Article

AGER-1 Long Non-Coding RNA Levels Correlate with the Expression of the Advanced Glycosylation End-Product Receptor, a Regulator of the Inflammatory Response in Visceral Adipose Tissue of Women with Obesity and Type 2 Diabetes Mellitus

by
Klaudia Gutowska
1,
Krzysztof Koźniewski
2,
Michał Wąsowski
3,
Marta Izabela Jonas
2,
Zbigniew Bartoszewicz
4,
Wojciech Lisik
5,
Maurycy Jonas
6,
Artur Binda
7,
Paweł Jaworski
7,
Wiesław Tarnowski
7,
Bartłomiej Noszczyk
8,
Monika Puzianowska-Kuźnicka
2,9,
Krzysztof Czajkowski
1 and
Alina Kuryłowicz
2,3,*
1
II Department of Obstetrics and Gynecology, Warsaw Medical University, 00-315 Warsaw, Poland
2
Department of Human Epigenetics, Mossakowski Medical Research Centre, Polish Academy of Sciences, 02-106 Warsaw, Poland
3
Department of General Medicine and Geriatric Cardiology, Medical Centre of Postgraduate Education, 00-401 Warsaw, Poland
4
Department of Internal Medicine and Endocrinology, The Medical University of Warsaw, 02- 097 Warsaw, Poland
5
Department of General and Transplantation Surgery, The Medical University of Warsaw, 02-005 Warsaw, Poland
6
Department of General Surgery, Barska Hospital, 02-315 Warsaw, Poland
7
Department of General, Oncological and Bariatric Surgery, Medical Centre of Postgraduate Education, 00-401 Warsaw, Poland
8
Department of Plastic Surgery, Medical Centre of Postgraduate Education, 00-401 Warsaw, Poland
9
Department of Geriatrics and Gerontology, Medical Centre of Postgraduate Education, 01-826 Warsaw, Poland
*
Author to whom correspondence should be addressed.
Int. J. Mol. Sci. 2023, 24(24), 17447; https://doi.org/10.3390/ijms242417447
Submission received: 15 November 2023 / Revised: 8 December 2023 / Accepted: 10 December 2023 / Published: 13 December 2023
(This article belongs to the Special Issue Nutrition, Obesity and Metabolic Syndrome)

Abstract

:
The advanced glycosylation end-product receptor (AGER) is involved in the development of metabolic inflammation and related complications in type 2 diabetes mellitus (T2DM). Tissue expression of the AGER gene (AGER) is regulated by epigenetic mediators, including a long non-coding RNA AGER-1 (lncAGER-1). This study aimed to investigate whether human obesity and T2DM are associated with an altered expression of AGER and lncAGER-1 in adipose tissue and, if so, whether these changes affect the local inflammatory milieu. The expression of genes encoding AGER, selected adipokines, and lncAGER-1 was assessed using real-time PCR in visceral (VAT) and subcutaneous (SAT) adipose tissue. VAT and SAT samples were obtained from 62 obese (BMI > 40 kg/m2; N = 24 diabetic) and 20 normal weight (BMI = 20–24.9 kg/m2) women, while a further 15 SAT samples were obtained from patients who were 18 to 24 months post-bariatric surgery. Tissue concentrations of adipokines were measured at the protein level using an ELISA-based method. Obesity was associated with increased AGER mRNA levels in SAT compared to normal weight status (p = 0.04) and surgical weight loss led to their significant decrease compared to pre-surgery levels (p = 0.01). Stratification by diabetic status revealed that AGER mRNA levels in VAT were higher in diabetic compared to non-diabetic women (p = 0.018). Elevated AGER mRNA levels in VAT of obese diabetic patients correlated with lncAGER-1 (p = 0.04, rs = 0.487) and with interleukin 1β (p = 0.008, rs = 0.525) and resistin (p = 0.004, rs = 0.6) mRNA concentrations. In conclusion, obesity in women is associated with increased expression of AGER in SAT, while T2DM is associated with increased AGER mRNA levels and pro-inflammatory adipokines in VAT.

1. Introduction

Adipose tissue is composed of heterogeneous anatomical depots with different epigenetic characteristics that determine their metabolic functions [1]. Although initially identified as a passive energy store, definitive studies have underlined its complex nature, ensuring endocrine, autocrine, and immune homeostasis [2]. Furthermore, adipose tissue is highly flexible and can therefore be remodeled according to caloric supply [1]. The excessive accumulation of energy reserves associated with obesity leads to adipocyte dysfunction, mitochondrial damage, and hypoxia, resulting in the disruption of cell metabolism and mechanical stress through stretching of the extracellular matrix [3,4]. It is widely accepted that obesity is associated with chronic low-grade inflammation, driven by various immune cells, which can result in irreversible organ damage [5]. In a state of positive energy balance, inflammatory cytokine and chemokine responses shift the immune system from an anti-inflammatory to a pro-inflammatory state and lead to an increased risk of developing metabolic disorders, including insulin resistance (IR) and type 2 diabetes mellitus (T2DM) [5]. Although this relationship is considered controversial by some, basic and clinical research confirms that the level of inflammation associated with obesity is positively correlated with the degree of IR and T2DM [6].
A key link between adipose tissue expansion, associated comorbidities, and inflammatory signaling is the advanced glycosylation end-product receptor (AGER) [7,8]. This cell surface molecule—present in a variety of cell types—triggers the generation of reactive oxygen species and the induction of an inflammatory response. Upon binding a variety of different ligands, including advanced glycation end-products (AGEs), it mediates the activation of nuclear factor κB (NF-κB) and other pro-inflammatory pathways, leading to tissue dysfunction and the development of obesity and other metabolic diseases [9,10,11].
Evidence suggests that activation of the inflammatory network depends on equally important environmental, genetic, and epigenetic contributing factors [12]. Long untranslated non-coding RNAs (lncRNAs) of more than 200 nucleotides are considered to be a hallmark of epigenetic regulation in inflammatory signaling [12]. These transcripts can act as regulatory elements that affect gene expression at different stages, including modulation of transcriptional availability of chromatin and mRNA processing [13,14]. Dynamic epigenetic modulations accompany obesity, as lncRNA expression patterns in adipose tissue and sera of obese subjects differ from those of normal weight individuals [15,16]. Furthermore, IR has been shown to alter non-coding RNA expression in obese subjects, confirming the central contribution of low-grade inflammation in both conditions [17]. As lncRNAs contribute to the epigenetic shaping of inflammatory genes, and AGER is a promoter of the immune response that is enhanced in obesity and T2DM, there may be a link between the concentration of particular lncRNAs and AGER expression.
With this in mind, in the current study, we aimed to investigate whether human obesity and T2DM are associated with altered expression of AGER and long non-coding RNA AGER-1 (lncAGER-1) in adipose tissue and, if so, whether these changes affect the local inflammatory milieu.

2. Results

2.1. Clinical and Biochemical Characteristics of Study Participants

The study group consisted of 62 women with a body mass index (BMI) of >40 kg/m2—calculated by weight in kg divided by height squared (m2). Based on the American Diabetes Association diagnostic criteria, T2DM was diagnosed in 23 participants (37.0%) within the study group [18]. All patients in the study group (O) underwent surgical treatment for obesity (sleeve gastrectomy or mini gastric bypass). During these surgical procedures, visceral (VAT) and subcutaneous (SAT) adipose tissue samples were collected from the lower abdomen. Fifteen additional SAT samples from the lower abdomen were obtained during abdominoplasty surgery, from previously obese (PO; BMI = 24.3–29.5 kg/m2) study participants who were 18 to 24 months post-bariatric surgery. Five patients in the post-bariatric group had residual hypertension, three had persistent pre-diabetes, and six had hyperlipidemia, but none met the criteria for a diagnosis of metabolic syndrome. As abdominoplasty is not associated with opening the abdominal cavity, it was not possible to obtain visceral adipose tissue samples from the PO participants.
The control group (N) consisted of 20 women with a BMI within the normal range (20.7–24.93 kg/m2). In addition, they had no history of chronic disease, and their metabolic health was confirmed as normal following a physical examination and biochemical blood tests. Although their body composition was not assessed, they were considered metabolically healthy based on their medical histories, normal BMI and biochemical parameters, and the absence of any metabolic syndrome components. None of the study participants were receiving anti-inflammatory treatment (e.g., glucocorticoids, non-steroidal anti-inflammatory drugs, or anti-cytokine drugs).
The baseline clinical and biochemical parameters of the study participants are summarized in Table 1.

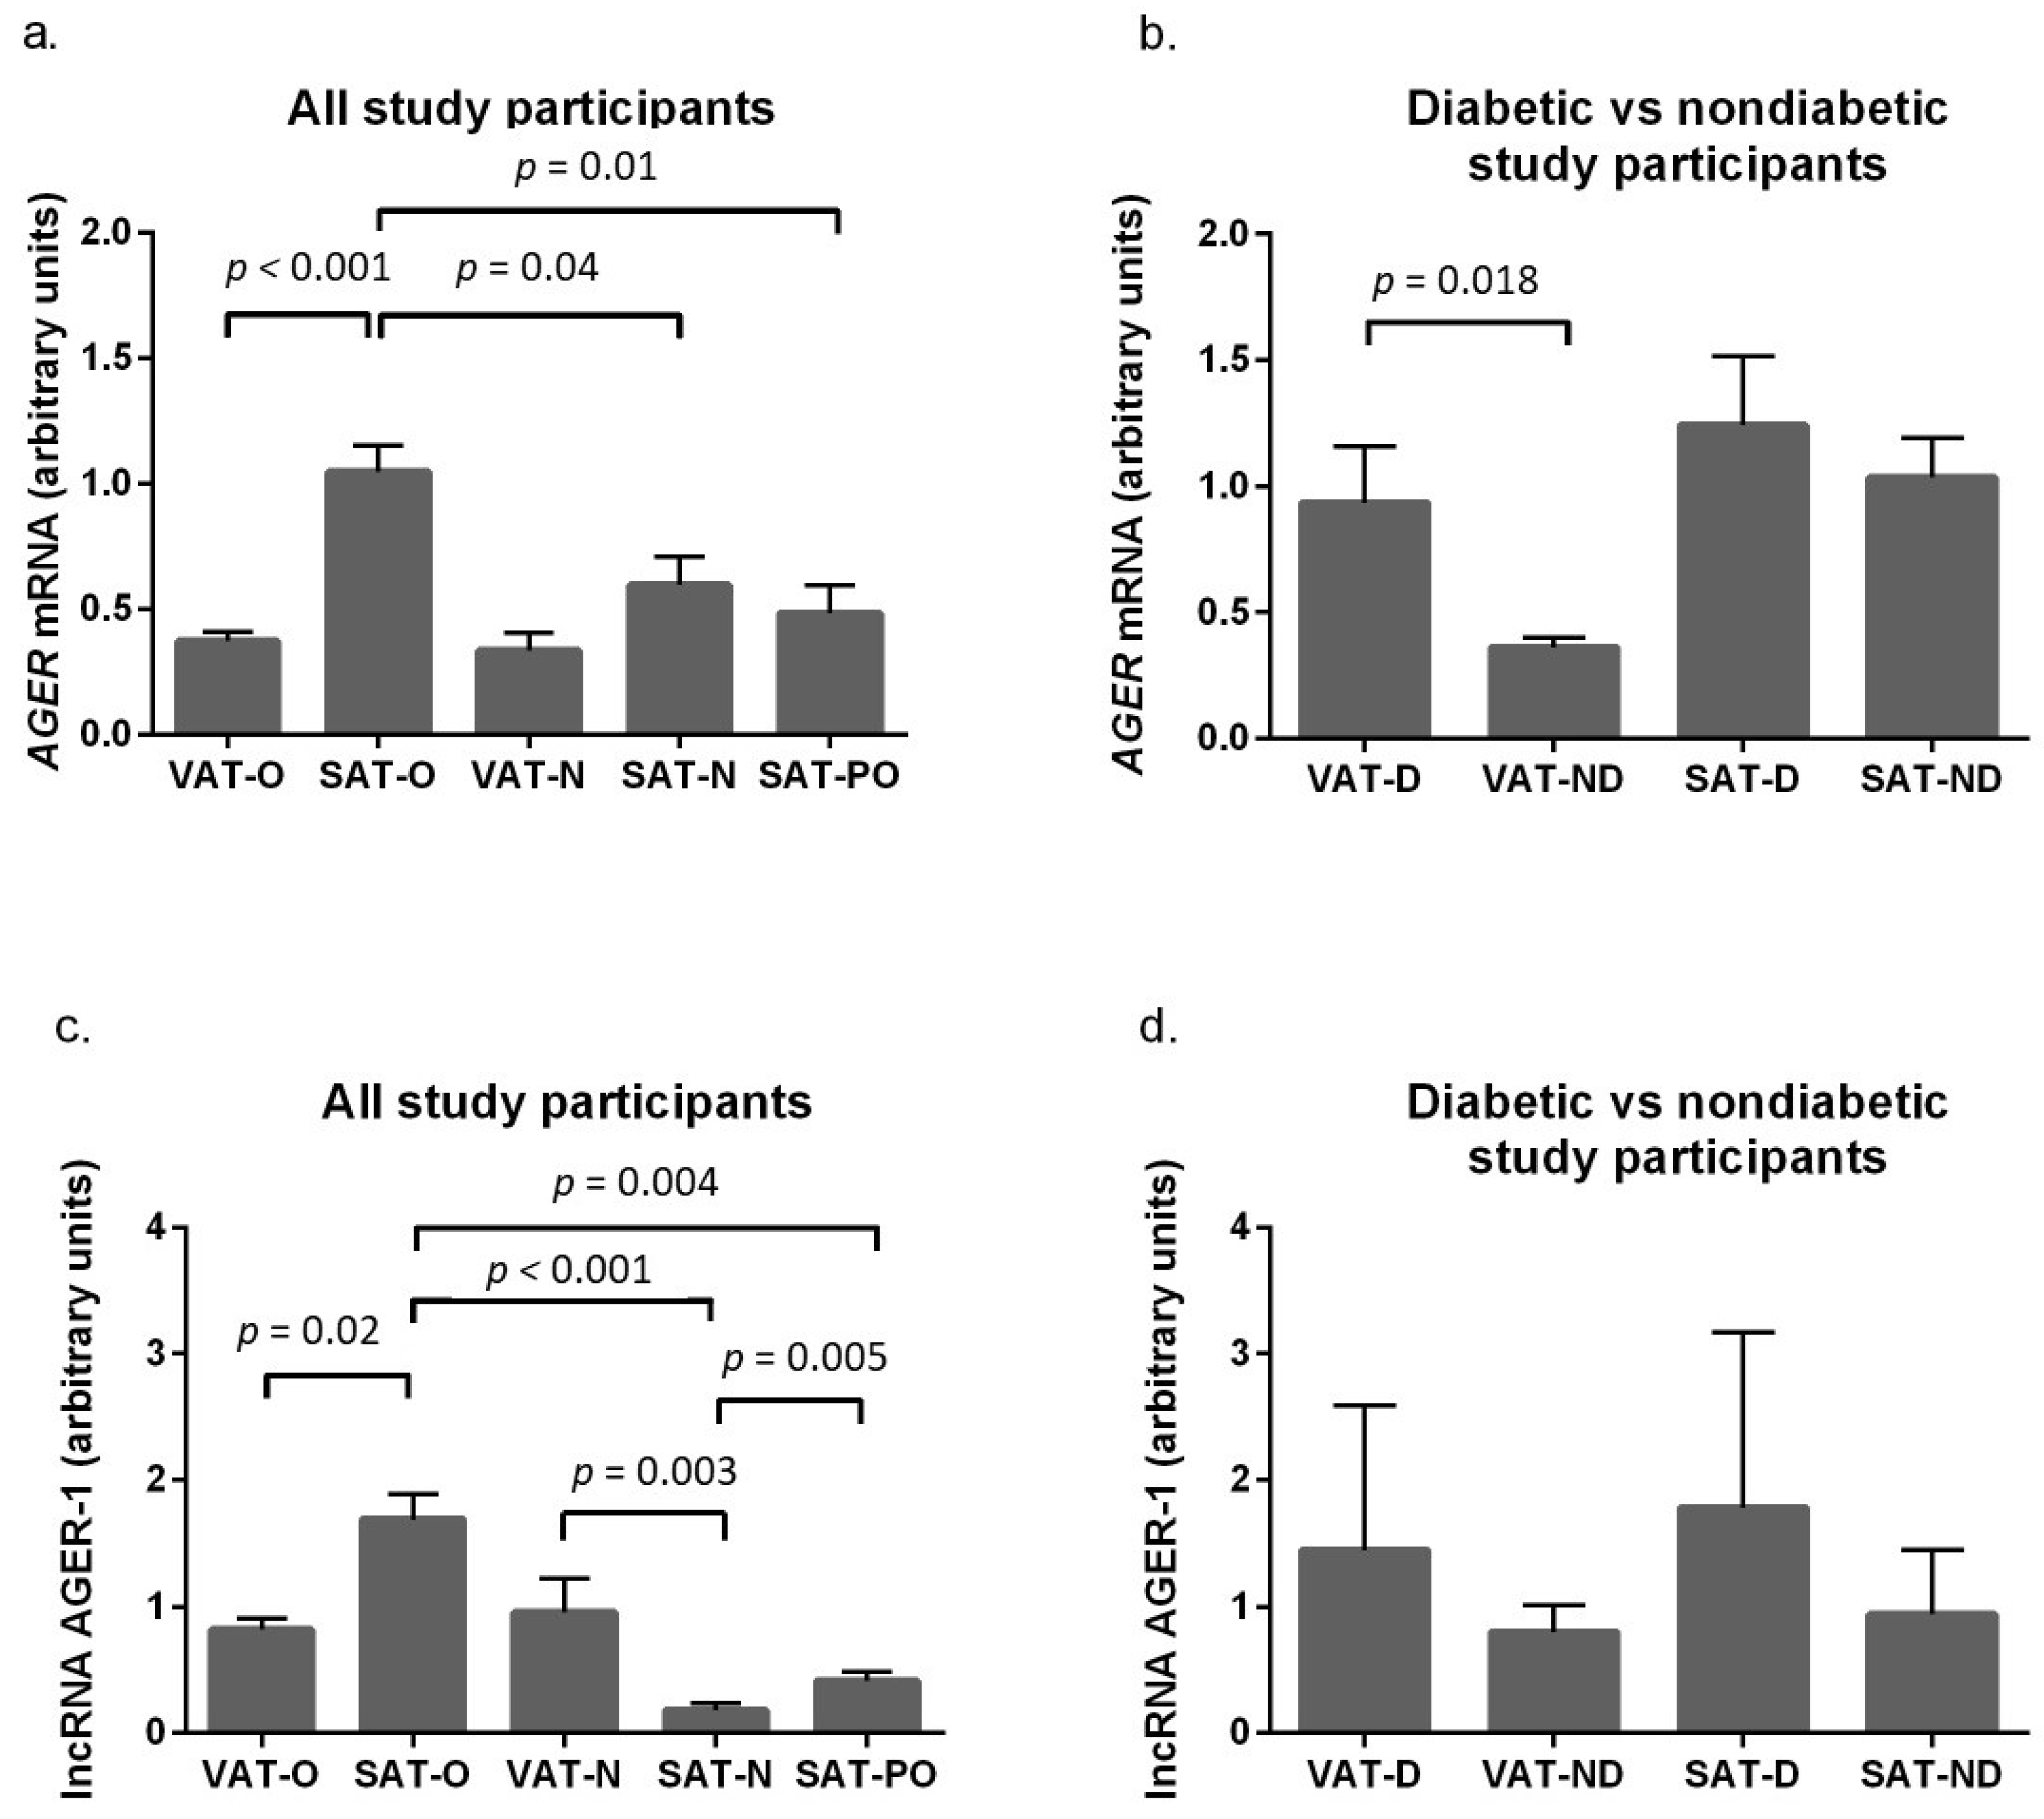
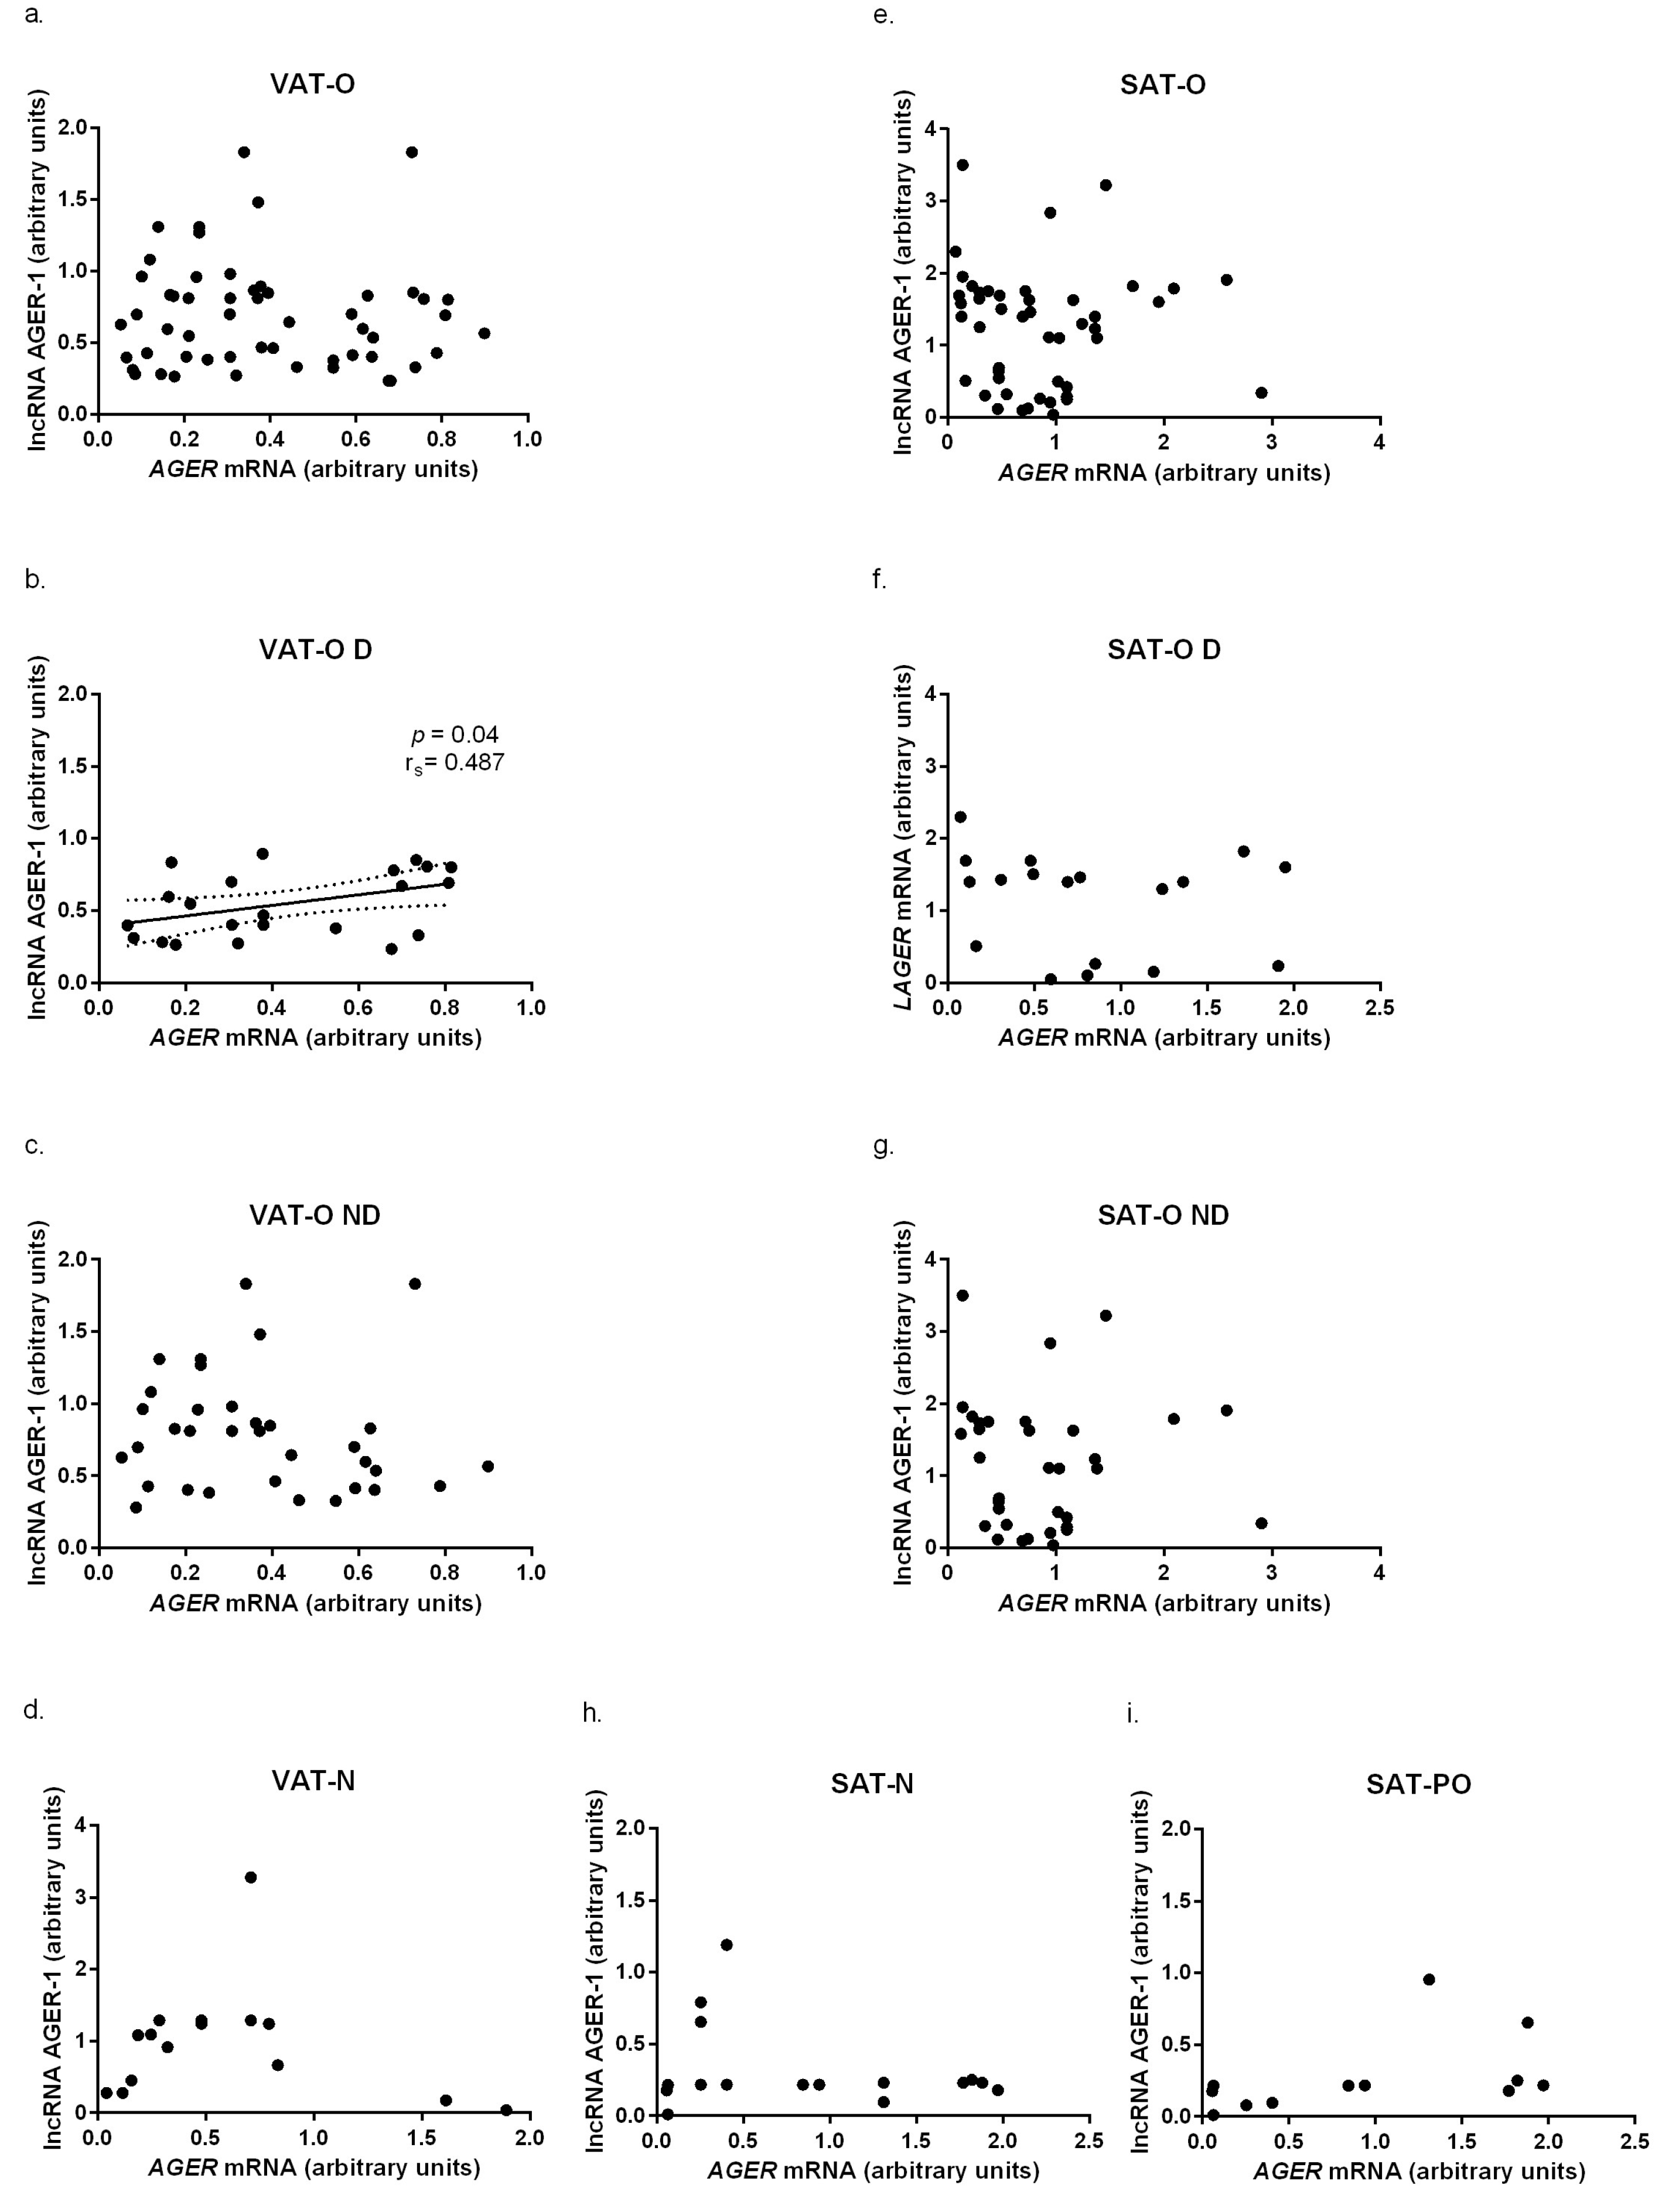
2.2. The Advanced Glycosylation End-Product Receptor (AGER) Gene and Long Non-Coding RNA AGER-1 Expression in Adipose Tissue of Obese Individuals before and after Bariatric Surgery and Normal Weight Subjects

AGER expression at the mRNA level was higher in the subcutaneous adipose tissue of obese patients (SAT-O) compared to the SAT of normal weight individuals (SAT-N, p = 0.04). Surgically induced weight loss was associated with a significant decrease in AGER mRNA levels in SAT (SAT-PO) (p < 0.001). Interestingly, there were substantially higher AGER mRNA levels in SAT-O compared to the visceral adipose tissue in obese participants (VAT-O), whereas in normal weight women, no significant differences in AGER expression were found between SAT and VAT (Figure 1a). When the obese study participants were stratified according to diabetic status, we found that what distinguished women with T2DM from normoglycemic women was the higher expression of AGER at the mRNA level in VAT (p = 0.018, Figure 1b).
The expression profile of lncAGER-1 in the studied tissues resembled that of AGER in many respects (Figure 1c). lncAGER-1 levels were significantly higher in the SAT of obese women compared to normal weight women (p < 0.001), and weight loss was associated with a marked decrease in lncAGER-1 levels (p = 0.004), but not to the level observed in the SAT of normal weight women (p = 0.005). There were differences in lncAGER-1 levels (Figure 1c) between adipose depots depending on the presence of obesity: in obese women, lncAGER-1 expression was higher in SAT (p = 0.02), whereas in normal weight women, it was higher in VAT (p = 0.003). Stratification of obese patients according to glycemic status revealed a similar trend in the expression profile of lncAGER-1 to AGER between the tissues examined, but the differences were not significant (Figure 1d).
Subsequent analysis (Figure 2) revealed a significant positive correlation between AGER mRNA and lncAGER-1 levels in the VAT of the obese diabetic subjects (p = 0.04, rs = 0.487, Figure 2b).

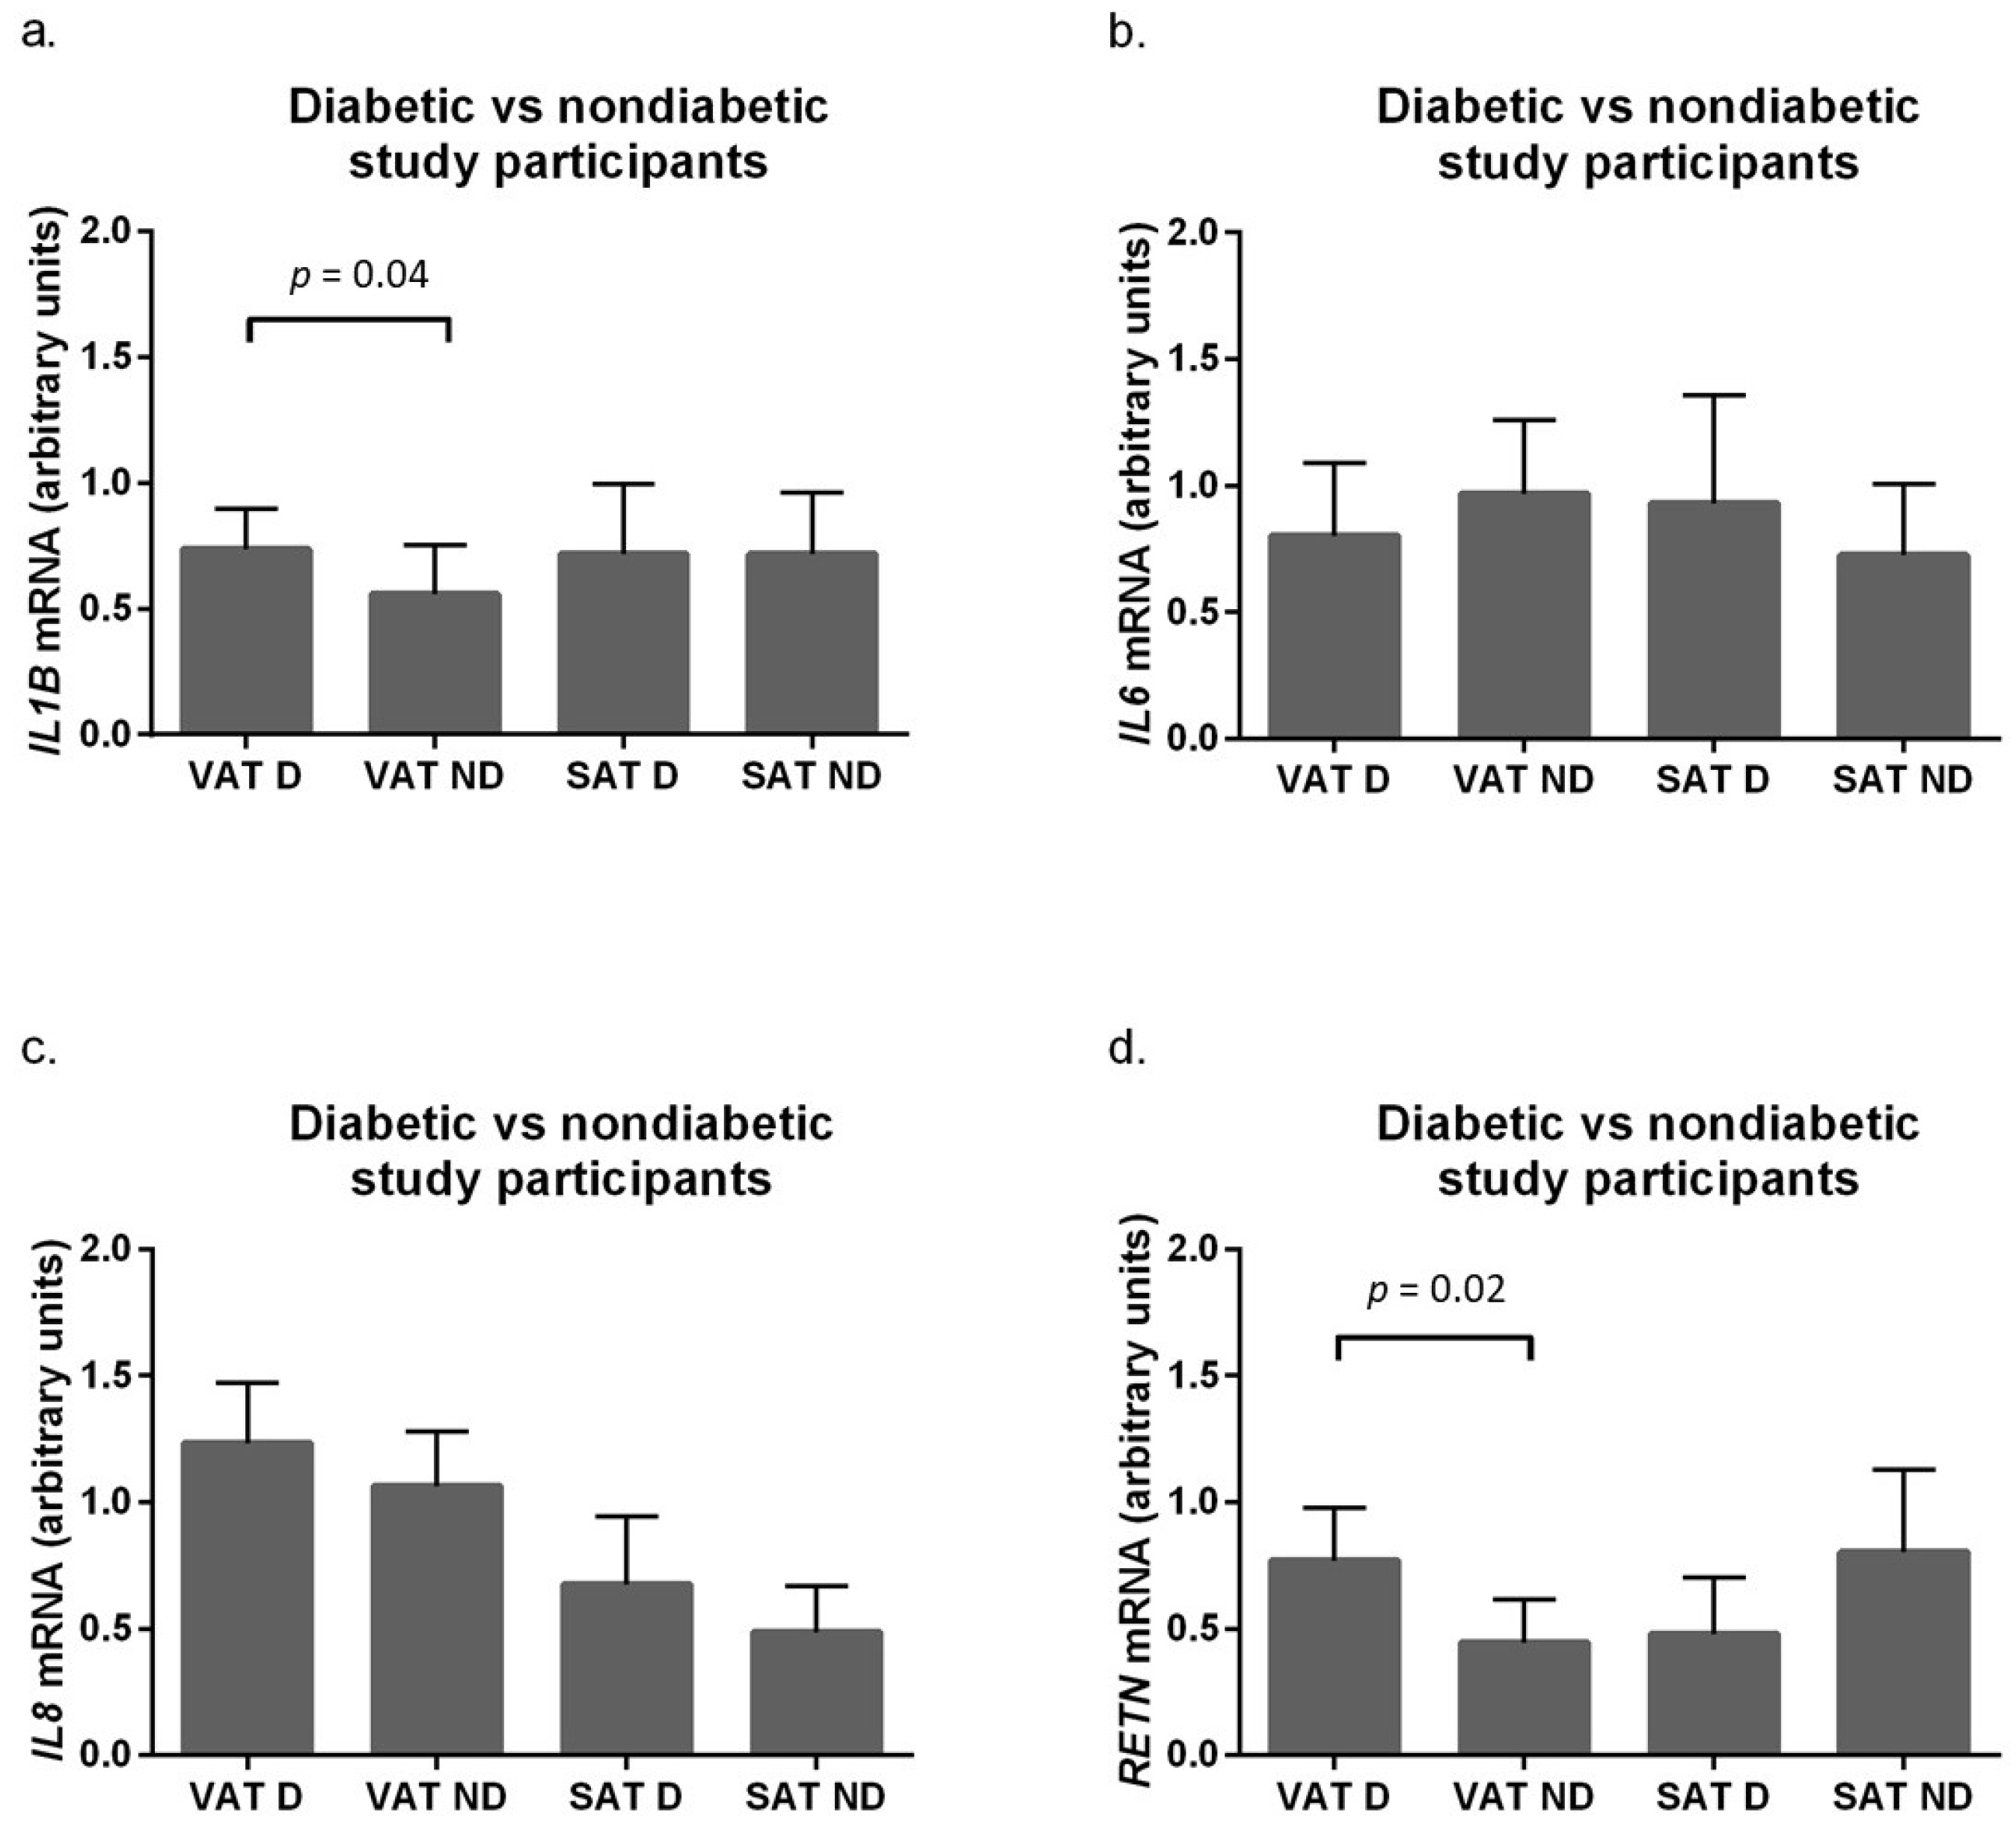
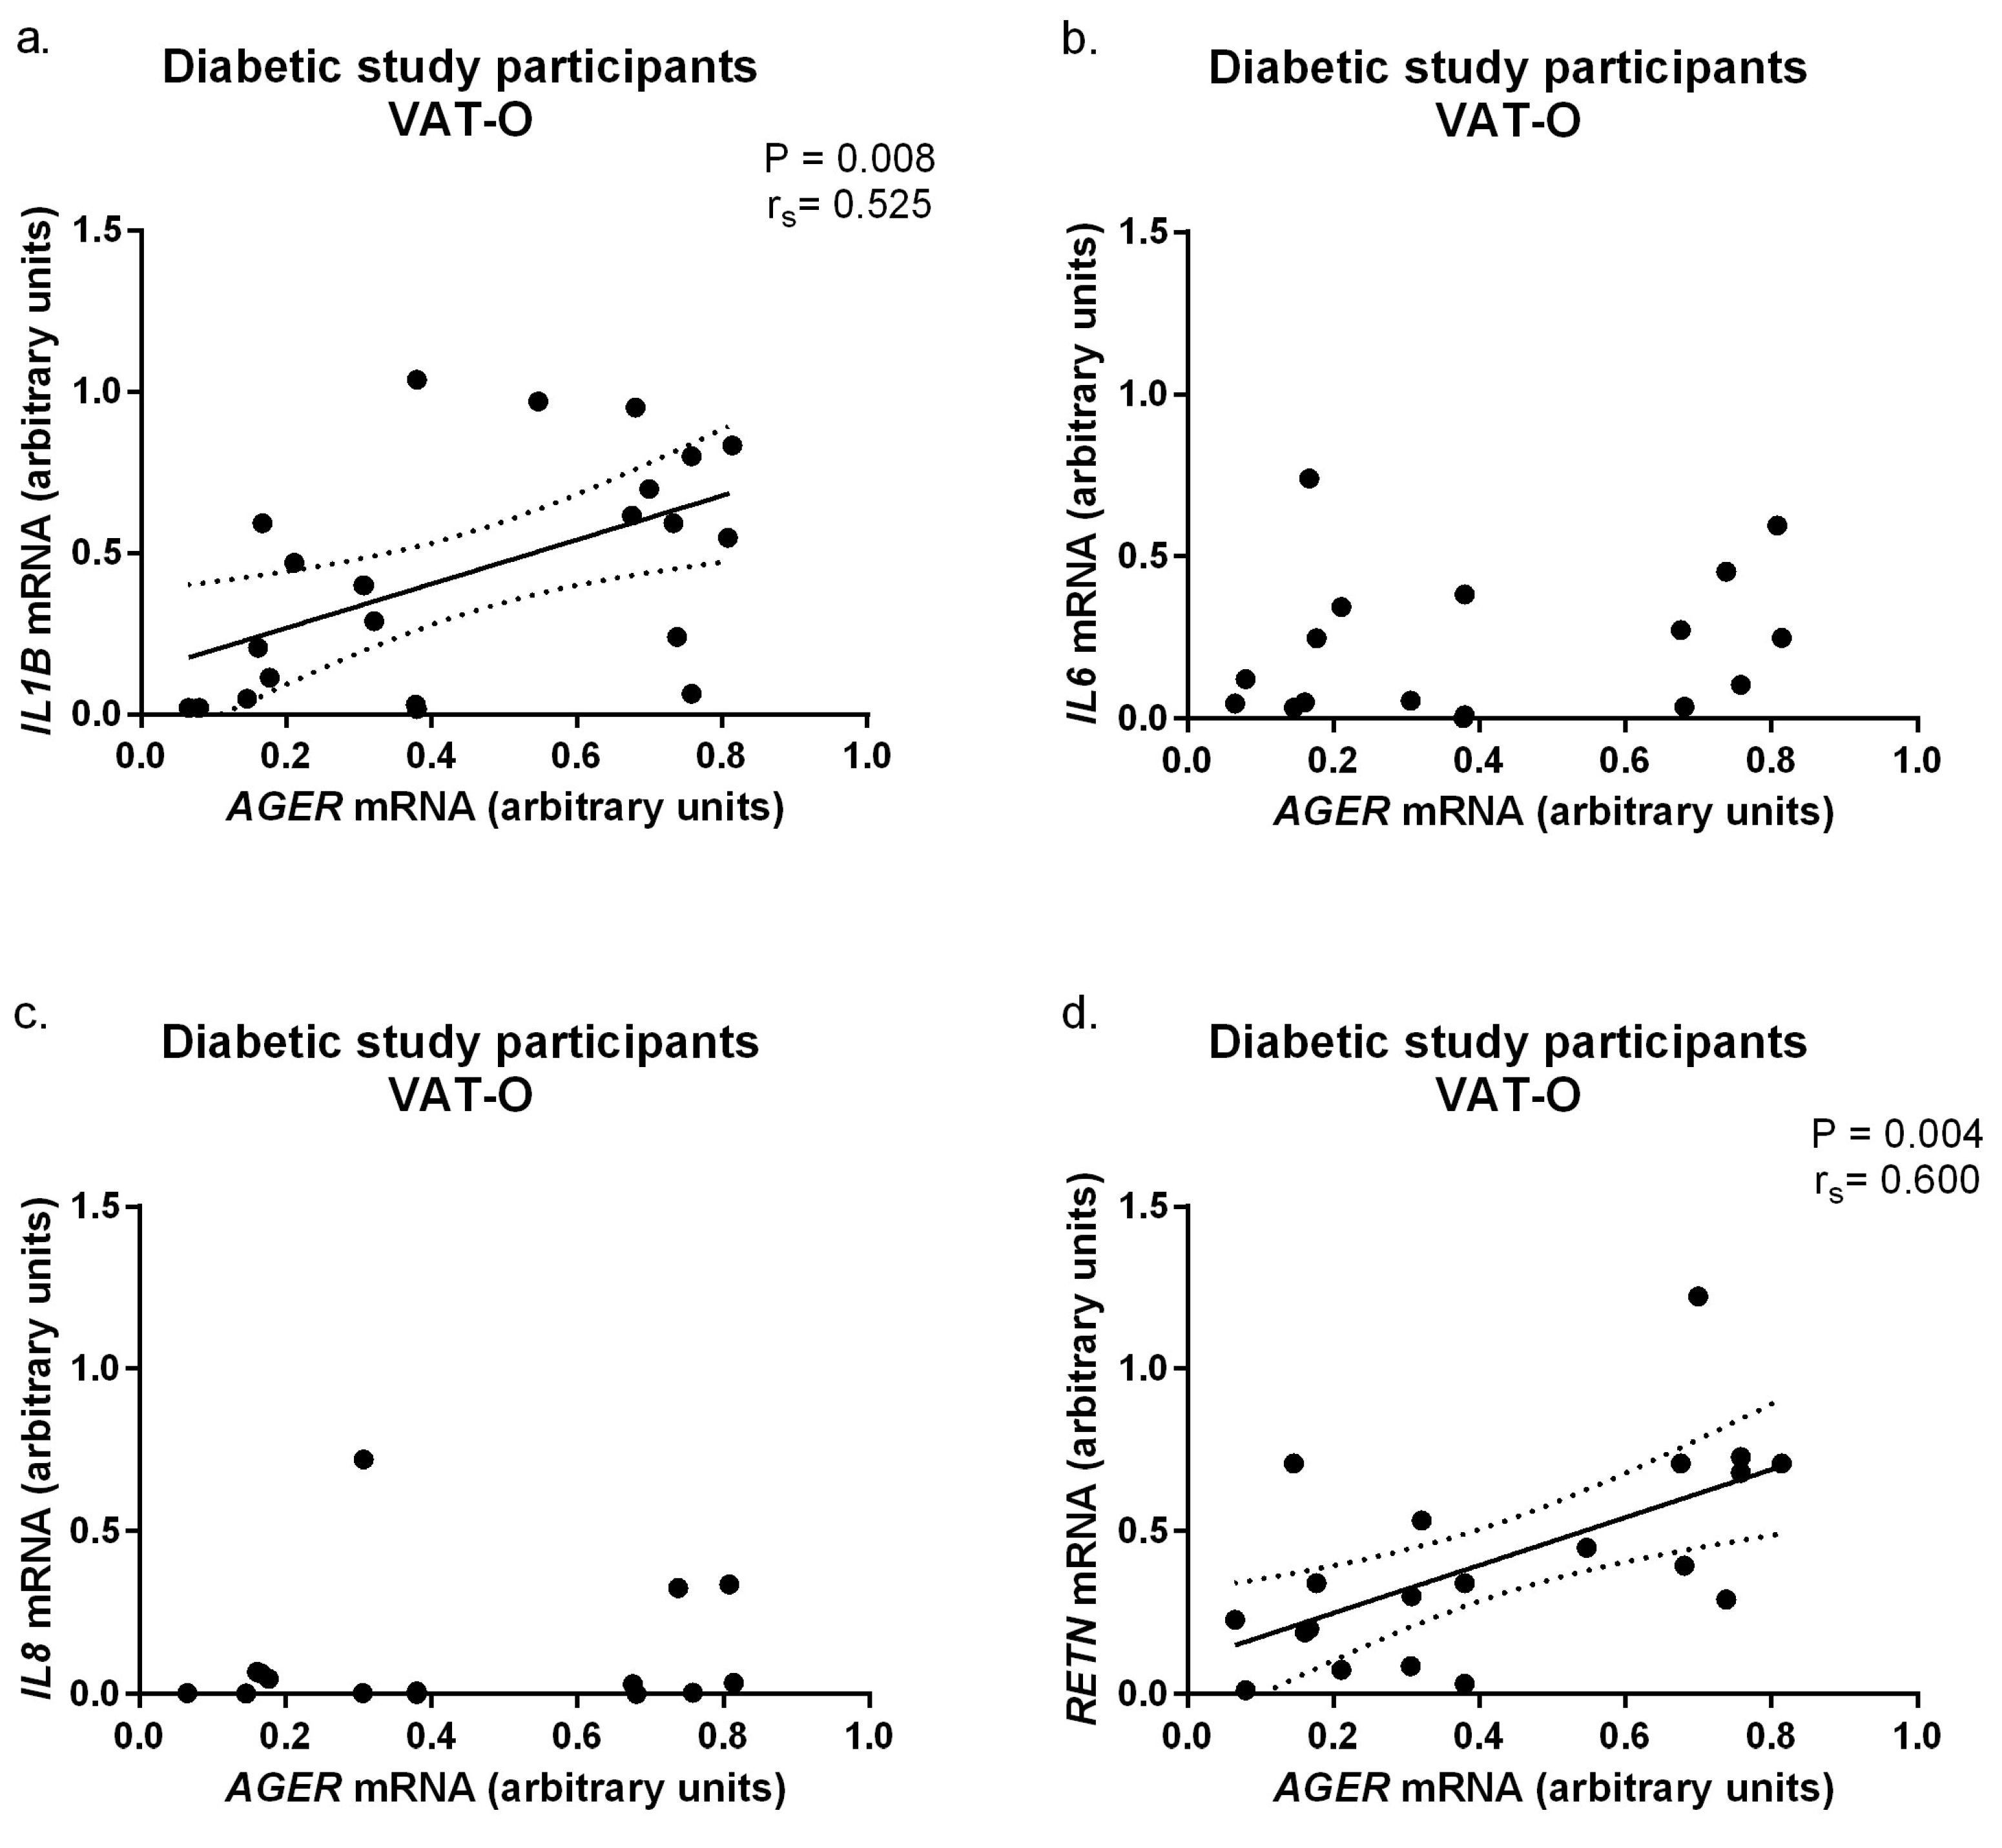
2.3. Expression of Pro-Inflammatory Adipokines in Adipose Tissue of Obese Subjects, Stratified by Diabetic Status

The finding that AGER mRNA levels differ between the tissues studied, and are higher in obese individuals (particularly those with T2DM), prompted us to investigate whether these differences affect the local inflammatory milieu. To this end, we examined the expression of genes that encode selected pro-inflammatory adipokines, namely interleukin 1 (IL1B), interleukin 6 (IL6), interleukin 8 (IL8), and resistin (RETN), at mRNA and protein levels, and correlated their concentrations with AGER mRNA levels. Due to the paucity of biological material, protein measurements were not performed in the PO group (18 to 24 months post-bariatric surgery). In our previous studies on a smaller group of patients, we found that the concentration of these adipokines in adipose tissue is significantly altered in the course of obesity [19,20]. Similarly, in the group of women studied in this work, we found that obesity was associated with an increase in the expression of genes encoding pro-inflammatory adipokines at both the mRNA and protein levels (Supplementary Figures S1 and S2).
The study group was then stratified according to glycemic status, and adipokine mRNA levels in adipose tissue were compared between the diabetic and non-diabetic study participants (Figure 3).
This stratification revealed that the mRNA levels for IL1B (p = 0.04) and resistin (p = 0.02) were significantly higher in the VAT of the diabetic, obese study participants (VAT-D) compared to the non-diabetic participants (VAT-ND). However, glycemic status did not affect adipokine protein levels in a given adipose tissue depot (Supplementary Figure S3). To verify whether the observed differences in adipokine mRNA levels between diabetic and non-diabetic subjects could be related to AGER expression, correlation analyses were performed. Significant positive correlations were found between AGER mRNA levels and IL1B (p = 0.008, rs = 0.525) and RETN (p = 0.004, rs = 0.60) mRNA levels in visceral adipose tissue of obese diabetic participants (Figure 4).

3. Discussion

Obesity-related adipose tissue dysfunction appears to play a critical role in the pathogenesis of metabolic complications, including insulin resistance and T2DM [1,4]. One manifestation of adipose tissue dysfunction is chronic inflammation, resulting from impaired adipocyte energy homeostasis that involves the extracellular matrix [4,5]. The key pathway in the development of metabolic inflammation and insulin resistance is the receptor for advanced glycation end-products’ (known as AGER or RAGE) signaling. Therefore, in this work, we investigated whether human obesity and T2DM are associated with altered expression of the AGER gene and its regulator lncAGER-1 in adipose tissue, and, if so, whether these changes affect the local inflammatory milieu. We found that obesity in women is associated with increased expression of AGER in subcutaneous adipose tissue, whereas AGER-mediated development of metabolic inflammation—which predisposes to increased insulin resistance and T2DM—preferentially affects the visceral depot.
Our finding regarding the elevated AGER expression in adipose tissue in obesity is consistent with the results of previous reports. Gaens et al. conducted a study on subcutaneous tissues—obtained from 10 patients with grade I/II obesity (mean BMI 34.2 ± 4.0 kg/m2) and from 9 normal weight controls—and found that AGER expression in both mRNA and protein levels is higher in the course of obesity [21]. Visceral adipose tissue was not analyzed in that study. However, when comparing tissues from different depots of obese patients, the authors found a significant increase in AGER mRNA levels in VAT compared to SAT. In our study, which focused only on women with obesity, we observed the opposite trend. As adipose tissue is a highly heterogeneous organ, its depots are biologically different, which is reflected in differences in the expression profiles of various genes, and translates into differences in lipolytic and inflammatory activity or insulin sensitivity [2]. In obesity, the functional differences between the different adipose tissue depots might be both accentuated and abolished [19,22], and these processes can be mediated by epigenetic mechanisms that buffer the effects of the environment [23]. There are many potential reasons for the discrepancy between our findings and the Gaens et al. study, such as differences in gender and metabolic status (in the study by Gaens et al., 30% of the participants were men and most of the patients had impaired glucose tolerance or T2DM) [21]. The latter aspect is important since, after stratifying the obese study participants according to glycemic status, we observed that VAT from diabetic subjects had higher levels of AGER mRNA than VAT of normoglycemic individuals. A similar association between T2DM and higher concentrations of AGER mRNA was previously observed in pericardial adipocytes [24].
Given the role of AGER in regulating the inflammatory response, we reasoned that the association between higher expression of this receptor in adipose tissue and T2DM might not be coincidental. Chronic low-grade inflammation is a primary event of obesity-related insulin resistance [25]. An essential role in inflammatory signaling in human adiposity is played by pro-inflammatory adipokines, including IL-1β, IL-6, IL-8, and resistin [19,20,26,27,28,29]. We demonstrated here, and before [19], that in the obese study participants, levels of mRNAs encoding these molecules were significantly increased in SAT. This reflects findings from other studies, wherein SAT, not VAT, was found to be a leader of cytokine synthesis [29,30,31]. The debate over which depot of adipose tissue plays the dominant role in the development of obesity-related inflammation has been ongoing for years, with several papers in the literature pointing to VAT as the main source of pro-inflammatory mediators [32,33,34]. Our observations suggest that patients’ glycemic status is crucial in this case. In our study, we observed higher IL1B and RETN mRNA in VAT of patients with obesity plus T2DM, rather than in obese patients with a euglycemic state. In preclinical studies, IL-1β has been identified as a key mediator of macrophage-induced insulin resistance in human adipocytes, and its high levels in VAT predispose obese rodents to the development of diabetes [35,36]. In addition, this cytokine orchestrates the mobilization of other inflammatory mediators, e.g., IL-6 contributing to insulin resistance and dyslipidemia [37]. In turn, resistin can be either the sender or recipient of pro-inflammatory processes by engaging the 5 AMP-activated protein kinase (AMPK) and AMPK-independent suppressor of cytokine signaling-3 (SOCS-3) pathways [38,39,40]. Subsequently, high levels of resistin correlate with insulin resistance, glucose intolerance, and endothelial dysfunction marker concentration [41]. In conclusion, when assessing the relationship between AGER expression and adipokine-encoding genes, it is crucial to define glycemic status, as different correlations can be expected in normoglycemic individuals and others with T2DM [42].
Our results suggest that AGER might be the chief of tri-directional communication between obesity, T2DM, and inflammation. In addition to inducing insulin resistance in adipose tissue, there is evidence that AGER ligands can induce pancreatic islet inflammation and beta cell apoptosis [43,44]. This raises the question of what mechanisms regulate AGER expression in obesity.
Previous studies proposed that lncRNAs, arising from noncoding transcripts, might contribute to the pathogenesis of metabolic disturbances, as well as cancer, neurodegenerative, and immune system diseases [45,46]. LncRNAs have a variety of functions; some (despite their name) encode peptides, but primarily, they exert post-translational effects on gene expression levels (both up-and down-regulated) and compete for the binding of specific miRNAs with mRNAs [47]. Here, we reported that lncAGER1, a functionally proven AGER regulator, may modulate its expression profile in adipose tissue. What’s more, obesity promoted an increase in lncAGER-1 level in SAT, whereas in normal weight subjects, higher expression of this transcript was found in VAT. Interestingly, tandem obesity and diabetes-induced increased levels of lncAGER-1 in VAT were positively correlated with AGER expression. Our findings indirectly suggest that lncAGER-1 may induce inflammation mediated by AGER, therefore predisposing individuals to increased insulin resistance and T2DM. Functional studies have proven that lncAGER-1 acts as a miRNA sponge and indirectly modulates the expression of AGER in lung or colorectal cancer [48,49]. However, this is the first report to suggest lncAGER-1 as a contributor to obesity-related insulin resistance and T2DM. In summary, our study reveals the possible role of lncRNA in the upregulation of AGER expression in the adipose tissue and therefore, indirectly, in the development of metabolic inflammation in the course of obesity; however, these phenomena seem to be depot-specific.
The main limitation of this study is its descriptive nature, which implies the need for further functional studies to confirm our findings. When describing the correlations between RNA and lncRNA levels, we can only surmise that they reflect tissue regulatory processes. Although the role of lncAGER-1 in regulation of AGER expression has been confirmed in functional studies in other tissues and organs, our results require in vitro verification in human adipocyte cell lines. Another limitation is the relatively small number of control tissues obtained from the normal weight individuals and patients who underwent bariatric surgery. On the other hand, the main strengths of the current study are its homogeneous, well-characterized population, with 62 participants in the study group, and its innovative nature, which can be considered a novel attempt to elucidate the mechanisms linking obesity and type 2 diabetes mellitus.

4. Materials and Methods

4.1. Tissue and Blood Sample Collection

Visceral (VAT) and subcutaneous (SAT) adipose tissue samples were collected from patients with obesity during bariatric surgery. SAT samples were obtained from the lower abdomen during abdominoplasty in previously obese study participants who were 18 to 24 months post-bariatric surgery. In the control group, VAT and SAT pairs were obtained at the time of elective cholecystectomy in a manner analogous to the study group. All adipose tissue samples were immediately frozen at −80 °C and then homogenized in liquid nitrogen. Before surgery, all participants underwent a medical examination and provided 15 mL of venous blood. All sera and adipose tissue samples were stored at −80 °C until molecular and biochemical measurements were performed.
This study was approved by the Bioethics Committee of the Medical University of Warsaw and the Centre for Postgraduate Medical Education in Warsaw (decision no. KB 147/2009 issued on 28 July 2009, KB 91/A/2010 issued on 19 July 2010, KB 117/A/2011 issued on 14 November 2011, and KB 38/A/2022 issued on 16 May 2022) and written informed consent was obtained from all participants.

4.2. Isolation of Total RNA, Reverse Transcription, and Real-Time PCR

Total RNA was isolated and reverse-transcribed to cDNA using previously described methods [19]. Real-time PCR was performed in triplicate using a LightCycler 480 Instrument II (Roche, Mannheim, Germany), as previously described [50]. The specific primers used to analyze lncAGER-1 and gene expression at the mRNA level in adipose tissue are listed in Table 2.

4.3. Isolation of a Protein Fraction from Adipose Tissue and Measurement of Cytokine Concentrations

Isolation of the adipose tissue protein fraction was performed as previously described [19,20]. An ELISA-based chemiluminescent Q-plex Custom array (Quansys Bioscience, West Logan, UT, USA) was used to measure interleukin (IL) 1β, 6, 8, and resistin concentrations in adipose tissue protein extracts. Luminescence was assessed using a Molecular Imager Versa Doc™ MP 5000 system (Bio-Rad, Hercules, CA, USA), according to the manufacturer’s guidelines. Results were analyzed using Q-View software version 2.17 (Quansys Bioscience, West Logan, UT, USA). Measurements of interleukins and resistin concentrations in adipose tissue were normalized to total protein concentrations in protein extracts. Mean total protein concentrations in VAT and SAT extracts from obese and normal weight participants were not significantly different (p > 0.05).

4.4. Statistical Analysis

The normality of distribution and homogeneity of variance of the studied parameters were checked using the Shapiro–Wilk and Levene tests, respectively. Differences in mRNA and protein levels in the tissues studied were calculated using Student’s t/Mann–Whitney U tests. The Bonferroni adjustment for multiple comparisons was not applied [52,53]. The Spearman correlation test was used for correlations between quantitative values. All statistical analyses were performed using the Statistica software package v.10 (StatSoft, Tulsa, OK, USA) and GraphPad Prism software v.7 (GraphPad Software, San Diego, CA, USA).

5. Conclusions

In conclusion, our data suggest that obesity in women is associated with increased expression of AGER in SAT. However, AGER-mediated development of metabolic inflammation—which predisposes to increased insulin resistance and type 2 diabetes mellitus—preferentially affects VAT. Given the descriptive nature of our study, these data need to be verified in vitro.

Supplementary Materials

The following supporting information can be downloaded at: https://www.mdpi.com/article/10.3390/ijms242417447/s1.

Author Contributions

Conceptualization, A.K.; methodology, K.G. and A.K.; investigation, K.G., K.K., M.W., M.I.J., Z.B., W.L., M.J., A.B., P.J., W.T., B.N. and A.K.; data acquisition, M.W., M.I.J., W.L., M.J., A.B., P.J., W.T., B.N. and A.K.; data curation, K.G. and A.K.; writing—original draft preparation, K.G. and A.K.; writing—review and editing, M.P.-K. and A.K.; supervision, A.K., K.C. and M.P.-K.; project administration, A.K.; funding acquisition, A.K. All authors have read and agreed to the published version of the manuscript.

Funding

This work was supported by the National Science Centre Poland, grant 2018/31/B/NZ5/01556.

Institutional Review Board Statement

The study was conducted in accordance with the Declaration of Helsinki, and approved by the Institutional Ethics of the Medical University of Warsaw and the Centre for Postgraduate Medical Education in Warsaw (decision no. KB 147/2009 issued on 28 July 2009, KB 91/A/2010 issued on 19 July 2010, KB 117/A/2011 issued on 14 November 2011, and KB 38/A/2022 issued on 16 May 2022).

Informed Consent Statement

Informed consent was obtained from all subjects involved in this study.

Data Availability Statement

The data presented in this study are available on request from the corresponding author.

Conflicts of Interest

The authors declare no conflict of interest. The funders had no role in the design of this study; in the collection, analyses, or interpretation of data; in the writing of the manuscript; or in the decision to publish the results.

References

  1. Kwok, K.; Lam, K.; Xu, A. Heterogeneity of white adipose tissue: Molecular basis and clinical implications. Exp. Mol. Med. 2016, 48, e215. [Google Scholar] [CrossRef] [PubMed]
  2. Cypess, A.M. Reassessing Human Adipose Tissue. N. Engl. J. Med. 2022, 386, 768–779. [Google Scholar] [CrossRef] [PubMed]
  3. Wang, R.; Sun, Q.; Wu, X.; Zhang, Y.; Xing, X.; Lin, K.; Feng, Y.; Wang, M.; Wang, Y.; Wang, R. Hypoxia as a Double-Edged Sword to Combat Obesity and Comorbidities. Cells 2022, 11, 3735. [Google Scholar] [CrossRef] [PubMed]
  4. Woo, C.Y.; Jang, J.E.; Lee, S.E.; Koh, E.H.; Lee, K.U. Mitochondrial Dysfunction in Adipocytes as a Primary Cause of Adipose Tissue Inflammation. Diabetes Metab. J. 2016, 43, 247–256. [Google Scholar] [CrossRef] [PubMed]
  5. Reilly, S.M.; Saltiel, A.R. Adapting to obesity with adipose tissue inflammation. Nat. Rev. Endocrinol. 2017, 13, 633–643. [Google Scholar] [CrossRef]
  6. Wondmkun, Y.T. Obesity, Insulin Resistance, and Type 2 Diabetes: Associations and Therapeutic Implications. Diabetes. Metab. Syndr. Obes. 2020, 13, 3611–3616. [Google Scholar] [CrossRef]
  7. Yan, S.F.; Ramasamy, R.; Schmidt, A.M. Mechanisms of disease: Advanced glycation end-products and their receptor in inflammation and diabetes complications. Nat. Clin. Pract. Endocrinol. Metab. 2008, 4, 285–293. [Google Scholar] [CrossRef]
  8. Ribeiro, P.V.M.; Tavares, J.F.; Costa, M.A.C.; Mattar, J.B.; Alfenas, R.C.G. Effect of reducing dietary advanced glycation end products on obesity-associated complications: A systematic review. Nutr. Rev. 2019, 77, 725–734. [Google Scholar] [CrossRef]
  9. Senatus, L.M.; Schmidt, A.M. The AGE-RAGE Axis: Implications for Age-Associated Arterial Diseases. Front. Genet. 2017, 8, 187. [Google Scholar] [CrossRef]
  10. Sessa, L.; Gatti, E.; Zeni, F.; Antonelli, A.; Catucci, A.; Koch, M.; Pompilio, G.; Fritz, G.; Raucci, A.; Bianchi, M.E. The receptor for advanced glycation end-products (RAGE) is only present in mammals and belongs to a family of cell adhesion molecules (CAMs). PLoS ONE 2014, 9, e86903. [Google Scholar] [CrossRef]
  11. Rouhiainen, A.; Kuja-Panula, J.; Tumova, S.; Rauvala, H. RAGE-mediated cell signaling. Methods Mol. Biol. 2013, 963, 239–263. [Google Scholar] [CrossRef] [PubMed]
  12. Chini, A.; Guha, P.; Malladi, V.S.; Guo, Z.; Mandal, S.S. Novel long non-coding RNAs associated with inflammation and macrophage activation in humans. Sci. Rep. 2023, 13, 4036. [Google Scholar] [CrossRef] [PubMed]
  13. Mattick, J.S.; Makunin, I.V. Non-coding RNA. Hum. Mol. Genet. Spec. 2006, 1, R17–R29. [Google Scholar] [CrossRef] [PubMed]
  14. Wijesinghe, S.N.; Nicholson, T.; Tsintzas, K.; Jones, S.W. Involvements of long noncoding RNAs in obesity-associated inflammatory diseases. Obes. Rev. 2021, 22, e13156. [Google Scholar] [CrossRef]
  15. Yang, L.; Wang, X.; Guo, H.; Zhang, W.; Wang, W.; Ma, H. Whole Transcriptome Analysis of Obese Adipose Tissue Suggests u001kfc.1 as a Potential Regulator to Glucose Homeostasis. Front. Genet. 2019, 10, 1133. [Google Scholar] [CrossRef]
  16. Sun, J.; Ruan, Y.; Wang, M.; Chen, R.; Yu, N.; Sun, L.; Liu, T.; Chen, H. Differentially expressed circulating LncRNAs and mRNA identified by microarray analysis in obese patients. Sci. Rep. 2016, 6, 35421. [Google Scholar] [CrossRef] [PubMed]
  17. Gao, H.; Kerr, A.; Jiao, H.; Hon, C.C.; Rydén, M.; Dahlman, I.; Arner, P. Long Non-Coding RNAs Associated with Metabolic Traits in Human White Adipose Tissue. EBioMedicine 2018, 30, 248–260. [Google Scholar] [CrossRef] [PubMed]
  18. American Diabetes Association Professional Practice Committee. Classification and Diagnosis of Diabetes: Standards of Medical Care in Diabetes—2022. Diabetes Care 2022, 45, S17–S38. [Google Scholar] [CrossRef] [PubMed]
  19. Jonas, M.I.; Kurylowicz, A.; Bartoszewicz, Z.; Lisik, W.; Jonas, M.; Wierzbicki, Z.; Chmura, A.; Pruszczyk, P.; Puzianowska-Kuznicka, M. Interleukins 6 and 15 Levels Are Higher in Subcutaneous Adipose Tissue, but Obesity Is Associated with Their Increased Content in Visceral Fat Depots. Int. J. Mol. Sci. 2015, 16, 25817–25830. [Google Scholar] [CrossRef]
  20. Jonas, M.I.; Kurylowicz, A.; Bartoszewicz, Z.; Lisik, W.; Jonas, M.; Domienik-Karlowicz, J.; Puzianowska-Kuznicka, M. Adiponectin/resistin interplay in serum and adipose tissue of obese and normal-weight individuals. Diabetol. Metab. Syndr. 2017, 9, 95. [Google Scholar] [CrossRef]
  21. Gaens, K.H.; Goossens, G.H.; Niessen, P.M.; van Greevenbroek, M.M.; van der Kallen, C.J.; Niessen, H.W. Nε-(carboxymethyl)lysine-receptor for advanced glycation end product axis is a key modulator of obesity-induced dysregulation of adipokine expression and insulin resistance. Arter. Thromb. Vasc. Biol. 2014, 34, 1199–1208. [Google Scholar] [CrossRef] [PubMed]
  22. Baptista, L.S.; Silva, K.R.; Jobeili, L.; Guillot, L.; Sigaudo-Roussel, D. Unraveling White Adipose Tissue Heterogeneity and Obesity by Adipose Stem/Stromal Cell Biology and 3D Culture Models. Cells 2023, 12, 1583. [Google Scholar] [CrossRef] [PubMed]
  23. Kurylowicz, A. microRNAs in Human Adipose Tissue Physiology and Dysfunction. Cells 2021, 10, 3342. [Google Scholar] [CrossRef] [PubMed]
  24. Haberka, M.; Machnik, G.; Kowalówka, A.; Biedroń, M.; Skudrzyk, E.; Regulska-Ilow, B.; Gajos, G.; Manka, R.; Deja, M.; Okopień, B.; et al. Epicardial, paracardial, and perivascular fat quantity, gene expressions, and serum cytokines in patients with coronary artery disease and diabetes. Pol. Arch. Intern. Med. 2019, 129, 738–746. [Google Scholar] [CrossRef] [PubMed]
  25. Kawai, T.; Autieri, M.V.; Scalia, R. Adipose tissue inflammation and metabolic dysfunction in obesity. Am. J. Physiol. Cell. Physiol. 2021, 320, C375–C391. [Google Scholar] [CrossRef] [PubMed]
  26. Samaras, K.; Botelho, N.K.; Chisholm, D.J.; Lord, R.V. Subcutaneous and visceral adipose tissue gene expression of serum adipokines that predict type 2 diabetes. Obesity 2010, 18, 884–889. [Google Scholar] [CrossRef]
  27. Donath, M.Y.; Böni-Schnetzler, M. IL-1β activation as a response to metabolic disturbances. Cell Metab. 2010, 12, 427–428. [Google Scholar] [CrossRef] [PubMed]
  28. Eder, K.; Baffy, N.; Falus, A.; Fulop, A.K. The major inflammatory mediator interleukin-6 and obesity. Inflamm. Res. 2009, 58, 727–736. [Google Scholar] [CrossRef]
  29. Saito, T.; Murata, M.; Otani, T.; Tamemoto, H.; Kawakami, M.; Ishikawa, S.E. Association of subcutaneous and visceral fat mass with serum concentrations of adipokines in subjects with type 2 diabetes mellitus. Endocr. J. 2012, 59, 39–45. [Google Scholar] [CrossRef]
  30. Beasley, L.E.; Koster, A.; Newman, A.B.; Javaid, M.K.; Ferrucci, L.; Kritchevsky, S.B.; Kuller, L.H.; Pahor, M.; Schaap, L.A.; Visser, M.; et al. Health ABC study. Health ABC study. Inflammation and race and gender differences in computerized tomography-measured adipose depots. Obesity 2009, 17, 1062–1069. [Google Scholar] [CrossRef]
  31. Spoto, B.; Di Betta, E.; Mattace-Raso, F.; Sijbrands, E.; Vilardi, A.; Parlongo, R.M.; Pizzini, P.; Pisano, A.; Vermi, W.; Testa, A.; et al. Pro- and anti-inflammatory cytokine gene expression in subcutaneous and visceral fat in severe obesity. Nutr. Metab. Cardiovasc. Dis. 2014, 24, 1137–1143. [Google Scholar] [CrossRef] [PubMed]
  32. Fox, C.S.; Massaro, J.M.; Hoffmann, U.; Pou, K.M.; Maurovich-Horvat, P.; Liu, C.Y.; Vasan, R.S.; Murabito, J.M.; Meigs, J.B.; Cupples, L.A.; et al. Abdominal visceral and subcutaneous adipose tissue compartments: Association with metabolic risk factors in the Framingham Heart Study. Circulation 2007, 116, 39–48. [Google Scholar] [CrossRef]
  33. Kim, S.K.; Kim, H.J.; Hur, K.Y.; Choi, S.H.; Ahn, C.W.; Lim, S.K.; Kim, K.R.; Lee, H.C.; Huh, K.B.; Cha, B.S. Visceral fat thickness measured by ultrasonography can estimate not only visceral obesity but also risks of cardiovascular and metabolic diseases. Am. J. Clin. Nutr. 2004, 79, 593–599. [Google Scholar] [CrossRef] [PubMed]
  34. Alvehus, M.; Burén, J.; Sjöström, M.; Goedecke, J.; Olsson, T. The human visceral fat depot has a unique inflammatory profile. Obesity 2010, 18, 879–883. [Google Scholar] [CrossRef] [PubMed]
  35. Nagareddy, P.R.; Kraakman, M.; Masters, S.L.; Stirzaker, R.A.; Gorman, D.J.; Grant, R.W.; Dragoljevic, D.; Hong, E.S.; Abdel-Latif, A.; Smyth, S.S.; et al. Adipose tissue macrophages promote myelopoiesis and monocytosis in obesity. Cell Metab. 2014, 19, 821–835. [Google Scholar] [CrossRef] [PubMed]
  36. Thrum, S.; Sommer, M.; Raulien, N.; Gericke, M.; Massier, L.; Kovacs, P.; Krasselt, M.; Landgraf, K.; Körner, A.; Dietrich, A.; et al. Macrophages in obesity are characterized by increased IL-1β response to calcium-sensing receptor signals. Int. J. Obes. 2022, 46, 1883–1891. [Google Scholar] [CrossRef]
  37. Curti, M.L.; Jacob, P.; Borges, M.C.; Rogero, M.M.; Ferreira, S.R. Studies of gene variants related to inflammation, oxidative stress, dyslipidemia, and obesity: Implications for a nutrigenetic approach. J. Obes. 2011, 2011, 497401. [Google Scholar] [CrossRef]
  38. Luo, Z.; Zhang, Y.; Li, F.; He, J.; Ding, H.; Yan, L.; Cheng, H. Resistin induces insulin resistance by both AMPK-dependent and AMPK-independent mechanisms in HepG2 cells. Endocrine 2009, 36, 60–69. [Google Scholar] [CrossRef]
  39. Kaser, S.; Kaser, A.; Sandhofer, A.; Ebenbichler, C.F.; Tilg, H.; Patsch, J.R. Resistin messenger-RNA expression is increased by proinflammatory cytokines in vitro. Biochem. Biophys. Res. Commun. 2003, 309, 286–290. [Google Scholar] [CrossRef]
  40. Silswal, N.; Singh, A.K.; Aruna, B.; Mukhopadhyay, S.; Ghosh, S.; Ehtesham, N.Z. Human resistin stimulates the pro-inflammatory cytokines TNF-alpha and IL-12 in macrophages by NF-kappaB-dependent pathway. Biochem. Biophys. Res. Commun. 2005, 334, 1092–1101. [Google Scholar] [CrossRef]
  41. Siddiqui, K.; Scaria Joy, S.; George, T.P. Circulating resistin levels in relation with insulin resistance, inflammatory and endothelial dysfunction markers in patients with type 2 diabetes and impaired fasting glucose. End. Metab. Sci. 2020, 3–4, 100059. [Google Scholar] [CrossRef]
  42. Ruiz, H.H.; Nguyen, A.; Wang, C.; He, L.; Li, H.; Hallowell, P.; McNamara, C.; Schmidt, A.M. The AGE/RAGE/DIAPH1 axis is associated with immunometabolic markers and risk of insulin resistance in subcutaneous but not omental adipose tissue in human obesity. Int. J. Obes. 2021, 45, 2083–2094. [Google Scholar] [CrossRef] [PubMed]
  43. Monden, M.; Koyama, H.; Otsuka, Y.; Morioka, T.; Mori, K.; Shoji, T.; Mima, Y.; Motoyama, K.; Fukumoto, S.; Shioi, A.; et al. Receptor for advanced glycation end products regulates adipocyte hypertrophy and insulin sensitivity in mice: Involvement of Toll-like receptor 2. Diabetes 2013, 62, 478–489. [Google Scholar] [CrossRef] [PubMed]
  44. Lee, B.W.; Chae, H.Y.; Kwon, S.J.; Park, S.Y.; Ihm, J.; Ihm, S.H. RAGE ligands induce apoptotic cell death of pancreatic β-cells via oxidative stress. Int. J. Mol. Med. 2010, 26, 813–818. [Google Scholar] [PubMed]
  45. Sanchez, C.A.; Kawamura, Y.; Yamamoto, Y.; Takeshita, F.; Ochiya, T. Emerging Roles of Long Non-Coding RNA in Cancer. Cancer Sci. 2018, 109, 2093–2100. [Google Scholar] [CrossRef]
  46. Chrysanthou, M.; Estruch, I.M.; Rietjens, I.M.C.M.; Wichers, H.J.; Hoppenbrouwers, T. In Vitro Methodologies to Study the Role of Advanced Glycation End Products (AGEs) in Neurodegeneration. Nutrients 2022, 14, 363. [Google Scholar] [CrossRef]
  47. Wu, P.; Cai, J.; Chen, Q.; Han, B.; Meng, X.; Li, Y.; Li, Z.; Wang, R.; Lin, L.; Duan, C.; et al. Lnc-TALC promotes O6-methylguanine-DNA methyltransferase expression via regulating the c-Met pathway by competitively binding with miR-20b-3p. Nat. Commun. 2019, 10, 2045. [Google Scholar] [CrossRef]
  48. Lin, M.; Li, Y.; Xian, J.; Chen, J.; Feng, Y.; Mao, C.; Pan, Y.; Li, Z.; Zeng, Y.; Yang, L.; et al. Long non-coding RNA AGER-1 inhibits colorectal cancer progression through sponging miR-182. Int. J. Biol. Markers 2020, 35, 10–18. [Google Scholar] [CrossRef]
  49. Pan, Z.; Liu, L.; Nie, W.; Miggin, S.; Qiu, F.; Cao, Y.; Chen, J.; Yang, B.; Zhou, Y.; Lu, J.; et al. Long non-coding RNA AGER-1 functionally upregulates the innate immunity gene AGER and approximates its anti-tumor effect in lung cancer. Mol. Carcinog. 2018, 57, 305–318. [Google Scholar] [CrossRef]
  50. Koźniewski, K.; Wąsowski, M.; Jonas, M.I.; Lisik, W.; Jonas, M.; Binda, A.; Jaworski, P.; Tarnowski, W.; Noszczyk, B.; Puzianowska-Kuźnicka, M.; et al. Epigenetic Regulation of Estrogen Receptor Genes’ Expressions in Adipose Tissue in the Course of Obesity. Int. J. Mol. Sci. 2022, 23, 5989. [Google Scholar] [CrossRef]
  51. Navel, V.; Malecaze, J.; Belville, C.; Choltus, H.; Henrioux, F.; Dutheil, F.; Malecaze, F.; Chiambaretta, F.; Blanchon, L.; Sapin, V. Dysregulation of Receptor for Advanced Glycation End Products (RAGE) Expression as a Biomarker of Keratoconus. Dis. Markers 2022, 2022, 1543742. [Google Scholar] [CrossRef] [PubMed]
  52. Perneger, T.V. What’s wrong with Bonferroni adjustments. BMJ 1998, 316, 1236–1238. [Google Scholar] [CrossRef] [PubMed]
  53. Nakagawa, S. A farewell to Bonferroni: The problems of low statistical power and publication bias. Behav. Ecol. 2004, 15, 1044–1045. [Google Scholar] [CrossRef]
Figure 1. AEGR mRNA (a,b) and lncAGER-1 (c,d) levels in visceral (VAT) and subcutaneous (SAT) adipose tissue of obese subjects before (O) and after surgical weight loss (PO), in normal weight subjects (N) and diabetic (D) and non-diabetic (ND) obese study participants. Results are presented as median with interquartile range.
Ijms 24 17447 g001
Figure 2. Correlations between AGER mRNA levels and AGER-1 lncRNA levels in visceral adipose tissue (VAT) and subcutaneous adipose tissue (SAT) of all obese (O), obese diabetic (D), obese non-diabetic (ND), normal weight (N), and post-bariatric surgery (PO) study participants. Black dots represent particular participants. Lines represent linear regression analysis with 95% CI interval. (ai) refer to the phenomena observed in the different fat deposits in the different study groups.
Ijms 24 17447 g002
Figure 3. mRNA levels of genes encoding (a) interleukin 1b (IL1B), (b) interleukin 6 (IL6), (c) interleukin 8 (IL8), and (d) resistin (RETN) in visceral (VAT) and subcutaneous (SAT) adipose tissue of diabetic (D) and non-diabetic (ND) obese subjects. Results are presented as median and interquartile range.
Ijms 24 17447 g003
Figure 4. Correlations between AGER mRNA concentrations and mRNA levels of interleukin 1b (IL1B, (a)), interleukin 6 (IL6, (b)), interleukin 8 (IL8, (c)), and resistin (RETN, (d)) in the visceral adipose tissue of obese diabetic study participants (VAT-O). Black dots represent particular participants. Lines represent linear regression analysis with 95% CI interval.
Ijms 24 17447 g004
Table 1. Clinical and biochemical characteristics of the study participants.
Obese Individuals
before Weight Loss (N = 62)
Obese Individuals
after Weight Loss (N = 15)
Normal Weight
Controls (N = 20)
Mean ± SDMin–MaxMean ± SDMin–MaxMean ± SDMin–Max
Age (years)40.48 ± 10.1920–5940.76 ± 8.1329–5944.08 ± 13.526–63
Weight (kg)125.6 ± 17.1187.8–170.073.11 ± 6.2566.0–82.067.92 ± 10.4854.0–74.0
BMI (kg/m2)45.97 ± 5.7035.43–63.4228.2 ± 2.4524.0–31.223.06 ± 1.3320.7–24.93
Adipose tissue (% body mass)48.54 ± 3.6540.43–57.2332.5 ± 3.426.0–37.0--
Weight loss (kg)--32.4 ± 8.423.0–42.0--
Glucose (mmol/l)5.91 ± 1.373.67–9.854.82 ± 0.554.12–5.665.2 ± 0.34.8–5.4
HbA1c (%)5.79 ± 0.515.06–7.205.1 ± 0.474.59–5.654.9 ± 0.284.6–5.3
Total cholesterol (mmol/l)4.96 ± 0.913.13–7.874.76 ± 0.663.92–5.94.31 ± 0.204.24–4.78
LDL cholesterol (mmol/l)3.04 ± 0.971.04–5.652.99 ± 0.352.54–3.582.82 ± 0.112.74–2.90
HDL cholesterol (mmol/l)1.21 ± 0.250.59–1.781.38 ± 0.271.08–1.681.47 ± 0.261.24–1.76
Triglycerides (mmol/l)1.43 ± 0.720.52–3.231.40 ± 0.381.02–1.851.32 ± 0.21.1–1.46
CRP (mg/l)10.65 ± 5.291.21–21.614.51 ± 2.451.81–7.213.24 ± 1.720.7–5.20
ComorbiditiesN(%)N(%)N(%)
Hypertension3150.0%533.3%nonenone
Type 2 diabetes mellitus/prediabetes *2337.0%320.0%nonenone
Hyperlipidemia3455.0%640.0%nonenone
BMI—body mass index calculated as weight (kg) divided by height squared (m2); CRP—C-reactive protein; HbA1c—glycated hemoglobin, HDL—high-density lipoproteins; LDL—low-density lipoproteins; N—number of subjects; * impaired fasting glucose and/or impaired glucose tolerance.
Table 2. Primers used for the analysis of lncRNA and gene expression at the mRNA level in adipose tissue.
Gene/lncRNADescription PrimersRef.
AGERadvanced glycosylation
end-product receptor
F5′ TGTGCTGATCCTCCCTGAGA 3′[51]
R5′ CGAGGAGGGGCCAACTGCA 3′
lncAGER-1long non-coding RNA
AGER-1
F5′ AACCAGGAGGAAGAGGAGGA 3′[48]
R5′ TTGGCAAGG TGGGGTTATAC 3′
IL1Binterleukin 1βF5′ CACCAAGCTTTTTTGCTGTGAGT3′[19]
R5′ GCACGATGCACCTGTACGAT 3′
IL6interleukin 6F5′ CCTTCGGTCCAGTTGCCTTC 3′[19]
R5′ GTGGGGCGGCTACATCTTTG 3′
IL8interleukin 8F5′ CACCGGAAGAACCATCTCACT 3′[19]
R5′ TCAGCCCTCTTCAAAAACTTCTCC 3′
RETNresistinF5′ GCTGTTGGTGTCTAGCAAGAC 3′[20]
R5′ CATCATCATCATCATCTCCAG 3′
ACTBβ-actinF5′ CAGCCTGGATAGCAACGTAC 3′[19,20,51]
R5′ TTCTACAATGAGCTGCGTGTG 3′
F—forward, R—reverse.
Disclaimer/Publisher’s Note: The statements, opinions and data contained in all publications are solely those of the individual author(s) and contributor(s) and not of MDPI and/or the editor(s). MDPI and/or the editor(s) disclaim responsibility for any injury to people or property resulting from any ideas, methods, instructions or products referred to in the content.

