1. Introduction
Neuronal plasticity is directly associated with alterations in the expression, properties, and function of plasma membrane channels and transporters that dissipate or generate ion gradients, respectively [
1,
2,
3]. The divalent transition metal cation zinc (Zn
2+) is concentrated in multiple brain regions, including the cerebral cortex, hippocampus, hypothalamus, and amygdala and seems to act as a neuromodulator, targeting a wide spectrum of postsynaptic receptors [
4,
5]. Specifically, Zn
2+ modulates the sensitivity of inhibitory and excitatory receptors to their respective neurotransmitters [
6,
7,
8].
As members of the pentameric ligand-gated ion channel (pLGICs) family, γ-aminobutyric acid type A receptors (GABA
ARs) are inhibited allosterically by micromolar concentrations of Zn
2+ [
9]. Recent structural studies have provided some insight into the mechanism of inhibition underlying GABA-induced responses to Zn
2+ [
10]. Once in the channel, Zn
2+ may first bind to a histidine residue and then nullify the γ-aminobutyric acid (GABA) response by physically plugging the pore, thereby reducing the single Cl
− current. This residue is located at the extracellular end of the ion channel lining the TM2 domain of the β3 subunit and may form part of a zinc-binding site [
11]. The Zn
2+ inhibitory potency is profoundly affected by the subunit composition (αβ or αβγ) of GABA
ARs [
12] and varies according to the developmental stage [
13,
14]. This is physiologically relevant because Zn
2+ ions could be critically involved in various pathological processes (e.g., seizures and temporal-lobe epilepsy) where subunit expression may be altered [
15,
16,
17]. In addition to the extracellular sites, there are intracellular amino acid residues in the receptor’s hetero-oligomeric structure that could, in principle, coordinate Zn
2+ binding; however, their role in modulating the receptor remains unclear. The GABA
AR β3 subunit possesses a zinc-sensitive ATPase that enables the energy-dependent transport of Cl
− via a receptor pore [
18,
19]. In addition, such a GABA
AR-coupled ATPase is involved in seizures [
20]. Given that Zn
2+ ions are released both extra- and intracellularly [
4,
5], and ATPase is localized on the intracellular side of the channel [
21], there is considerable interest in determining the molecular mechanisms through which Zn
2+ modulates ATPase function. Furthermore, the molecular determinants that mediate the sensitivity of GABA
AR to Zn
2+ ions at different developmental stages are not fully understood.
Zinc is a signaling molecule involved in the regulation of various enzymes by inhibiting their catalytic activity [
22]. Zn
2+ at nano- or micromolar concentrations inhibits “metallobinding” proteins by interacting with an active center that contains catalytic dyads or triads of glutamate, histidine, and cysteine residues. Early studies have provided evidence of the sulfhydryl and disulfide groups’ involvement in GABA
AR responses [
23], notably two cysteine residues located at the external N-terminus and most of the extra cysteines (1–11) of the GABA
AR subunits that can significantly contribute to redox modulation [
24]. In addition, transmembrane domains can contain cysteines whose positions show a relatively high degree of conservation. Specifically, a single cysteine at the M3 domain is present in virtually all GABA
AR subunit subtypes (including β subunits). Although the modulation of such cysteine residue (C313) by redox agents has been shown in homomeric GABA
AR β3 subtypes [
25], its sensitivity to zinc is unknown.
There is strong evidence showing that synaptic sulfhydryl groups of ionic channels and transporters are targets for electrophiles [
26].
N-ethylmaleimide (NEM) is a membrane-permeant alkylating agent that modifies the thiol groups of cysteine residues via the formation of a covalent thioether bond. Specifically, NEM can cause an increase in the frequency of GABA
AR-mediated postsynaptic currents [
27,
28] or eliminate the depolarization- or post-burst-induced suppression of GABA
AR-mediated inhibition in CA1 pyramidal cells [
28,
29]. Moreover, NEM modulates the GABA
AR-mediated Cl
− or HCO
3− fluxes in cortical neurons via regulating the desensitization/resensitization in a bicarbonate-dependent fashion [
19]. However, the specific mechanism by which NEM functions to modulate GABA
ARs has yet to be established. Considering that NEM, in contrast to other thiol agents, causes a decrease in the neuronal concentration of ATP [
19,
30], we aimed to use NEM to test the hypothesis that cysteine residues contribute significantly to the Zn
2+-mediated modulation of the ATPase activity.
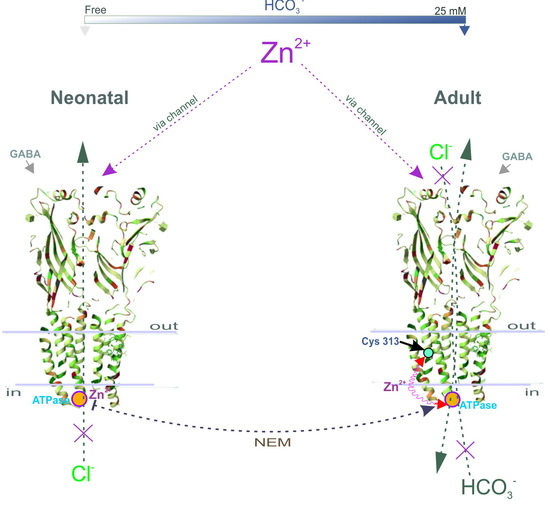
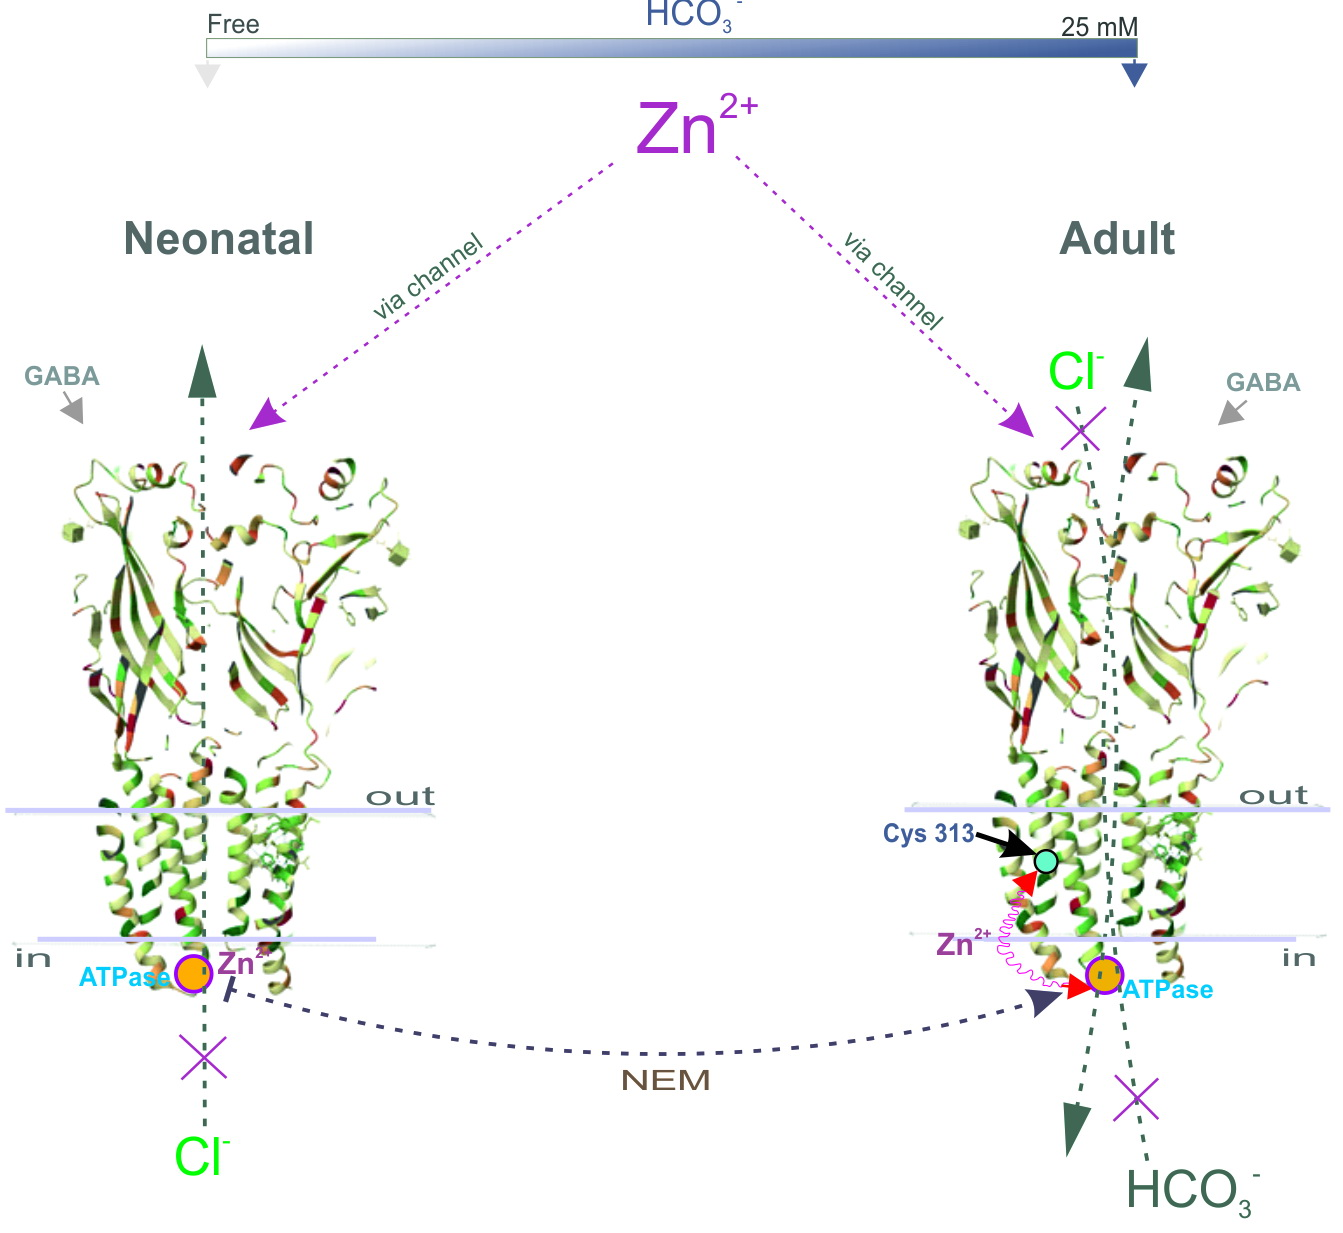
Here, we propose a mechanistic and molecular basis for the inhibition of intracellular GABAAR/ATPase function by zinc in neonatal and adult rats. The enzymes within the scope of GABAAR performance as Cl−ATPase and then as Cl−, HCO3−ATPase form during the first week of postnatal rat development. The GABAAR β1 and β3 isoforms, in contrast to the β2 subunit, possess the ATPase activity that facilitates re-establishing the anion gradients into neurons. In addition, we have shown that the Cl−ATPase form belongs to the β1 subunit, whereas the β3 subunit preferably possesses the Cl−, HCO3−ATPase activity. We demonstrated that a Zn2+ with variable efficacy inhibits the GABAAR as well as the ATPase activities of immature or mature neurons. Using fluorescence recording in the cortical synaptoneurosomes (SNs), we showed a competitive association between Zn2+ and NEM in parallel changes both in the ATPase activity and the GABAAR-mediated Cl− and HCO3− fluxes. Finally, by site-directed mutagenesis, we identified in the M3 domain of β subunits the cysteine residue (C313) that is essential for the manifestation of Zn2+ potency.
3. Discussion
Currently, the properties of GABA
ARs are studied using electrophysiological (e.g., patch-clamp) and non-electrophysiological (e.g., fluorescence-based) methods. Although the fluorescence-based, in contrast to the patch-clamp method, does not directly measure ionic current and ion-concentration-dependent changes of fluorescence signals as a result of ionic flux, using environmentally sensitive dyes may allow to detect the conformational changes [
46]. We used fluorescence recordings to directly assess the contribution of anions on GABA
AR functional activity during ontogenesis. Our results shed light on the substantial role of HCO
3− in the GABA efficacy in SNs isolated from adult rats (P35). In addition, we focused on the role of ATPase in the rapid re-establishment of anionic gradients after GABA
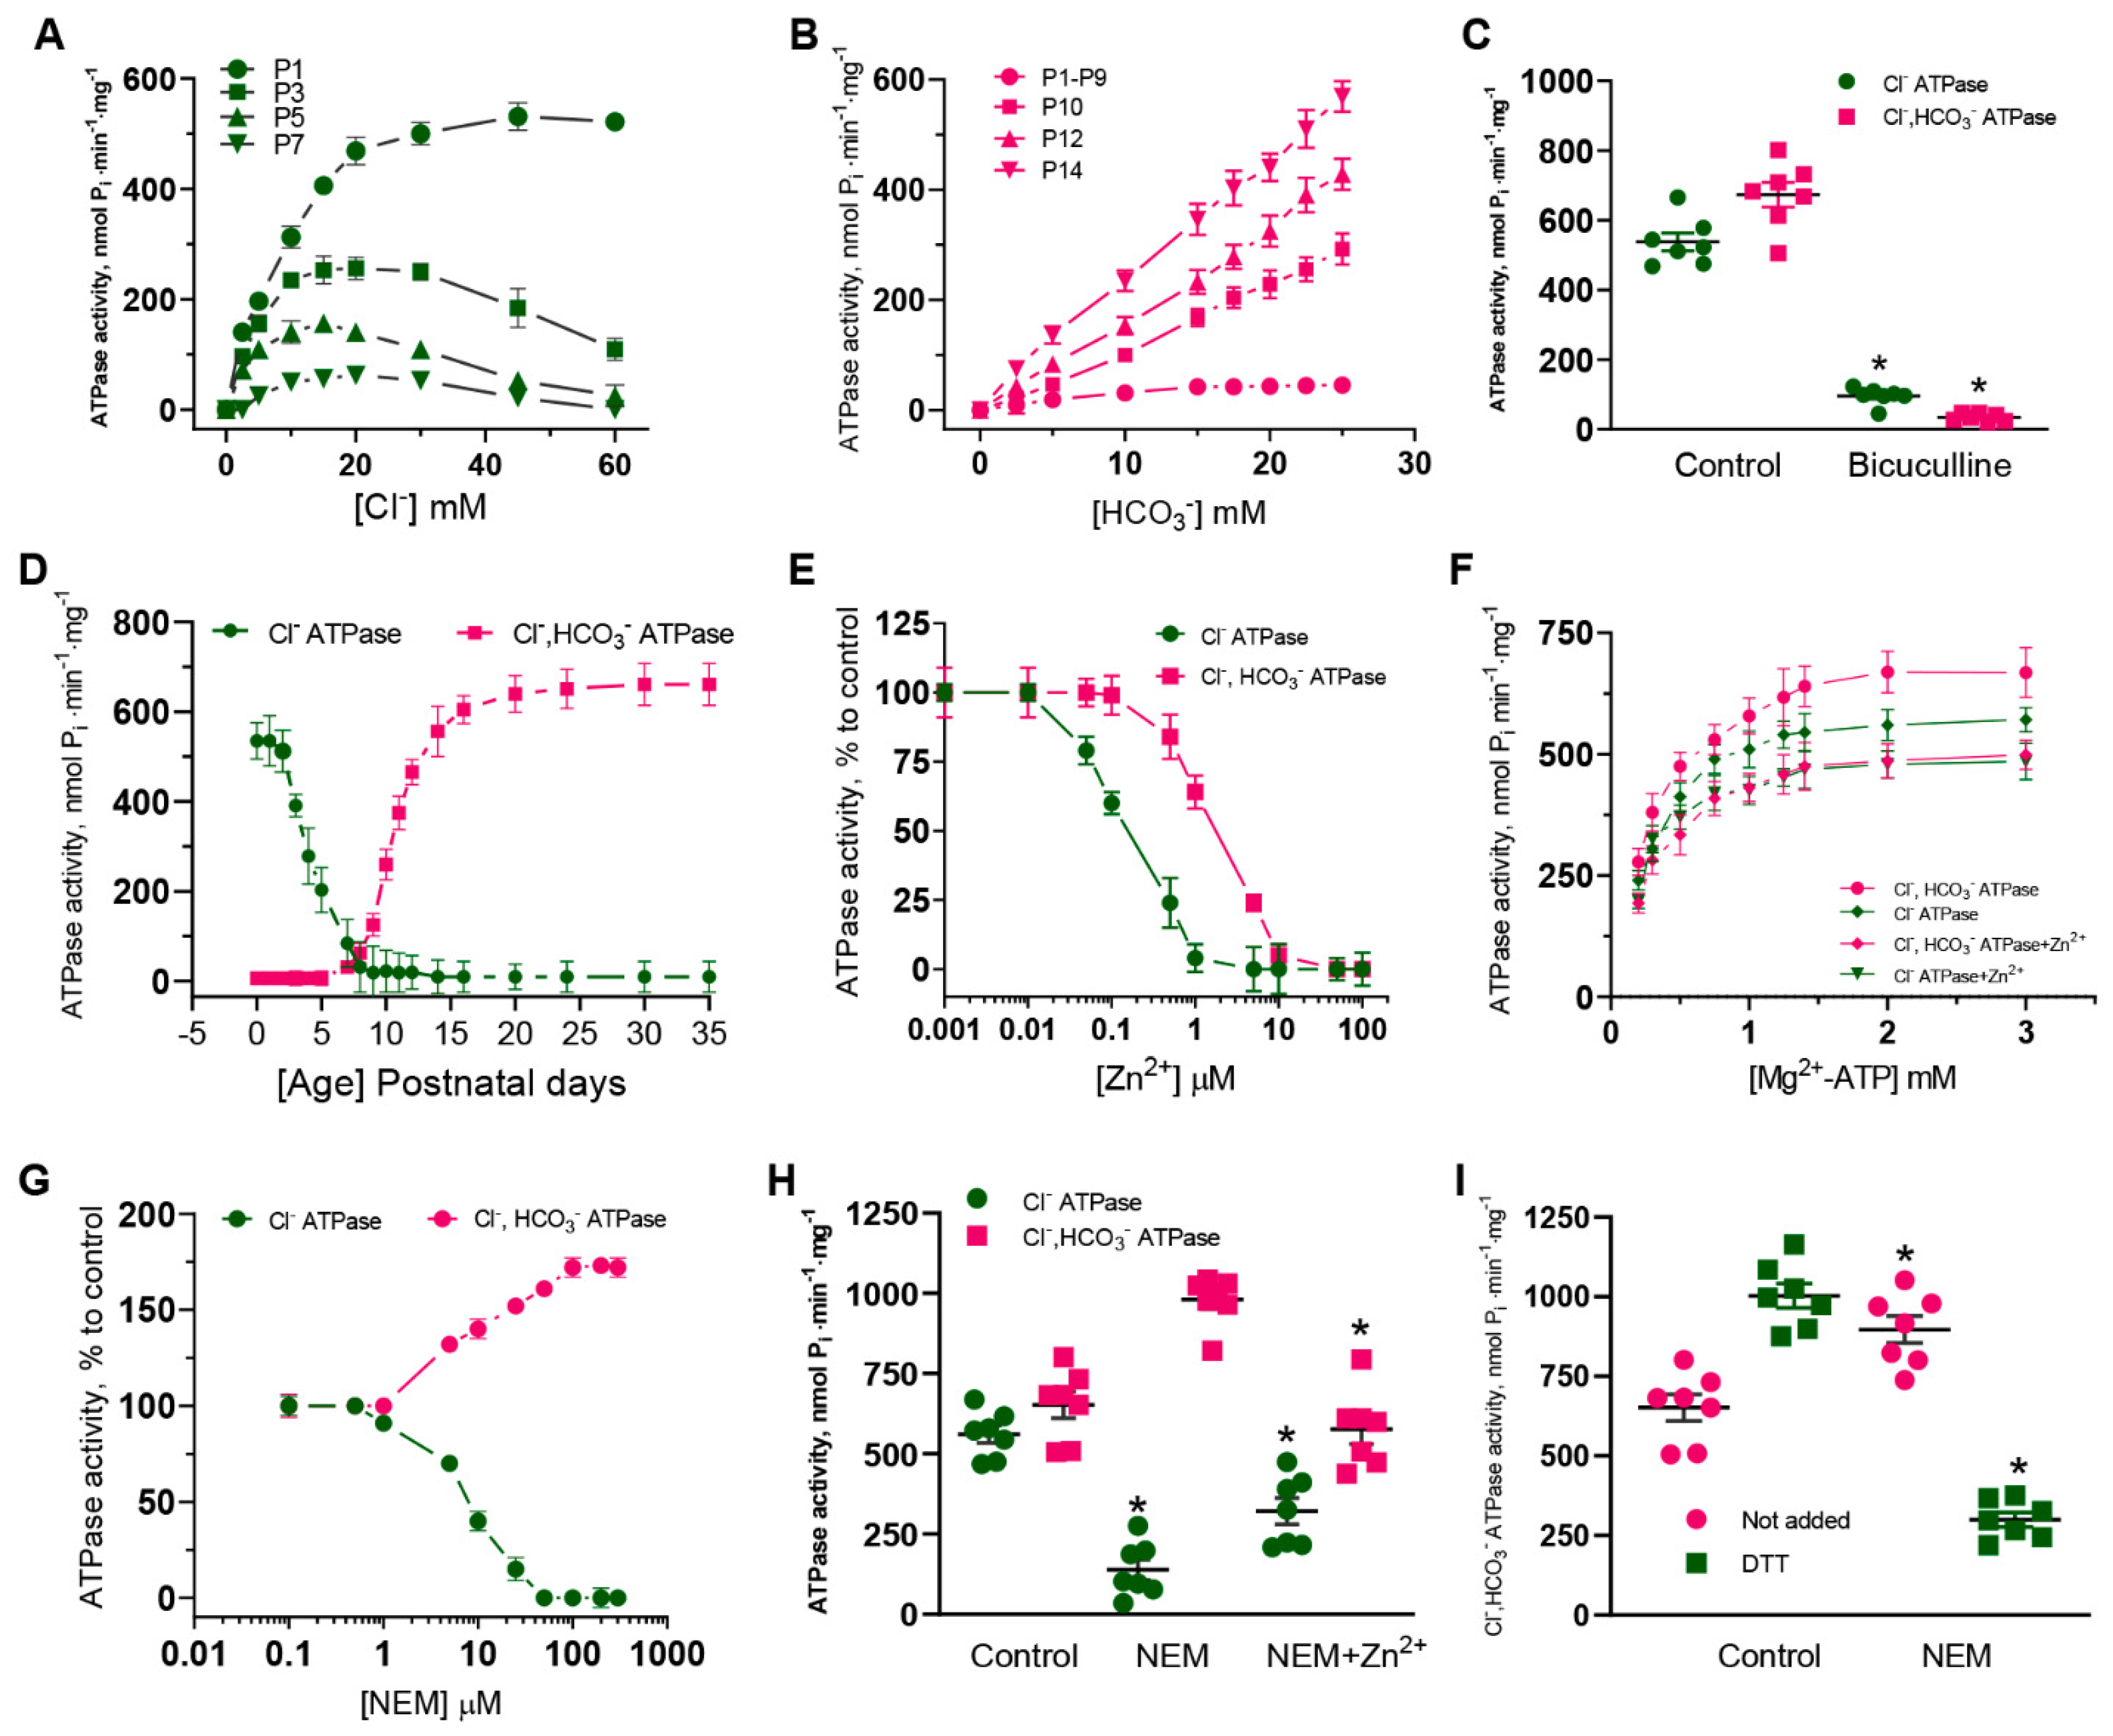
AR responses. During the first days (P1–P4), Cl
−, but not HCO
3−, played a dominant role in the ATPase activity, while after postnatal day 10, a dominant role for HCO
3− and a minor role for Cl
− became apparent (
Figure 1). The dramatic transient switching in the effectiveness and performance of the enzyme forms from Cl
−ATPase to Cl
−, HCO
3−ATPase during early postnatal development demonstrates the involvement of primary-active transport in the recovery not only of [Cl
−]
i, but also [HCO
3−]
i after day P10. In addition, it was established that Cl
−ATPase is related to the GABA
AR β1 isoform, whereas the Cl
−, HCO
3−ATPase belonged to the GABA
AR β3 isoform. Most likely, this is associated with both the distinct properties of the subunits and their traffic changes to the cell surface [
47]. Data from the literature shows the variable expression of mRNA GABA
AR β1, β2, or β3 subunits in hippocampal granule cells during postnatal development. Specifically, in neurons isolated in samples between days P5 and P7, there is a significant expression of the GABA
AR β1 subunit mRNA in contrast to the β2 or β3 subunits [
14], and neurons isolated in samples from postnatal days 17–21 had an increased expression of the GABA
AR β2 and β3 subunits’ mRNA. In this study, we show for the first time that the homomeric β3 isoform, in contrast to the β1 isoform, manifests an essential GABA-mediated HCO
3− outflow and its recovery. These data suggest the high probability of the presence of a distinctive mechanism for HCO
3− transport via the GABA
ARs. Notably, previous work has gained attention in the concluding observations that, out of the three β subunits, only the expression of β3 in the β1-β2 subunit knockout can fully maintain or restore inhibitory responses to control levels in the hippocampus [
48].
Although early studies reported that Zn
2+ inhibits both primary active transporters and secondary active cation-chloride cotransporters (CCCs), there are essential differences in their sensitivity to its inhibiting action. Specifically, Zn
2+ inhibits the erythrocyte Ca
2+ ATPase with a K
i of 80 pM [
49], whereas CCCs are inhibited at high concentrations (I
50 = 50 µM) [
50]. In the present study, we propose a mechanistic and molecular basis for the inhibition of GABA
AR-coupled ATPase by Zn
2+ and its dependence on the stage of postembryonal development. The ATPase activity was inhibited by Zn
2+, but its sensitivity to cations differed in neonatal (IC
50 = 0.2 µM) and adult rats (IC
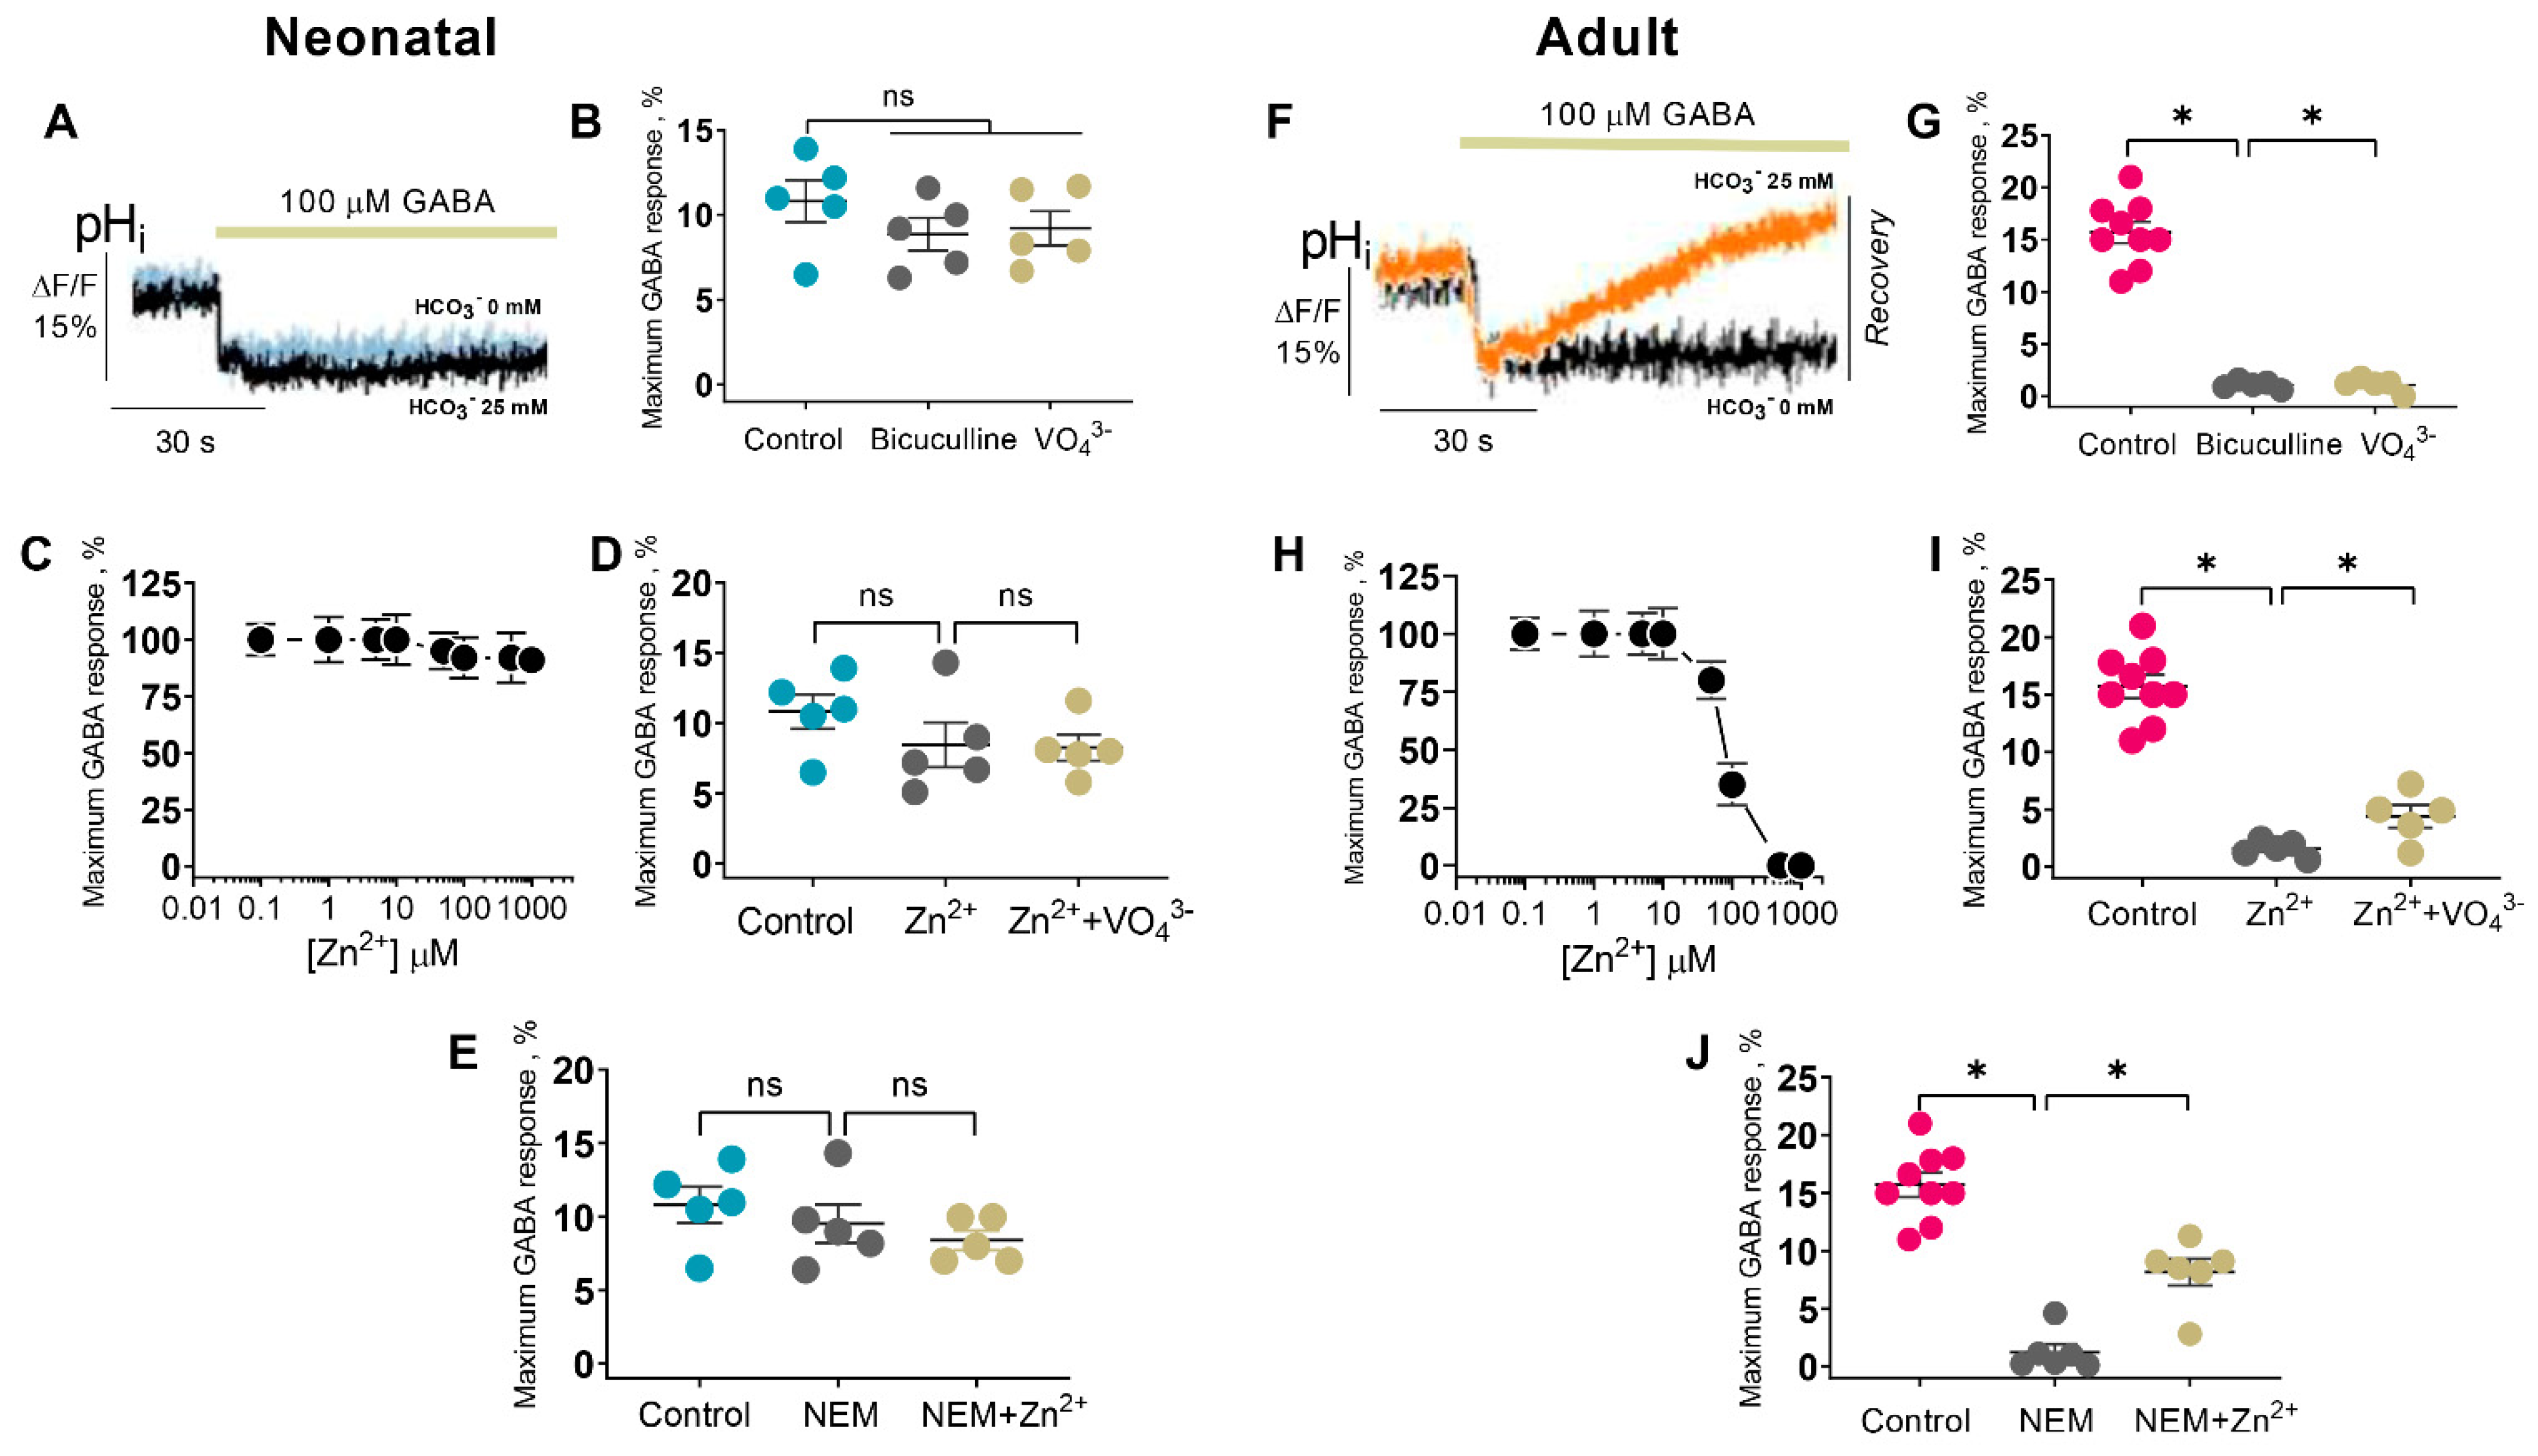
50 = 2.0 µM), which is similar to the results of electrophysiological studies. Specifically, the GABA
AR-mediated Cl
− current recorded in hippocampal slices isolated from postnatal rats (P1–P5) was inhibited by 80% at 100 µM Zn
2+, in contrast to adult rats (30% inhibition at 400 µM Zn
2+) [
13,
14]. In confirmation of these data, the GABA
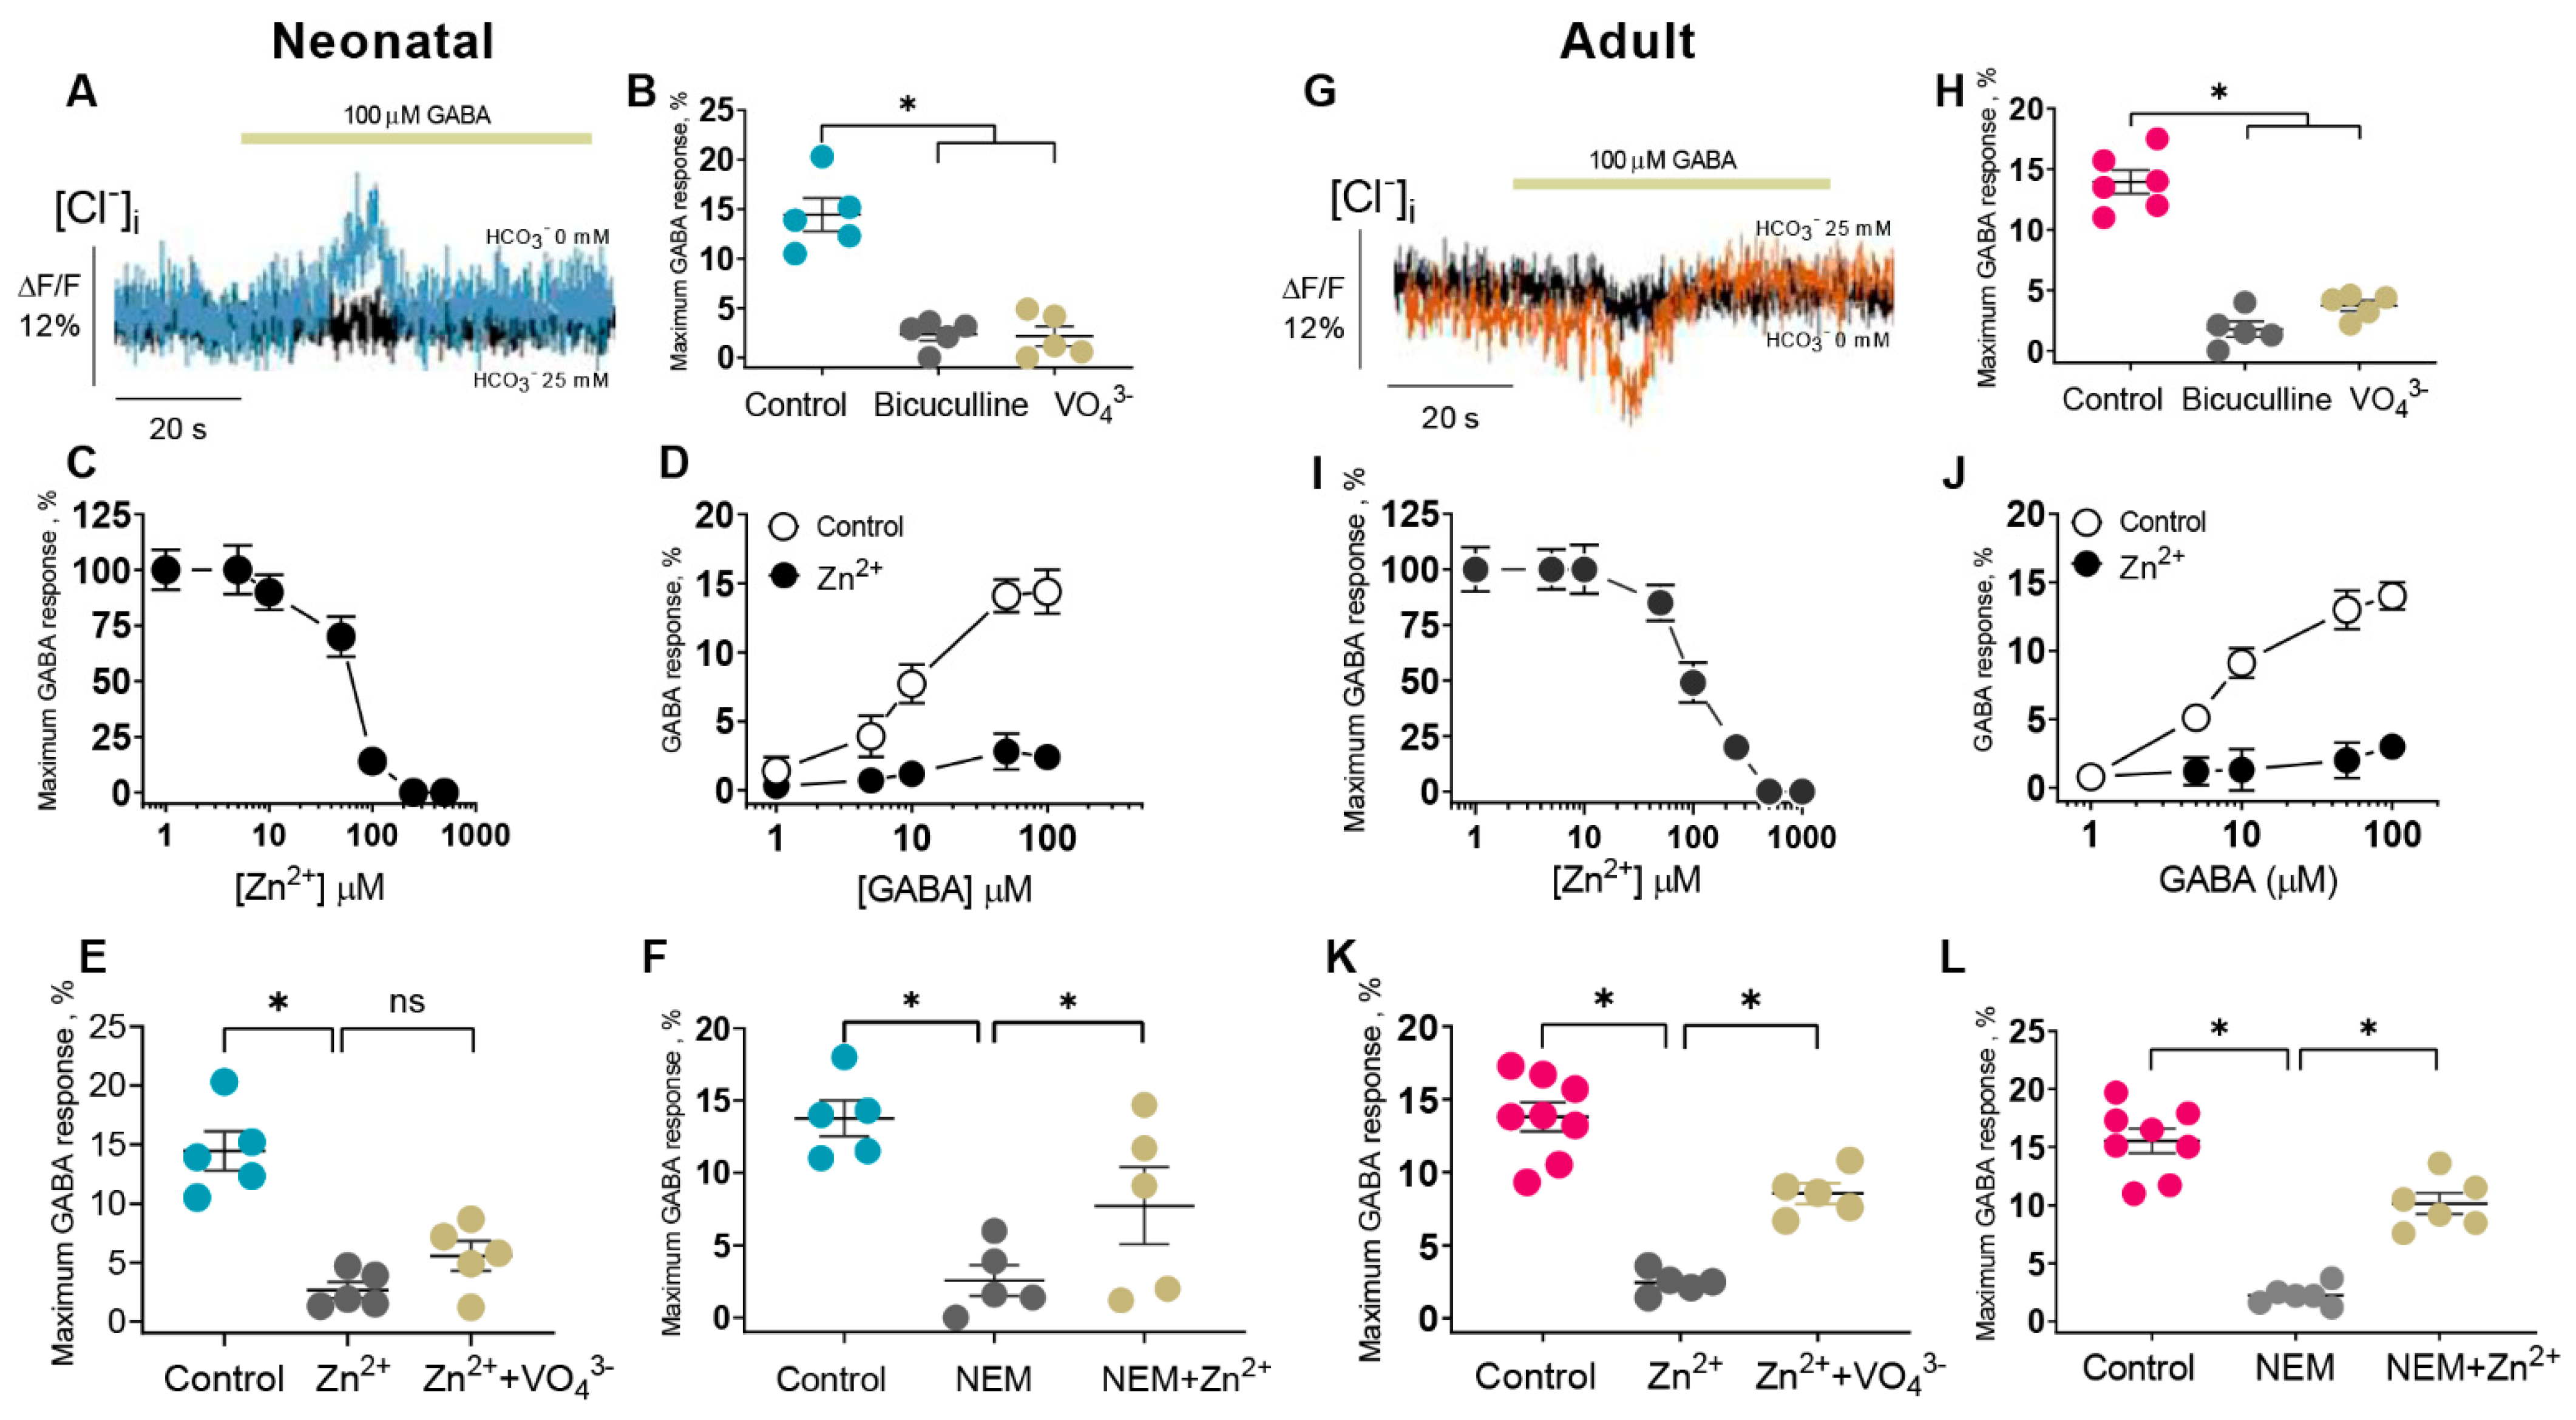
AR-mediated Cl
− flow in the SNs (P1) was inhibited by ~90% at 100 µM Zn
2 +(I
50 = 80 µM), in contrast to adult rats (80% inhibition at 250 µM Zn
2+) (I
50 = 100 µM) (
Figure 2). Based on the received data, the physiological role of zinc in the modulation of GABA
AR/ATPase functional activity is in question because zinc ions are released both extra- and intracellularly [
16]. Cellular “free” zinc concentrations are between 10 and 1000 pM and these concentrations are similar to the affinity of Zn
2+ for cytosolic “metallobinding” enzymes [
22]. Effective micromolar zinc-inhibition can have physiological significance only at an extracellular binding with the receptor complex. However, some studies have shown that Zn
2+ can penetrate via the channel as a complex ion with permeating anions resulting in the intracellular or membrane inhibition effect [
51,
52]. Specifically, on cultured hippocampal neurons it was showed that a continuous background release of GABA induced a standing-sensitive inward Cl
−-current that was inhibited by bicuculline [
51]. This leakage current is initially reduced in amplitude by 300 µM Zn
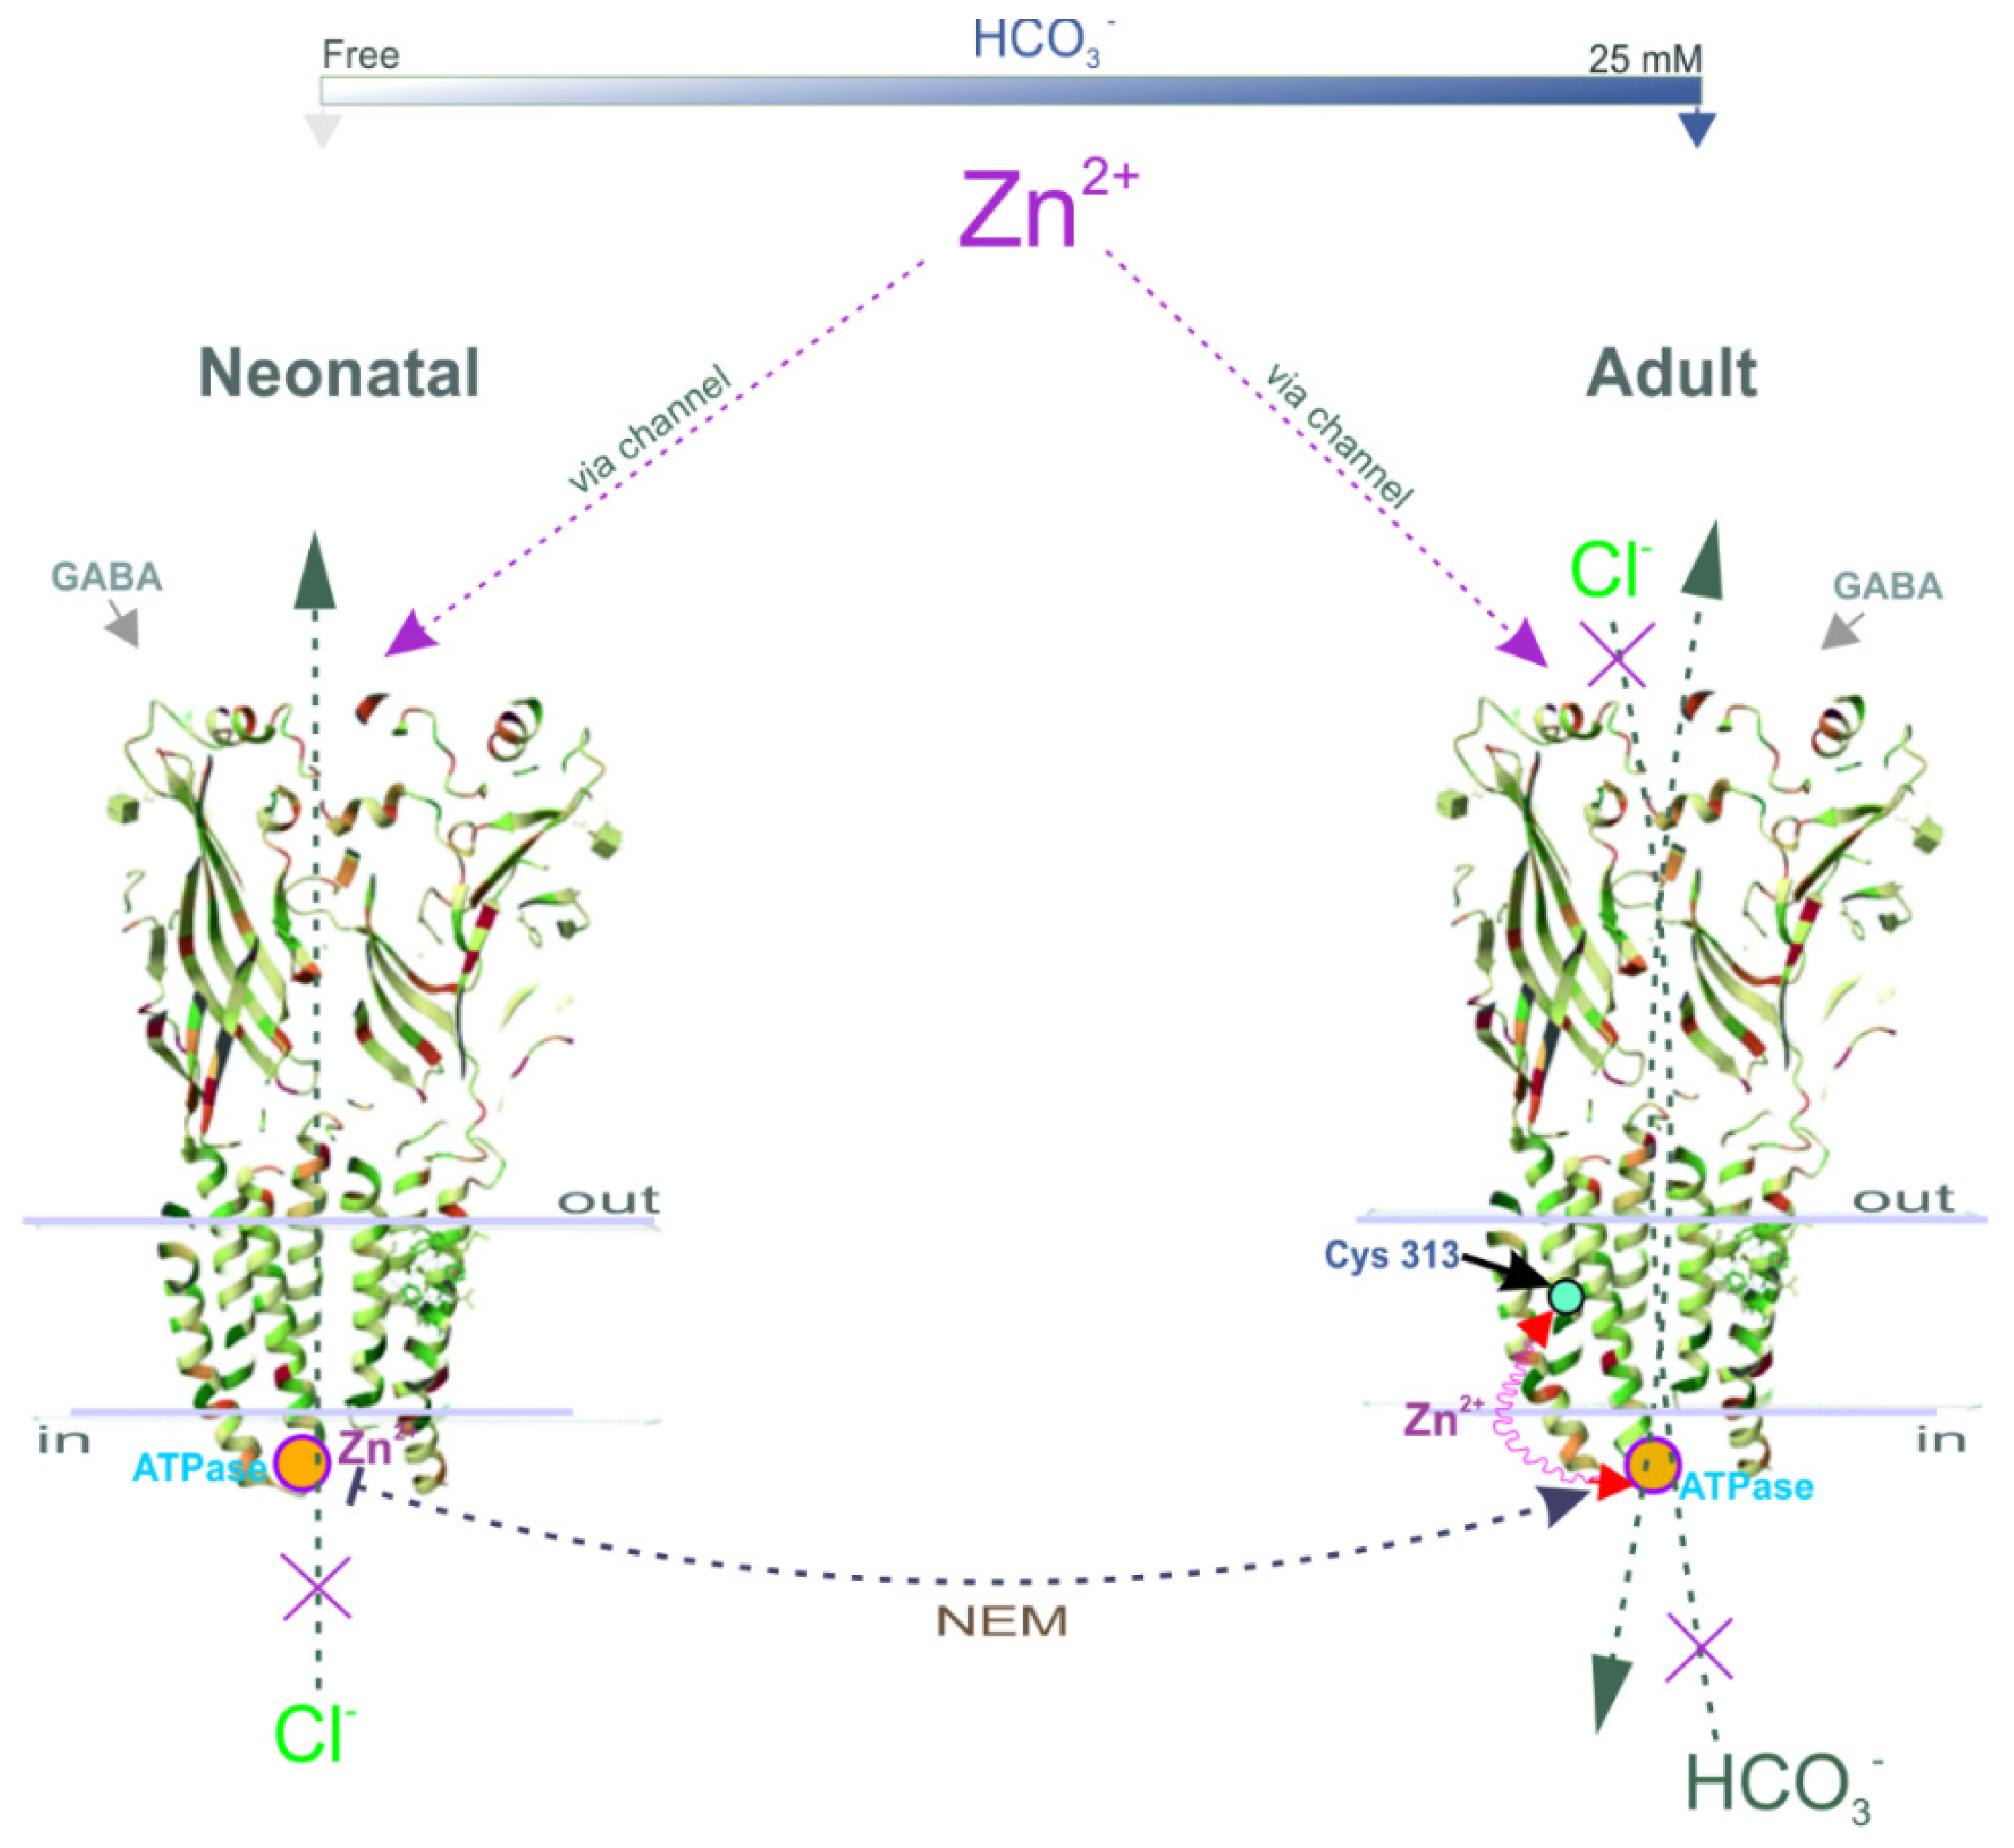
2+ and eventually converted, in the continued presence of zinc, into discrete discontinuous transients appearing. It can be assumed that in our study we have also observed both the extra- and intracellular effects of Zn
2+ on the GABA
AR-mediated anion transport and ATPase activity (
Figure 5). In addition, in our study, the substrate (Mg
2+-ATP) and Zn
2+ were likely to have competed for the same ATP-hydrolysis site, indicating the binding of Zn
2+ to the active site. This finding aligns with the data showing that Zn
2+ can competitively bind to the catalytic center of various enzymes [
22,
53]. For example, Zn
2+ at nanomolar concentrations inhibits the receptor protein tyrosine phosphatase β activity, which contains a catalytic cysteine residue [
53].
Recently, three distinct Zn
2+-binding sites on the GABA
AR were identified: one site within the ion pore of the β3 subunit is for His267 and Glu270 residues, and the other two occur on the external amino (N)-terminal face between the β (Glu 182) and α (Glu137 and His141) subunits [
10,
11]. Early research questioned the possible role of a cysteine residue in the structure of pLGICs, which theoretically could interact with Zn
2+ [
8]. However, the involvement of cysteine in the Zn
2+-inhibition potency of GABA
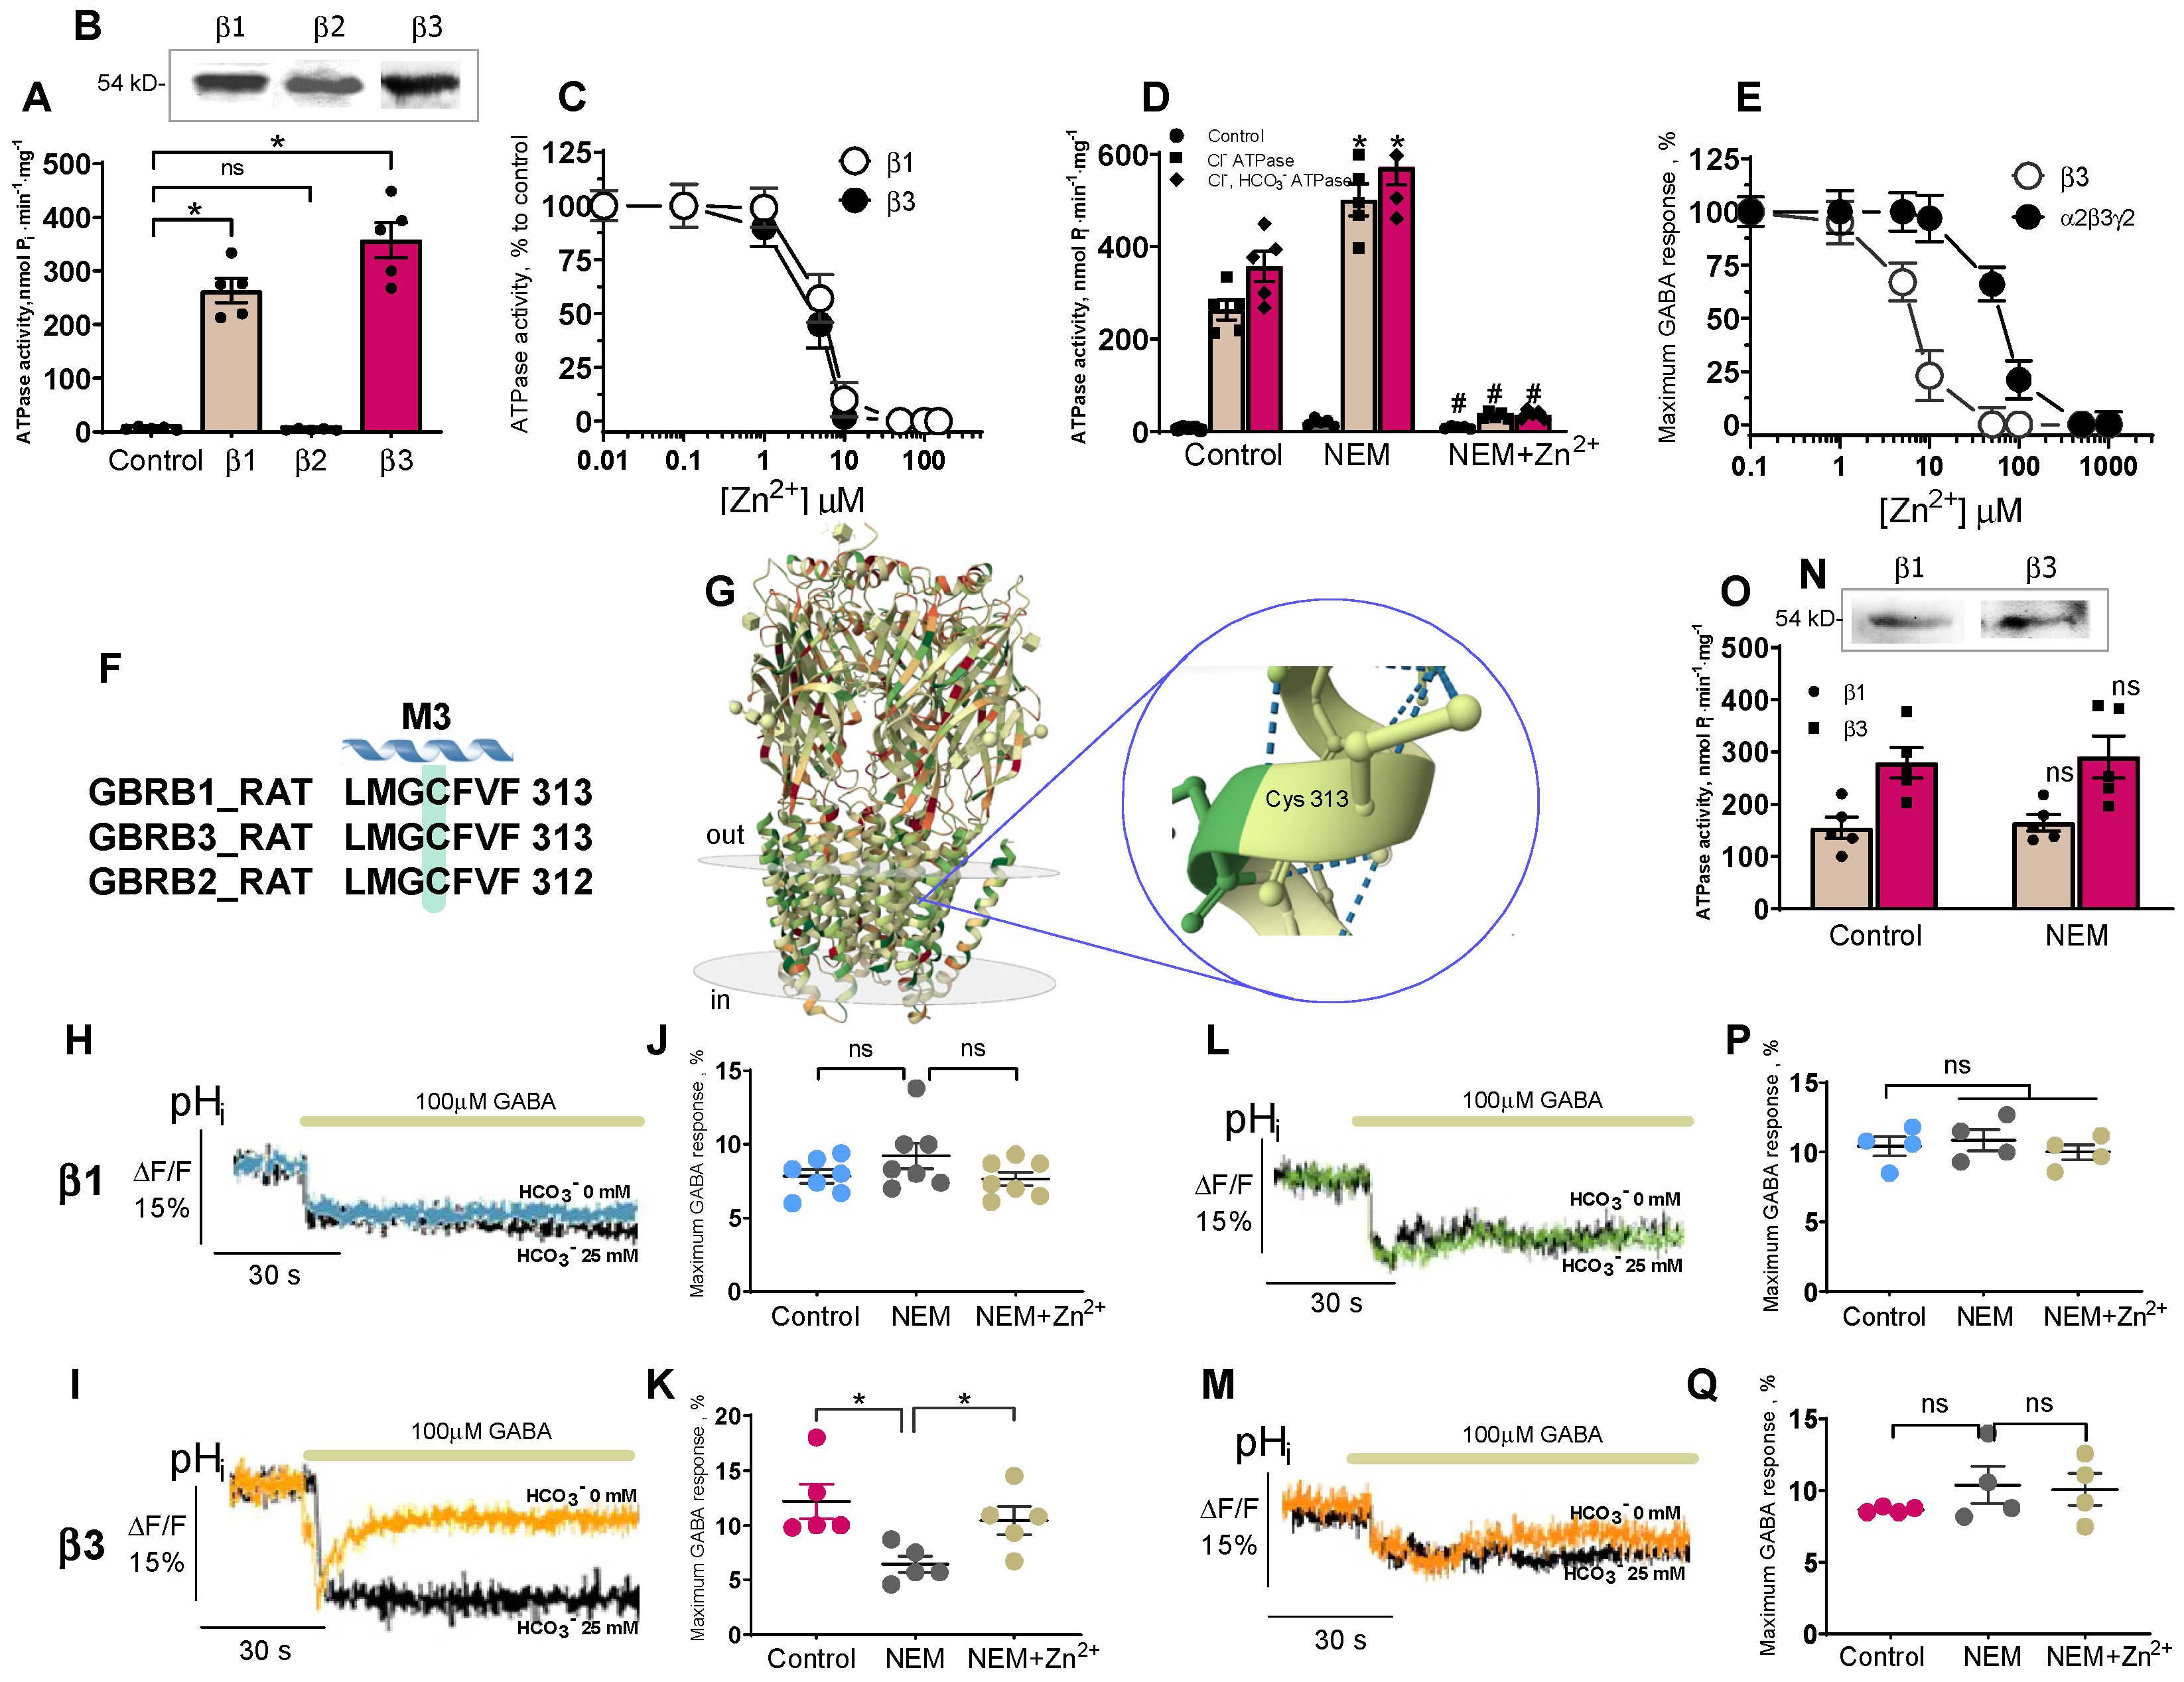
ARs was not demonstrated. Here, NEM completely inhibits the Cl
−ATPase activity and Zn
2+ eliminates the NEM effect on Cl
−, HCO
3−ATPase form (
Figure 1), implicating it as the catalytic cysteine (Cys313) and nearby residues in the coordination of Zn
2+ in the M3 domain of these β subunits (
Figure 4F). This line of reasoning confirms that mutant isoforms do not show the activation of ATPase by NEM. In addition, the NEM effect on the GABA
AR-mediated Cl
− or HCO
3− fluxes was eliminated by vanadate in the presence of HCO
3–, which denoted a close site of localization of the ATP-hydrolyzing center and cysteine residue (C313) in the M3 domain of the β3 subunit [
19]. However, it should be noted that a side chain of Cys313 faces inside the β-subunit and is buried between the TM domains of the surrounding residues making it difficult to access. Moreover, this amino residue is not a part of the channel and does not ensure its formation. Therefore, we can assume that NEM may cause not a direct, but an allosteric effect on the enzyme activity that does not consider cysteine residue as absolutely catalytic. Based on the data obtained, two possible molecular mechanisms for Zn
2+ potency can be suggested: (1) the reaction of sulfhydryl bonds in the receptor-channel protein with Zn
2+, and (2) the formation of inactive complexes between Zn
2+ and the ATPase (
Figure 5). Given that the ATP-hydrolyzing site is localized intracellularly and Cys313 is located in the transmembrane domain approximately in the middle of the membrane (
Figure 4G), it is more likely that not only cysteine, but also other amino acid residues that form at the active center are also involved in the zinc-induced inhibition of enzyme activity.
Intracellular neuronal zinc modulation is associated with a variety of physiological signaling pathways (including protein kinases and protein phosphatases) [
54,
55,
56]. Here, we expand on these data and demonstrate that, during brain maturation, Zn
2+ with various efficacies inhibited not only the passive GABA
AR-mediated responses, but also the ATPase compartment determined by β1 or β3 subunits. In addition, we established that the Cl
−ATPase form belongs to the β1 subunit, whereas the β3 subunit preferably possesses the Cl
−, HCO
3−ATPase activity. Overall, we describe a new a role for Zn
2+ in the inhibition of GABA
AR-coupled ATPase activity and present evidence of the existence of a new intracellular site responsible for its potency via binding with cysteine. In this context, given the current structural and kinetic data, identifying the molecular determinants underlying the extracellular regulation of GABA
AR function, intracellular Zn
2+ regulation can have physiological and pathophysiological implications [
57]. Indeed, GABAergic signaling is unique in that its polarity of action depends on [Cl
−]
i and [HCO
3−]
i [
2,
3], which are highly labile, leading not only to inhibitory, but also depolarizing/excitatory actions under certain conditions (for example, massive activation and spinal cord lesions, etc.) [
35,
57]. Moreover, altering [Cl
−]
i on the second scale through changing GABA
AR desensitization/resensitization may cause the collapse of the anion gradients and contribute to the induction of pathological conditions (e.g., seizures or epilepsy) modulated by Zn
2+ [
15,
58]. A mechanistic understanding of the interactions between Zn
2+ and the ATP-hydrolysis center within the receptor molecule may have clinical implications for the therapy of brain disorders by regulating the formation of an unstable, high-energy, phosphorylated intermediate and could pave the way for novel drug design.
4. Materials and Methods
4.1. Animals
Animal experiments were carried out using adult male Wistar rats purchased from the Institute of General Pathology and Pathophysiology vivarium and weighing 130–160 g at the time of arrival unless otherwise stated. Rats were always group-housed (5 per cage) and maintained in a temperature-controlled environment (23 ± 1) on a 12:12 h light-dark cycle and had access to food and water ad libitum. We performed all manipulations on animals in accordance with EU directive 2010/63/EU and according to the principles expressed in the Declaration of Helsinki revised by WMA, Fortaleza, Brazil, 2013, and the Rules of Good Laboratory Practice in the Russian Federation approved by Order N 199H (1 April 2016) of the Ministry of Health Care, under supervision of the Ethics Committee of the Institute of General Pathology and Pathophysiology (project approval protocol No 3 of 18 August 2021; the final approval protocol No 1 of 3 March 2022).
4.2. Synaptoneurosomes and Plasma Membrane Preparation
SNs were prepared from whole brains of wild-type from freshly dissected forebrains (cortex) (~200–400 mg wet weight) as previously described [
19]. Briefly, rats were quickly decapitated using a guillotine, brains were removed and placed in an ice-cold, balanced salt solution (BSS) containing 135 mM NaCl (sodium chloride, 1 mM KCl, 0.8 mM MgCl
2, 0.5 mM KH
2PO
4, 10 mM glucose, 0.1% bovine serum albumin (BSA), 10 mM Hepes-Tris (pH 7.3), and a protease inhibitor (A32955, Thermo Fisher Scientific, Waltham, MA, USA). The brain was cut into small pieces (2–3 mm) and manually homogenized (6 strokes) with a loosely fitting glass-Teflon homogenizer. The homogenate was passed through a nylon mesh (80 μm), and the filtrate was subsequently passed through a cellulose nitrate filter (8 μm) followed by centrifugation at 1000×
g for 15 min. The pellet was washed once in BSS and centrifuged. All the procedures were performed at 4 °C. Sodium chloride (7647-14-5), potassium chloride (7447-40-7), magnesium chloride (7786-30-3), potassium phosphate monobasic (7778-77-0), BSA (9048-46-8), and
d-(+)-Glucose (50-99-7) were obtained from Merck, Kenilworth, NJ, USA.
PMs were prepared from control HEK 293FT cells and various GABAAR variants were detached using Hanks’ balanced salt solution (Gibco, Waltham, MA, USA) without divalent cations (i.e., trypsin was not used), and the cells were centrifuged at 300× g for 3 min. The HEK 293FT cells or brain (mostly cortex) were homogenized in an ice-cold buffer containing 0.3 M sucrose, 0.5 mM EDTA-Tris, HEPES-Tris, 10 mM (pH 7.3), and protease inhibitor cocktail tablets (A32955, Thermo Fisher Scientific, Waltham, MA, USA), and centrifuged at 10,000× g for 15 min at 4 °C, after which the pellet was discarded. The supernatant was centrifuged for 1 h at 150,000× g and the resulting pellets were resuspended in 20 mM HEPES-Tris pH 7.3. This plasma membrane-enriched preparation was used for further measurements of the enzyme activity. Ethylenediaminetetraacetic acid (60-00-4), 4-(2-hydroxyethyl)-1-piperazineethane-sulfonic acid (HEPES), and Tris(hydroxymethylamino-methane (77-86-1) were obtained from Merck (Kenilworth, NJ, USA).
4.3. Cell Cultures and Transfection
For the expression homo- or heteromeric GABAAR ensembles, human embryonic kidney 293FT cells (American Type Culture Collection) were used. The cells were purchased from Invitrogen (Carlsbad, CA, USA) as part of the MembraneProTM Functional Protein Expression System (A11667), and the cell line identity was not further authenticated. The cells were grown and maintained in an incubator (Sanyo, Osaka, Japan) at 37 °C in a humidified atmosphere with 5% CO2, in DMEM media (41965-039, Gibco, Inchinnan, UK) supplemented with of 0.1 mM MEM NEAA (11140035, Gibco, Inchinnan, UK), 4 mM l-glutamine, 1 mM sodium pyruvate, 4.5 g/L d-glucose (15023021), and 10% FBS (10270-106, Gibco, Waltham, MA, USA) until the 20th passage, as suggested by the vendor. HEK 293FT cells were transfected by Lipofectamine TM 2000 or 3000 (Invitrogen, Thermo Fisher Scientific, Waltham, MA, USA and Lithuania) transfection reagents according to the manufacturer’s instructions. Cells were harvested and analyzed 24 h after transfection. For transfection procedures and virus-like particle (VLP) production, the same growth medium with decreased FBS content up to 4% was used according to the manufacturer’s recommendations. Geneticin G418 sulphate (11811031, Invitrogen, Waltham, MA, USA) was present in the growth medium at a concentration of 500 mg/mL constantly except during the transfection. The cells were subcultured at confluence by treatment with 0.05% trypsin and 0.02% EDTA in PBS. For selection purposes and improving the yield of VLPs, the transfection medium was removed after 24 h and a fresh growth medium with 10 µg/mL blasticidin (R21001 Gibco, Waltham, MA, USA) was added. Transfected cells and VLPs were collected and analyzed 24–48 h after transfection.
4.4. Molecular Biology
The genes encoding the full-length rat GABAAR β1, β2 or β3 subunits were amplified by PCR from the cDNA library (Evrogen, Moscow, Russia) using gene-specific primers with Kozak sequence at the 5′ end of the forward primer based on “GenBank:NM_012956.1”, “GenBank:NM_012957.2” “GenBank:NM_017065.1” sequences. The PCR products were cloned into the pEF6/V5-His TOPO TA vector (K961020, Invitrogen, Waltham, MA, USA) separately and verified by DNA sequencing. Each vector was amplified using E. coli TOP10 strain in LB medium supplemented with 20 µg/mL ampicillin. Isolation and purification of plasmids were performed with PureYieldTM Plasmid Miniprep System (Promega, Madison, WI, USA) and Plasmid Midiprep 2.0 (Evrogen, Moscow, Russia). The sterilization of plasmids was implemented via 0.22-µm filtration. The concentration of plasmids was evaluated on spectrophotometer NanoDrop 1000 (Thermo Fisher Scientific, Waltham, MA, USA). The quality validation of cloning and growth was performed additionally through enzymatic restriction by XbaI and BamHI in BamHI buffer (Thermo Fisher Scientific, Waltham, MA, USA), and the following electrophoresis in 1% agarose gel.
The typical transfection procedure of GABAAR subunit-containing constructs for the subsequent biochemical, spectrofluorometric, and Western blot analyses was as follows. Approximately 5 × 10⁵ HEK293FT cells were suspended in 8 mL DMEM, plated into a 90-mm culture dish, and maintained 24 h approximately until 50–90% confluence. Then, 5 μg of plasmid DNA (β3 alone) was added combined with Lipofectamine® 3000 Reagent (Invitrogen, Thermo Fisher Scientific, Waltham, MA, USA) in Opti-MEM® I (1×) + GlutaMAXTM-I medium (51985-026, Gibco, Inchinnan, UK) accordingly the manufacturers’ recommendations. For microscopy, the cells were plated in 35 mm dishes and were incubated with a proportional amount of reagents and vectors.
For VLP production, GABAAR subunit-containing constructs were transfected together with Membrane Pro TM Reagent (Invitrogen, Waltham, MA, USA) amenably. Transfected HEK293FT started to bud off VLPs from the cell membrane approximately 24 h after transfection. The harvesting procedure was executed in conformity with manufacturer’s recommendations. Briefly, the VLP-containing medium was mixed with Membrane ProTM Precipitation Mix in the ratio of 5 to 1, where 5 refers to the medium. Then, the mix was incubated at 4 °C overnight. After incubation, VLPs were pelleted by centrifugation at 5500× g for 30 min and resuspended in HEPES buffer for subsequent analysis or stored at −80 °C.
4.5. Cl− and HCO3−-Transport Monitoring
Cl−-sensitive fluorescent dye MQAE (N-(Ethoxycarbonyl-methyl)-6-Methoxyquinolinium Bromide) or pH-sensitive fluorescent dye BCECF, AM (2′,7′-Bis-(2-Carboxyethyl)-5-(and-6)-Carboxyfluorescein, Acetoxy methyl Ester) were obtained from Thermo Fisher Scientific, USA (E3101) or B1170, respectively. A stock solution was prepared in H2O, aliquoted, and stored in the freezer (−20 °C) protected from light. For cases in which fluorescence measurements were conducted, the HEK 293FT cells or SNs with loaded dye were stored in an opaque test tube at RT or 4 °C. Sodium bicarbonate (144-55-8), γ-aminobutyric acid, GABA (56-12-2), ouabain, bicuculline (485-49-4) and zinc chloride (7646-85-7) were obtained from Sigma-Aldrich (St. Louis, MI, USA), and bumetanide (28395-03-1) were obtained from Merck (Kenilworth, NJ, USA). SNs were loaded dye (MQAE or BCECF) in BSS for 1 h at 37 °C and stored in an opaque test tube at RT or 4 °C. For that, the control HEK 293FT cells and various GABAAR β3 isoforms cells were trypsinized by adding 0.05% trypsin-EDTA solution (25200056, Gibco BRL, Waltham, MA, USA), washed PBS twice, resuspended in the BSB, and then loaded with MQAE for 1 h at 37 °C. After loading, the suspension was centrifuged at 200× g for 5 min at RT and kept in the aforementioned medium at RT in the opaque test tubes. For analysis, the pellet was resuspended in the BSB. Monitoring was performed with cells continuously superfused with incubation medium composed of (mM):135 NaCl (or 135 NaCl and 25 NaHCO3), 0.5 KH2PO4, 0.8 MgCl2, and 5 mM Hepes (pH 7.4). Dye-loaded cells (SNS or HEK 293FT) were equilibrated in the test tube in the incubation medium V = 200 µL) in the absence or presence of compounds (ZnCl2, Na3VO4, NEM, bicuculline, or ouabain) for about 10 min at 37 °C before initial fluorescence measurements, and then 150 μL of the suspension was added into quartz microcuvette (non-flow cell) and stirred. The GABA-mediated Cl− or HCO3− transport was initiated directly by addition of GABA in final concentration of 1–100 µM in the cuvette by an in-house solution supply system. GABAAR-mediated Cl—or HCO3—transport was assessed by the dynamic measurements of the variations in the fluorescence intensity of Cl—sensitive fluorescent dye MQAE-loaded or BCECF-loaded HEK 293FT cells or SNs using a FluoroMax®-4 spectrofluorometer (HORIBA Scientific Edison, Piscataway, NJ, USA), respectively. The excitation and emission wavelengths were 350 nm and 480 nm for the measurement of Cl−-transport or 490 nm and 535 nm for measurement of HCO3−-transport, respectively. The ΔF/F of each trial was calculated as (F − F0)/F0, where F0 is the baseline fluorescence signal averaged over a 10 s period (this was the control measurement) immediately before the start of the application of GABA and supplement compounds. The value of 100% was obtained as the fluorescence intensity before the application of GABA, in the absence or presence of test compounds. The maximum amplitude of GABA-mediated fluorescence responses was calculated as the maximal difference in fluorescence intensity in the absence or presence of an agonist.
4.6. ATPase Activity Monitoring
The ATPase activity in PMs of neurons or HEK 293FT cells expressing the various constructs were measured as previously described [
20]. PMs (~7 µg) or VLPs (~14 µg) were added into glass tube to 0.5 mL of an incubation medium containing 20 mM HEPES-Tris pH 7.3, 5 mM NaCl/25 mM NaHCO
3 (or 25 mM NaCl), 0.5 mM ouabain and 40 mM NaNO
3 (neutral salt) to measure enzyme activity. The PMs or VLPs were preincubated at 37 °C for ~20 min with the relevant compounds (NEM (0.1–400 µM); Zn
2+(0.001–100 µM); DTT (2 mM); bicuculline (40 μM)) in the incubation medium. Preparation of the test tube with bicarbonate—NaHCO
3 (1 mM)—was previously dissolved in HEPES (20 mM) and then added in the 20 mM HEPES-Tris buffer (pH 6.7). After preincubation, the enzyme reaction was started by addition of Mg
2+-ATP 2 mM (final concentration) in the incubation medium.
After 15–20 min of incubation, the ATPase activity was stopped by the addition of reagents for measuring of inorganic phosphorus (P
i). The Cl
−- and Cl
−, HCO
3−ATPase activities were determined as a difference in formation of P
i in the absence and in the presence of NaCl (2–60 mM) or NaHCO
3 (2.5–25 mM) in the incubation medium, respectively. Adenosine 5′-triphosphate (ATP) disodium salt hydrate (34369-07-8) and adenosine 5′-triphosphate disodium salt hydrate (A26209) were obtained from Merck (Kenilworth, NJ, USA). The concentration of P
i in the incubation medium was measured by a modified method of Chen et al., (1956) [
19] using a Cary 60 UV–vis spectrophotometer (Agilent, Santa Clara, CA, USA) at wavelength of 650 nm. The γ-phosphate analog, orthovanadate (VO
43−) (Sigma-Aldrich, St. Louis, MI, USA), was obtained by boiling the vanadate solution (pH 10; 10 min), and freshly boiled stock was diluted to the final concentration (pH 7.3) prior to use.
4.7. Western Blot
VLPs of transfected HEK 293FT cells were subjected to SDS-PAGE using the SDS-PAGE reagent starter kit (1615100 Bio-Rad, Hercules, CA, USA) and to Western blot analysis using the Pierce™ fast Western blot kit (35055 Thermo Scientific, Waltham, MA, USA), ECL Plus Western Blotting Detection System Substrate (GE Healthcare, Chicago, IL, USA). Samples were SDS-treated by boiling for 5 min in a buffer consisting of 62.5 mM Tris, 10% glycerol, 5% 2-mercaptoethanol, 4% SDS, and 0.001% bromophenol blue, and then ~20 µg of total protein was loaded into SDS-PAGE. Electrophoresis parameters were: 70 V for 10 min on 4% SDS-PAGE stacking gel and 120 V for 50 min on 12.5% SDS-PAGE resolving gel. Proteins were transferred on PVDF membrane by the semi-dry method using 0.09 A/cm2 for 1 h. After that, membranes were incubated for 1 h in blocking solution containing 5% milk, and then incubated at 4 °C overnight with primary Anti-GABRB1 Monoclonal Antibody (S96-55) (Catalog # MA5-27699, TermoFisher Scientific, Waltham, MA, USA), Anti-GABRB2 Recombinant Rabbit Monoclonal Antibody (ARC0631) or GABRB3 antibody [N87/25] (ab98968, Abcam, Cambridge, UK), diluted 1:1000 with the blocking solution. After incubation, the membranes were washed with TBS-T 4 times for 15 min each, and then incubated at RT for 1 h with secondary HRP-conjugated antibodies (62–6520 Thermo Fisher Scientific, Waltham, MA, USA) diluted 1:5000 with the blocking solution. Then, the membrane was washed with TBS-T four times and the GE Healthcare ECL Plus Western Blotting Detection System (AmershamTM, GE Healthcare, UK) was applied according to manufacturer’s instructions. The visualization of the bands was performed using a Kodak Image Station 440 (Rochester, NY, USA).
4.8. Statistical Analysis
The data are expressed as the mean ± SEM, and differences were considered significant for p < 0.05. Statistical differences were determined by two-tailed Student’s unpaired t-test for data with equal variances and which were assessed as normally distributed with the Shapiro–Wilk test. Graphs and statistical analysis were obtained by using GraphPad Prism 9.3 (GraphPad Software, San Diego, CA, USA).
Representative images of MQAE and BCECF fluorescence changes in synaptoneurosomes VLPs were analyzed and assessed using Origin Pro version 9.1 for Windows (OriginLab, Northampton, MA, USA). The mean fluorescence intensity from each treatment group was separately compared to the mean fluorescence intensity of the untreated control group.


