
Physiological Role of ATPase for GABAA Receptor Resensitization
by
Sergey A. Menzikov
1,*, 
Danila M. Zaichenko
1,
Aleksey A. Moskovtsev
1,2,
Sergey G. Morozov
1 and
Aslan A. Kubatiev
1,2 1
Institute of General Pathology and Pathophysiology, Russian Academy of Sciences, 8, Baltiyskaya St., 125315 Moscow, Russia
2
Russian Medical Academy of Postdoctoral Education, Federal State Budgetary Educational Institution of Further Professional Education of the Ministry of Healthcare of the Russian Federation, 2/1, Barrykadnaya St., 125993 Moscow, Russia
*
Author to whom correspondence should be addressed.
Int. J. Mol. Sci. 2022, 23(10), 5320; https://doi.org/10.3390/ijms23105320
Submission received: 11 April 2022
/
Revised: 3 May 2022
/
Accepted: 7 May 2022
/
Published: 10 May 2022
(This article belongs to the Special Issue Ion Channels: Intersection of Structure, Function and Pharmacology)
Abstract
:γ-Aminobutyric acid type A receptors (GABAARs) mediate primarily inhibitory synaptic transmission in the central nervous system. Following fast-paced activation, which provides the selective flow of mainly chloride (Cl−) and less bicarbonate (HCO3−) ions via the pore, these receptors undergo desensitization that is paradoxically prevented by the process of their recovery, referred to as resensitization. To clarify the mechanism of resensitization, we used the cortical synaptoneurosomes from the rat brain and HEK 293FT cells. Here, we describe the effect of γ-phosphate analogues (γPAs) that mimic various states of ATP hydrolysis on GABAAR-mediated Cl− and HCO3− fluxes in response to the first and repeated application of the agonist. We found that depending on the presence of bicarbonate, opened and desensitized states of the wild or chimeric GABAARs had different sensitivities to γPAs. This study presents the evidence that recovery of neuronal Cl− and HCO3− concentrations after desensitization is accompanied by a change in the intracellular ATP concentration via ATPase performance. The transition between the desensitization and resensitization states was linked to changes in both conformation and phosphorylation. In addition, the chimeric β3 isoform did not exhibit the desensitization of the GABAAR-mediated Cl− influx but only the resensitization. These observations lend a new physiological significance to the β3 subunit in the manifestation of GABAAR resensitization.
Keywords:
rat; cortical synaptoneurosomes; GABAAR; chloride; bicarbonate; desensitization; resensitization; ATPase; β3 subunit; transport1. Introduction
As members of the pentameric ligand-gated ion channels family (pLGIC), γ-Aminobutyric acid type A receptors (GABAARs) are mainly involved in inhibition but also in excitation of the central nervous system of vertebrates under certain circumstances [1,2]. Upon mediator binding, GABAARs quickly open their transmembrane pore to enable the passive flow of chloride (Cl−) and less bicarbonate (HCO3−) ions via the plasma membrane. However, following activation, GABAARs undergo desensitization, which involves inchmeal entry into the long-lived closed state refractory to excessive activation [3,4,5,6]. Although the causes and the roles of receptor desensitization continue to be debated, they potentially include the reduction in responses during high-frequency neurotransmitter release and the prolongation of synaptic currents [7,8]. In addition, the GABAAR desensitization is extremely related to the slowdown of their deactivation, called resensitization [9,10]. The linkage between desensitization and resensitization of GABAAR-mediated currents is demonstrated in a response to a prolongation [2,5] or reapplication of GABA [3,11]. However, despite the critical importance of GABAAR resensitization in maintaining their responsiveness to subsequent activation, it is unclear which molecular events trigger this long-term receptor alteration.
The regulation of desensitization and resensitization of GABAARs is an important mechanism controlled at the receptor level and within the signaling pathway, but regulation of the receptors assumes great significance in understanding the withdrawal of neurological disorders [5]. In addition, the regulation of GABAAR neurotransmission plays an exceptional role in psychiatric disabilities and addiction [12,13]. Many studies of desensitization have focused on changes to the receptor following massive activation with agonists or allosteric ligands that affect the occupancy of this state during synaptic inhibition [9,14]. Such changes can include phosphorylation of subunits by kinases [5], expression, clustering [15], and receptor pharmacology [16]. Additionally, some structural works have shown that the differences between the agonist-bound open (conducting) state and desensitization (hindering) state are conformational changes occurring at the “internal face” of the receptor. Recent functional and structural studies provide compelling evidence for a “dual-gate” model, in which the transmembrane domain (TMD) of pLGICs contains both an activation gate, located in the upper half of the channel, and a de-gate, at the intracellular end of the channel [17,18].
Preliminary studies have shown that the GABAAR-mediated current is significantly elevated by inhibitors of phosphatases [19,20] or non-hydrolysable ATP analogues [21], indicating the involvement of the processes of phosphorylation and dephosphorylation in regulating GABAAR functional activity [22]. It has also been demonstrated during intensive agonist action that the diminution in intracellular adenosine triphosphate concentration ([ATP]i) is the main reason underpinning the functional rundown of GABAAR function, eventually paving the way for neuronal excitation [23,24,25,26]. However, the molecular determinants that provide the ATP depletion within the GABAAR rundown phenomenon remain poorly understood. Recently, we reported that the GABAAR β3 subunit possesses Cl− and HCO3− ATPase activity, which provides the anion homeostasis and is involved in neurological disorders [27,28]. Given that such an ATPase is specifically regulated by GABAergic agonists or antagonists [27] and the ATP-hydrolyzing center is localized at the intracellular side of the channel [29], we set out to test the hypothesis about its participation in the processes of the desensitization and resensitization. Specifically, our focus was on γ-phosphate-modified ATP analogues (γPAs) that are often used to mimic various important states of ATP hydrolysis: non-hydrolysable ATP analogue adenylyl-imidodiphosphate (AMP-PNP)—the pre-hydrolytic state, and vanadate (VO43−) and fluoride metal (AlFx)—the transition state [30]. We found that activation (open) and desensitization states of GABAAR-mediated Cl− and HCO3− flows in the synaptoneurosomes (SNs) of the cortical neurons of the rat brain were different in terms of the sensitivity to γPAs. The transition between the desensitization and resensitization states was correlated with the changing intracellular concentration of ATP ([ATP]i) determined by HCO3−. The β3 subunit was established as being essential for the process of GABAAR resensitization by ATPase performance. By using the thiol-modifying agent n-ethylmaleimide (NEM), we provided evidence of differences in the conformational properties of activation and desensitization states of GABAARs. The important role of conformational rearrangements and the resulting changes in the processes of phosphorylation and dephosphorylation was confirmed by using a mutant receptor that substantially alters the receptor’s ability to access the transition from a desensitized state to a resensitized state.
2. Results
2.1. Reapplication of GABA Causes Desensitization of GABAAR-Mediated Cl− Influx
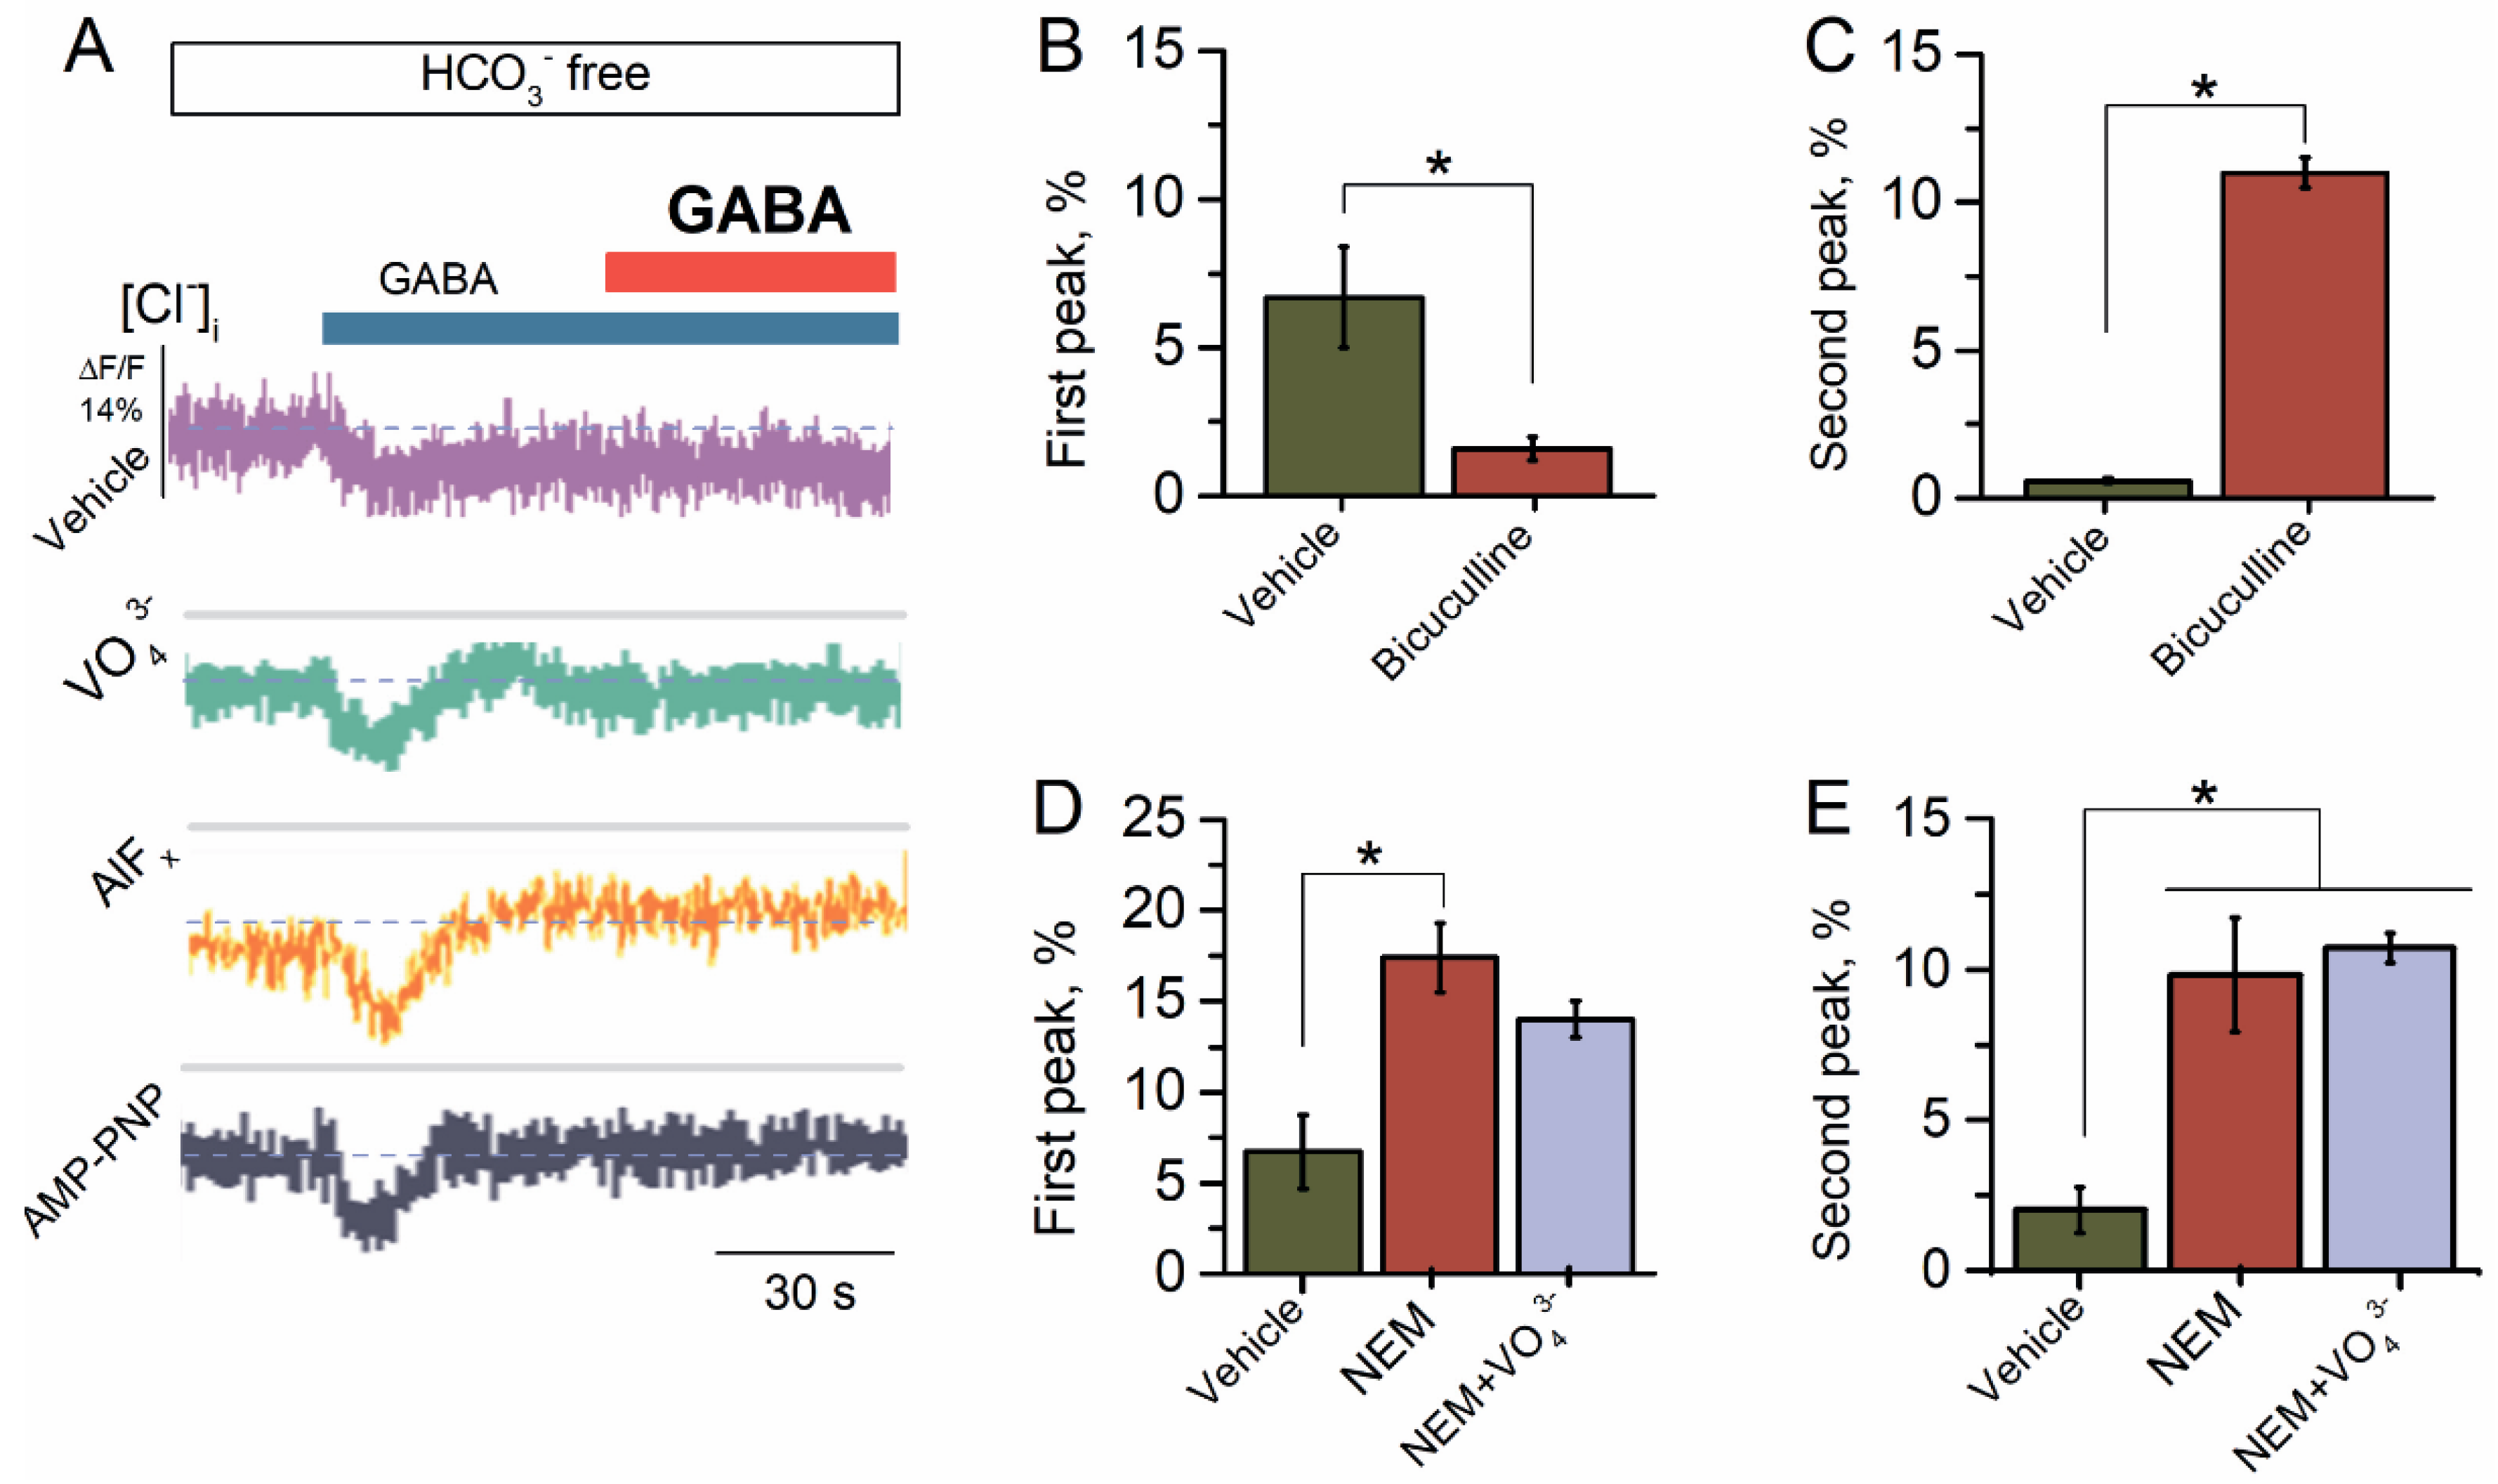
The preliminary studies have shown that the GABAARs of the SNs provide the Cl− influx via plasma membranes [31,32,33]. Earlier, we showed that GABA (1–100 μM) increased the ATPase activity of the ternary (α2β3γ2) GABAAR subtype with maximum effect at 100 μM [27]. To explore the GABAAR-mediated Cl− influx, the SNs initially were loaded with dye for Cl− (MQAE) and then exposed to 10, 50, or 100 μM of GABA. The SNs in the HCO3−-free medium showed a Cl− influx in response to the application of GABA with a maximum peak of fluorescence changes of 2.6 ± 0.3%, 4.4 ± 0.3%, or 6.7 ± 0.2%, respectively. Therefore, as illustrated in Figure 1A, we used GABA at a concentration of 100 μM. Some studies have shown that the repetitive application of the same agonist concentration can induce the desensitization of the GABA-evoked Cl− current [11]. We applied second applications of the agonist to assess the nature of agonist-dependent desensitization and resensitization of GABAAR. However, reapplication of GABA (100 μM) revealed apparent desensitization of the GABAAR-mediated Cl− influx that is similar to literature data. Specifically, the studies showed that in rat central neurons, the GABAAR-mediated Cl− current leads to substantial desensitization with the repetitive application of GABA [11].
In exploring and establishing the role of the ATP-hydrolyzing system in the desensitization and resensitization, we studied the effect of VO43− (20 μM), AlFx (20 μM), or AMP-PNP (2 mM) on the GABAAR-mediated Cl− influx. All test γ-PAs caused an increase in the GABA-mediated Cl− influx into neurons by approximately two times at first and had no effect on the second application of the mediator (Figure 1A). Bicuculline completely suppressed the first peak of the GABA-mediated fluorescence changes, indicating the receptor-dependent method of mediator action (Figure 1B). By contrast, at the second application of the mediator, bicuculline significantly activated the Cl− influx in the SNs with a maximum peak of fluorescence changes of 11.0 ± 0.5% (n = 5) (Figure 1C).
It has been shown that synaptic sulfhydryl groups of ionic channels and transporters are targets for electrophiles [34,35]. Specifically, NEM has been used as an agent to regulate the cation–chloride cotransporter (CCC) function by modulating their phosphorylation [35]. In addition, NEM (300 μM) causes an increase in the frequency of the GABAAR-mediated postsynaptic currents [36,37] and eliminates the depolarization- or post-burst-induced suppression of GABAAR-mediated inhibition in CA1 pyramidal cells [38,39]. Here, NEM (300 μM) activated both at first and at the reapplication of GABA with a maximum peak of fluorescence changes of 17.4 ± 1.9% (n = 5) and 9.8 ± 1.9% (n = 5), respectively (Figure 1D,E). NEM effect did not change significantly amid the presence of VO43− (20 μM) in the first case and reapplication of the agonist (Figure 1D,E).
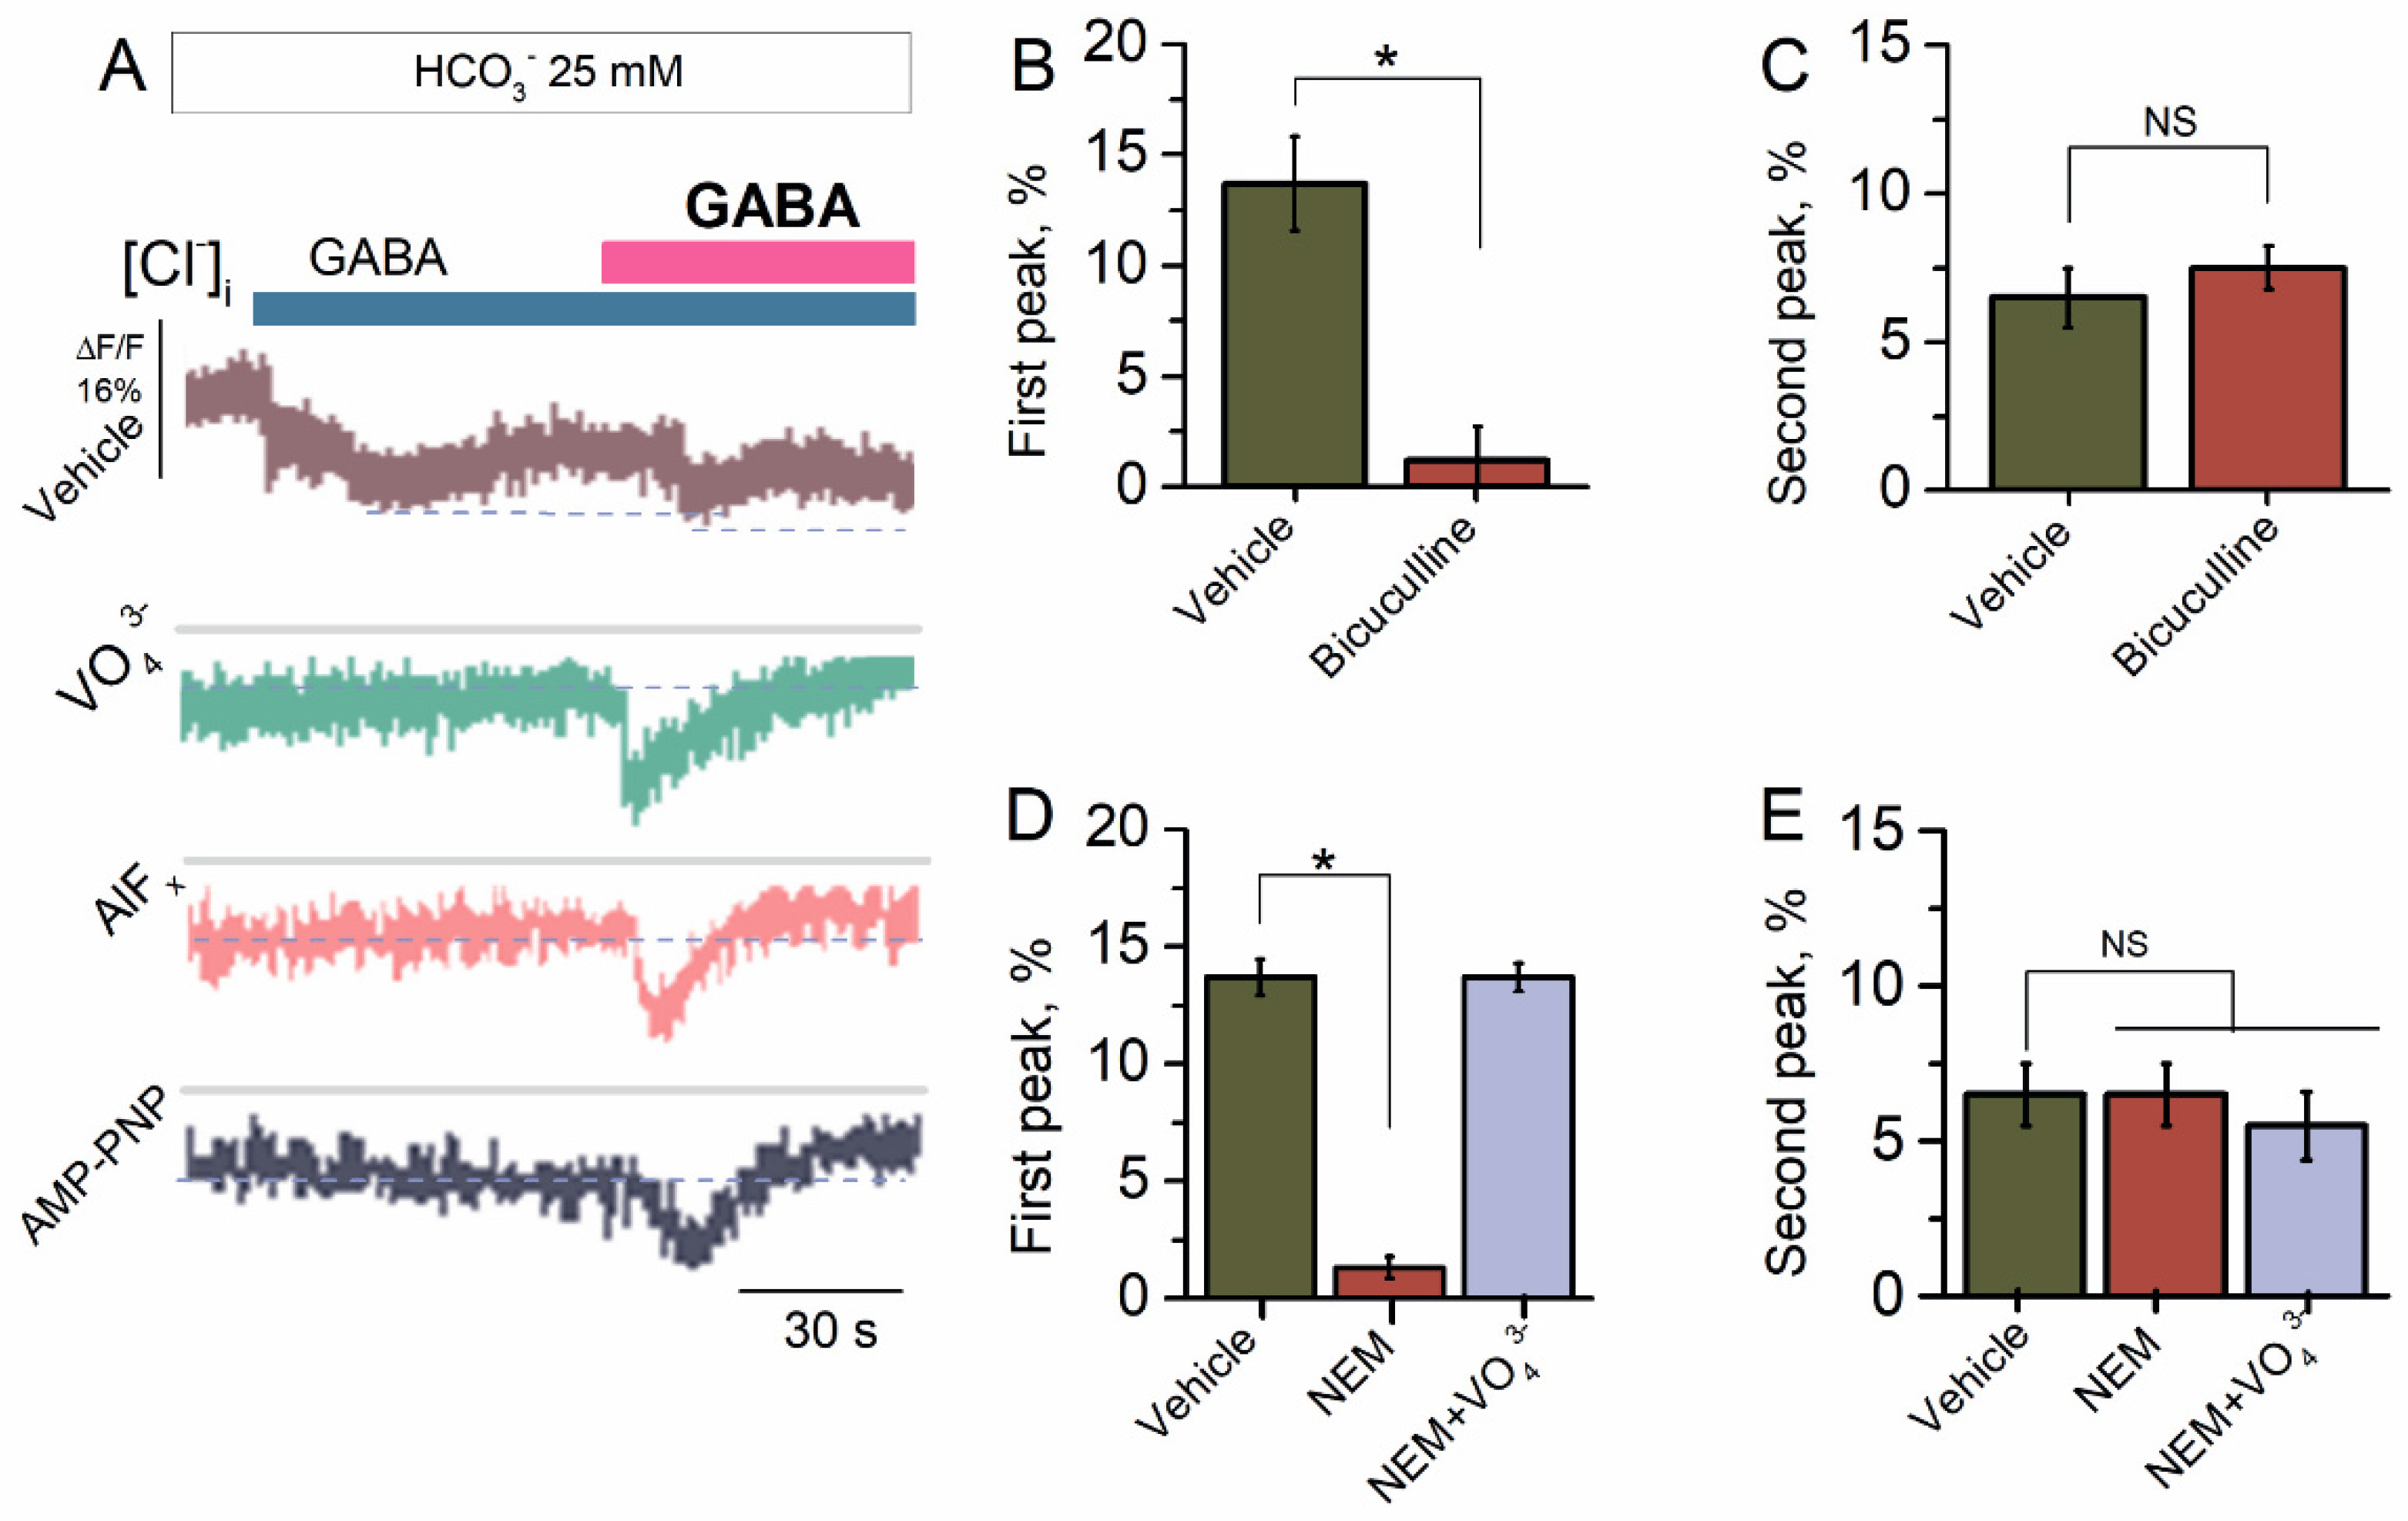
2.2. Bicarbonate Determines a Transition from Desensitization to Resensitization State of GABAAR-Mediated Cl− Influx
The preliminary studies have shown that HCO3− increased the GABAAR-mediated Cl− influx in the neurons [40]. In our study, the SNs in the presence of HCO3− (25 mM) showed increased Cl− influx in response to the first application of GABA (100 μM) with a maximum peak of fluorescence changes of 13.7 ± 2.1% (n = 5) (Figure 2A). Reapplication of GABA (100 μM) revealed a decrease in the GABAAR-mediated Cl− influx by two times with a maximum peak of fluorescence changes of 6.5 ± 1.0% (n = 5). Previously, it was shown that the effect of ATP and γPAs on GABAAR-mediated Cl− transport in the neurons depends on the presence of HCO3− in the experimental medium [22,23,24]. To probe whether the HCO3− can regulate the GABAAR function, we studied the effect of γPAs on the GABAAR-mediated Cl− influx in the presence of a physiological concentration of HCO3− (25 mM) (Figure 2A). Here, γPAs eliminated the GABA-mediated Cl− influx into neurons at the first application and activated it approximately two times on reapplication of the agonist (Figure 2A). Bicuculline completely suppressed the first peak of the GABA-mediated fluorescence changes, confirming the receptor-dependent method of mediator action (Figure 2B). In contrast, at reapplication of the mediator, bicuculline had no significant influence (7.5 ± 0.8%, n = 6) on the Cl− influx in the SNs (Figure 2C). Similar to bicuculline’s effect, NEM (300 μM) inhibited (1.3 ± 1.2%, n = 6) on the first application and had no effect (6.5 ± 1.0%, n = 6) on repeated application of GABA (Figure 2D). Meanwhile, in the presence of VO43− (20 μM) in the experimental medium, the NEM effect was eliminated in the first case (Figure 2D) and unchanged at reapplication of GABA (Figure 2E).
2.3. ATP-Dependent Recovery of GABAAR-Mediated pHi Changes
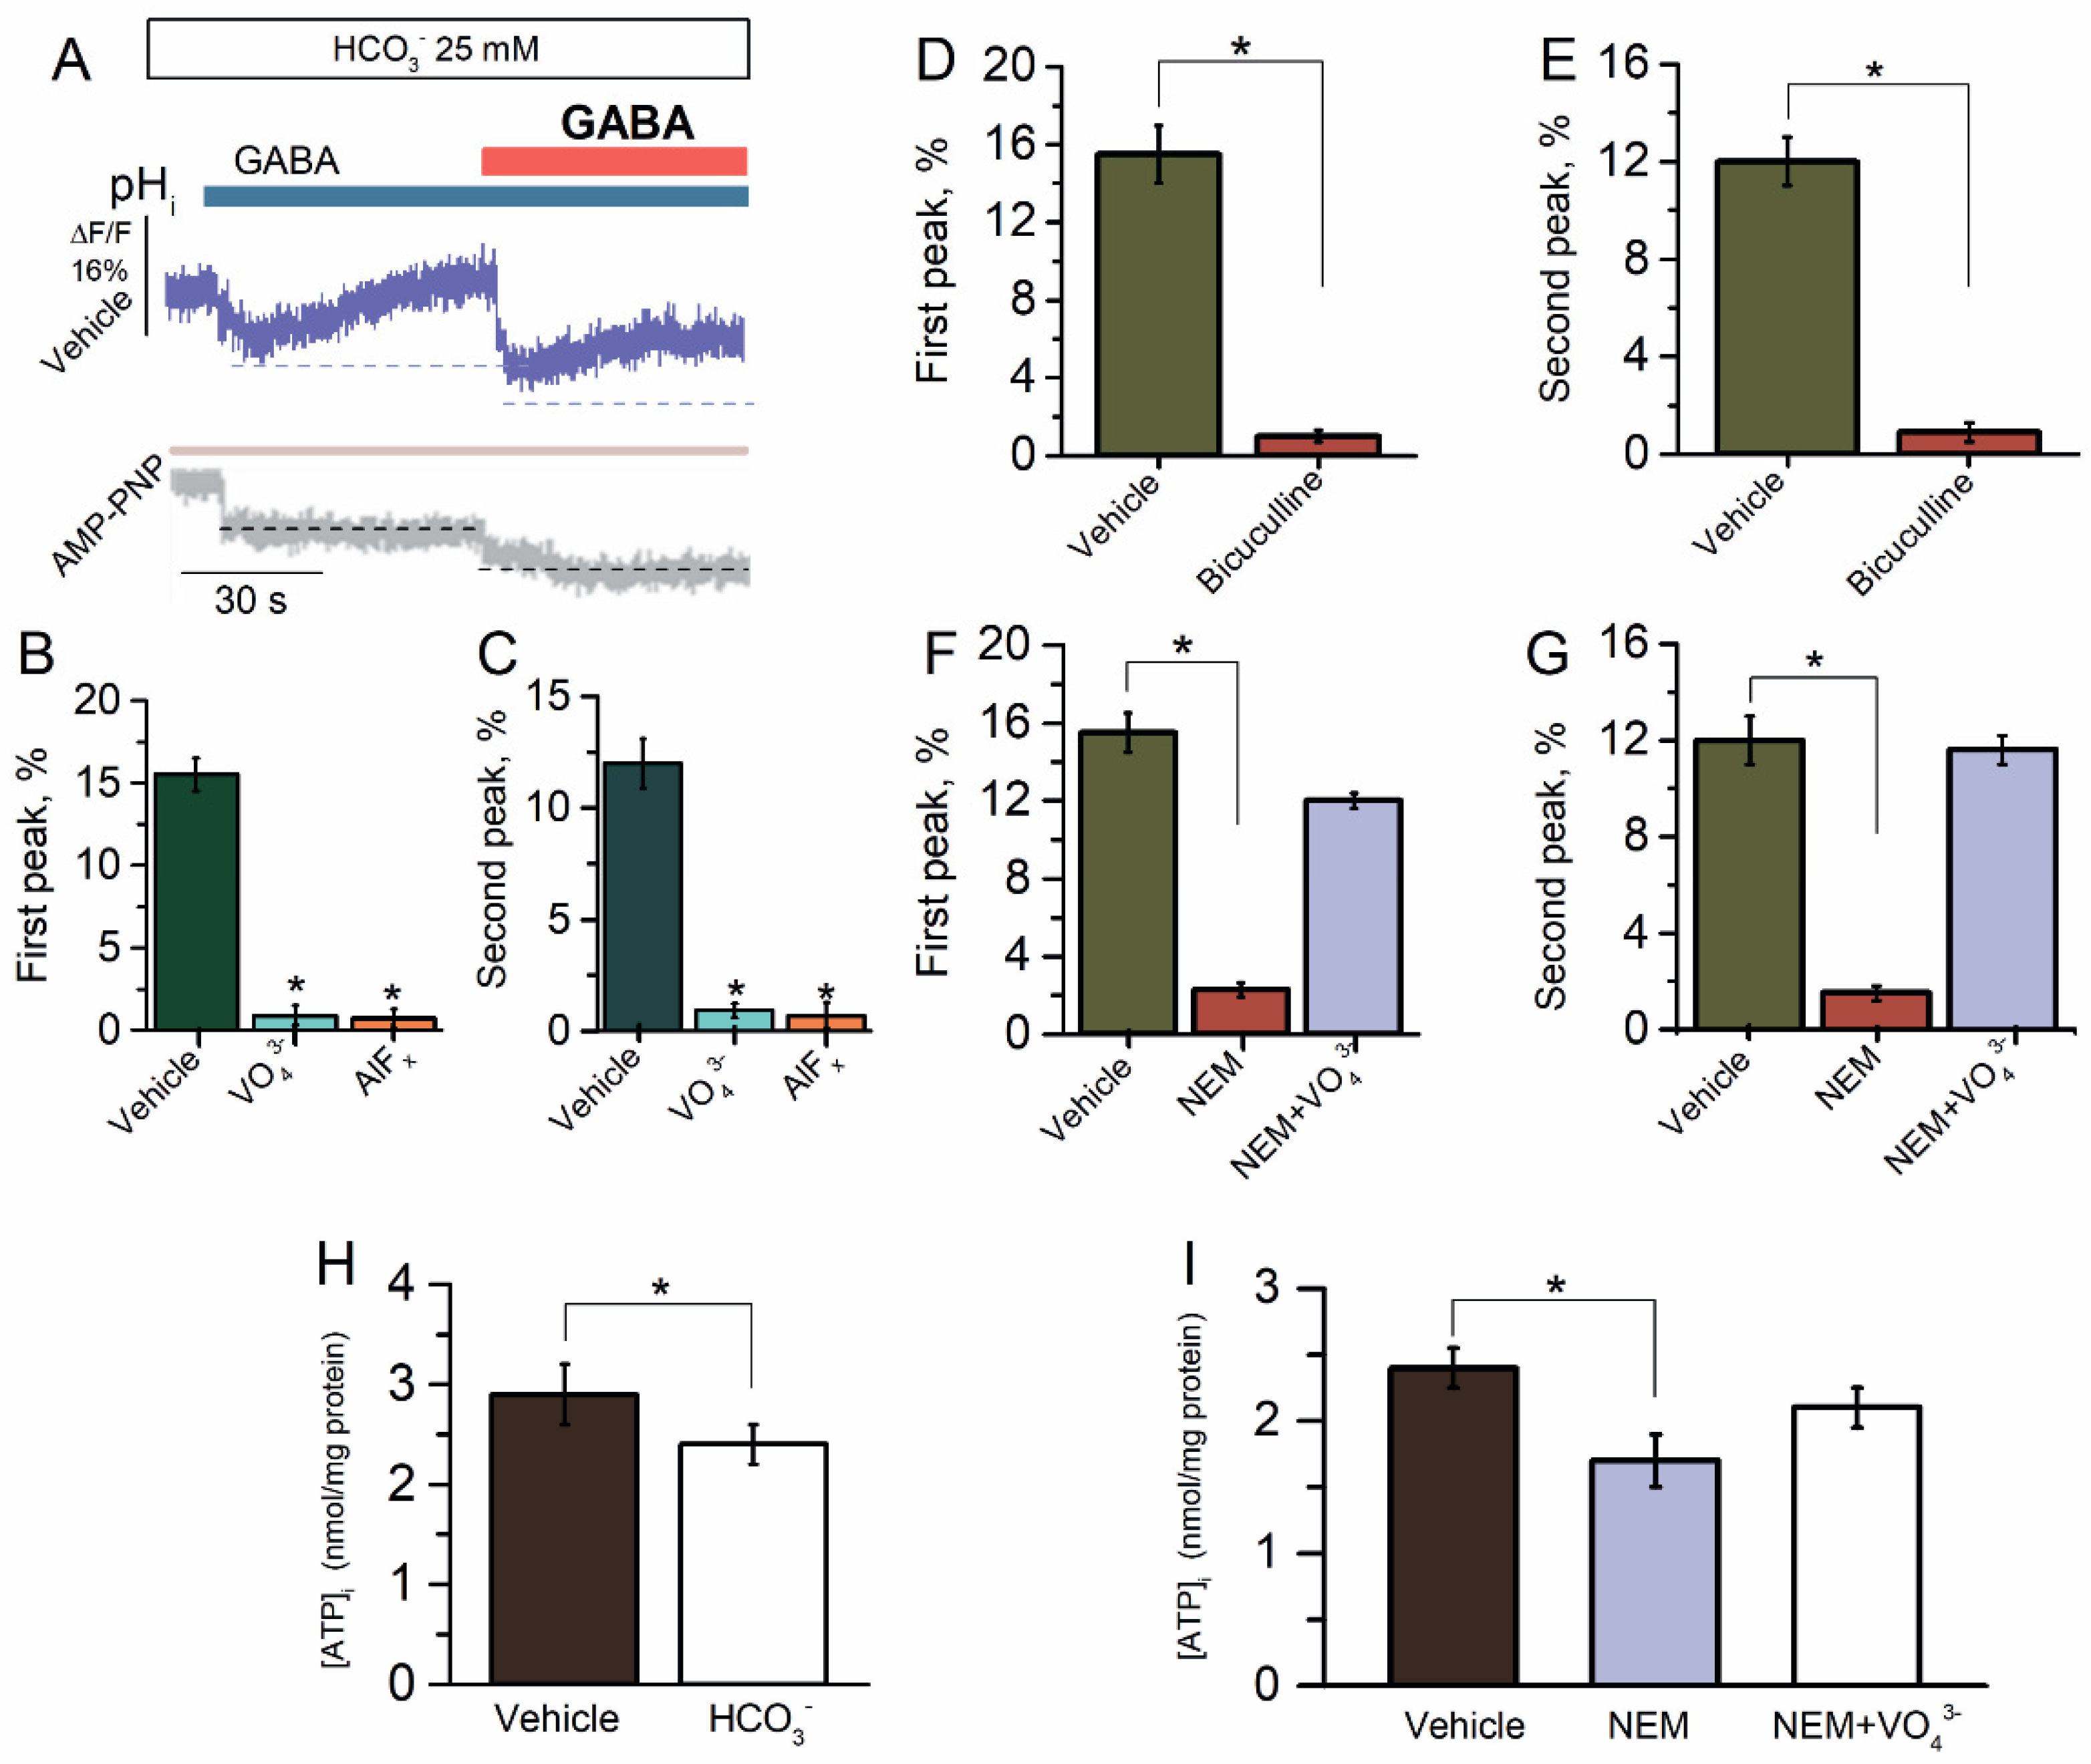
The rat hippocampal pyramidal neurons show an instantaneous net influx of Cl− and efflux of HCO3− in response to GABA (500 μM) application with a subsequent steady-state decrease in intracellular pH (pHi) of 0.2 to 0.5 [41,42]. To explore the GABAAR-mediated HCO3− outflux, the SNs initially were loaded with dye for pHi (BCECF) before being exposed to GABA (100 μM). Since at reapplication of the same concentration of GABA (100 μM) [43,44], the GABAARs are permeable to HCO3−, we studied the change in the pHi in the SNs after the first and repeated application of GABA (100 μM) in the presence of HCO3− (25 mM). Here, similar results were observed, where SNs quickly demonstrated a pHi decrease for both the first and repetitive application of the agonist with a maximum peak of fluorescence changes of 15.5 ± 1.5% (n = 6) and 12.0 ± 1.0% (n = 6), respectively (Figure 3B,C). These data showed the absence of desensitization and only appeared in the process of resensitization. To further elucidate the cause of pHi changes by GABA application, we added bicuculline to the experimental medium. Bicuculline (50 μM) inhibited the GABA-mediated HCO3− outflux to first and repeated application of the agonist (Figure 3D,E). We added the γPAs in the experimental medium to assess the role of ATPase in the recovery of GABAAR-mediated HCO3− outflux. All γPAs eliminated the GABA-mediated pHi changes in the first and repeated application of the agonist (Figure 3A–C).
When exposed to NEM (300 μM), the GABA-mediated pHi changes were significantly eliminated for both the first and repeat application of GABA (Figure 3F,G). However, the NEM effect did not appear in the presence of VO43− (20 μM), thus indicating the energy-dependent method of action (Figure 3F,G). These data suggest that NEM and HCO3− have similar binding sites that are close to the ATP-hydrolyzing center. In order to ascertain this hypothesis, we examined the influence of HCO3− and NEM on [ATP]i. In the control samples, the concentration of [ATP]i was 3.0 nmol/mg protein and the addition of HCO3− (25 mM) induced a decrease in [ATP]i by 29.2 ± 1.0% (n = 6) (Figure 3H). Moreover, as shown in Figure 3I, the addition of NEM in the experience medium also resulted in a decline in [ATP]i by 37.6 ± 1.2% (n = 5). However, the influence of NEM on [ATP]i did not appear in the presence of VO43− (20 μM).
2.4. β3 Subunit Is Responsible for GABAAR Resensitization in HEK 293FT Cells
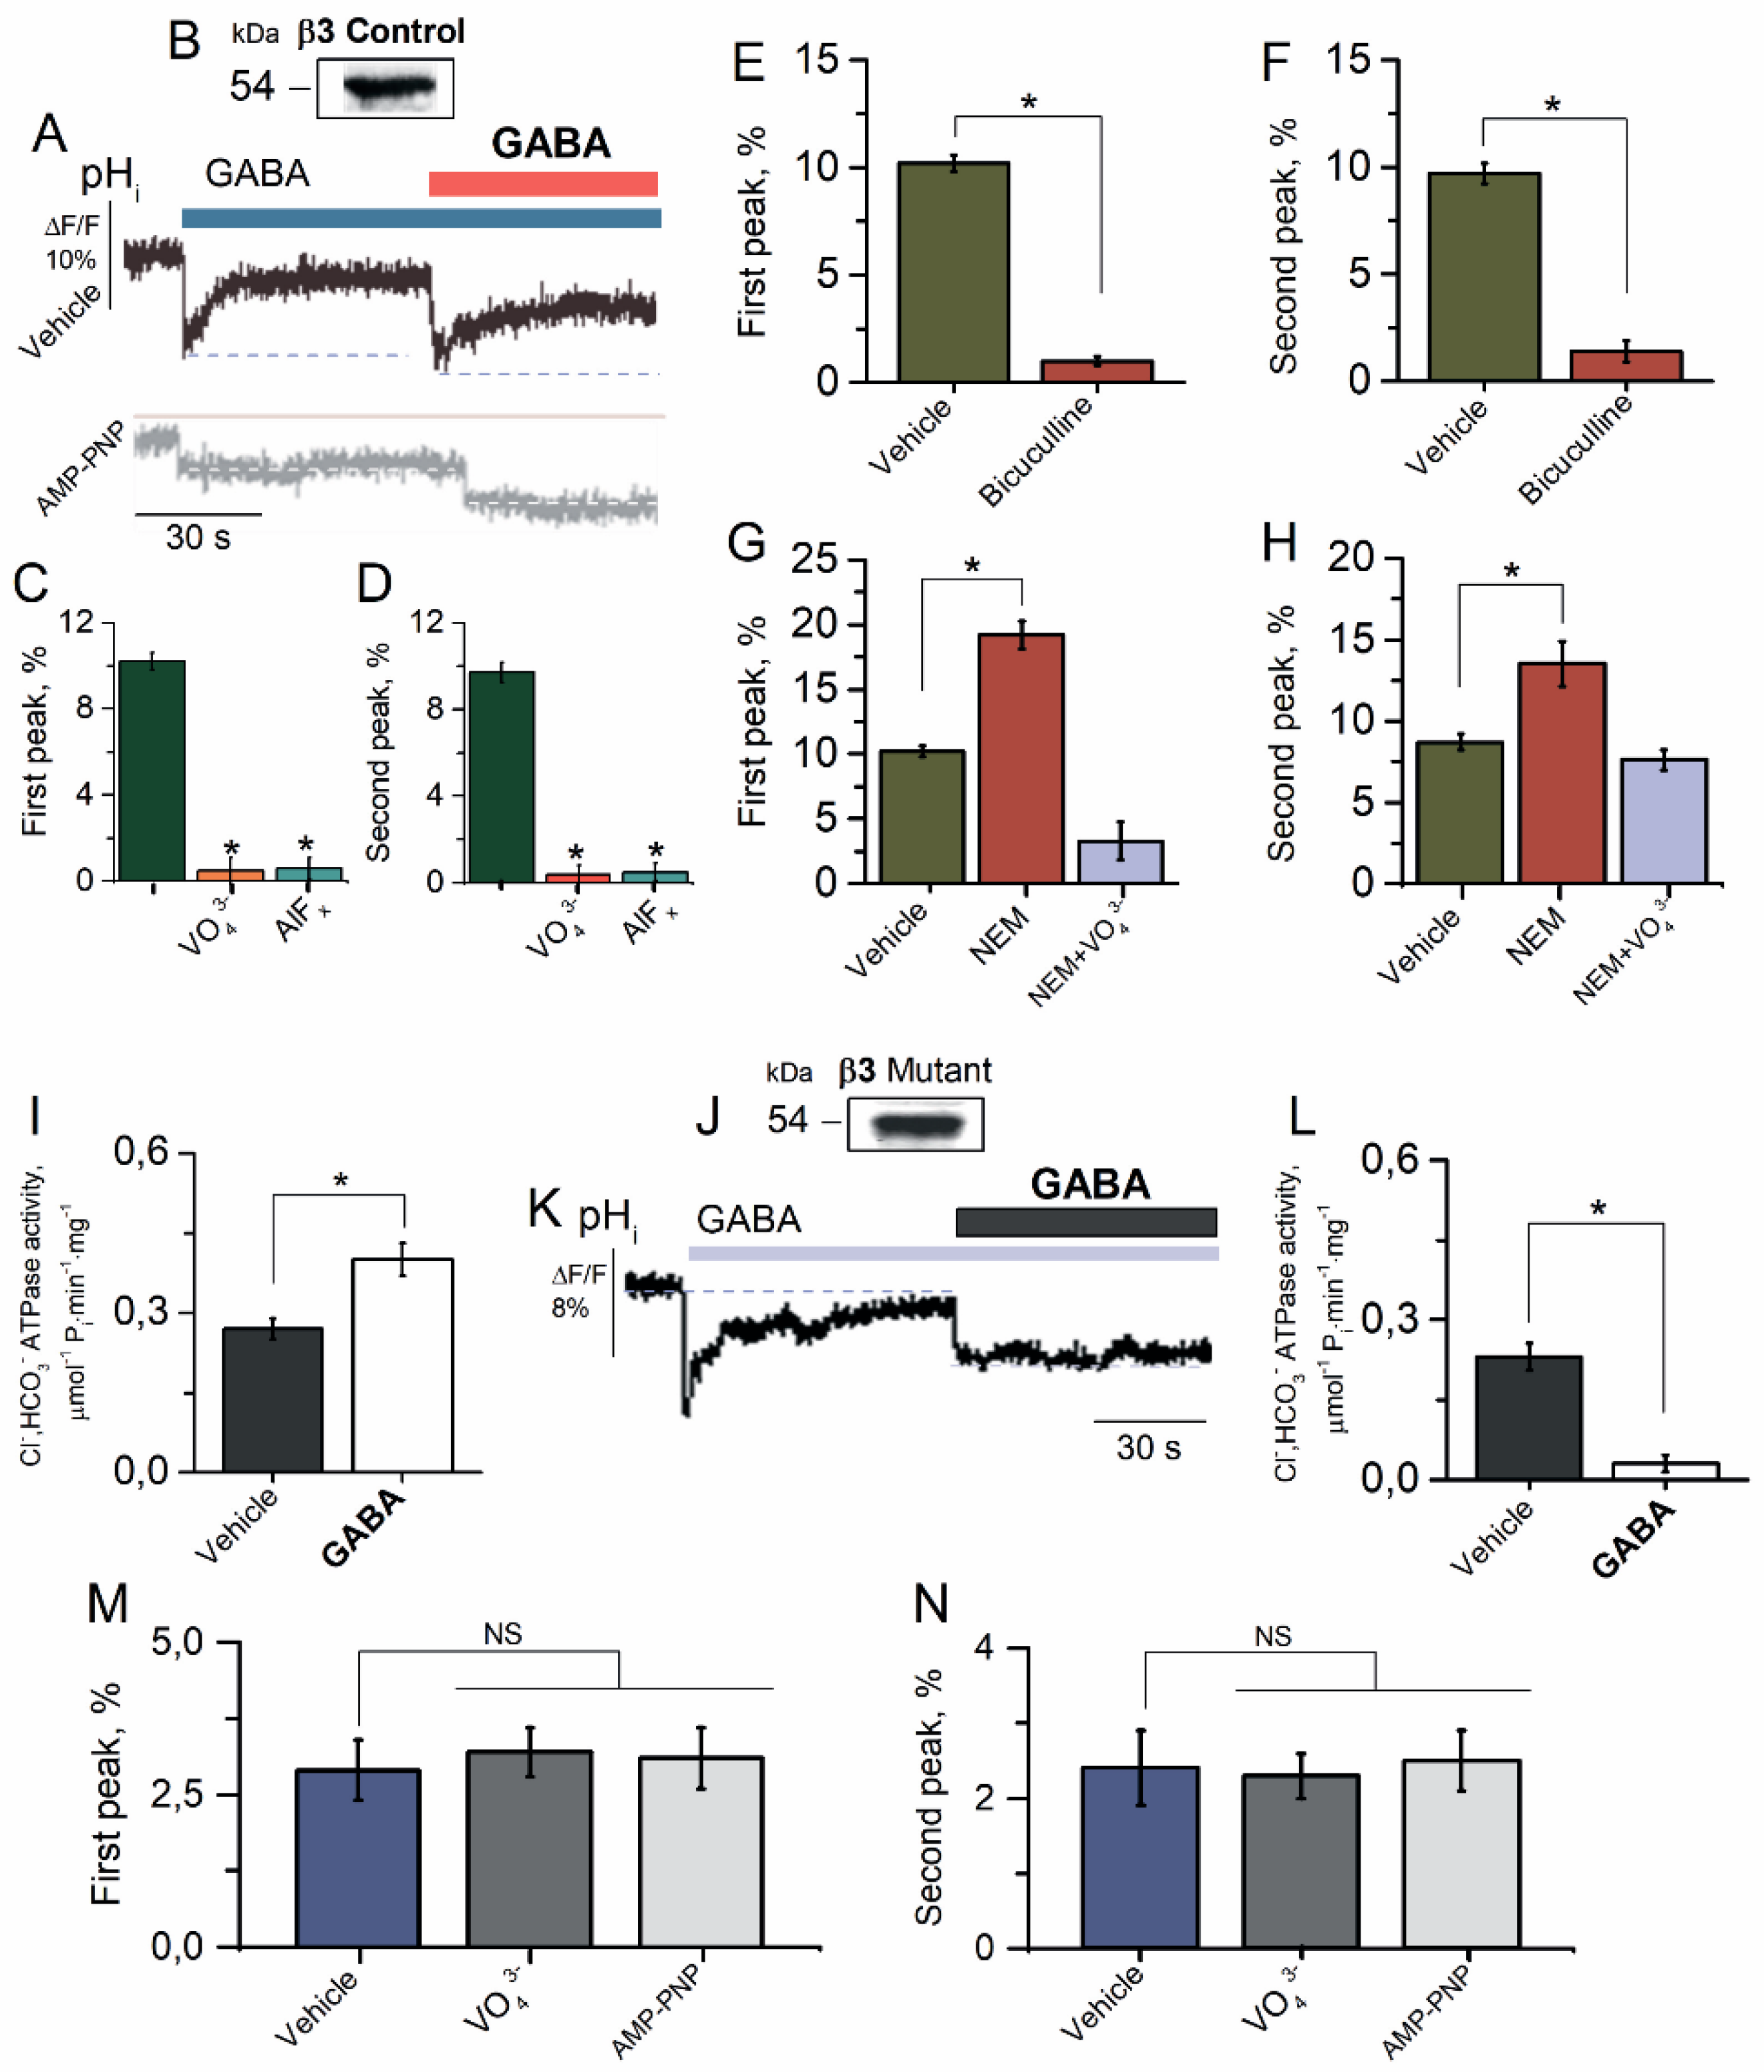
Previously, we have shown that only the GABAAR β3 subunit, in contrast to α2 or γ2 subunits, participates in the GABA-mediated or ATP-dependent Cl− transport [27]. To examine whether the β3 subunit is also involved in the HCO3− transport, we studied the properties of the GABAAR-mediated HCO3− outflux in the HEK 293FT cells expressing the homomeric GABAAR β3 isoform (Figure 4A). HEK 293FT cells expressing the GABAAR β3 isoform showed one band in the VLPs with a molecular weight of approximately ~54 kDa that was bound to antibodies against the GABAAR β3 subunits (Figure 4B). The HEK 293FT cells in the presence of HCO3− (25 mM) in the experience medium showed a rapid pHi decrease in the both first and repetitive applications of the agonist with a maximum peak of fluorescence changes of 10.2 ± 0.4% (n = 5) and 9.7 ± 0.5% (n = 5) (Figure 4C,D), respectively, and with a subsequent rapid (~40 s) recovery of [HCO3−]i (Figure 4A). γPAs completely eliminated the GABA-mediated fluorescence changes in the first application and at reapplication of GABA (100 μM) (Figure 4A,C,D). Bicuculline (50 μM) completely eliminated the fluorescence changes, recorded in response to first and reapplication of GABA (100 μM) in an experimental medium (Figure 4E,F).
NEM (300 μM) activated the HCO3− outflux at the first and repeated application of GABA with a maximum peak of fluorescence changes of 19.2 ± 1.1% (n = 5) and 13.5 ± 1.4% (n = 5), respectively (Figure 4G,H). The NEM effect did not appear in the presence of VO43− (20 μM) assuming the involvement of the ATP-hydrolyzing system in the process of [HCO3−]i recovery. To assess the role of ATPase in the consuming of [ATP]i, we studied the effect of GABA on the Cl−, HCO3− ATPase activity. As shown in Figure 4I, the control GABAAR β3 isoform showed Cl−, HCO3− ATPase activity of 0.27 ± 0.2 μmol−1 Pi min−1 mg−1. The addition of GABA (100 μM) induced increased enzyme activity by one and a half times.
To examine the contribution of the β3 subunit in the processes of resensitization, we selected a mutation nearby the desensitization-gate, which was previously found to specifically alter the desensitization kinetics and amplitude [10,17,18]. Specifically, a single cysteine residue (C313) in the M3 domain was conserved in all GABAAR β subunits and demonstrated a specific response to modulation by oxidizing agents [45]. To test whether this cysteine residue formed at least in part the molecular basis for NEM modulation, this residue was mutated to alanine in the β3 subunit (C313A). HEK 293FT cells expressing the mutant GABAAR β3 isoform showed one band in the VLPs with a molecular weight of approximately ~54 kDa that was bound to antibodies against the GABAAR β3 subunits, respectively (Figure 4J). In contrast to the control receptor isoform, the homomeric mutant GABAAR β3 (C313A) isoform displayed the GABA-mediated recovery of pHi (8.9 ± 0.7%) in the first case and at the second application of GABA, showing desensitization (Figure 4K). The mutant GABAAR β3 isoform also possessed Cl−, HCO3− ATPase activity (0.23 ± 0.01 μmol−1 Pi min−1 mg−1), and an exposition with GABA (100 μM) only decreased the enzyme activity (Figure 4L). Meanwhile, in the HEK 293FT cells expressing the homomeric GABAAR β3 isoform, GABA (100 μM) in both the first and repetitive application induced Cl− influx in cells, but it was not statistically significant (Figure 4M,N). The maximal peak of fluorescence changes for the first and repeated application was 2.9 ± 0.8 (n = 5) and 2.3 ± 0.9 (n = 5), respectively, and that had few changes in the presence of VO43− (20 μM) or AMP-PNP (2 mM).
2.5. The Reconstituted Cl−, HCO3− ATPase Responsible for GABAAR Resensitization
We followed-up on our results showing that the β3 subunit alone sufficed to show ATPase activity by transfecting HEK 293FT cells with plasmid vectors containing GABAAR cDNA of the β3 subunit bound to a His-tag fusion protein [27]. These studies showed that reconstituted GABAARs can participate in both the influx and efflux of Cl−. We purified and reconstituted the enzyme and investigated the ATP-dependent Cl−-transport in proteoliposomes containing the embedded protein and the fluorescent dye MQAE. To understand how the β3 subunit might affect GABAAR resensitization, the proteoliposomes after addition of 2 mM Mg2+-ATP were exposed with the agonist.
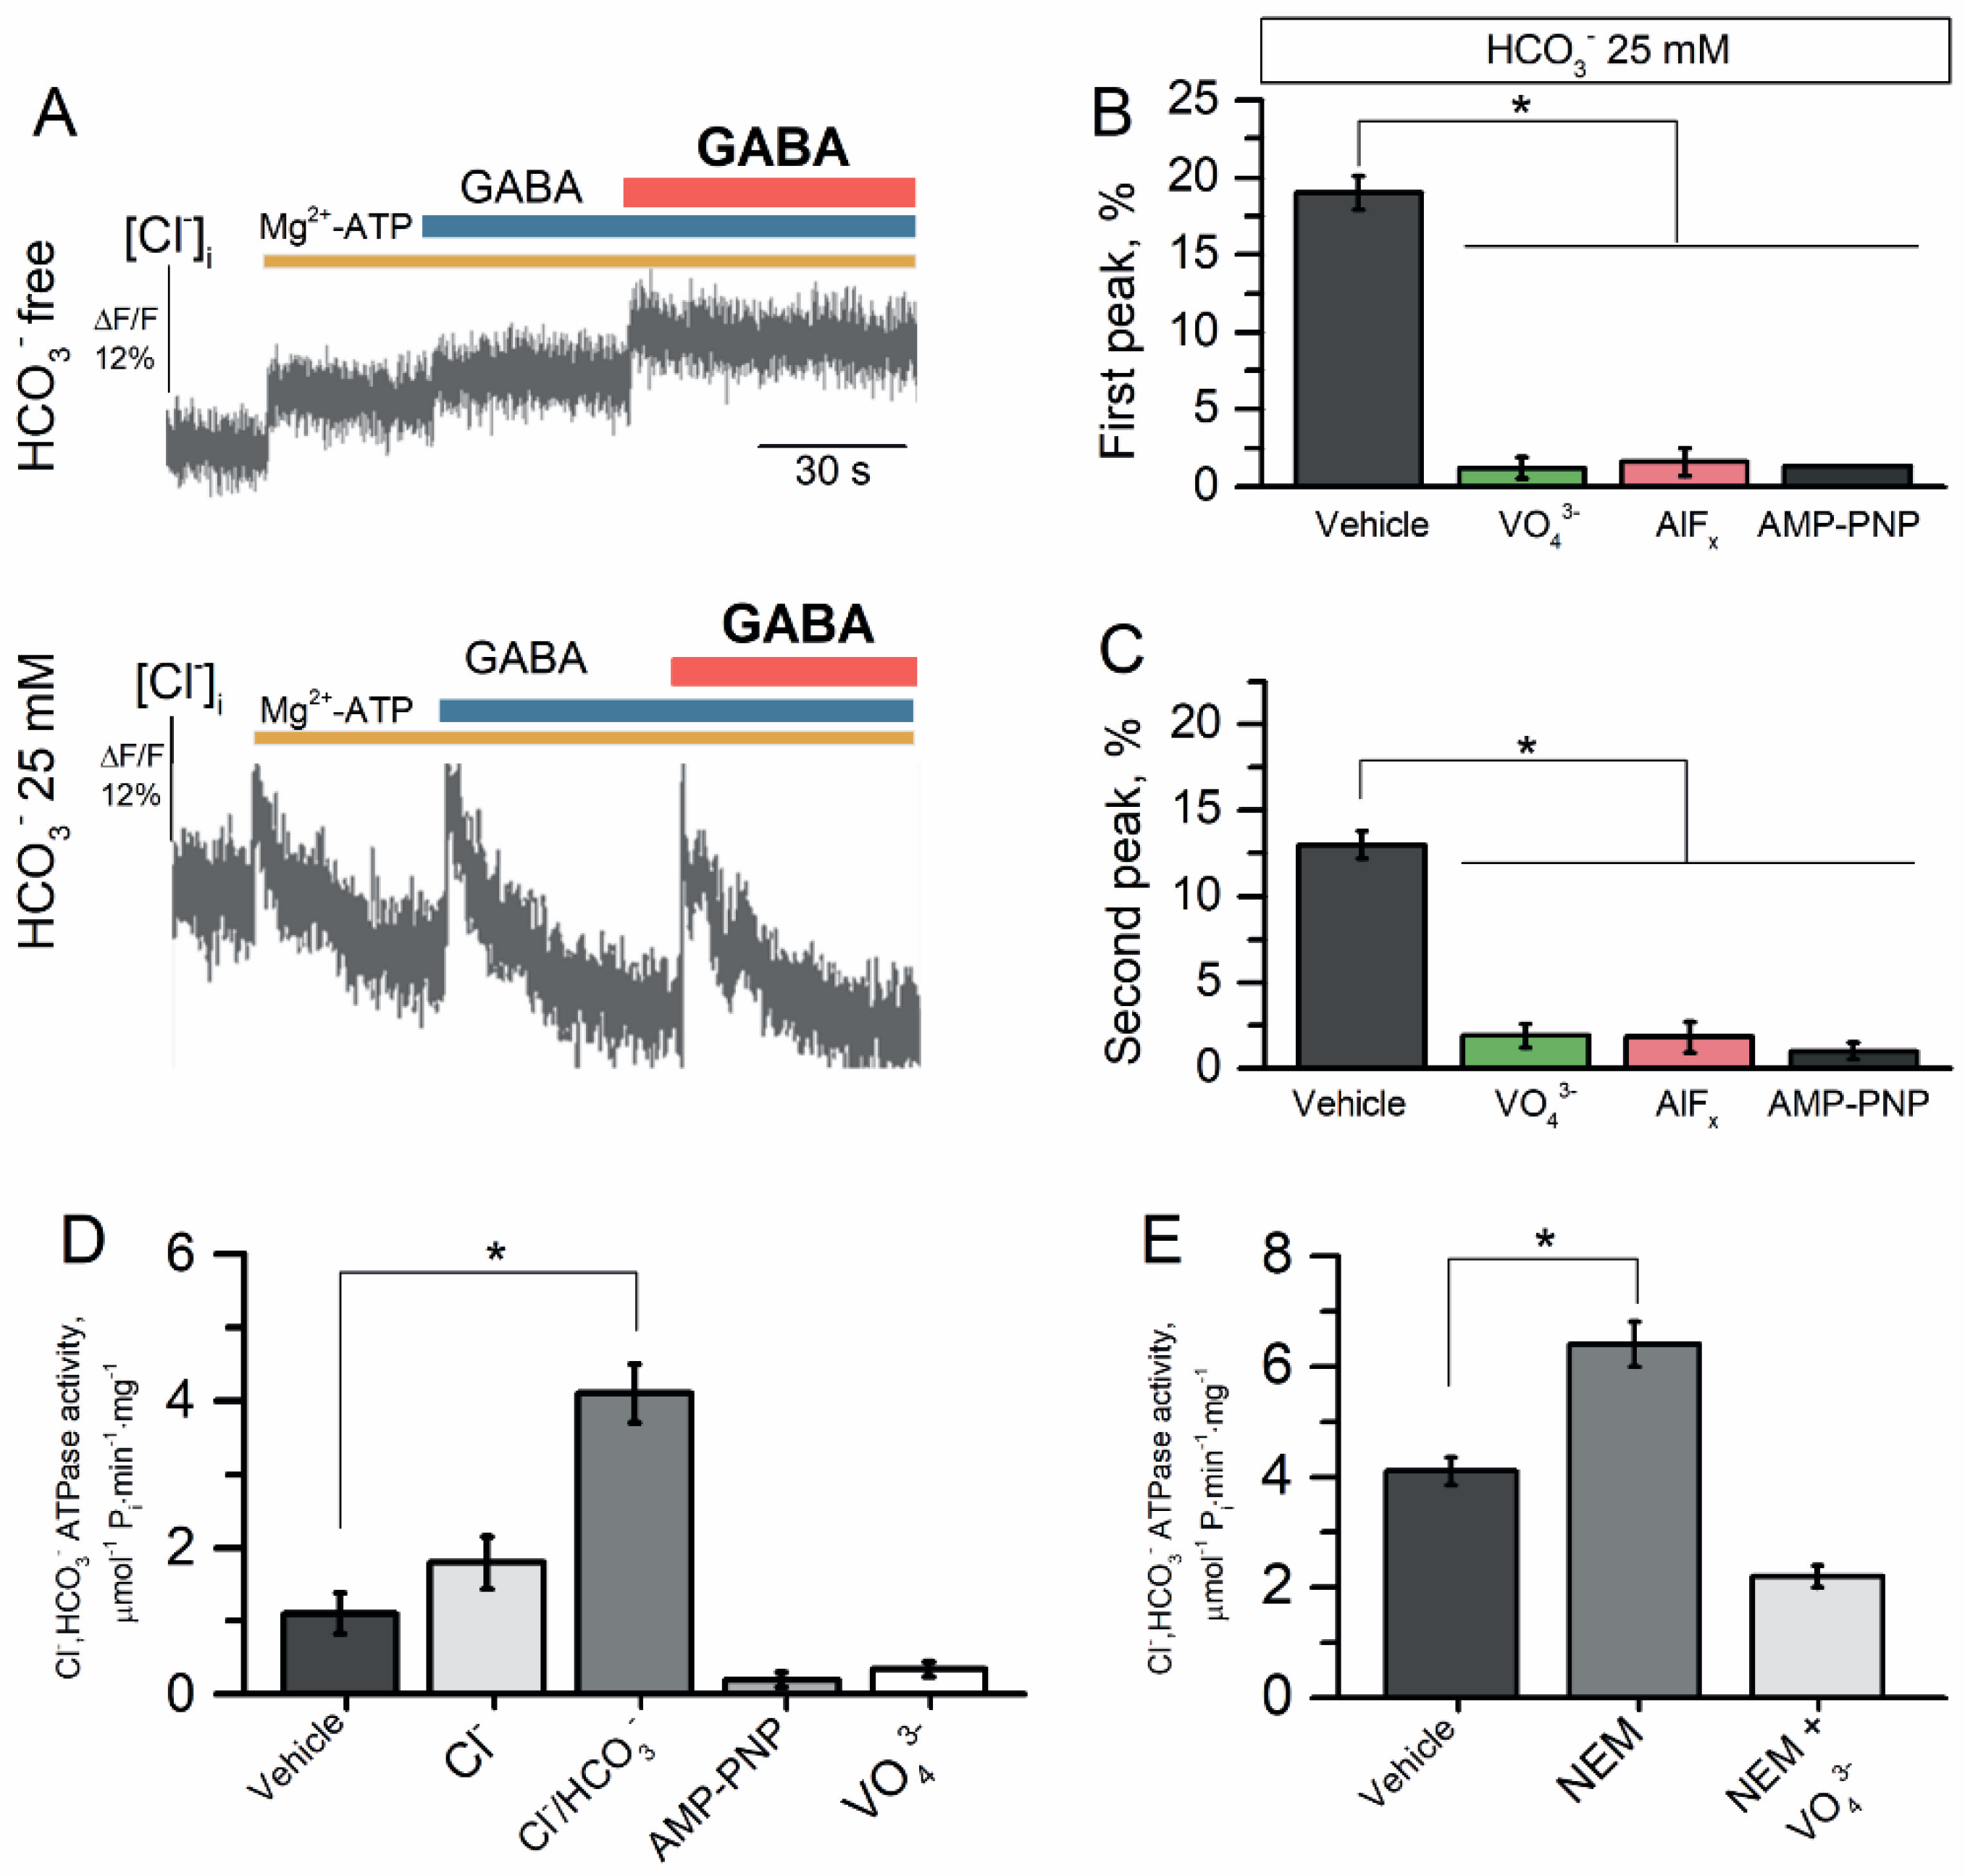
As shown in Figure 5A (top image), addition of 2.0 mM Mg2+-ATP to the HCO3−-free medium resulted in a short-term (1–30 s) increase in the flow of Cl− into the proteoliposomes of 5.5 ± 0.4% (n = 4); this influx reached a plateau after 40 s of incubation. The first and repeated application of GABA (100 μM) did not change the Cl− influx to proteoliposomes in the HCO3−-free medium. Meanwhile, as shown in Figure 5A (bottom image), in the presence of HCO3− (25 mM) in the experimental medium, addition of Mg2+-ATP (2.0 mM) increased the Cl− influx into the proteoliposomes during the short-term (1–30 s); this Cl− influx reached a plateau after 30 s of incubation with a maximal peak of the fluorescence changes (19.5 ± 0.7%, n = 4).
The first addition of GABA (100 μM) to the incubation medium caused a short-term (~1 s) efflux of Cl− from the proteoliposomes with a maximal peak of fluorescence change of 18.0 ± 1.3% (n = 4) that was quickly restored and reached a plateau during ~60 s of incubation (Figure 5A). Repetitive application of GABA (100 μM) also caused a short-term (~1 s) efflux of Cl− from the proteoliposomes with a maximal peak of fluorescence change of 13.0 ± 0.5% (n = 4) that was quickly restored and reached a plateau during ~60 s. Both the first and repetitive application of the agonist were inhibited by γPAs, showing the involvement of ATPase activity (Figure 5B,C). To examine the role of ATPase in the GABA-mediated Cl− influx into proteoliposomes, we studied its activity in the absence or presence of γPAs. The reconstituted receptor showed Cl−, HCO3− ATPase activity in 4.1 ± 0.3 μmol−1 Pi min−1 mg−1 (Figure 5D). In addition, AMP-PNP (2 mM) and VO43− (20 μM) suppressed the Cl−, HCO3− ATPase activity. An application of NEM (300 μM) increased the enzyme activity (6.4 ± 0.4 μmol−1 Pi min−1 mg−1) and this effect was eliminated by the addition of VO43− (20 μM) (Figure 5E).
3. Discussion
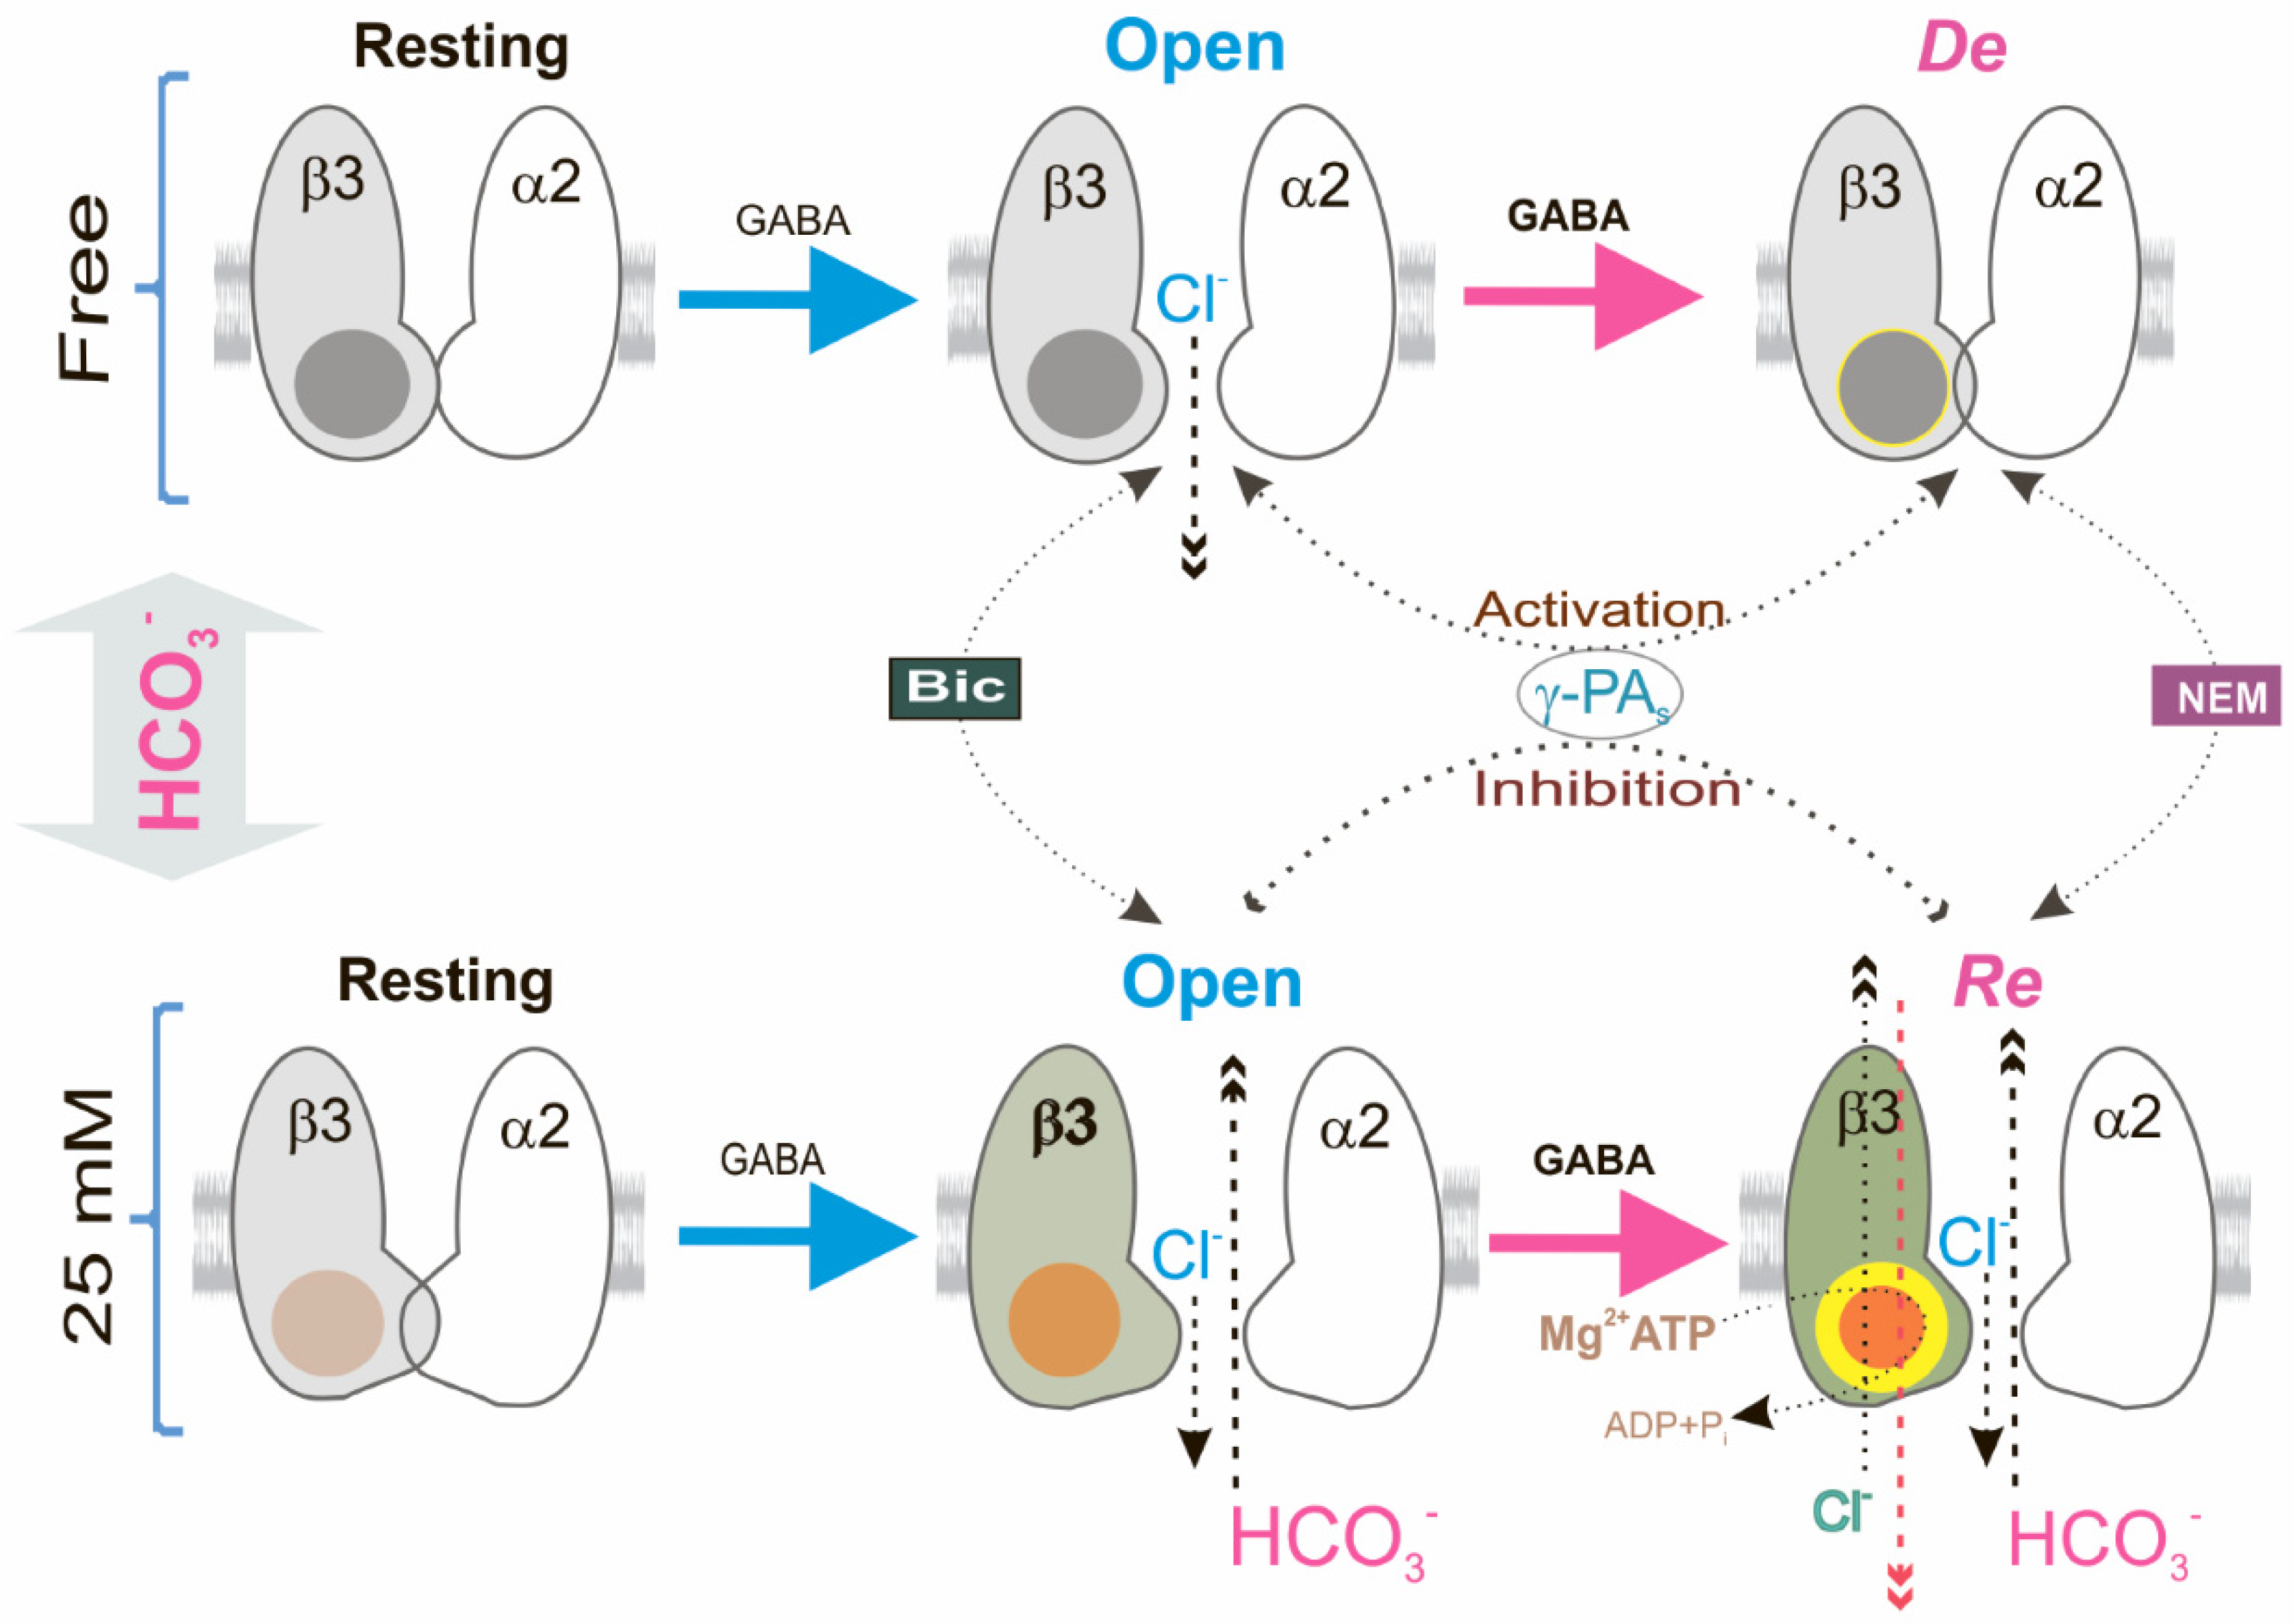
Although the involvement of kinases and other molecules in the desensitization and slowdown of deactivation of GABAAR-mediated currents has been shown [9,20], the role of the ATP-hydrolyzing system in these processes is less explored. Currently, three fundamental states have been established that depict the GABAAR channel function at sustained or repeated application of agonist binding: resting, open, and desensitized states [2,16]. Here, by repeated use of the agonist, we also observed three forms of GABAAR-mediated Cl− influx in the neurons that vary in their sensitivity to γPAs (Figure 6). The open GABAAR state, in contrast to the desensitization state, was activated by γPAs (Figure 1) which is similar to data from other studies. Specifically, blockers of phosphatases (vanadate or okadaic acid) in the concentration of 100 μM [20] as well as AMP-PNP (1 mM) [21,25] activated the GABAAR-mediated Cl− current via changes of processes of phosphorylation and dephosphorylation [46]. However, we found that in the presence of physiological concentrations of HCO3−, blockers as well as AMP-PNP inhibited the open state of the GABAARs that were shown to take part in the ATP-consuming system in the processes of desensitization and resensitization (Figure 2). This assumption was also supported by the data about changes in [ATP]i in the presence of a physiological concentration of HCO3− and the alkylating agent NEM (Figure 3). AMP-PNP, which traps the magnesium nucleotide within the ATP-hydrolyzing site [30], effectively eliminated the GABAAR-mediated Cl−/HCO3− fluxes. Similar conclusions were drawn from experiments in which the GABAAR conductance was maintained by the addition of Mg2+-ATP (2 mM) not revealed in the presence of non-hydrolysable ATP analogs (AMP-PNP or AMP-PCP) [22,23,24,25].
GABAergic neurotransmission has the unique property of ionic plasticity, rooted in the short-term and long-term changes in the neuronal intracellular concentrations of chloride ([Cl−]i) and bicarbonate ([HCO3−]i) ions [47,48]. Although GABAARs are mainly permeable to Cl−, they also show a significant permeability to HCO3− (at a ratio of HCO3− to Cl− of ~0.2–0.4). In mature neurons, the [Cl−]i is low, the neuronal equilibrium potential for chloride (ECl−) is negative, and GABAAR activation triggers Cl− influx and subsequent hyperpolarization or depolarization that depends not only on [Cl−]i but also on [HCO3−]i [49,50]. Experimental studies have demonstrated that massive GABAergic stimulation can shift EGABA from hyperpolarizing toward depolarizing and even excitation [42,44]. In contrast to Cl−, much less is known about the role of HCO3−, which despite a lower permeability, invariably flows outward after significant GABAAR activation with a consequent dramatic fall in intracellular pH (pHi) [41,50,51,52]. Moreover, it was shown that the reapplication of GABA (100 μM) does not reveal the desensitization of bicuculline-inhibited and GABAAR-mediated HCO3− outflux in in situ experiments [43,50]. Here, we showed that the presence of HCO3− not only increased the [Cl−] but also reduced pHi after HCO3− outflow via the GABAAR pore. We also did not find that the desensitization of GABAAR-mediated HCO3− outflux at the second application of the agonist (Figure 3). In addition, such recovery of [HCO3−]i after GABAAR-mediated activity occurring at ~40 s is consistent with data on the recovery of GABAAR-mediated conductance after desensitization at ~30 s [41,51].
Unlike the various plasmalemmal ATPases that use the ATP energy for actively transporting ions against an electrochemical gradient [53], GABAARs have passive conduits for anions [1]. Our studies also demonstrated that the GABAARs have passive permeability for Cl− or HCO3− (Figure 1 and Figure 3). The homomeric β3 GABAAR subtype operates in two different modes, which was shown before in the presence of HCO3 as a GABA-gated ion channel or a primary-active ATP-consuming transporter [27]. Such properties are characteristic of several systems, including intensively studied systems such as ATP-binding cassette importers [54] or exporters [55] inhibited by high concentrations (≥100 μM) of vanadate or okadaic acid [56,57]. However, detailed mechanistic insights into the role of ATP consumption in the function of these systems are lacking and most probably involves in channel gating [58]. P-type ATPases are characterized by the formation of transit high-energy acyl phosphate intermediates, where ATP is bound at the catalytic site as a planar structure in a complex with water and Mg2+ in a dephosphorylation transition state-like conformation that is inhibited by low concentrations (≤20 μM) of VO43− or metal fluoride (MeFx) complexes [56,57]. Previously, we showed that the GABAAR-coupled ATPase can form a phosphate intermediate that is dephosphorylated in the presence of anions and inhibited by low concentrations of VO43− (≤20 μM) [28]. Phosphorylation of the β3 subunit was seemingly an intermediate step required for energy transduction and displacement of bound anions before hydrolytic cleavage of Pi during the resensitization state (Figure 1 and Figure 2). In addition, the NEM effect on the GABAAR-mediated Cl− or HCO3− fluxes was eliminated by vanadate in the presence of HCO3, which denoted a close site of localization of the ATP-hydrolyzing center and cysteine residue (C313) in the M3 domain of the β3 subunit (Figure 6). This line of reasoning confirms data where the chimeric isoform did not show the desensitization of the GABAAR-mediated Cl− flux but only the resensitization.
Although stereotypical synaptic GABAARs are composed of two α, two β, and one γ subunit [59], the functional properties of GABAARs are ensured by the mandatory inclusion of the β subunits and primary β3 subunit [60]. Furthermore, the β3 subunit possesses a set of functional and pharmacological properties that distinguish it from other β subunits [28,61]. These observations lend a new physiological significance to the β3 subunit in the manifestation of resensitization of GABAAR via the involvement of the ATPase. The changing [HCO3−]i is the major determinant of the appearance of GABAAR resensitization, whereas the changing [Cl−]i in the bicarbonate-free medium plays a vital role in their desensitization that is similar to data of other studies. In the particular, it was found that the changing [Cl−]i is the major determinant of GABAAR-mediated current decay in the presence of an agonist [11,62]. Overall, we describe a new investigation of the role of HCO3− in the GABAAR function and revealed a molecular mechanism whereby a massive activation of GABAARs can strengthen or reduce the inhibition via GABAergic synapses. In this context, given the current structural and kinetic evidence, the physiological role of the ATPase appears to be essential due to its involvement in the long-lived conformational change of receptors, transduced from the external to the internal faces of the plasma membrane upon the binding of an agonist. However, structural studies are required to establish precisely what kind of molecular rearrangements take place in the structure of the β3 subunit during the transition from desensitization to resensitization.
4. Materials and Methods
4.1. Animals and Housing
Animal experiments were carried out using adult male Wistar rats purchased from the Institute of General Pathology and Pathophysiology vivarium and weighing 130–160 g at the time of arrival unless otherwise stated. Rats were always group-housed (5 per cage) and maintained in a temperature-controlled environment (23 ± 1) on a 12:12 h light-dark cycle and had access to food and water ad libitum. We performed all manipulations on animals in accordance with EU directive 2010/63/EU and according to the principles expressed in the Declaration of Helsinki revised by WMA, Fortaleza, Brazil, 2013, and the Rules of Good Laboratory Practice in the Russian Federation approved by Order N 199H (1 April 2016) of the Ministry of Health Care, under supervision of the Ethics Committee of the Institute of General Pathology and Pathophysiology (project approval protocol No 3 of 18 08 2021; the final approval protocol No 1 of 03 03 2022).
4.2. Synaptoneurosomes (SNs) Preparation
SNs were prepared from whole brains of wild-type from freshly dissected forebrains (mostly cortex) (~200–400 mg wet weight) as previously described [63]. Briefly, rats were quickly decapitated using a guillotine, brains were removed and placed in an ice-cold, balanced salt solution (BSS) containing 135 mM NaCl, 1 mM KCl, 0.8 mM MgCl2, 0.5 mM KH2PO4, 10 mM glucose, 0.1% bovine serum albumin (BSA), 10 mM Hepes-Tris (pH 7.3), and a protease inhibitor (A32955, Thermo Fisher Scientific, USA). The brain was cut into small pieces (2–3 mm) and manually homogenized (6 strokes) with a loosely fitting glass-Teflon homogenizer. The homogenate was passed through a nylon mesh (80 μm), and the filtrate was subsequently passed through a cellulose nitrate filter (8 μm) followed by centrifugation at 1000× g for 15 min. The pellet was washed once in BSS and centrifuged. All the procedures were performed at 4 °C. Sodium chloride (7647-14-5), potassium chloride (7447-40-7), magnesium chloride (7786-30-3), potassium phosphate monobasic (7778-77-0), BSA (9048-46-8), and D-(+)-Glucose (50-99-7) were obtained from Merck, (Branchburg, NJ, USA).
4.3. Plasma Membrane (PM) Preparation
PMs were prepared from control HEK 293FT cells and various GABAAR variants were detached using Hanks’ balanced salt solution (Gibco, Waltham, MA, USA) without divalent cations (i.e., trypsin was not used), and the cells were centrifuged at 300× g for 3 min. The HEK 293FT cells or brain (mostly cortex) were homogenized in an ice-cold buffer containing 0.3 M sucrose, 0.5 mM EDTA-Tris, HEPES-Tris, 10 mM (pH 7.3), and protease inhibitor cocktail tablets (A32955, Thermo Fisher Scientific, Waltham, MA, USA), and centrifuged at 10,000× g for 15 min at 4 °C, after which the pellet was discarded. The supernatant was centrifuged for 1 h at 150,000× g and the resulting pellets were resuspended in 20 mM HEPES-Tris pH 7.3. This plasma membrane-enriched preparation was used for further measurements of the enzyme activity. Ethylenediaminetetraacetic acid (60-00-4), 4-(2-hydroxyethyl)-1-piperazineethane-sulfonic acid (HEPES), and Tris(hydroxymethylamino-methane (77-86-1) were obtained from Merck (USA).
4.4. Cell Cultures and Transfection
For the expression homo- or heteromeric GABAAR ensembles, human embryonic kidney 293FT cells (American Type Culture Collection) were used. The cells were purchased from Invitrogen (USA) as part of the Membrane Pro™ Functional Protein Expression System (A11667), and the cell line identity was not further authenticated. The cells were grown and maintained in an incubator (Sanyo, Osaka, Japan) at 37 °C in a humidified atmosphere with 5% CO2, in DMEM media (41965-039, Gibco, Inchinnan, UK) supplemented with of 0.1 mM MEM NEAA (11140035, Gibco, Inchinnan, UK), 4 mM L-glutamine, 1 mM sodium pyruvate, 4.5 g/L D-glucose (15023021), and 10% FBS ((10270-106, Gibco, Germany) until the 20th passage, as suggested by the vendor. HEK 293FT cells were transfected by Lipofectamine TM 2000 or 3000 (Invitrogen, Thermo Fisher Scientific, Waltham, MA, USA and Lithuania) transfection reagents according to the manufacturer’s instructions. Cells were harvested and analyzed 24 h after transfection. For transfection procedures and virus-like particle (VLP) production, the same growth medium with decreased FBS content up to 4% was used according to the manufacturer’s recommendations. Geneticin G418 sulphate (11811031, Invitrogen, Waltham, MA, USA) was present in the growth medium at a concentration of 500 mg/mL constantly except during the transfection. The cells were subcultured at confluence by treatment with 0.05% trypsin and 0.02% EDTA in PBS. For selection purposes and improving the yield of VLPs, the transfection medium was removed after 24 h and a fresh growth medium with 10 µg/mL blasticidin (R21001 Gibco, USA) was added. Transfected cells and VLPs were collected and analyzed 24–48 h after transfection.
4.5. Molecular Biology
The genes encoding the full-length rat GABAAR β3 subunit were amplified by PCR from the cDNA library (Evrogen, Moscow, Russia) using gene-specific primers with Kozak sequence at the 5′ end of the forward primer based on “GenBank: NM_017065.1” sequences. The PCR products were cloned into the pEF6/V5-His TOPO TA vector (K961020, Invitrogen, Waltham, MA, USA) separately and verified by DNA sequencing. Each vector was amplified using E. coli TOP10 strain in LB medium supplemented with 20 µg/mL ampicillin. Isolation and purification of plasmids were performed with PureYieldTM Plasmid Miniprep System (Promega, Madison, WI, USA) and Plasmid Midiprep 2.0 (Evrogen, Moscow, Russia). The sterilization of plasmids was implemented via 0.22 µm filtration. The concentration of plasmids was evaluated on spectrophotometer NanoDrop 1000 (Thermo Fisher Scientific, Waltham, MA, USA). The quality validation of cloning and growth was performed additionally through enzymatic restriction by XbaI and BamHI in BamHI buffer (Thermo Fisher Scientific, Waltham, MA, USA), and the following electrophoresis in 1% agarose gel.
4.6. Transfection
The typical transfection procedure of GABAAR subunit-containing constructs for the subsequent biochemical, spectrofluorometric, and Western blot analyses was as follows. Approximately 5 × 10⁵ HEK293FT cells were suspended in 8 mL DMEM, plated into a 90-mm culture dish, and maintained 24 h approximately until 50% to 90% of the confluence. Then, 5 μg of plasmid DNA (β3 alone) was added combined with Lipofectamine® 3000 Reagent (Invitrogen, Thermo Fisher Scientific, Waltham, MA, USA) in Opti-MEM® I (1×) + GlutaMAXTM-I medium (51985-026, Gibco, Inchinnan, UK) accordingly the manufacturers’ recommendations. For microscopy, the cells were plated in 35 mm dishes and were incubated with a proportional amount of reagents and vectors.
4.7. VLP Production
For VLP production, GABAAR subunit-containing constructs were transfected together with Membrane Pro™ Reagent (Invitrogen, Waltham, MA, USA) amenably. Transfected HEK293FT started to bud off VLPs from the cell membrane approximately 24 h after transfection. The harvesting procedure was executed in conformity with manufacturer’s recommendations. Briefly, the VLP-containing medium was mixed with Membrane Pro™ Precipitation Mix in the ratio of 5 to 1, where 5 refers to the medium. Then, the mix was incubated at 4 °C overnight. After incubation, VLPs were pelleted by centrifugation at 5500× g for 30 min and resuspended in HEPES buffer for subsequent analysis or stored at −80 °C.
4.8. Cl− and HCO3−-Transport Assays
Cl−-sensitive fluorescent dye MQAE (N-(Ethoxycarbonyl-methyl)-6-Methoxyquinolinium Bromide) or BCECF, AM (2′,7′-Bis-(2-Carboxyethyl)-5-(and-6)-Carboxyfluorescein, Acetoxy methyl Ester) were obtained from Thermo Fisher Scientific, USA (E3101) or B1170, respectively. A stock solution was prepared in H2O, aliquoted, and stored in the freezer (−20 °C) protected from light. For cases in which fluorescence measurements were conducted, the HEK 293FT cells or SNs with loaded dye were stored in an opaque test tube at RT or 4 °C. Sodium bicarbonate (144-55-8), γ-aminobutyric acid, GABA (56-12-2), and bicuculline (485-49-4) were obtained from Sigma-Aldrich (USA), and adenosine 5′-(β,γ-imido)triphosphate lithium salt hydrate (25612-73-1) were obtained from Merck (USA). GABAAR-mediated Cl−- or HCO3−-transport was assessed by the dynamic measurements of the variations in the fluorescence intensity of Cl−-sensitive fluorescent dye MQAE-loaded or BCECF-loaded HEK 293FT cells or SNs using a FluoroMax®-4 spectrofluorometer (HORIBA Scientific Edison, Piscataway, NJ, USA), respectively. For that, the control HEK 293FT cells and various GABAAR β3 isoforms cells were trypsinized by adding 0.05% trypsin-EDTA solution (25200056, Gibco BRL, USA), washed PBS twice, resuspended in the BSB, and then loaded with MQAE for 1 h at 37 °C. After loading, the suspension was centrifuged at 200× g for 5 min at RT and kept in the aforementioned medium at RT in the opaque test tubes. For analysis, the pellet was resuspended in the BSB. Dye-loaded cells (SNS or HEK 293FT) or proteoliposomes were equilibrated in the incubation medium in the absence or presence of compounds (γPAs, bicuculline, or NEM) for about 10 min at 37 °C before initial fluorescence measurements, and then 150 μL of the suspension was added into quartz microcuvette (non-flow cell) andstirred. The GABA-mediated Cl− or HCO3− transport was initiated directly in the cuvette by an in-house solution supply system. The excitation and emission wavelengths were 350 nm and 480 nm for measurement of Cl−-transport or 490 nm and 535 nm for measurement of HCO3−-transport, respectively. The ΔF/F of each trial was calculated as (F − F0)/F0, where F0 is the baseline fluorescence signal averaged over a 25 s period (this was the control measurement) immediately before the start of the application of GABA and supplement compounds. The value of 100% was obtained as the fluorescence intensity before the application of GABA, in the absence or presence of test compounds. The maximum amplitude of GABA-mediated fluorescence responses (first peak % and second peak %) was calculated as the maximal difference in fluorescence intensity in the absence or presence of an agonist.
4.9. [ATP]i Measurement
ATP concentrations were determined by the luciferase method. As the source of luciferase, we used the ATP-Glo luminescence kit from Biotium (Fremont, CA, USA). The ATP standards or samples of SNs were prepared in 100 μL dH20 for the assay. The solution containing luciferase was reconstituted as indicated by the manufacturer and was stored in aliquots at −20 °C for at least 2 weeks. For measuring ATP, the solution was diluted 25-fold with an ATP assay mix dilution buffer. A calibration curve with 2–200 pmol of ATP was prepared by diluting an ATP stock solution (2 mM). ATP standards or samples were added to give a final volume of 500 μL. Tubes were vigorously vortexed for 3–5 s and the content was immediately placed in the 96-well black plate and then in the multilabel counter (Plate ChameleonTM V, Finland). The procedure lasted 3–5 min. D-luciferin was dissolved to a concentration of 0.4 mg/mL. Firefly luciferase was added to the ATP-Glo assay solution at a rate of 1 μL per 100 μL (25 μL luciferase per 2.5 mL). The ATP-Glo detection cocktail was prepared fresh before each use for maximum potency. The integration time of the luminescent signal was 10 s. As well, 100 μL of ATP-Glo detection cocktail was added to the sample. We mixed the mixture rapidly by pipetting. Immediately thereafter, the luciferase activity was measured at room temperature.
4.10. ATPase Activation Assay
The Cl−/HCO3−-ATPase activity in PMs of neurons or HEK 293FT cells expressing the various constructs were measured as previously described [27]. Briefly, PMs or VLPs were added to 0.5 mL of an incubation medium containing 20 mM HEPES-Tris pH 7.3, 5 mM NaCl/25 mM NaHCO3, and 50 mM NaNO3 (neutral salt) to measure enzyme activity. The enzyme preparations (~10 μg) were preincubated at 37 °C for 15 min with the relevant compounds in an incubation medium containing 20 mM HEPES-Tris pH 7.3 and 5 mM NaCl/25 mM NaHCO3. Preparation of the test tube with bicarbonate—NaHCO3 (1 mM)—was previously dissolved in HEPES (20 mM) and then added in the 20 mM HEPES-Tris buffer (pH 6.7). The reaction was started by addition of Mg2+-ATP 2 mM (final concentration) in an experimental medium. The Cl−/HCO3−-activated ATPases activity was determined as a difference in formation of inorganic phosphorus (Pi) in the absence and in the presence of 5 mM NaCl/25 mM NaHCO3 in the incubation medium. Adenosine 5′-triphosphate (ATP) disodium salt hydrate (34369-07-8) and adenylyl-imidodiphosphate (25612-73-1) were obtained from Merck (USA). The concentration of inorganic phosphate (Pi) in the incubation medium was measured by a modified method of Chen et al., (1956) [27] using a Cary 60 UV–vis spectrophotometer (Agilent, Santa Clara, CA, USA) at wavelength of 650 nm. The γ-phosphate analog, orthovanadate (VO43−) (Sigma-Aldrich, St. Louis, MI, USA), was obtained by boiling the vanadate solution ([pH 10]; 10 min), and freshly boiled stock was diluted to the final concentration (pH 7.3) prior to use.
4.11. Western Blot Analysis
VLPs of transfected HEK 293FT cells were subjected to SDS-PAGE using the SDS-PAGE reagent starter kit (1615100 Bio-Rad, Hercules, CA, USA) and to Western blot analysis using the Pierce™ fast western blot kit (35055 Thermo Scientific, Waltham, MA, USA), ECL Plus Western Blotting Detection System Substrate (GE Healthcare, Chicago, IL, USA). Samples were SDS-treated by boiling for 5 min in a buffer consisting of 62.5 mM Tris, 10% glycerol, 5% 2-mercaptoethanol, 4% SDS, and 0.001% bromophenol blue, and then ~20 µg of total protein was loaded into SDS-PAGE. Electrophoresis parameters were: 70 V for 10 min on 4% SDS-PAGE stacking gel and 120 V for 50 min on 12.5% SDS-PAGE resolving gel. Proteins were transferred on PVDF membrane by the semi-dry method using 0.09 A/cm2 for 1 h. After that, membranes were incubated for 1 h in a blocking solution containing 5% milk, and then incubated at 4 °C overnight with primary anti-GABRB3 antibodies [N87/25] (ab98968, Abcam, Cambridge, UK) diluted 1:1000 with the blocking solution. After incubation, the membranes were washed with TBS-T 4 times for 15 min each, and then incubated at RT for 1 h with secondary HRP-conjugated antibodies (62-6520 Thermo Fisher Scientific, Waltham, MA, USA) diluted 1:5000 with the blocking solution. Then, the membrane was washed with TBS-T four times and the GE Healthcare ECL Plus Western Blotting Detection System (Amersham™, GE Healthcare, UK) was applied according to manufacturer’s instructions. The visualization of the bands was obtained on a Kodak Image Station 440 (USA).
4.12. Statistical Analysis
All the data shown in the bar graphs are presented as mean ± standard errors (SEM). This includes graphs demonstrating the median GABAAR-mediated events. The data were collected with a repetition during several experimental days (n) and two or three measurements were combined for the average value in each series. The one-way analysis of variance (ANOVA) followed by Tukey’s post hoc test for multiple groups comparison was performed for the data, which were assessed as normally distributed with the Shapiro-Wilk test. Results with p values < 0.05 were defined as statistically significant (indicated by the * symbol on graphs), and p values are reported in full, where appropriate, with each figure legend. Origin Pro version 9.1 for Windows (OriginLab, Northampton, MA, USA) was used for conducting of the statistical analysis and the graphic representation of the data. Origin Pro version 9.1 for Windows (OriginLab, USA) was used for conducting of the statistical analysis and the graphic representation of the data.
Author Contributions
Conceptualization, S.A.M.; investigation, D.M.Z., A.A.M. and S.A.M.; writing—original draft, S.A.M.; resources, S.G.M. and A.A.K.; project administration, S.G.M. and A.A.K. All authors have read and agreed to the published version of the manuscript.
Funding
This research received no external funding.
Institutional Review Board Statement
The study was conducted in accordance with the Declaration of Helsinki, and approved by the Institute of General Pathology and Pathophysiology Review Board (or Ethics Committee) and the Rules of Good Laboratory Practice in the Russian Federation approved by Order N 199H (1 April 2016) of the Ministry of Health Care, under supervision of the Ethics Committee of the Institute of General Pathology and Pathophysiology (project approval protocol No 3 of 18 August 2021; the final approval protocol No 1 of 3 March 2022).
Informed Consent Statement
Not applicable.
Data Availability Statement
The data presented in this study are available on request from the corresponding author.
Acknowledgments
We thank Oksana Mayorova and Olga Menzikova for the preparation of the figures, Boris Matveev for the organization of technical support.
Conflicts of Interest
The authors declare no competing financial interest.
References
- Farrant, M.; Kaila, K. The cellular, molecular and ionic basis of GABAA receptor signalling. Prog. Brain Res. 2007, 160, 59–87. [Google Scholar] [PubMed]
- Sallard, E.; Letourneur, D.; Legendre, P. Electrophysiology of ionotropic GABA receptors. Cell Mol. Life Sci. 2021, 78, 5341–5370. [Google Scholar] [CrossRef] [PubMed]
- Bianchi, M.T.; Macdonald, R.L. Slow phases of GABAA receptor desensitization: Structural determinants and possible relevance for synaptic function. J. Physiol. 2002, 544, 3–18. [Google Scholar] [CrossRef] [PubMed]
- Chang, Y.; Ghansah, E.; Chen, Y.; Ye, J.; Weiss, D.S. Desensitization mechanism of GABA receptors revealed by single oocyte binding and receptor function. J. Neurosci. 2002, 22, 7982–7990. [Google Scholar] [CrossRef]
- Field, M.; Dorovykh, V.; Thomas, P.; Smart, T.G. Physiological role for GABAA receptor desensitization in the induction of long-term potentiation at inhibitory synapses. Nat. Commun. 2021, 12, 2112. [Google Scholar] [CrossRef]
- Gielen, M.; Barilone, N.; Corringer, P.J. The desensitization pathway of GABAA receptors, one subunit at a time. Nat. Commun. 2020, 11, 5369. [Google Scholar] [CrossRef]
- Jones, M.V.; Westbrook, G.L. Desensitized states prolong GABAA channel responses to brief agonist pulses. Neuron 1995, 15, 181–191. [Google Scholar] [CrossRef] [Green Version]
- Tia, S.; Wang, J.F.; Kotchabhakdi, N.; Vicini, S. Distinct deactivation and desensitization kinetics of recombinant GABAA receptors. Neuropharmacology 1996, 35, 1375–1382. [Google Scholar] [CrossRef]
- Kang, Y.; Saito, M.; Toyoda, H. Molecular and Regulatory Mechanisms of Desensitization and Resensitization of GABAA Receptors with a Special Reference to Propofol/Barbiturate. Int. J. Mol. Sci. 2020, 21, 563. [Google Scholar] [CrossRef] [Green Version]
- Hinkle, D.J.; Macdonald, R.L. β subunit phosphorylation selectively increases fast desensitization and prolongs deactivation of α1β1γ2L and α1β3γ2L GABAA receptor currents. J. Neurosci. 2003, 23, 11698–11710. [Google Scholar] [CrossRef] [Green Version]
- Karlsson, U.; Druzin, M.; Johansson, S. Cl− concentration changes and desensitization of GABAA and glycine receptors. J. Gen. Physiol. 2011, 138, 609–626. [Google Scholar] [CrossRef] [Green Version]
- Florence, L.; Lassi, D.L.S.; Kortas, G.T.; Lima, D.R.; de Azevedo-Marques Périco, C.; Andrade, A.G.; Torales, J.; Ventriglio, A.; De Berardis, D.; De Aquino, J.P.; et al. Brain Correlates of the Alcohol Use Disorder Pharmacotherapy Response: A Systematic Review of Neuroimaging Studies. Brain Sci. 2022, 12, 386. [Google Scholar] [CrossRef]
- Martinotti, G.; Lupi, M.; Sarchione, F.; Santacroce, R.; Salone, A.; De Berardis, D.; Serroni, N.; Cavuto, M.; Signorelli, M.; Aguglia, E.; et al. The potential of pregabalin in neurology, psychiatry and addiction: A qualitative overview. Curr. Pharm. Des. 2013, 19, 6367–6374. [Google Scholar] [CrossRef]
- Gravielle, M.C.C. Regulation of GABAA receptors by prolonged exposure to endogenous and exogenous ligands. Neurochem. Int. 2018, 118, 96–104. [Google Scholar] [CrossRef]
- Chen, L.; Wang, H.; Vicini, S.; Olsen, R.W. The γ-aminobutyric acid type A (GABAA) receptor-associated protein (GABARAP) promotes GABAA receptor clustering and modulates the channel kinetics. Proc. Natl. Acad. Sci. USA 2000, 97, 11557–11562. [Google Scholar] [CrossRef] [Green Version]
- Sugasawa, Y.; Cheng, W.W.; Bracamontes, J.R.; Chen, Z.W.; Wang, L.; Germann, A.L.; Pierce, S.R.; Senneff, T.C.; Krishnan, K.; Reichert, D.E.; et al. Site-specific effects of neurosteroids on GABAA receptor activation and desensitization. elife 2020, 9, e55331. [Google Scholar] [CrossRef]
- Gielen, M.; Corringer, P.-J. The dual-gate model for pentameric ligand-gated ion channels activation and desensitization. J. Physiol. 2018, 596, 1873–1902. [Google Scholar] [CrossRef] [Green Version]
- Kaczor, P.T.; Wolska, A.D.; Mozrzymas, J.W. α1 Subunit Histidine 55 at the Interface between Extracellular and Transmembrane Domains Affects Preactivation and Desensitization of the GABAA Receptor. ACS Chem. Neurosci. 2021, 12, 562–572. [Google Scholar] [CrossRef]
- Amico, C.; Cupello, A.; Fossati, C.; Robello, M. Involvement of phosphatase activities in the run-down of GABAA receptor function in rat cerebellar granule cells in culture. Neuroscience 1998, 84, 529–535. [Google Scholar] [CrossRef]
- Moss, S.J.; Gorrie, G.H.; Amato, A.; Smart, T.G. Modulation of GABAA receptors by tyrosine phosphorylation. Nature 1995, 377, 344–348. [Google Scholar] [CrossRef]
- Liu, J.; Wang, Y.T. Allosteric modulation of GABAA receptors by extracellular ATP. Mol. Brain 2014, 24, 6. [Google Scholar] [CrossRef] [Green Version]
- Stelzer, A.; Kay, A.R.; Wong, R.K. GABAA-receptor function in hippocampal cells is maintained by phosphorylation factors. Science 1988, 241, 339–341. [Google Scholar] [CrossRef]
- Harata, N.; Wu, J.; Ishibashi, H.; Ono, K.; Akaike, N. Run-down of the GABAA response under experimental ischaemia in acutely dissociated CA1 pyramidal neurones of the rat. J. Physiol. 1997, 500, 673–688. [Google Scholar] [CrossRef]
- Shirasaki, T.; Aibara, K.; Akaike, N. Direct modulation of GABAA receptor by intracellular ATP in dissociated nucleus tractus solitarii neurones of rat. J. Physiol. 1992, 449, 551–572. [Google Scholar] [CrossRef]
- Li, G.; Yang, K.; Zheng, C.; Liu, Q.; Chang, Y.; Kerrigan, J.F.; Wu, J. Functional rundown of gamma-aminobutyric acidA receptors in human hypothalamic hamartomas. Ann. Neurol. 2011, 69, 664–672. [Google Scholar] [CrossRef]
- Cifelli, P.; Di Angelantonio, S.; Alfano, V.; Morano, A.; De Felice, E.; Aronica, E.; Ruffolo, G.; Palma, E. Dissecting the Molecular Determinants of GABAA Receptors Current Rundown, a Hallmark of Refractory Human Epilepsy. Brain Sci. 2021, 11, 441. [Google Scholar] [CrossRef]
- Menzikov, S.A.; Zaichenko, D.M.; Moskovtsev, A.A.; Morozov, S.G.; Kubatiev, A.A. Ectopic GABAA receptor β3 subunit determines Cl−/HCO3−-ATPase and chloride transport in HEK 293FT cells. FEBS J. 2020, 288, 699–712. [Google Scholar] [CrossRef]
- Menzikov, S.A.; Morozov, S.G.; Kubatiev, A.A. Intricacies of GABAA Receptor Function: The Critical Role of the β3 Subunit in Norm and Pathology. Int. J. Mol. Sci. 2021, 22, 1457. [Google Scholar] [CrossRef]
- Menzikov, S.A.; Ruzhinskaia, N.N.; Menzikova, O.V. Mg2+-ATPase in the fish brain and its ultrastructural localization. J. Evol. Biochem. Physiol. 2000, 36, 346–352. [Google Scholar] [CrossRef]
- Lacabanne, D.; Wiegand, T.; Wili, N.; Kozlova, M.I.; Cadalbert, R.; Klose, D.; Mulkidjanian, A.Y.; Meier, B.H.; Böckmann, A. ATP Analogues for Structural Investigations: Case Studies of a DnaB Helicase and an ABC Transporter. Molecules 2020, 25, 5268. [Google Scholar] [CrossRef]
- Pinto, J.G.; Hornby, K.R.; Jones, D.G.; Murphy, K.M. Developmental changes in GABAergic mechanisms in human visual cortex across the lifespan. Front. Cell Neurosci. 2010, 10, 16. [Google Scholar] [CrossRef] [PubMed]
- Ito, Y.; Segawa, K.; Fukuda, H. Functional diversity of GABAA receptor ligand-gated chloride channels in rat synaptoneurosomes. Synapse 1995, 19, 188–196. [Google Scholar] [CrossRef] [PubMed]
- Francis, J.; Mihic, S.J.; Sneddon, W.B.; Burnham, W.M. The effect of anticonvulsant drugs on GABA-stimulated chloride uptake. Can. J. Neurol. Sci. 1994, 21, 3–8. [Google Scholar] [CrossRef] [Green Version]
- LoPachin, R.M.; Barber, D.S. Synaptic cysteine sulfhydryl groups as targets of electrophilic neurotoxicants. Toxicol. Sci. 2006, 94, 240–255. [Google Scholar] [CrossRef] [Green Version]
- Conway, L.C.; Cardarelli, R.A.; Moore, Y.E.; Jones, K.; McWilliams, L.J.; Baker, D.J.; Burnham, M.; Bürli, R.W.; Wang, Q.; Brandon, N.; et al. N-Ethylmaleimide increases KCC2 cotransporter activity by modulating transporter phosphorylation. J. Biol. Chem. 2017, 292, 21253–21263. [Google Scholar] [CrossRef] [Green Version]
- Morishita, W.; Alger, B.E. Evidence for endogenous excitatory amino acids as mediators in DSI of GABAAergic transmission in hippocampal CA1. J. Neurophysiol. 1999, 82, 2556–2564. [Google Scholar] [CrossRef] [Green Version]
- Kirmse, K.; Kirischuk, S. N-ethylmaleimide increases release probability at GABAergic synapses in layer I of the mouse visual cortex. Eur. J. Neurosci. 2006, 24, 2741–2748. [Google Scholar] [CrossRef]
- Morishita, W.; Kirov, S.A.; Pitler, T.A.; Martin, L.A.; Lenz, R.A.; Alger, B.E. N-ethylmaleimide blocks depolarization-induced suppression of inhibition and enhances GABA release in the rat hippocampal slice in vitro. J. Neurosci. 1997, 17, 941–950. [Google Scholar] [CrossRef] [Green Version]
- Beau, F.E.; Alger, B.E. Transient suppression of GABAA-receptor-mediated IPSPs after epileptiform burst discharges in CA1 pyramidal cells. J. Neurophysiol. 1998, 79, 659–669. [Google Scholar] [CrossRef] [Green Version]
- Perkins, K.L.; Wong, R.K. Ionic basis of the postsynaptic depolarizing GABA response in hippocampal pyramidal cells. J. Neurophysiol. 1996, 76, 3886–3894. [Google Scholar] [CrossRef]
- Kaila, K. Ionic basis of GABAA receptor channel function in the nervous system. Prog. Neurobiol. 1994, 42, 489–537. [Google Scholar] [CrossRef]
- Do-Young, K.; Fenoglio, K.A.; Kerrigan, J.F.; Rho, J.M. Bicarbonate contributes to GABAA receptor-mediated neuronal excitation in surgically resected human hypothalamic hamartomas. Epilepsy Res. 2009, 83, 89–93. [Google Scholar]
- Staley, K.J.; Proctor, W.R. Modulation of mammalian dendritic GABAA receptor function by the kinetics of Cl− and HCO3− transport. J. Physiol. Lond. 1999, 519, 693–712. [Google Scholar] [CrossRef]
- Lückermann, M.; Trapp, S.; Ballanyi, K. GABA- and glycine-mediated fall of intracellular pH in rat medullary neurons in situ. J. Neurophysiol. 1997, 77, 1844–1852. [Google Scholar] [CrossRef]
- Pan, Z.H.; Zhang, X.; Lipton, S.A. Redox modulation of recombinant human GABA(A) receptors. Neuroscience 2000, 98, 333–338. [Google Scholar] [CrossRef]
- Nakamura, Y.; Darnieder, L.M.; Deeb, T.Z.; Moss, S.J. Regulation of GABAARs by phosphorylation. Adv. Pharmacol. 2015, 72, 97–146. [Google Scholar]
- Hübner, C.A.; Holthoff, K. Anion transport and GABA signaling. Front. Cell Neurosci. 2013, 7, 177. [Google Scholar] [CrossRef] [Green Version]
- Raimondo, J.V.; Richards, B.A.; Woodin, M.A. Neuronal chloride and excitability-the big impact of small changes. Curr. Opin. Neurobiol. 2017, 43, 35–42. [Google Scholar] [CrossRef]
- Rivera, C.; Voipio, J.; Kaila, K. Two developmental switches in GABAergic signalling: The K+–Cl− cotransporter KCC2 and carbonic anhydrase CAVII. J. Physiol. 2005, 562, 27–36. [Google Scholar] [CrossRef]
- Phillips, I.; Martin, K.F.; Thompson, K.S.; Heal, D.J. GABA-evoked depolarisations in the rat cortical wedge: Involvement of GABAA receptors and HCO3− ions. Brain Res. 1998, 798, 330–332. [Google Scholar] [CrossRef]
- Sato, S.S.; Artoni, P.; Landi, S.; Cozzolino, O.; Parra, R.; Pracucci, E.; Trovato, F.; Szczurkowska, J.; Luin, S.; Arosio, D.; et al. Simultaneous two-photon imaging of intracellular chloride concentration and pH in mouse pyramidal neurons in vivo. Proc. Natl. Acad. Sci. USA 2017, 114, 8770–8779. [Google Scholar]
- Lombardi, A.; Jedlicka, P.; Luhmann, H.J.; Kilb, W. Interactions between Membrane Resistance, GABA-A Receptor Properties, Bicarbonate Dynamics and Cl−-Transport Shape Activity-Dependent Changes of Intracellular Cl− Concentration. Int. J. Mol. Sci. 2019, 20, 1416. [Google Scholar] [CrossRef] [Green Version]
- Kühlbrandt, W. Biology, structure and mechanism of P-type ATPases. Nat. Rev. Mol. Cell Biol. 2004, 5, 282–295. [Google Scholar] [CrossRef]
- Mächtel, R.; Narducci, A.; Griffith, D.A.; Cordes, T.; Orelle, C. An integrated transport mechanism of the maltose ABC importer. Res. Microbiol. 2019, 170, 321–337. [Google Scholar] [CrossRef]
- Prieß, M.; Göddeke, H.; Groenhof, G.; Schäfer, L.V. Molecular Mechanism of ATP Hydrolysis in an ABC Transporter. ACS Cent. Sci. 2018, 4, 1334–1343. [Google Scholar] [CrossRef] [Green Version]
- Clausen, J.D.; Bublitz, M.; Arnou, B.; Olesen, C.; Andersen, J.P.; Mølle, J.V.; Nissen, P. Crystal Structure of the Vanadate-Inhibited Ca2+-ATPase. Structure 2016, 24, 617–623. [Google Scholar] [CrossRef] [Green Version]
- Cornelius, F.; Mahmmoud, Y.A.; Toyoshima, C. Metal fluoride complexes of Na+, K+-ATPase: Characterization of fluoride-stabilized phosphoenzyme analogues and their interaction with cardiotonic steroids. J. Biol. Chem. 2011, 286, 29882–29892. [Google Scholar] [CrossRef] [Green Version]
- Locher, K.P. Mechanistic diversity in ATP-binding cassette (ABC) transporters. Nat. Struct. Mol. Biol. 2016, 23, 487–493. [Google Scholar] [CrossRef] [Green Version]
- Sieghart, W.; Sperk, G. Subunit composition, distribution and function of GABA-A receptor subtypes. Curr. Top. Med. Chem. 2002, 2, 795–816. [Google Scholar] [CrossRef]
- Connolly, C.N.; Wooltorton, J.R.; Smart, T.G.; Moss, S.J. Subcellular localization of gamma-aminobutyric acid type A receptors is determined by receptor beta subunits. Proc. Natl. Acad. Sci. USA 1996, 93, 9899–9904. [Google Scholar] [CrossRef] [Green Version]
- Nguyen, Q.A.; Nicoll, R.A. The GABAA Receptor β Subunit Is Required for Inhibitory Transmission. Neuron 2018, 98, 718–725. [Google Scholar] [CrossRef] [Green Version]
- Le Foll, F.; Soriani, O.; Vaudry, H.; Cazin, L. Contribution of changes in the chloride driving force to the fading of IGABA in frog melanotrophs. Am. J. Physiol. Endocrinol. Metab. 2000, 278, E430–E443. [Google Scholar] [CrossRef] [Green Version]
- Heynen, A.J.; Quinlan, E.M.; Bae, D.C.; Bear, M.F. Bidirectional, activity-dependent regulation of glutamate receptors in the adult hippocampus in vivo. Neuron 2000, 28, 527–536. [Google Scholar] [CrossRef] [Green Version]
Figure 1.
Reapplication of GABA causes a desensitization of GABAAR-mediated Cl− influx. (A) Representative images of MQAE fluorescence changes in SNs recorded in response to the first application of GABA (100 μM) and reapplication of GABA (100 μM) in the HCO3−-free experimental medium, without or in the presence of VO43− (20 μM), AlFx (20 μM), or AMP-PNP (2 mM). (B) Bar graph of percentage in MQAE peak fluorescence changes in response to the first application of GABA (100 μM), without or in the presence of bicuculline (50 μM) in an experimental medium (one-way ANOVA, Tukey’s test: F(19) = 6.7, p = 0.005, n = 5). (C) Bar graph of percentage in MQAE peak fluorescence changes in response to reapplication of GABA (100 μM), without or in the presence of bicuculline (50 μM) in an experimental medium (one-way ANOVA, Tukey’s test: F(19) = 142.7, p = 0.0000025, n = 5). (D) Bar graph of percentage in MQAE peak fluorescence changes in response to first application of GABA (100 μM) without or containing NEM (300 μM) in an experimental medium, in the absence or presence of VO43− (20 μM) (one-way ANOVA, Tukey’s test: F(19) = 16.4, p = 0.005 or F(19) = 23.8, p = 0.005, n = 5), respectively. (E) Bar graph of percentage in MQAE peak fluorescence changes in response to reapplication of GABA (100 μM) without or containing NEM (300 μM), in the absence and presence of VO43− in an experimental medium (20 μM) (one-way ANOVA, Tukey’s test: F(19) = 9.1, p = 0.05 or F(19) = 106.2, p = 0.00005, n = 5). All data in the bar graphs in this figure and those proceeding it are presented as mean values +/− SEM; * p < 0.05.

Figure 2.
Bicarbonate hindered the desensitization of GABAAR-mediated Cl− influx. (A) Representative images of MQAE fluorescence changes in SNs recorded in response to first application of GABA (100 μM) and reapplication of GABA (100 μM) in the presence of HCO3− (25 mM) in an experimental medium, without or in the presence of VO43− (20 μM), AlFx (10 μM), or AMP-PNP (2 mM). (B) Bar graph of percentage in MQAE peak fluorescence changes in response to first application of GABA (100 μM), without or in the presence of bicuculline (50 μM) (one-way ANOVA, Tukey’s test: F(6,9) = 47.5, p = 0.00075, n = 7). (C) Bar graph of percentage in MQAE peak fluorescence changes in response to reapplication of GABA (100 μM), without or in the presence of bicuculline (50 μM) (one-way ANOVA, Tukey’s test: F(6,9) = 1.5, p = 0.05, n = 7). (D) Bar graph of percentage in MQAE peak fluorescence changes in response to first application of GABA (100 μM) without or containing NEM (300 μM), in the absence or presence of VO43− (20 μM) in an experimental medium (one-way ANOVA, Tukey’s test: F(9,6) = 23.7, p = 0.0005, n = 6 or F(9,6) = 0.01, p = 0.05, n = 6). (E) Bar graph of percentage in MQAE peak fluorescence changes in response to reapplication of GABA (100 μM) without or containing NEM (300 μM), in the absence or presence of VO43− (20 μM) in an experimental medium (one-way ANOVA, Tukey’s test: F(9,6) = 0.13, p = 0.05, n = 6 or F(9,6) = 0.4, p = 0.05, n = 6). All data in the bar graphs in this figure and those proceeding it are presented as mean values +/− SEM; * p < 0.05.

Figure 3.
Reapplication of GABA did not reveal the desensitization of GABAAR-mediated HCO3− outflux. (A–C) Representative images of BCECF fluorescence changes in SNs recorded in response to first application of GABA (100 μM) and reapplication of GABA (100 μM) in the presence of HCO3− (25 mM) in an experimental medium, without or in the presence of VO43− (20 μM), AlFx (20 μM), or AMP-PNP (2 mM). (D) Bar graph of percentage in BCECF peak fluorescence changes in response to first application of GABA (100 μM), without or in the presence of bicuculline (50 μM) (one-way ANOVA, Tukey’s test: F(9,6) = 130.4, p = 0.000075, n = 6). (E) Bar graph of percentage in BCECF peak fluorescence changes in response to reapplication of GABA (100 μM), without or in the presence of bicuculline (50 μM) (one-way ANOVA, Tukey test: F(9,6) = 58.2, p = 0.00005, n = 6). (F) Bar graph of percentage in BCECF peak fluorescence changes in response to first application of GABA (100 μM) without or containing NEM (300 μM), in the absence or presence of VO43− (20 μM) in an experimental medium (one-way ANOVA, Tukey’s test: F(9,6) = 104.7, p = 0.0000005 or F(9,6) = 4.2, p = 0.05, n = 6), respectively. (G) Bar graph of percentage in BCECF peak fluorescence changes in response to reapplication of GABA (100 μM) without or containing NEM (300 μM), in the absence and presence of VO43− (20 μM) in an experimental medium (one-way ANOVA, Tukey’s test: F(19) = 53.1, p = 0.00005 or F(19) = 0.03, p = 0.05, n = 5), respectively. (H) Bar graph of evaluation of [ATP]i activity before and after the application of HCO3− (25 mM) (one-way ANOVA, Tukey’s test: F(9,6) = 8.9, p = 0.05, n = 5). (I) Bar graph of evaluation of [ATP]i before and after the application of NEM (300 μM) in the absence or presence of VO43− (20 μM) in an experimental medium (one-way ANOVA, Tukey’s test: F(9,6) = 11.0 or F(9,6) = 0,005, p = 0.05, n = 5). All data in the bar graphs in this figure and those proceeding it are presented as mean values +/− SEM; * p < 0.05.

Figure 4.
β3 subunit is responsible for GABAAR resensitization in HEK 293FT cells. (A) Representative images of BCECF fluorescence changes in HEK 293FT cells expressing β3 GABAAR isoform and (B) Western blot analysis binding of VLPs with antibody against GABAAR β3 subunit after expression of GABAAR β3 subunit in HEK 293FT cells. (C) Bar graph of percentage in BCECF peak fluorescence changes in HEK 293FT cells expressing β3 GABAAR isoform recorded in response to first application of GABA (100 μM), without or in the presence of VO43− (20 μM) or AlFx (20 μM) (one-way ANOVA, Tukey’s test: F(19) = 5.0, p = 0.05 or F(19) = 2.18, p = 0.05, n = 5). (D) Bar graph of percentage in BCECF peak fluorescence changes in HEK 293FT cells expressing β3 GABAAR isoform recorded in response in response to second application of GABA (100 μM), without or in the presence of VO43− (20 μM) or AlFx (20 μM) (one-way ANOVA, Tukey’s test: F(19) = 5.0, p = 0.05 or F(19) = 2.18, p = 0.05, n = 5). (E) Bar graph of percentage in BCECF peak fluorescence changes in HEK 293FT cells expressing β3 GABAAR isoform recorded in response to first application of GABA (100 μM), without or in the presence of bicuculline (50 μM) (one-way ANOVA, Tukey’s test: F(19) = 192.5, p = 0.000001, n = 5). (F) Bar graph of percentage in BCECF peak fluorescence changes in HEK 293FT cells expressing β3 GABAAR isoform recorded in response in response to second application of GABA (100 μM), without or in the presence of bicuculline (50 μM) (one-way ANOVA, Tukey’s test: F(19) = 268.0, p = 0.0000005, n = 5). (G) Bar graph of percentage in BCECF peak fluorescence changes in HEK 293FT cells expressing β3 GABAAR isoform recorded in response to first application of GABA (100 μM) without or containing NEM (300 μM), in the absence and presence of VO43− (20 μM) in an experimental medium (one-way ANOVA, Tukey’s test: F(19) = 36.5, p = 0.001 or F(19) = 29.0, p = 0.005, n = 5), respectively. (H) Bar graph of percentage in BCECF peak fluorescence changes in HEK 293FT cells expressing β3 GABAAR isoform recorded in response to first and repeat application of GABA (100 μM) without or containing NEM (300 μM), in the absence and presence of VO43− (20 μM) in an experimental medium (one-way ANOVA, Tukey’s test: F(19) = 5.0, p = 0.05 or F(19) = 2.18, p = 0.05, n = 5), respectively. (I) Bar graph of evaluation of Cl−, HCO3− ATPase activity before and after the application of GABA (100 μM) in HEK 293FT cells expressing β3 GABAAR isoform (one-way ANOVA, Tukey’s test: F(6,9) = 7.84, p = 0.005, n = 7). (J) Western blot analysis binding of VLPs with antibody against GABAAR β3 subunit after expression of mutant (C313A) GABAAR β3 subunit in HEK 293FT cells. (K) Representative images of BCECF fluorescence changes in HEK 293FT cells expressing mutant β3 GABAAR isoform recorded in response to first application of GABA (100 μM) and reapplication of GABA (100 μM) in the presence of HCO3− (25 mM) in an experimental medium. (L) Bar graph of evaluation of Cl−, HCO3− ATPase activity before and after the application of GABA (100 μM) in HEK 293FT cells expressing mutant β3 GABAAR isoform (one-way ANOVA, Tukey’s test: F(0,02) = 7.84, p = 0.005, n = 7). (M) Bar graph of percentage in MQAE peak fluorescence changes in response to first application of GABA (100 μM) in the absence and presence of VO43− (20 μM) or AMP-PNP (2 mM) in an experimental medium (one-way ANOVA, Tukey’s test, n = 5), respectively. (N) Bar graph of percentage in MQAE peak fluorescence changes in response to reapplication of GABA (100 μM) in the absence and presence of VO43− (20 μM) or AMP-PNP (2 mM) in an experimental medium (one-way ANOVA, Tukey’s test, n = 5), respectively. All data in the bar graphs in this figure and those proceeding it are presented as mean values +/− SEM; * p < 0.05.

Figure 5.
The reconstituted Cl−, HCO3− ATPase responsible for GABAAR resensitization. (A) Representative images of MQAE fluorescence changes in the proteoliposomes recorded in response to addition of Mg2+-ATP (2 mM) before or after first and repeated application of GABA (100 μM) in an experimental medium in the presence or absence of HCO3− (25 mM). (B) Bar graph of percentage in MQAE peak fluorescence changes in the proteoliposomes recorded in response to first application of GABA (100 μM), without or in the presence of VO43− (20 μM), AlFx (20 μM), or AMP-PNP (2 mM) in an experimental medium (one-way ANOVA, Tukey’s test: F(18,5) = 239.0, p = 0.0000005, n = 4). (C) Bar graph of percentage in MQAE peak fluorescence changes in the proteoliposomes recorded in response to first application of GABA (100 μM), without or in the presence of VO43− (20 μM), AlFx (20 μM), or AMP-PNP (2 mM) in an experimental medium (one-way ANOVA, Tukey’s test: F(18,5) = 65.0, p = 0.00001, n = 4). (D) Bar graph of evaluation of Cl− ATPase or Cl−, HCO3− ATPase activity before and after addition of AMP-PNP (2 mM) or VO43− (20 μM) (one-way ANOVA, Tukey’s test: F(9,6) = 7.84, p = 0.005, n = 6). (E) Bar graph of evaluation of Cl−, HCO3− ATPase activity before and after the application of NEM (300 μM) without or in the presence of VO43− (20 μM) (one-way ANOVA, Tukey’s test: F(9,6) = 7.84, p = 0.005, n = 6). All data in the bar graphs in this figure and those proceeding it are presented as mean values +/− SEM; * p < 0.05.

Figure 6.
Bicarbonate preferentially stabilized GABAAR via ATPase performance. Model showing four basic conformation states that depict the GABAAR function: a resting state; an open state; a desensitization state; and a resensitization state. In an HCO3−-free experimental medium, fist application of GABA shifted the equilibrium from resting state to high-affinity open state, and repeat application of agonist induced GABAAR desensitization. In contrast, in the presence of HCO3− (25 mM) in an experimental medium, first application of GABA induced the changes in the conformation of channel and shifted the equilibrium from resting state to high-affinity open state, whereas the reapplication of agonist induced GABAAR resensitization by β3-coupled ATPase operation.

Publisher’s Note: MDPI stays neutral with regard to jurisdictional claims in published maps and institutional affiliations. |
© 2022 by the authors. Licensee MDPI, Basel, Switzerland. This article is an open access article distributed under the terms and conditions of the Creative Commons Attribution (CC BY) license (https://creativecommons.org/licenses/by/4.0/).
Share and Cite
MDPI and ACS Style
Menzikov, S.A.; Zaichenko, D.M.; Moskovtsev, A.A.; Morozov, S.G.; Kubatiev, A.A. Physiological Role of ATPase for GABAA Receptor Resensitization. Int. J. Mol. Sci. 2022, 23, 5320. https://doi.org/10.3390/ijms23105320
AMA Style
Menzikov SA, Zaichenko DM, Moskovtsev AA, Morozov SG, Kubatiev AA. Physiological Role of ATPase for GABAA Receptor Resensitization. International Journal of Molecular Sciences. 2022; 23(10):5320. https://doi.org/10.3390/ijms23105320
Chicago/Turabian StyleMenzikov, Sergey A., Danila M. Zaichenko, Aleksey A. Moskovtsev, Sergey G. Morozov, and Aslan A. Kubatiev. 2022. "Physiological Role of ATPase for GABAA Receptor Resensitization" International Journal of Molecular Sciences 23, no. 10: 5320. https://doi.org/10.3390/ijms23105320
Note that from the first issue of 2016, this journal uses article numbers instead of page numbers. See further details here.