
Differences and Interactions in Placental Manganese and Iron Transfer across an In Vitro Model of Human Villous Trophoblasts

 , and
, and 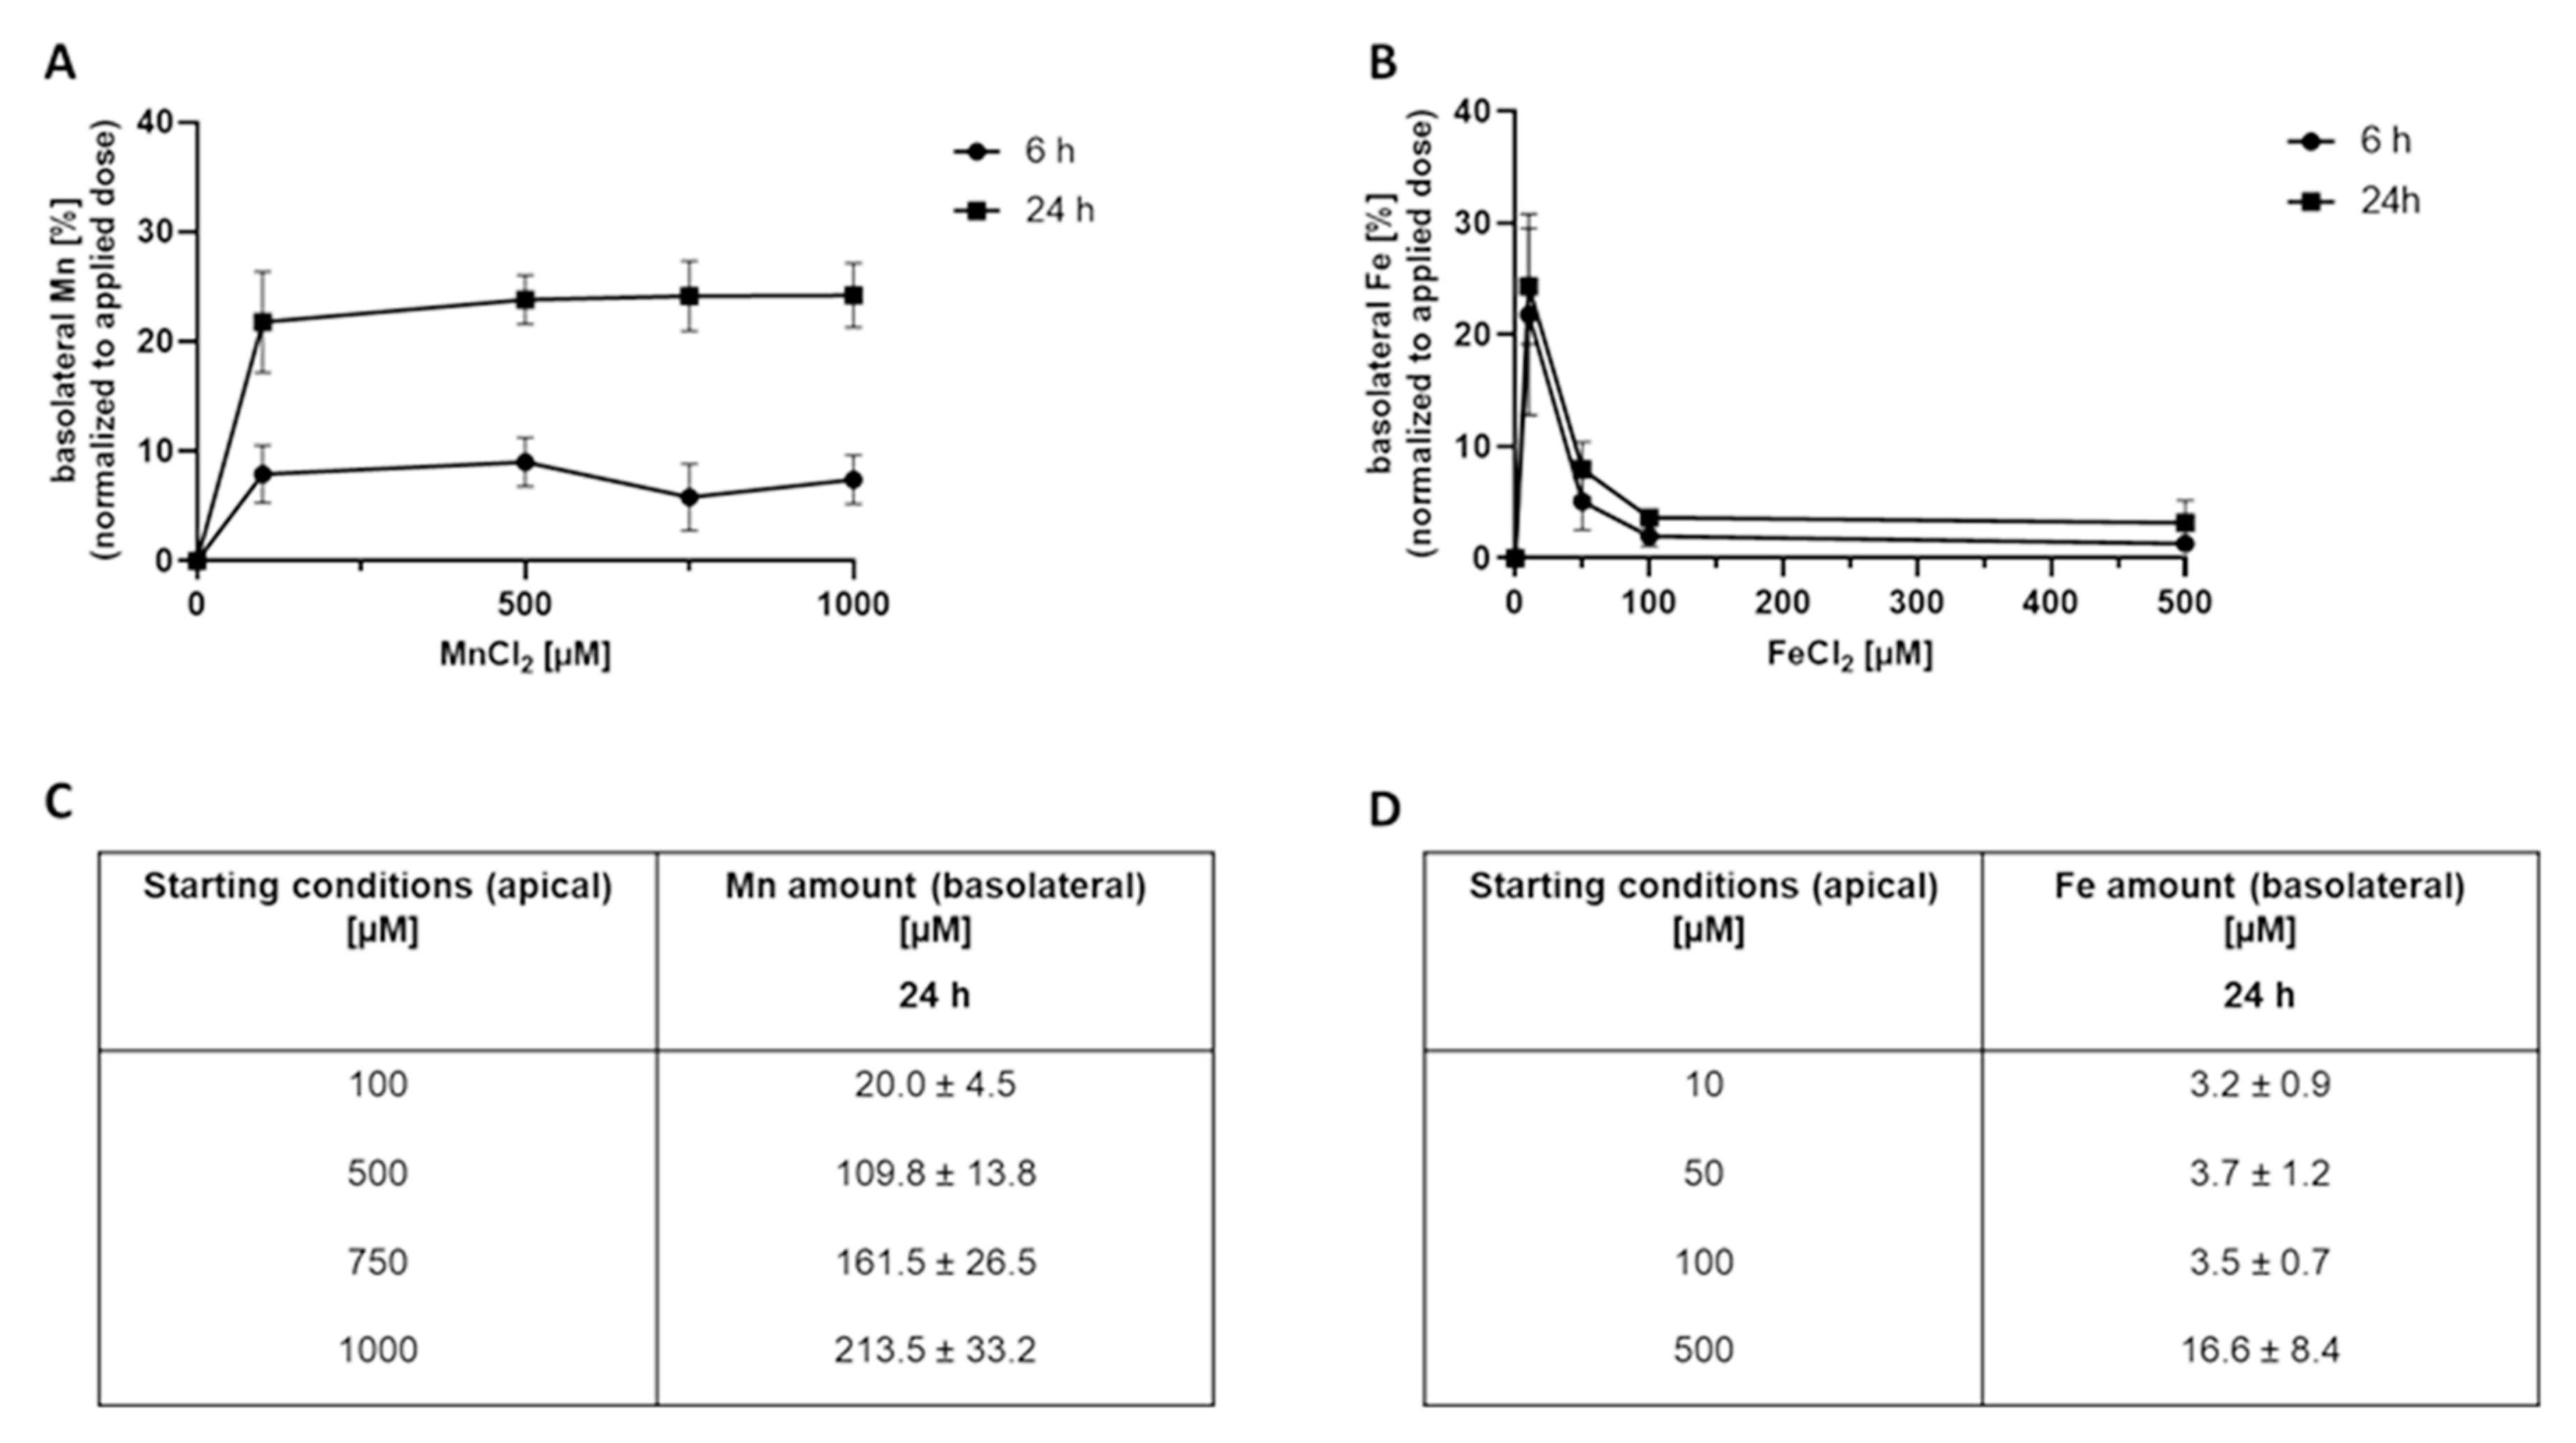
Abstract
:1. Introduction
2. Results
2.1. Mn and Fe Cytotoxicity in Confluent BeWo b30 Cells
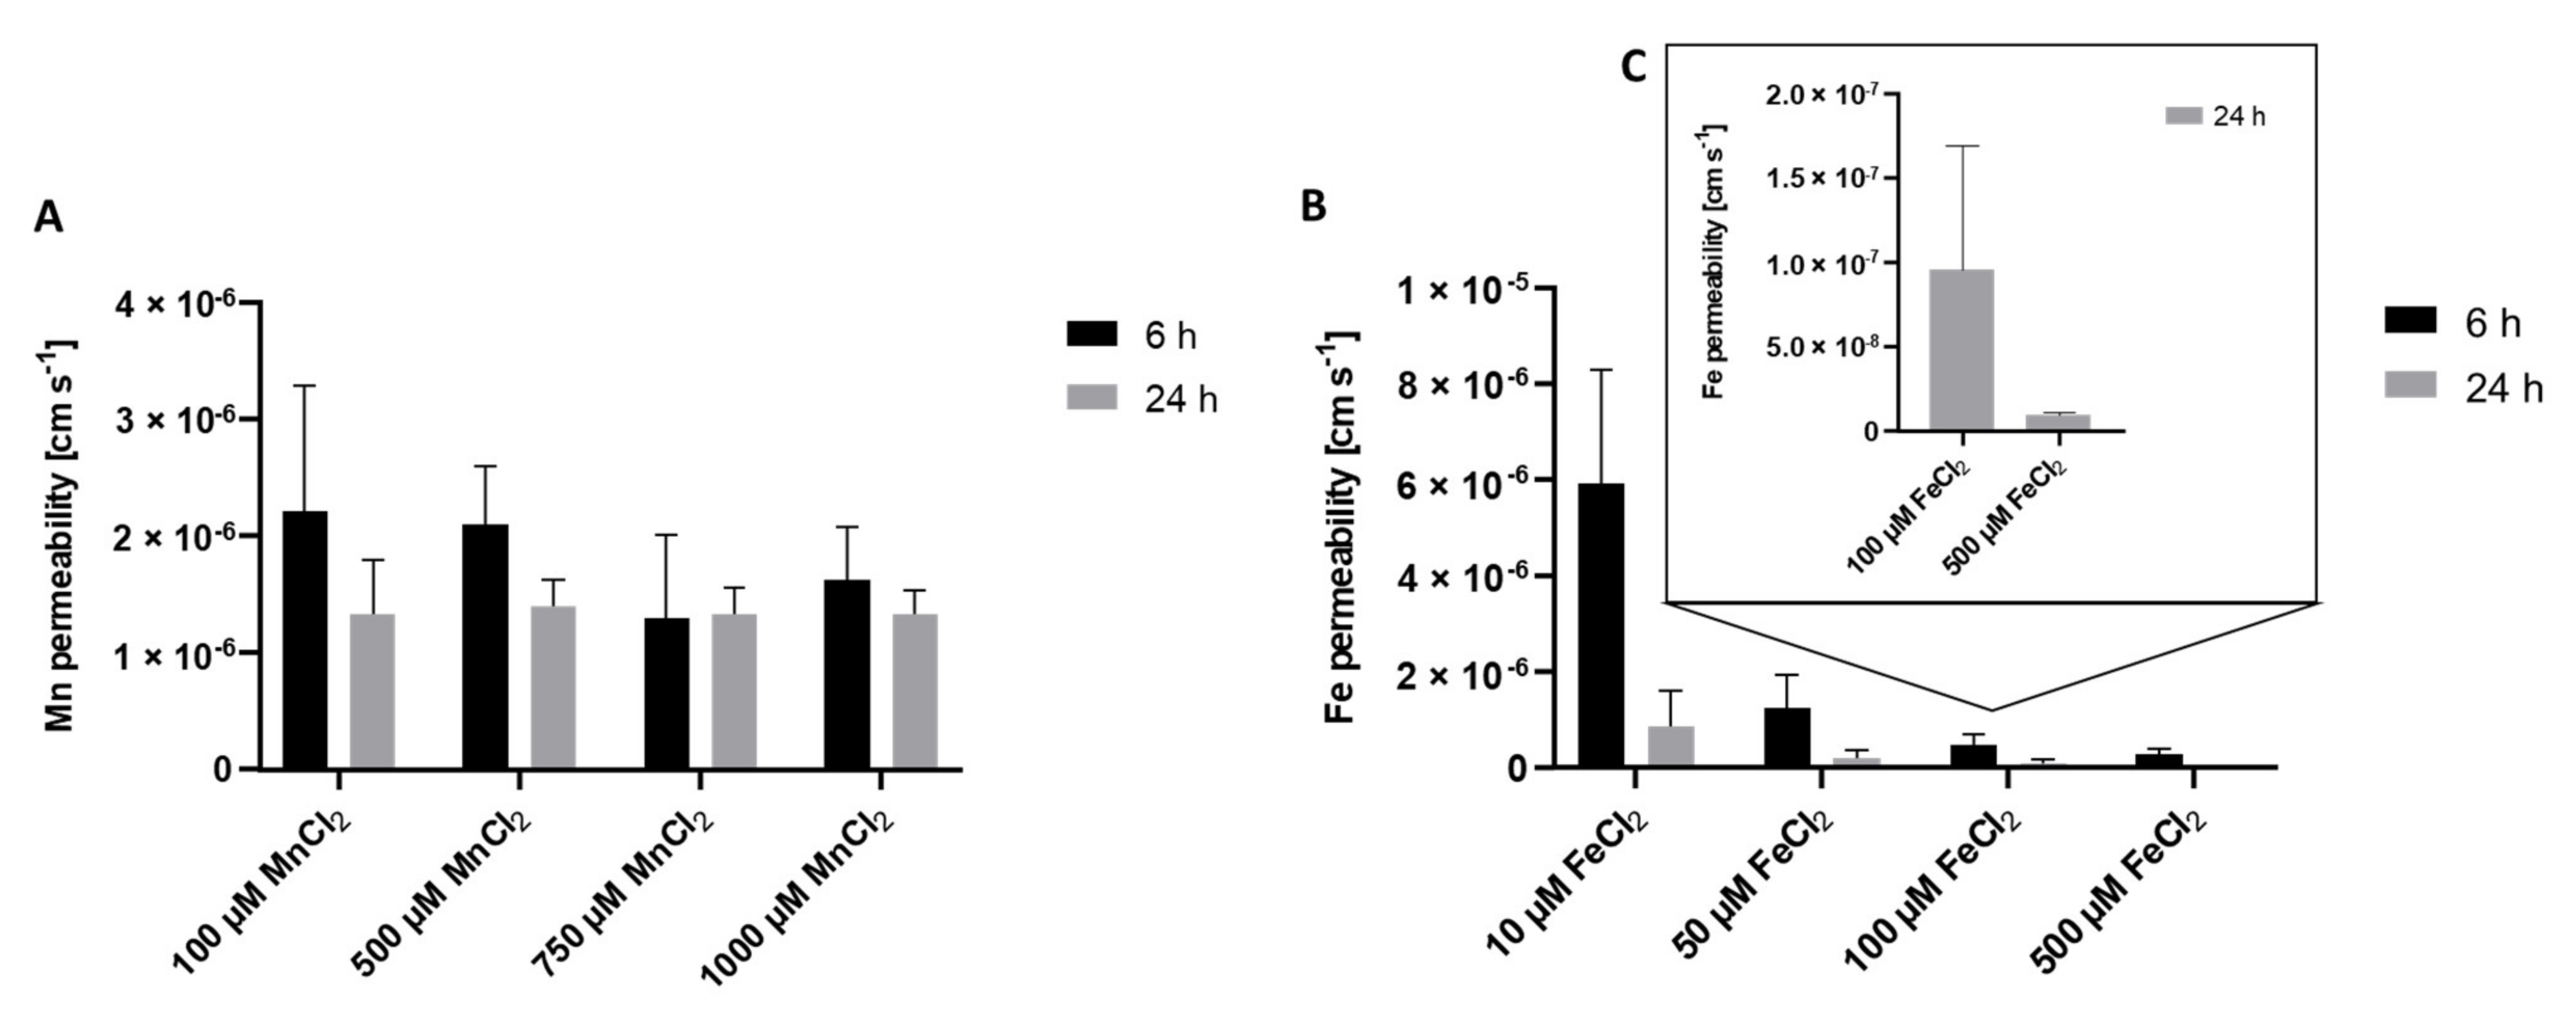
2.2. Mn and Fe Transfer across the BeWo b30 Cell Layer
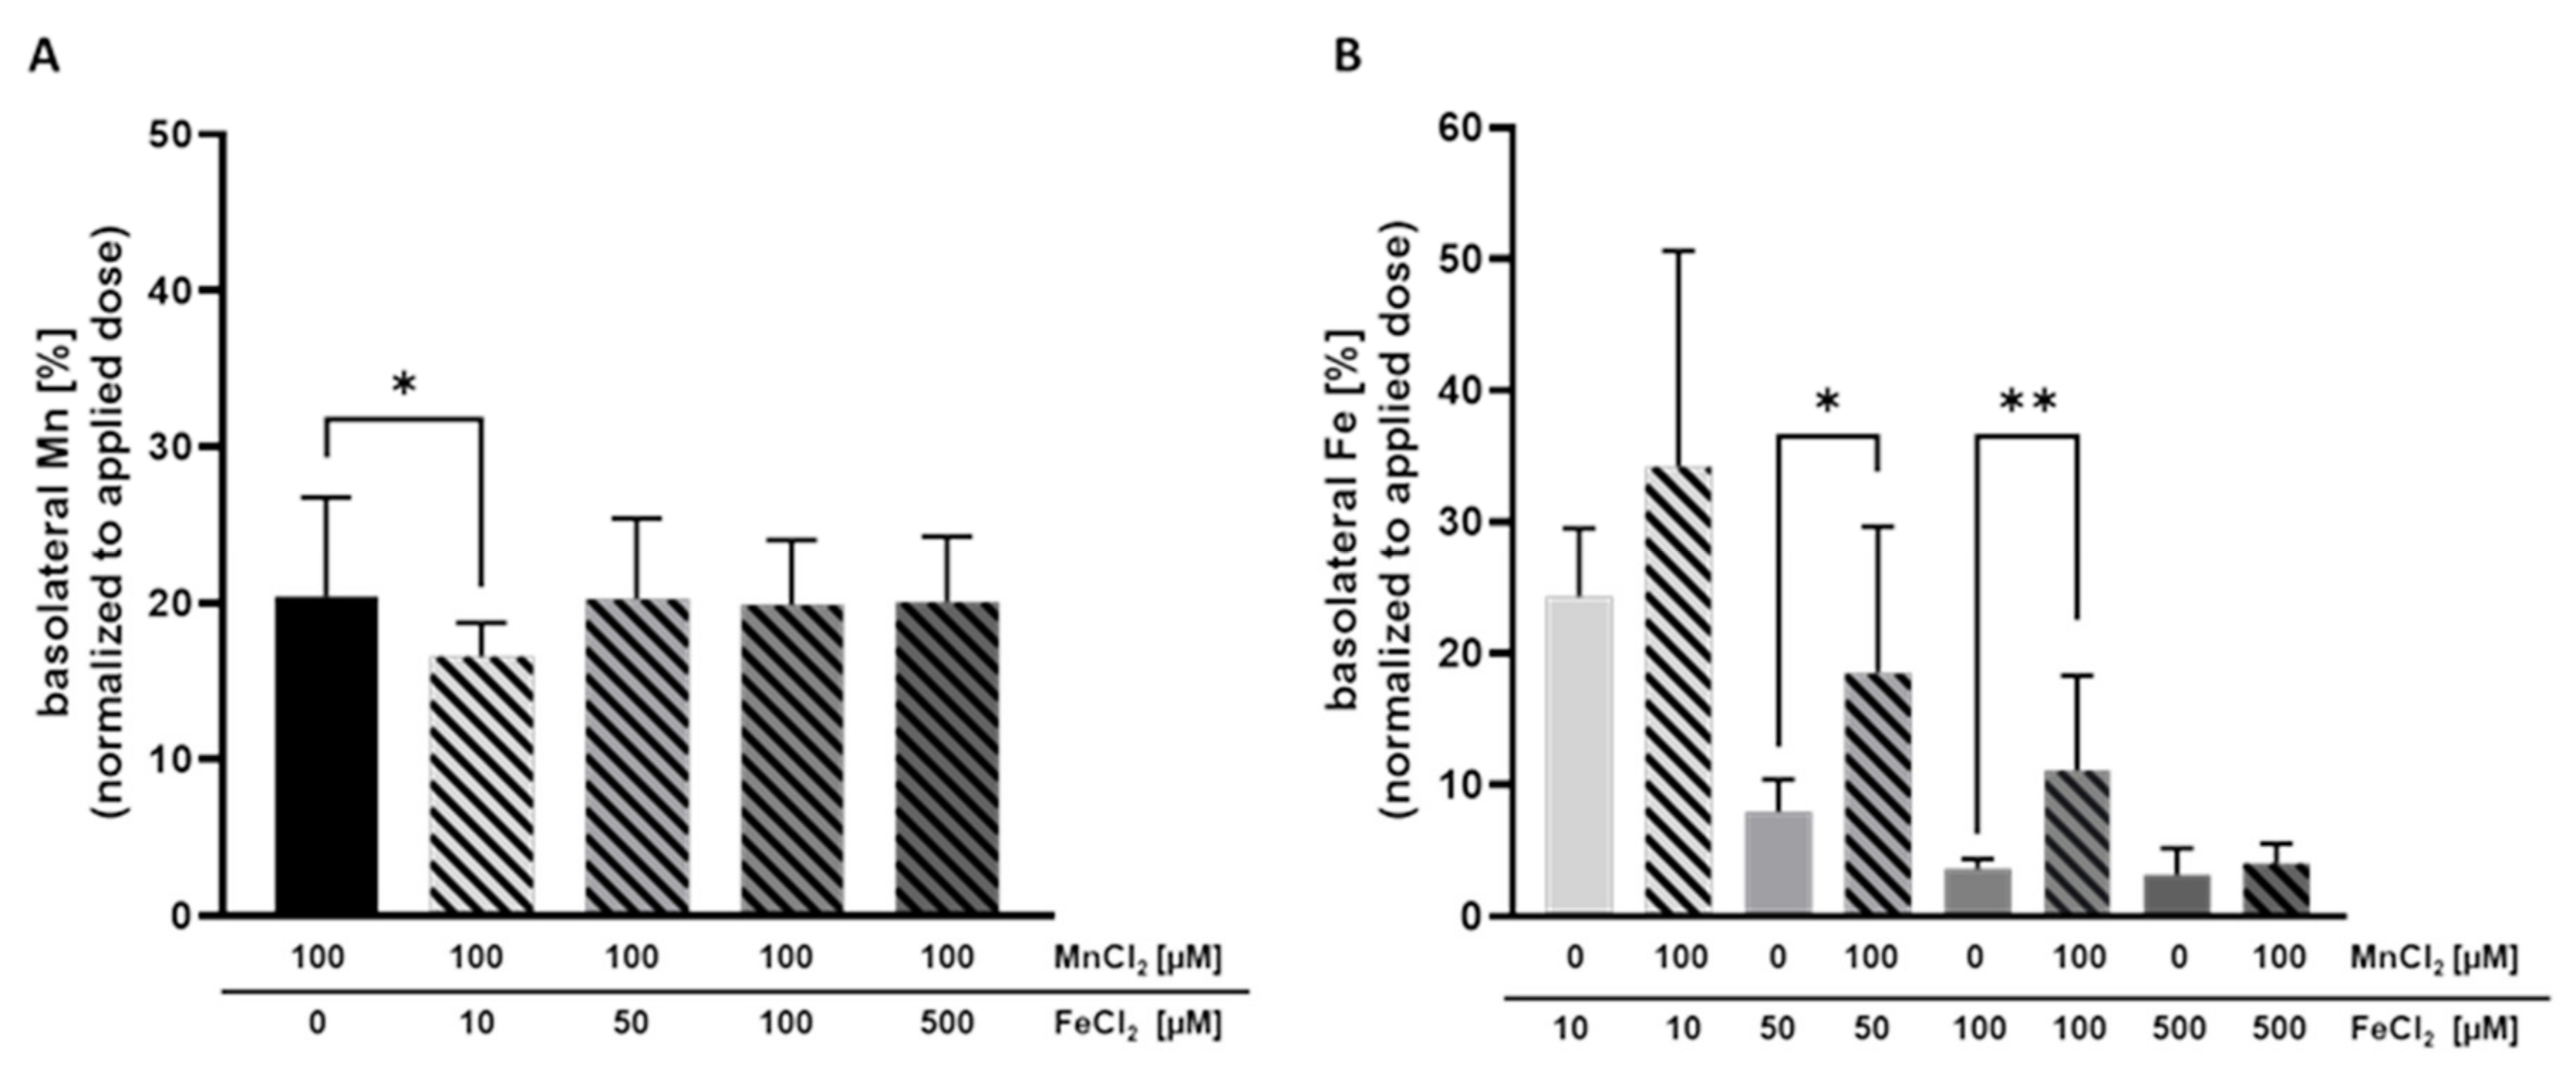
2.3. Mn and Fe Transfer Interactions
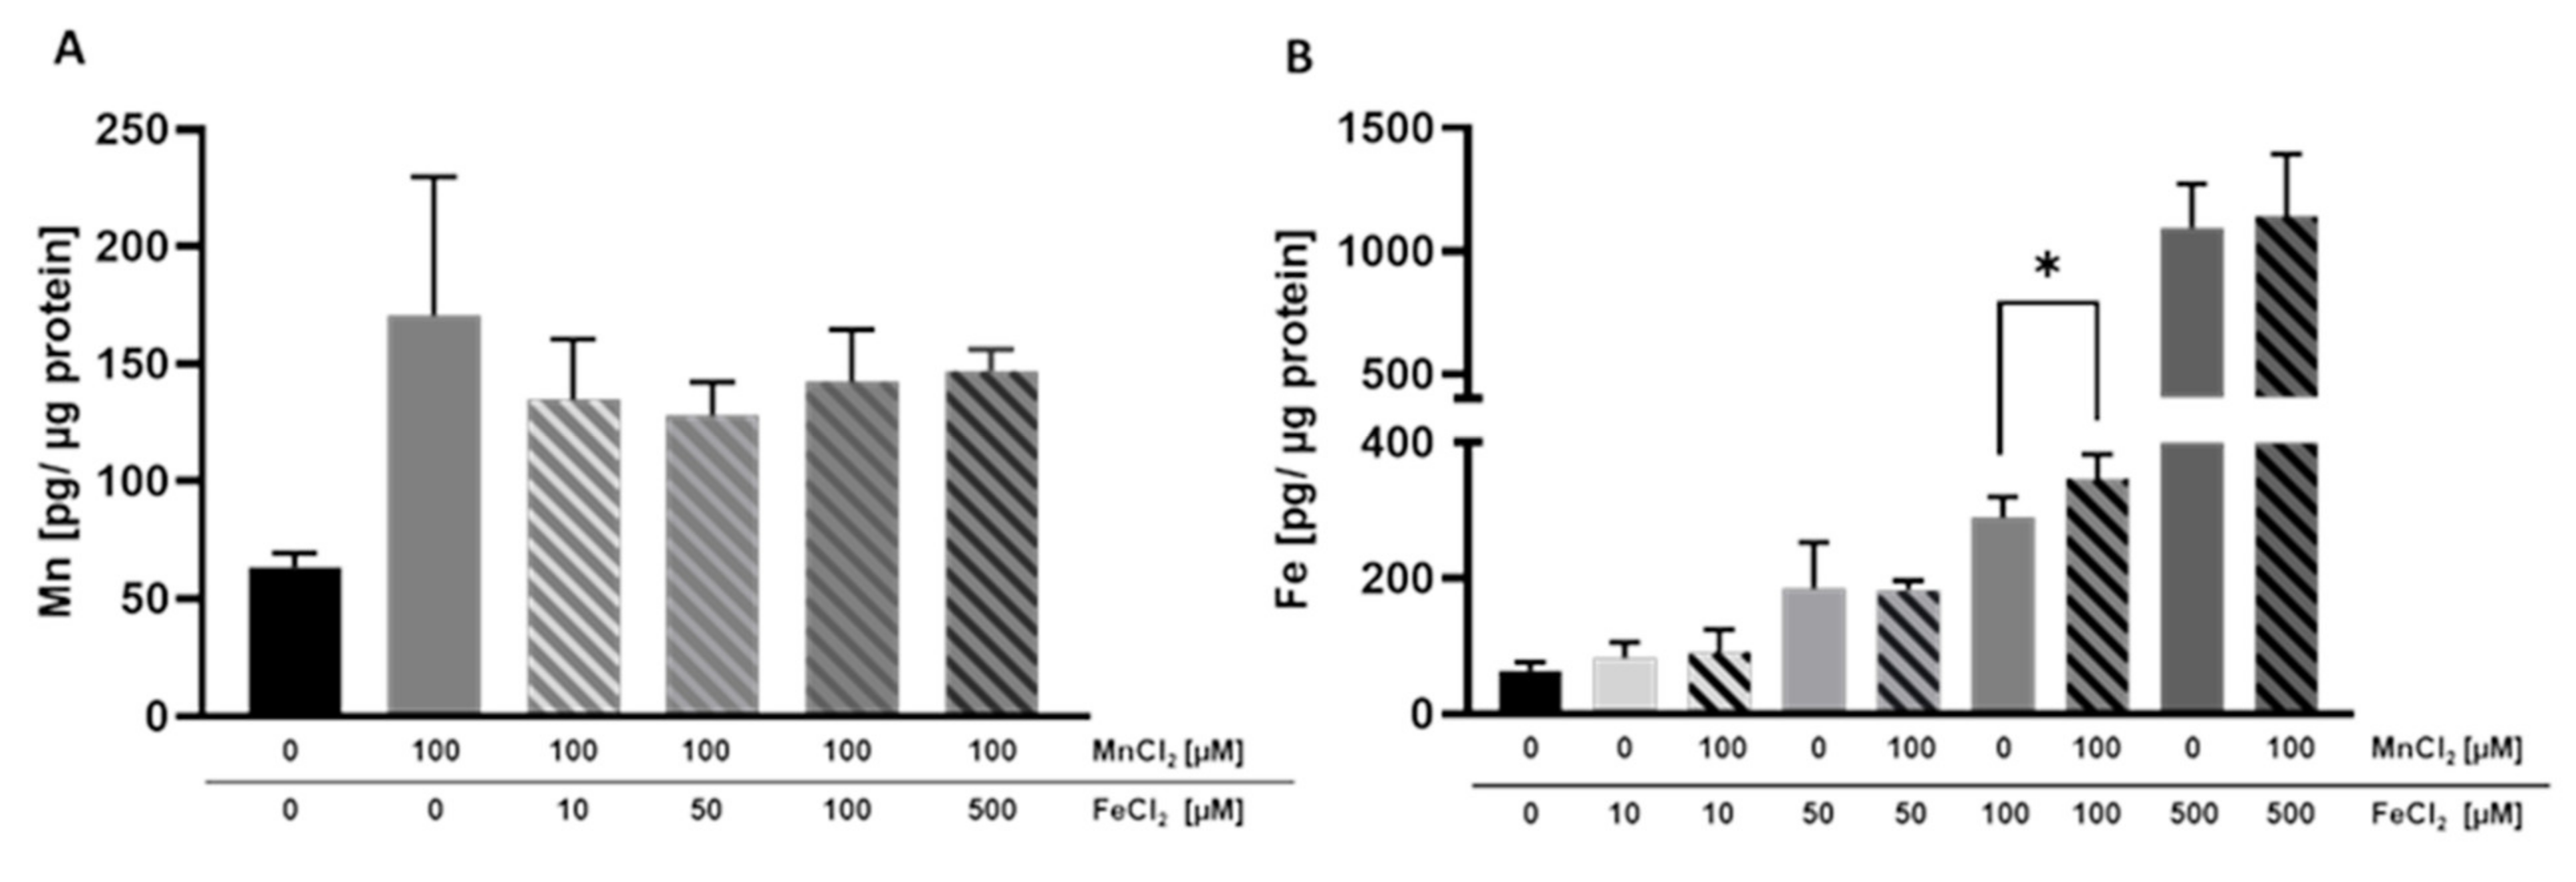
2.4. Cellular Amount of Mn and Fe
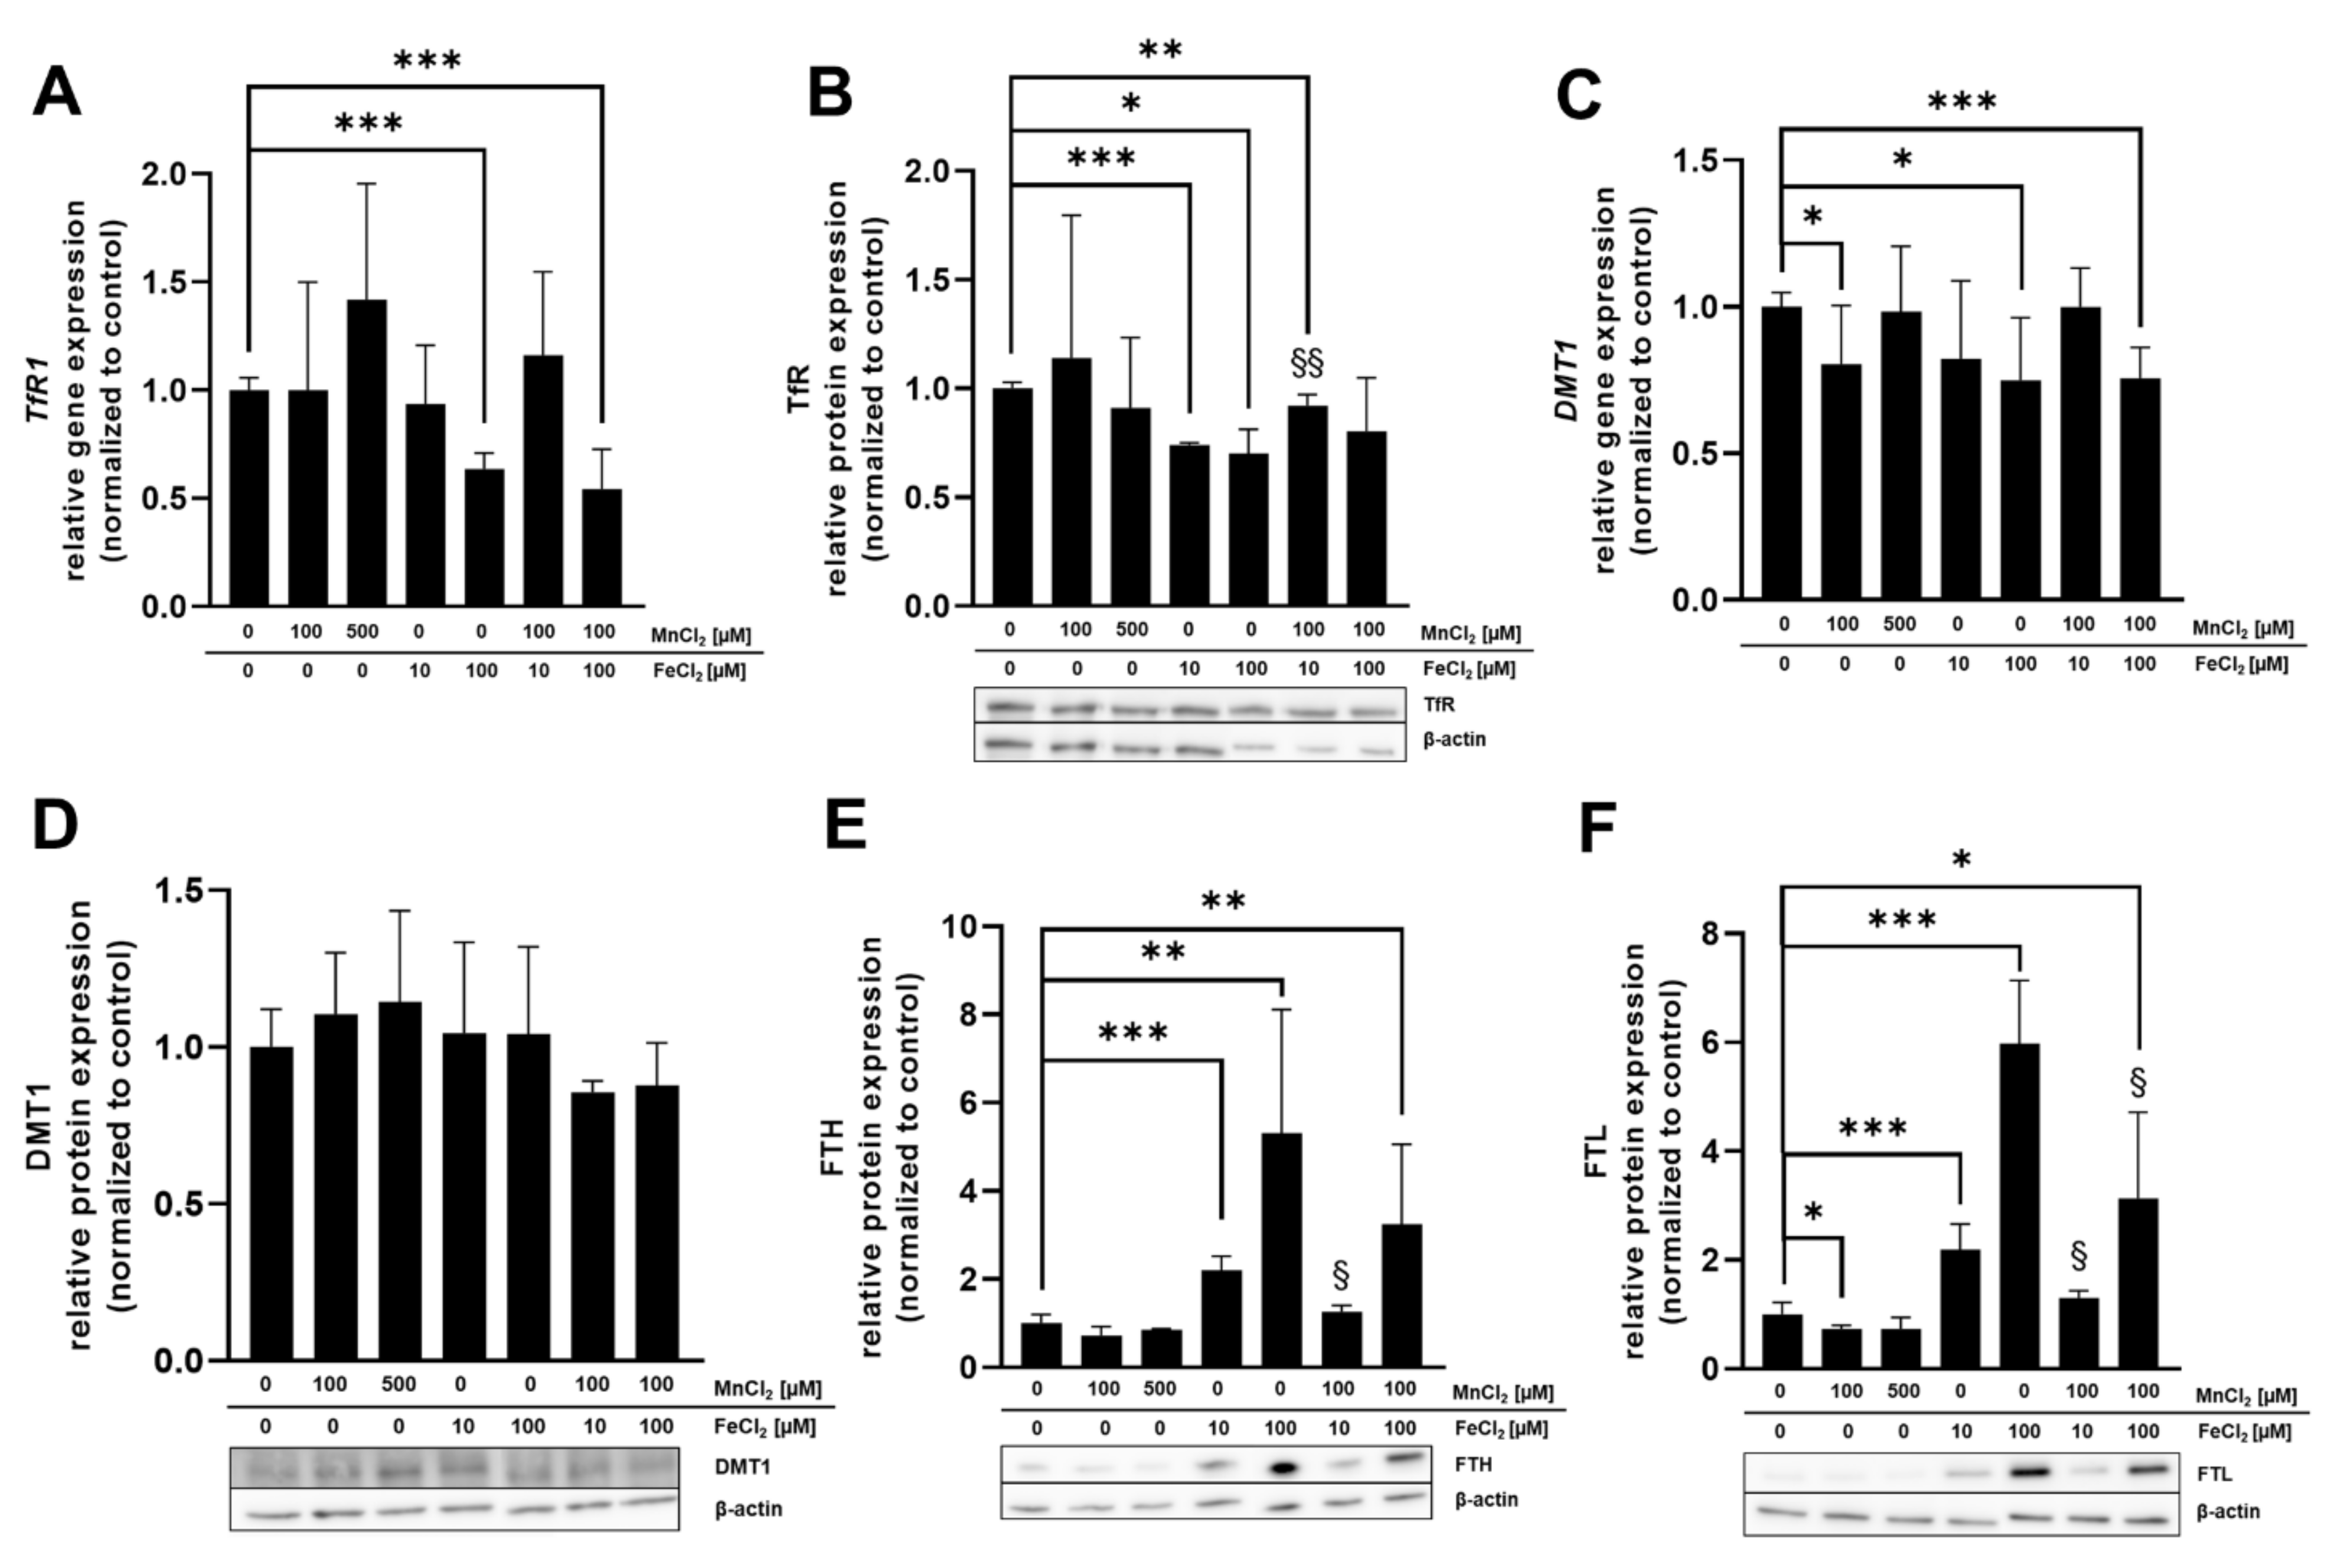
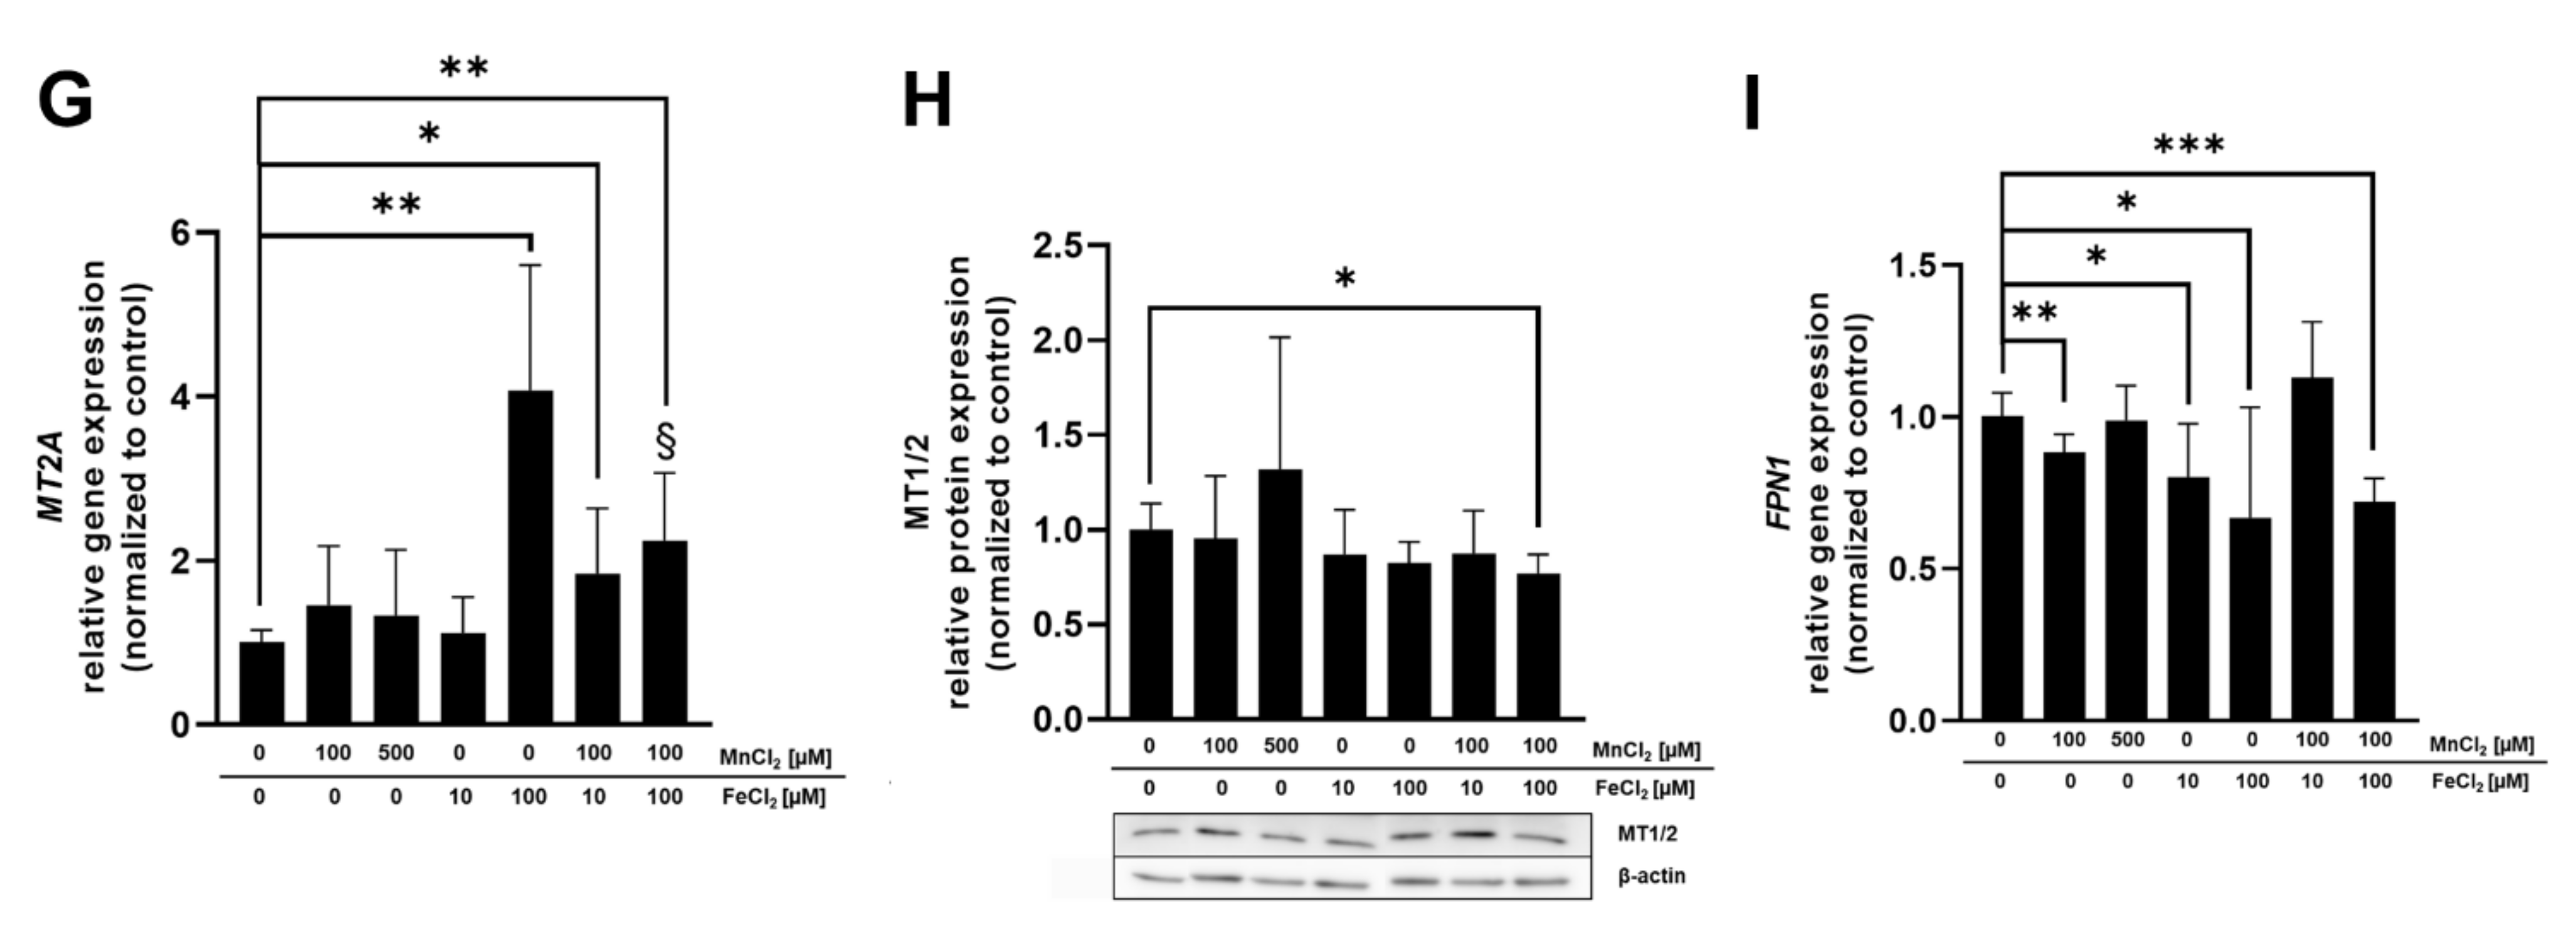
2.5. mRNA and Protein Expression of Mn and Fe Associated Genes and Related Proteins
3. Discussion
4. Conclusions and Outlook
5. Materials and Methods
5.1. Cultivation of BeWo b30 Cells
5.2. Cytotoxicity Testing for Dosage Regimen
5.3. Mn and Fe Transfer across the BeWo b30 Cell Layer
5.4. Transporter Inhibition Study
5.5. Quantitative Real-Time PCR Analysis
5.6. Western Blot Analysis
5.7. Statistical Analysis
Supplementary Materials
Author Contributions
Funding
Institutional Review Board Statement
Informed Consent Statement
Data Availability Statement
Acknowledgments
Conflicts of Interest
References
- Mezzaroba, L.; Alfieri, D.F.; Colado Simão, A.N.; Vissoci Reiche, E.M. The role of zinc, copper, manganese and iron in neurodegenerative diseases. NeuroToxicology 2019, 74, 230–241. [Google Scholar] [CrossRef] [PubMed]
- Wang, W.; Zhao, F.; Ma, X.; Perry, G.; Zhu, X. Mitochondria dysfunction in the pathogenesis of Alzheimer’s disease: Recent advances. Mol. Neurodegener. 2020, 15, 30. [Google Scholar] [CrossRef] [PubMed]
- Chevion, M. A site-specific mechanism for free radical induced biological damage: The essential role of redox-active transition metals. Free Radic. Biol. Med. 1988, 5, 27–37. [Google Scholar] [CrossRef]
- Farina, M.; Avila, D.S.; da Rocha, J.B.; Aschner, M. Metals, oxidative stress and neurodegeneration: A focus on iron, manganese and mercury. Neurochem. Int. 2013, 62, 575–594. [Google Scholar] [CrossRef] [PubMed] [Green Version]
- Rock, K.D.; Patisaul, H.B. Environmental Mechanisms of Neurodevelopmental Toxicity. Curr. Environ. Health Rep. 2018, 5, 145–157. [Google Scholar] [CrossRef]
- Ek, C.J.; Dziegielewska, K.M.; Habgood, M.D.; Saunders, N.R. Barriers in the developing brain and Neurotoxicology. Neurotoxicology 2012, 33, 586–604. [Google Scholar] [CrossRef]
- Gude, N.M.; Roberts, C.T.; Kalionis, B.; King, R.G. Growth and function of the normal human placenta. Thromb. Res. 2004, 114, 397–407. [Google Scholar] [CrossRef]
- Rubinchik-Stern, M.; Eyal, S. Drug Interactions at the Human Placenta: What is the Evidence? Front. Pharmacol. 2012, 3, 126. [Google Scholar] [CrossRef] [Green Version]
- Sangkhae, V.; Nemeth, E. Placental iron transport: The mechanism and regulatory circuits. Free Radic. Biol. Med. 2019, 133, 254–261. [Google Scholar] [CrossRef]
- Cao, C.; Fleming, M.D. The placenta: The forgotten essential organ of iron transport. Nutr. Rev. 2016, 74, 421–431. [Google Scholar] [CrossRef] [Green Version]
- Hurley, L.S. The roles of trace elements in foetal and neonatal development. Philos. Trans. R. Soc. Lond. B Biol. Sci. 1981, 294, 145–152. [Google Scholar] [CrossRef] [PubMed]
- Chen, P.; Bornhorst, J.; Aschner, M. Manganese metabolism in humans. Front. Biosci. 2018, 23, 1655–1679. [Google Scholar] [CrossRef] [PubMed] [Green Version]
- Balachandran, R.C.; Mukhopadhyay, S.; McBride, D.; Veevers, J.; Harrison, F.E.; Aschner, M.; Haynes, E.N.; Bowman, A.B. Brain manganese and the balance between essential roles and neurotoxicity. J. Biol. Chem. 2020, 295, 6312–6329. [Google Scholar] [CrossRef] [Green Version]
- EFSA Panel on Dietetic Products, Nutrition and Allergies (NDA). Scientific Opinion on Dietary Reference Values for manganese. EFSA J. 2013, 11, 3419. [Google Scholar] [CrossRef] [Green Version]
- Nandakumaran, M.; Al-Sannan, B.; Al-Sarraf, H.; Al-Shammari, M. Maternal-fetal transport kinetics of manganese in perfused human placental lobule in vitro. J. Matern. Fetal Neonatal Med. 2016, 29, 274–278. [Google Scholar] [CrossRef]
- Liu, J.; Jin, L.; Zhang, L.; Li, Z.; Wang, L.; Ye, R.; Zhang, Y.; Ren, A. Placental concentrations of manganese and the risk of fetal neural tube defects. J. Trace Elem. Med. Biol. 2013, 27, 322–325. [Google Scholar] [CrossRef]
- Takser, L.; Mergler, D.; Hellier, G.; Sahuquillo, J.; Huel, G. Manganese, monoamine metabolite levels at birth, and child psychomotor development. Neurotoxicology 2003, 24, 667–674. [Google Scholar] [CrossRef]
- Claus Henn, B.; Bellinger, D.C.; Hopkins, M.R.; Coull, B.A.; Ettinger, A.S.; Jim, R.; Hatley, E.; Christiani, D.C.; Wright, R.O. Maternal and Cord Blood Manganese Concentrations and Early Childhood Neurodevelopment among Residents near a Mining-Impacted Superfund Site. Environ. Health Perspect. 2017, 125, 067020. [Google Scholar] [CrossRef] [Green Version]
- Kupsco, A.; Estrada-Gutierrez, G.; Cantoral, A.; Schnaas, L.; Pantic, I.; Amarasiriwardena, C.; Svensson, K.; Bellinger, D.C.; Téllez-Rojo, M.M.; Baccarelli, A.A.; et al. Modification of the effects of prenatal manganese exposure on child neurodevelopment by maternal anemia and iron deficiency. Pediatr. Res. 2020, 88, 325–333. [Google Scholar] [CrossRef]
- De Water, E.; Papazaharias, D.M.; Ambrosi, C.; Mascaro, L.; Iannilli, E.; Gasparotti, R.; Lucchini, R.G.; Austin, C.; Arora, M.; Tang, C.Y.; et al. Early-life dentine manganese concentrations and intrinsic functional brain connectivity in adolescents: A pilot study. PLoS ONE 2019, 14, e0220790. [Google Scholar] [CrossRef] [Green Version]
- Institute of Medicine. Dietary Reference Intakes for Vitamin A, Vitamin K, Arsenic, Boron, Chromium, Copper, Iodine, Iron, Manganese, Molybdenum, Nickel, Silicon, Vanadium, and Zinc; The National Academies Press: Washington, DC, USA, 2001; p. 800. [Google Scholar]
- Duck, K.A.; Connor, J.R. Iron uptake and transport across physiological barriers. Biometals 2016, 29, 573–591. [Google Scholar] [CrossRef] [PubMed] [Green Version]
- Krachler, M.; Rossipal, E.; Micetic-Turk, D. Trace element transfer from the mother to the newborn—Investigations on triplets of colostrum, maternal and umbilical cord sera. Eur. J. Clin. Nutr. 1999, 53, 486–494. [Google Scholar] [CrossRef] [PubMed] [Green Version]
- Smith, E.R.; He, S.; Klatt, K.C.; Barberio, M.D.; Rahnavard, A.; Azad, N.; Brandt, C.; Harker, B.; Hogan, E.; Kucherlapaty, P.; et al. Limited data exist to inform our basic understanding of micronutrient requirements in pregnancy. Sci. Adv. 2021, 7, eabj8016. [Google Scholar] [CrossRef] [PubMed]
- Erikson, K.M.; Thompson, K.; Aschner, J.; Aschner, M. Manganese neurotoxicity: A focus on the neonate. Pharmacol. Ther. 2007, 113, 369–377. [Google Scholar] [CrossRef] [Green Version]
- Ye, Q.; Park, J.E.; Gugnani, K.; Betharia, S.; Pino-Figueroa, A.; Kim, J. Influence of iron metabolism on manganese transport and toxicity. Metallomics 2017, 9, 1028–1046. [Google Scholar] [CrossRef]
- Aengenheister, L.; Keevend, K.; Muoth, C.; Schonenberger, R.; Diener, L.; Wick, P.; Buerki-Thurnherr, T. An advanced human in vitro co-culture model for translocation studies across the placental barrier. Sci. Rep. 2018, 8, 5388. [Google Scholar] [CrossRef] [Green Version]
- Heaton, S.J.; Eady, J.J.; Parker, M.L.; Gotts, K.L.; Dainty, J.R.; Fairweather-Tait, S.J.; McArdle, H.J.; Srai, K.S.; Elliott, R.M. The use of BeWo cells as an in vitro model for placental iron transport. Am. J. Physiol. Cell Physiol. 2008, 295, C1445–C1453. [Google Scholar] [CrossRef] [PubMed] [Green Version]
- Li, H.; van Ravenzwaay, B.; Rietjens, I.M.; Louisse, J. Assessment of an in vitro transport model using BeWo b30 cells to predict placental transfer of compounds. Arch. Toxicol. 2013, 87, 1661–1669. [Google Scholar] [CrossRef]
- Bastin, J.; Drakesmith, H.; Rees, M.; Sargent, I.; Townsend, A. Localisation of proteins of iron metabolism in the human placenta and liver. Br. J. Haematol. 2006, 134, 532–543. [Google Scholar] [CrossRef]
- Nikulin, S.V.; Knyazev, E.N.; Gerasimenko, T.N.; Shilin, S.A.; Gazizov, I.N.; Zakharova, G.S.; Poloznikov, A.A.; Sakharov, D.A. [Impedance Spectroscopy and Transcriptome Analysis of Choriocarcinoma BeWo b30 as a Model of Human Placenta]. Mol. Biol. 2019, 53, 467–475. [Google Scholar] [CrossRef]
- Widhalm, R.; Ellinger, I.; Granitzer, S.; Forsthuber, M.; Bajtela, R.; Gelles, K.; Hartig, P.Y.; Hengstschläger, M.; Zeisler, H.; Salzer, H.; et al. Human placental cell line HTR-8/SVneo accumulates cadmium by divalent metal transporters DMT1 and ZIP14. Metallomics 2020, 12, 1822–1833. [Google Scholar] [CrossRef] [PubMed]
- Kallol, S.; Moser-Haessig, R.; Ontsouka, C.E.; Albrecht, C. Comparative expression patterns of selected membrane transporters in differentiated BeWo and human primary trophoblast cells. Placenta 2018, 72–73, 48–52. [Google Scholar] [CrossRef] [PubMed]
- Prouillac, C.; Lecoeur, S. The role of the placenta in fetal exposure to xenobiotics: Importance of membrane transporters and human models for transfer studies. Drug Metab. Dispos. 2010, 38, 1623–1635. [Google Scholar] [CrossRef] [PubMed] [Green Version]
- Poulsen, M.S.; Rytting, E.; Mose, T.; Knudsen, L.E. Modeling placental transport: Correlation of in vitro BeWo cell permeability and ex vivo human placental perfusion. Toxicol. Vitr. 2009, 23, 1380–1386. [Google Scholar] [CrossRef]
- Liu, F.; Soares, M.J.; Audus, K.L. Permeability properties of monolayers of the human trophoblast cell line BeWo. Am. J. Physiol. 1997, 273, C1596–C1604. [Google Scholar] [CrossRef]
- Faust, J.J.; Zhang, W.; Chen, Y.; Capco, D.G. Alpha-Fe2O3 elicits diameter-dependent effects during exposure to an in vitro model of the human placenta. Cell Biol. Toxicol. 2014, 30, 31–53. [Google Scholar] [CrossRef]
- Bornhorst, J.; Wehe, C.A.; Huwel, S.; Karst, U.; Galla, H.J.; Schwerdtle, T. Impact of manganese on and transfer across blood-brain and blood-cerebrospinal fluid barrier in vitro. J. Biol. Chem. 2012, 287, 17140–17151. [Google Scholar] [CrossRef] [Green Version]
- Li, X.; Xie, J.; Lu, L.; Zhang, L.; Zhang, L.; Zou, Y.; Wang, Q.; Luo, X.; Li, S. Kinetics of manganese transport and gene expressions of manganese transport carriers in Caco-2 cell monolayers. Biometals 2013, 26, 941–953. [Google Scholar] [CrossRef]
- Aschner, M. The transport of manganese across the blood-brain barrier. Neurotoxicology 2006, 27, 311–314. [Google Scholar] [CrossRef]
- Chen, P.; Chakraborty, S.; Mukhopadhyay, S.; Lee, E.; Paoliello, M.M.; Bowman, A.B.; Aschner, M. Manganese homeostasis in the nervous system. J. Neurochem. 2015, 134, 601–610. [Google Scholar] [CrossRef] [Green Version]
- Yoon, M.; Nong, A.; Clewell, H.J., 3rd; Taylor, M.D.; Dorman, D.C.; Andersen, M.E. Evaluating placental transfer and tissue concentrations of manganese in the pregnant rat and fetuses after inhalation exposures with a PBPK model. Toxicol. Sci. 2009, 112, 44–58. [Google Scholar] [CrossRef] [Green Version]
- Natoli, M.; Felsani, A.; Ferruzza, S.; Sambuy, Y.; Canali, R.; Scarino, M.L. Mechanisms of defence from Fe(II) toxicity in human intestinal Caco-2 cells. Toxicol. Vitr. 2009, 23, 1510–1515. [Google Scholar] [CrossRef] [PubMed]
- Casanueva, E.; Viteri, F.E. Iron and oxidative stress in pregnancy. J. Nutr. 2003, 133, 1700s–1708s. [Google Scholar] [CrossRef]
- Walker, O.S.; Ragos, R.; Wong, M.K.; Adam, M.; Cheung, A.; Raha, S. Reactive oxygen species from mitochondria impacts trophoblast fusion and the production of endocrine hormones by syncytiotrophoblasts. PLoS ONE 2020, 15, e0229332. [Google Scholar] [CrossRef] [PubMed]
- Mikelson, C.K.; Troisi, J.; LaLonde, A.; Symes, S.J.K.; Thurston, S.W.; DiRe, L.M.; David Adair, C.; Miller, R.K.; Richards, S.M. Placental concentrations of essential, toxic, and understudied metals and relationships with birth outcomes in Chattanooga, TN. Environ. Res. 2019, 168, 118–129. [Google Scholar] [CrossRef] [PubMed]
- Yin, S.; Wang, C.; Wei, J.; Wang, D.; Jin, L.; Liu, J.; Wang, L.; Li, Z.; Ren, A.; Yin, C. Essential trace elements in placental tissue and risk for fetal neural tube defects. Environ. Int. 2020, 139, 105688. [Google Scholar] [CrossRef]
- Callan, A.C.; Hinwood, A.L.; Ramalingam, M.; Boyce, M.; Heyworth, J.; McCafferty, P.; Odland, J. Maternal exposure to metals--concentrations and predictors of exposure. Environ. Res. 2013, 126, 111–117. [Google Scholar] [CrossRef]
- Freire, C.; Amaya, E.; Gil, F.; Murcia, M.; Llop, S.; Casas, M.; Vrijheid, M.; Lertxundi, A.; Irizar, A.; Fernández-Tardón, G.; et al. Placental metal concentrations and birth outcomes: The Environment and Childhood (INMA) project. Int. J. Hyg. Environ. Health 2019, 222, 468–478. [Google Scholar] [CrossRef]
- De Angelis, P.; Miller, R.K.; Darrah, T.H.; Katzman, P.J.; Pressman, E.K.; Kent, T.R.; O’Brien, K.O. Elemental content of the placenta: A comparison between two high-risk obstetrical populations, adult women carrying multiples and adolescents carrying singletons. Environ. Res. 2017, 158, 553–565. [Google Scholar] [CrossRef]
- The European Parliament; The Council of The European Union. Directive 2002/46/EC of the European Parliament and of the Council of 10 June 2002 on the approximation of the laws of the Member States relating to food supplements. Off. J. Eur. Communities 2002, L183, 51–57. [Google Scholar]
- Rabin, O.; Hegedus, L.; Bourre, J.M.; Smith, Q.R. Rapid brain uptake of manganese(II) across the blood-brain barrier. J. Neurochem. 1993, 61, 509–517. [Google Scholar] [CrossRef] [PubMed]
- Yoon, M.; Schroeter, J.D.; Nong, A.; Taylor, M.D.; Dorman, D.C.; Andersen, M.E.; Clewell, H.J., 3rd. Physiologically based pharmacokinetic modeling of fetal and neonatal manganese exposure in humans: Describing manganese homeostasis during development. Toxicol. Sci. 2011, 122, 297–316. [Google Scholar] [CrossRef] [PubMed] [Green Version]
- Byrne, S.L.; Buckett, P.D.; Kim, J.; Luo, F.; Sanford, J.; Chen, J.; Enns, C.; Wessling-Resnick, M. Ferristatin II promotes degradation of transferrin receptor-1 in vitro and in vivo. PLoS ONE 2013, 8, e70199. [Google Scholar] [CrossRef] [PubMed] [Green Version]
- Yanatori, I.; Yasui, Y.; Noguchi, Y.; Kishi, F. Inhibition of iron uptake by ferristatin II is exerted through internalization of DMT1 at the plasma membrane. Cell Biol. Int. 2015, 39, 427–434. [Google Scholar] [CrossRef]
- Nemeth, E.; Tuttle, M.S.; Powelson, J.; Vaughn, M.B.; Donovan, A.; Ward, D.M.; Ganz, T.; Kaplan, J. Hepcidin regulates cellular iron efflux by binding to ferroportin and inducing its internalization. Science 2004, 306, 2090–2093. [Google Scholar] [CrossRef] [Green Version]
- Arumugasaamy, N.; Rock, K.D.; Kuo, C.Y.; Bale, T.L.; Fisher, J.P. Microphysiological systems of the placental barrier. Adv. Drug Deliv. Rev. 2020, 161–162, 161–175. [Google Scholar] [CrossRef]
- Gambling, L.; Lang, C.; McArdle, H.J. Fetal regulation of iron transport during pregnancy. Am. J. Clin. Nutr. 2011, 94, 1903s–1907s. [Google Scholar] [CrossRef] [Green Version]
- Gao, G.; Li, J.; Zhang, Y.; Chang, Y.Z. Cellular Iron Metabolism and Regulation. Adv. Exp. Med. Biol. 2019, 1173, 21–32. [Google Scholar] [CrossRef]
- Michalke, B.; Willkommen, D.; Venkataramani, V. Iron Redox Speciation Analysis Using Capillary Electrophoresis Coupled to Inductively Coupled Plasma Mass Spectrometry (CE-ICP-MS). Front. Chem. 2019, 7, 136. [Google Scholar] [CrossRef] [Green Version]
- EFSA Panel on Dietetic Products, Nutrition and Allergies (NDA). Scientific Opinion on Dietary Reference Values for iron. EFSA J. 2015, 13, 4254. [Google Scholar] [CrossRef]
- Brown, B.; Wright, C. Safety and efficacy of supplements in pregnancy. Nutr. Rev. 2020, 78, 813–826. [Google Scholar] [CrossRef] [PubMed]
- Aschner, J.L.; Aschner, M. Nutritional aspects of manganese homeostasis. Mol. Asp. Med. 2005, 26, 353–362. [Google Scholar] [CrossRef] [PubMed]
- Vincent, J.B.; Love, S. The binding and transport of alternative metals by transferrin. Biochim. Biophys. Acta. 2012, 1820, 362–378. [Google Scholar] [CrossRef] [PubMed]
- Miyazawa, M.; Bogdan, A.R.; Hashimoto, K.; Tsuji, Y. Regulation of transferrin receptor-1 mRNA by the interplay between IRE-binding proteins and miR-7/miR-141 in the 3′-IRE stem-loops. RNA 2018, 24, 468–479. [Google Scholar] [CrossRef] [Green Version]
- Klausner, R.D.; Rouault, T.A.; Harford, J.B. Regulating the fate of mRNA: The control of cellular iron metabolism. Cell 1993, 72, 19–28. [Google Scholar] [CrossRef]
- Mazgaj, R.; Lipiński, P.; Edison, E.S.; Bednarz, A.; Staroń, R.; Haberkiewicz, O.; Lenartowicz, M.; Smuda, E.; Jończy, A.; Starzyński, R.R. Marginally reduced maternal hepatic and splenic ferroportin under severe nutritional iron deficiency in pregnancy maintains systemic iron supply. Am. J. Hematol. 2021, 96, 659–670. [Google Scholar] [CrossRef] [PubMed]
- Li, Y.Q.; Bai, B.; Cao, X.X.; Yan, H.; Zhuang, G.H. Ferroportin 1 and hephaestin expression in BeWo cell line with different iron treatment. Cell Biochem. Funct. 2012, 30, 249–255. [Google Scholar] [CrossRef]
- Sangkhae, V.; Fisher, A.L.; Wong, S.; Koenig, M.D.; Tussing-Humphreys, L.; Chu, A.; Lelić, M.; Ganz, T.; Nemeth, E. Effects of maternal iron status on placental and fetal iron homeostasis. J. Clin. Investig. 2020, 130, 625–640. [Google Scholar] [CrossRef]
- Bogdan, A.R.; Miyazawa, M.; Hashimoto, K.; Tsuji, Y. Regulators of Iron Homeostasis: New Players in Metabolism, Cell Death, and Disease. Trends Biochem. Sci. 2016, 41, 274–286. [Google Scholar] [CrossRef] [Green Version]
- Yang, A.; Zhao, J.; Lu, M.; Gu, Y.; Zhu, Y.; Chen, D.; Fu, J. Expression of Hepcidin and Ferroportin in the Placenta, and Ferritin and Transferrin Receptor 1 Levels in Maternal and Umbilical Cord Blood in Pregnant Women with and without Gestational Diabetes. Int. J. Environ. Res. Public Health 2016, 13, 766. [Google Scholar] [CrossRef] [Green Version]
- Venkataramani, V.; Doeppner, T.R.; Willkommen, D.; Cahill, C.M.; Xin, Y.; Ye, G.; Liu, Y.; Southon, A.; Aron, A.; Au-Yeung, H.Y.; et al. Manganese causes neurotoxic iron accumulation via translational repression of amyloid precursor protein and H-Ferritin. J. Neurochem. 2018, 147, 831–848. [Google Scholar] [CrossRef] [PubMed]
- Tai, Y.K.; Chew, K.C.M.; Tan, B.W.Q.; Lim, K.L.; Soong, T.W. Iron mitigates DMT1-mediated manganese cytotoxicity via the ASK1-JNK signaling axis: Implications of iron supplementation for manganese toxicity. Sci. Rep. 2016, 6, 21113. [Google Scholar] [CrossRef] [PubMed] [Green Version]
- Zheng, W.; Zhao, Q. Iron overload following manganese exposure in cultured neuronal, but not neuroglial cells. Brain Res. 2001, 897, 175–179. [Google Scholar] [CrossRef] [Green Version]
- Bjørklund, G.; Dadar, M.; Peana, M.; Rahaman, M.S.; Aaseth, J. Interactions between iron and manganese in neurotoxicity. Arch. Toxicol. 2020, 94, 725–734. [Google Scholar] [CrossRef]
- Ling, X.B.; Wei, H.W.; Wang, J.; Kong, Y.Q.; Wu, Y.Y.; Guo, J.L.; Li, T.F.; Li, J.K. Mammalian Metallothionein-2A and Oxidative Stress. Int. J. Mol. Sci. 2016, 17, 1483. [Google Scholar] [CrossRef]
- Witt, B.; Meyer, S.; Ebert, F.; Francesconi, K.A.; Schwerdtle, T. Toxicity of two classes of arsenolipids and their water-soluble metabolites in human differentiated neurons. Arch. Toxicol. 2017, 91, 3121–3134. [Google Scholar] [CrossRef]


Publisher’s Note: MDPI stays neutral with regard to jurisdictional claims in published maps and institutional affiliations. |
© 2022 by the authors. Licensee MDPI, Basel, Switzerland. This article is an open access article distributed under the terms and conditions of the Creative Commons Attribution (CC BY) license (https://creativecommons.org/licenses/by/4.0/).
Share and Cite
Michaelis, V.; Aengenheister, L.; Tuchtenhagen, M.; Rinklebe, J.; Ebert, F.; Schwerdtle, T.; Buerki-Thurnherr, T.; Bornhorst, J. Differences and Interactions in Placental Manganese and Iron Transfer across an In Vitro Model of Human Villous Trophoblasts. Int. J. Mol. Sci. 2022, 23, 3296. https://doi.org/10.3390/ijms23063296
Michaelis V, Aengenheister L, Tuchtenhagen M, Rinklebe J, Ebert F, Schwerdtle T, Buerki-Thurnherr T, Bornhorst J. Differences and Interactions in Placental Manganese and Iron Transfer across an In Vitro Model of Human Villous Trophoblasts. International Journal of Molecular Sciences. 2022; 23(6):3296. https://doi.org/10.3390/ijms23063296
Chicago/Turabian StyleMichaelis, Vivien, Leonie Aengenheister, Max Tuchtenhagen, Jörg Rinklebe, Franziska Ebert, Tanja Schwerdtle, Tina Buerki-Thurnherr, and Julia Bornhorst. 2022. "Differences and Interactions in Placental Manganese and Iron Transfer across an In Vitro Model of Human Villous Trophoblasts" International Journal of Molecular Sciences 23, no. 6: 3296. https://doi.org/10.3390/ijms23063296