Article

An Analysis of the Evolution of Public Sentiment and Spatio-Temporal Dynamics Regarding Building Collapse Accidents Based on Sina Weibo Data

1
School of Surveying and Geo-Informatics, Shandong Jianzhu University, Jinan 250101, China
2
School of Architecture and Urban Planning, Shandong Jianzhu University, Jinan 250101, China
*
Author to whom correspondence should be addressed.
ISPRS Int. J. Geo-Inf. 2023, 12(10), 388; https://doi.org/10.3390/ijgi12100388
Submission received: 27 July 2023 / Revised: 21 September 2023 / Accepted: 22 September 2023 / Published: 26 September 2023

Abstract

:
Monitoring, analyzing, and managing public sentiment surrounding urban emergencies hold significant importance for city governments in executing effective response strategies and maintaining social stability. In this study, we present a study which was conducted regarding the self-built house collapse incident in Changsha, China, that occurred on 29 April 2022, with a focus on leveraging Sina Weibo (a Twitter-like microblogging system in China) comment data. By employing the Latent Dirichlet Allocation (LDA) topic model, we identified key discussion themes within the comments and explored the emotional and spatio-temporal characteristics of the discourse. Furthermore, utilizing geographic detectors, we investigated the factors influencing the spatial variations in comment data. Our research findings indicate that the comments can be categorized into three main themes: “Rest in Peace for the Deceased”, “Wishing for Safety”, and “Thorough Investigation of Self-Built Houses”. Regarding emotional features, the overall sentiment expressed in the public discourse displayed positivity, albeit with significant fluctuations during different stages of the incident, including the initial occurrence, rescue efforts, and the establishment of accountability and investigative committees. These fluctuations were closely associated with the emotional polarity of the specific topics. In terms of temporal distribution, the peak in the number of comments occurred approximately one hour after the topic was published. Concerning spatial distribution, a positive sentiment prevailed across various provinces. The comment distribution exhibited a stair-like pattern, which correlated with interregional population migration and per capita GDP. Our study provides valuable insights for city governments and relevant departments in conducting sentiment analysis and guiding public opinion trends.

1. Introduction

Cities serve as hubs of human activity and information exchange, where both natural and anthropogenic factors can trigger unforeseen events that exert profound impacts on urban systems. Sudden public incidents possess the characteristics of spontaneity, complexity, destructiveness, and persistence, often engendering widespread public negativity [1]. The rapid and extensive dissemination of various messages, including rumors, can further instigate secondary social disasters and disrupt the functioning of city management endeavors, thus impeding societal stability. Therefore, the study of public perceptions and responses to such incidents represents a crucial avenue for mitigating adverse social effects, while holding significant implications for urban management authorities in conducting sentiment analysis, crisis response, and societal stabilization efforts. Furthermore, it plays a pivotal role within urban planning departments as they strategize urban development and conduct comprehensive assessments.
Since the beginning of the 21st century, with the rise of the internet, social platforms have played a significant role in driving the dissemination of news through new media, leading to an increasing level of public attention towards urban emergencies [2,3,4,5]. In recent years, significant safety liability accidents caused by building collapses have occurred frequently. Examples include the “3.7” collapse of the COVID-19 quarantine hotel named Xinjia in Quanzhou, Fujian Province, China, in 2020, and the “8.29” major collapse accident of Juxian Restaurant in Xiangfen County, Linfen City, Shanxi Province, in 2021. These accidents resulted in property damage and significant casualties, with extremely negative social impacts. Conducting public sentiment analysis on such incidents can provide valuable insights for government and relevant management departments in terms of policy making and accident response.
From a research perspective, current studies on public opinion analysis mainly involve four aspects. Firstly, text mining [6] is the central field of research, encompassing topic mining [7], sentiment analysis [8,9,10,11,12,13], and spatio-temporal analysis [4,5,14]. Secondly, there is user behavior analysis [15]. Thirdly, the study extends to social network analysis [16]. Fourthly, there are simulations and evolutions of public sentiment. Topic modeling is a widely used approach in topic mining to extract the main themes from unstructured text. Common topic modeling approaches include the LDA model based on probabilistic graphical models, the HDP model, the NMF model based on matrix factorization, and models like Word2Vec based on word embeddings. Additionally, there are other models based on deep learning, topic modeling, and network embeddings, among others (Table 1). In recent years, the LDA model has become a widely used model in the field of text mining due to its advantages, including unsupervised learning, high interpretability, and versatility. For instance, Chen et al. [17] employed the LDA model to investigate the potential topics underlying three reopening measures during the COVID-19 pandemic. They explored the public’s responses to public policies, providing a basis for the government to make timely adjustments to public policies. Considering the comment data used in this paper exhibits characteristics such as topic diversity, rich vocabulary, moderate text length, a large quantity of data, and an uneven distribution of topics, LDA was chosen for mining comment topics. The roots of sentiment analysis can be traced back to early 20th-century studies on public opinion analysis and the subjective analysis of texts conducted by the computational linguistics community in the 1990s. With the proliferation of social media platforms such as Twitter and Facebook, research in this field grew 50-fold between 2005 and 2016 [18]. There are two primary methods used for text sentiment analysis. One method is based on machine learning and deep learning [19,20,21,22], where machine learning algorithms or deep learning models are used for text sentiment classification. The other method is based on sentiment lexicons. It involves manually constructing sentiment lexicons containing various types of sentiment words. After segmenting and tagging the research text, the text content in terms of words is matched with the vocabulary in the constructed lexicon to calculate sentiment polarity and intensity. Considerations are also given to negation words, adverbs of degree, etc., to derive the sentiment value of the text. In terms of research content, sentiment analysis primarily focuses on three main aspects: sentiment classification, which typically includes positive, negative, and neutral categories and sometimes more specific ones like anger, joy, and sadness; sentiment intensity, and sentiment evolution. For example, Lyu et al. [23] employed the National Research Council of Canada Emotion Lexicon for sentiment analysis, categorizing emotions into eight distinct categories. Chen et al. [24] conducted topic clustering analysis using the K-Means clustering algorithm and sentiment analysis using SnowNLP on Sina Weibo data, analyzing and visually expressing topics relevant to the COVID-19 pandemic. Some researchers have also investigated the relationship between sentiment analysis and the evolution of events. For example, Hu [25] analyzed the patterns and characteristics of sentiment tendencies among Sina Weibo users during the COVID-19 pandemic. This evolution model not only takes into account emotional tendencies but also considers the impact of events, the number of newly confirmed cases, and the number of retweets and comments. In the spatio-temporal analysis, the main focus is on the relationship between comment location and the number of comments, as well as the relationship between comment time and the number of comments. Mane et al. [26] collected tweets related to the overturning of Roe v Wade and abortion bans from the public, along with their timestamp and location information. They analyzed and obtained the geographical variations in the number of tweets posted by different states regarding specific topics, as well as the temporal evolution of various viewpoints on these topics. Sun et al. [9] examined tweets on Twitter regarding public sentiments about COVID-19 vaccines, calculating emotional polarity and spatial distribution of tweet counts. The research revealed the prevalence of negative vaccine sentiment, and this sentiment exhibited geographic variations.
The literature review above predominantly focuses on analyzing posts or comments widely posted by the public on social media regarding a particular public opinion. However, this process inevitably contains various behaviors of the public that have a negative impact on the true course of events in the dissemination of public opinion, such as exaggeration, fabrication, incitement, and intentional guidance. To eliminate such influences, this article attempts to conduct public opinion research based on the reports of a mainstream media outlet. Mainstream media outlets not only serve as important channels for information dissemination but also have the ability to shape public opinions and sentiments. They influence public views on events and issues through reporting, commentary, editorials, and more. As one of China’s leading media outlets, the People’s Daily plays a leading role in guiding mainstream opinions. The content it publishes is authoritative, serious, and timely. This manuscript selects public comments on all news reports related to the event from the People’s Daily to avoid inappropriate comments that distort facts or maliciously encourage misinformation dissemination, thus ensuring that the comments are based on timely and genuine reporting. Additionally, the mainstream media published multiple news reports about this event. This article collects comments based on different news content to investigate the relationship between news topics and the sentiment polarity of public comments, which helps mainstream media to guide public opinion. In this study, we take the collapse of self-built houses in the Wangcheng District, Changsha City, China, on 29 April 2022, as an example. We focus on the topics covered in all the articles published by the People’s Daily, a mainstream media outlet in China, regarding this incident. We collect comment data for each topic and utilize the LDA topic model to determine the main themes of the comments. We further explore the word frequency features, sentiment characteristics, and spatio-temporal patterns of the comments and employ geographic detectors to investigate the factors influencing the spatial differentiation of the comment data. Our findings can serve as a supplementary reference for urban management departments in dealing with public sentiment.
Our main contributions are summarized as follows:
(1)
Instead of collecting comments from all relevant posts, this study chose to select comments from specific mainstream media as a novel research perspective. This avoids inappropriate comments that distort facts or maliciously spread false information, thereby ensuring that the comments are based on timely and genuine reporting, which enhances the reliability of the data. More importantly, selecting data from mainstream media facilitates the study of the relationship between the content they published and public sentiment, allowing for an exploration of the media’s role in guiding public opinion.
(2)
We not only focused on sentiment polarity and intensity but also considered factors related to media topics and the sentiment polarity of specific vocabulary. In addition, we integrated sentiment with spatial distribution and time series for a more comprehensive and detailed analysis, leading to more comprehensive conclusions.
(3)
To explore the geographical spatial differences in public sentiment, this study analyzed regional attention disparities and regional intensity differences in public sentiment. Additionally, by employing geographic detectors, it delved into the reasons behind these spatial disparities, providing a basis for relevant authorities to formulate differentiated regional strategies.
The remainder of the manuscript is organized as follows. In Section 2, we provide a case description of the event and elaborate on our methodology. Section 3 is dedicated to presenting our research findings. Section 4 entails a discussion of the analysis results. Finally, Section 5 serves as the conclusion of this paper, addressing limitations and future work.

2. Data and Methods

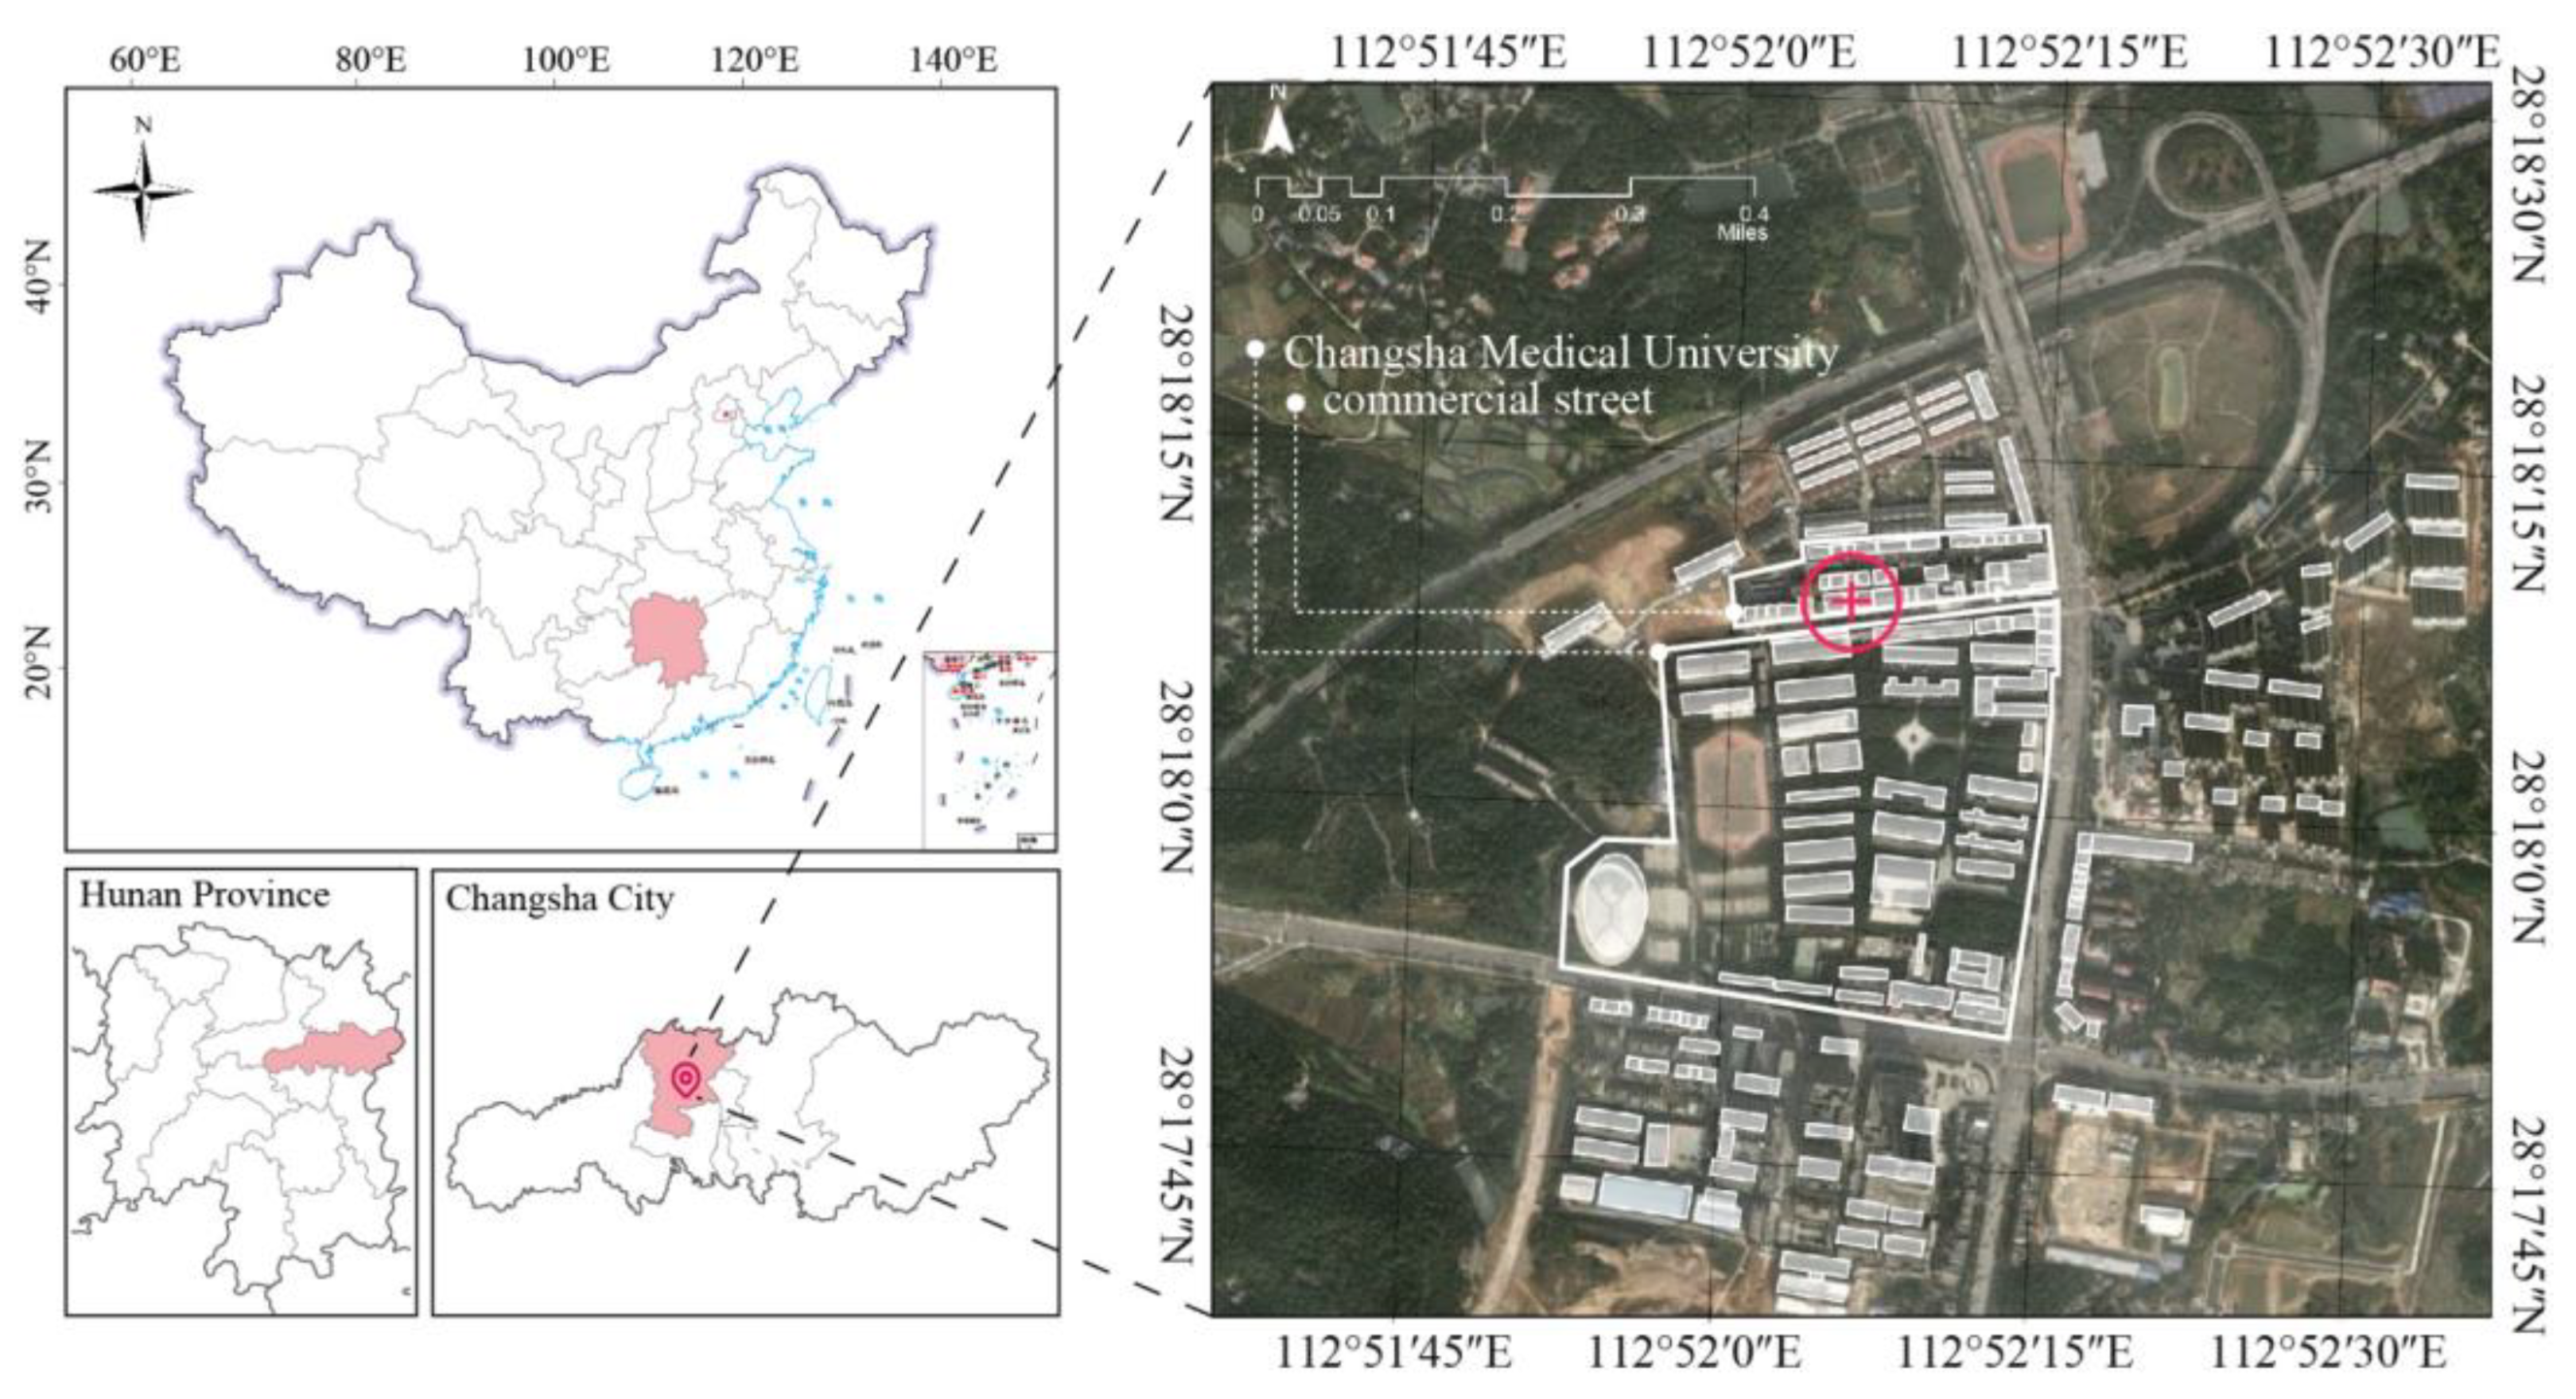
2.1. Case Presentation

Within the scope of this research, we have chosen to conduct a public sentiment analysis focused on the unfortunate incident of a collapsed self-built structure in Wangcheng District, Changsha City, China. The aforementioned self-built house was situated in the Jinping community of Jinshanqiao Street, adjacent to Changsha Medical College (Figure 1). Serving the surrounding schools and residents, the ground floor of this structure is used as a commercial space. The collapsed building was located near the north entrance of Changsha Medical College. The incessant influx of students and their thriving consumer demands contributed to the progressive “vertical growth” of self-built houses in the vicinity.
On 29 April 2022, at precisely 12:24 PM, the aforementioned structure suddenly succumbed to collapse. The collapsed self-built house comprised eight stories, with the ground floor serving as a storefront, the second floor housing a restaurant, the third floor accommodating a cinema café, and the fourth, fifth, and sixth floors functioning as a family inn. The seventh and eighth floors were designated as residential spaces. Given that the incident occurred during lunchtime, a considerable number of students were dining nearby.
Around 12:50 PM on 29 April, the first batch of rescue personnel promptly arrived at the scene and immediately commenced rescue operations. After an intense and demanding rescue effort spanning over 130 h, a total of 10 individuals were successfully rescued. On the morning of 6 May, the seventh press conference regarding the collapsed self-built structure in Wangcheng District, Changsha City was held, during which it was announced that the rescue operations at the incident site had concluded. Regrettably, this incident resulted in the loss of 53 lives. On 16 May, during the routine press conference organized by the Ministry of Emergency Management, the death toll for the collapsed self-built structure accident on 29 April in Wangcheng District, Changsha City, was revised to 54 individuals.

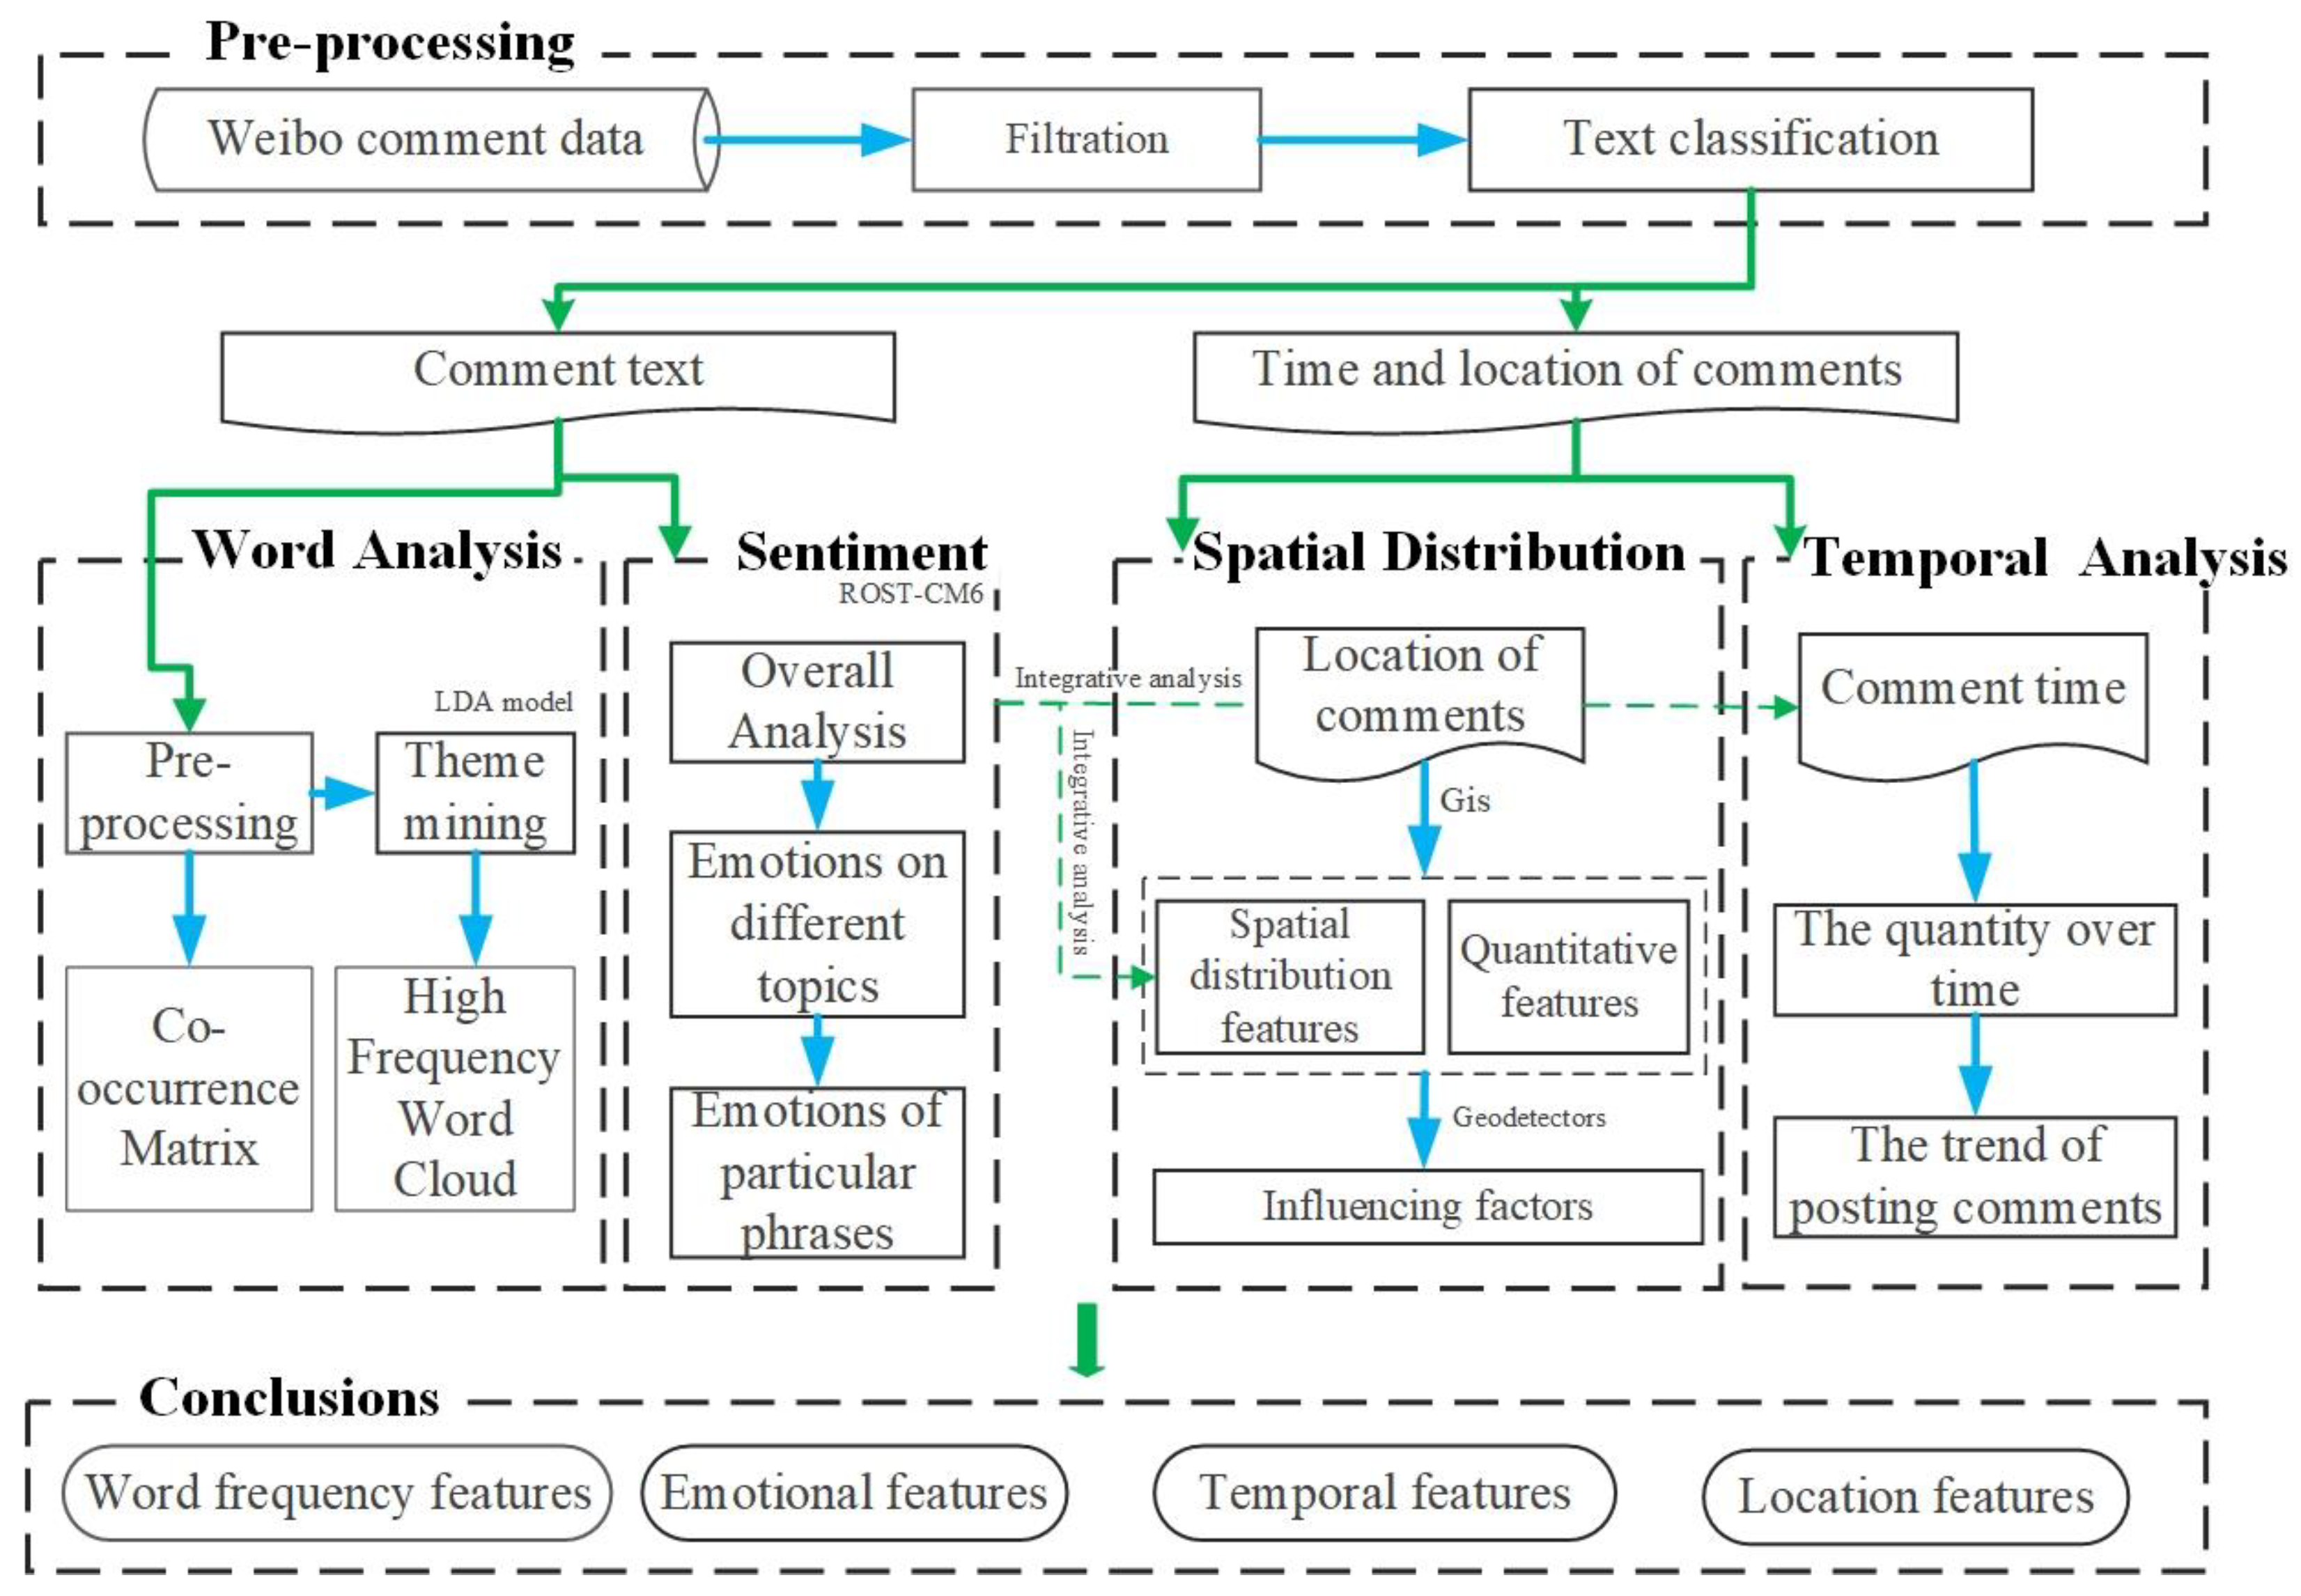
2.2. Research Framework

To comprehensively study the characteristics of comments, we employed web scraping techniques to collect three types of data: comment text, posting time, and comment location. Our research framework, as illustrated in Figure 2, focuses on analyzing the frequency, sentiment, and spatio-temporal features of the comments. We conducted three main parts of the analysis using the collected data. In the first part, we applied Python to perform topic analysis on the comment texts. Initially, we processed the comments by removing duplicates and reducing noise. Then, we utilized word segmentation techniques to analyze the network relationships among high-frequency words. By employing the Latent Dirichlet Allocation (LDA) topic model, we conducted topic mining and extraction. We also visualized the high-frequency words associated with each topic by generating word clouds. The second part of our analysis focused on examining the sentiment features of the comment texts. Firstly, we analyzed the overall sentiment value of the comments and the sentiment values associated with each topic. We then explored the relationship between the public sentiment trend and media topics by considering the emotional values. Additionally, we investigated spatial variations in sentiment values and examined specific vocabulary related to sentiment characteristics. The third part involved spatio-temporal analysis. We conducted feature analysis on the comment posting time and location. Furthermore, we examined the spatial distribution characteristics of comments and studied the influential factors affecting their spatial patterns. Furthermore, by integrating sentiment analysis into spatial context, we can derive spatial distribution patterns of emotional features. Combining sentiment analysis with time allows us to obtain the temporal evolution of sentiment values. This is the meaning represented by the green dashed line in Figure 2, which is the integration of sentiment with spatio-temporal analysis. Through the analysis process described above, we aimed to conduct a comprehensive investigation into the characteristics of the comments. The findings will contribute to a better understanding of the comment landscape and provide valuable insights for related fields.

2.3. Data and Data Pre-Processing

A Weibo topic, known as a keyword, used for searching on the social media platform Sina Weibo, refers to the functionality where users can create and participate in discussions about specific topics or events by using specific tags or keywords enclosed in double hashtags (##). Each Weibo topic can aggregate related posts, comments, and shares, and users can use the same tags in their own Weibo posts to join the topic discussion. This feature is similar to hashtags or topic tags on other social media platforms and is used to connect and aggregate related content. From 29 April to 6 May 2022, the People’s Daily published a series of follow-up reports on the event. In relation to this event, the People’s Daily created a total of 19 Weibo topics including the accident occurrence, the initiation of rescue operations, and the conclusion of the rescue efforts. For this study, data were collected using a distributed web scraping technique on the Sina Weibo client webpage (https://m.weibo.cn/u/2803301701?t=0&luicode=10000011&lfid=100103type%3D1%26q%3D%E4%BA%BA%E6%B0%91%E6%97%A5%E6%8A%A5weibo.cn (accessed on 20 November 2022)). The collected data included comment text, posting time, and comment location. After data processing, which involved filtering, deduplication, and noise reduction, a total of 33,878 valid data points were obtained. Among these topics, there were 19 related topics published by the People’s Daily. However, one topic, “The Changsha Municipal Committee and the Municipal Government apologize for the collapse incident”, had only six displayed comments. Due to the limited number of data points, this topic lacked representativeness. Therefore, this particular topic was excluded from the study. The analysis was conducted based on the remaining 18 topics, resulting in 33,872 data entries for research and analysis, as shown in Table 2.
The dataset of Weibo comments used in this study contains a number of non-textual comments, such as those consisting only of emoji or punctuation marks. These non-textual comments were excluded from the analysis. After removing these comments, the dataset underwent further processing steps, including deduplication and noise reduction, to obtain the final set of comment texts. Additionally, the population data for each province and the interprovincial population migration data for Hunan Province were sourced from the seventh national population census data released by the National Bureau of Statistics (http://www.stats.gov.cn/sj/pcsj/rkpc/7rp/indexch.htm (accessed on 14 December 2022)) in 2020. The per capita GDP data for each province were calculated based on the total GDP data and population data published on the official website of the National Bureau of Statistics (http://www.stats.gov.cn/sj/ndsj/2021/indexch.htm (accessed on 14 December 2022)). The distance between each province and the incident location was determined by measuring the distance between the provincial capital cities and Changsha City.

2.4. Method

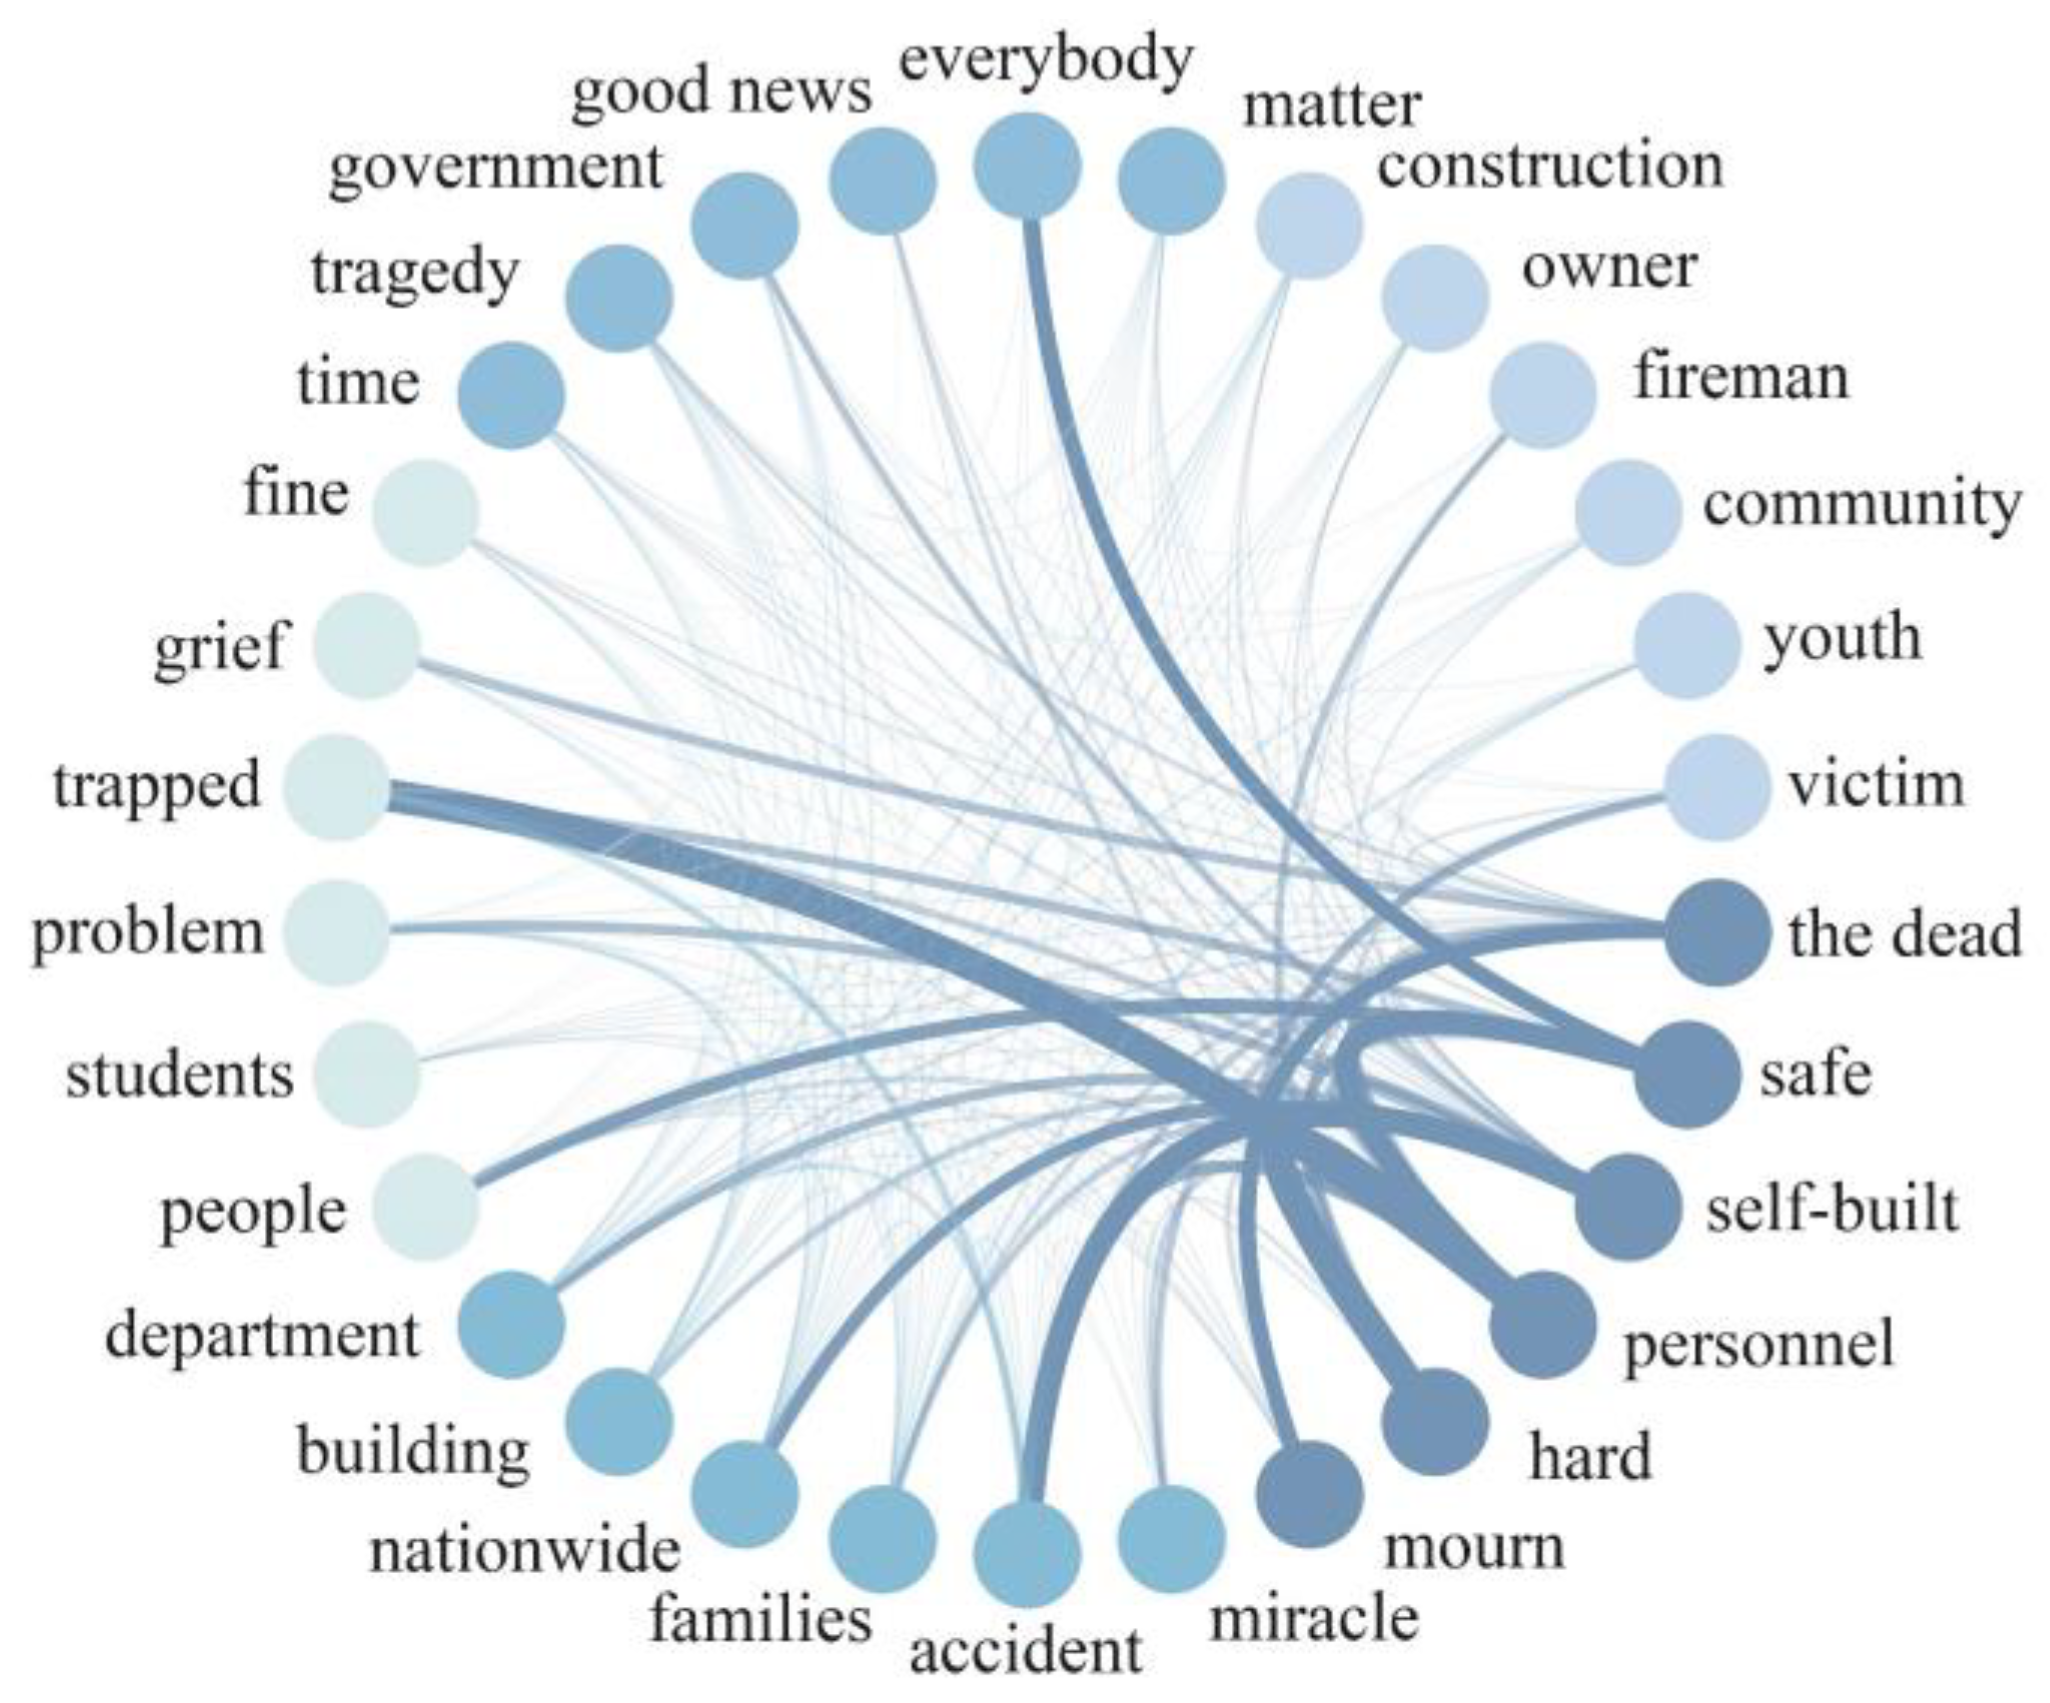
2.4.1. Co-Occurrence Matrix Analysis

The term co-occurrence matrix is a natural language processing technique that constructs a matrix by calculating the co-occurrence count of words in a text. Each element in the co-occurrence matrix represents the number of times two words appear together in the same context. The term frequency co-occurrence matrix can reveal relationships between important words and reflect public concerns. In this paper, Python is used for the calculation and visualization of term frequency co-occurrence matrices. Initially, the Jieba word segmentation package is employed for text segmentation. Then, a matrix is created, where each row represents a comment, and the values in the matrix represent word frequencies. On this basis, the term frequency co-occurrence matrix is constructed and visually represented to better understand the relationships between vocabulary in the text data. High-frequency co-occurrence analysis specifically refers to the analysis of term frequency co-occurrence matrices for frequently occurring words after tokenizing the comments. In this paper, the top 30 most frequent words were selected for this analysis.

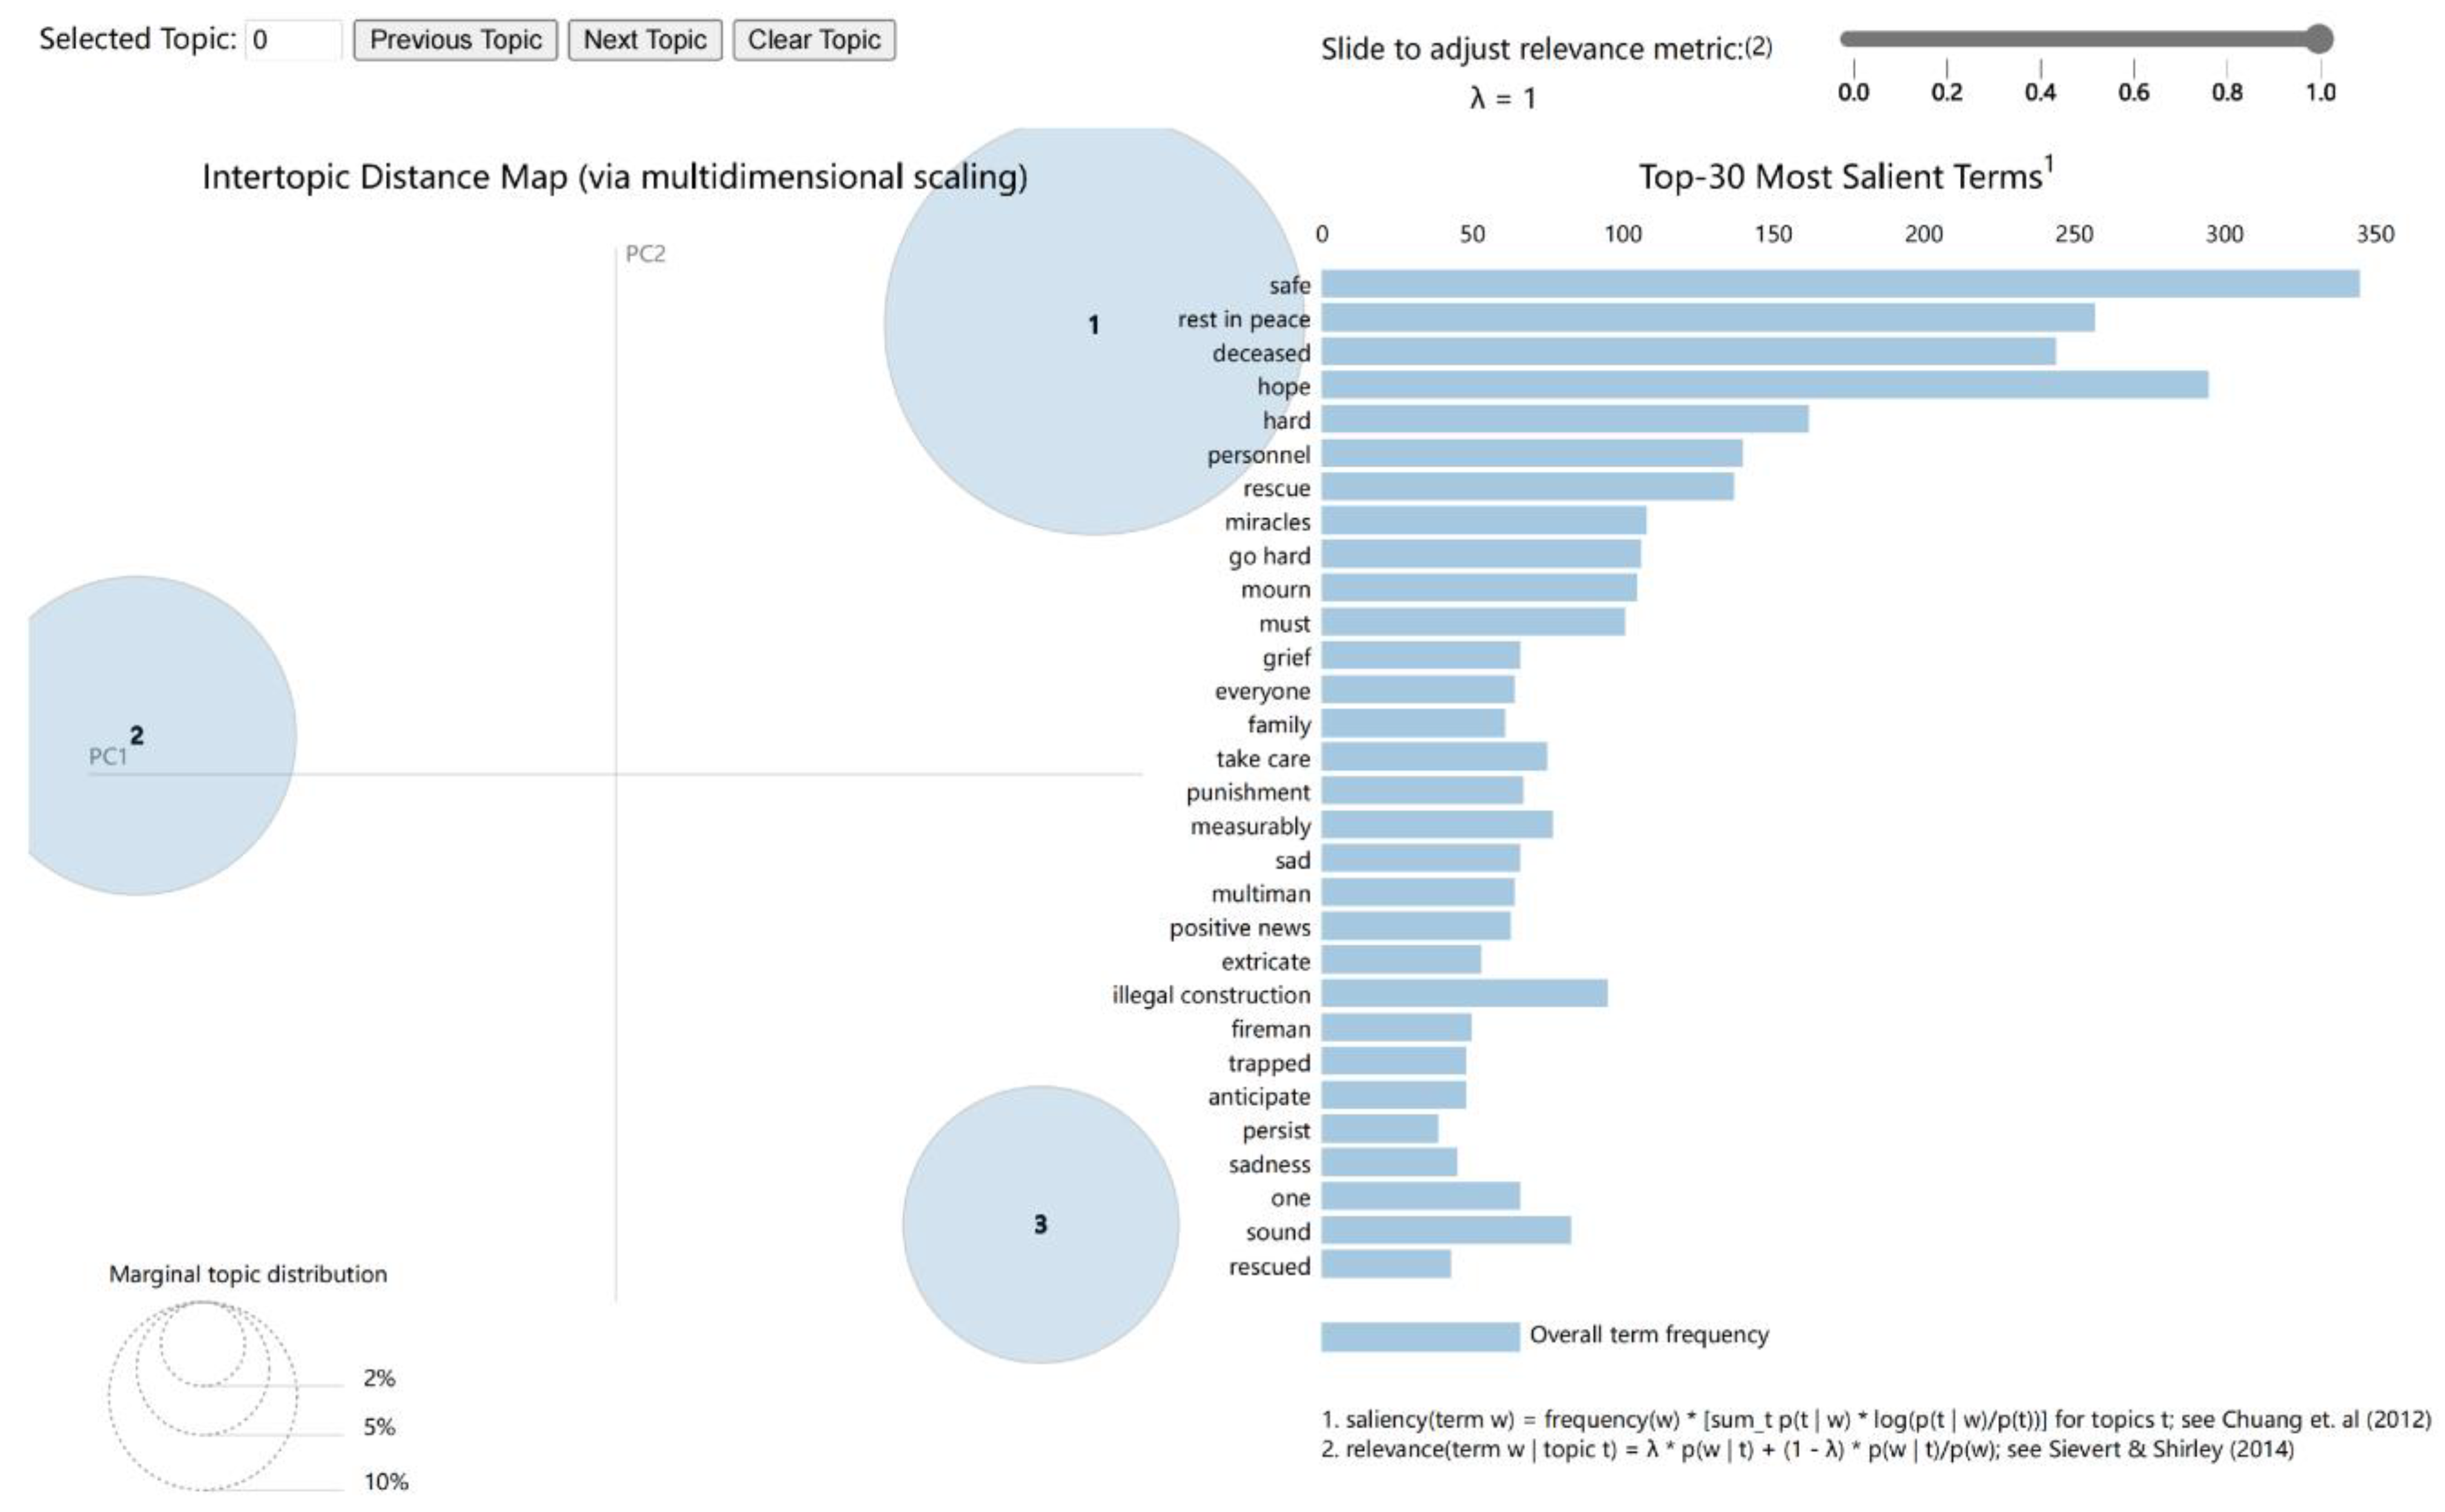
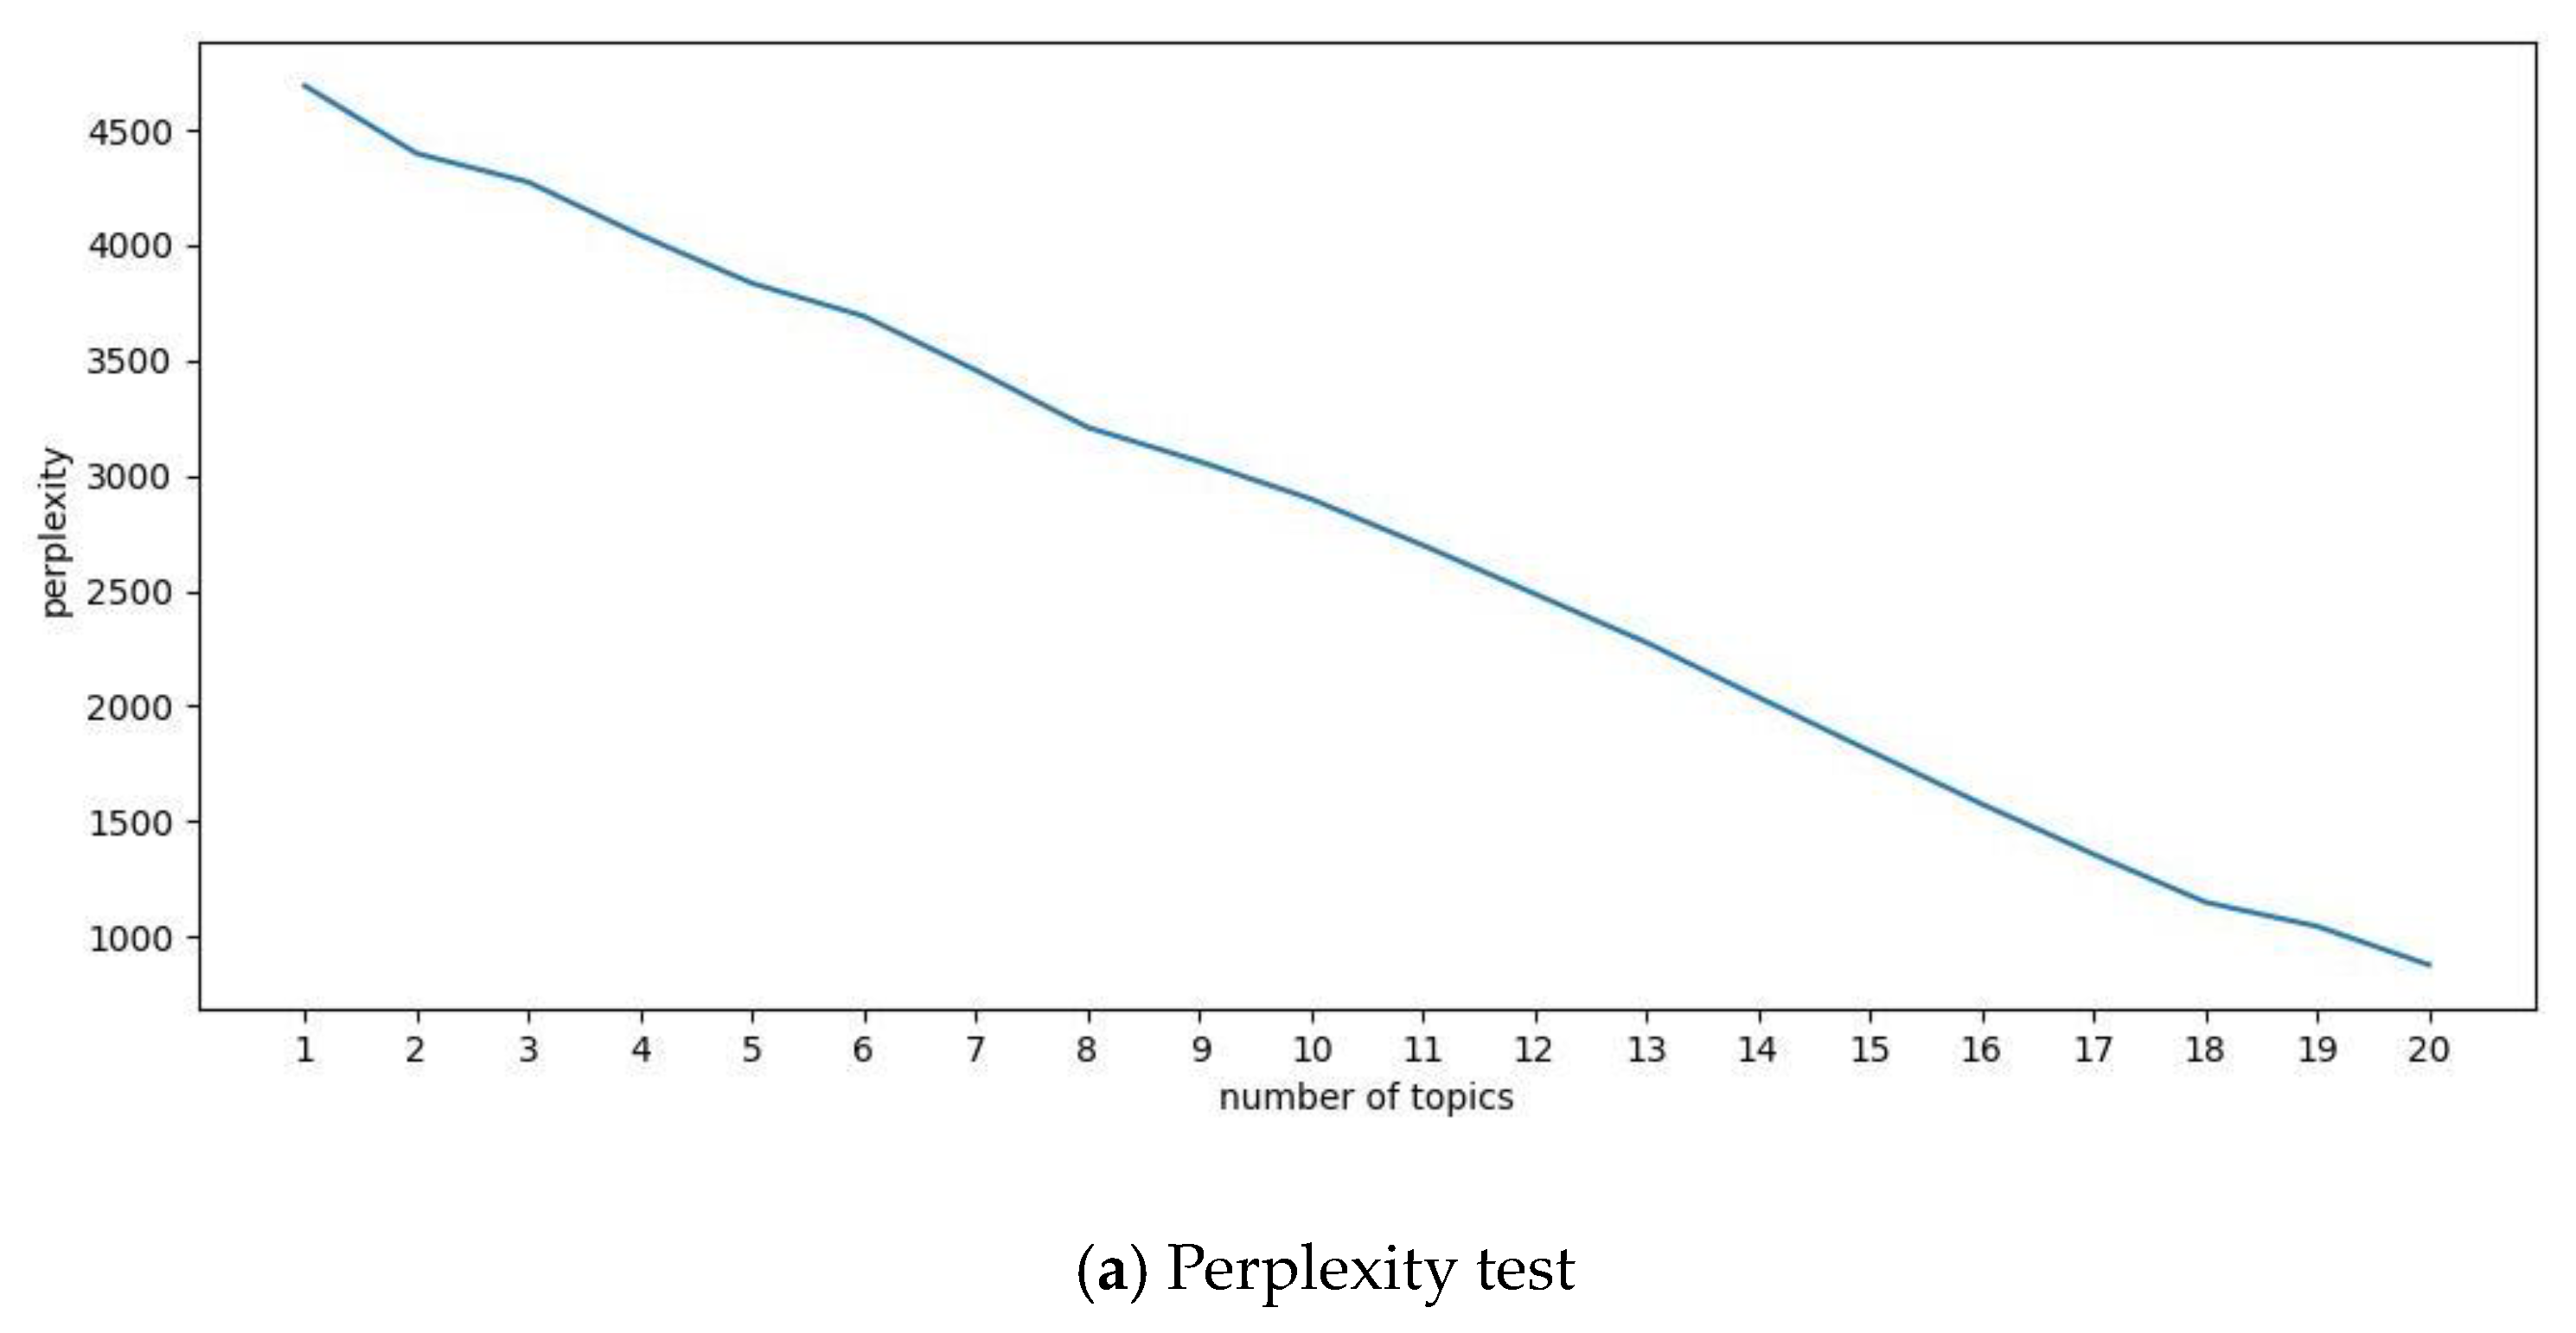
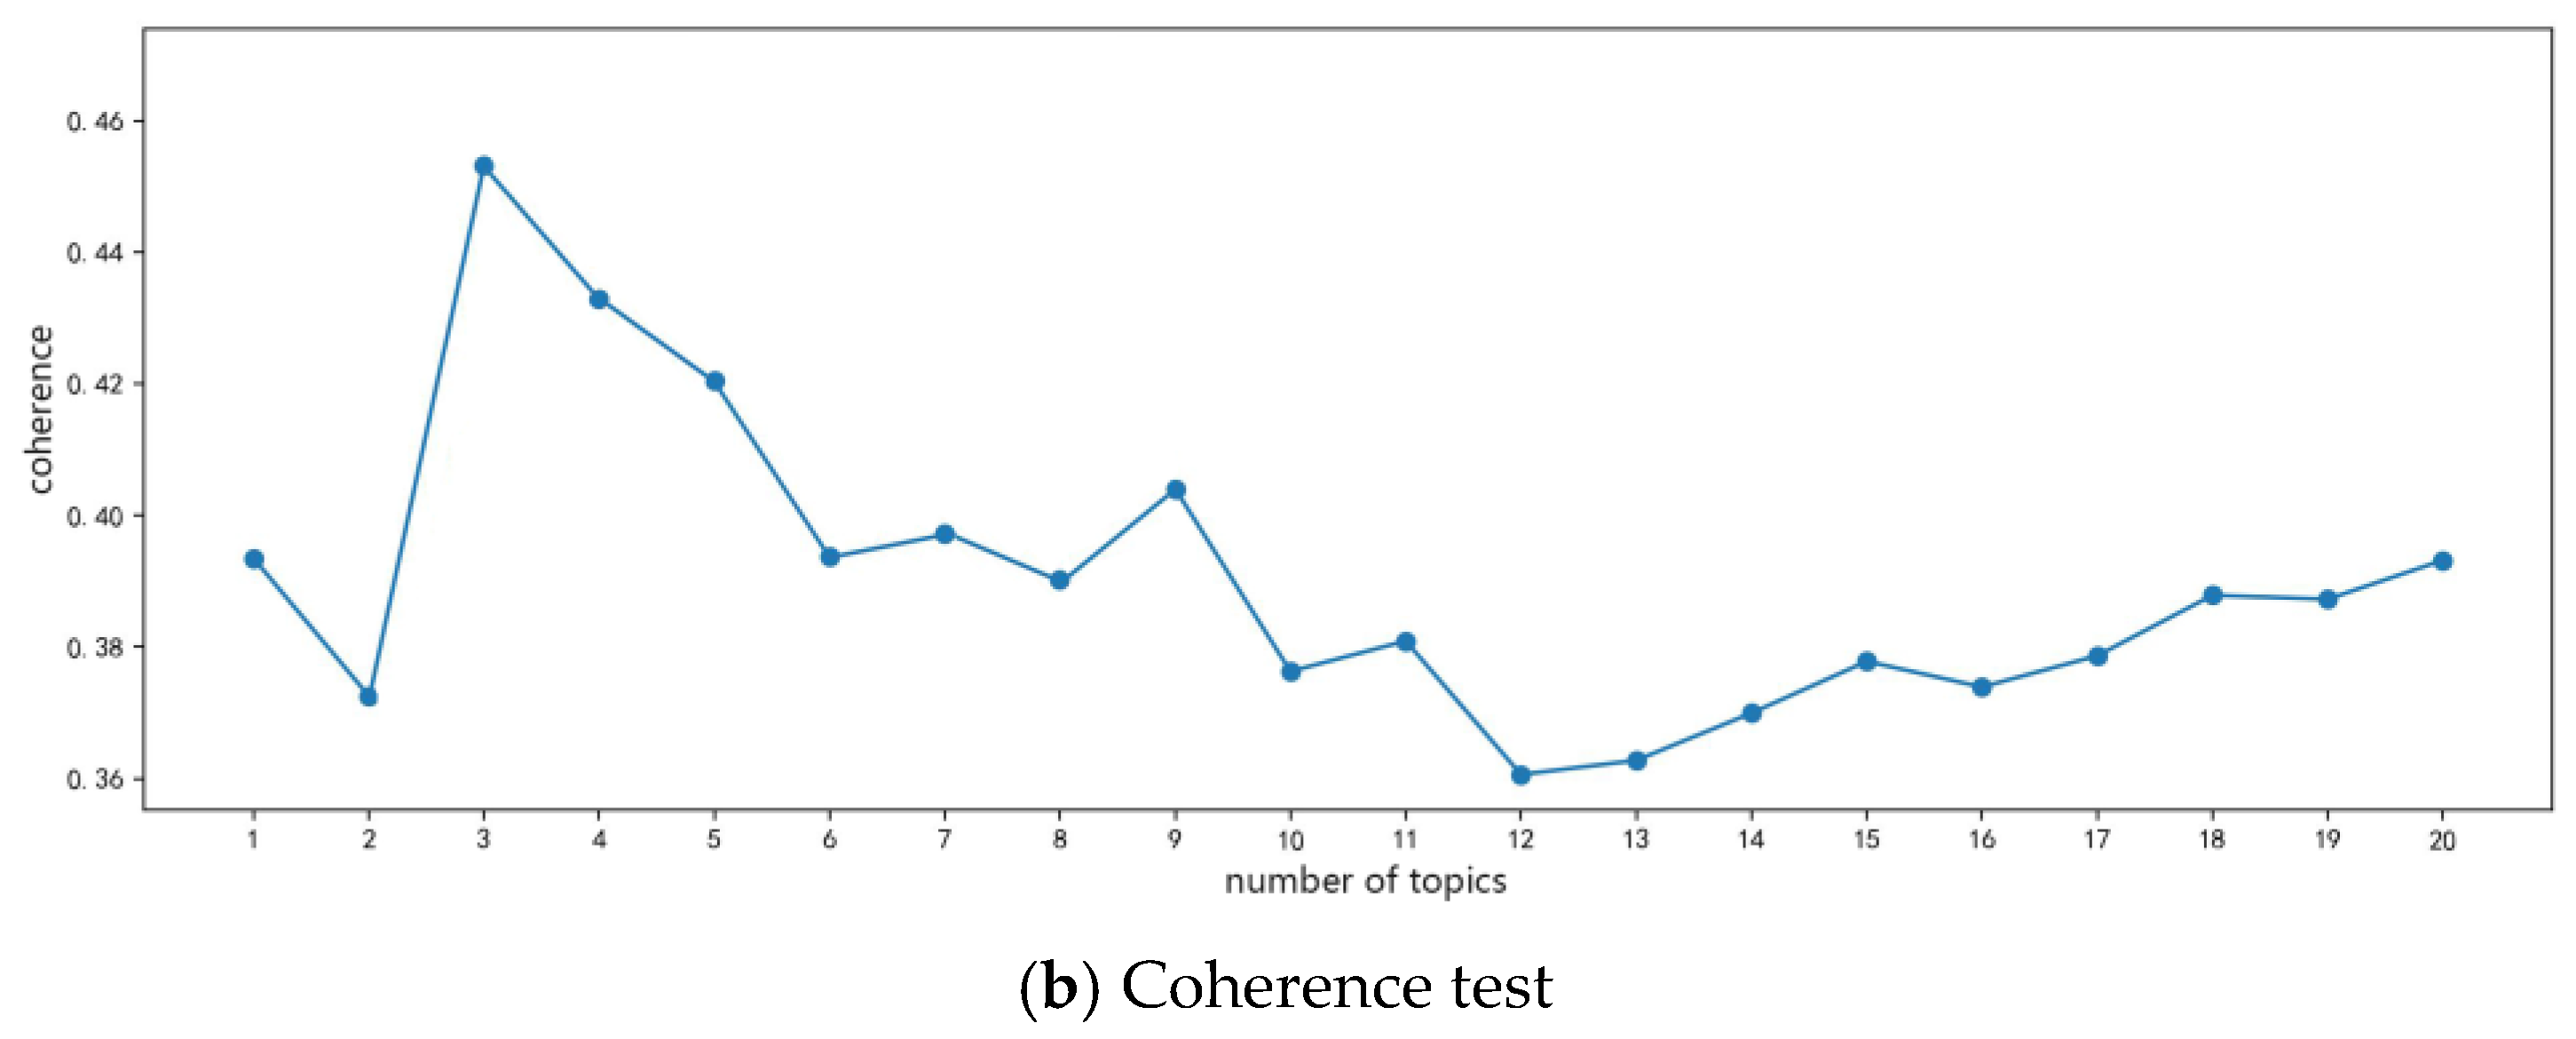
2.4.2. LDA Topic Model

To gain insights into the public’s opinions on the 18 valid posts from the People’s Daily and to identify the key areas of interest and most actively discussed points regarding this event, we utilized the LDA model to perform topic modeling on the collected dataset of 33,872 comments. LDA is a topic modeling technique used to identify the underlying semantic information within large-scale corpora. LDA is a Bayesian probability model that has three layers: “document–topic–word” [27]. In LDA, documents are represented as random mixtures of latent topics, each of which is characterized by a distribution of words [28]. LDA can provide a probability distribution of topics for each document in a collection. By analyzing a set of documents and extracting their respective topic distributions, it is possible to perform topic clustering or text classification based on these topics. LDA is a typical bag-of-words model, where a document is represented as a collection of words without any specific word order. The joint distribution formula for LDA is as follows:
P ω , z , θ , φ α , β = Π n = 1 N p θ α p z θ p φ β p ϖ θ
In the LDA model, each document is assumed to follow a Dirichlet distribution denoted as θ , while each topic corresponds to a Dirichlet distribution denoted as φ . The hyperparameters α and β represent the distribution hyperparameters for the topic distribution θ and the topic–word distribution φ , respectively [29]. The variables z and ω represent the generated topics and topic words, respectively. The specific process for generating the LDA model is as follows: Firstly, we sample the topic distribution θ from the Dirichlet distribution with hyperparameter α . Next, using this topic distribution, we assign topics z to the corresponding text segments. Afterwards, we randomly sample the word distribution α for each topic, based on the word frequency distribution β associated with that topic. Finally, we sample the corresponding words ω based on the generated distributions.
The Python package Sklearn provides an implementation of the LDA model. We can utilize this package to perform LDA analysis and conduct tests using perplexity and coherence metrics. In LDA, two common metrics used to evaluate the quality of the model and determine the optimal number of topics are perplexity and coherence. Perplexity measures the model’s fit to new data. It represents the uncertainty when determining if a piece of text belongs to a particular topic. A lower perplexity value indicates a better fit of the model. Its principle is described in Equation (3), where D represents the testing text set, N represents the number of documents, ω d represents the word sequence in document d , and p ( ω d ) represents the likelihood probability of the model for document d . However, to avoid the issue of model overfitting when there are too many topics, a single perplexity metric is insufficient for determining the quality of the model. Coherence is used to evaluate the quality of a topic model, measuring the average similarity between words within the same topic. Higher coherence indicates a stronger similarity among words within the same topic, reflecting better model quality. Its principle is outlined in Equation (4), where k represents the number of topics, ω i and ω i denote two different topic-specific words, sim( ω i , ω j ) signifies their semantic similarity, and E ( s i m ( ω i , ω j )) represents the expected similarity on a random corpus. Typically, we consider both perplexity and coherence as two indicators to determine the optimal number of topics:
P e r p l e x i t y D = e 1 N d = 1 N l o g p ω d
C v = 2 k k 1 i = 1 k j = 1 , j i k s i m ω i , ω j E s i m ω i , ω j m a x ( j = 1 , j i k s i m ω i , ω j , 1 )
Additionally, we can leverage the web-based visualization tool pyLDAvis to visualize the LDA model results. This tool provides an interactive and insightful visualization of the topic distributions and word associations, aiding in the interpretation and understanding of the obtained topics.

2.4.3. Word Frequency Analysis

Frequent terms serve as a tangible reflection of the public’s focal points. In this article, we employ the Python programming language to execute both the statistical analysis and visual representation of high-frequency terms, thereby constructing word clouds for the entire corpus of comments as well as for each distinct topic. Initially, we employ the Jieba toolkit to perform text segmentation. This process relies on a Chinese lexicon and utilizes associated probabilities to establish meaningful connections between Chinese characters. By identifying character combinations with higher probabilities, cohesive word units are formed, yielding the segmentation outcome. Subsequently, we utilize the wordcloud toolkit to generate captivating word cloud visualizations.

2.4.4. Sentiment Analysis Methods

Sentiment analysis pertains to the exploration of individuals’ subjective opinions and emotions concerning a specific event or topic [30]. The process of sentiment analysis involves analyzing and studying text that carries emotional connotations. By examining the polarity and intensity of public sentiments expressed through their writings, one can discern the general emotional inclination towards a given event and further delve into the public’s perceptions and viewpoints by analyzing the polarity of specific keywords. In this study, we employed the ROST Content Mining 6 platform [31] for sentiment analysis, utilizing MiniTagCloud to examine the sentiment polarity of sentences containing specific vocabulary.
ROST-CM6 is an extensive social computing platform developed under the leadership of Professor Shen Yang from Wuhan University. It provides excellent support for the Chinese language, offering functionalities such as network analysis, frequency statistics, cluster analysis, and semantic analysis. The sentiment analysis feature of the micro-word cloud enables us to explore the sentiment analysis results of crucial keywords such as sentiment words and feature words, providing insights into positive or negative analyses related to terms of concern. ROST Content Mining 6 categorizes sentiments into three classes: positive, negative, and neutral. Each sentiment is assigned a score based on its degree of expression, where larger absolute values indicate a higher intensity. Positive sentiment refers to the optimistic and supportive emotions exhibited by the public regarding the incident itself and its handling. It reflects hopeful and positive attitudes towards rescue efforts and is represented by positive scores. Negative sentiment encompasses dissatisfaction, pessimism, and complaints. It expresses discontent towards the occurrence of the incident or may involve anger and even verbal abuse towards certain social groups. Negative sentiment is indicated by negative scores. Neutral sentiment denotes the absence of a distinct subjective emotion or a balance between positive and negative sentiments, resulting in a score of 0. The specific sentiment classification in this study is illustrated in Table 3.

2.4.5. Spatio-Temporal Analysis

The comment data possess temporal and spatial attributes. By extracting the temporal and spatial data from the comments, we can perform temporal analysis and spatial analysis to observe the evolving trends of event popularity over time and the geographical distribution of public sentiment. The spatial distribution is visualized using a Geographic Information System (GIS) platform, enabling us to visualize the spatial patterns.
Through temporal analysis, we can examine the fluctuation in event popularity over time, identifying any noteworthy trends or shifts in public attention. This analysis helps in understanding how the intensity of interest surrounding the event changes over different time periods. Spatial analysis allows us to explore the geographic distribution of public sentiment and the regional variations in the level of attention given to the event. By visualizing these data on a GIS platform, we can gain insights into the areas that exhibit higher levels of engagement or concern, providing a comprehensive understanding of the event’s impact across different geographical locations.

2.4.6. Exploring Spatial Heterogeneity of Comment Data Using a Geographical Detector

To explore the potential factors influencing the spatio-temporal distribution characteristics, we employ a geographical detector. We specifically investigate the correlation between four factors: population, mobile population, per capita GDP, and spatial distance. The geographical detector serves as a tool for examining the spatial heterogeneity of individual variables, offering options such as factor detection, interaction detection, ecological detection, and risk detection. In this study, we focus on factor detection. By utilizing the factor detector, we aim to unveil the spatial heterogeneity of attribute Y and determine to what extent a specific factor X explains the spatial divergence of attribute Y [32]. The expression for this investigation is as follows:
q = 1 h = 1 L N h σ h 2 N σ 2
Within the equation, h = 1, ..., L represents the stratification of the Weibo comment quantity Y. N h and N denote the number of units in stratum h and the entire area, respectively. σ h 2 and σ h 2 represent the variances of the Y values in stratum h and the entire area, respectively. In extreme cases, a q value of 1 indicates that factor X fully controls the spatial distribution of Y, while a q value of 0 suggests that factor X has no relationship with Y. The q value represents the extent to which factor X explains 100 × q % of Y. Through the analysis of the factor detector, we can gain insights into the spatial heterogeneity of attribute Y and the degree to which factor X explains the spatial divergence of attribute Y.

3. Results

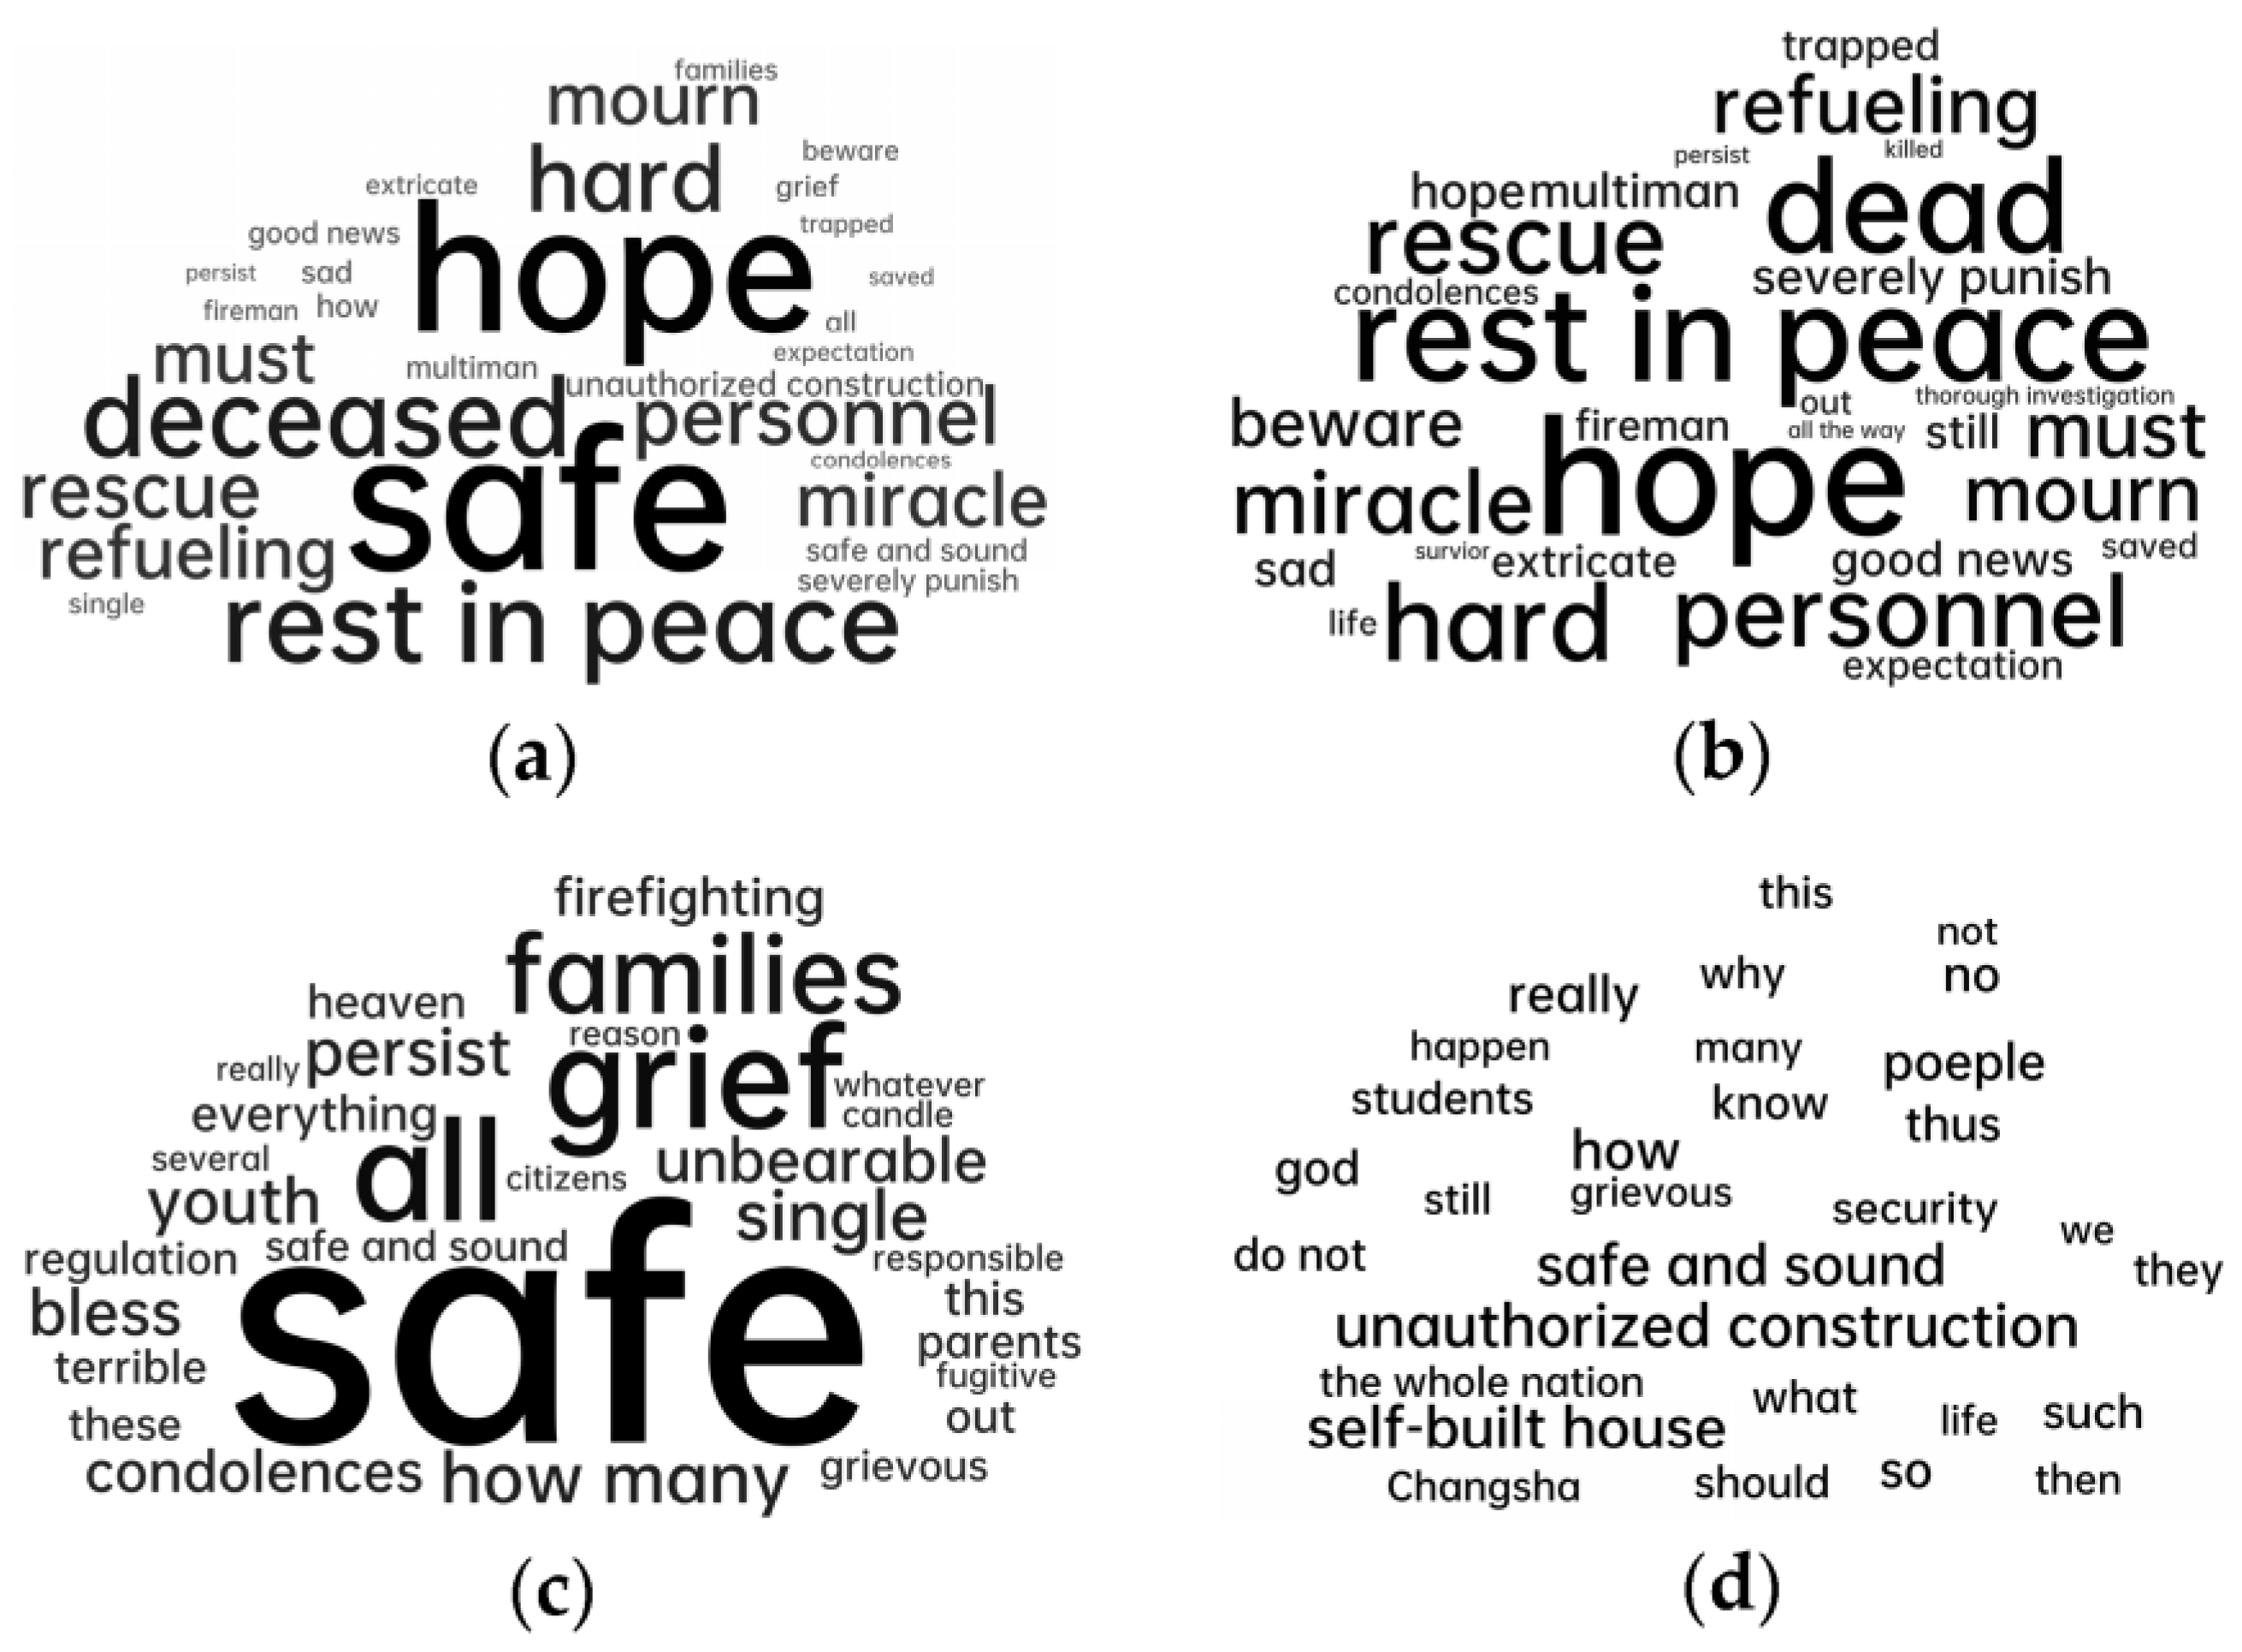
3.1. Topic Mining and Word Frequency Analysis

We utilized a Python segmentation package to segment the collection of comment documents. After merging synonymous high-frequency words, we generated a high-frequency co-occurrence network based on the co-occurrence patterns. The resulting network is depicted in Figure 3. In the graph, each curve represents words that appear together in the same document, with the thickness of the line indicating the frequency of co-occurrence. Thicker lines represent higher co-occurrence frequencies. Each circle represents words that have a higher frequency of occurrence in the document. From the overall analysis of the comments, we observed a high co-occurrence rate between the terms “relevant personnel” and “trapped”, “safe” and “hardworking.” These terms frequently appeared together in the comments, indicating a strong semantic relationship and association among them.
We employed the LDA topic-mining model and pyLDAvis for visualizing the results, as shown in Figure 4. The size and numbering of the bubbles represent the frequency of occurrence for each topic, while the distance between bubbles utilizes JSD distance, indicating the dissimilarity between topics. The right-side panel displays the 30 most relevant words for the overall topics. By conducting perplexity and coherence tests, as shown in Figure 5, it can be determined that the optimal number of topics is three. These parameters indicate that there are 20 iterations in the process, with Alpha set to 0.6 and Beta set to 0.01. The comments can be summarized into the following themes: “Rest in Peace for the Deceased”, “Wishing Everyone Safety”, and “Thorough Investigation of Self-Built Houses”. These three topics have distinct sets of characteristic words, without any overlapping terms.
We have created word cloud visualizations for the top 30 high-frequency words in each topic, as depicted in Figure 6. The commonly occurring high-frequency words in the overall comments include “safety”, “hope”, “rest in peace”, “moment of silence”, “rescue”, and others. These can be summarized into three main aspects: mourning for the deceased, expressing positive emotions and hopes for the rescue of more trapped individuals, and expressing gratitude towards the rescue personnel. For Theme 1, “Rest in Peace for the Deceased”, the high-frequency words include “hope”, “deceased”, “rest in peace”, “rescue”, “miracle”, and others. For Theme 2, “Wishing Everyone Safety”, the high-frequency words include “safety”, “heartache”, “family”, “everyone”, and others. For Theme 3, “Thorough Investigation of Self-Built Houses”, the high-frequency words include “illegal construction”, “self-built houses”, “deceased”, and others.

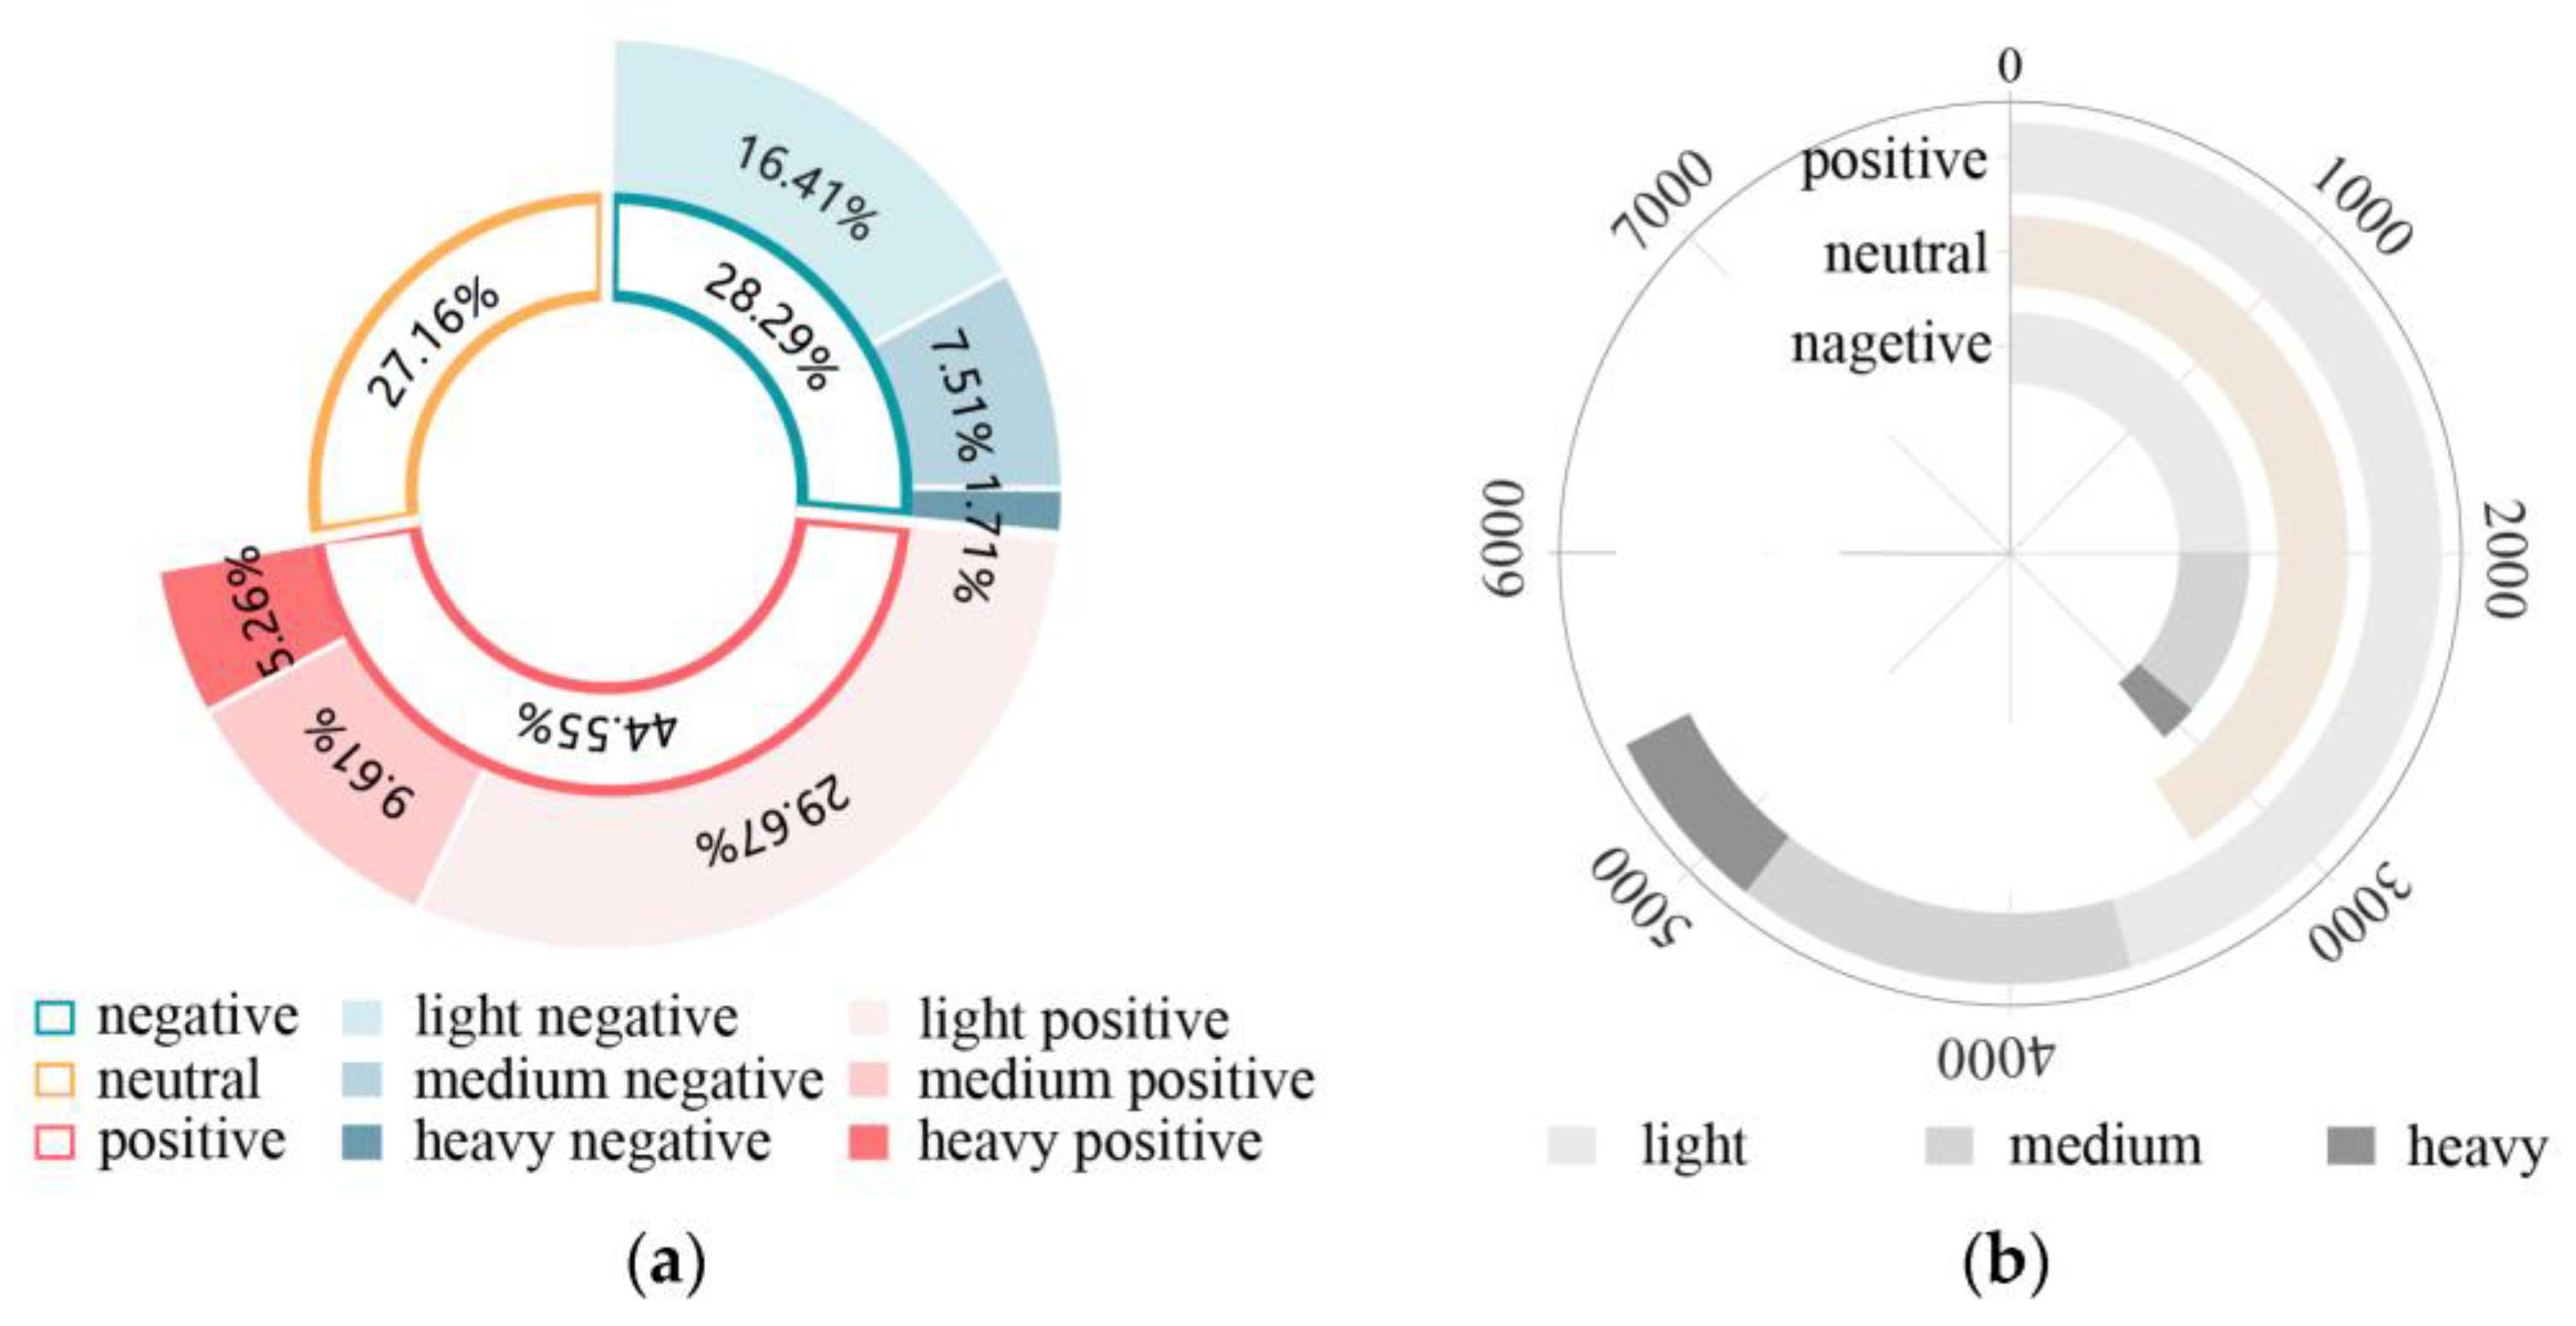
3.2. Sentiment Analysis

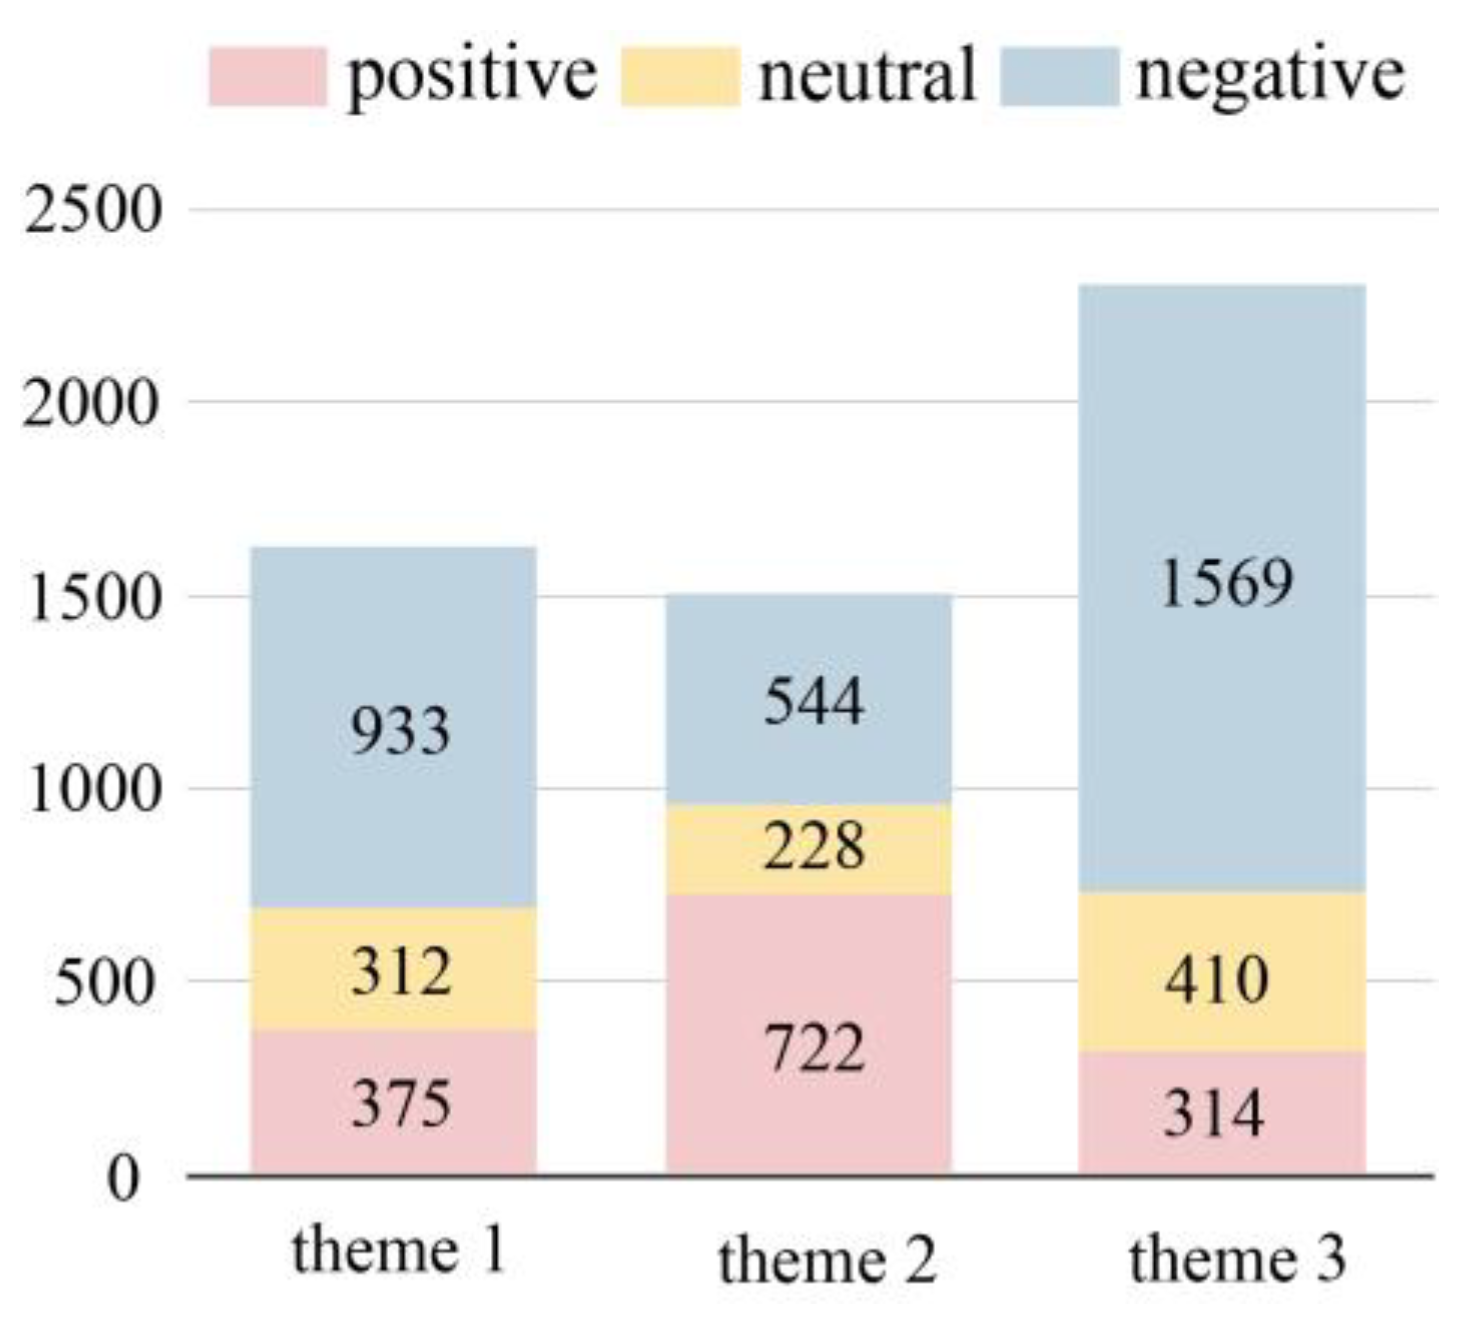
3.2.1. Overall Sentiment Analysis

We conducted a comprehensive sentiment analysis of Weibo comments related to the event using ROST Content Mining 6.0. Overall, we found that out of the total comments, 5484 (44.55%) expressed a positive sentiment, 3344 (28.29%) had a neutral sentiment, and 3483 (27.16%) conveyed a negative sentiment (refer to Figure 7). The sentiment polarity varied across different topics (see Table 4 and Figure 8). Theme 1 and Theme 3 exhibited a slightly negative sentiment with sentiment values of −3.32 and −5.96, respectively. In contrast, Topic 2 had the most positive sentiment with a sentiment value of 3.39. The relationship between sentiment values and spatial distribution is illustrated in Figure 9. The sentiment values ranged from −2 to 8. Overall, most provinces, municipalities, and autonomous regions displayed a positive sentiment in their comments, with the majority of regions having positive sentiment values. However, six provinces, municipalities, and autonomous regions exhibited negative sentiment values, while Hunan Province had a slightly below-average sentiment value.

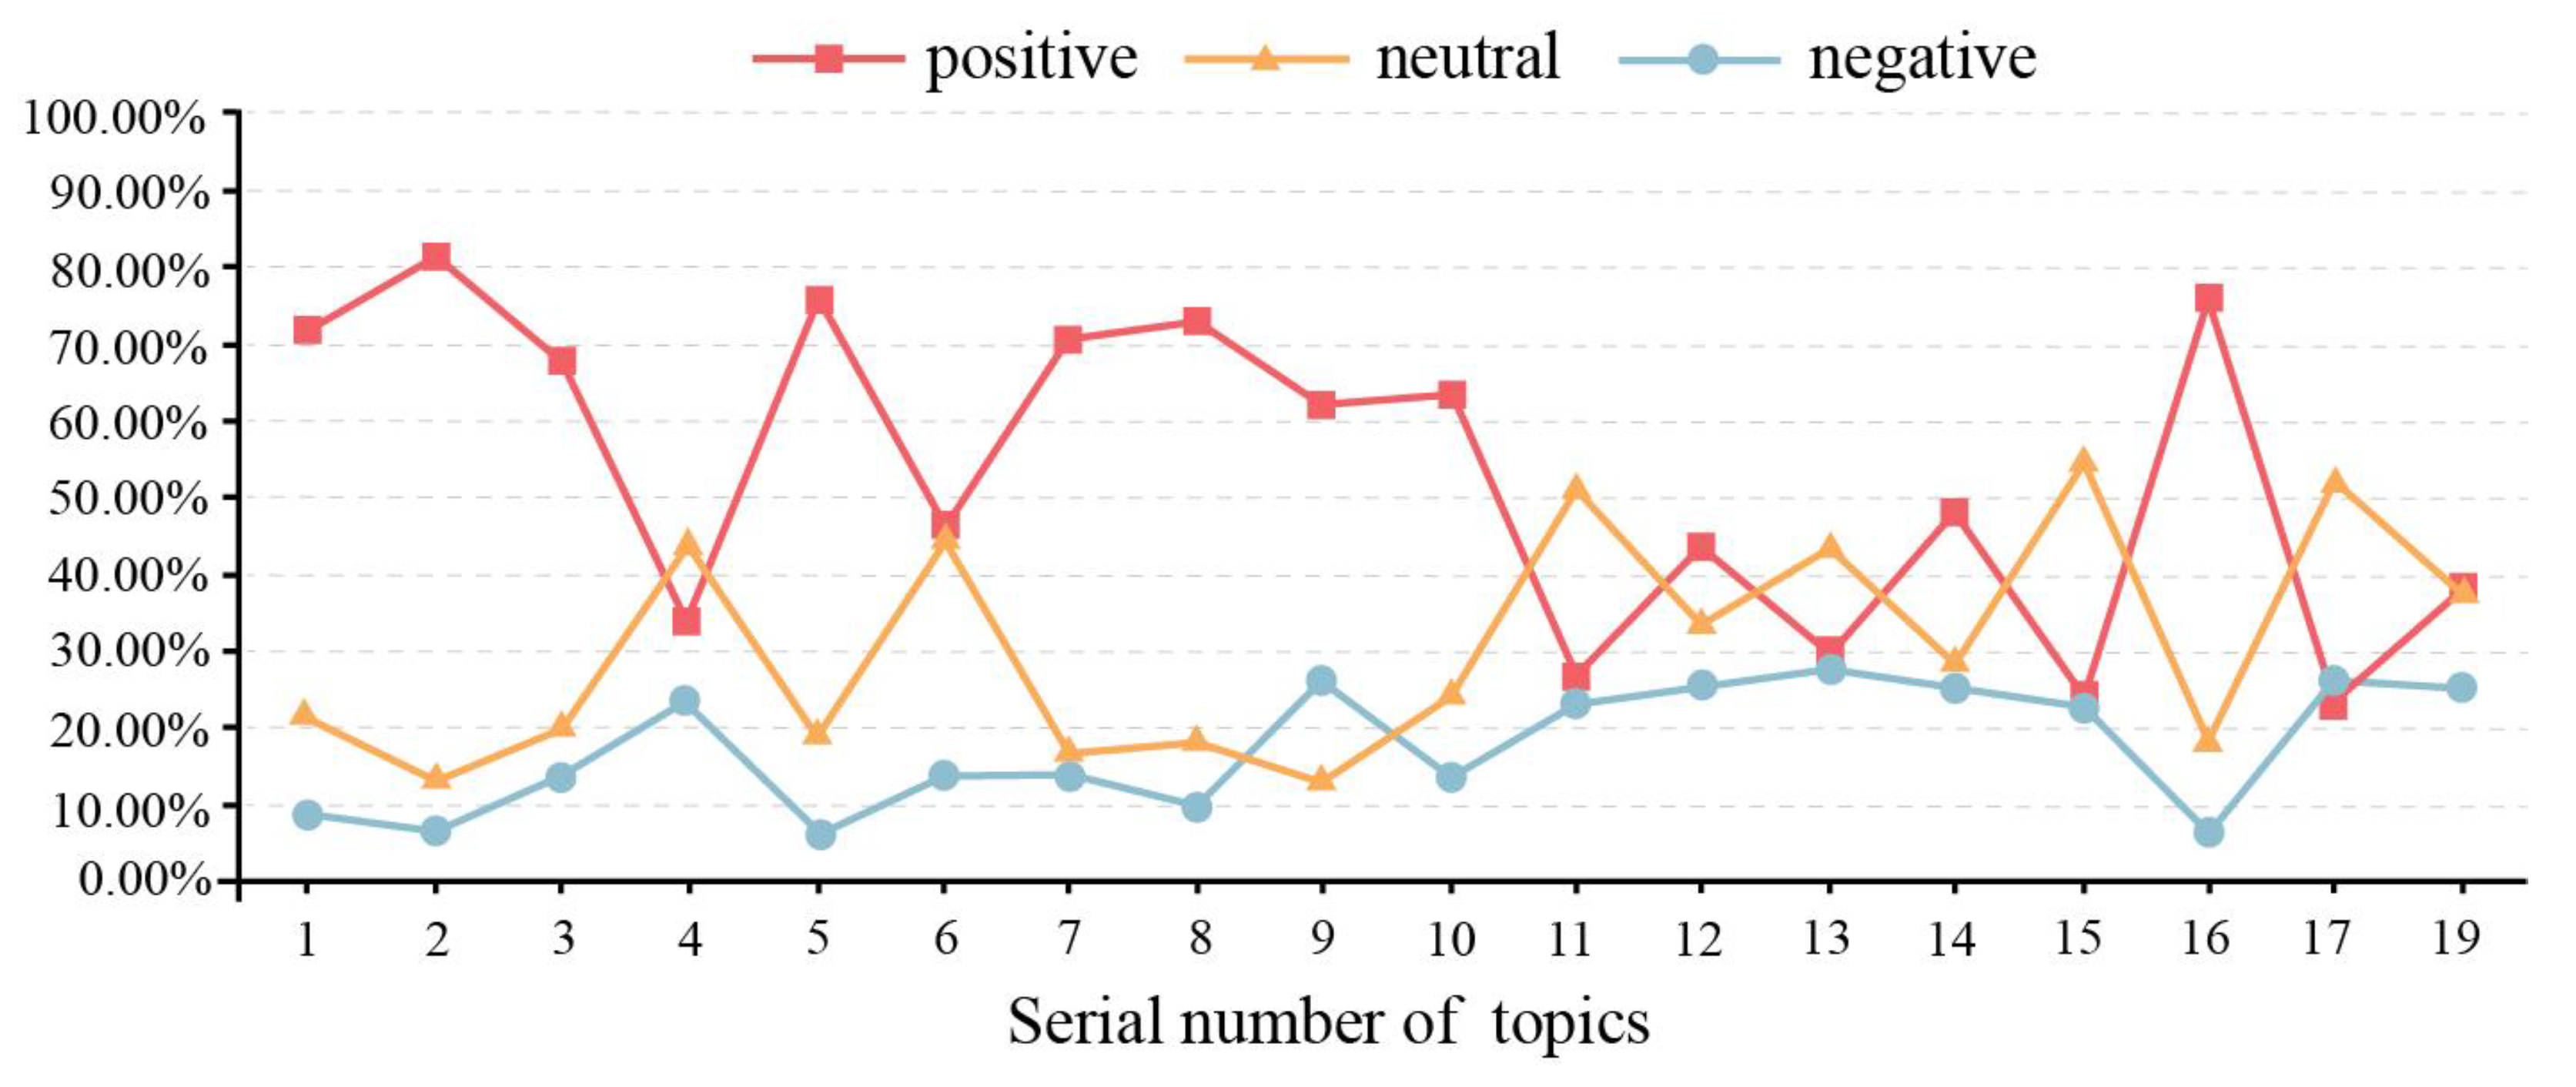
3.2.2. Relationship between Emotional Polarity and Weibo Content Variation

We conducted an analysis of the sentiment polarity for each topic and generated a relationship graph depicting the change in sentiment polarity, as shown in Figure 10. Overall, it can be observed that different topics have a significant impact on sentiment polarity. Out of the 18 topics, 9 topics have more than 50% of their related comments expressing positive sentiment, while none of the topics have more than 30% of comments expressing negative sentiment. The polarity of positive and neutral sentiment shows more fluctuations compared to negative sentiment, which exhibits relatively smoother variations. In terms of the timeline, it is evident that the earlier topics had a higher proportion of positive sentiment, which declined significantly in the later stages. On the other hand, neutral comments experienced a substantial increase in the later stages.
During the release of topics “#Collapse of a building in Changsha#” (topic 1) and “#Challenges in the rescue operation of the Changsha building collapse accident#” (topic 3), this was the initial phase of the incident and the beginning of the rescue efforts. At that time, the public did not have sufficient understanding of the cause of the accident, the severity of the situation, or the number of casualties. Therefore, the dominant sentiment expressed was the positive emotion of wishing for quick rescue and the safety of the victims. Topics where positive sentiment accounted for less than one-third of the total sentiment include “#9 people involved in the Changsha self-built building collapse accident have been criminally detained #” (topic 4), “#9 people involved in the Changsha self-built building collapse accident have been arrested #” (topic 11), “#Rescue personnel at the Changsha collapse site observe a moment of silence for the victims#” (topic 13), “#26 people confirmed dead in the Changsha self-built building collapse accident#” (topic 15), and “#53 people confirmed dead in the Changsha self-built building collapse accident#” (topic 17). In these topics, which focus on accountability and the casualties of the accident, the public displayed a higher proportion of negative sentiment.

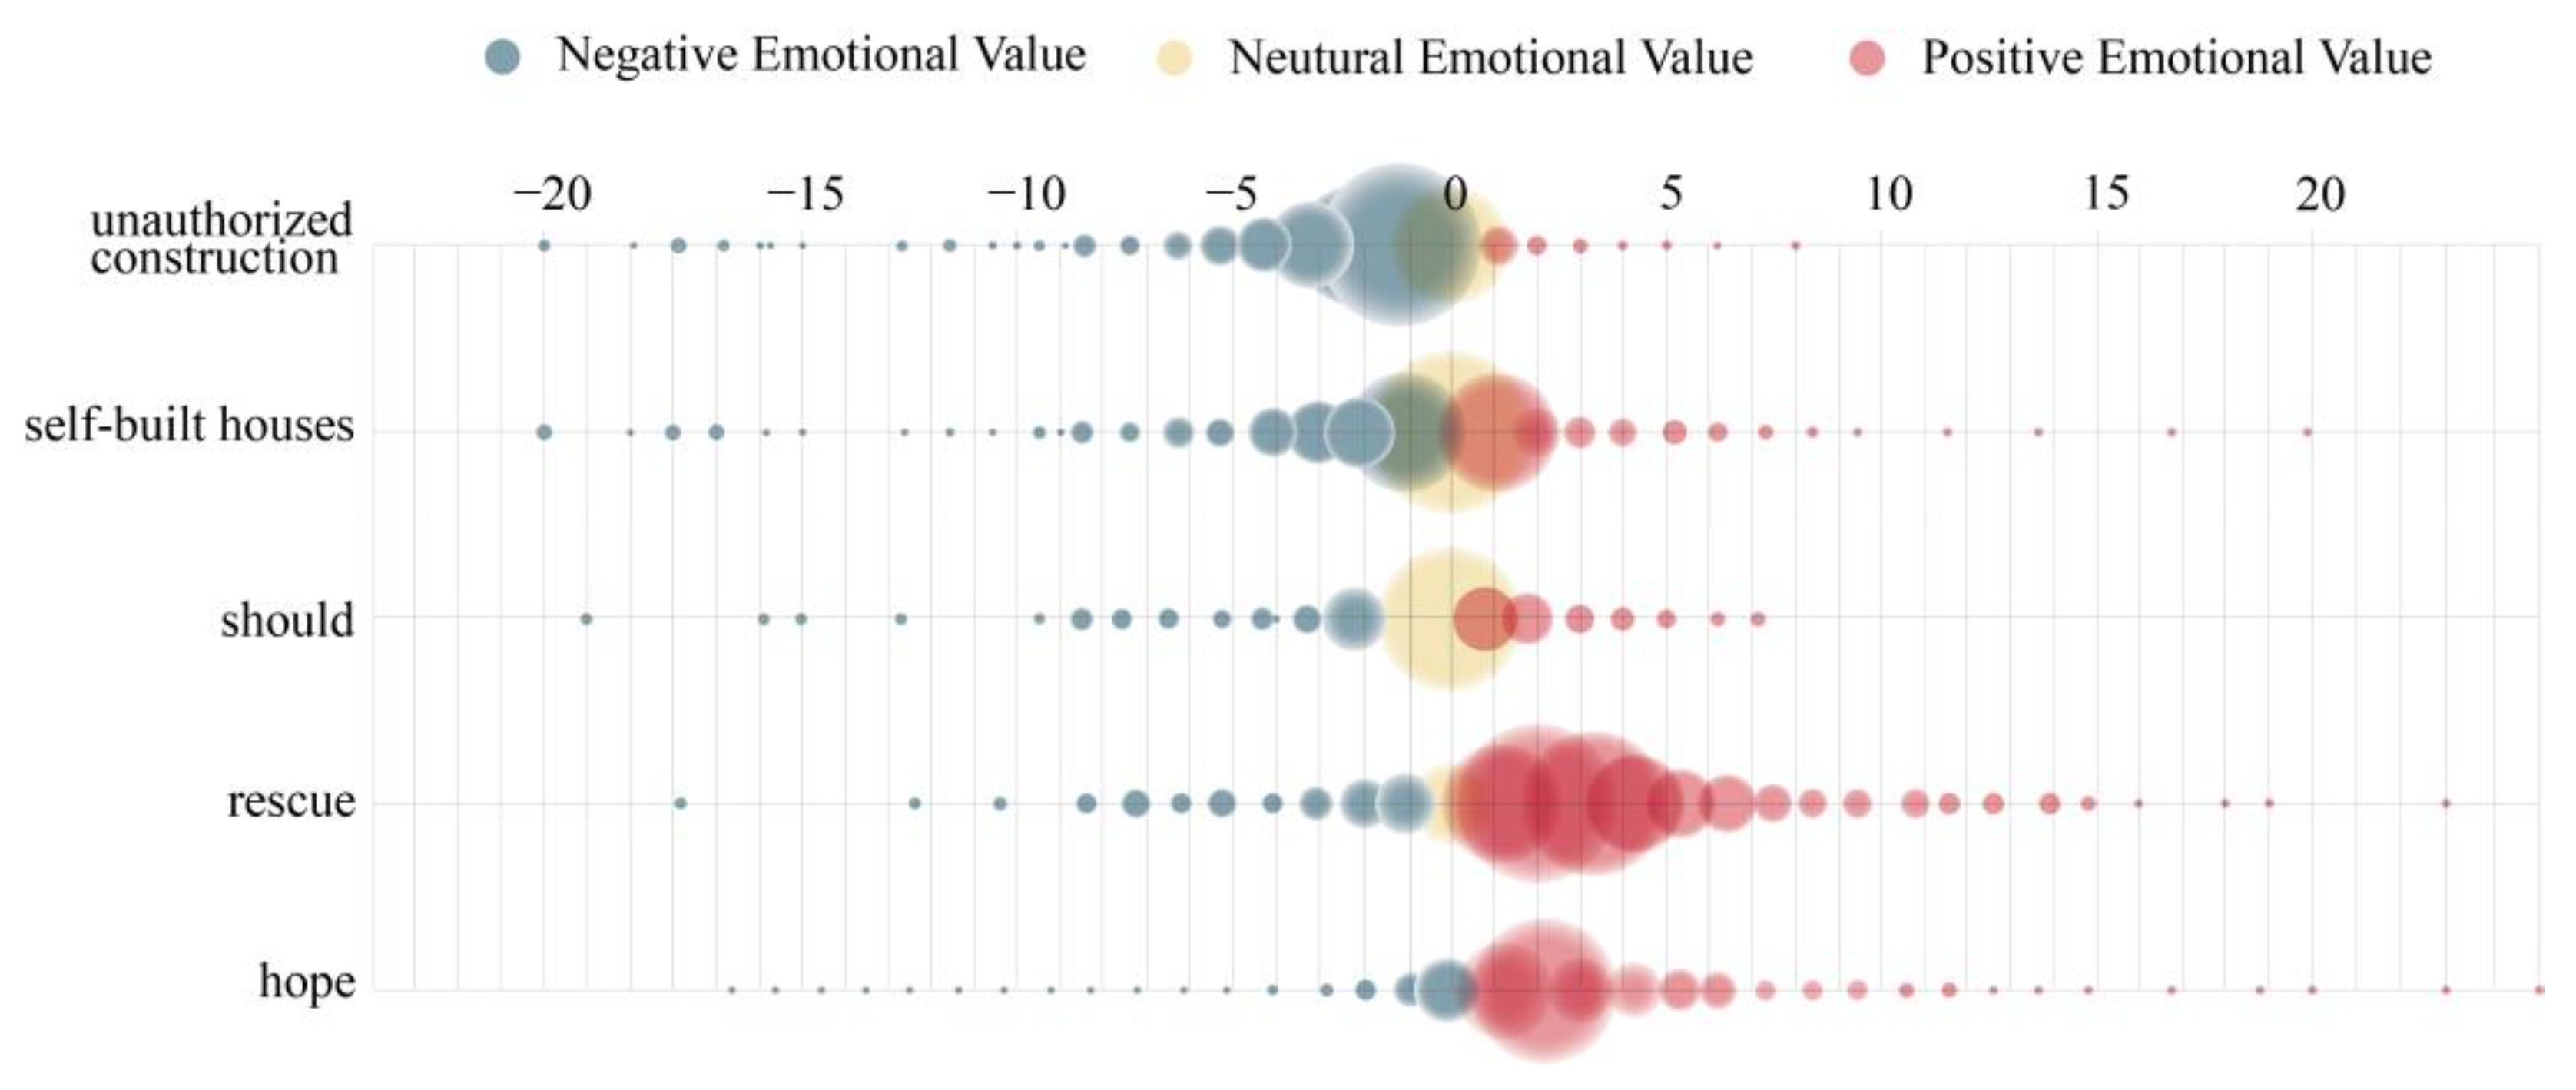
3.2.3. Sentiment Analysis of Specific Words

Public opinions refer to the public perception or emotional responses regarding various aspects of social life, especially hot topics. In the case of urban emergencies, the comments and discussions containing public sentiment not only reflect the emotional characteristics of the public but also contain a substantial number of opinions and suggestions regarding the handling of the incident, relevant urban departments, or specific individuals responsible for city activities. Analyzing these suggestive comments, opinions, and emotional characteristics can provide timely insights into public sentiment and offer valuable references for urban management activities by relevant authorities. Such comment texts often contain certain characteristic words. For example, comment texts with location-specific nouns usually reflect the commentator’s views on similar urban issues in that location. For instance, under the topic “#The State Council establishes an investigation team for the collapse incident of self-built houses in Changsha#”, a comment like “In addition, please conduct a thorough investigation of the backstreets near major universities in Changsha. There are many self-built houses along the Changsha Lishan Express Line, especially shops on the basement level. Please conduct a strict investigation!” carries the word “should”. The term “should” is commonly used in the context of suggestions or expressing something that is deemed necessary or expected. In Weibo comments, comments related to “should” usually contain the public’s opinions or suggestions regarding the current event. Therefore, analyzing comments containing such vocabulary for sentiment polarity and text analysis can provide timely insights into the public’s opinions and suggestions regarding the event.
In this manuscript, we attempted to analyze the sentiment values of comments containing five selected vocabulary words: “illegal construction”, “self-built houses”, “rescue”, “hope”, and “should”. These words were chosen based on their frequency ranking among the top 10 words in the overall comment dataset. By analyzing the sentiment values of comments containing these words, we examined the relationship between the sentiment values and the corresponding comment counts. The findings were then visualized in a relationship graph, as shown in Figure 11. From the distribution of sentiment values, it can be observed that the sentiment values follow a normal distribution in relation to the number of posts. Comments related to self-built houses and illegal construction tended to be more negative overall, while comments related to rescue efforts and expressions of good wishes were more positive in nature. Regarding comments involving the word should, the average sentiment value was −0.43, slightly leaning towards negativity. Upon reviewing the related content, it is evident that there is a strong demand from the public for relevant authorities to intensify penalties and crack down on illegal construction activities. Some comments from netizens include “The relevant authorities should pay attention to the approval process, construction supervision, and monitoring mechanisms”, “Rescue efforts should continue”, and “no hope should be abandoned”.

3.3. Analysis of Spatio-Temporal Distribution and Influencing Factors of Comment Texts

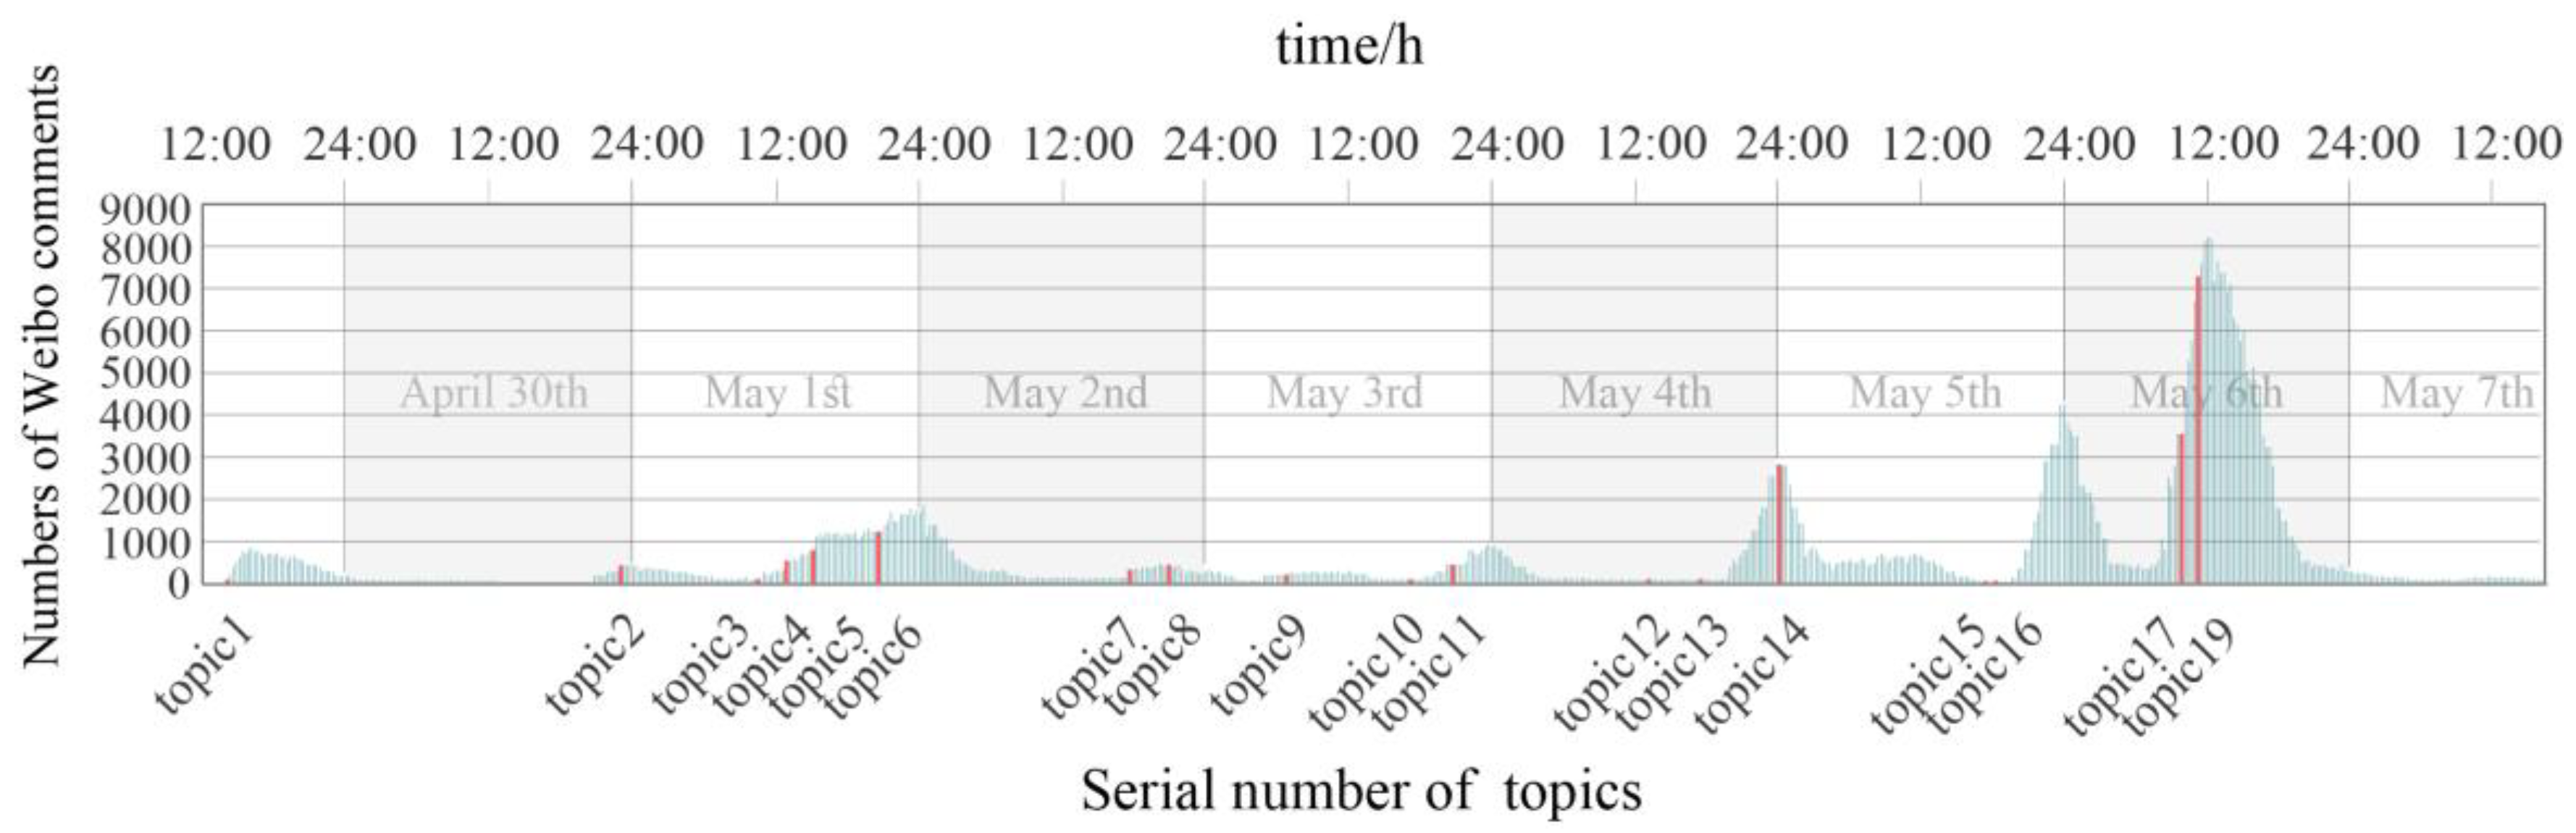
3.3.1. Temporal Distribution Characteristics of Weibo Comments

In comparison to the publication time of the People’s Daily, it is evident that the peak of engagement in microblog comments generally occurs approximately one to two hours after the initial post, as depicted in Figure 12. The majority of these peaks are observed around noon and midnight. The comment volume exhibits a cyclical pattern, with higher levels of activity observed on 4 May, 5 May, and 6 May. Notably, on May 6th, there was a sudden surge in comment volume, reaching its maximum around 12 o’clock.

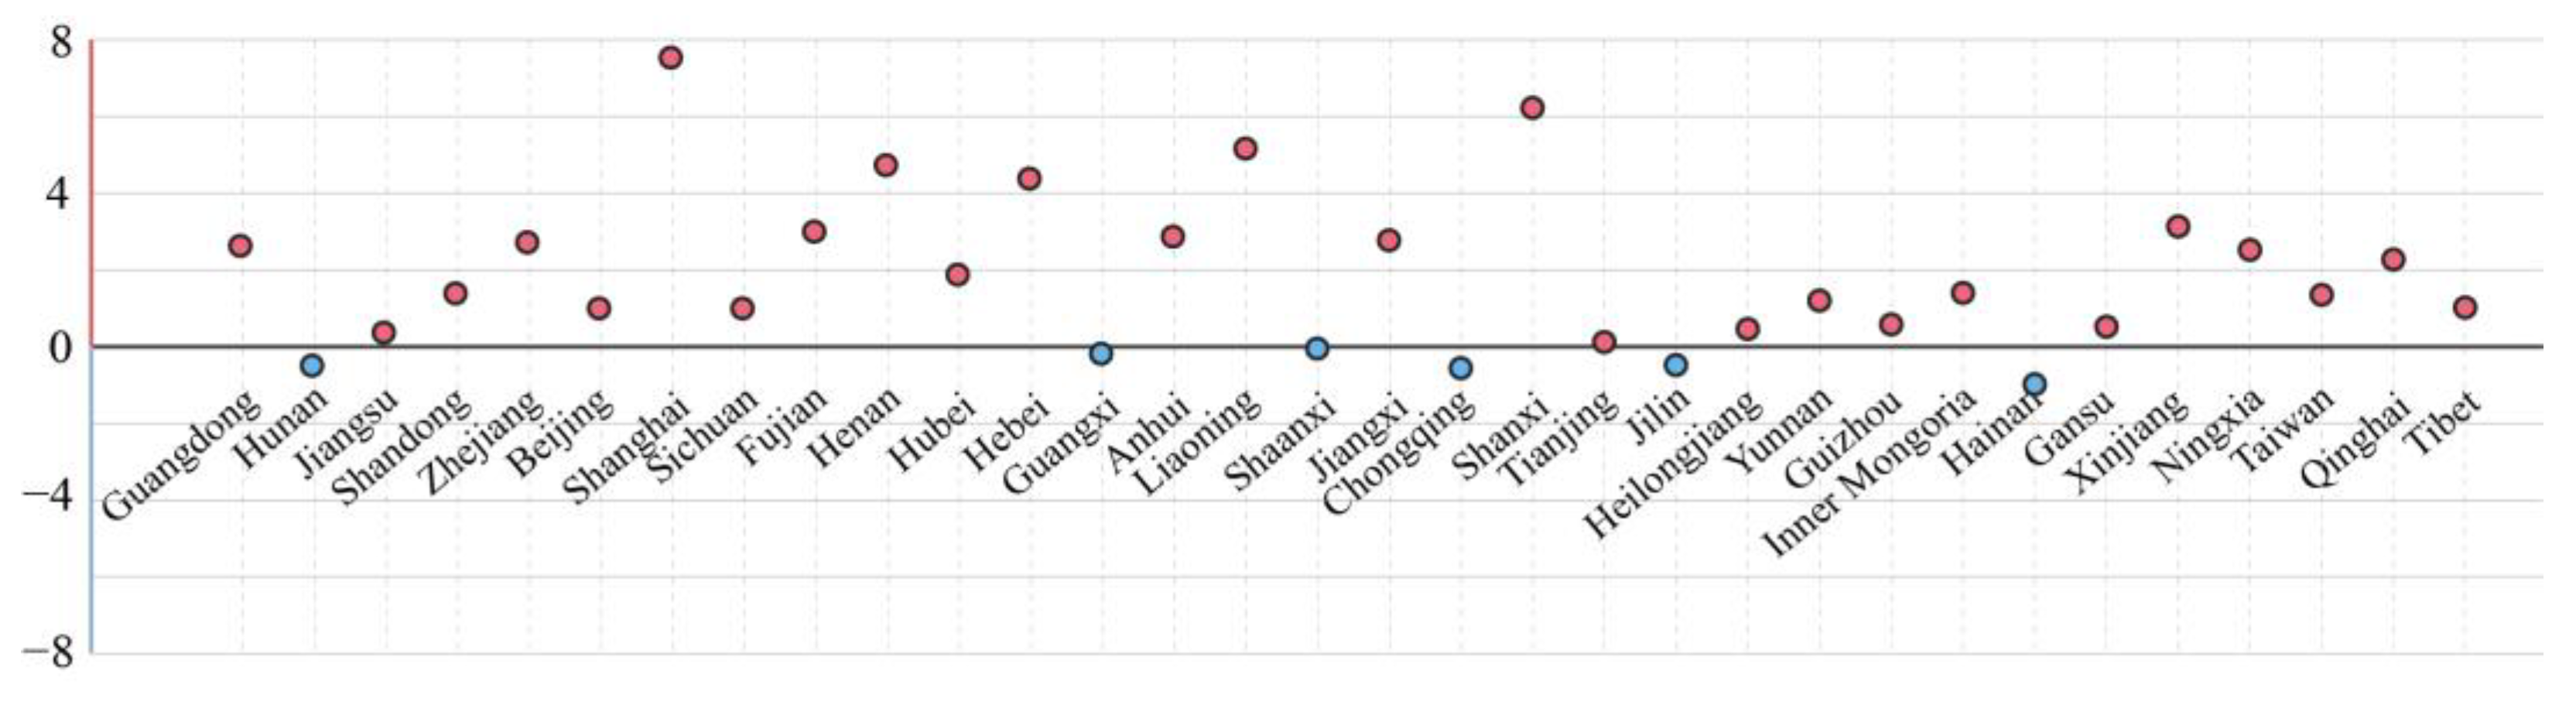
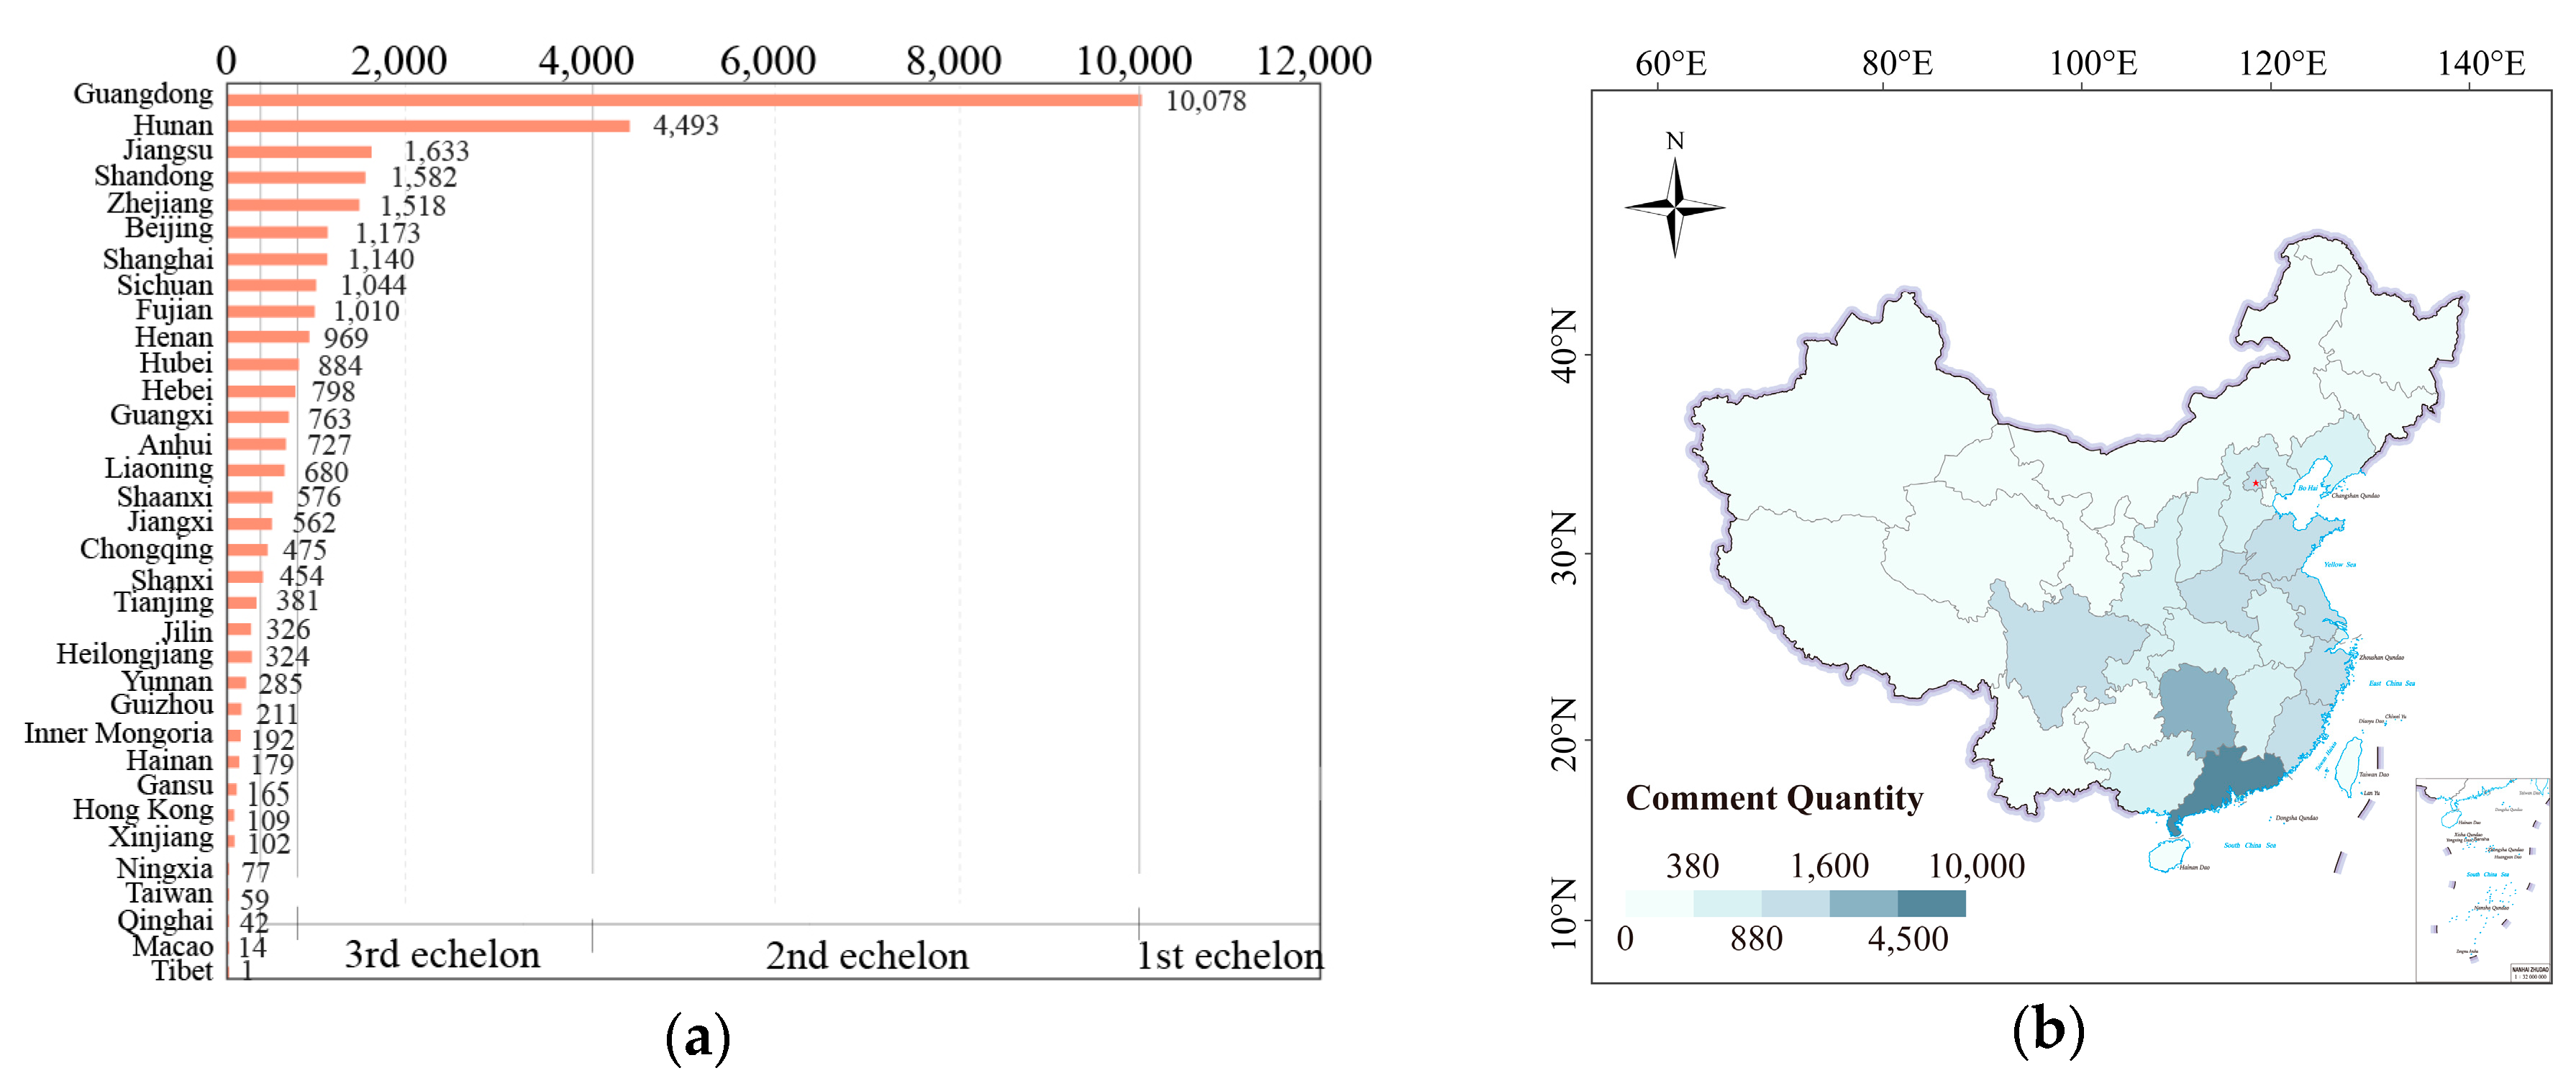
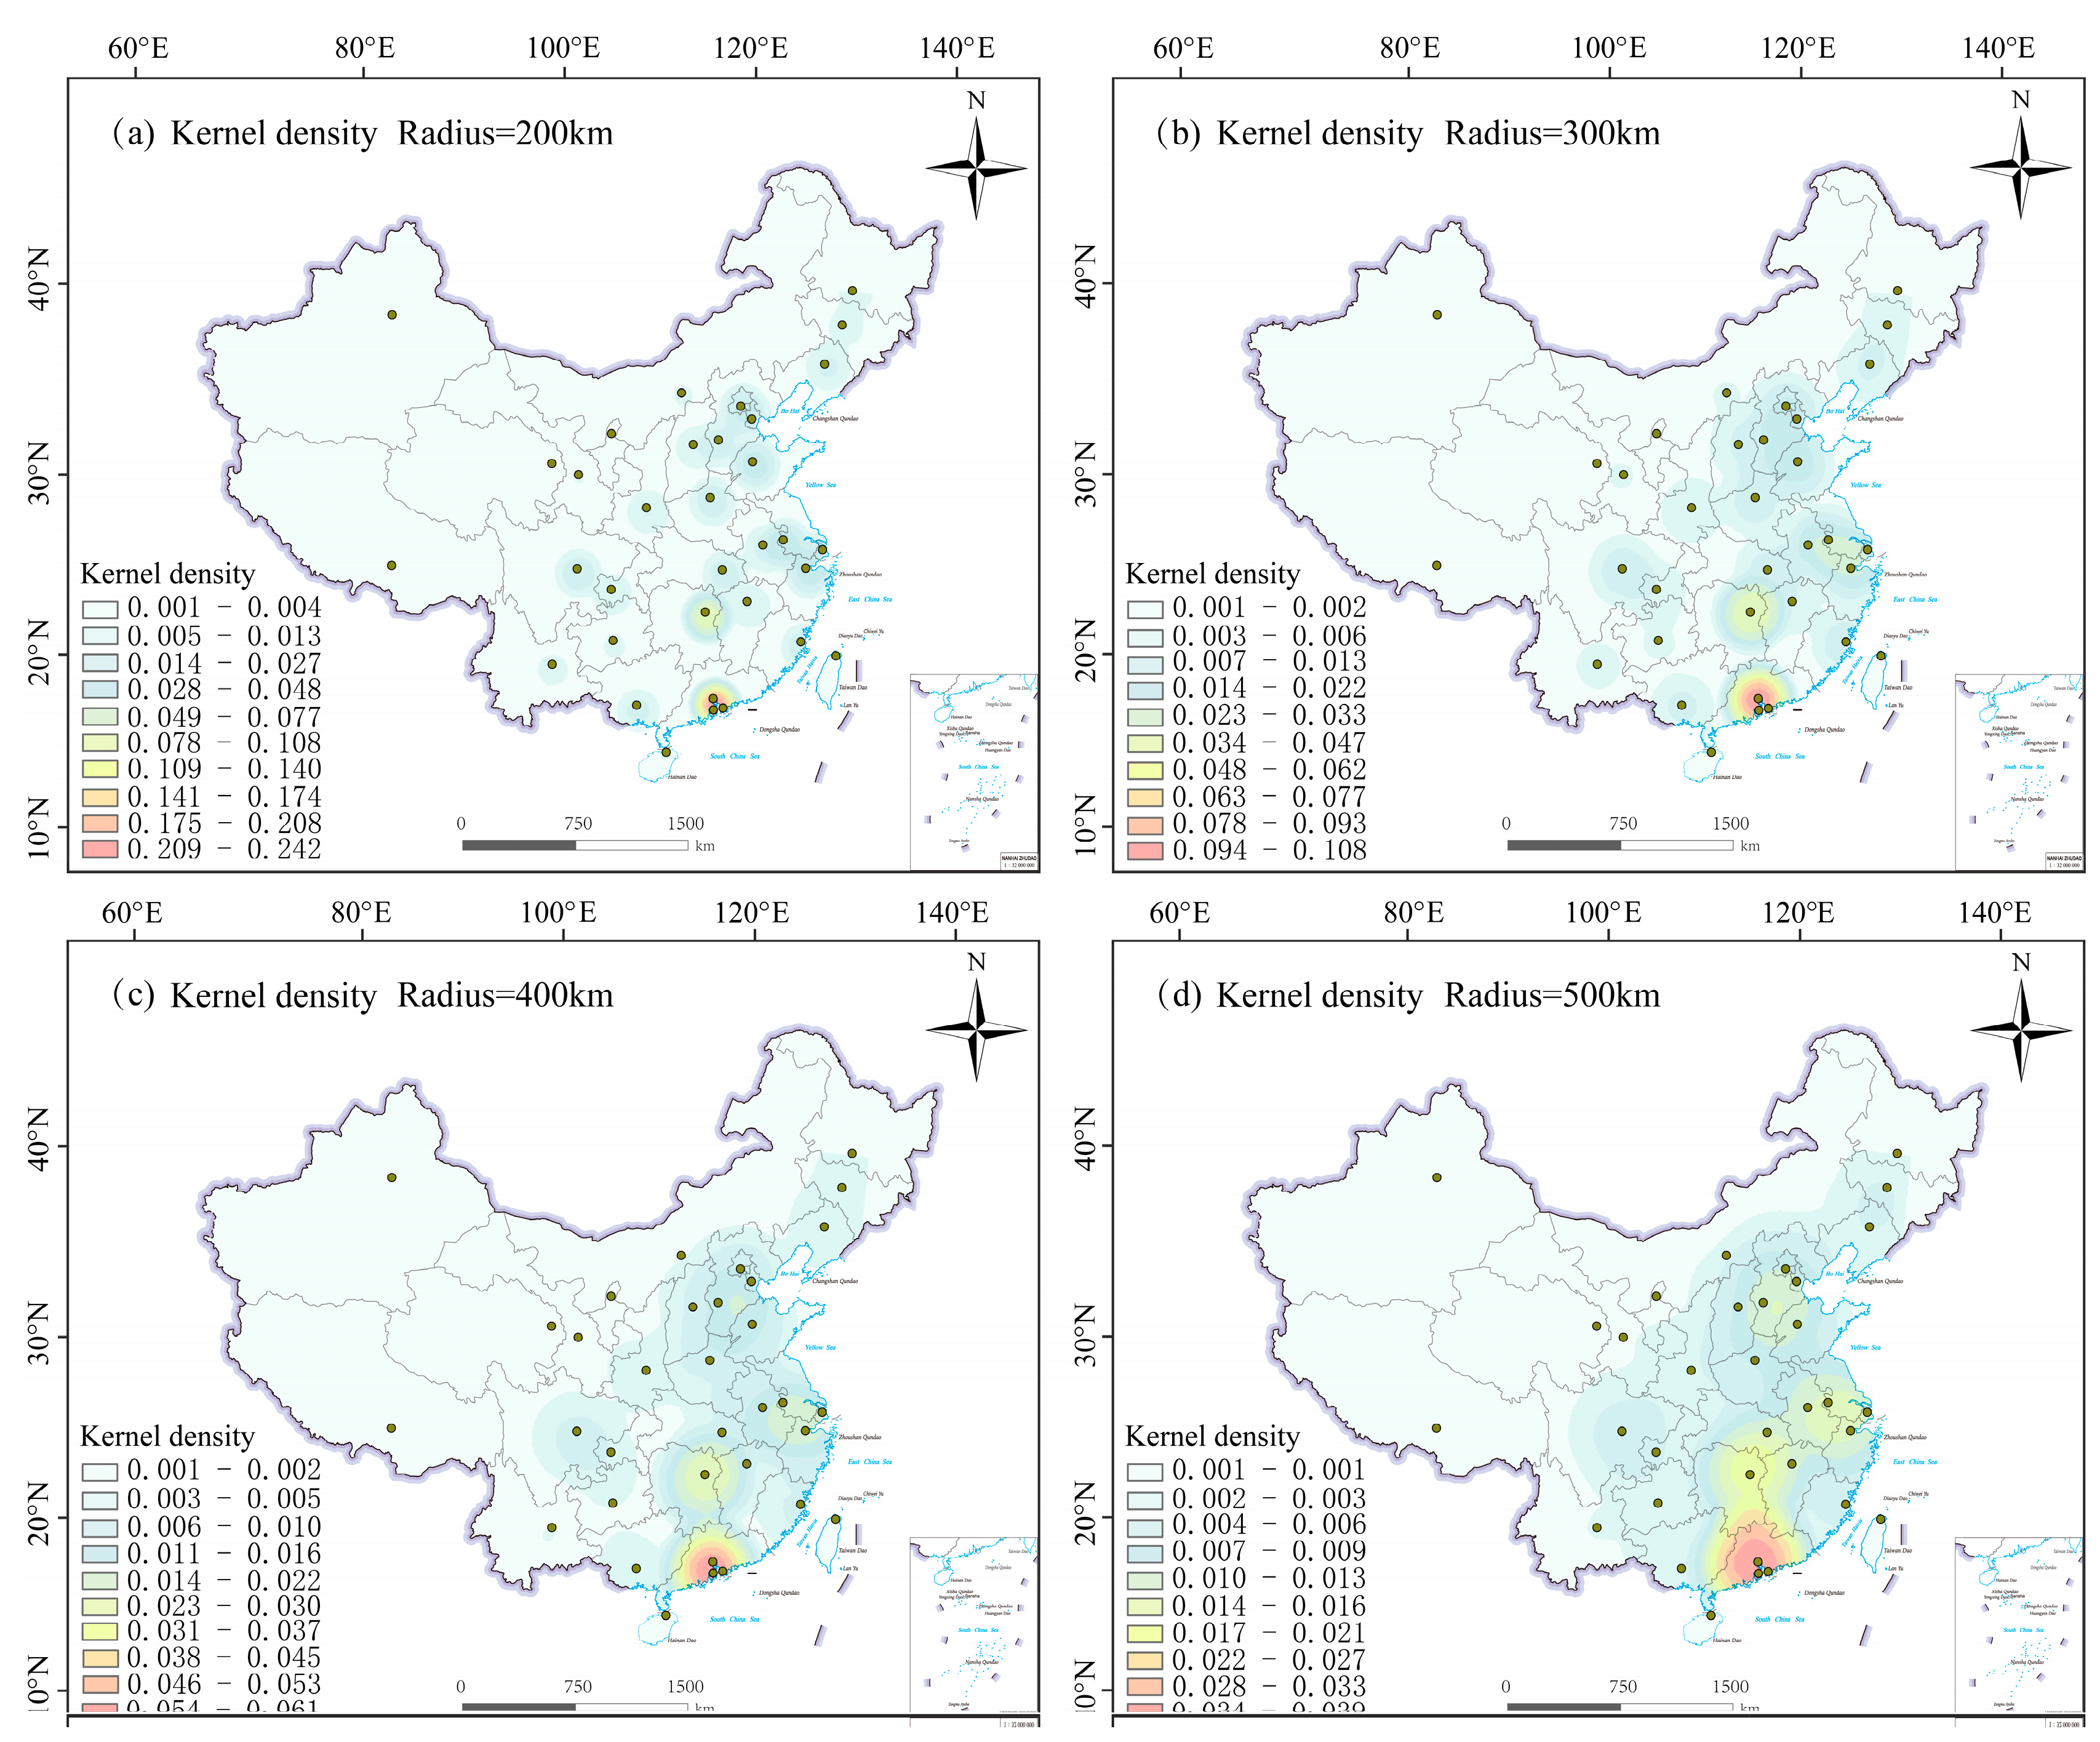
3.3.2. Spatial Distribution Characteristics of Weibo Comments

The spatial distribution of microblog comments is illustrated in Figure 13. Figure 13 reveals a distinct staircase pattern in the comment volume. The first tier is dominated by Guangdong Province, surpassing even the comment count from the incident’s location, Hunan Province, by more than twice the amount. The second tier includes the southeastern coastal regions, as well as Beijing and Sichuan Province. The central region forms the third tier, while the western and northwestern regions exhibit the lowest comment counts.
The spatial kernel density characteristics of microblog comments at different scales can be visualized by setting different search radii, as shown in Figure 14. Results with a search radius of 200 km reveal Guangdong as the focal center, surrounded by Hunan, Shanghai, Fujian, Chengdu, Beijing, and others, forming a scattered star-shaped distribution. Results with a search radius of 300 km highlight Guangdong and Hunan as the core areas, with Jiangsu, Zhejiang, and Shanghai standing out, and a continuous trend observed in Shanxi, Hebei, Shandong, and Henan. Results with a search radius of 400 km demonstrate the emergence of the core trend in the Beijing–Tianjin–Hebei region. Finally, results with a search radius of 500 km accentuate a contiguous regional pattern centered around Guangdong, the junction area of Hunan, Jiangxi, Hubei, Anhui, Shanghai, Zhejiang, and Beijing–Tianjin–Hebei.

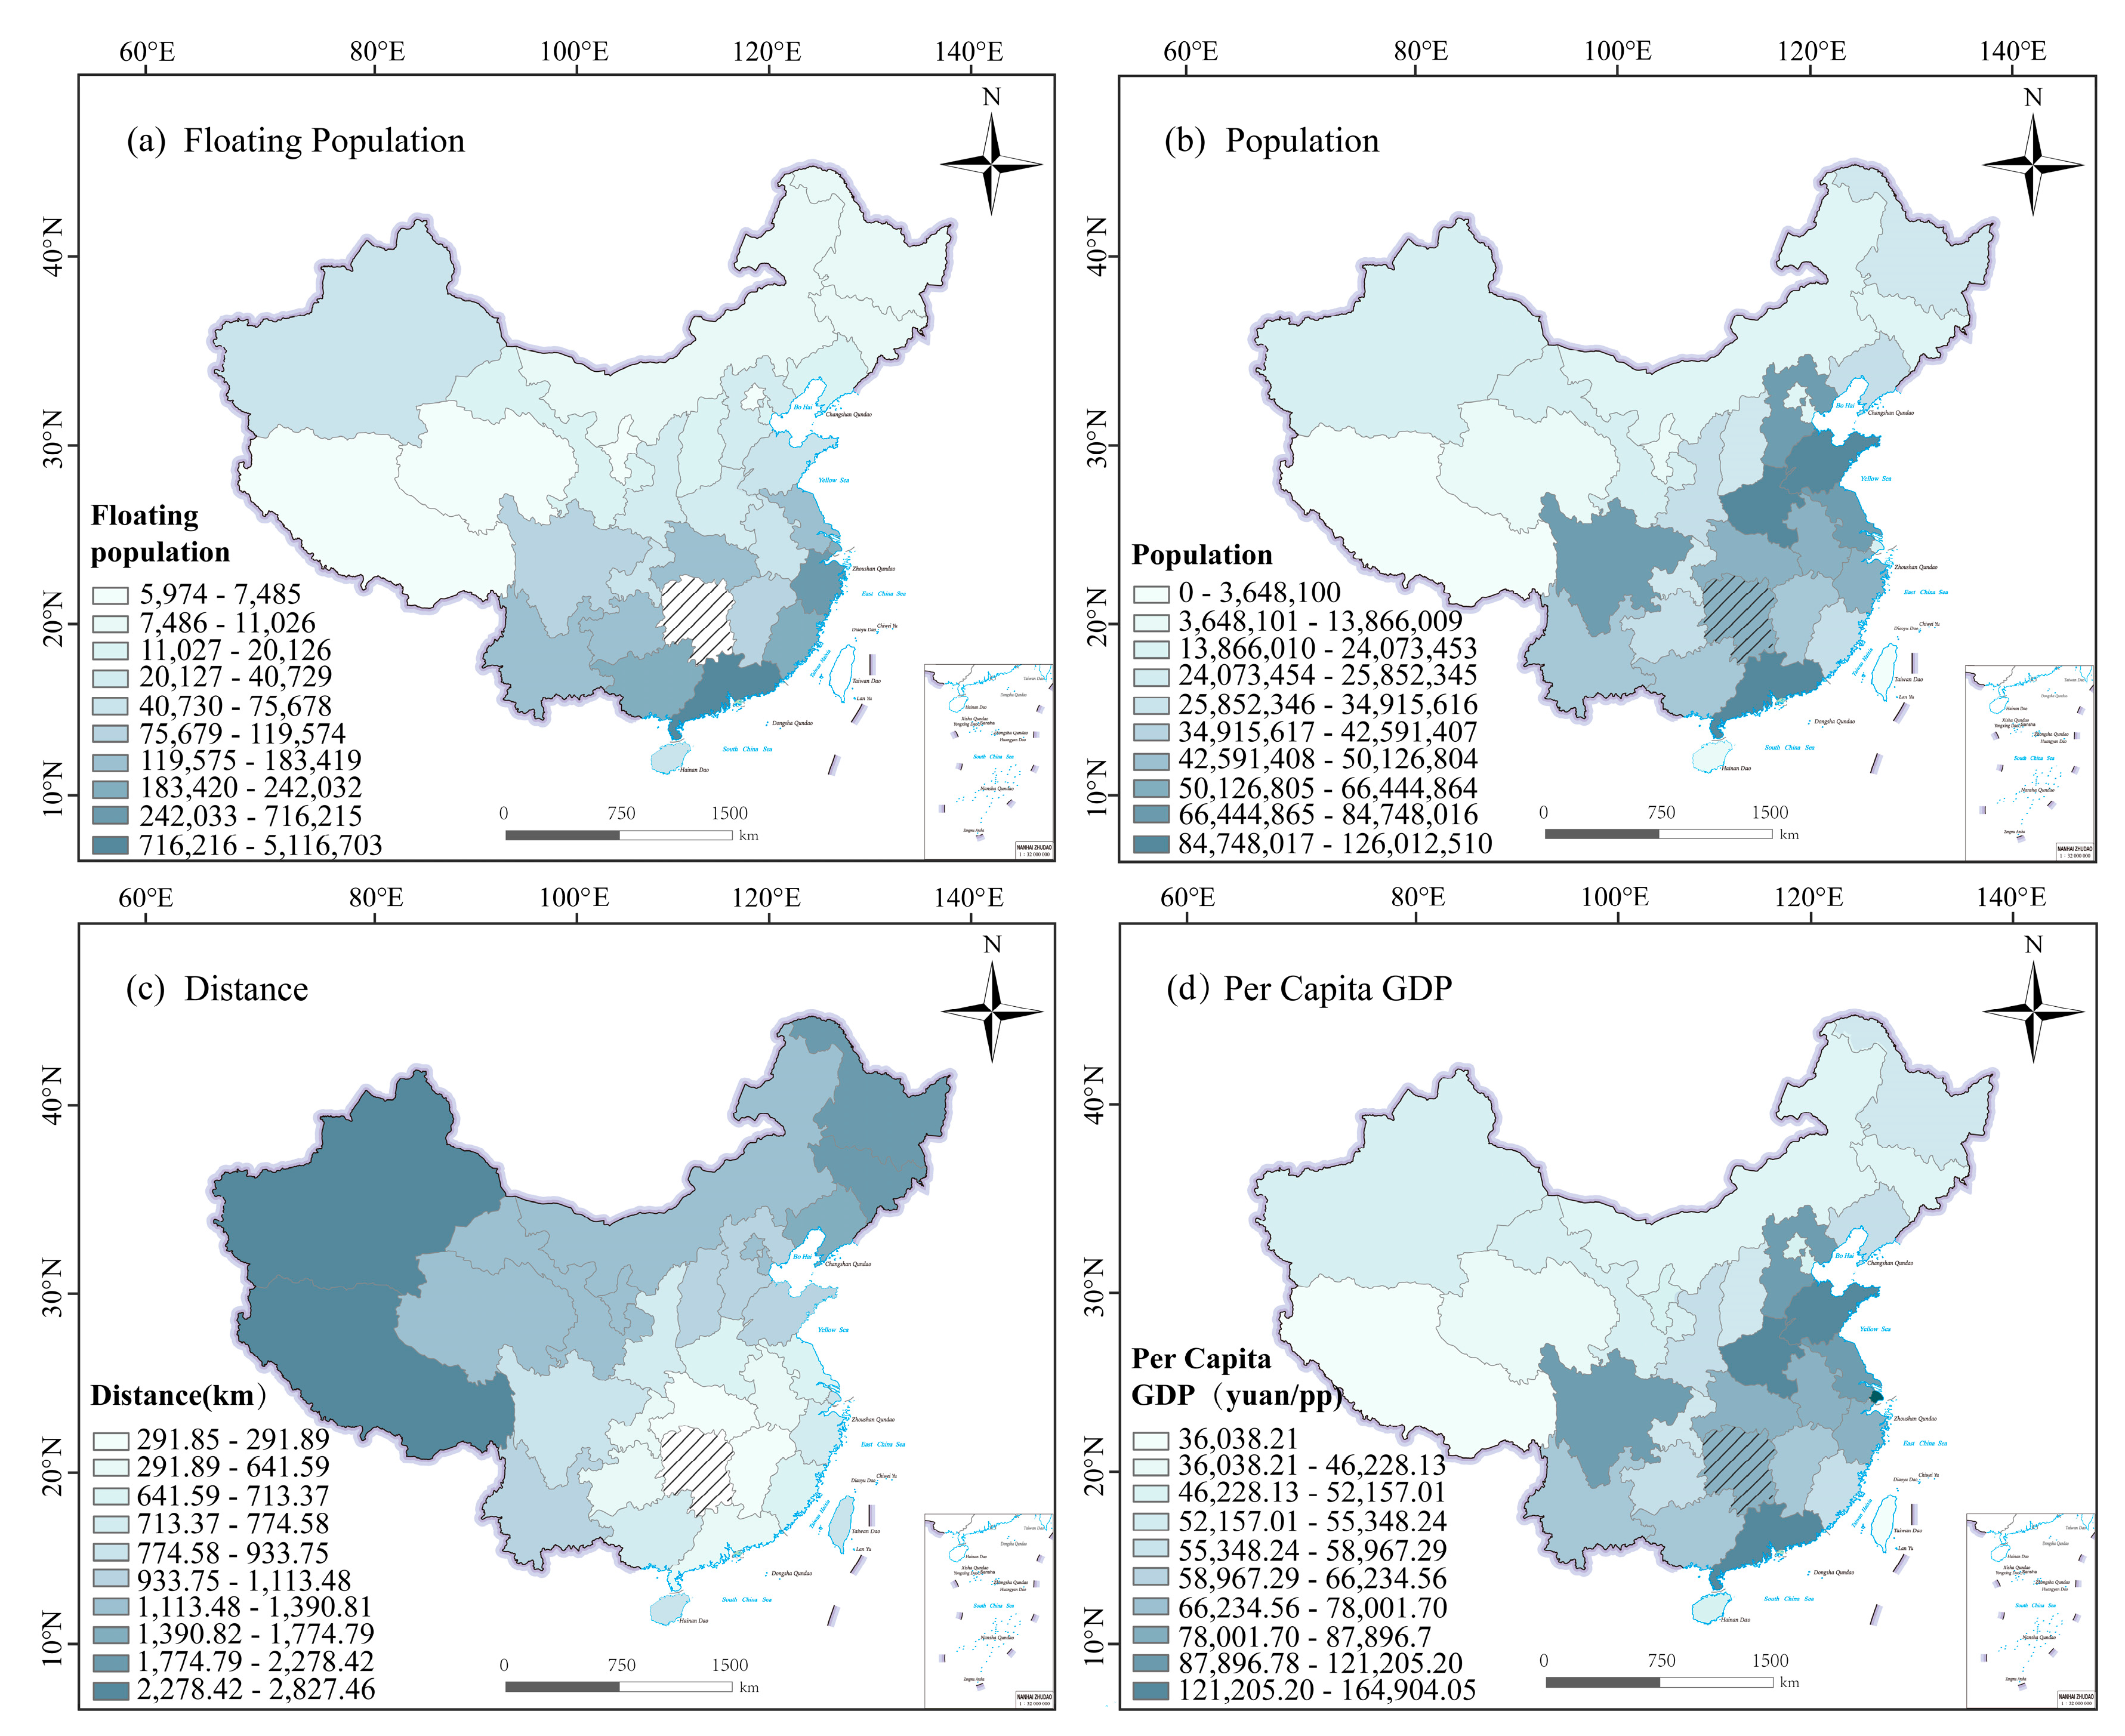
3.3.3. Analysis of Factors Influencing Spatial Divergence of Weibo Comments

Based on Figure 13a, it is evident that there is a significant difference in the number of microblog comments across provinces, with Guangdong Province surpassing Hunan Province, where the incident occurred. In this section, we use a geographic detector to speculate about and verify the reasons for this difference. According to the results of the seventh population census, Guangdong Province has the highest outflow of population from Hunan Province, with a total of 5.1167 million people moving to Guangdong Province. This suggests a potential relationship between the high number of comments from Guangdong Province and this population movement. Additionally, we selected three factors, namely, population, per capita GDP, and distance from Hunan Province, as independent variables (x), and the number of comments from each province as the dependent variable (y). We transformed the data for the outflow of population from Hunan Province to other provinces, the population of each province, the distance between each provincial capital and Changsha (the capital of Hunan Province), and the per capita GDP of each province into categorical data. Using the natural break method in ArcGIS, we divided the data into ten categories, as shown in Figure 15. Subsequently, we calculated the y values along with the processed x values in the geographic detector, and the results are presented in Table 5.
The q-value measures the explanatory power of the independent variable x on the dependent variable y, with a higher q-value indicating a stronger explanatory power. The p-value represents the probability, indicating the likelihood of x explaining y, with a smaller p-value indicating more reliable results. For the factors of the outflow of population from Hunan Province and per capita GDP, the corresponding q-values are 0.965099 and 0.963853, respectively, with both p-values being 0. This suggests a significant correlation between spatial differences and the population outflow and per capita GDP. On the other hand, the factors of population and distance have q-values of 0.258924 and 0.215676, respectively, with p-values of 0.79695 and 0.84563. This indicates a weak relationship between spatial differences and population and distance.

4. Discussion

4.1. Analysis of Topic and Word Frequency

In this article, the term “rest in peace” appears 7193 times, making it the most frequent term. It is closely related to the topic of “53 people confirmed dead in the Changsha self-built building collapse accident”, representing the sentiment of wishing for peace and safety. Other related terms include “wishing for safety” and “safety”. From the high-frequency word network diagram, it can be observed that the public shows a high level of concern for the trapped individuals and the issue of self-built houses itself.

4.2. Sentiment Analysis

In general, the comments regarding this incident are mostly positive, with the public expressing concerns for the trapped individuals and paying tribute to the rescue workers. In both positive and neutral sentiments, the majority of comments fall under the “moderate” category, accounting for over 50% of each sentiment category. This indicates that the public’s emotions remained relatively stable throughout the various stages of the incident. Looking at the spatial distribution, among the provinces with comment counts exceeding 1000, only the sentiment value of comments in Hunan Province is negative. This can be attributed to the fact that Hunan Province is the location where the incident occurred, and the local residents feel more saddened and negative about the accident. The government needs to focus on addressing and alleviating the emotions of the affected individuals in the incident location.
Different topics show significant variations in sentiment values. Looking at specific topics, in the early stages of the rescue operation, except for the topic #9 people involved in the Changsha self-built building collapse accident have been criminally detained#”, the majority of comments related to each topic were positive. As the incident progressed, the public’s emotions stabilized, and there was a slight decline in positive sentiment, with more neutral and objective comments. As the number of casualties increased, negative sentiment among the public also rose. However, with the release of posts and videos related to the topic “#I knew the firefighters would come to rescue me#”, the public’s confidence and blessings directed towards the rescue efforts experienced a significant increase.
Overall, the public has shown a high level of positive sentiment towards reports of successful rescue operations. While the later-stage rescue topics have more neutral and objective comments, the release of the topic “#I knew the firefighters would come to rescue me#” once again evoked a significantly high level of positive sentiment among the public. This indicates that the release of related positive and uplifting rescue videos and topics can greatly boost the public’s confidence in rescue efforts.
In the context of urban crises, the analysis of public sentiment through the examination of comments containing specific vocabulary provides a timely means to comprehend public perspectives. This practice serves as a participatory approach for the public to engage in urban management and development, offering valuable insights to guide city assessment and evaluation. In the realm of urban emergency situations, the assessment of public sentiment plays a crucial role in understanding the collective perceptions and opinions of citizens. By analyzing comments that contain specific keywords, we can promptly grasp the sentiment and viewpoints of the public. This approach not only facilitates a real-time understanding of public sentiment but also enables a deeper comprehension of their concerns, suggestions, and emotions. It serves as an avenue for public participation in urban governance and fosters a sense of ownership and involvement in the development and management of their cities.

4.3. Spatio-Temporal Distribution Analysis of Weibo Comments and Influencing Factors

In terms of temporal distribution, comments on Weibo generally reach their peak approximately one hour after the publication of the content. There are five instances where comment peaks occur at 24:00, indicating that the timing of posting does not have a decisive influence on the level of attention. Instead, it is primarily determined by the content of the posts. The concentration of comment peaks around noon and midnight is due to a higher frequency of post publications around 11:00 AM and 11:00 PM. In terms of the number of comments, the public displayed a high level of engagement with posts published on 4 May, 5 May, and 6 May, with the highest level of engagement observed on 6 May. There are several factors contributing to this trend. Firstly, during these dates, there was a higher concentration of post publications across various topics, resulting in a larger cumulative number of comments. Secondly, when comparing the comment volume for each topic, it becomes evident that the public displays a higher level of concern for topics related to casualties and accident investigations.
In terms of spatial distribution, the outflow of population and per capita GDP play a significant role in explaining the spatial patterns of Weibo comments. The corresponding p-values for both factors are 0, indicating a high level of reliability for this inference. On the other hand, population and distance have a weaker explanatory power, with a p-value of 0.79695 and 0.84563, suggesting a lack of clear correlation between comment distribution and distance. The local area and its surrounding regions show the highest level of attention to the incident, with Guangdong Province surpassing other provinces in terms of the number of posts. Through the geographical factor detector, it is evident that this is related to population mobility. Guangdong Province is the destination for the largest outflow of population from Hunan Province, with over five million people from Hunan migrating to Guangdong. These outflow populations exhibit a high level of concern for the illegal construction accidents in their hometowns, which is supported by comments from Guangdong netizens, such as “Then, various violent demolitions started in different parts of Hunan Province... I was really angry when I heard about the incident in my hometown last night” and “All the old dangerous houses in our village could collapse at any time, but the village authorities say they will not demolish them unless an excavator can access them. Once the houses collapse, they could kill someone at any time.” On the other hand, the comments also reflect the issue of self-built illegal constructions in Guangdong Province, as indicated by comments from Guangdong netizens, such as “Come to Guangzhou and see the numerous self-built and illegal houses. There are so many that you dare not even intervene for inspection!” and “There are plenty of eight, nine, or ten-story self-built houses in the urban villages of Shenzhen. Why do not they come and investigate?” Users from economically developed regions tend to contribute more comments on Weibo and exhibit a higher level of interest in internet-related information. This indicates that, in addition to monitoring the public sentiment in the area where the incident occurred, it is also crucial to pay attention to the public sentiment trends in economically developed regions.

4.4. Integrated Analysis of Sentiment and Spatio-Temporal Features

Taking a comprehensive view of the relationship between sentiment polarity and regions, Figure 9 reveals the characteristics of sentiment polarity across regions. In terms of sentiment polarity, most provinces, municipalities, and autonomous regions exhibit a positive sentiment, reflecting an overall optimistic attitude towards the event. Regarding the intensity of sentiment, there is little absolute difference in sentiment values among regions, indicating that there are no significant spatial variations in sentiment. The sentiment values in the region where the incident occurred are slightly lower.
Regarding the relationship between sentiment intensity and time, Figure 10 illustrates the relationship between sentiment intensity and topics. The topics are naturally ordered by their occurrence in time. Combined with Figure 12, we can discern the trends of sentiment polarity over time. It is important to note that sentiment intensity does not exhibit a consistent upward or downward trend over time. This suggests that the trend in sentiment polarity is closely related to the content of the posts themselves.
In summary, in terms of spatial geography, the analysis highlights that changes in public sentiment are particularly focused on the region where the incident occurred. Throughout the event’s development, the publication of positive reports can uplift public morale.

5. Conclusions

This study is based on data collected from Sina Weibo, specifically focusing on the self-built house collapse accident in Changsha City, China, that occurred on 29 April 2022. It involved data crawling and analysis of the comments’ text, timing, and location under relevant Weibo topics posted by the People’s Daily. This research aimed to investigate the frequency, sentiment, and spatio-temporal characteristics of the online public opinion surrounding this urban emergency incident, revealing certain patterns and trends. Python and the LDA topic model were utilized to analyze high-frequency words and comment topics. The Rost CM sentiment analysis tool was employed to study the sentiment polarity of public opinion regarding this incident. The influence of Weibo topics on sentiment polarity was examined, and specific keywords were selected to uncover public views and attitudes towards the event. This study explored the evolution and spatial distribution of comment volume, employing a geographic detector to investigate the reasons behind spatial differentiation. The findings aim to provide a reference and guidance for managing and guiding public sentiment in urban emergency situations. The research results are presented below.
Overall, the public exhibited a positive sentiment towards the incident. Different topics displayed varying sentiment polarities. In the initial stages, the public sentiment predominantly leaned towards positivity. However, as the incident unfolded, positive sentiment declined, and negative sentiment slightly increased. Over time, comments tended to be more neutral and objective. Towards the end, with the release of the final number of casualties (which was significant), negative sentiment increased substantially. Comments containing specific keywords reflected public opinions and suggestions. The release of positive and uplifting rescue videos contributed to stabilizing public sentiment.
In terms of spatial distribution, Weibo comments were related to per capita GDP and the number of cross-provincial population flows. The relationship between comment volume and posting time was relatively weak compared to the close association with Weibo topic content.
Through this study, we have witnessed the untapped potential of our discoveries and methodologies. Primarily, we have employed cutting-edge textual research methods to unearth the distinct characteristics of social media data, enabling us to comprehensively grasp the public’s focal points, spatio-temporal patterns of posting, and attitudes towards the unforeseen incident. Furthermore, by attentively listening to the collective voice of the public, we can assist urban governmental management departments in making informed decisions, ensuring the proper handling of accidents, and fostering societal stability. Finally, the availability of our dataset and advanced analytical tools empowers decision-makers to gain real-time insights from the public, thereby facilitating agile, efficient, and inclusive decision-making processes.
However, it is crucial to acknowledge the limitations of our study. While we have primarily focused on analyzing textual comments in this research, we have overlooked the potential information offered by visual content, such as images and videos. These multimedia elements could provide additional valuable insights. Moreover, some comments may consist solely of emoticons, numerical figures, or other special symbols. Despite lacking explicit text, these comments still reflect the emotions and thought processes of the authors.
Although our study employed the LDA model for word frequency analysis, we must acknowledge some limitations of this approach. Firstly, the LDA model does not consider semantic or syntactic relationships between words, which means it may fail to capture some important information in the text content and context. This could result in limitations in understanding comments, especially in cases involving polysemous words or high contextual relevance. Secondly, our word frequency analysis relies on word segmentation techniques to identify meaningful words in the text. However, for Chinese text, word segmentation is a complex task because Chinese words are not typically separated by spaces as in English.
Our sentiment analysis method may not fully consider the impact of negation words, modifiers, or domain-specific terms on sentiment polarity and intensity. In some cases, the results of sentiment analysis may be influenced by these factors. For example, negation words like “not” or “no” in comments may sometimes not be correctly identified, potentially leading to inaccuracies in determining the actual sentiment polarity. Additionally, modifiers can alter the intensity of sentiment, but our method may not accurately capture the influence of these modifiers. For instance, in the phrase “really good”, our method might only recognize “good” as a sentiment word and might not consider the intensifying effect of “really.” Lastly, our sentiment analysis method may not adapt well to domain-specific terms or jargon. Different domains may have specific terminology and vocabulary with sentiment meanings that differ from general vocabulary. Our method may not accurately understand and analyze comments in these specific domains.
While we have mitigated biases such as the spread of false information by selecting posting users, certain potential biases and limitations still exist in our study. For instance, there is the bias of the subjects of comments. Sina Weibo users may not represent the viewpoints and sentiments of all social groups, and our research overlooks populations beyond this platform’s users. Additionally, in our research, we have not considered the relationship between some external factors and social media comments.
Addressing the limitations of this study, future work is outlined as follows: Firstly, to achieve a more accurate quantification of public sentiment, future investigations should explore the analysis of non-textual elements, including emojis, punctuation marks, and other special symbols. Secondly, the accuracy of word segmentation is crucial in ensuring the quality of the analysis results. If word segmentation is carried out incorrectly or ambiguously, it can affect our analysis and understanding of the comments. Therefore, we need to be aware of these limitations and strive to find more effective methods to address these issues in future research to enhance the quality and accuracy of our analysis of social media comments. Thirdly, when using our sentiment analysis results, it is important to consider the limitations and exercise caution when analyzing and interpreting the results. In future research, we will continue to work on improving our sentiment analysis methods to enhance their applicability and accuracy. Last but not least, we need to delve deeper into the relationship between these external factors and social media comments to gain a more comprehensive understanding of the formation of public opinion.
In conclusion, while recognizing these limitations, our research highlights the potential of our findings and methodologies. By employing advanced techniques for textual analysis, we offer valuable insights into understanding and analyzing the public sentiment surrounding urban emergencies. Through continued refinement of our methodologies and data analysis, we can better harness the potential of social media data to comprehend public opinions and attitudes, providing invaluable guidance and references for urban management authorities.

Author Contributions

Conceptualization, Dongling Ma; methodology, Dongling Ma and Chunhong Zhang; software, Qingji Huang; data curation, Baoze Liu; writing—original draft preparation, Dongling Ma and Liang Zhao; writing—review and editing, Chunhong Zhang; visualization, Chunhong Zhang and Baoze Liu; supervision, Qingji Huang; funding acquisition, Dongling Ma. All authors have read and agreed to the published version of the manuscript.

Funding

This research was funded by the National Natural Science Foundation of China (grant number 42171435), the Natural Science Foundation of Shandong Province (grant number ZR2020MD025), the Science and Technology Research Program for Colleges and Universities in Shandong Province (grant number J18KA183), the Key Topics of Art and Science in Shandong Province (grant number 2014082), and the Doctoral Fund Projects in Shandong Jianzhu University (grant number X21079Z).

Data Availability Statement

Data sharing not applicable.

Acknowledgments

The authors would like to thank the editor and anonymous reviewers for their comments on the manuscript.

Conflicts of Interest

The authors declare no conflict of interest.

References

  1. Dai, W.H. Public cognition morale mechanism of unexpected incidents in cities and the responding strategies. Shanghai Chengshi Guanli 2014, 23, 34–37. [Google Scholar]
  2. Xiao, Y.; Du, N.; Chen, J.; Li, Y.L.; Qiu, Q.M.; Zhu, S.Y. Workplace violence against doctors in China: A case analysis of the Civil Aviation General Hospital incident. Front. Public Health 2022, 10, 2984. [Google Scholar] [CrossRef] [PubMed]
  3. Ding, Y. Public opinion analysis of traffic control during the epidemic based on social media data. Comput. Era 2022, 363, 78–82+95. [Google Scholar]
  4. de Carvalho, V.D.H.; Nepomuceno, T.C.C.; Poleto, T.; Costa, A.P.C.S. The COVID-19 infodemic on Twitter: A space and time topic analysis of the Brazilian immunization program and public trust. Trop. Med. Infect. Dis. 2022, 7, 425. [Google Scholar] [CrossRef] [PubMed]
  5. Zhang, T.; Cheng, C. Temporal and spatial evolution and influencing factors of public sentiment in natural disasters—A case study of typhoon haiyan. ISPRS Int. J. Geo-Inf. 2021, 10, 299. [Google Scholar] [CrossRef]
  6. Justicia De La Torre, C.; Sánchez, D.; Blanco, I.; Martín-Bautista, M.J. Text mining: Techniques, applications, and challenges. Int. J. Uncertain. Fuzziness Knowl.-Based Syst. 2018, 26, 553–582. [Google Scholar] [CrossRef]
  7. Silva, P.A.; Santos, R. An opinion mining methodology to analyse games for health. Multimed. Tools Appl. 2023, 82, 12957–12976. [Google Scholar] [CrossRef]
  8. Arbane, M.; Benlamri, R.; Brik, Y.; Alahmar, A.D. Social media-based COVID-19 sentiment classification model using Bi-LSTM. Expert Syst. Appl. 2023, 212, 118710. [Google Scholar] [CrossRef]
  9. Sun, R.; Budhwani, H. Negative sentiments toward novel coronavirus (COVID-19) vaccines. Vaccine 2022, 40, 6895–6899. [Google Scholar] [CrossRef]
  10. Sari, I.C.; Ruldeviyani, Y. Sentiment analysis of the COVID-19 virus infection in indonesian public transportation on twitter data: A case study of commuter line passengers. In Proceedings of the 2020 International Workshop on Big Data and Information Security (IWBIS), Depok, Indonesia, 17 October 2020. [Google Scholar]
  11. Fitri, V.A.; Andreswari, R.; Hasibuan, M.A. Sentiment analysis of social media Twitter with case of Anti-LGBT campaign in Indonesia using Naïve Bayes, decision tree, and random forest algorithm. Procedia Comput. Sci. 2019, 161, 765–772. [Google Scholar] [CrossRef]
  12. Arias, F.; Guerra-Adames, A.; Zambrano, M.; Quintero-Guerra, E.; Tejedor-Flores, N. Analyzing Spanish-language public sentiment in the context of a pandemic and social unrest: The Panama case. Int. J. Environ. Res. Public Health 2022, 19, 10328. [Google Scholar] [CrossRef] [PubMed]
  13. Ding, J.; Wang, A.; Zhang, Q. Mining the vaccination willingness of China using social media data. Int. J. Med. Inform. 2023, 170, 104941. [Google Scholar] [CrossRef] [PubMed]
  14. Jabalameli, S.; Xu, Y.; Shetty, S. Spatial and sentiment analysis of public opinion toward COVID-19 pandemic using twitter data: At the early stage of vaccination. Int. J. Disaster Risk Reduct. 2022, 80, 103204. [Google Scholar] [CrossRef] [PubMed]
  15. Weng, Z.; Lin, A. Public opinion manipulation on social media: Social network analysis of twitter bots during the COVID-19 pandemic. Int. J. Environ. Res. Public Health 2022, 19, 16376. [Google Scholar] [CrossRef]
  16. Liu, C.; Guo, L.; Fan, Z.Y. Study on identification and governance countermeasures of the traffic problems in metropolis based on online public opinion: A case study of Wuhan City. Chengshi Wenti 2022, 323, 77–87. [Google Scholar]
  17. Chen, Y.; Niu, H.; Silva, E.A. The road to recovery: Sensing public opinion towards reopening measures with social media data in post-lockdown cities. Cities 2023, 132, 104054. [Google Scholar] [CrossRef]
  18. Pi, Z.; Feng, H. The evolution of public sentiment toward government management of emergencies: Social media analytics. Front. Ecol. Evol. 2022, 10, 1026175. [Google Scholar] [CrossRef]
  19. Zhang, P.; Zhang, H.; Kong, F.; Kong, B.L. A study on public opinion characteristics of rainstorm flooding disasters based on Sina Weibo data: Take the three rainstorm flooding disasters in China in 2021 as an example. Shuili Shuidian Jishu 2022, 54, 47–59. [Google Scholar]
  20. Liu, G.J.; Li, W.W.; Han, W.; Chen, A. Analysis on structural features of dissemination network of the ethnic factors-related online public opinion based on SNA: Taking the Kunming “3.1” violent and terrorist incident as an example. Anquan 2022, 43, 12–21. [Google Scholar]
  21. Lv, B.R.; Peng, L.; Chen, J.H.; Chen, R.N.; Ge, X.T. Analysis of Public Opinion Information Pulsation of Forest Fire on Social Media. Dili Xinxi Shijie 2021, 28, 61–66. [Google Scholar]
  22. Jelodar, H.; Wang, Y.; Orji, R.; Huang, S. Deep sentiment classification and topic discovery on novel coronavirus or COVID-19 online discussions: NLP using LSTM recurrent neural network approach. IEEE J. Biomed. Health Inform. 2020, 24, 2733–2742. [Google Scholar] [CrossRef]
  23. Lyu, J.C.; Han, E.L.; Luli, G.K. COVID-19 vaccine–related discussion on Twitter: Topic modeling and sentiment analysis. J. Med. Internet Res. 2021, 23, e24435. [Google Scholar] [CrossRef]
  24. Chen, X.S.; Chang, T.Y.; Wang, H.Z.; Zhao, Z.L.; Zhang, J. Spatial and temporal analysis on public opinion evolution of epidemic situation about novel coronavirus pneumonia based on micro-blog data. J. Sichuan Univ. 2020, 57, 409–416. [Google Scholar]
  25. Hu, N. Sentiment analysis of texts on public health emergencies based on social media data mining. Comput. Math. Methods Med. 2022, 2022, 3964473. [Google Scholar] [CrossRef] [PubMed]
  26. Mane, H.; Yue, X.; Yu, W.; Doig, A.C.; Wei, H.; Delcid, N.; Harris, A.; Nguyen, T.N.; Nguyen, Q.C. Examination of the Public’s Reaction on Twitter to the Over-Turning of Roe v Wade and Abortion Bans. Healthcare 2022, 10, 2390. [Google Scholar] [CrossRef] [PubMed]
  27. Griffiths, T.L.; Steyvers, M. Finding scientific topics. Proc. Natl. Acad. Sci. USA 2004, 101, 5228–5235. [Google Scholar] [CrossRef] [PubMed]
  28. Blei, D.M.; Ng, A.Y.; Jordan, M.I. Latent dirichlet allocation. J. Mach. Learn. Res. 2003, 3, 993–1022. [Google Scholar]
  29. Luo, L.X. Network text sentiment analysis method combining LDA text representation and GRU-CNN. Pers. Ubiquitous Comput. 2019, 23, 405–412. [Google Scholar] [CrossRef]
  30. Liu, J.W.; Zhang, S.Q. jiyu qinggan fenxi de weibo redian huati yanhua fenxi[Micro-blog hot topic evolution analysis based on sentiment analysis]. Xinxi Xitong Gongcheng 2022, 12, 137–140. [Google Scholar]
  31. Liu, Y.H.; Liu, W.T. Spatio-temporal characteristics of public opinion and emotion analysis of MS6.4Yunnan Yangbi earthquake based on Sina Weibbo data. Ziran Zaihai Xuebao 2022, 31, 168–178. [Google Scholar]
  32. Wang, J.F.; Xu, C.D. Geodetertor: Principle and prospective. Dili Xuebao 2017, 72, 116–134. [Google Scholar]
Figure 1. Accident location map.
Ijgi 12 00388 g001
Figure 2. Research framework.
Ijgi 12 00388 g002
Figure 3. Network relationship of high-frequency words in comments.
Ijgi 12 00388 g003
Figure 4. Topic extraction results.
Ijgi 12 00388 g004
Figure 5. Perplexity and coherence test. (a) Perplexity test; (b) coherence test.
Ijgi 12 00388 g005aIjgi 12 00388 g005b
Figure 6. Word clouds of high-frequency words. (a) Word cloud of overall high-frequency words in comments; (b) Word cloud of high-frequency words for Theme 1; (c) Word cloud of high-frequency words for Theme 2; (d) Word cloud of high-frequency words for Theme 3.
Ijgi 12 00388 g006
Figure 7. Statistical chart of various emotions and intensity. (a) Proportion of various emotions and intensity; (b) Number of various emotions and intensity.
Ijgi 12 00388 g007
Figure 8. Trend chart of emotions with topic variations.
Ijgi 12 00388 g008
Figure 9. Spatial differences map of emotional values. Red dots represent positive values, while blue dots represent negative values.
Ijgi 12 00388 g009
Figure 10. Trend of emotional variation with topic change.
Ijgi 12 00388 g010
Figure 11. Distribution of emotional values and quantity.
Ijgi 12 00388 g011
Figure 12. Time series of comments. The red line represents the timing of posts, while the blue line represents the number of comments.
Ijgi 12 00388 g012
Figure 13. Spatial distribution of comment quantity. (a) Comment quantity by province; (b) Distribution of comment quantity.
Ijgi 12 00388 g013
Figure 14. Kernel density maps at different scales. (a) Kernel density with a search radius of 200 km; (b) Kernel density with a search radius of 300 km; (c) Kernel density with a search radius of 400 km; (d) Kernel density with a search radius of 500 km.
Ijgi 12 00388 g014
Figure 15. Ten-level categorical plot of the independent variable X. (a) Floating population; (b) Population; (c) Distance; (d) Per capita GDP.
Ijgi 12 00388 g015
Table 1. Comparison of text topic mining models.
Model PrinciplesRepresentative ModelsApplicable ScenariosAdvantagesDisadvantages
Based on probabilistic graph modelsLDALarge-scale text topic mining; applicable to fields such as news and research papersStrong interpretabilityNot very suitable for short texts
HDPAdaptive topic number learningDynamically learning; handling multi-domain dataHigher computational complexity; requires large datasets; poor interpretability
Based on matrix factorizationNMFTasks such as topic mining and text clusteringSimple and interpretableEffectiveness may be influenced by initialization
Based on word embeddingsWord2Vec, Doc2Vec, FastTextWord sense representation and text similarity calculation, etc.Capturing semantic relationshipsMay not be suitable for complex topic mining; may require a large amount of training data
Based on deep learningBERT,
CNN,
RNN
Multi-task text analysis, sentiment analysis, etc.Strong expressive capabilityTraining process can be slow; requires a large amount of data
Topic-basedAuthor-topic model,
DTM
Analyzing the relationship between authors and topics, as well as how topics change over timeConsidering contextual informationRequires additional information; relatively complex
Network-based embeddingsNode2VecAnalyzing graph dataConsidering graph structure relationshipsComplexity
Table 2. Overview of topics published in the People’s Daily.
Serial NumberDateTopicNumber of CommentsNumber of Valid Comments
129 April#Collapse of a building in Changsha#21161403
230 April#Hello, tomorrow#963801
31 May#Challenges in the rescue operation of the Changsha building collapse accident#754493
41 May#9 people involved in the Changsha self-built building collapse accident have been criminally detained#925430
51 May#A trapped person is being rescued from the scene of the building collapse in Changsha#257221
61 May#Another trapped individual rescued in the collapse of a building in Changsha#31612546
71 May#The seventh trapped individual was rescued from the scene of the building collapse in Changsha#14581125
82 May#The rescue team responded that they would never give up until the last moment#402305
92 May#The eighth trapped individual was rescued#482410
103 May#The ninth trapped individual was rescued#528465
113 May#9 people involved in the Changsha self-built building collapse accident have been arrested#641326
123 May#The search and rescue approach for the collapse incident in Changsha has been adjusted#30711089
134 May#Rescue personnel at the Changsha collapse site observe a moment of silence for the victims#72934594
145 May#The 10th trapped individual has been rescued in the collapse incident in Changsha#894393
155 May#26 people confirmed dead in the Changsha self-built building collapse accident#83725137
165 May#I knew the firefighters would come to rescue me#598441
176 May#53 people confirmed dead in the Changsha self-built building collapse accident#20,00012,977
186 May#The Changsha Municipal Committee and the Municipal Government apologize for the collapse incident#10136
196 May#The State Council establishes an investigation team for the collapse incident of self-built houses in Changsha#1137710
Total 33,878
Table 3. Examples of corresponding blog posts for different emotions.
SentimentDateGeolocationExample of Comment Content
Positive sentiment29 April 17:05HainanHope for safety. Rescuers, thank you for your hard work!
29 April 14:23ShandongMay everyone be safe🙏🙏🙏
Neutral sentiment30 April 23:33HenanIs it a prefabricated panel structure?
30 April 23:33FujianWhy are there so many people in the self-built house? Is it a homestay?
Negative sentiment30 April 23:41HenanThe one next to it in the picture looks even more dangerous, it has not collapsed yet, but it’s just a matter of time!
5 May 08:50JiangsuA completely avoidable accident, let us have a human sacrifice before the press conference.
Table 4. Emotional values of comments for different topics.
ThemeTheme 1Theme 2Theme 3
Rest in Peace for the DeceasedWishing Everyone SafetyThorough Investigation of Self-Built Houses
Emotion Value−3.323.39−5.96
Table 5. Detection results of spatial distribution factors for Weibo comments.
Floating PopulationPopulationDistance from Hunan ProvincePer Capita GDP
q statistic0.9650990.2589240.2156760.963853
p value00.796950.845630
Disclaimer/Publisher’s Note: The statements, opinions and data contained in all publications are solely those of the individual author(s) and contributor(s) and not of MDPI and/or the editor(s). MDPI and/or the editor(s) disclaim responsibility for any injury to people or property resulting from any ideas, methods, instructions or products referred to in the content.

