
Analyzing Spanish-Language Public Sentiment in the Context of a Pandemic and Social Unrest: The Panama Case

 , , , and
Abstract
:1. Introduction
2. Materials and Methods
2.1. Data Acquisition
| Algorithm 1 Tweet Extraction Algorithm |
|
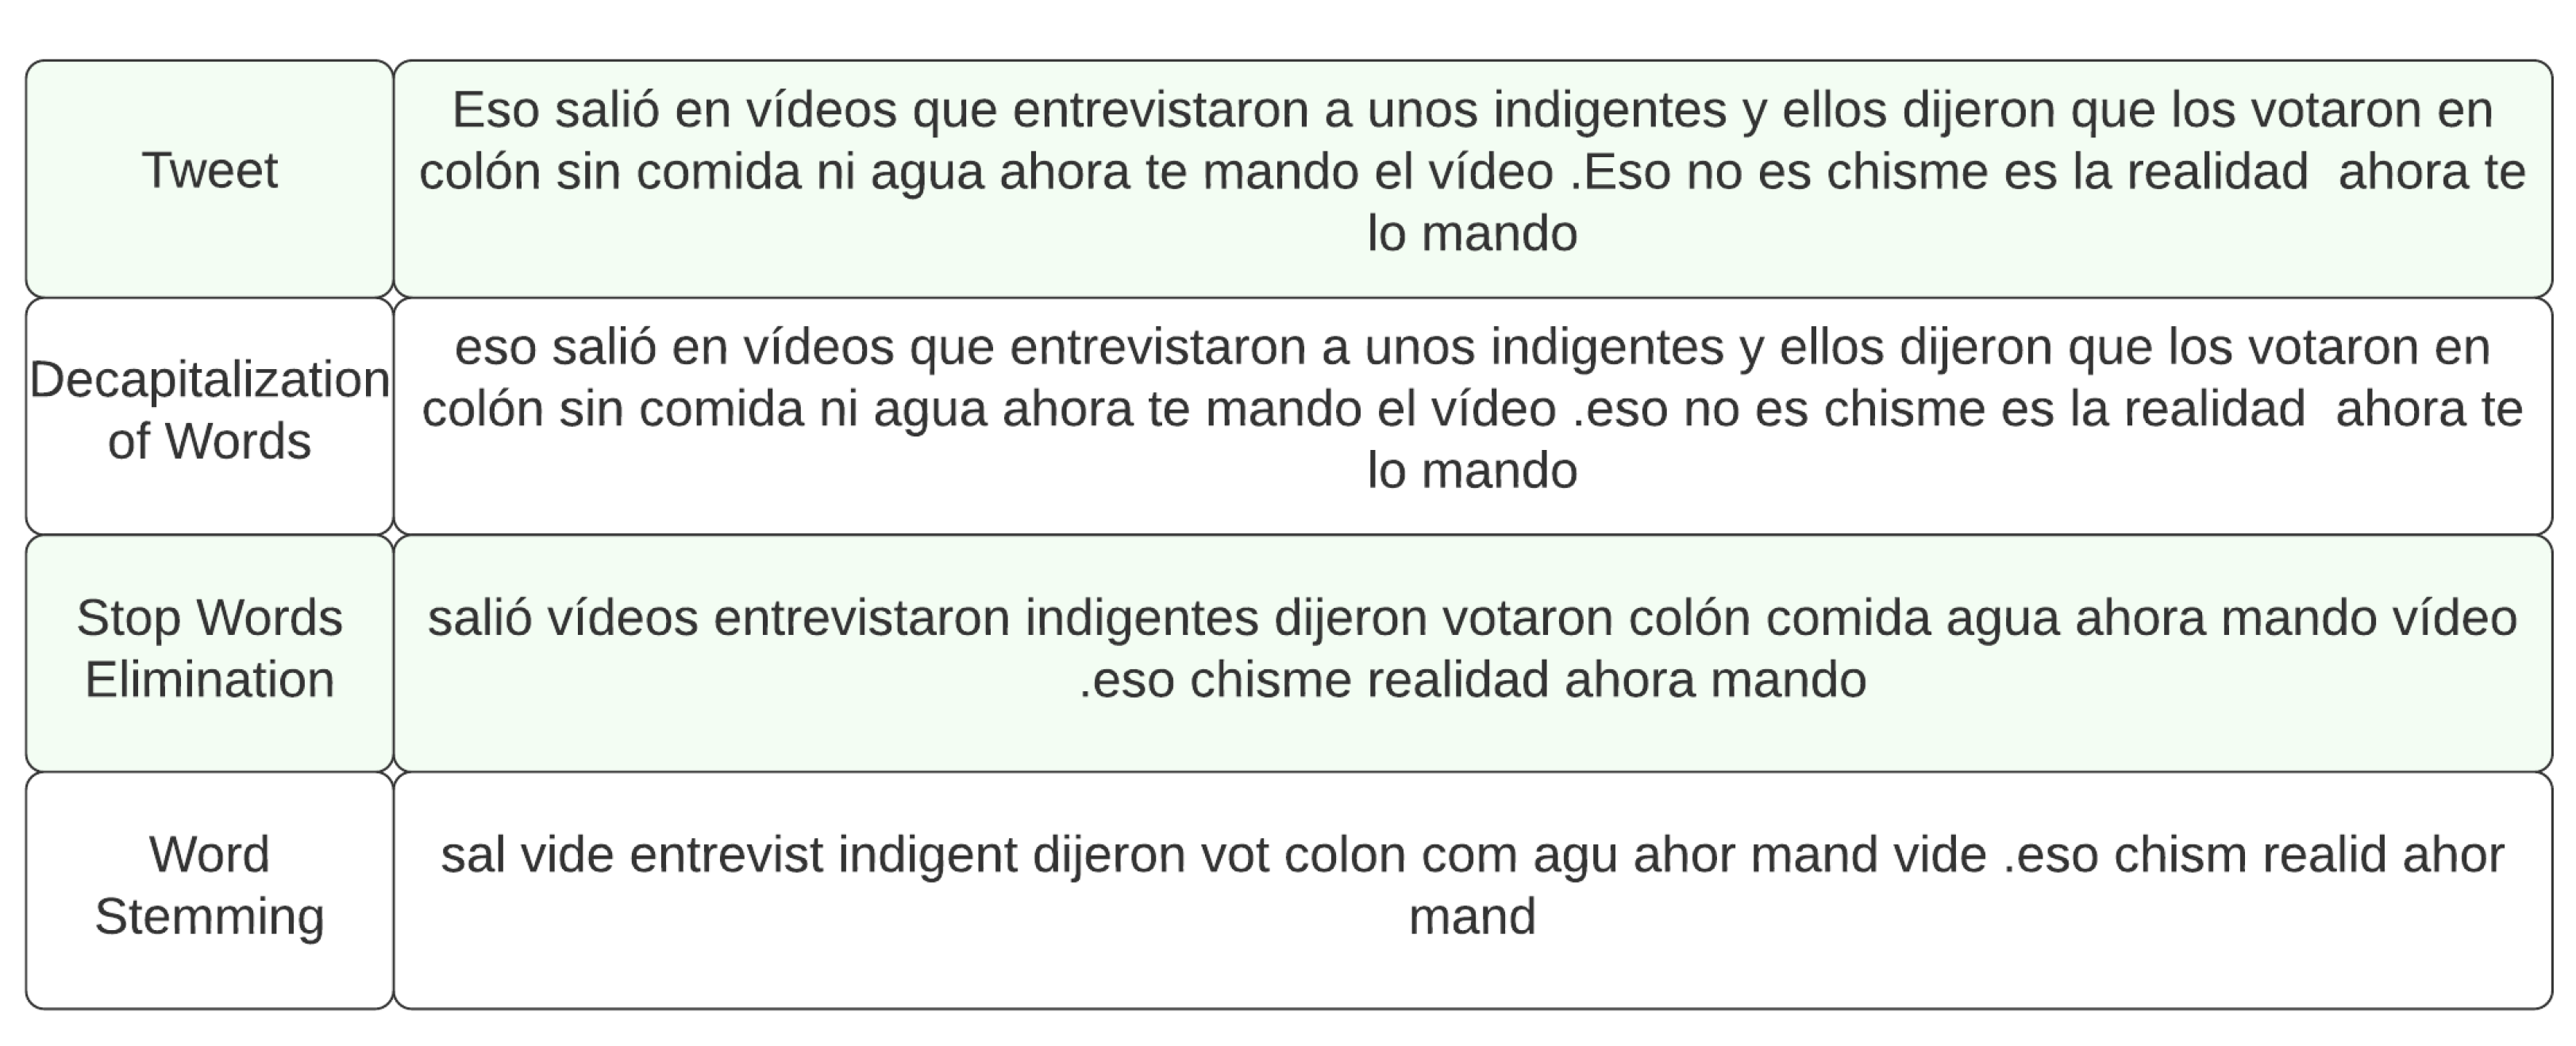
2.2. Data Pre-Processing
2.2.1. Immigrant Bias
2.3. Sentiment Analysis
2.3.1. Random Forest
2.3.2. K-Nearest Neighbors (KNN)
2.3.3. Naive Bayes
2.3.4. Gradient Boosting (GB)
2.3.5. Stochastic Gradient Descent (SGD)
2.3.6. Support Vector Classifier (SVC)
2.3.7. Extreme Gradient Boosting (XGBoost)
3. Results
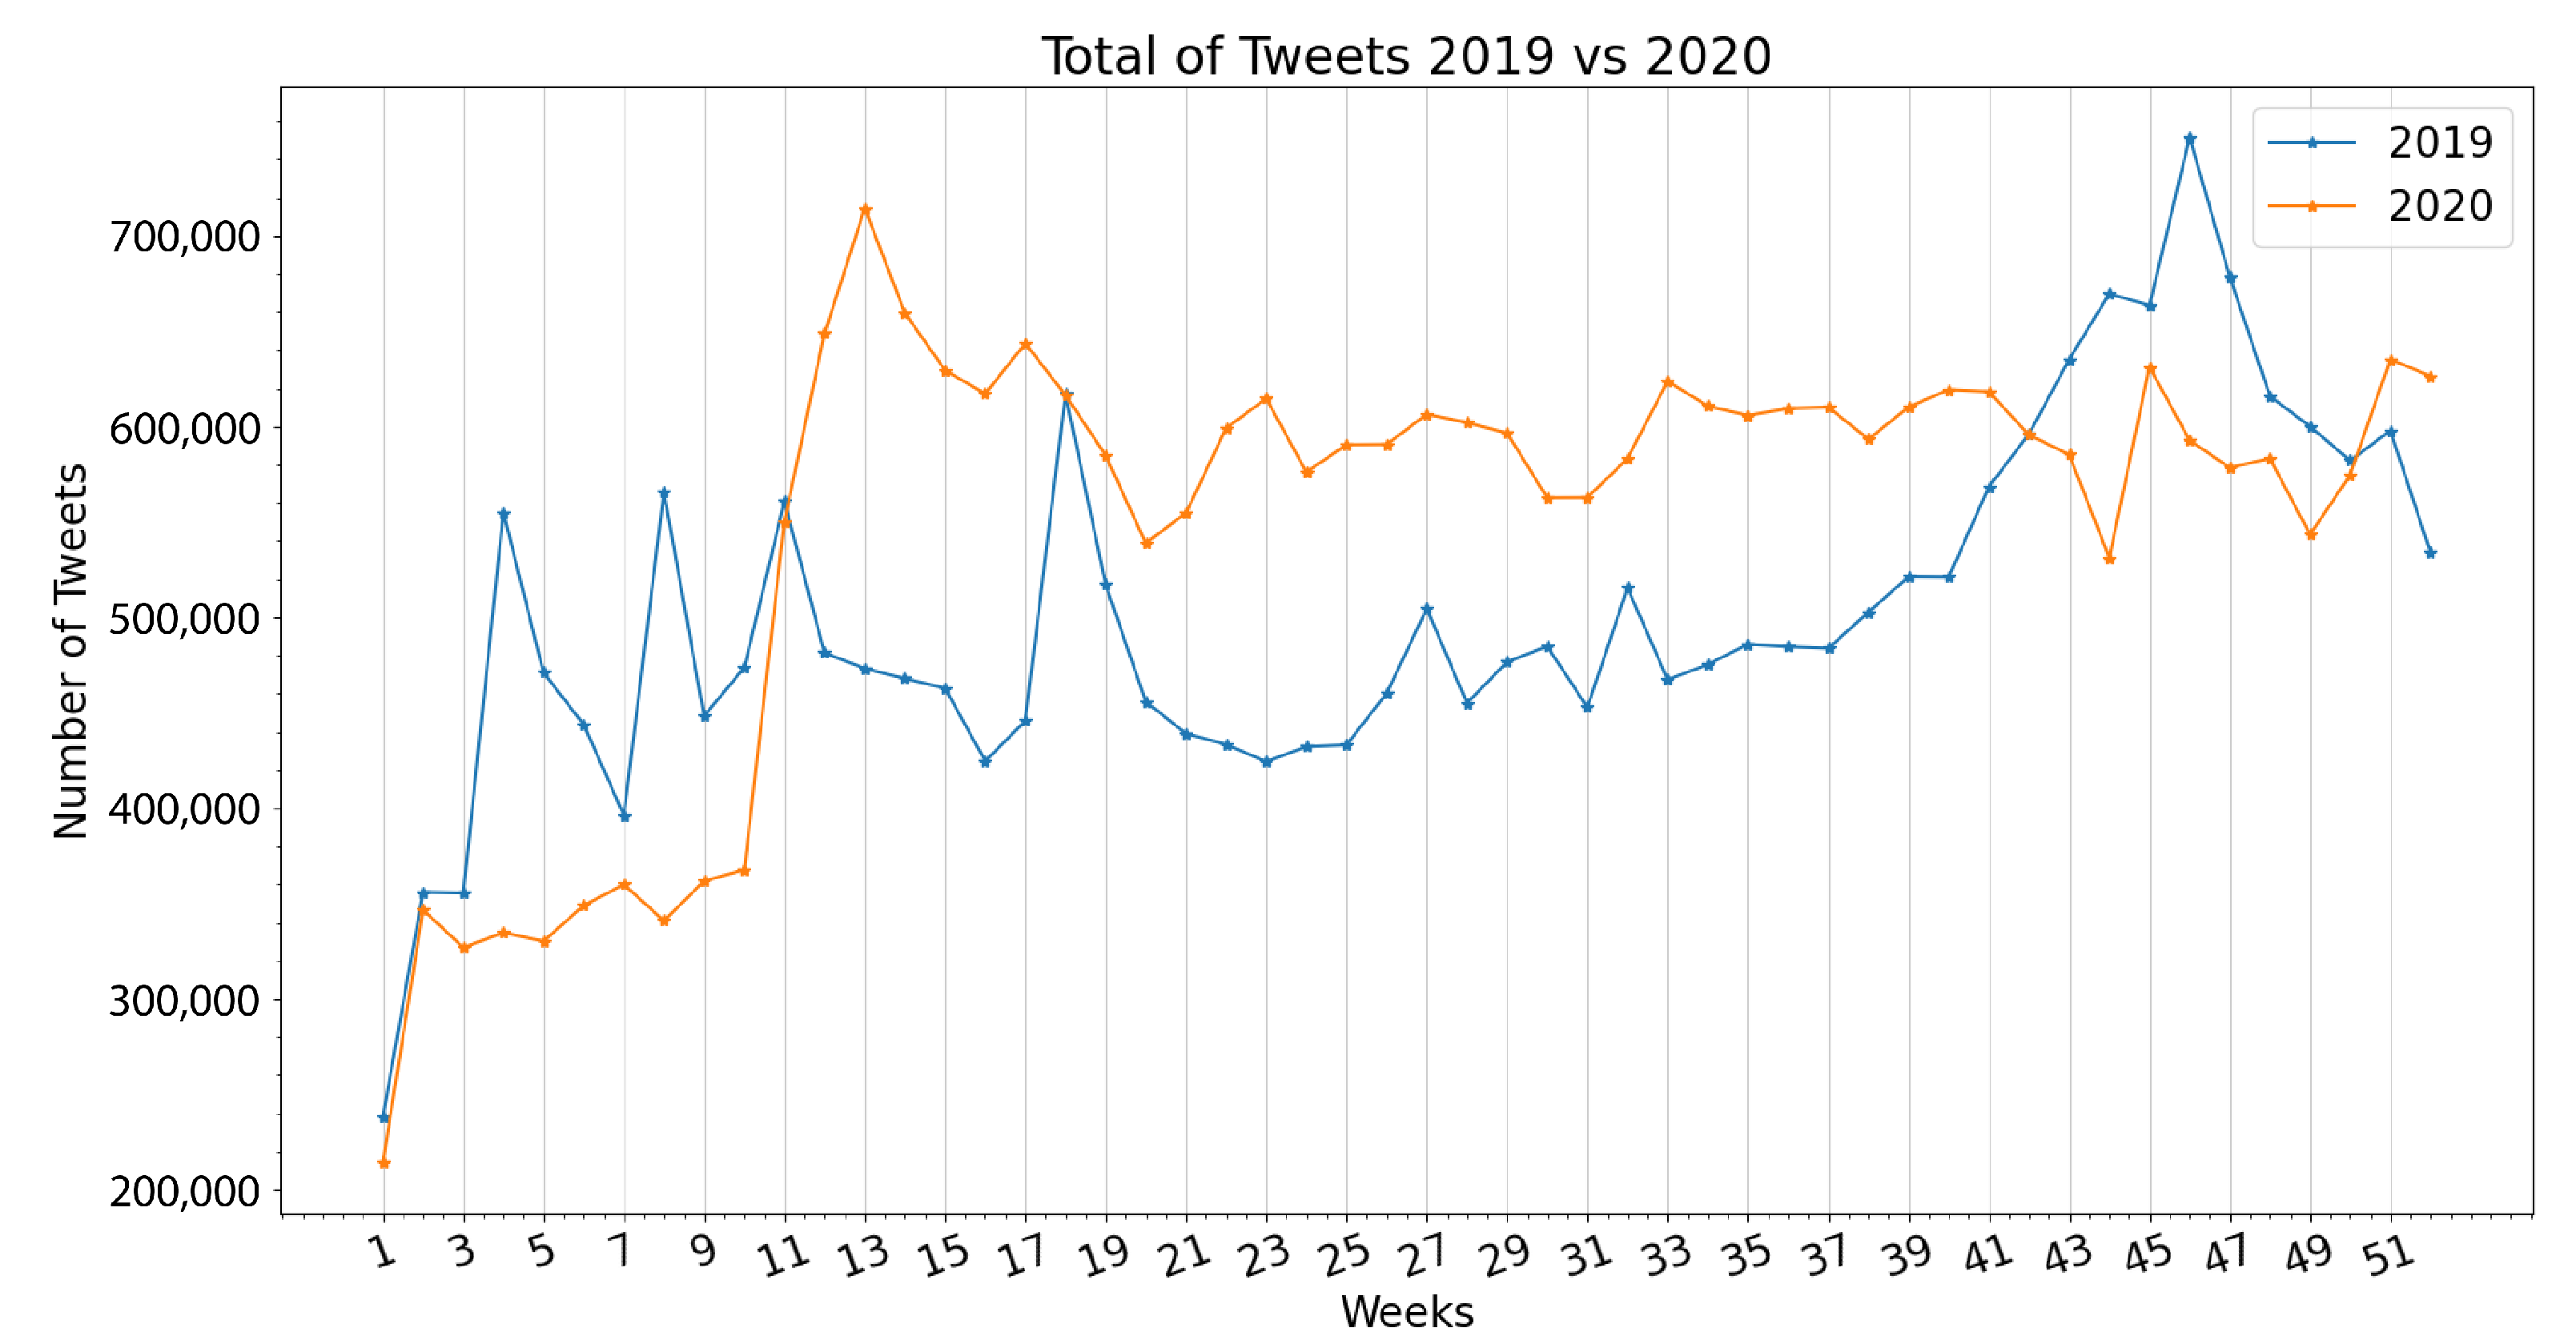
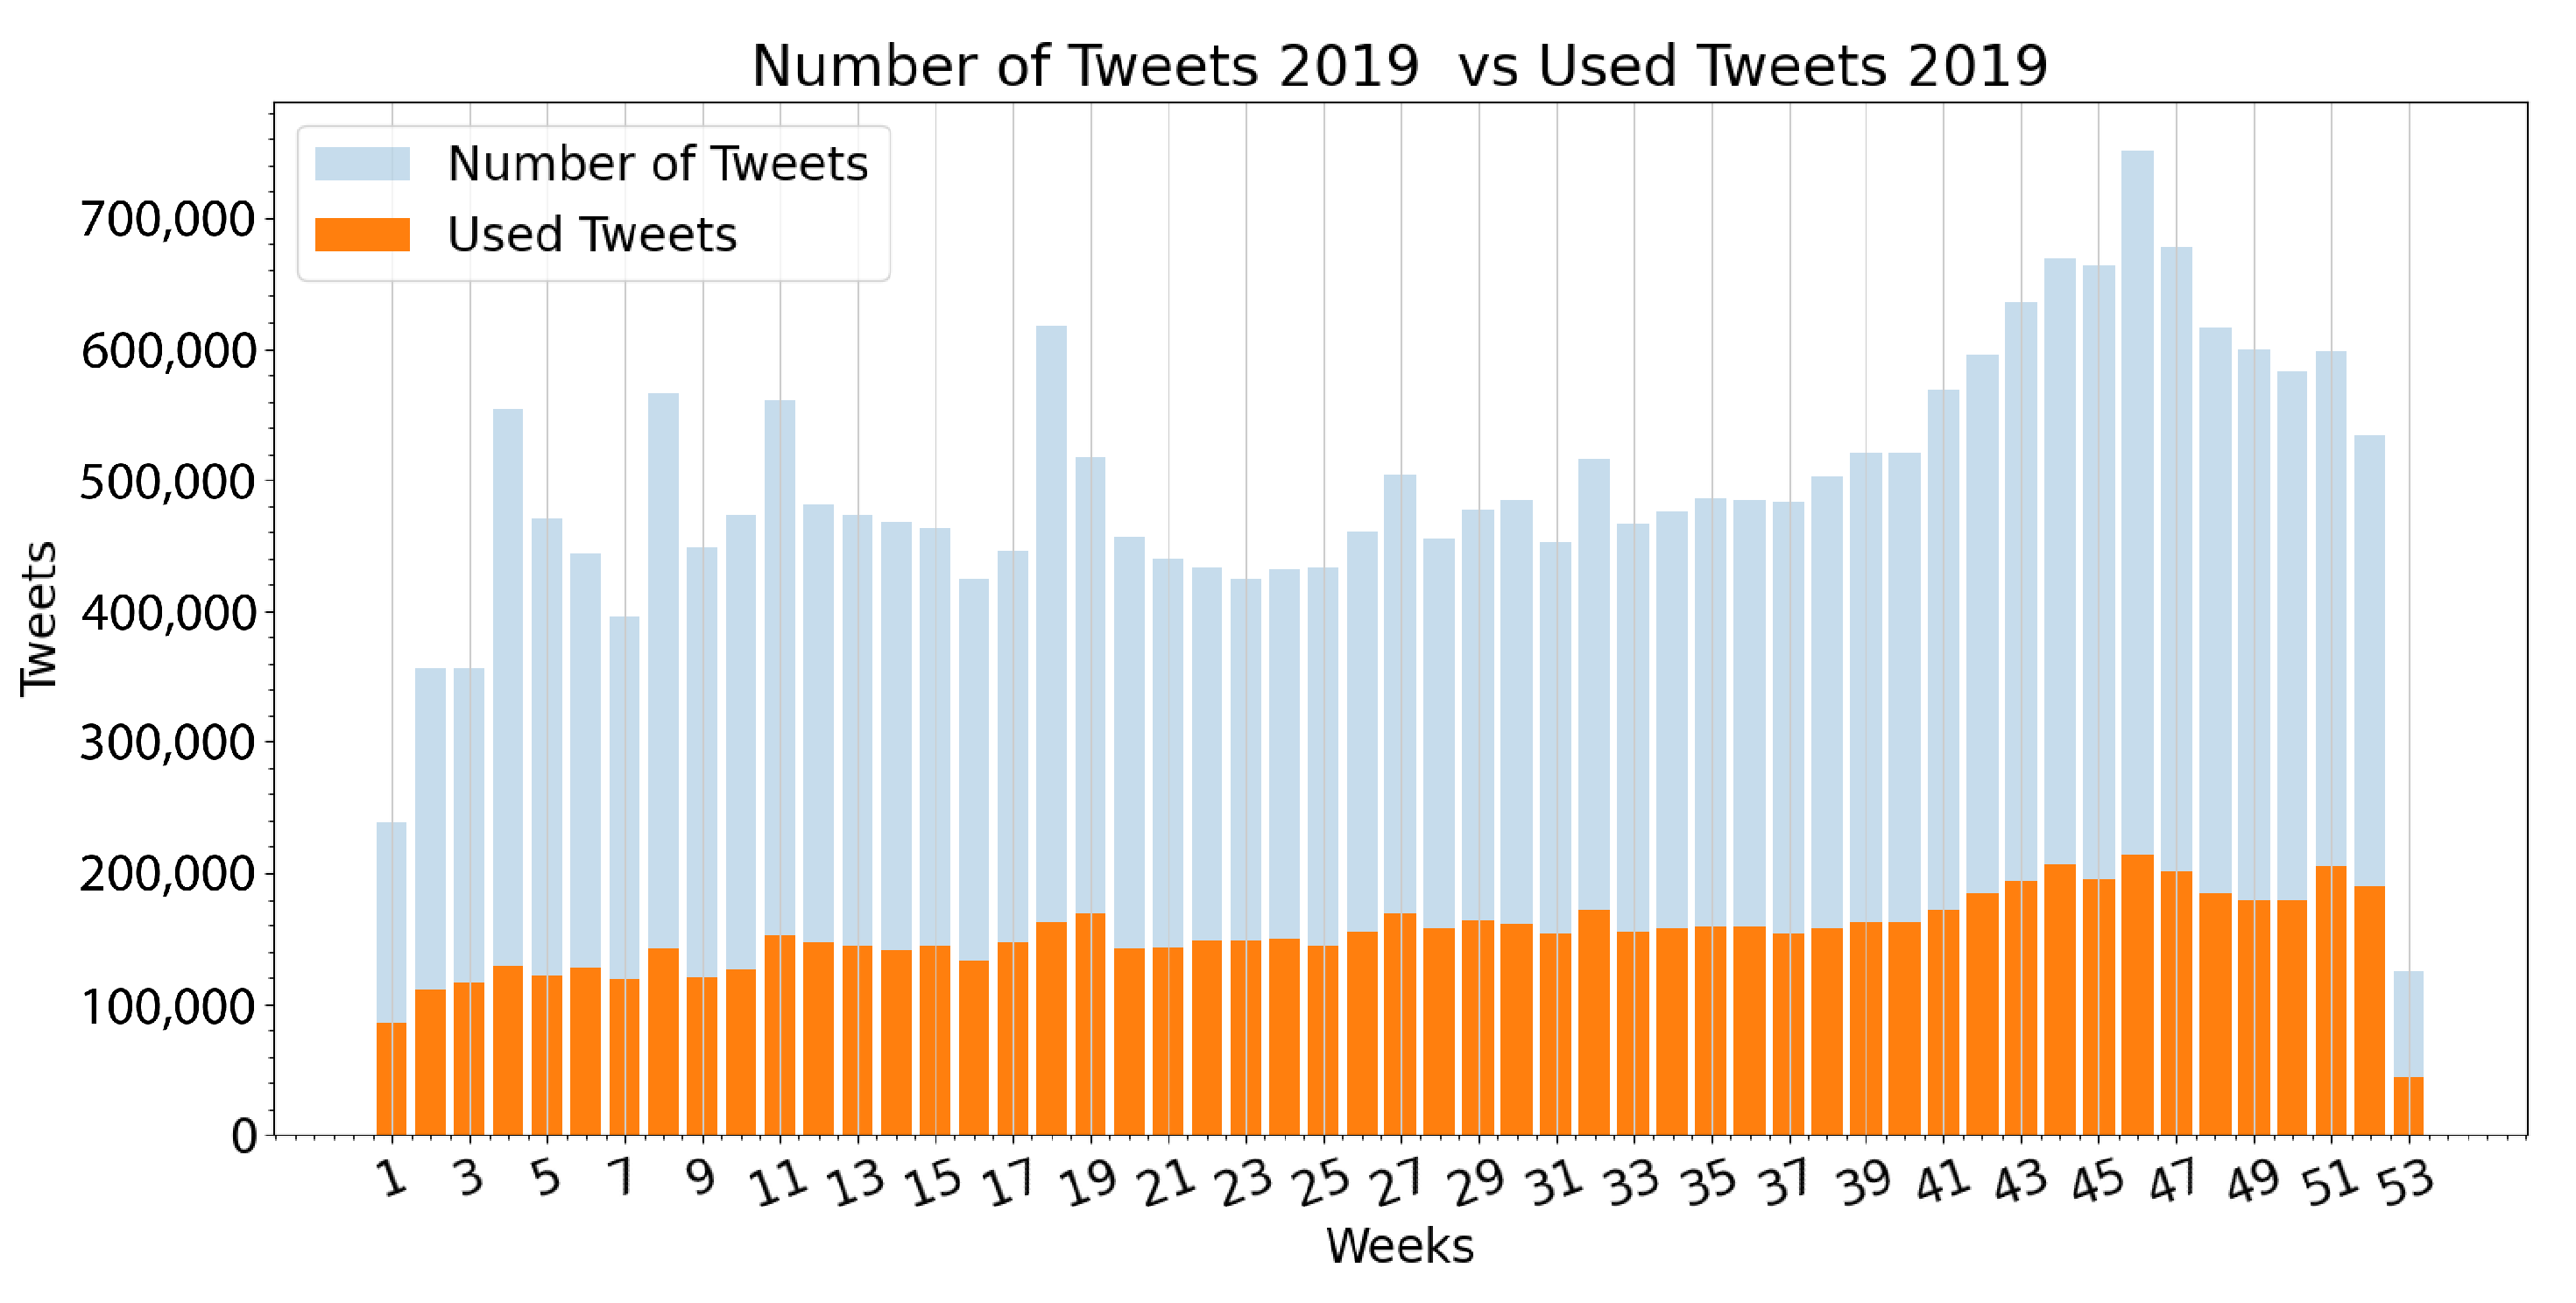
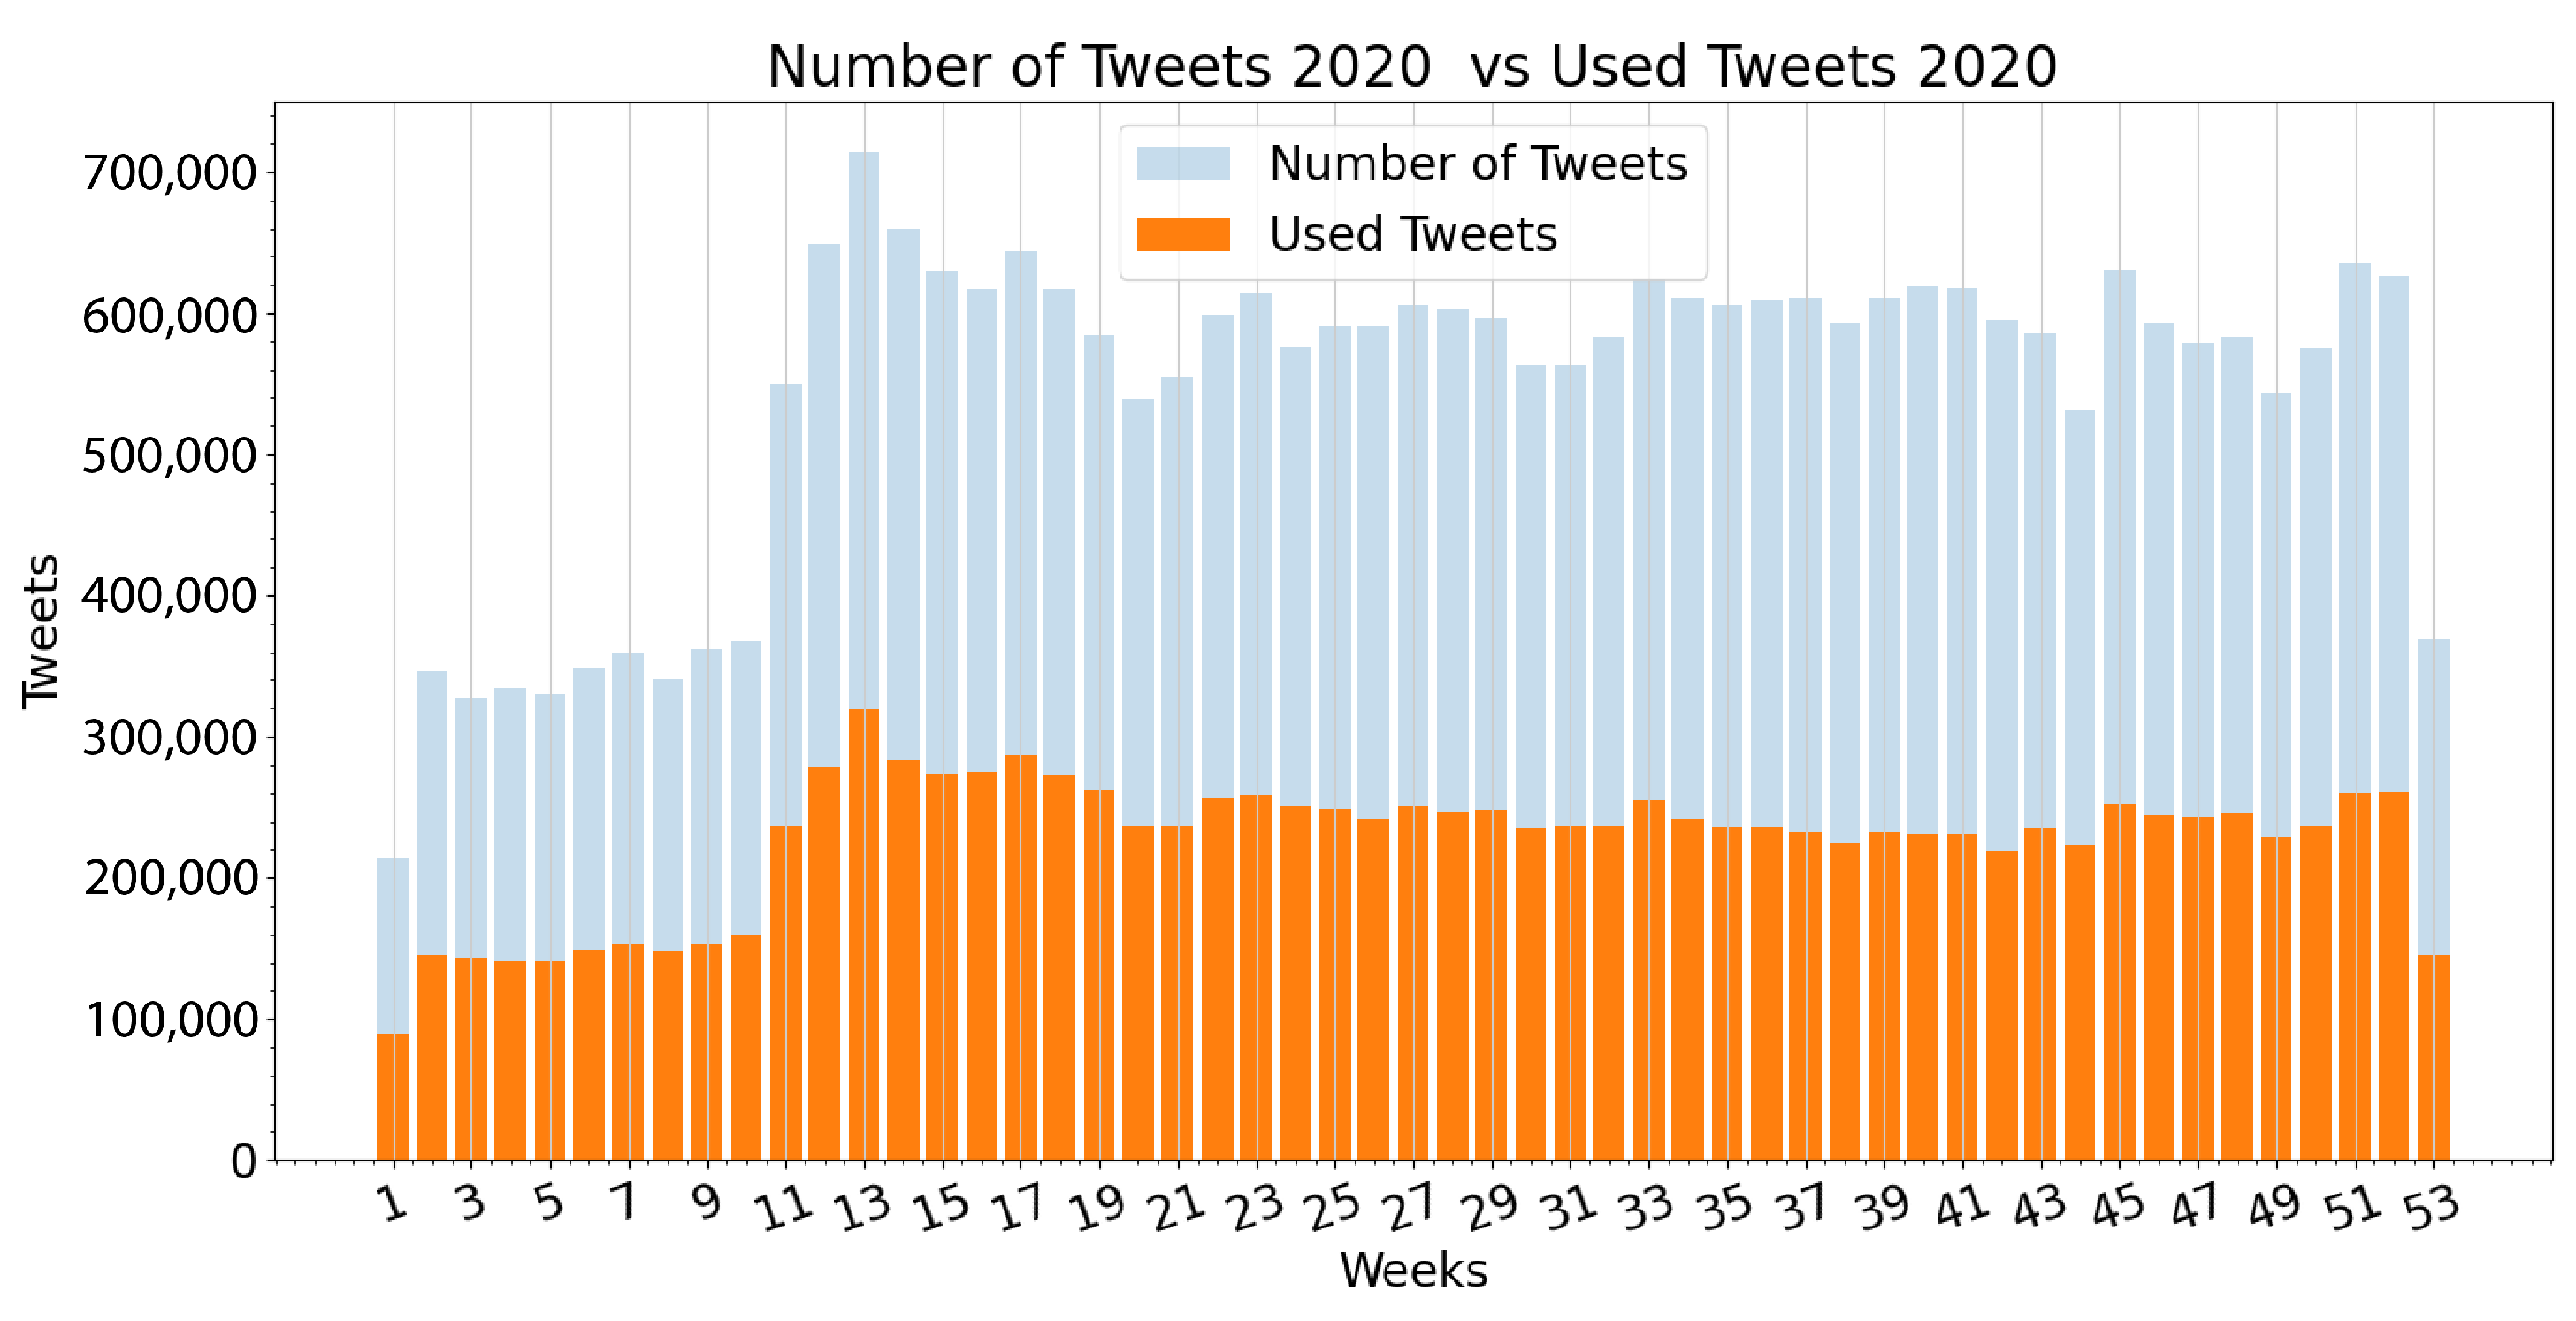
3.1. Extracted Data
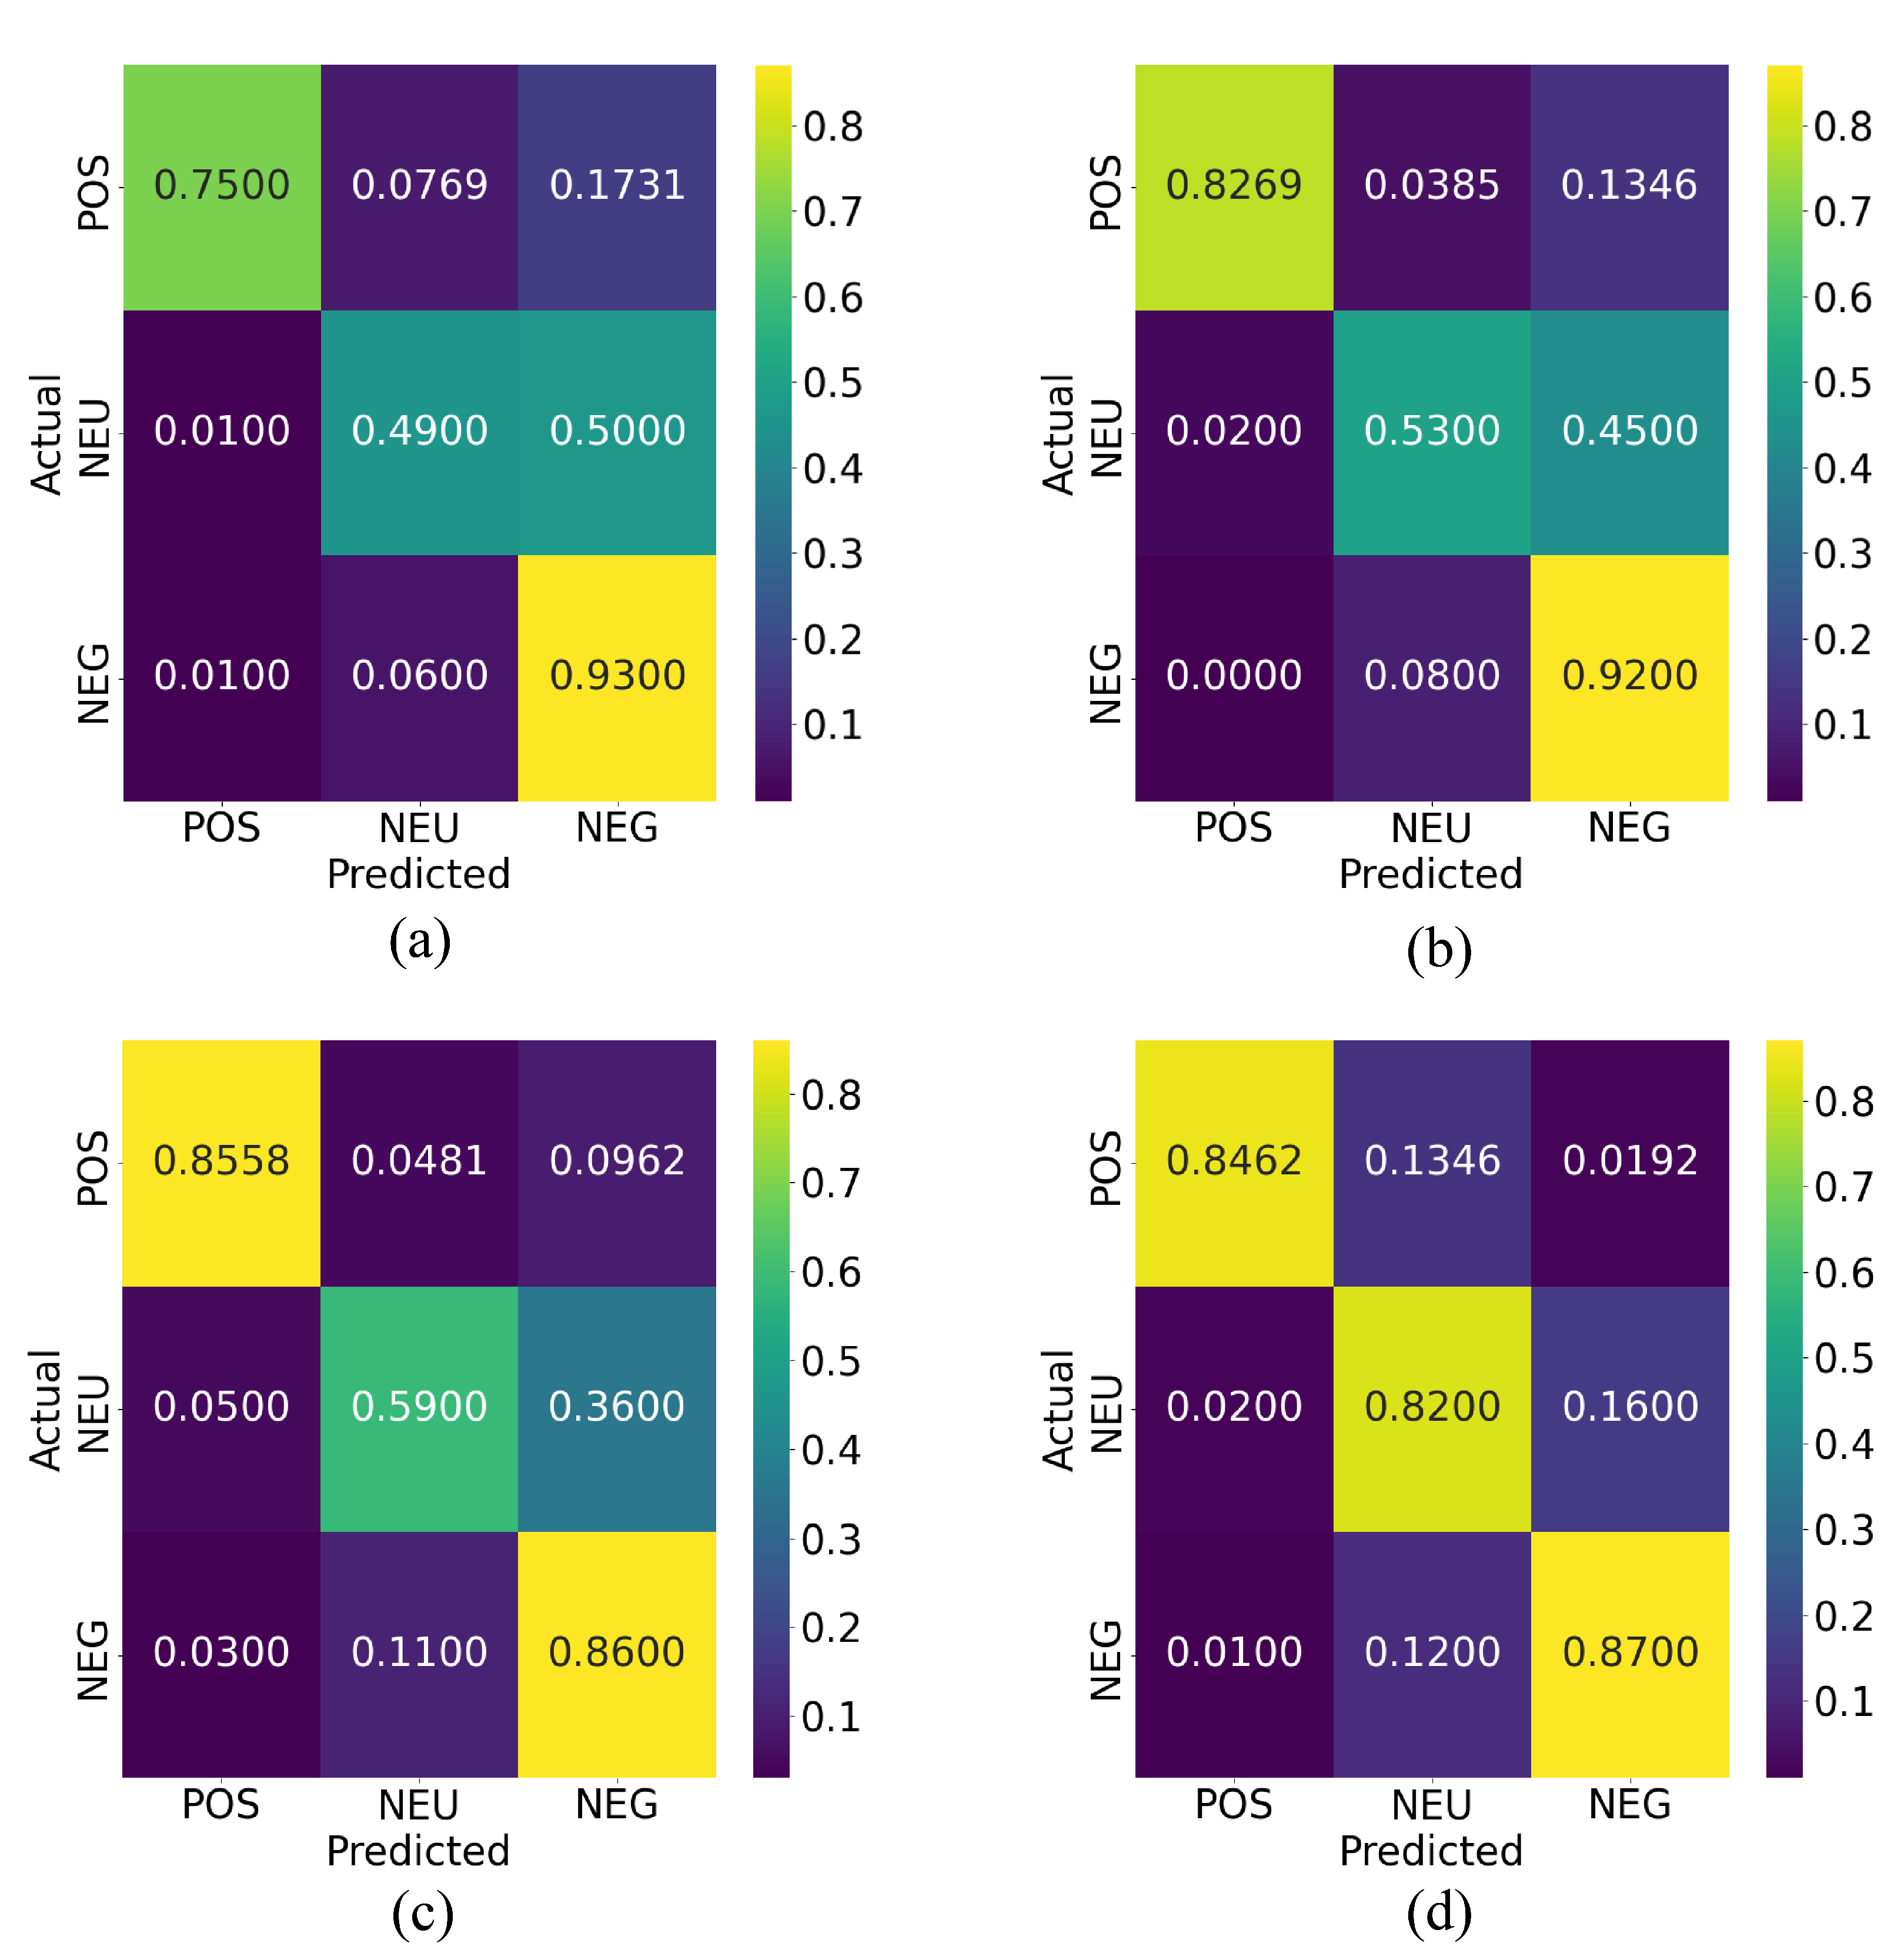
3.2. Method Evaluation
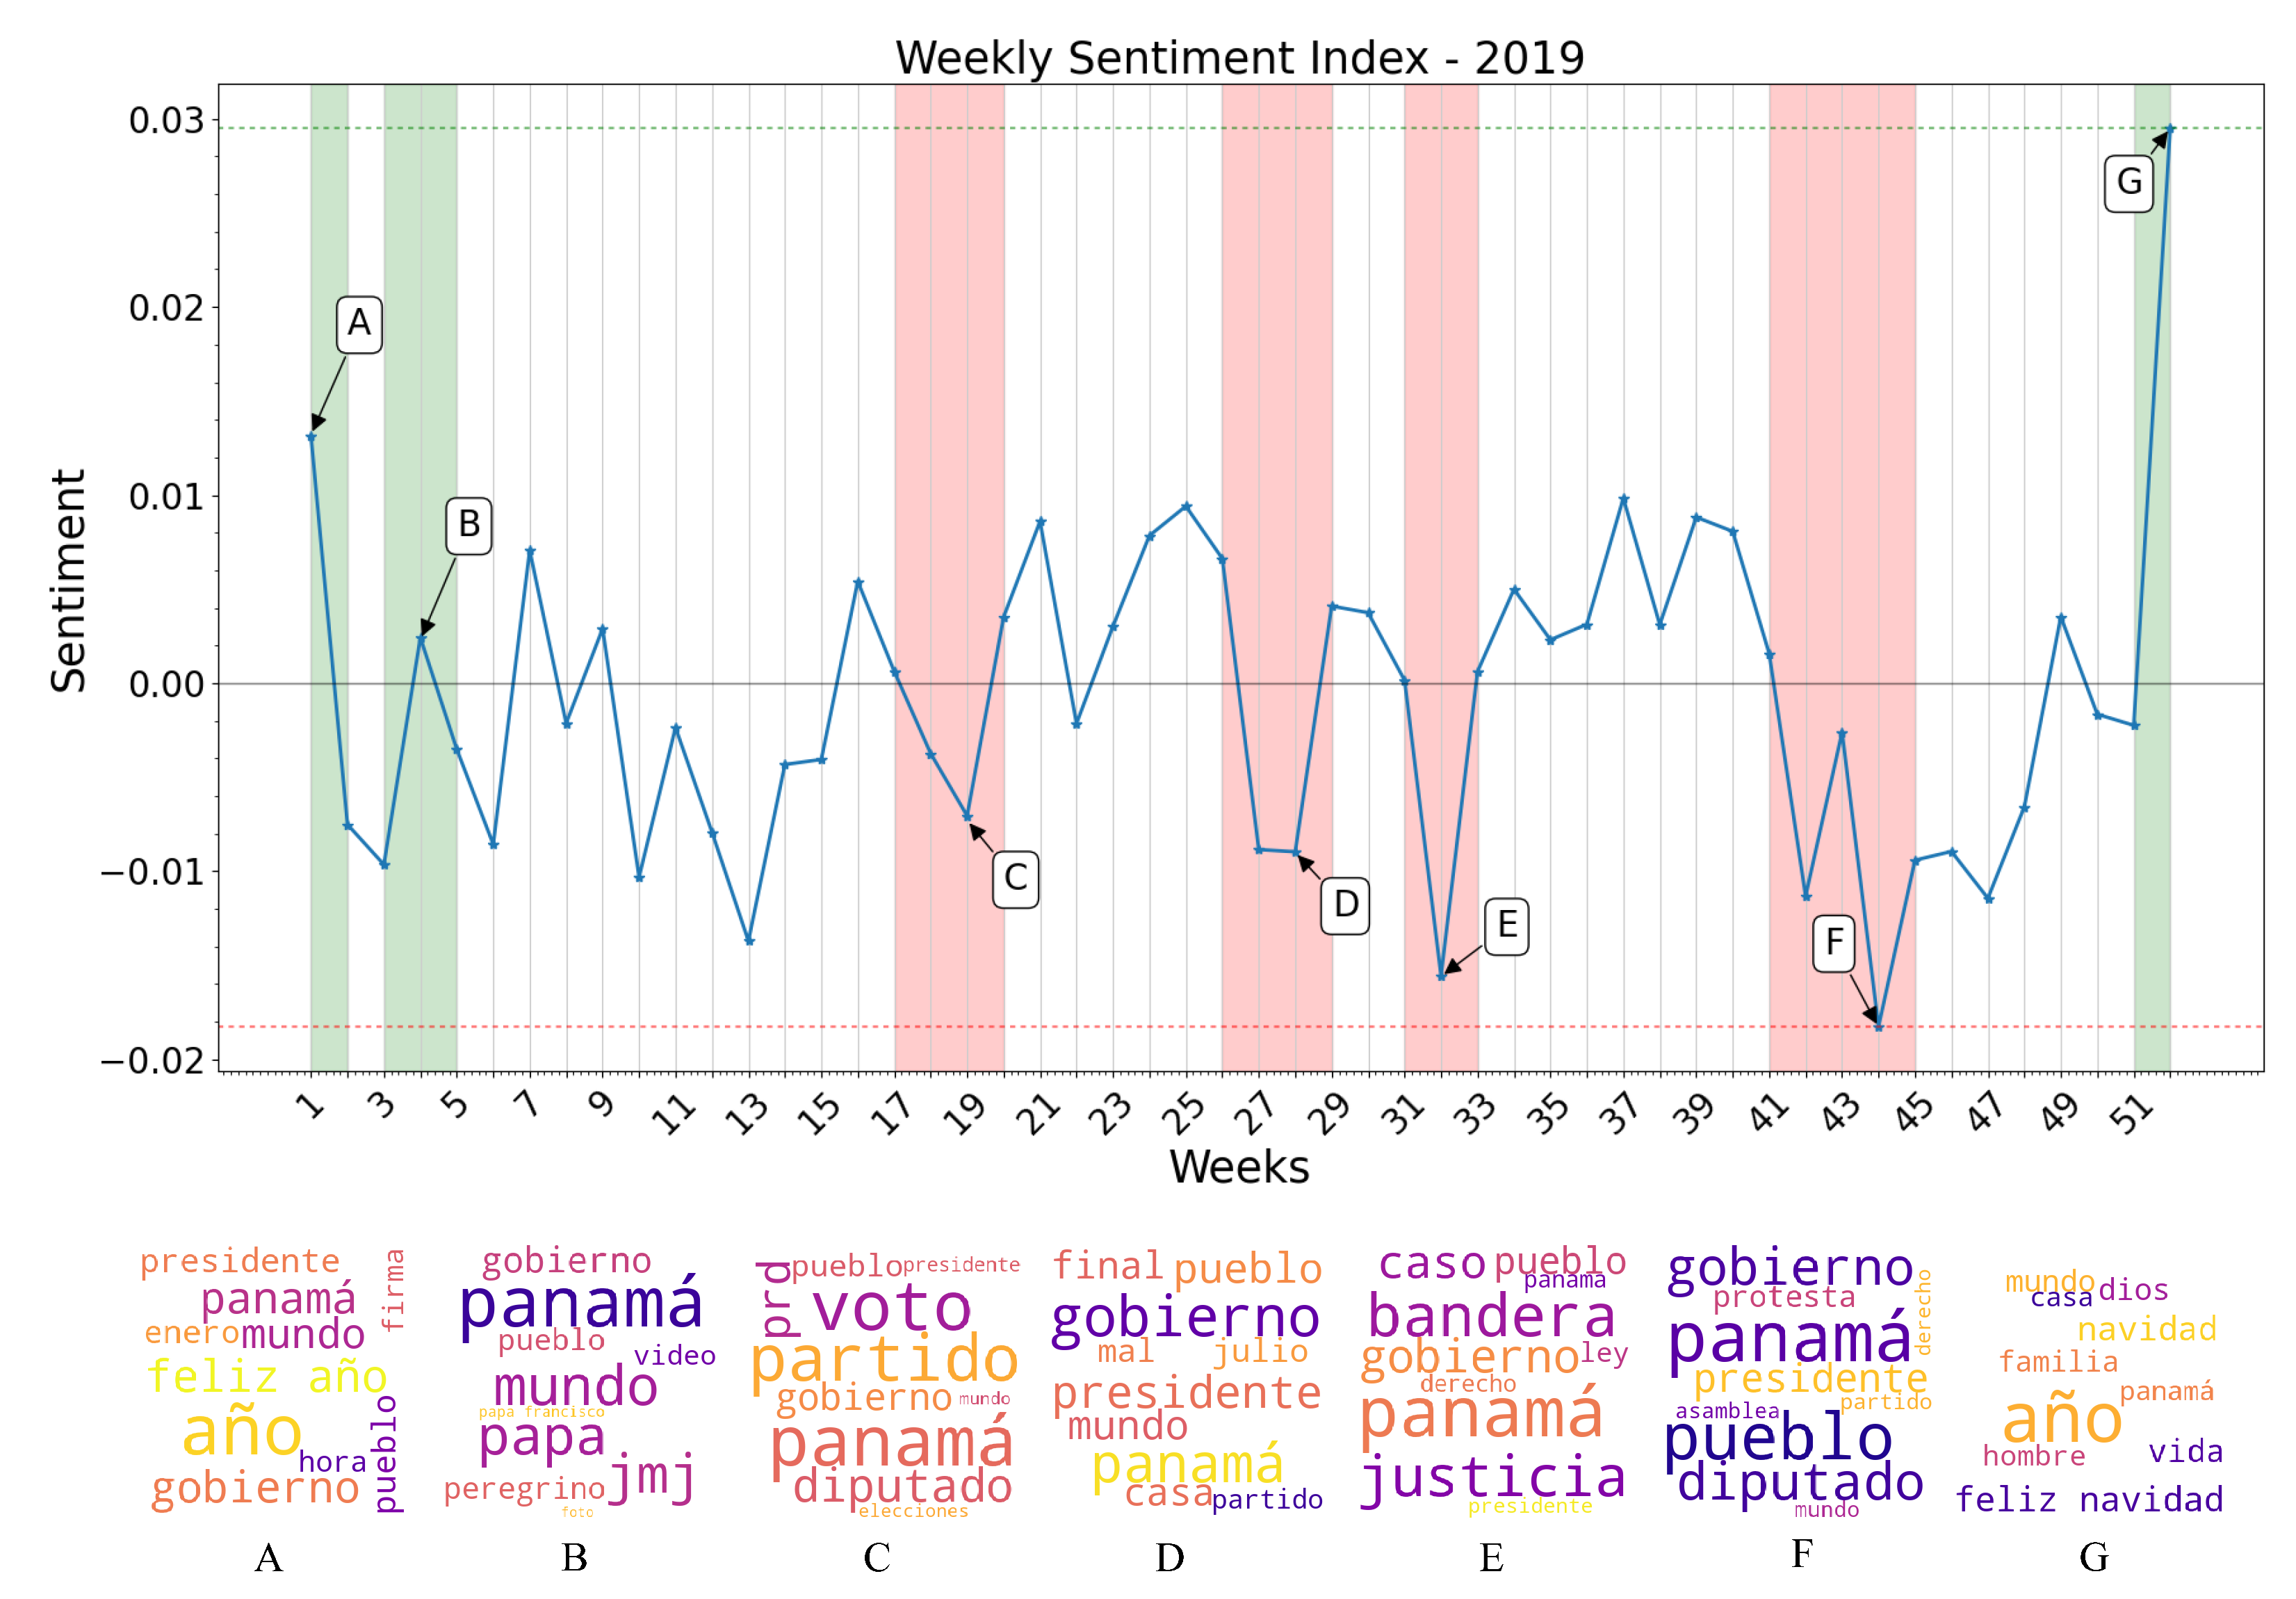
3.3. Sentiment Index Estimation
- Week 1: New Year celebrations and discussions of yearly resolutions predominate the public discussion, raising the overall sentiment towards a positive polarity. Notice the words “feliz año” (“happy new year” in Spanish) in the word cloud generated from the specified time period.
- Week 4: World Youth Day (WYD) 2019 takes place in Panama City from the 22 to the 27 of January. Pope Francis arrives on the country on the 23rd of January as well as more than 70 thousand foreign pilgrims. Sentiment regarding the event is overall conflicting, but tends towards a positive polarity. Notice the words “papa francisco”, “jmj” and “peregrino” (“Pope Francis”, “WYD”, and “pilgrim” in Spanish) in the word cloud of this period.
- Weeks 18–19: General elections take place in Panama. President Laurentino Cortizo is elected with 33% of votes in his favor, and his party (PRD) also obtaining a majority of legislators in the National Assembly, causing an overall discontent among the majority of the population with an online presence. Notice the words “diputado”, “presidente”, “prd”, “voto”, “party” (“depute”, “president”, “vote” and “[political] party” in Spanish) in the word cloud generated.
- Weeks 27–28: The President Elect, and newly elected National Assembly assume office. Public discontent grows, as a viral campaign against re-election of legislators fails. Notice the words “gobierno”, “presidente”, “pueblo”, “mal” (“governement”, “president”, “people”, and “bad” in Spanish) in the generated word cloud.
- Week 32: Protests against the re-election of legislator Benicio Robinson and his fellow party members take place outside the National Assembly. During these protests, an activist group displayed an altered version of the national flag with the LGBT colors instead of the red and blue, causing discontent among a mostly conservative population. Notice the words “bandera”, “justicia”, “gobierno”, and “pueblo” (“flag”, “justice”, “government” and “people” in Spanish) in the generated word cloud.
- Weeks 41–44: Mass-scale protests against the elected National Assembly erupt, resulting in dozens of arrests on consecutive days, and the deployment of riot control police on multiple locations. Most negative polarity of the year. Notice the words “protesta”, “gobierno”, “pueblo”, “diputado” and “presidente” (“protest”, “government”, “people”, “depute” and “president” in Spanish) in the word clouds generated.
- Week 52: Christmas and New Year celebrations raise overall sentiment once again. Notice the words “feliz navidad” (“Merry Christmas” in Spanish) as some of the most mentioned during this week in the word clouds generated.
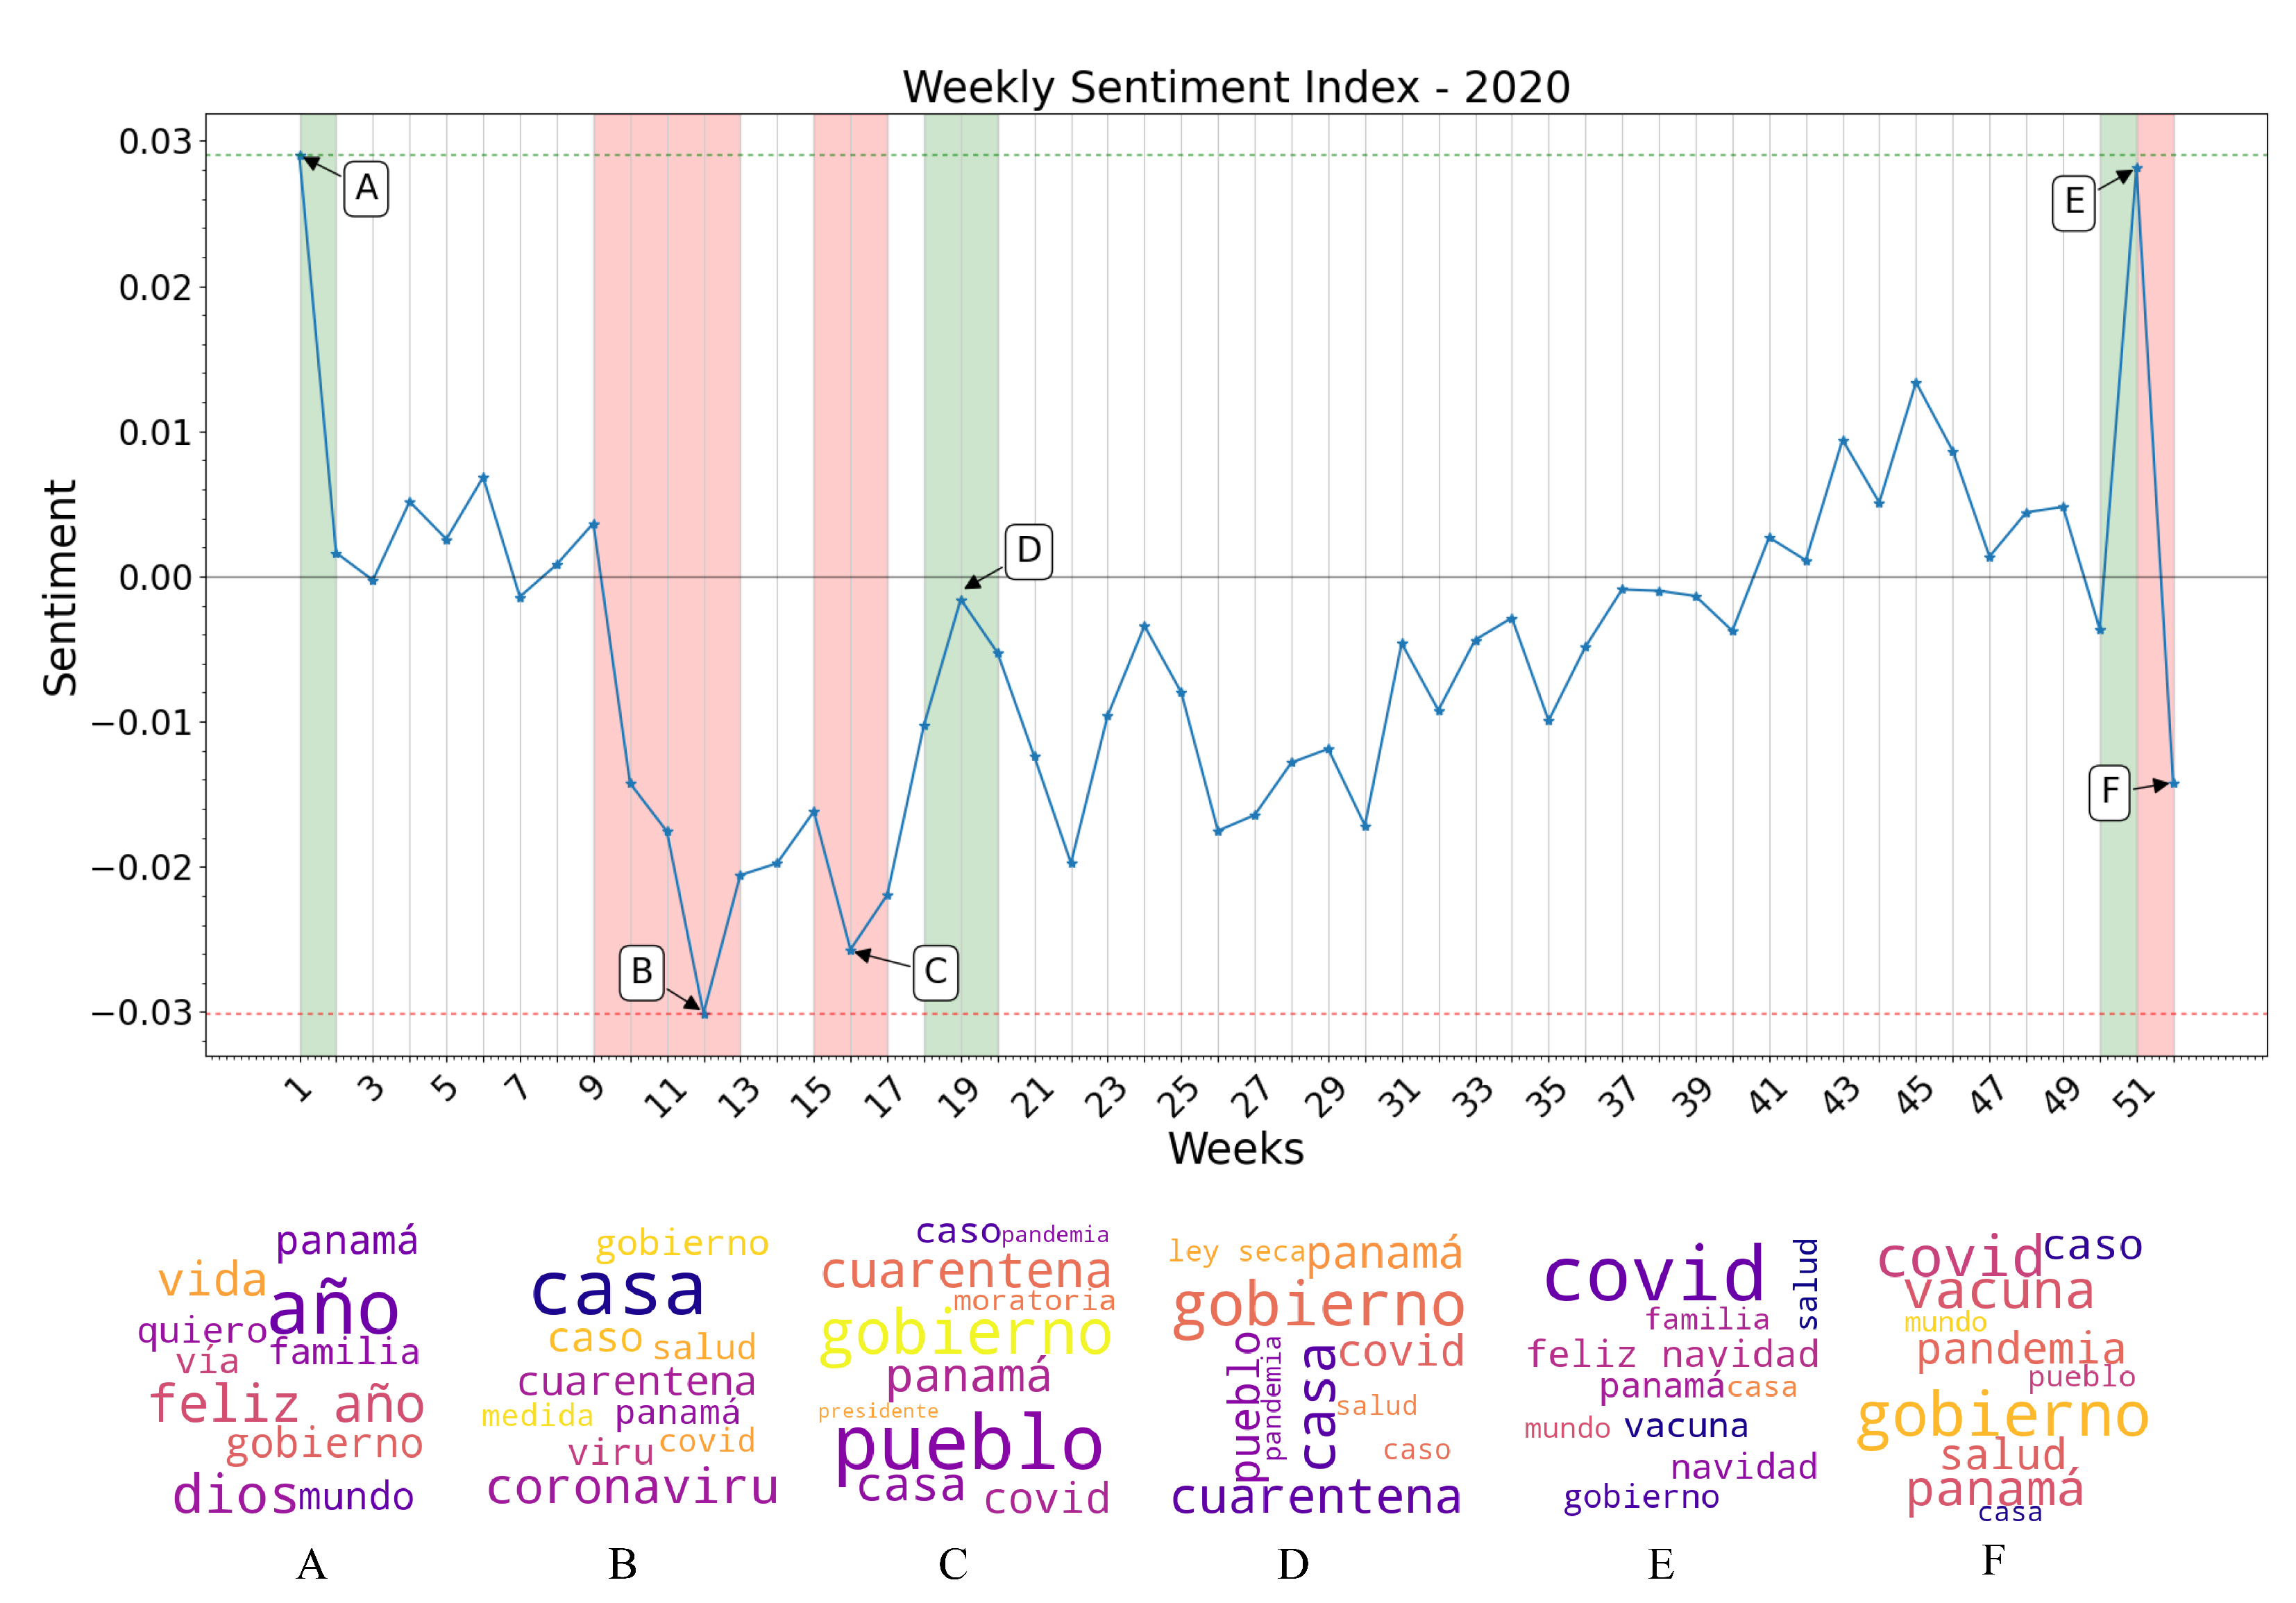
- Week 1: Year-end holiday sentiment carries on to the first week of the year. Notice the words “feliz año”, “quiero” and “familia” (“Happy New Year”, “I want”, and “family” in Spanish) as the most mentioned in this time period reflected in the word cloud.
- Week 10–13: First official detection of a COVID-19 case in Panama, and declaration of a Pandemic by the WHO. Panama’s Ministry of Health begins holding daily press conferences on the worsening epidemic situation in the country. Citizens demand the government to dictate quarantine measures to curb the spread of the disease (Week 12). Most negative sentiment polarity of the year. First measure of quarantine and curfew on a national level, as well as massive business closures and a prohibition of alcohol sales (Week 13). Sentiment remains negative, but less than the previous week as the government enacted restrictive measures to curb the spread of the disease. Most mentioned words according to the word clouds are “cuarentena”, “coronavirus”, “caso”, and “casa” (“quarantine”, “coronavirus”, “case” and “home” in Spanish) the last one referring to the “stay at home” movement seen worldwide during the first months of the pandemic.
- Week 16: Quarantine and curfew measures are extended beyond their original estimates. As the work situation of the majority of Panamanians remains uncertain, demand grows on social media for government-enforced moratoriums and economic aid. Sentiment remains negative. Among the most mentioned words remain “cuarentena”, “casa”, “covid”, “caso”, and “gobierno” as well as “moratoria” and “pueblo” (“quarantine”, “home”, “covid”, “case”, “government”, “moratorium” and “people” in Spanish).
- Week 19: Prohibition of alcohol sales is lifted. Sentiment tends toward a more positive polarity, criticism towards the government remains. Most frequent words remain stamble in comparison with previous weeks, with an uptick in metions of “ley seca” or “dry spell” in Spanish, meaning prohibition of alcohol sales.
- Week 51: The prospect of Christmas celebrations raise overall sentiment. Government confirms the emergency approval of the Pfizer-BioNTech vaccine, weeks after confirming the initial acquisition of 3 million of their vaccines, also contributing to an uptick in positive sentiment. Words such as “feliz navidad” and “vacuna” (“merry christmas” and “vaccine” in Spanish) appear frequently.
- Week 52: New wave of cases causes the installment of two-week quarantine and curfew measures on a national level in an attempt to control rising case numbers. The Panamanian government publishes the initial schedule of vaccine distribution, causing debate on social media. Sentiment deteriorates once again towards a negative polarity. Some of the most frequent words used according to the word clouds generated are “covid”, “vacuna”, “pandemia” and “caso” (“covid”, “vaccine”, “pandemic” and “case” in Spanish), not deviating from earlier stages of the pandemic.
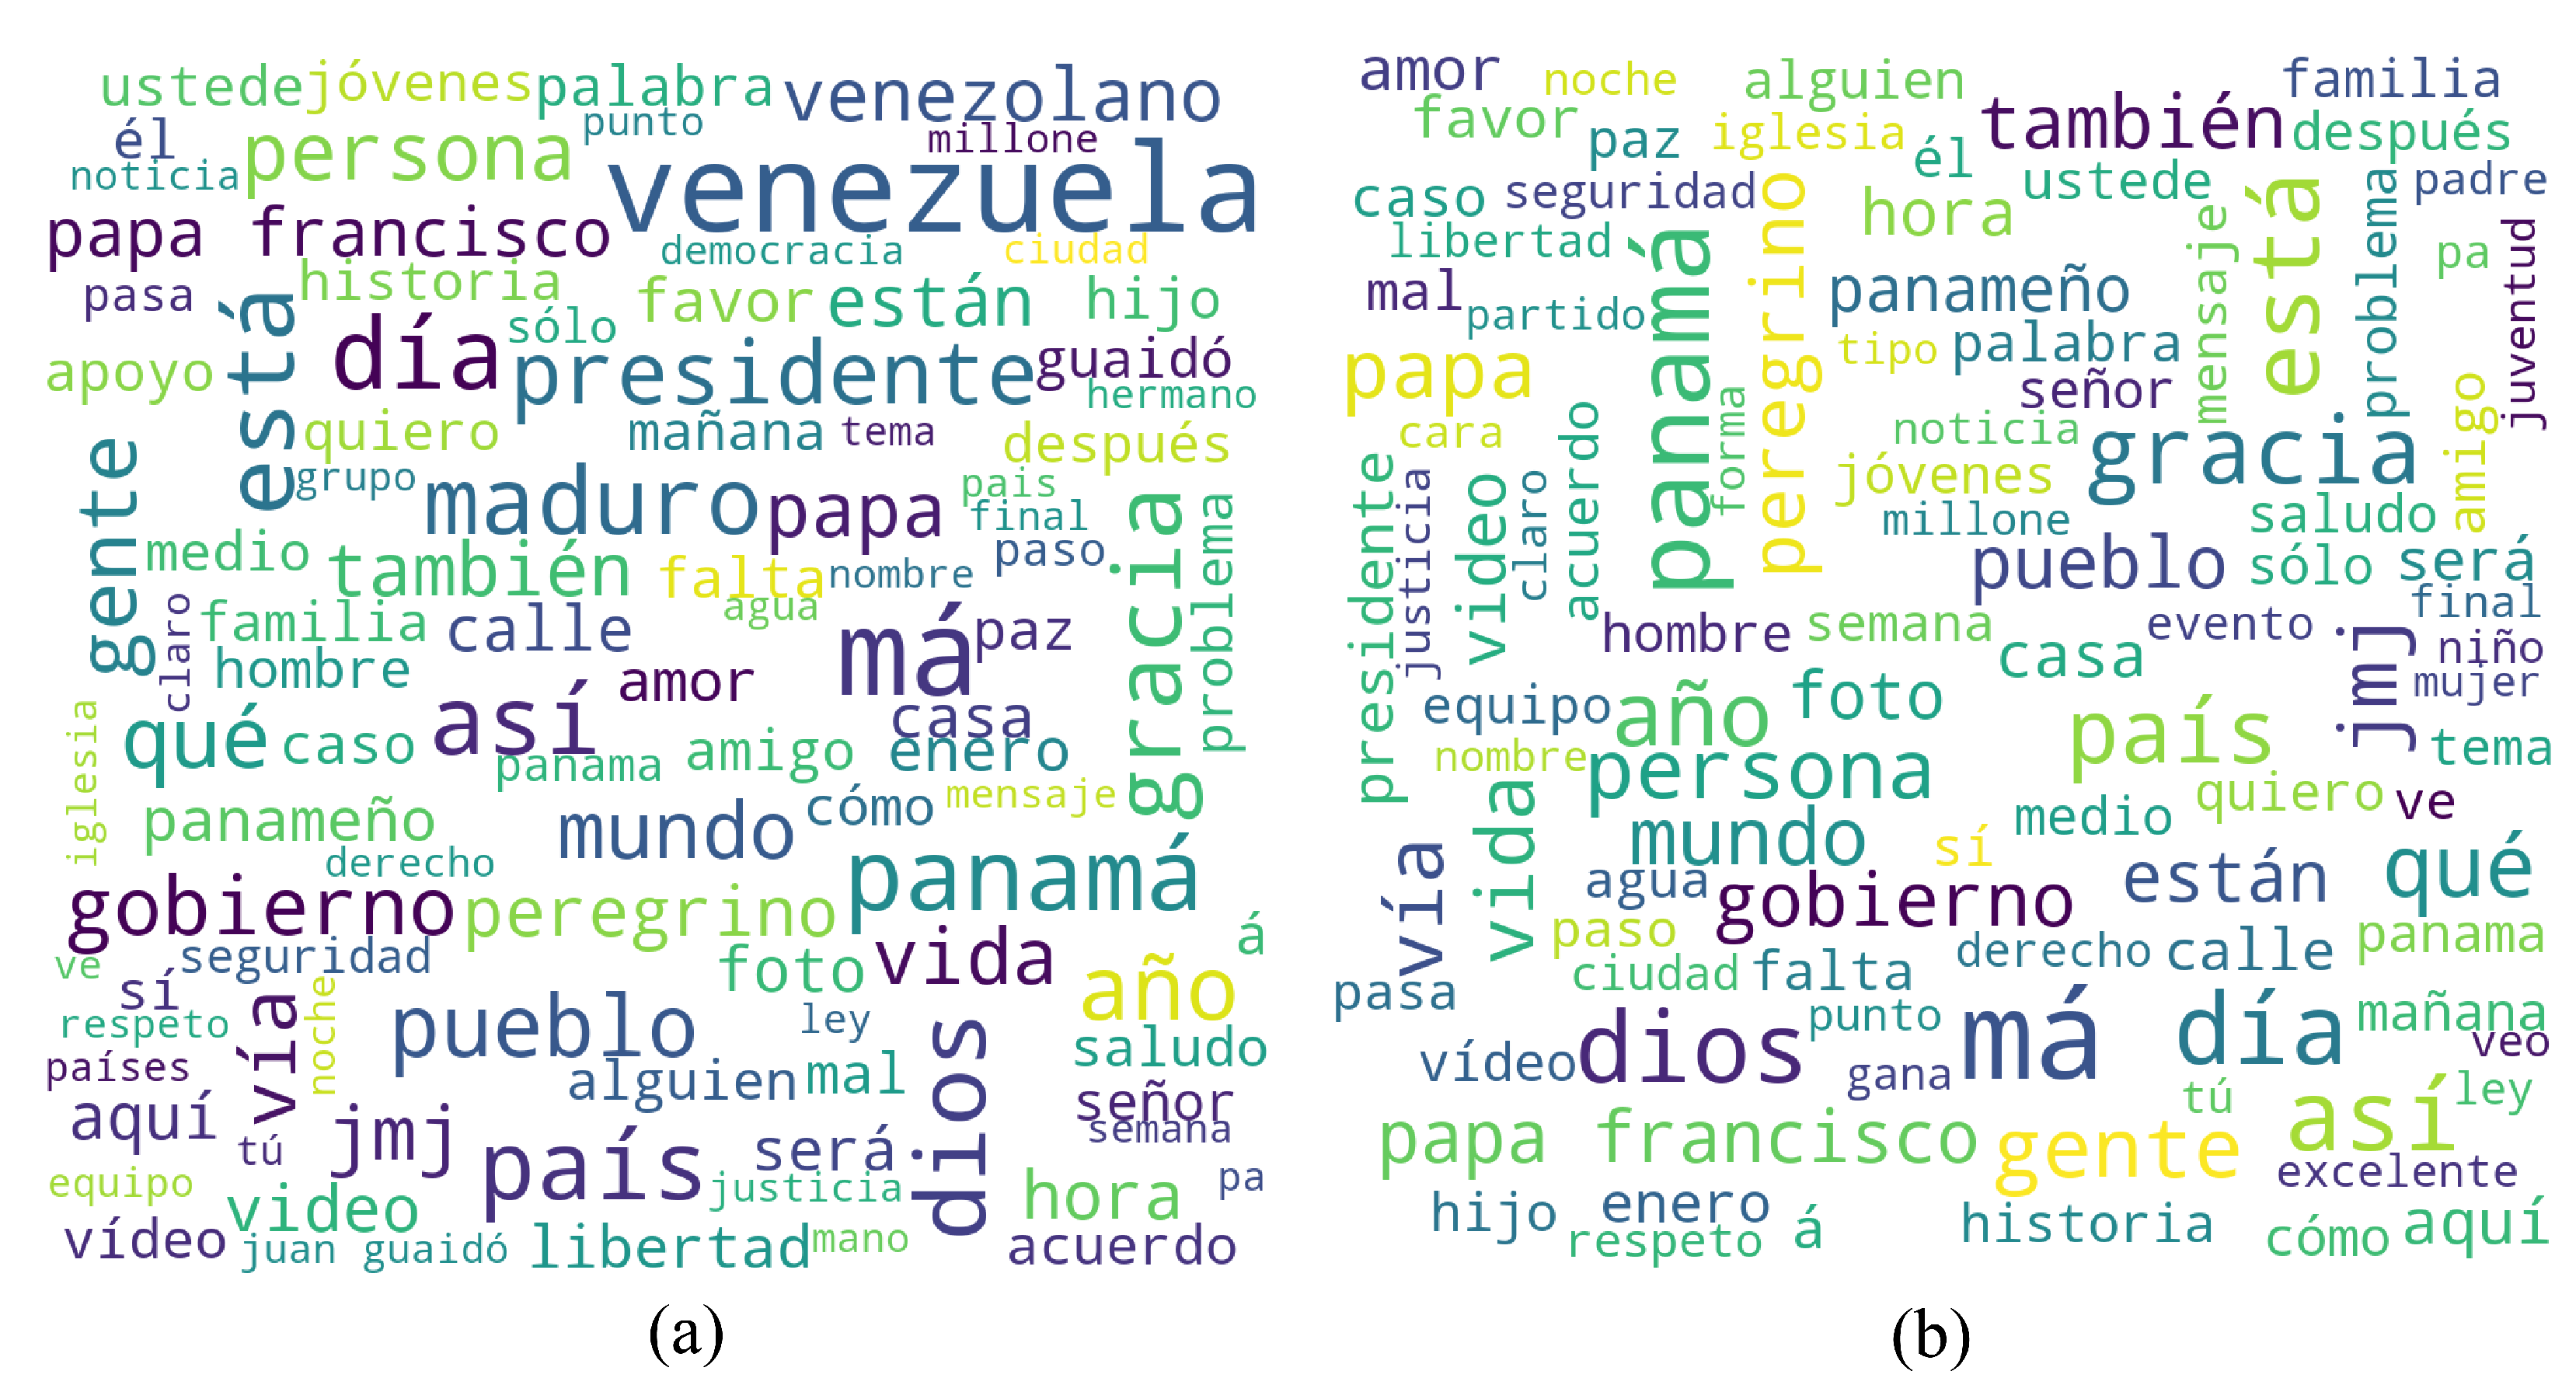
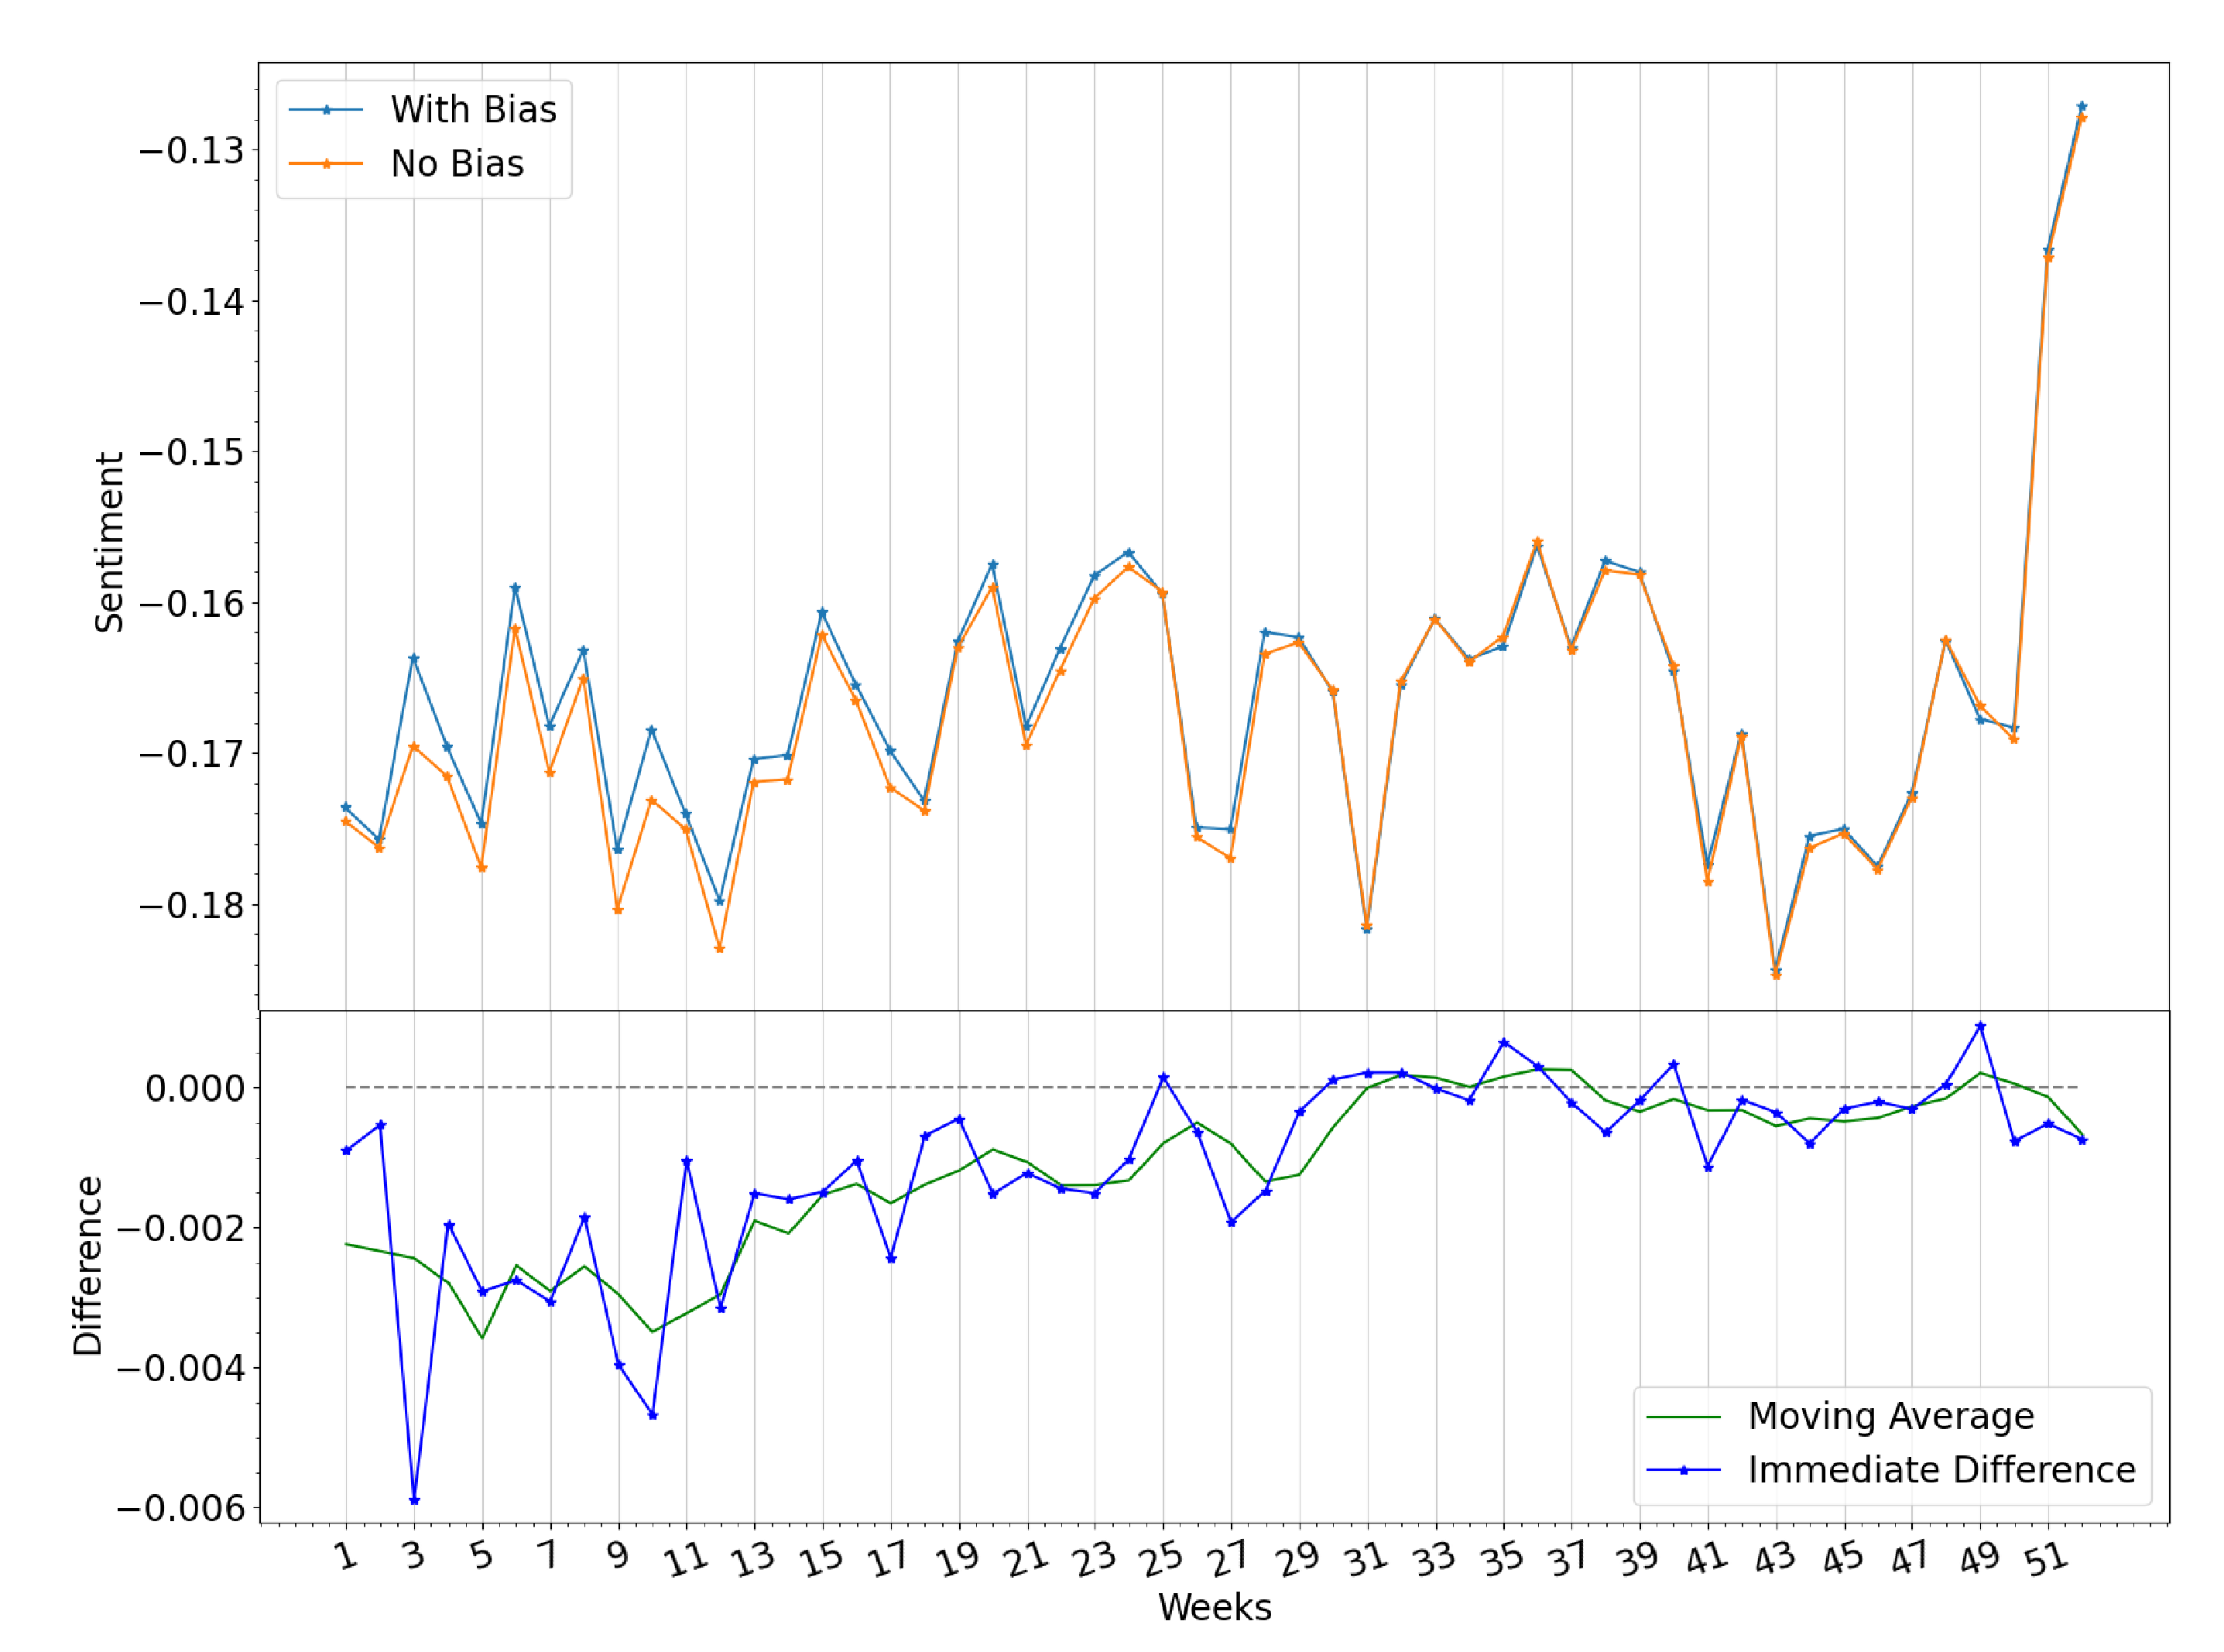
Impact of Immigrant Bias
- Week 3: Juan Guaidó is sworn Acting President of Venezuela on the 23rd of January, 2019. Millions of Venezuelans participated in massive demonstrations in Venezuela and in various countries around the world.
- Week 10: Nationwide blackouts occur between the 7th and the 12th of March resulting in at least 43 deaths related to a lack of power for critical equipment in venezuelan hospitals. This was the largest power outage in the country’s history, and even affected neighboring regions of Brazil.
4. Discussion of Results
5. Conclusions
Author Contributions
Funding
Acknowledgments
Conflicts of Interest
References
- Broniatowski, D.A.; Paul, M.J.; Dredze, M. National and local influenza surveillance through Twitter: An analysis of the 2012–2013 influenza epidemic. PLoS ONE 2013, 8, e83672. [Google Scholar] [CrossRef] [PubMed]
- Hawn, C. Take two aspirin and tweet me in the morning: How Twitter, Facebook, and other social media are reshaping health care. Health Aff. 2009, 28, 361–368. [Google Scholar] [CrossRef] [PubMed]
- Middleton, S.E.; Middleton, L.; Modafferi, S. Real-time crisis mapping of natural disasters using social media. IEEE Intell. Syst. 2013, 29, 9–17. [Google Scholar] [CrossRef]
- Abd-Alrazaq, A.; Alhuwail, D.; Househ, M.; Hamdi, M.; Shah, Z. Top concerns of tweeters during the COVID-19 pandemic: Infoveillance study. J. Med. Internet Res. 2020, 22, e19016. [Google Scholar] [CrossRef]
- Saini, S.; Punhani, R.; Bathla, R.; Shukla, V.K. Sentiment analysis on twitter data using R. In Proceedings of the 2019 International Conference on Automation, Computational and Technology Management (ICACTM), London, UK, 24–26 April 2019; pp. 68–72. [Google Scholar]
- Trappey, A.J.; Lin, A.P.; Hsu, K.Y.; Trappey, C.V.; Tu, K.L. Development of an Empathy-Centric Counseling Chatbot System Capable of Sentimental Dialogue Analysis. Processes 2022, 10, 930. [Google Scholar] [CrossRef]
- Ahmed, M.S.; Aurpa, T.T.; Anwar, M.M. Detecting sentiment dynamics and clusters of Twitter users for trending topics in COVID-19 pandemic. PLoS ONE 2021, 16, e0253300. [Google Scholar] [CrossRef]
- Shofiya, C.; Abidi, S. Sentiment analysis on COVID-19-related social distancing in Canada using Twitter data. Int. J. Environ. Res. Public Health 2021, 18, 5993. [Google Scholar] [CrossRef]
- Balog, K.; Mishne, G.; De Rijke, M. Why are they excited? Identifying and explaining spikes in blog mood levels. In Proceedings of the Demonstrations Conference, Trento, Italy, 3–7 April 2006; pp. 207–210. [Google Scholar]
- Young, T.; Hazarika, D.; Poria, S.; Cambria, E. Recent trends in deep learning based natural language processing. IEEE Comput. Intell. Mag. 2018, 13, 55–75. [Google Scholar] [CrossRef]
- Jindal, K.; Aron, R. A systematic study of sentiment analysis for social media data. Mater. Today Proc. 2021. [Google Scholar] [CrossRef]
- Hemmatian, F.; Sohrabi, M.K. A survey on classification techniques for opinion mining and sentiment analysis. Artif. Intell. Rev. 2019, 52, 1495–1545. [Google Scholar] [CrossRef]
- Nandwani, P.; Verma, R. A review on sentiment analysis and emotion detection from text. Soc. Netw. Anal. Min. 2021, 11, 1–19. [Google Scholar] [CrossRef]
- Antonakaki, D.; Fragopoulou, P.; Ioannidis, S. A survey of Twitter research: Data model, graph structure, sentiment analysis and attacks. Expert Syst. Appl. 2021, 164, 114006. [Google Scholar] [CrossRef]
- Ambalavan, A.K.; Moulahi, B.; Azé, J.; Bringay, S. Unveiling online suicide behavior: What can we learn about mental health from suicide survivors of Reddit? In Proceedings of the MedInfo Conference, Lyon, France, 5–30 August 2019; pp. 50–54. [Google Scholar]
- Ceron, A.; Curini, L.; Iacus, S.M.; Porro, G. Every tweet counts? How sentiment analysis of social media can improve our knowledge of citizens’ political preferences with an application to Italy and France. New Media Soc. 2014, 16, 340–358. [Google Scholar] [CrossRef]
- Li, J.; Meesad, P. Combining sentiment analysis with socialization bias in social networks for stock market trend prediction. INternational J. Comput. Intell. Appl. 2016, 15, 1650003. [Google Scholar] [CrossRef]
- Philander, K.; Zhong, Y. Twitter sentiment analysis: Capturing sentiment from integrated resort tweets. Int. J. Hosp. Manag. 2016, 55, 16–24. [Google Scholar] [CrossRef]
- Georgiadou, E.; Angelopoulos, S.; Drake, H. Big data analytics and international negotiations: Sentiment analysis of Brexit negotiating outcomes. Int. J. Inf. Manag. 2020, 51, 102048. [Google Scholar] [CrossRef]
- Arias, F.; Zambrano Nuñez, M.; Guerra-Adames, A.; Tejedor-Flores, N.; Vargas-Lombardo, M. Sentiment Analysis of Public Social Media as a Tool for Health-Related Topics. IEEE Access 2022, 10, 74850–74872. [Google Scholar] [CrossRef]
- Yeasmin, N.; Mahbub, N.I.; Baowaly, M.K.; Singh, B.C.; Alom, Z.; Aung, Z.; Azim, M.A. Analysis and Prediction of User Sentiment on COVID-19 Pandemic Using Tweets. Big Data Cogn. Comput. 2022, 6, 65. [Google Scholar] [CrossRef]
- Djatmiko, F.; Ferdiana, R.; Faris, M. A review of sentiment analysis for non-English language. In Proceedings of the 2019 International Conference of Artificial Intelligence and Information Technology (ICAIIT), Yogyakarta, Indonesia, 13–15 March 2019; pp. 448–451. [Google Scholar]
- Miranda, C.H.; Guzman, J. A review of Sentiment Analysis in Spanish. Tecciencia 2017, 12, 35–48. [Google Scholar] [CrossRef]
- Cruz, F.L.; Troyano, J.A.; Pontes, B.; Ortega, F.J. ML-SentiCon: Un lexicón multilingüe de polaridades semánticas a nivel de lemas. Proces. del Leng. Nat. 2014, 53, 113–120. [Google Scholar]
- Brooke, J.; Tofiloski, M.; Taboada, M. Cross-linguistic sentiment analysis: From English to Spanish. In Proceedings of the International Conference RANLP-2009, Borovets, Bulgaria, 14–16 September 2009; pp. 50–54. [Google Scholar]
- Zafra, S.M.J.; Valdivia, M.T.M.; Camara, E.M.; Lopez, L.A.U. Studying the scope of negation for Spanish sentiment analysis on Twitter. IEEE Trans. Affect. Comput. 2017, 10, 129–141. [Google Scholar] [CrossRef]
- Angel, S.O.; Negrón, A.P.P.; Espinoza-Valdez, A. Systematic literature review of sentiment analysis in the Spanish language. Data Technol. Appl. 2021. [Google Scholar] [CrossRef]
- Gutiérrez, G.; Margain, L.; Luna, C.D.; Padilla, A.; Ponce, J.; Canul, J.; Ochoa, A. A sentiment analysis model: To process subjective social corpus through the adaptation of an affective semantic lexicon. In Proceedings of the Mexican International Conference on Artificial Intelligence, Tuxtla Gutierrez, Mexico, 16–22 November 2014; pp. 233–244. [Google Scholar]
- Vaswani, A.; Shazeer, N.; Parmar, N.; Uszkoreit, J.; Jones, L.; Gomez, A.N.; Kaiser, Ł.; Polosukhin, I. Attention is all you need. Adv. Neural Inf. Process. Syst. 2017, 30. [Google Scholar]
- Devlin, J.; Chang, M.W.; Lee, K.; Toutanova, K. Bert: Pre-training of deep bidirectional transformers for language understanding. arXiv 2018, arXiv:1810.04805. [Google Scholar]
- Canete, J.; Chaperon, G.; Fuentes, R.; Ho, J.H.; Kang, H.; Pérez, J. Spanish pre-trained bert model and evaluation data. Pml4dc at iclr 2020, 2020, 1–10. [Google Scholar]
- Pérez, J.M.; Furman, D.A.; Alemany, L.A.; Luque, F. RoBERTuito: A pre-trained language model for social media text in Spanish. arXiv 2021, arXiv:2111.09453. [Google Scholar]
- Alzamzami, F.; Hoda, M.; El Saddik, A. Light gradient boosting machine for general sentiment classification on short texts: A comparative evaluation. IEEE Access 2020, 8, 101840–101858. [Google Scholar] [CrossRef]
- Athanasiou, V.; Maragoudakis, M. A novel, gradient boosting framework for sentiment analysis in languages where NLP resources are not plentiful: A case study for modern Greek. Algorithms 2017, 10, 34. [Google Scholar] [CrossRef]
- Seyfioğlu, M.S.; Demirezen, M.U. A hierarchical approach for sentiment analysis and categorization of Turkish written customer relationship management data. In Proceedings of the 2017 Federated Conference on Computer Science and Information Systems (FedCSIS), Prague, Czech Republic, 3–6 September 2017; pp. 361–365. [Google Scholar]
- Fernandez, G.; Maione, C.; Yang, H.; Zaballa, K.; Bonnici, N.; Carter, J.; Spitzberg, B.H.; Jin, C.; Tsou, M.H. Social Network Analysis of COVID-19 Sentiments: 10 Metropolitan Cities in Italy. Int. J. Environ. Res. Public Health 2022, 19, 7720. [Google Scholar] [CrossRef]
- Kydros, D.; Argyropoulou, M.; Vrana, V. A content and sentiment analysis of Greek tweets during the pandemic. Sustainability 2021, 13, 6150. [Google Scholar] [CrossRef]
- Obiedat, R.; Harfoushi, O.; Qaddoura, R.; Al-Qaisi, L.; Al-Zoubi, A. An evolutionary-based sentiment analysis approach for enhancing government decisions during COVID-19 pandemic: The case of jordan. Appl. Sci. 2021, 11, 9080. [Google Scholar] [CrossRef]
- Wang, T.; Lu, K.; Chow, K.P.; Zhu, Q. COVID-19 sensing: Negative sentiment analysis on social media in China via BERT model. IEEE Access 2020, 8, 138162–138169. [Google Scholar] [CrossRef] [PubMed]
- Qi, H.; Jiang, H.; Bu, W.; Zhang, C.; Shim, K.J. Tracking political events in social media: A case study of Hong Kong protests. In Proceedings of the 2019 IEEE International Conference on Big Data (Big Data), Los Angeles, CA, USA, 9–12 December 2019; pp. 6192–6194. [Google Scholar]
- Bang, C.C.; Lee, J.; Rao, H.R. The Egyptian protest movement in the twittersphere: An investigation of dual sentiment pathways of communication. Int. J. Inf. Manag. 2021, 58, 102328. [Google Scholar] [CrossRef]
- Nicoletti, L.; Verma, T.; Santi, P.; Warnier, M. Tweets Matter: Quantifying the Spatio-Temporal Relationship Between Social Media Activism and Physical Protest. 2022. [Google Scholar] [CrossRef]
- Jakubik, J.; Vössing, M.; Bär, D.; Pröllochs, N.; Feuerriegel, S. Online Emotions During the Storming of the US Capitol: Evidence from the Social Media Network Parler. arXiv 2022, arXiv:2204.04245. [Google Scholar]
- Li, Q.; King, B.; Uzzi, B. Quantifying The Leadership and Social Media Predictors of Violence and Racism during the January 6th Attack on the Capitol. 2022. [Google Scholar] [CrossRef]
- Loaiza, J.R.; Rao, K.; Eskildsen, G.A.; Ortega-Barria, E.; Miller, M.J.; Gittens, R.A. COVID-19 pandemic in Panama: Lessons of the unique risks and research opportunities for Latin America. Rev. Panam. Salud Pública 2020, 44, e86. [Google Scholar] [CrossRef]
- The World Bank. Online Resource: Individuals Using the Internet (% of Population)—Panama. 2020. Available online: https://data.worldbank.org/indicator/IT.NET.USER.ZS?locations=PA (accessed on 12 February 2022).
- Kemp, S. Digital in Panama: All the Statistics You Need in 2021— DataReportal–Global Digital Insights. 2021. Available online: https://datareportal.com/reports/digital-2021-panama (accessed on 12 February 2022).
- Twitter API Documentation. Online Resource: Twitter API v2.0 Reference Index. Available online: https://developer.twitter.com/en/docs/api-reference-index (accessed on 12 February 2022).
- Lui, M.; Baldwin, T. langid.py: An Off-the-shelf Language Identification Tool. In Proceedings of the ACL 2012 System Demonstrations, Association for Computational Linguistics, Jeju Island, Korea, 8–14 July 2012; pp. 25–30. [Google Scholar]
- Pedregosa, F.; Varoquaux, G.; Gramfort, A.; Michel, V.; Thirion, B.; Grisel, O.; Blondel, M.; Prettenhofer, P.; Weiss, R.; Dubourg, V.; et al. Scikit-learn: Machine Learning in Python. J. Mach. Learn. Res. 2011, 12, 2825–2830. [Google Scholar]
- Gedan, B.N. Venezuelan migration: Is the western hemisphere prepared for a refugee crisis? SAIS Rev. Int. Aff. 2017, 37, 57–64. [Google Scholar] [CrossRef]
- UNICEF. Panamá—Situación De La Población Refugiada Y Migrante De Venezuela En Panamá (September 2019). 2019. Available online: https://panama.un.org/es/47624-situacion-de-la-poblacion-refugiada-y-migrante-de-venezuela-en-panama (accessed on 22 June 2022).
- Dekker, R.; Engbersen, G.; Klaver, J.; Vonk, H. Smart refugees: How Syrian asylum migrants use social media information in migration decision-making. Soc. Media Soc. 2018, 4, 2056305118764439. [Google Scholar] [CrossRef]
- Merisalo, M.; Jauhiainen, J.S. Asylum-related migrants’ social-media use, mobility decisions, and resilience. J. Immigr. Refug. Stud. 2021, 19, 184–198. [Google Scholar] [CrossRef]
- Mustapha, A.; Mohamed, L.; Ali, K. An overview of gradient descent algorithm optimization in machine learning: Application in the ophthalmology field. In Proceedings of the International Conference on Smart Applications and Data Analysis, Marrakesh, Morocco, 25–26 June 2020; pp. 349–359. [Google Scholar]
- Sutskever, I.; Martens, J.; Dahl, G.; Hinton, G. On the importance of initialization and momentum in deep learning. In Proceedings of the International Conference on Machine Learning, Atlanta, GA, USA, 17–19 June 2013; pp. 1139–1147. [Google Scholar]


| Method | Accuracy | Precision | Recall | F1 | Time (ms) |
|---|---|---|---|---|---|
| KNN | 0.4703 | 0.7943 | 0.4728 | 0.4106 | 10 |
| NB | 0.6282 | 0.6449 | 0.6271 | 0.6189 | 301 |
| GB | 0.7401 | 0.7944 | 0.7401 | 0.7373 | 1894 |
| SGD | 0.7631 | 0.8041 | 0.7620 | 0.7594 | 6 |
| SVC | 0.7697 | 0.7852 | 0.7685 | 0.7670 | 833 |
| XGB | 0.8466 | 0.8536 | 0.8466 | 0.8484 | 34 |
Publisher’s Note: MDPI stays neutral with regard to jurisdictional claims in published maps and institutional affiliations. |
© 2022 by the authors. Licensee MDPI, Basel, Switzerland. This article is an open access article distributed under the terms and conditions of the Creative Commons Attribution (CC BY) license (https://creativecommons.org/licenses/by/4.0/).
Share and Cite
Arias, F.; Guerra-Adames, A.; Zambrano, M.; Quintero-Guerra, E.; Tejedor-Flores, N. Analyzing Spanish-Language Public Sentiment in the Context of a Pandemic and Social Unrest: The Panama Case. Int. J. Environ. Res. Public Health 2022, 19, 10328. https://doi.org/10.3390/ijerph191610328
Arias F, Guerra-Adames A, Zambrano M, Quintero-Guerra E, Tejedor-Flores N. Analyzing Spanish-Language Public Sentiment in the Context of a Pandemic and Social Unrest: The Panama Case. International Journal of Environmental Research and Public Health. 2022; 19(16):10328. https://doi.org/10.3390/ijerph191610328
Chicago/Turabian StyleArias, Fernando, Ariel Guerra-Adames, Maytee Zambrano, Efraín Quintero-Guerra, and Nathalia Tejedor-Flores. 2022. "Analyzing Spanish-Language Public Sentiment in the Context of a Pandemic and Social Unrest: The Panama Case" International Journal of Environmental Research and Public Health 19, no. 16: 10328. https://doi.org/10.3390/ijerph191610328