
A Study of the Plan and Performance Evaluation Method of an 8-m3 Chamber Using Ventilation Experiments and Numerical Analyses

Abstract
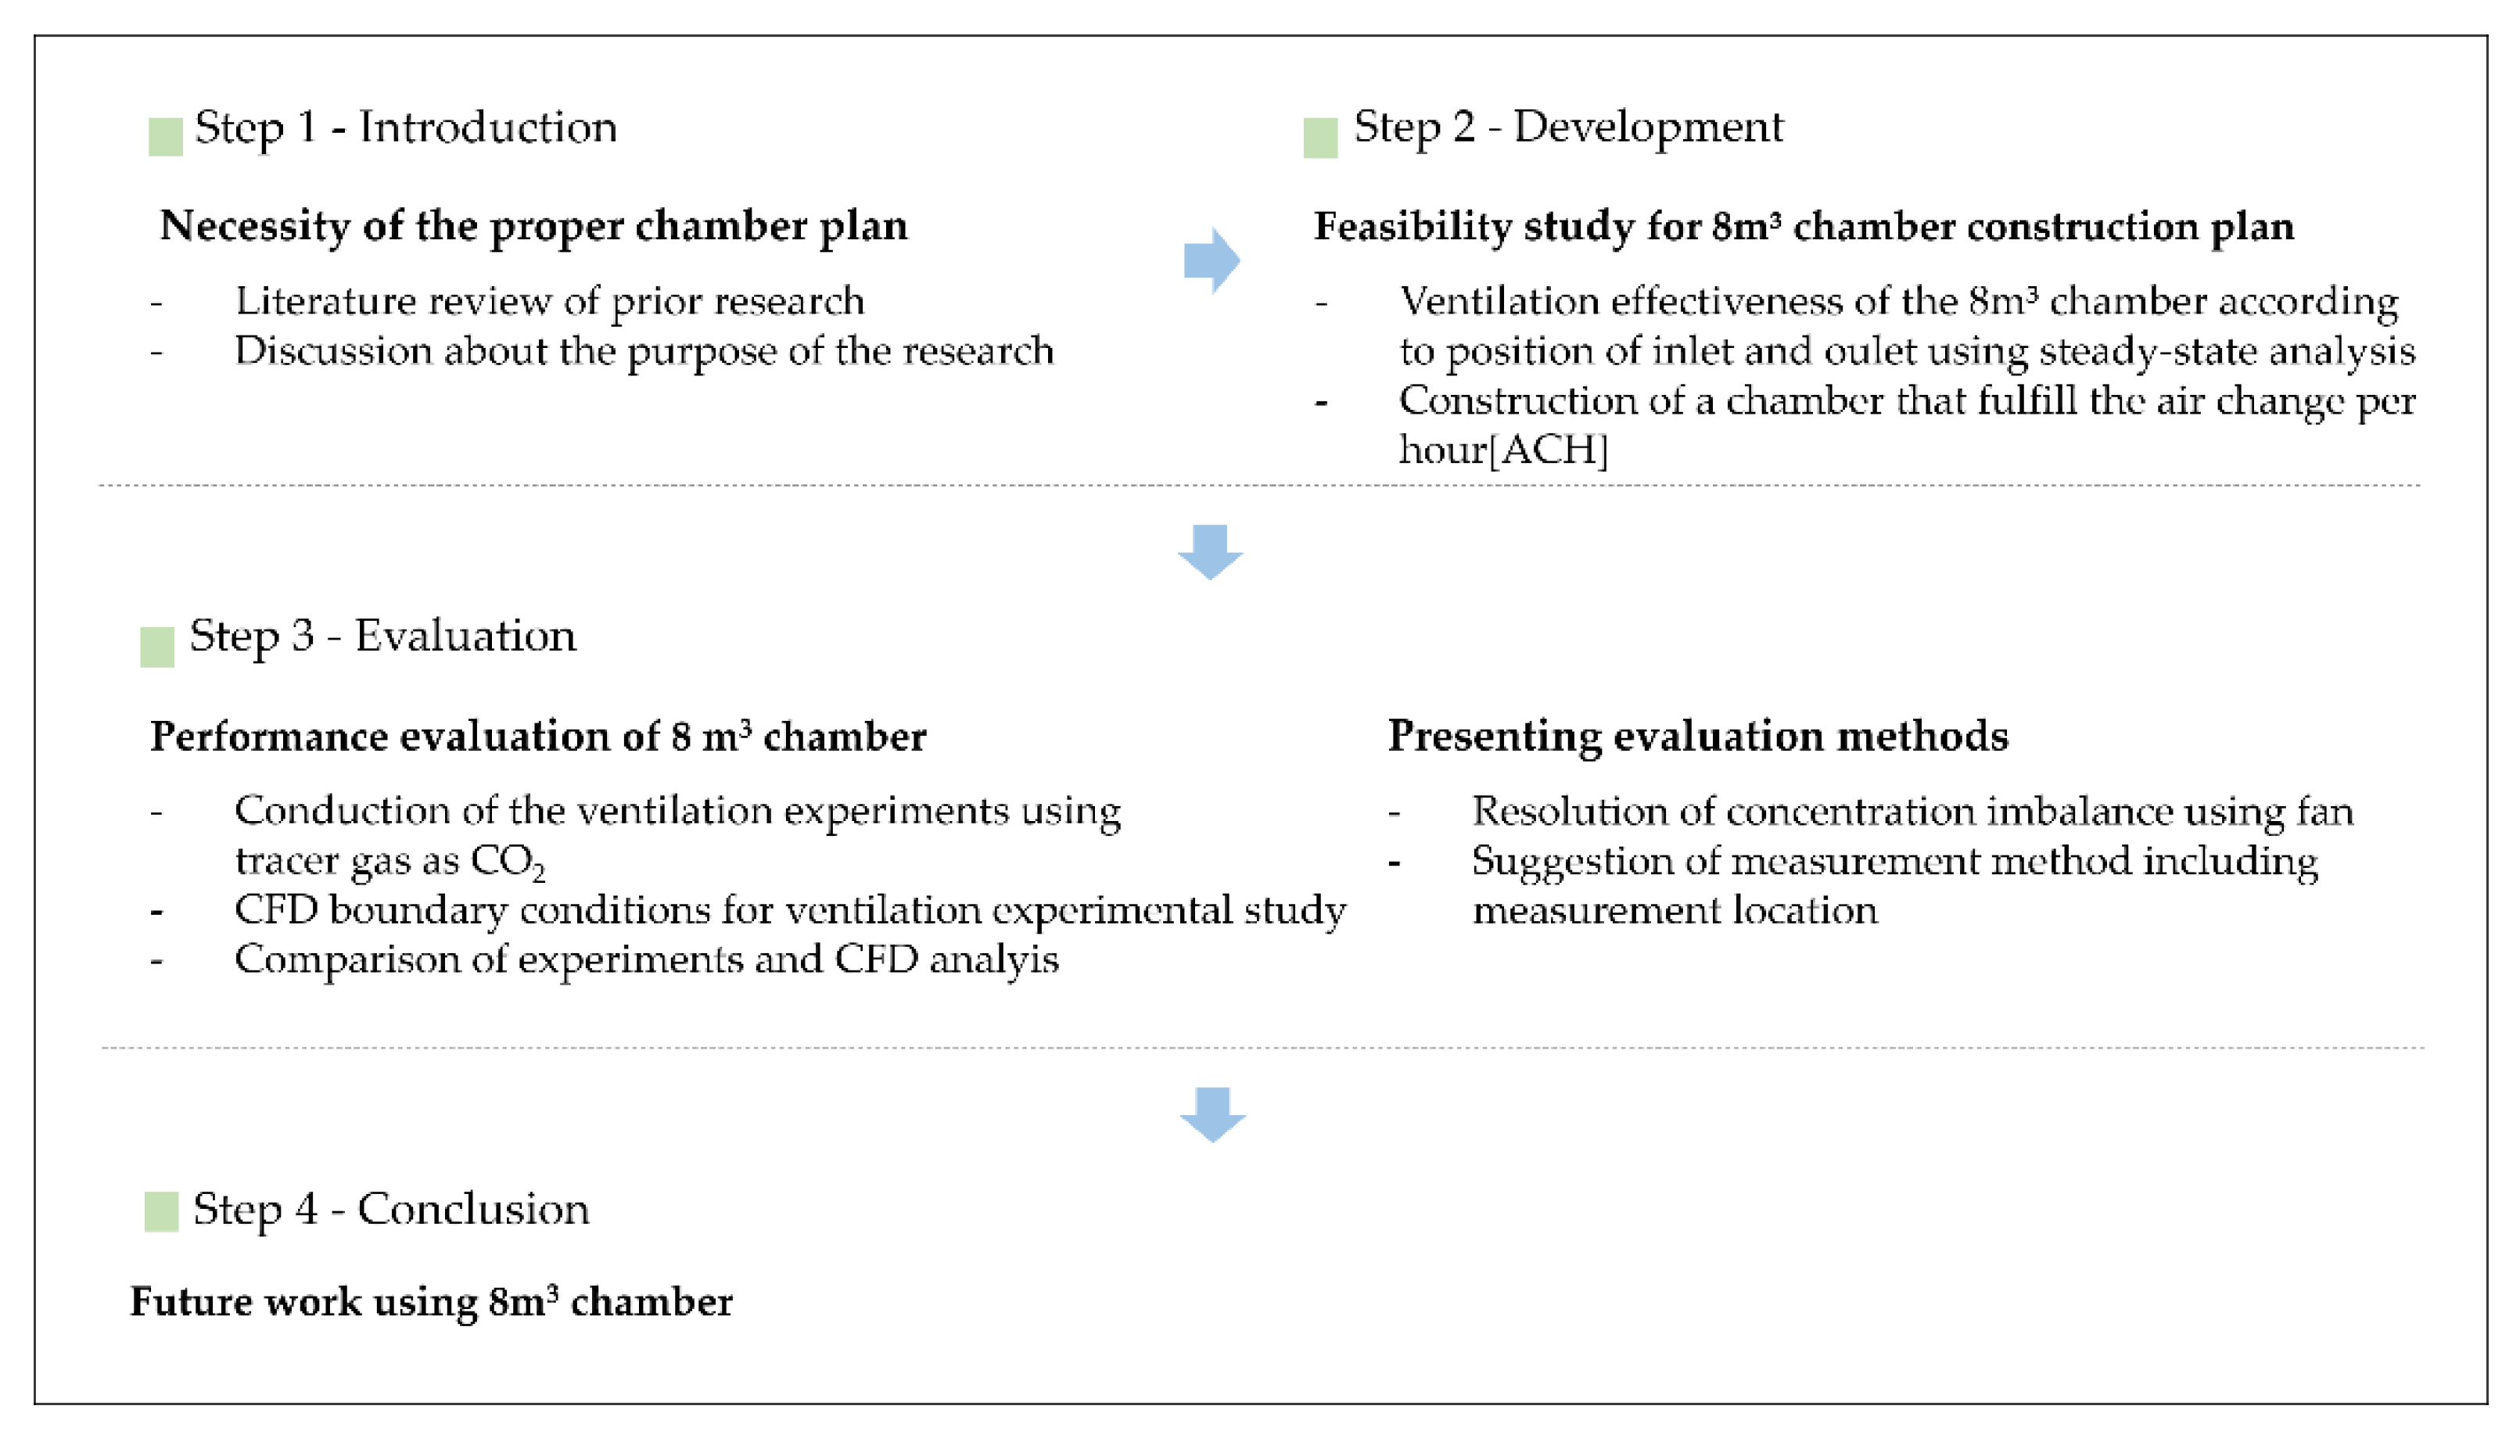
:1. Introduction
2. Feasibility Study for Chamber Construction Plan
2.1. Construction of Chamber According to Ventilation Effectiveness Using Steady-State Analysis
2.1.1. Definition of Ventilation Effectiveness
2.1.2. Ventilation Effectiveness According to the Age of Air
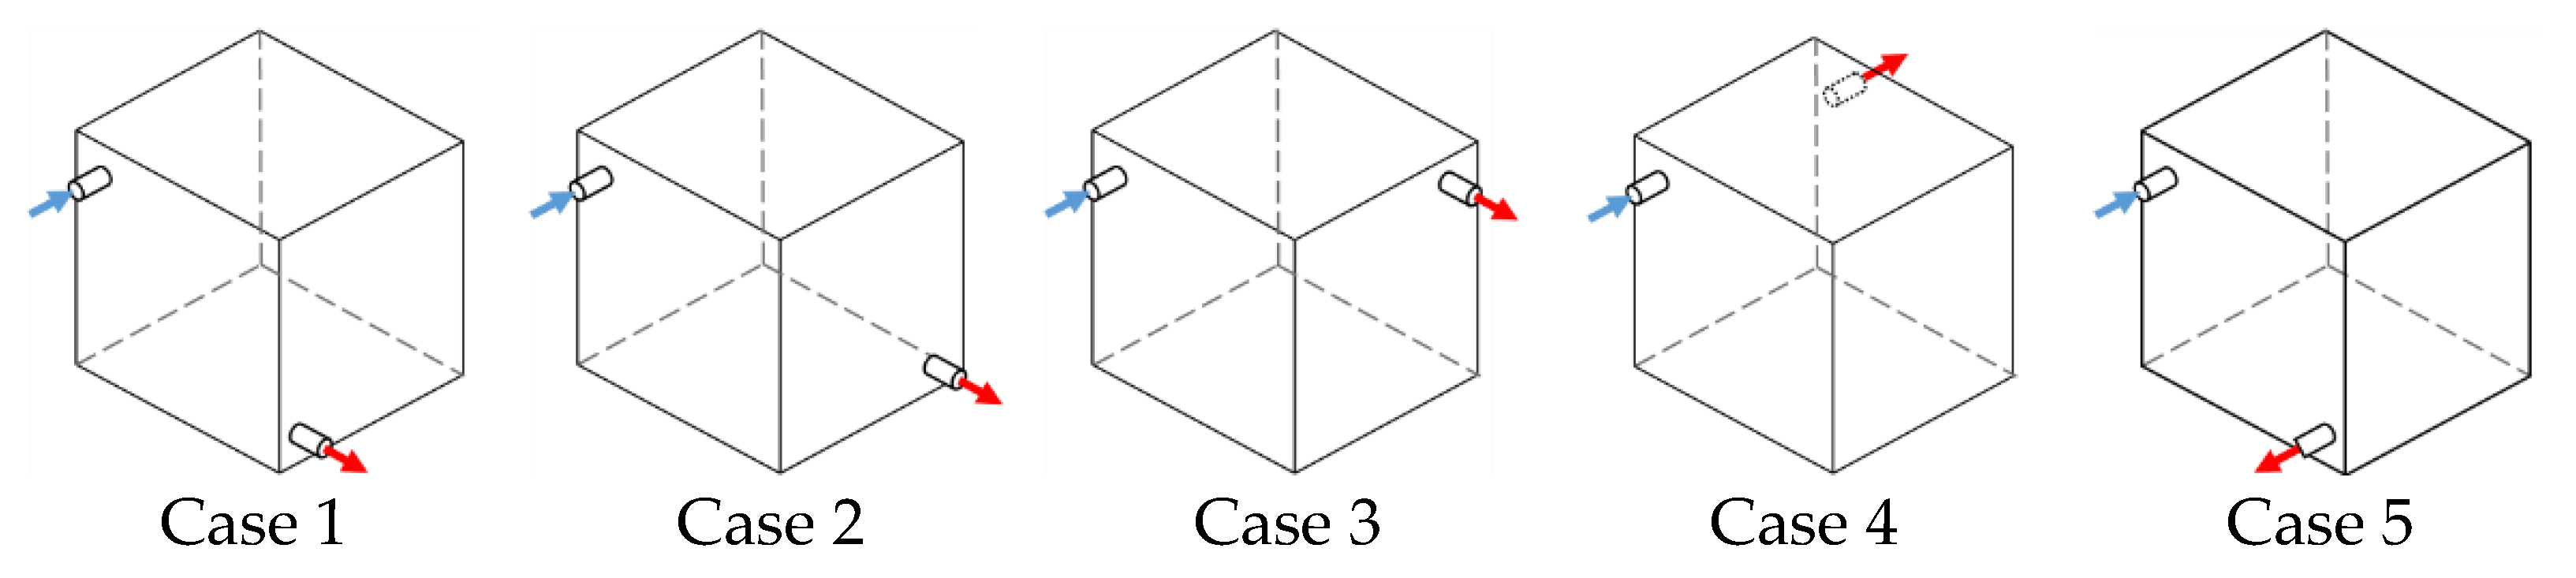
2.1.3. Ventilation Effectiveness of the 8-m3 Chamber According to Position of Inlet and Outlet Using Steady-State Analysis
3. Comparison of Experiments and Numerical Analysis for 8-m3 Chamber Evaluation
3.1. CFD Boundary Conditions for Ventilation Experimental Study
3.1.1. Species Transport Equation for Performance Evaluation of Chamber
3.1.2. Velocity Profile of Inlet
3.1.3. Boundary Condition Using a Fan
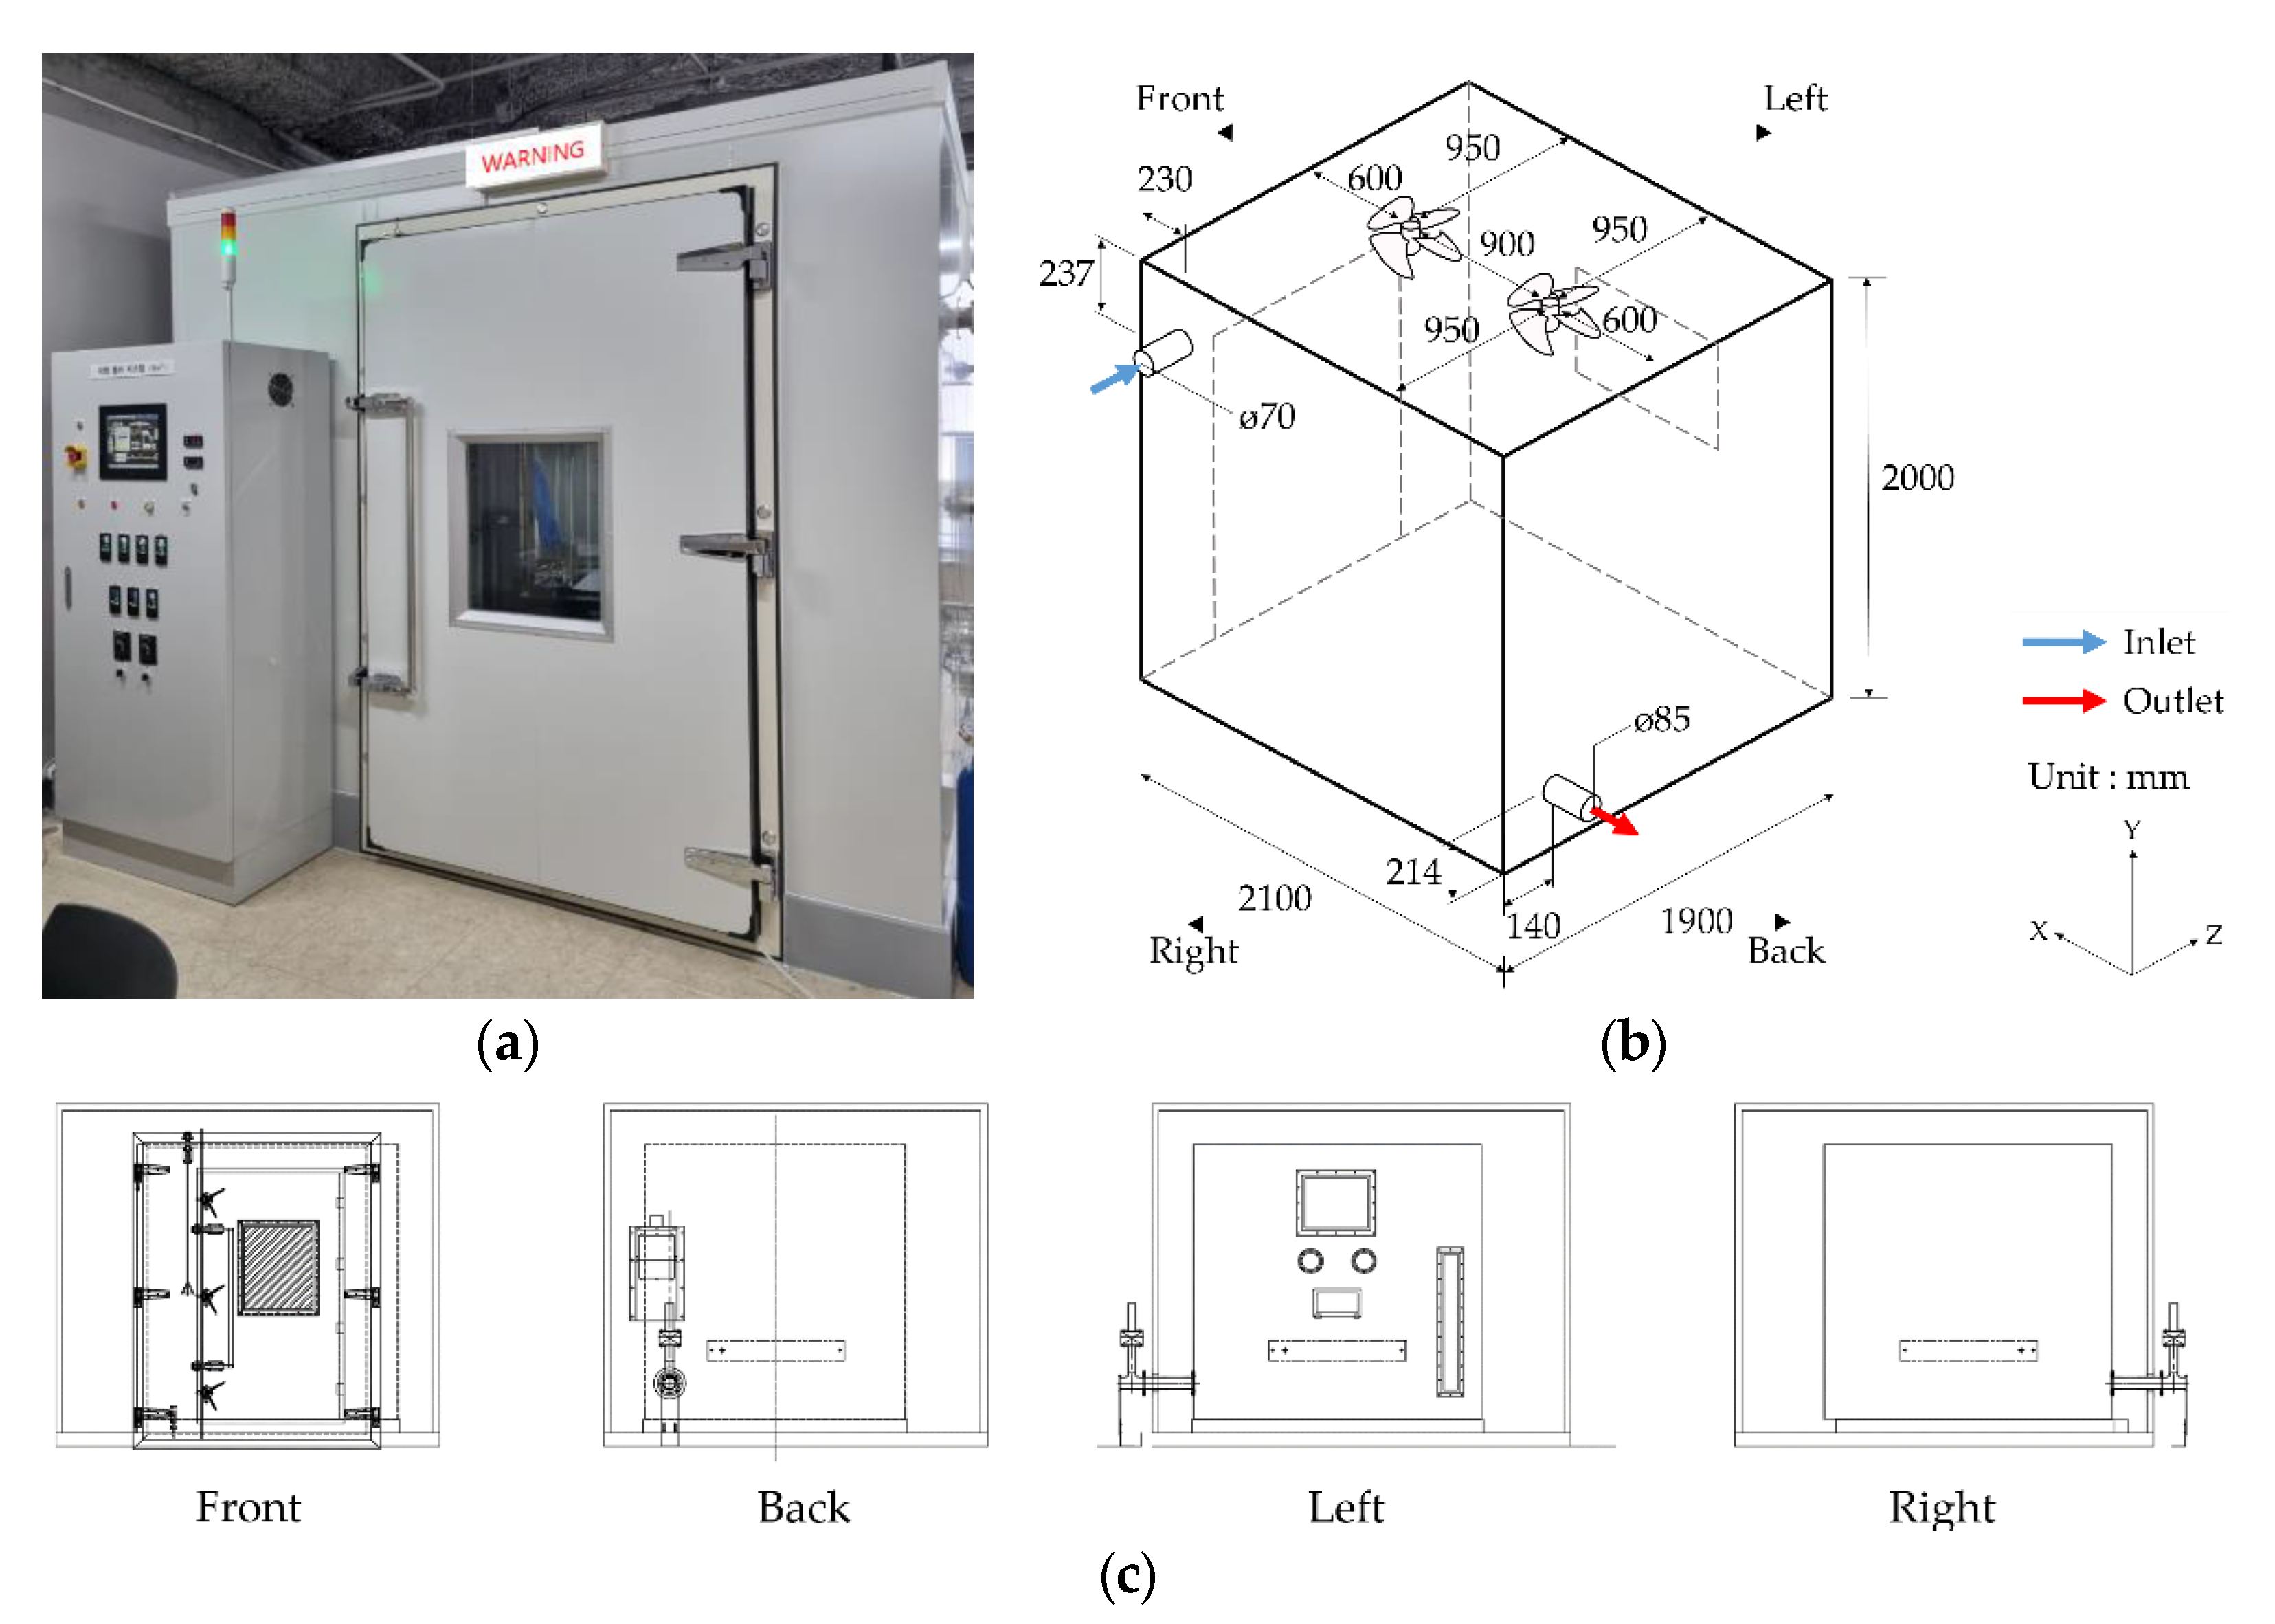
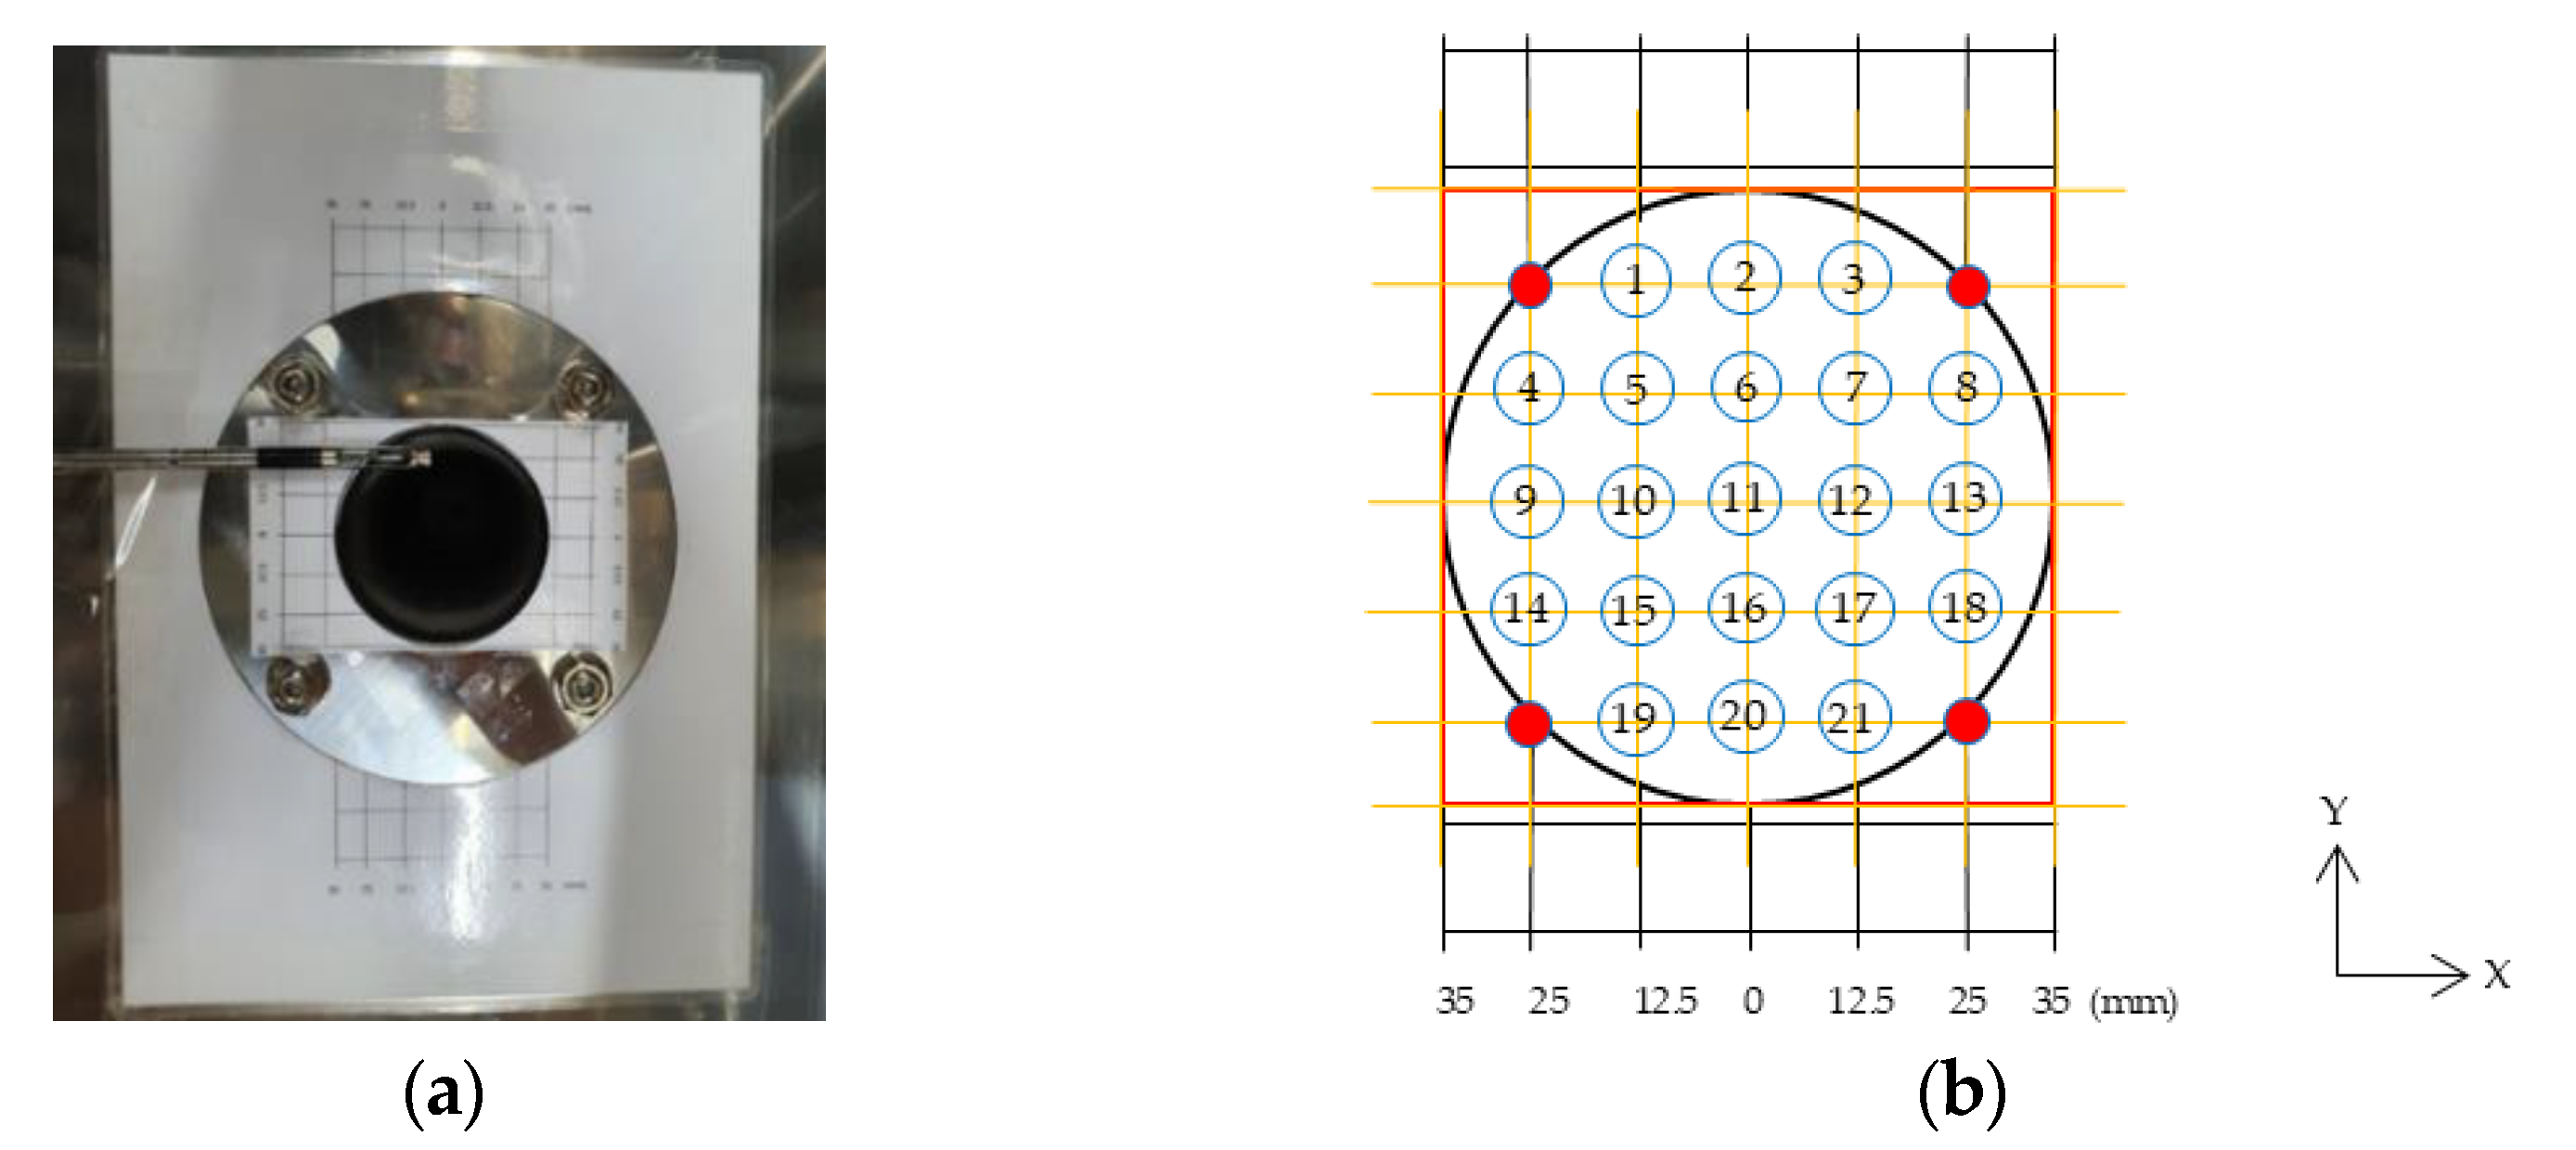
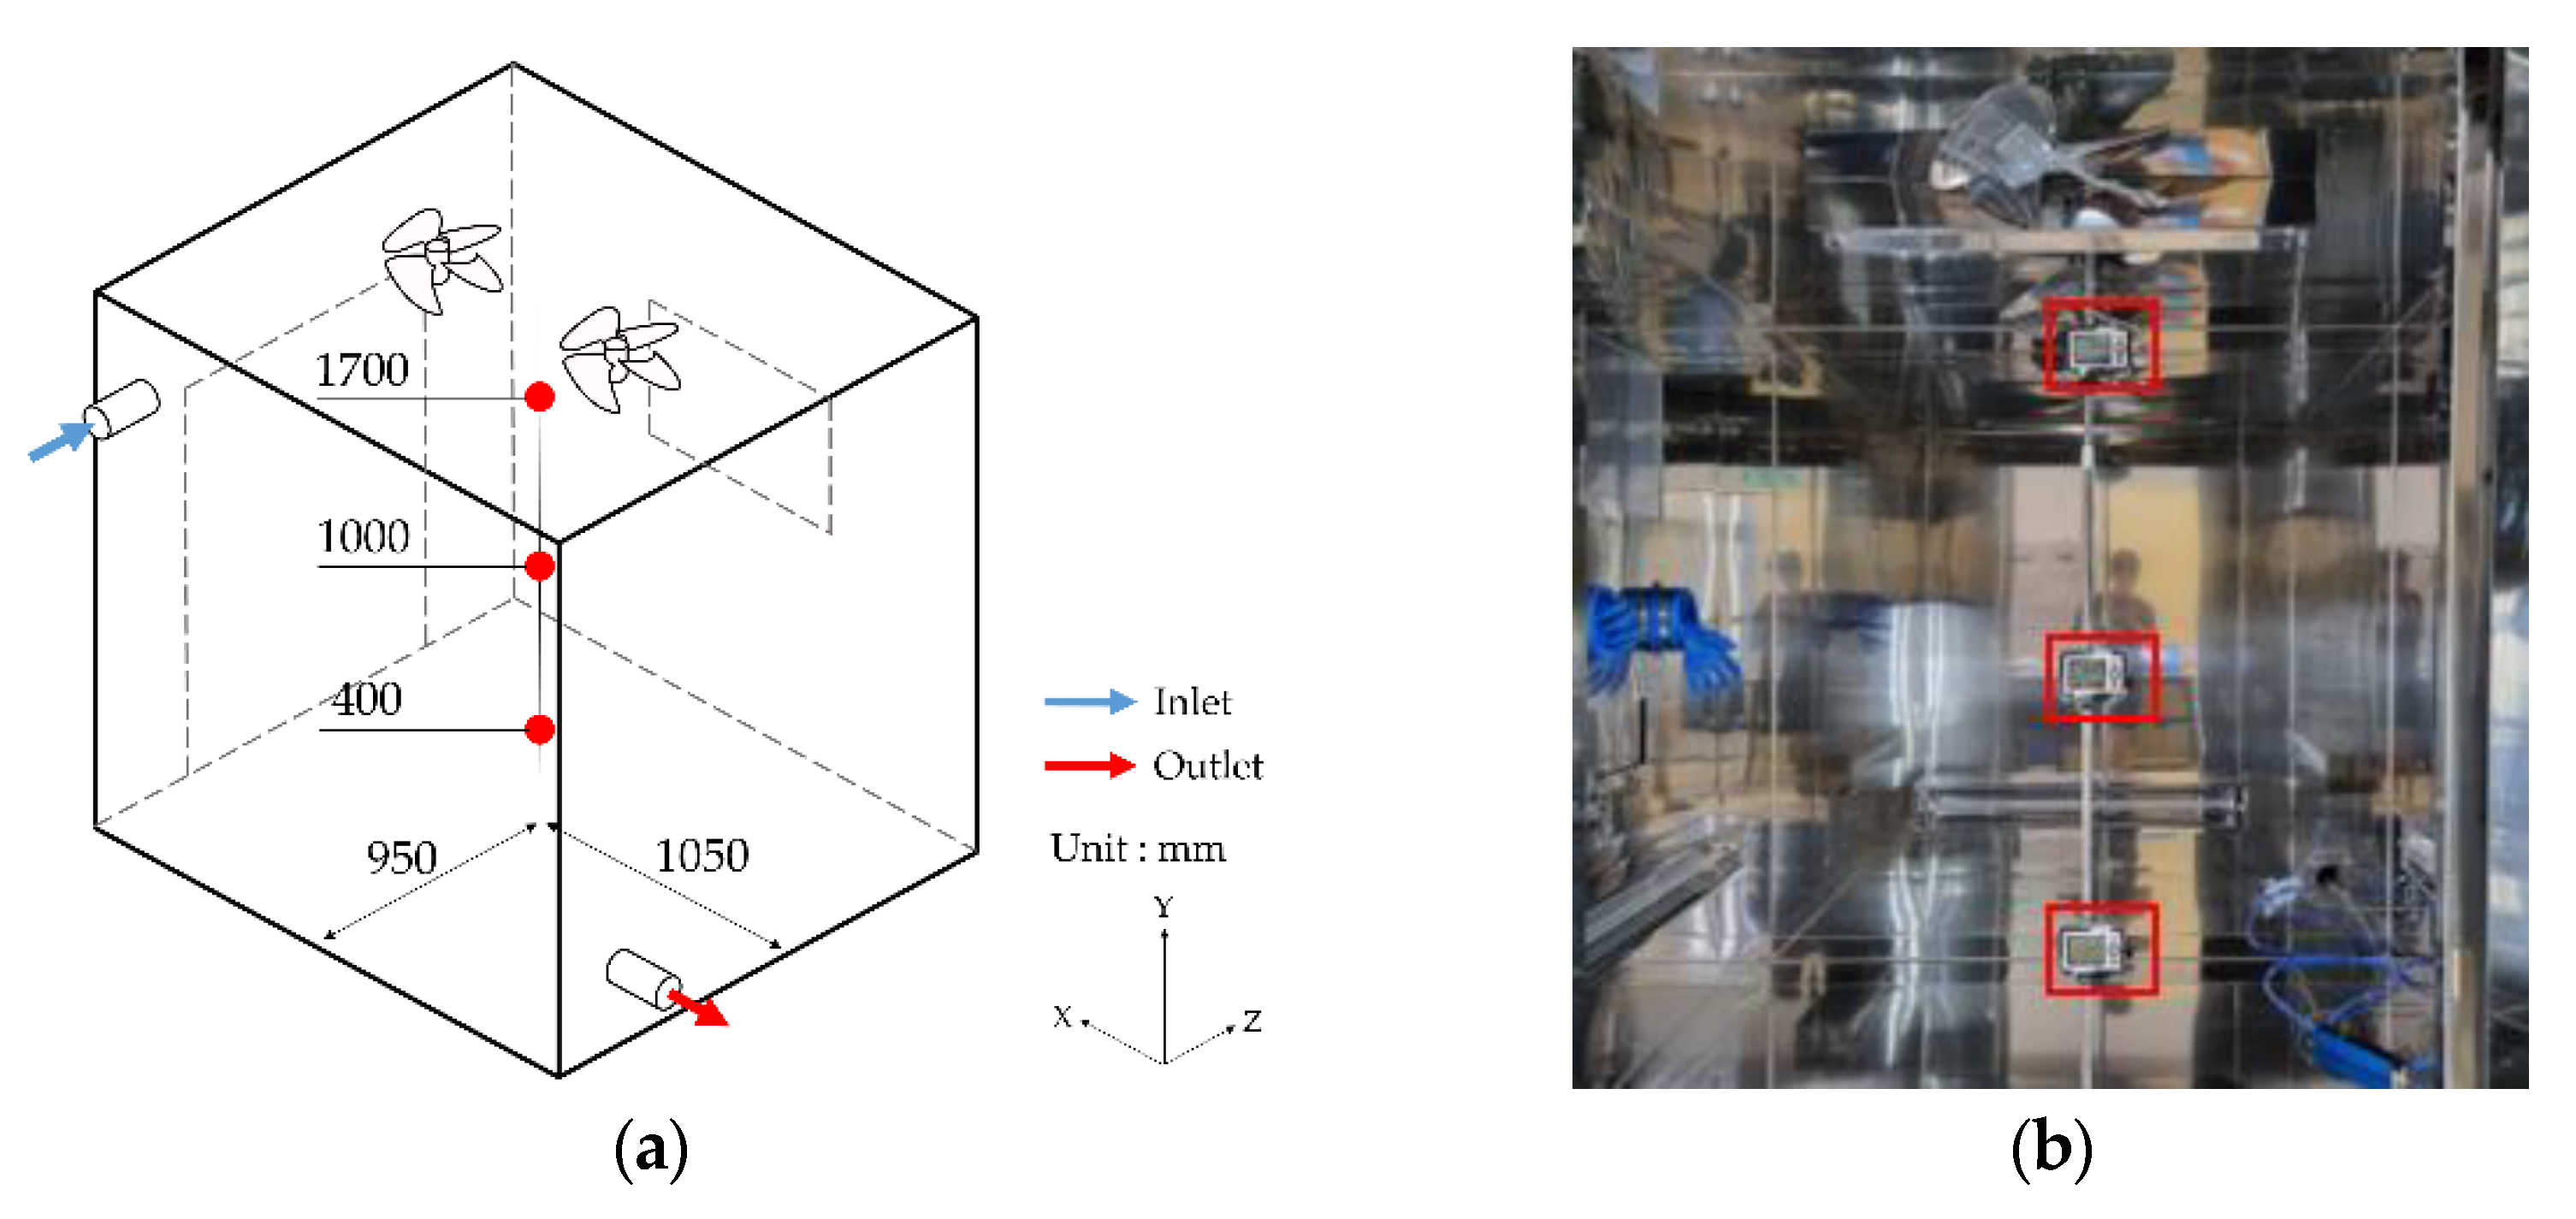
3.2. Experimental Study in the 8-m³ Chamber
4. Results and Discussions
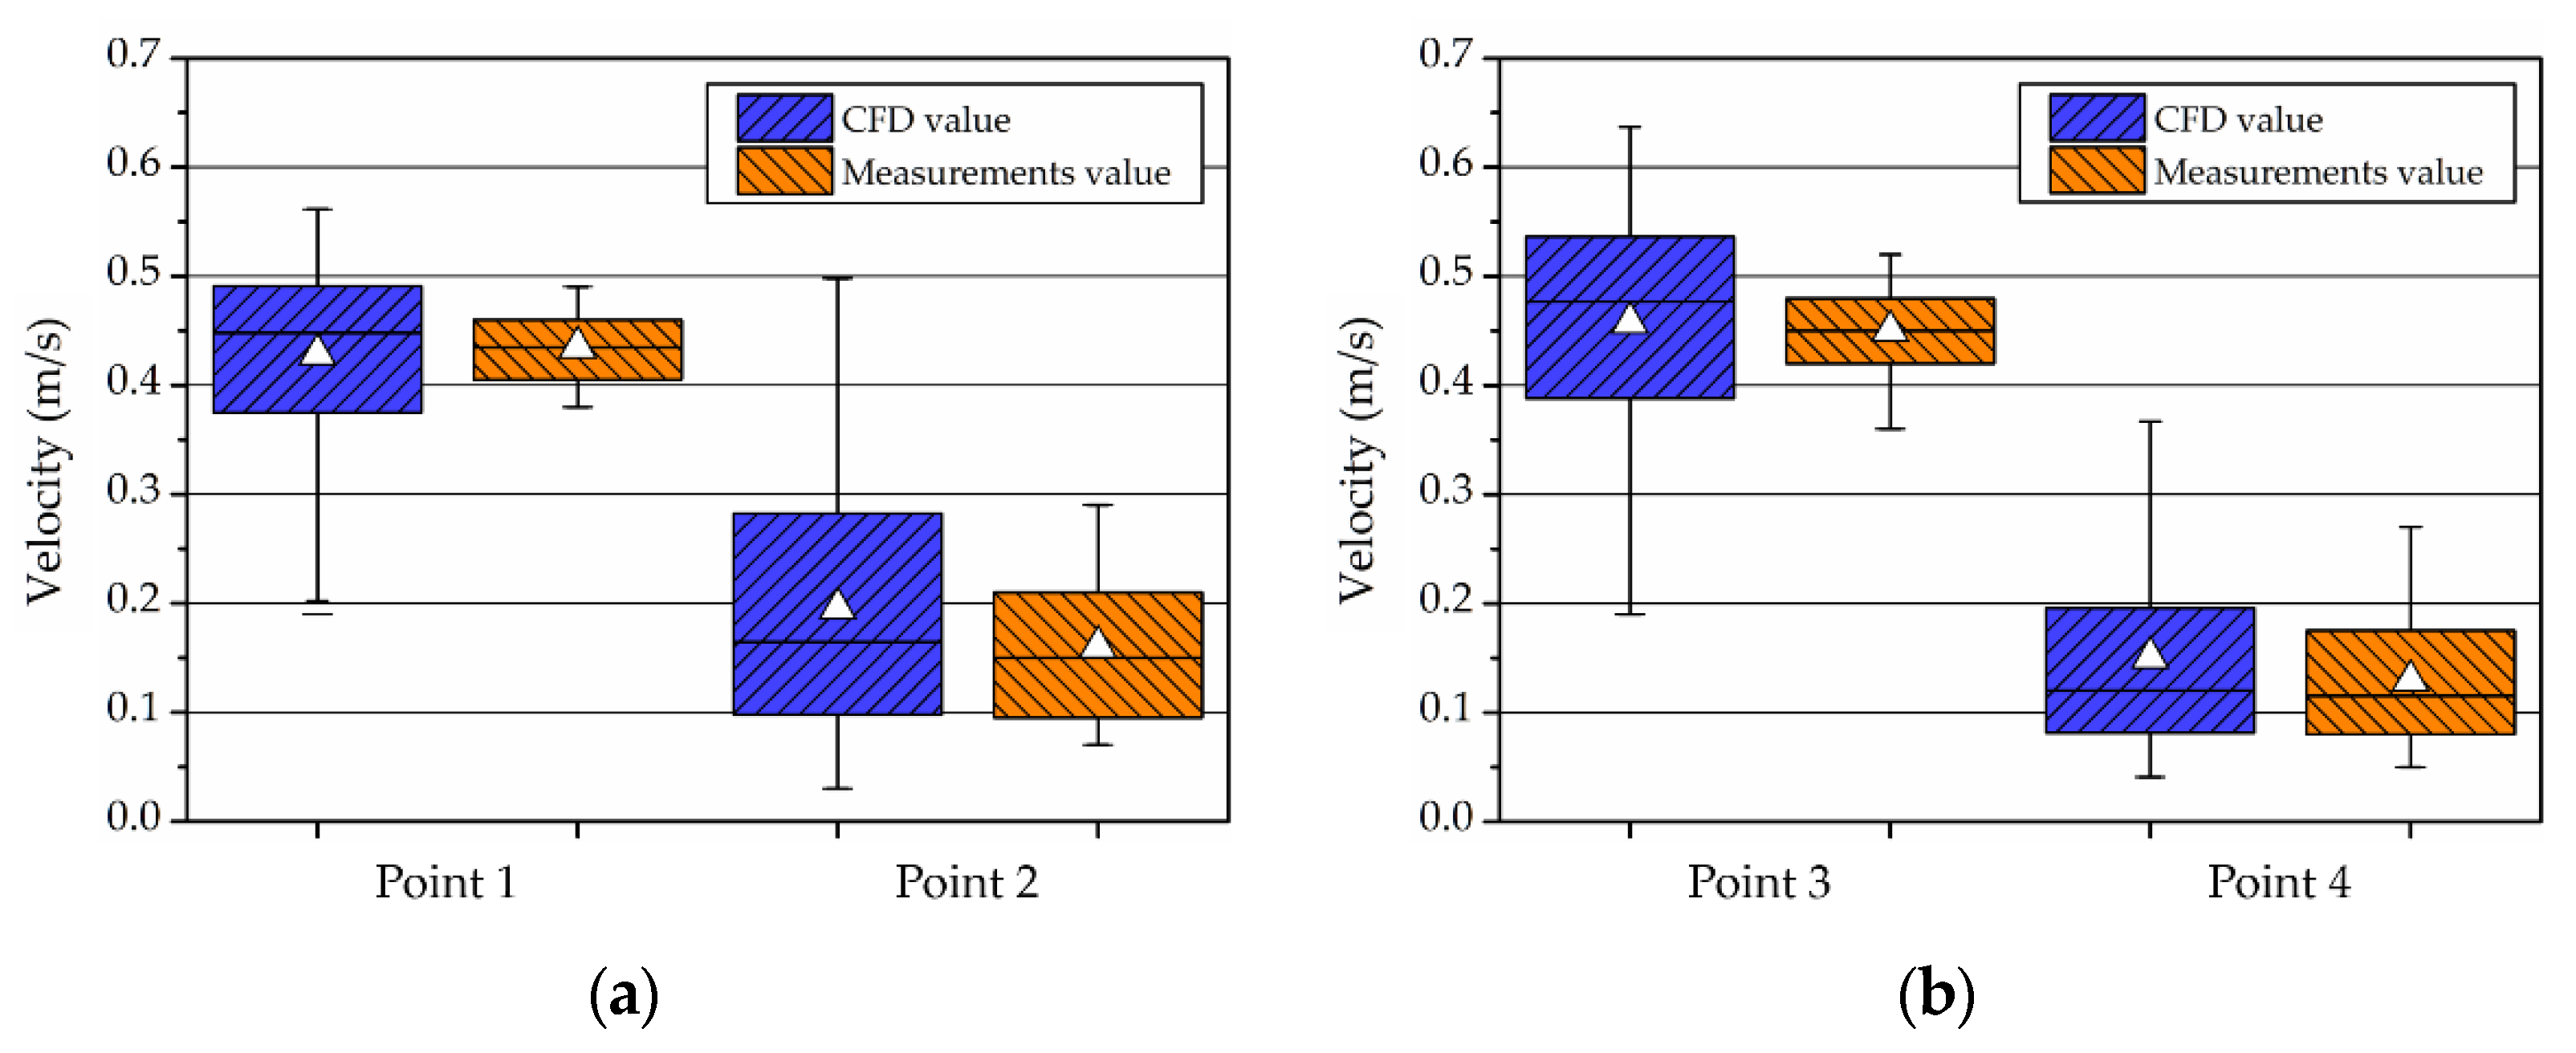
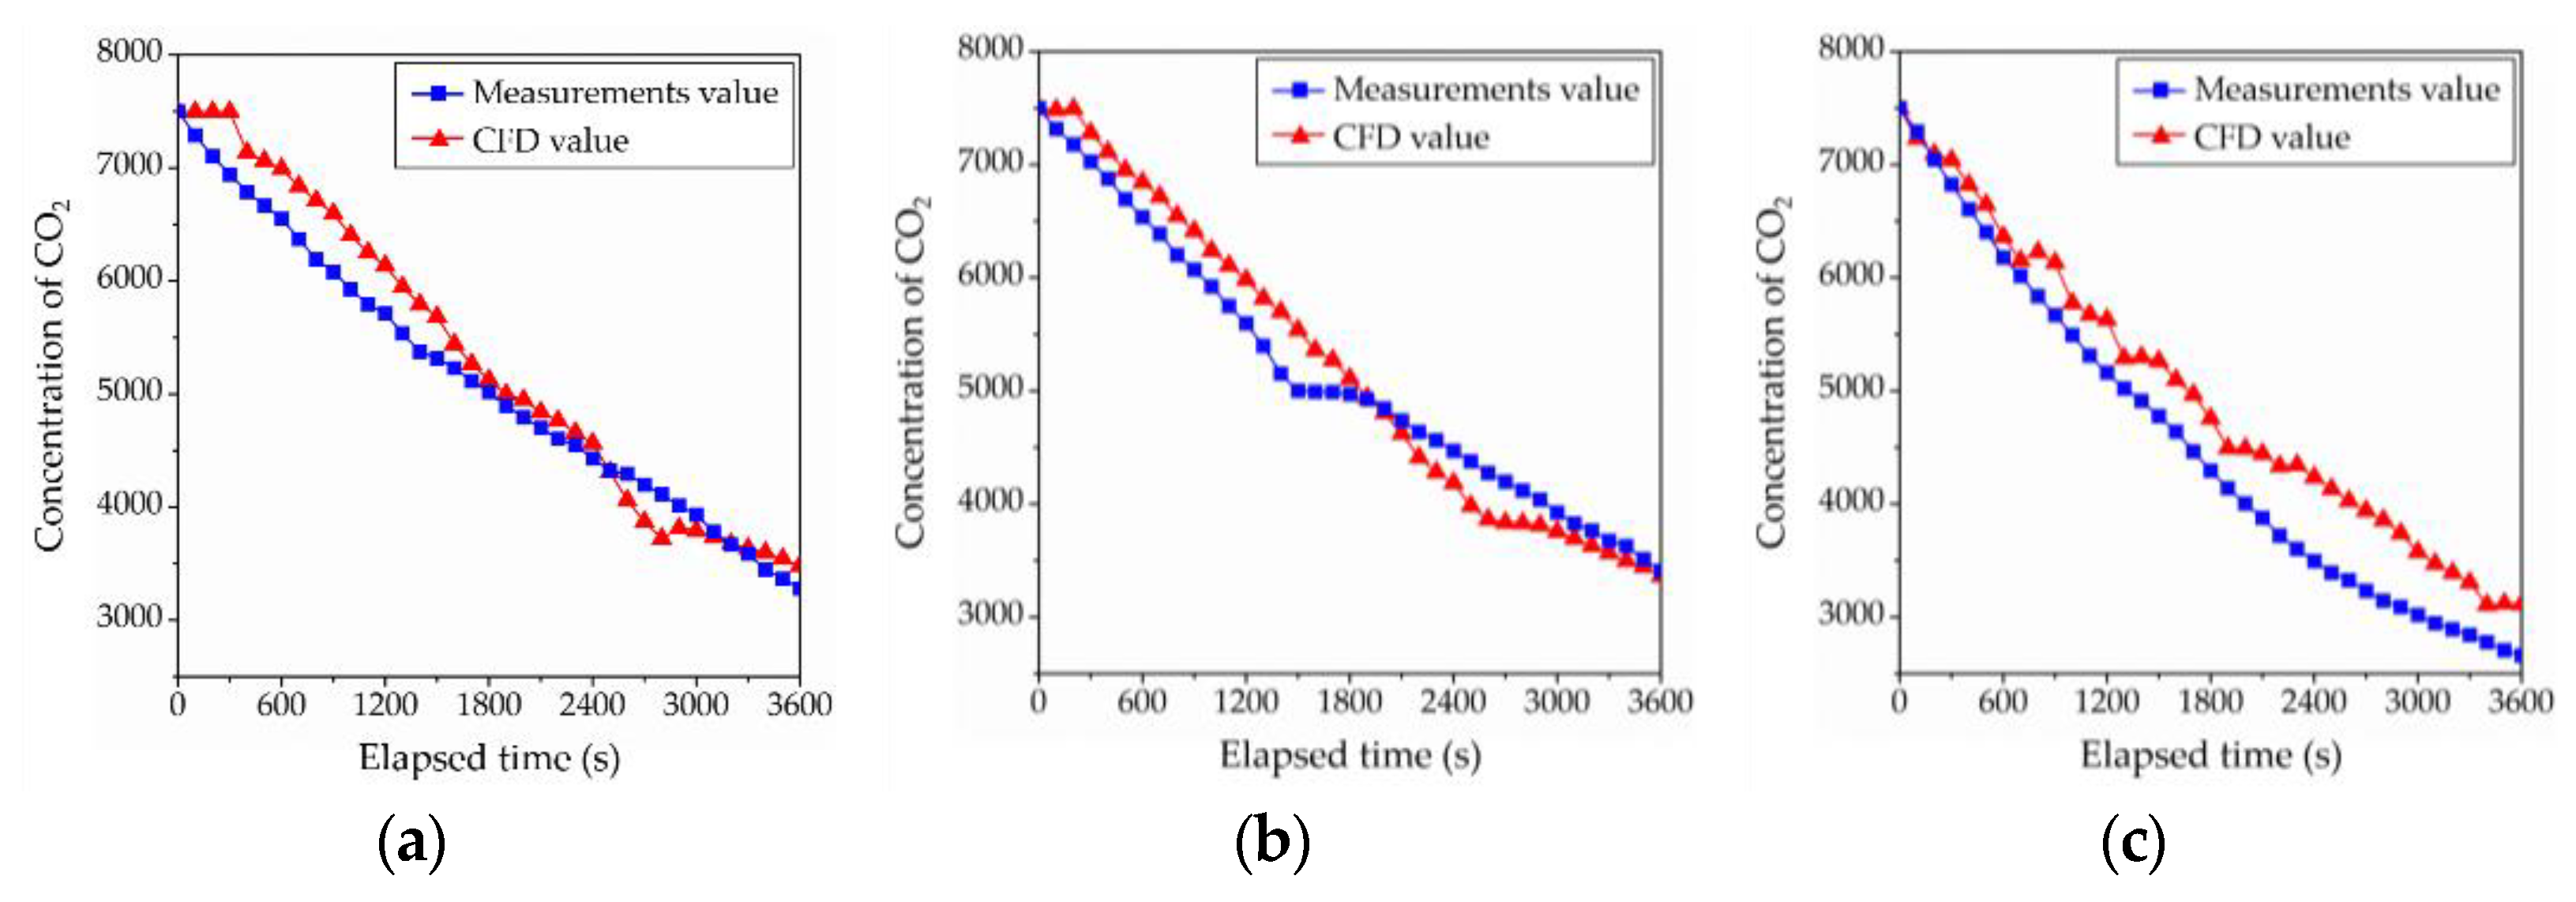
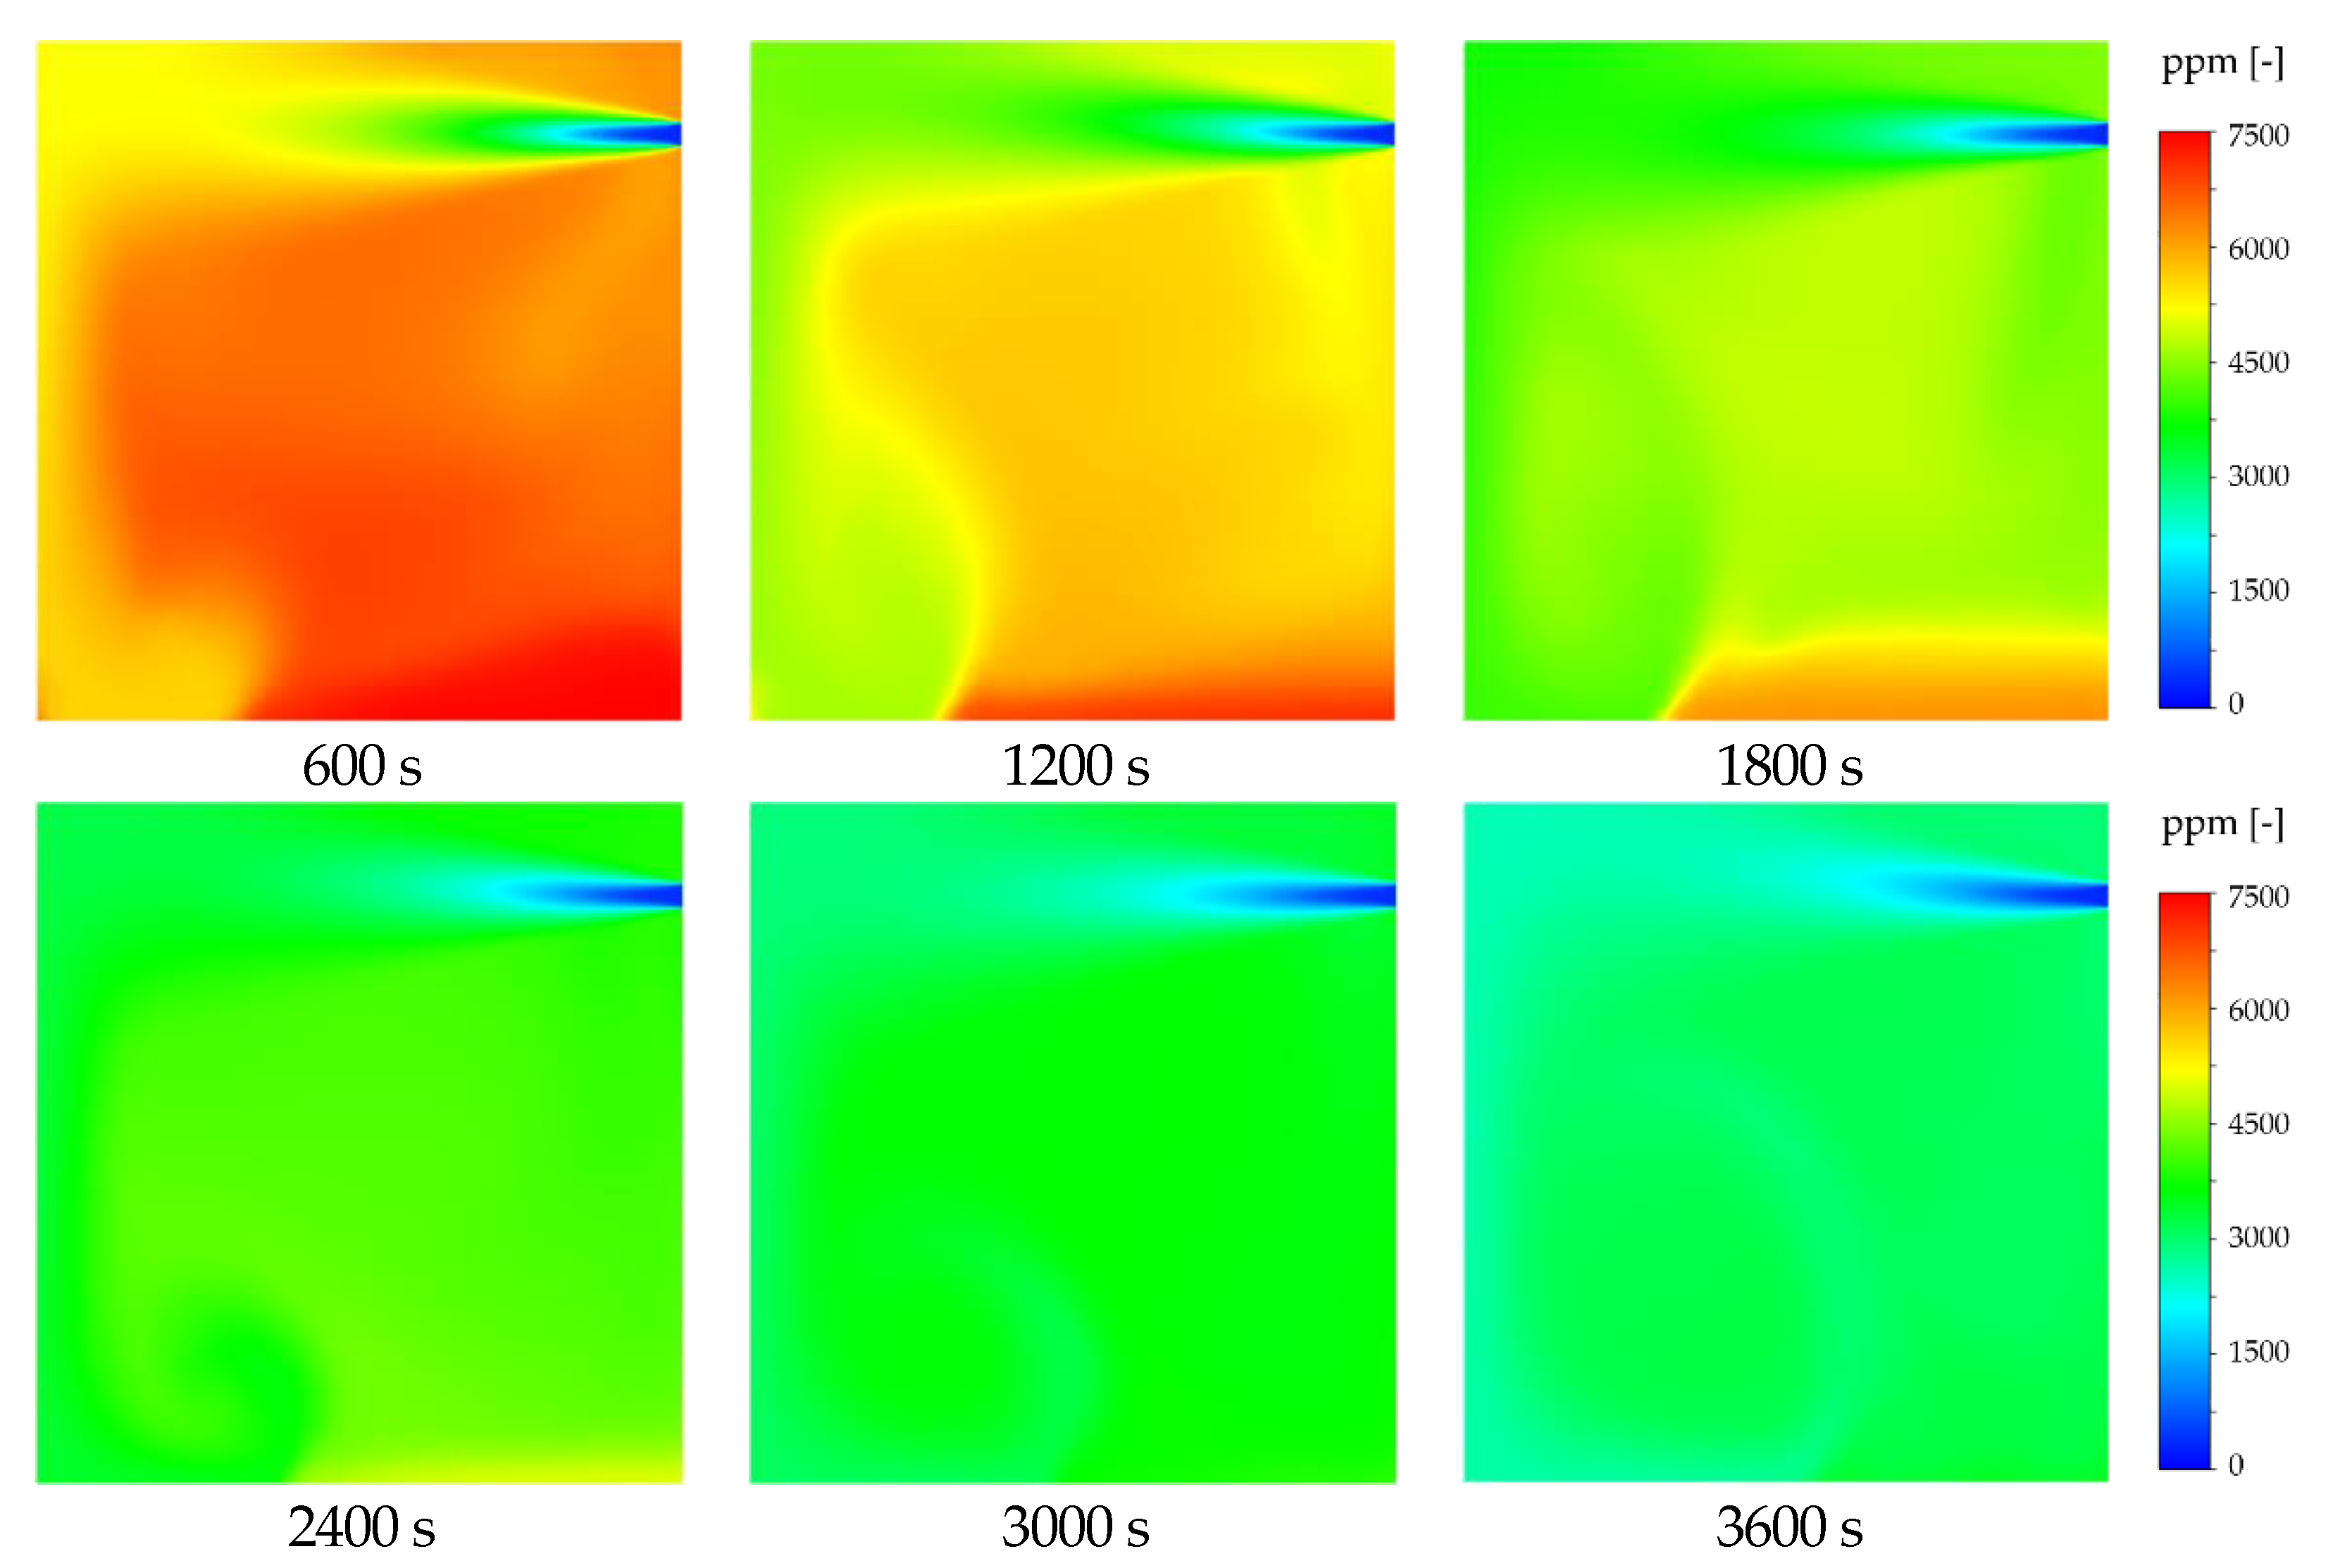
4.1. Comparison Measurements and CFD
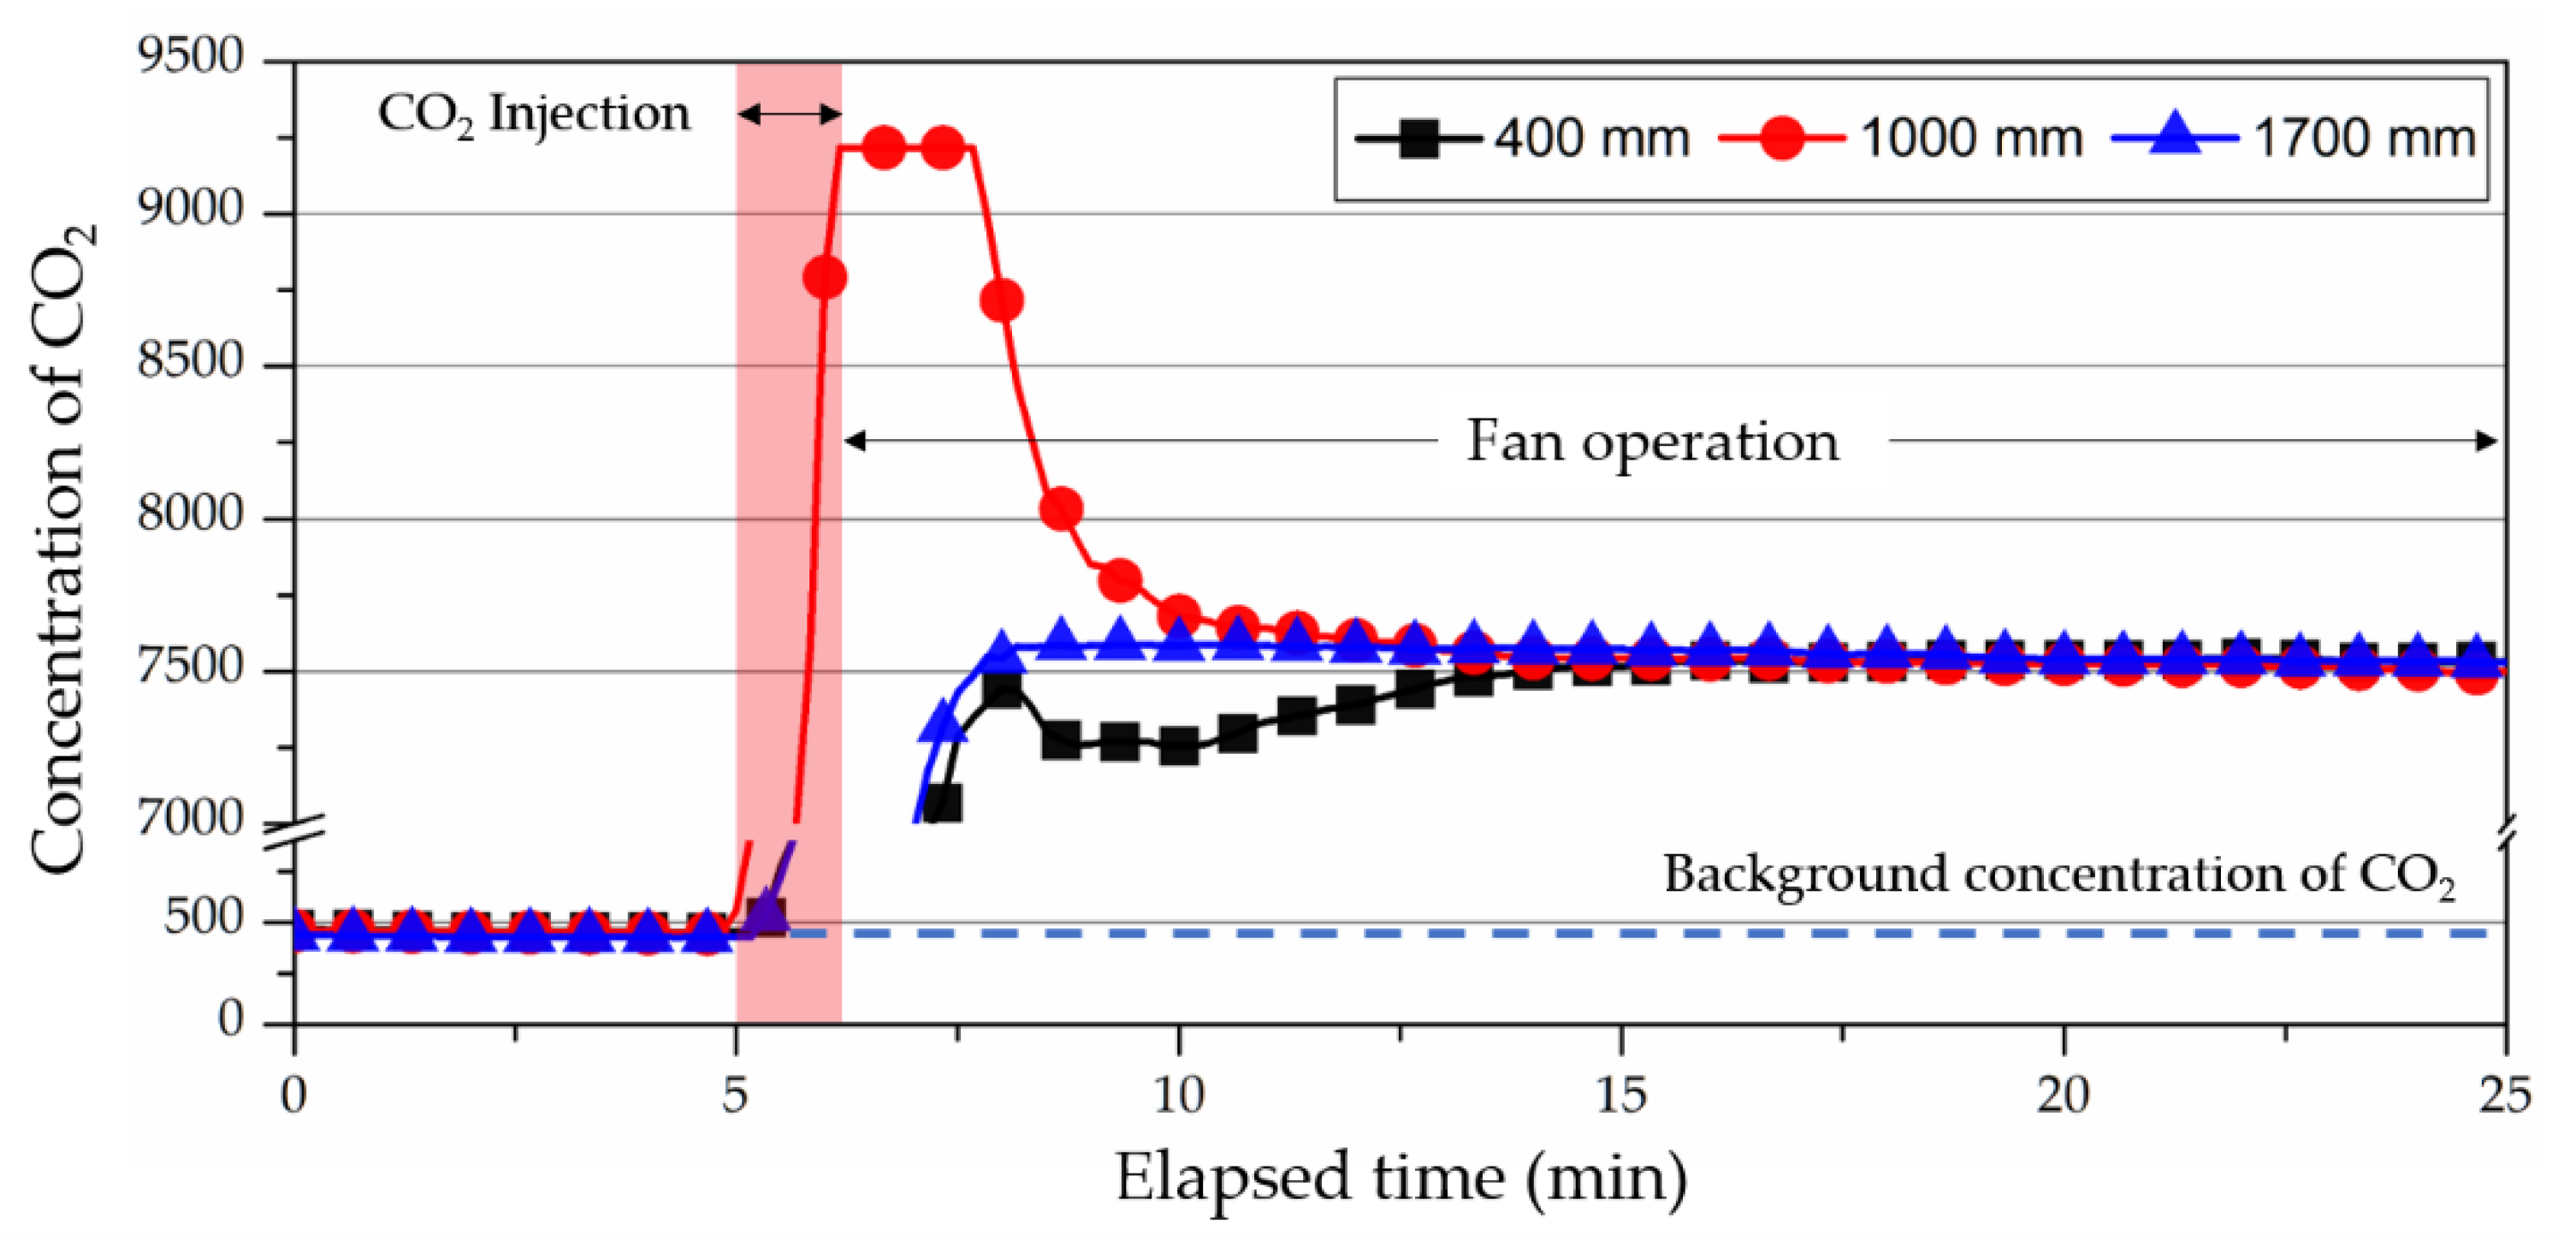
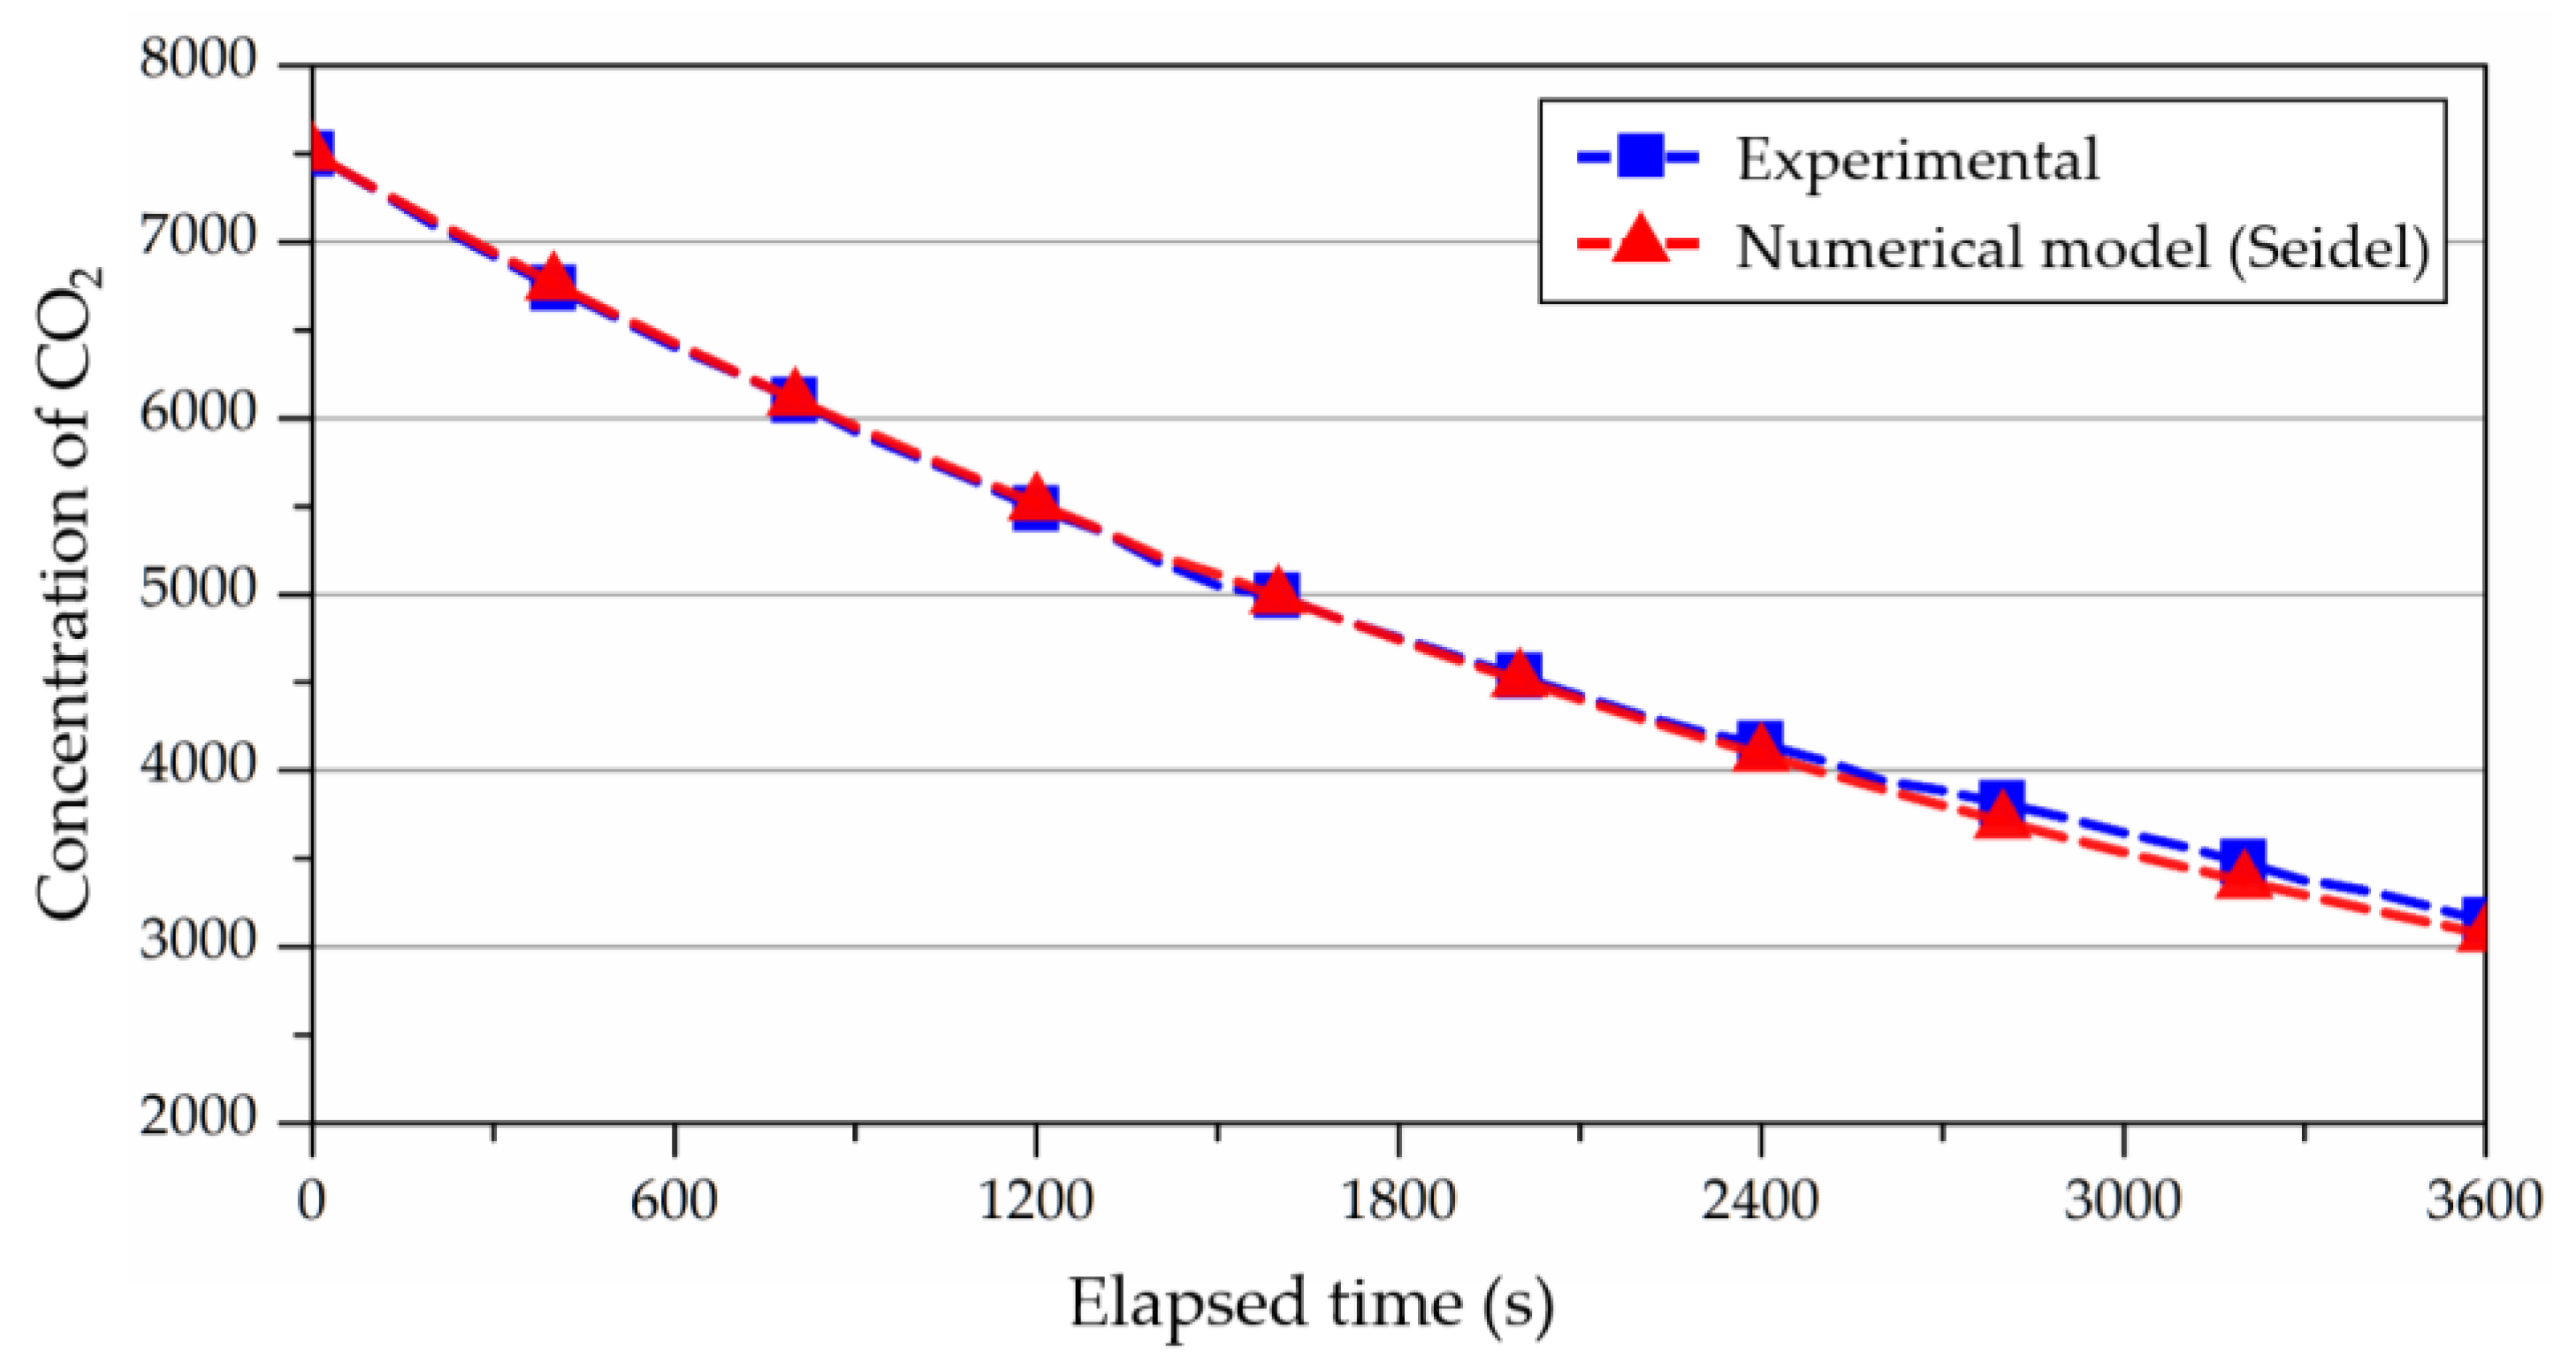
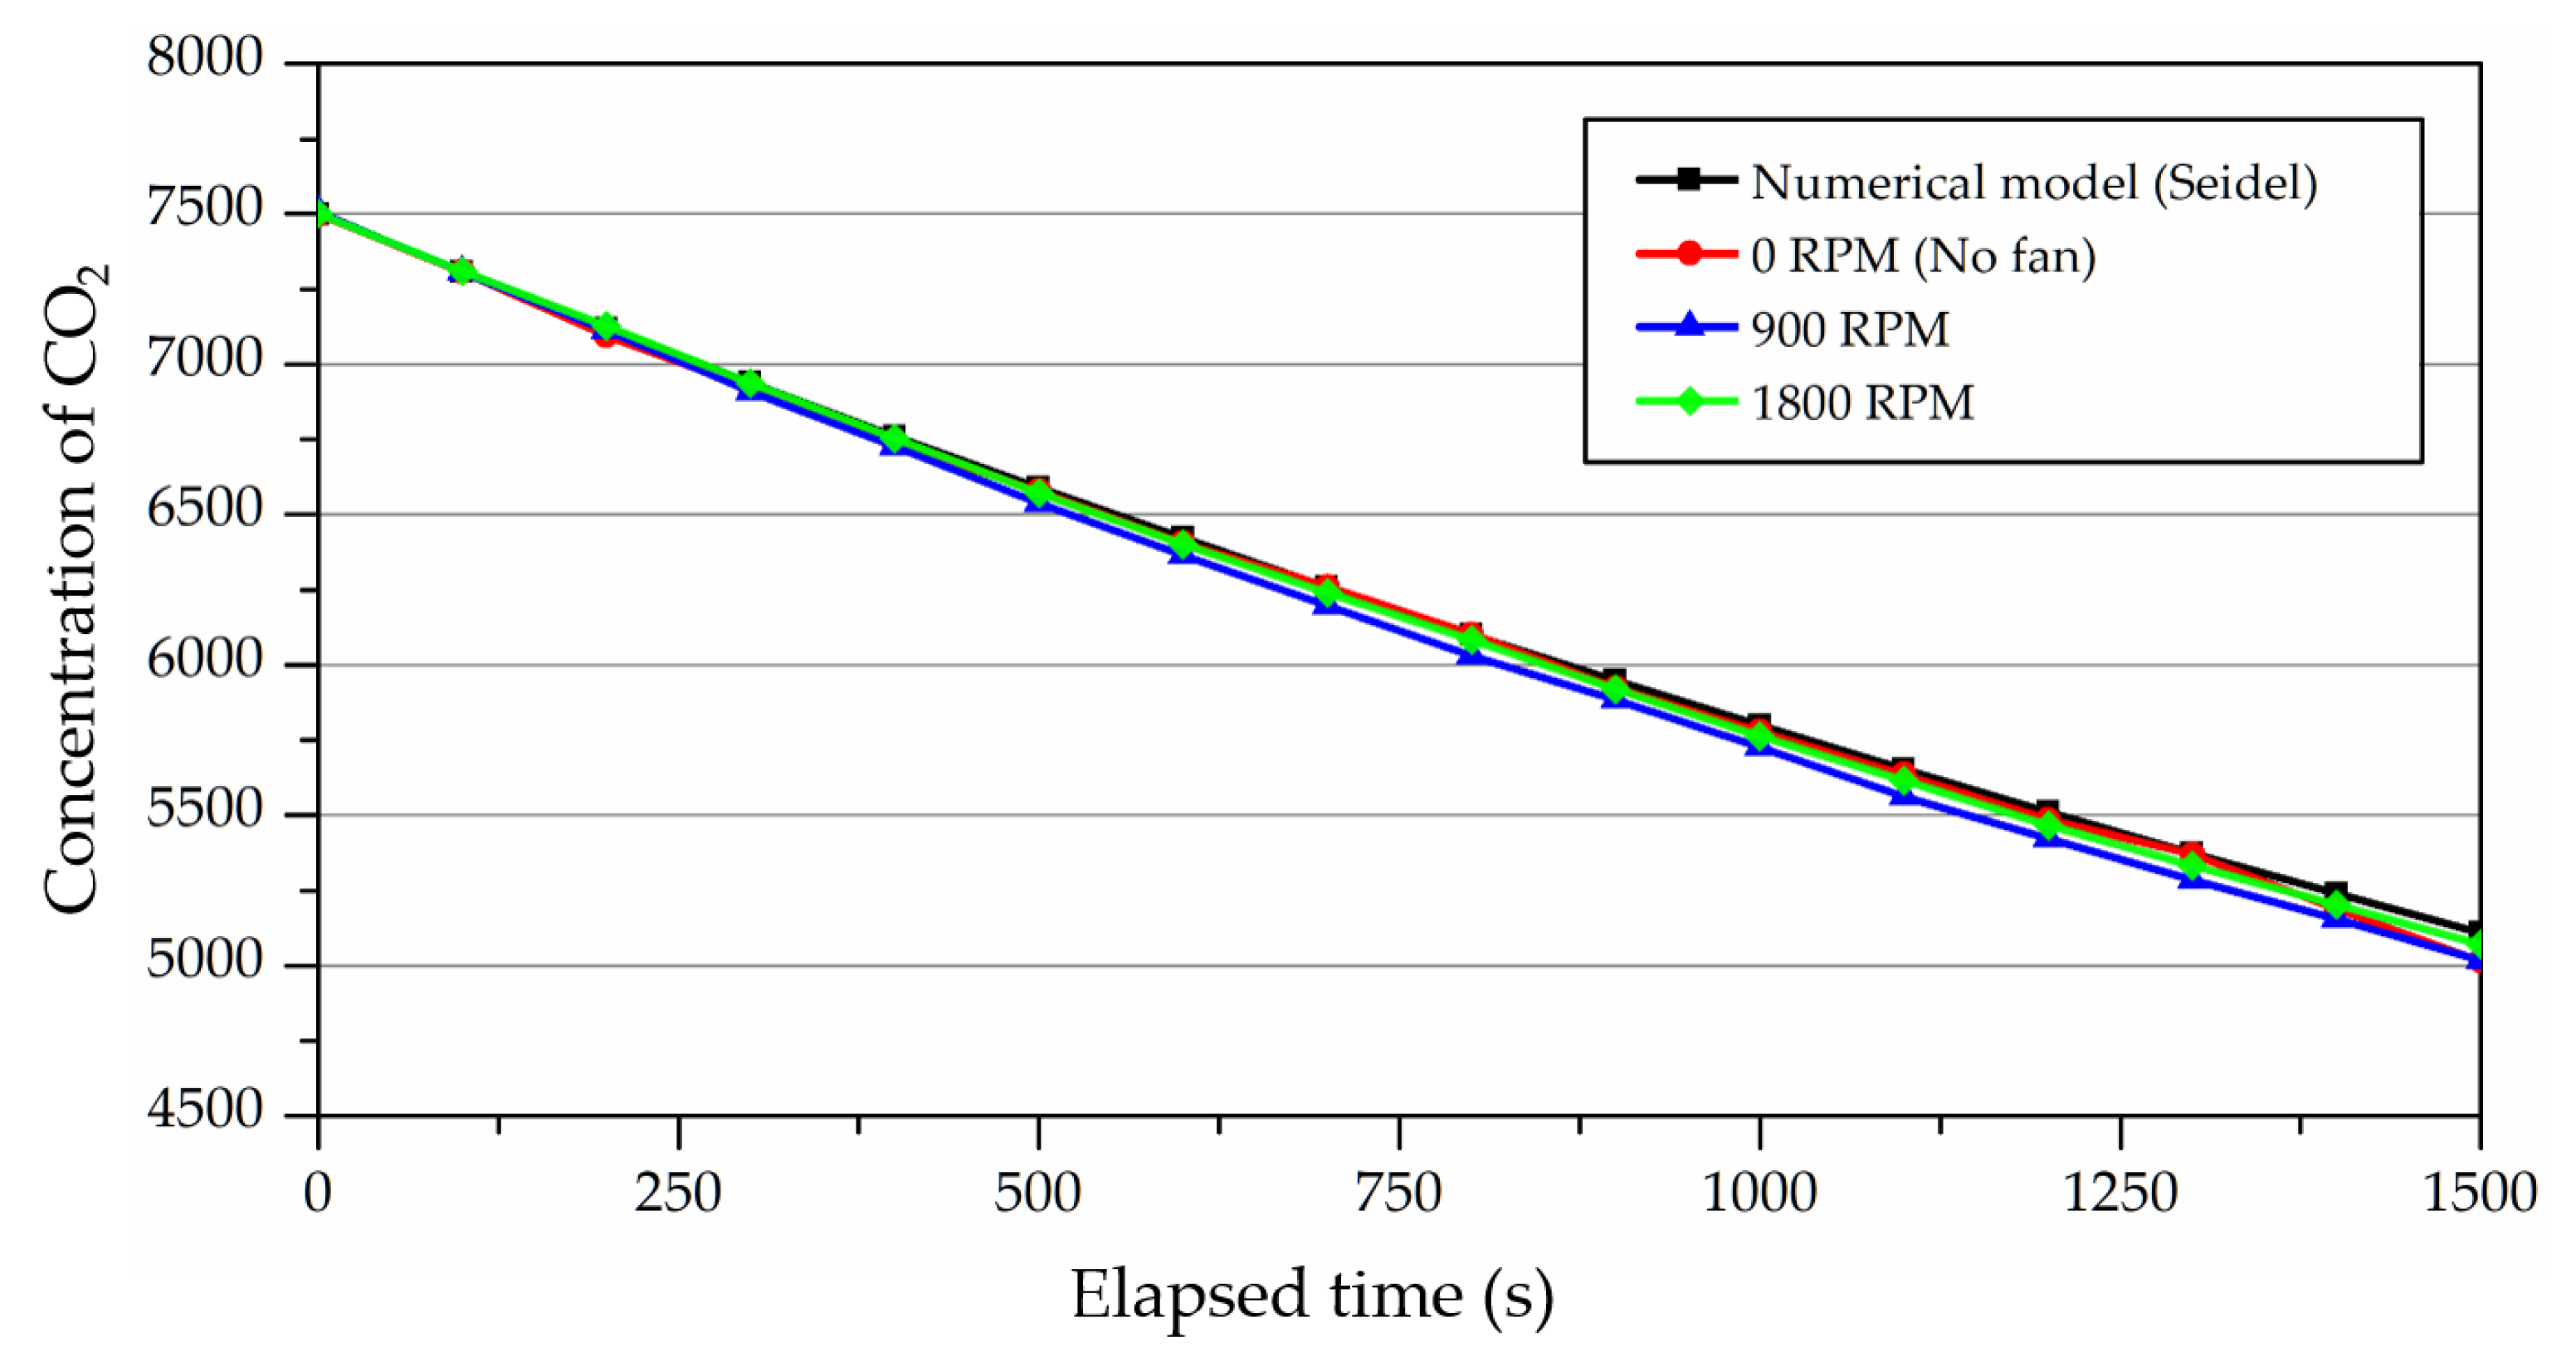
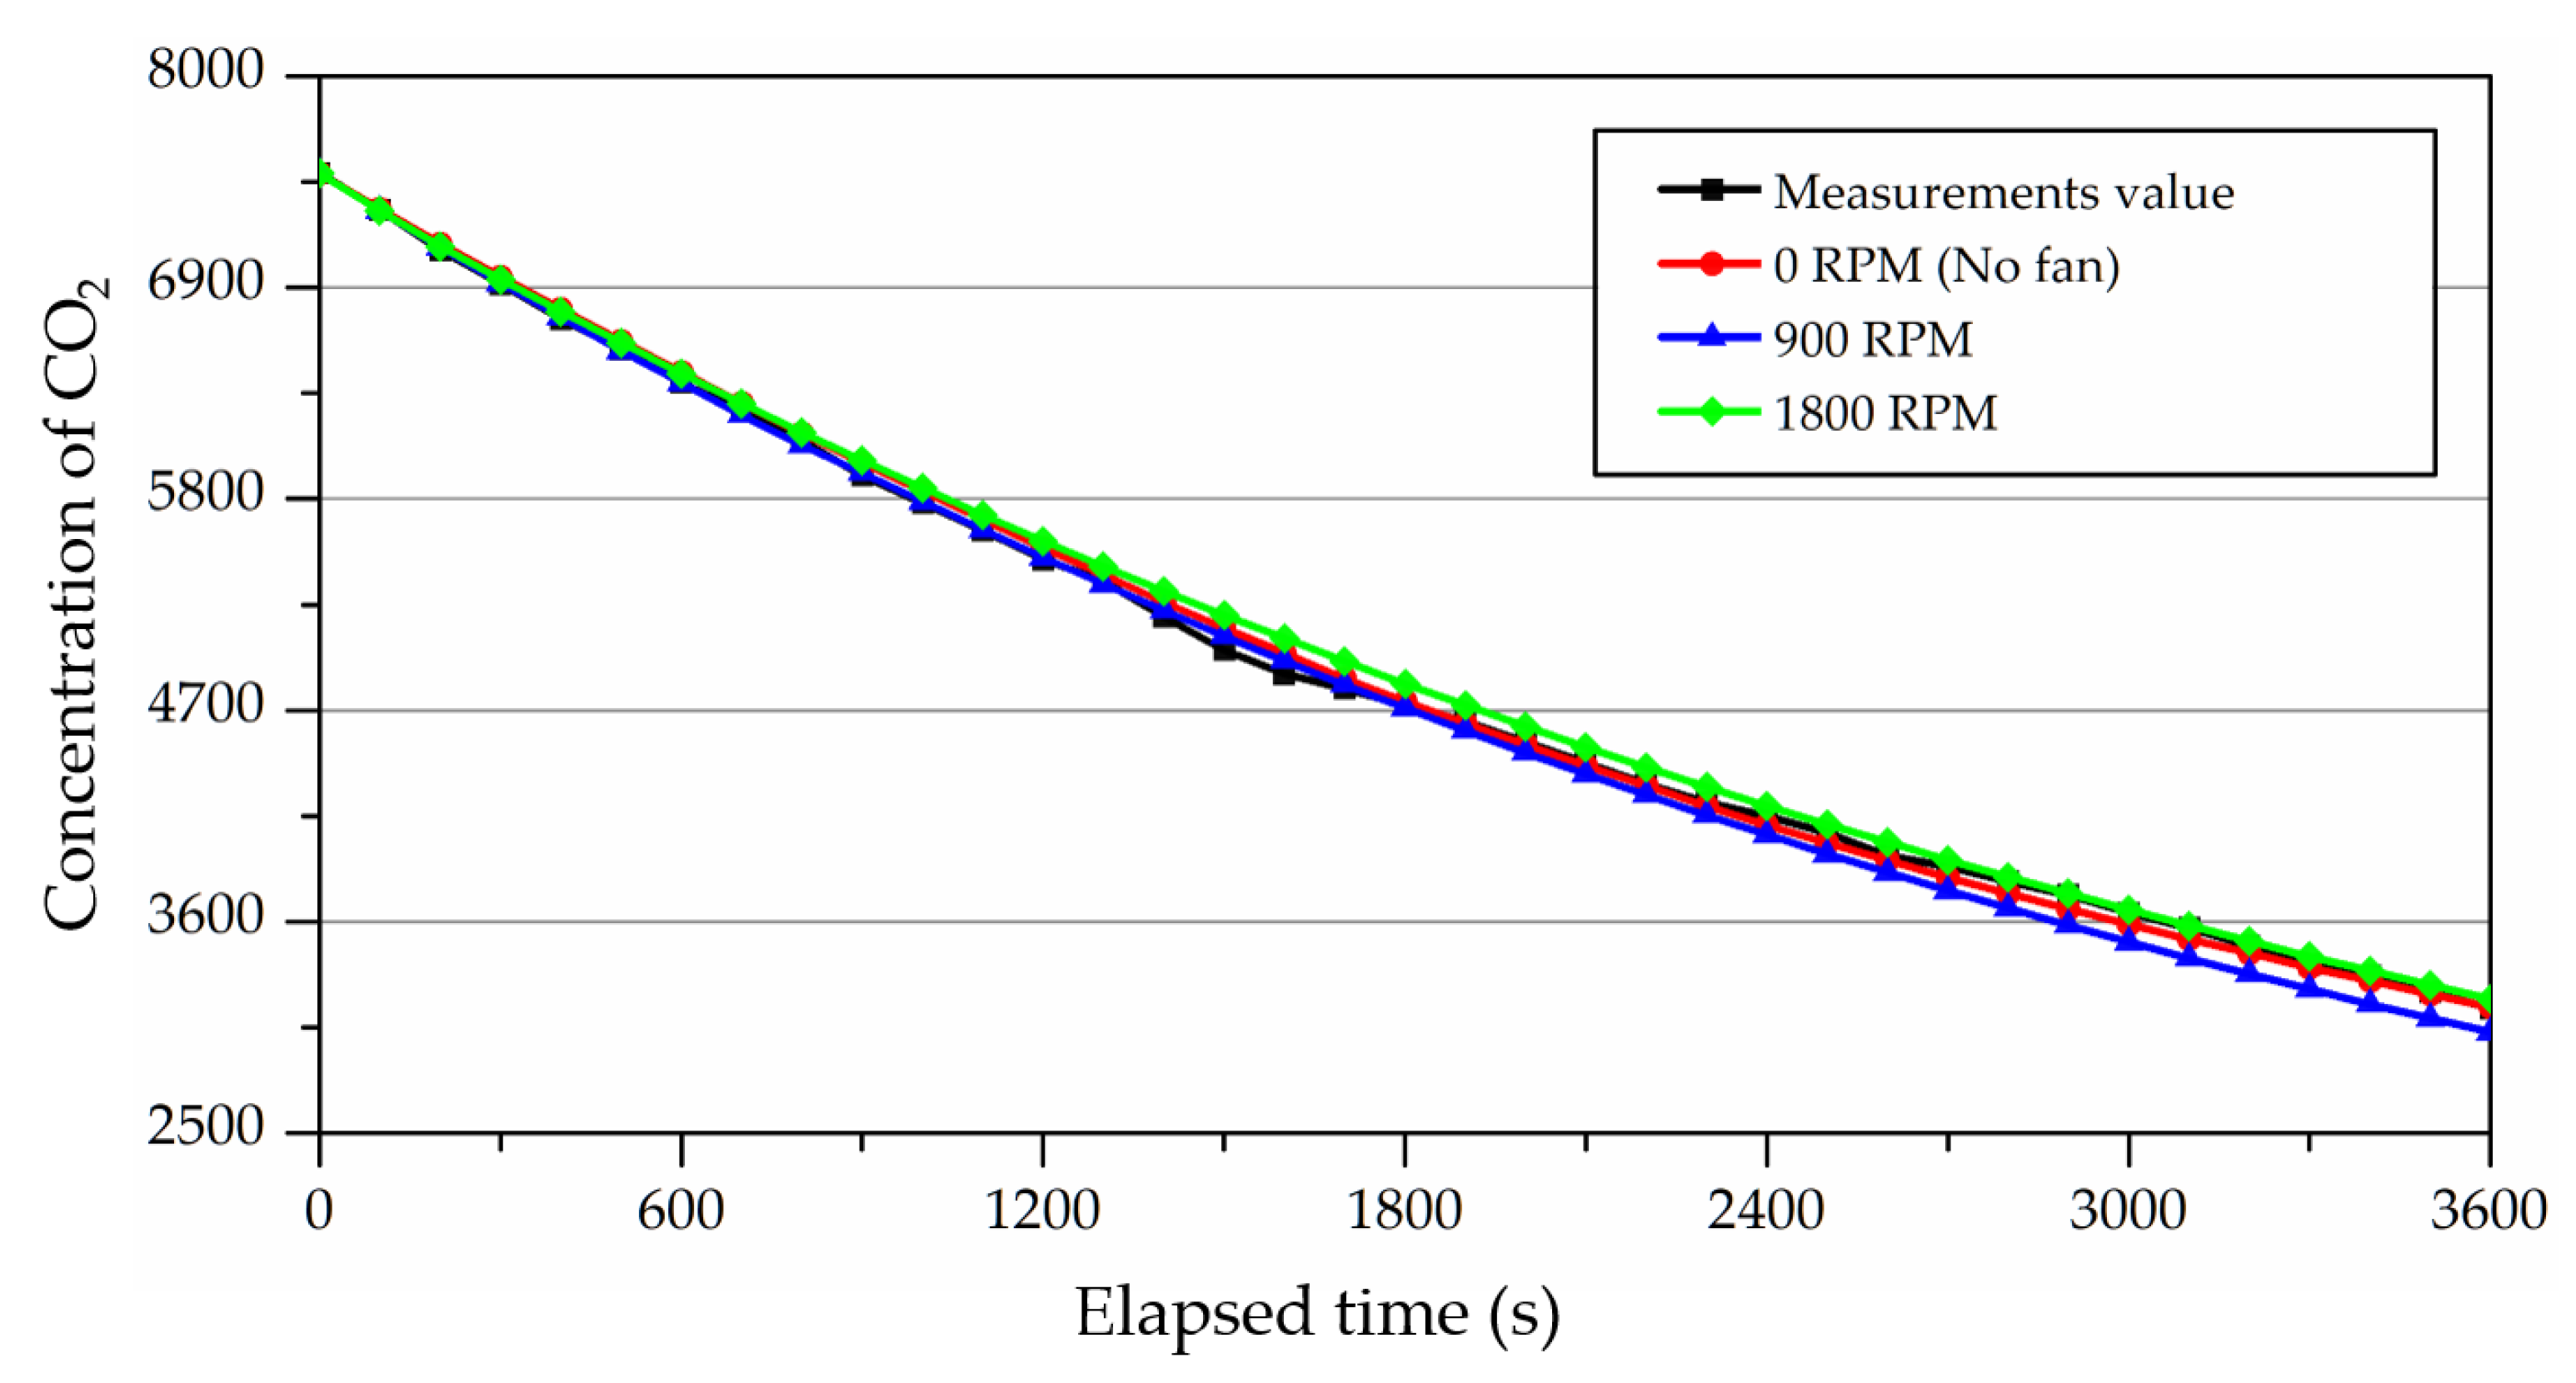
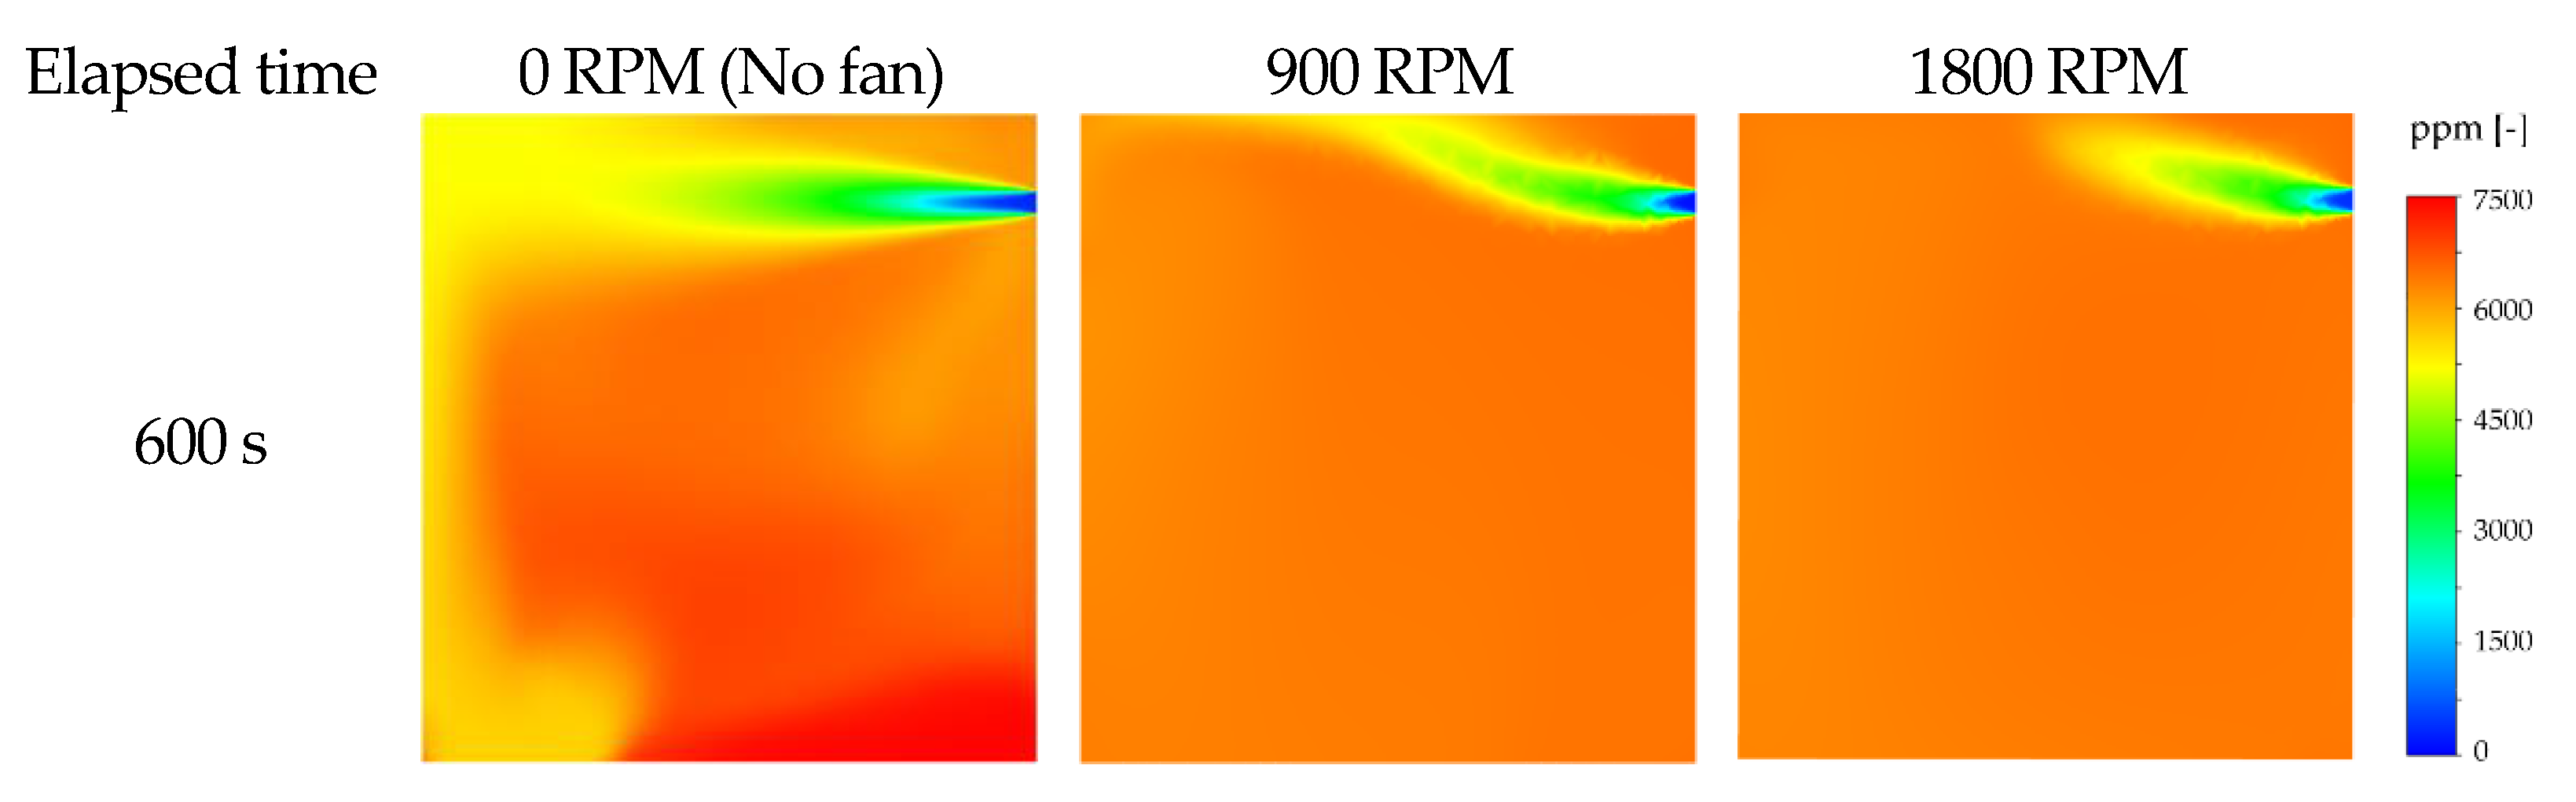
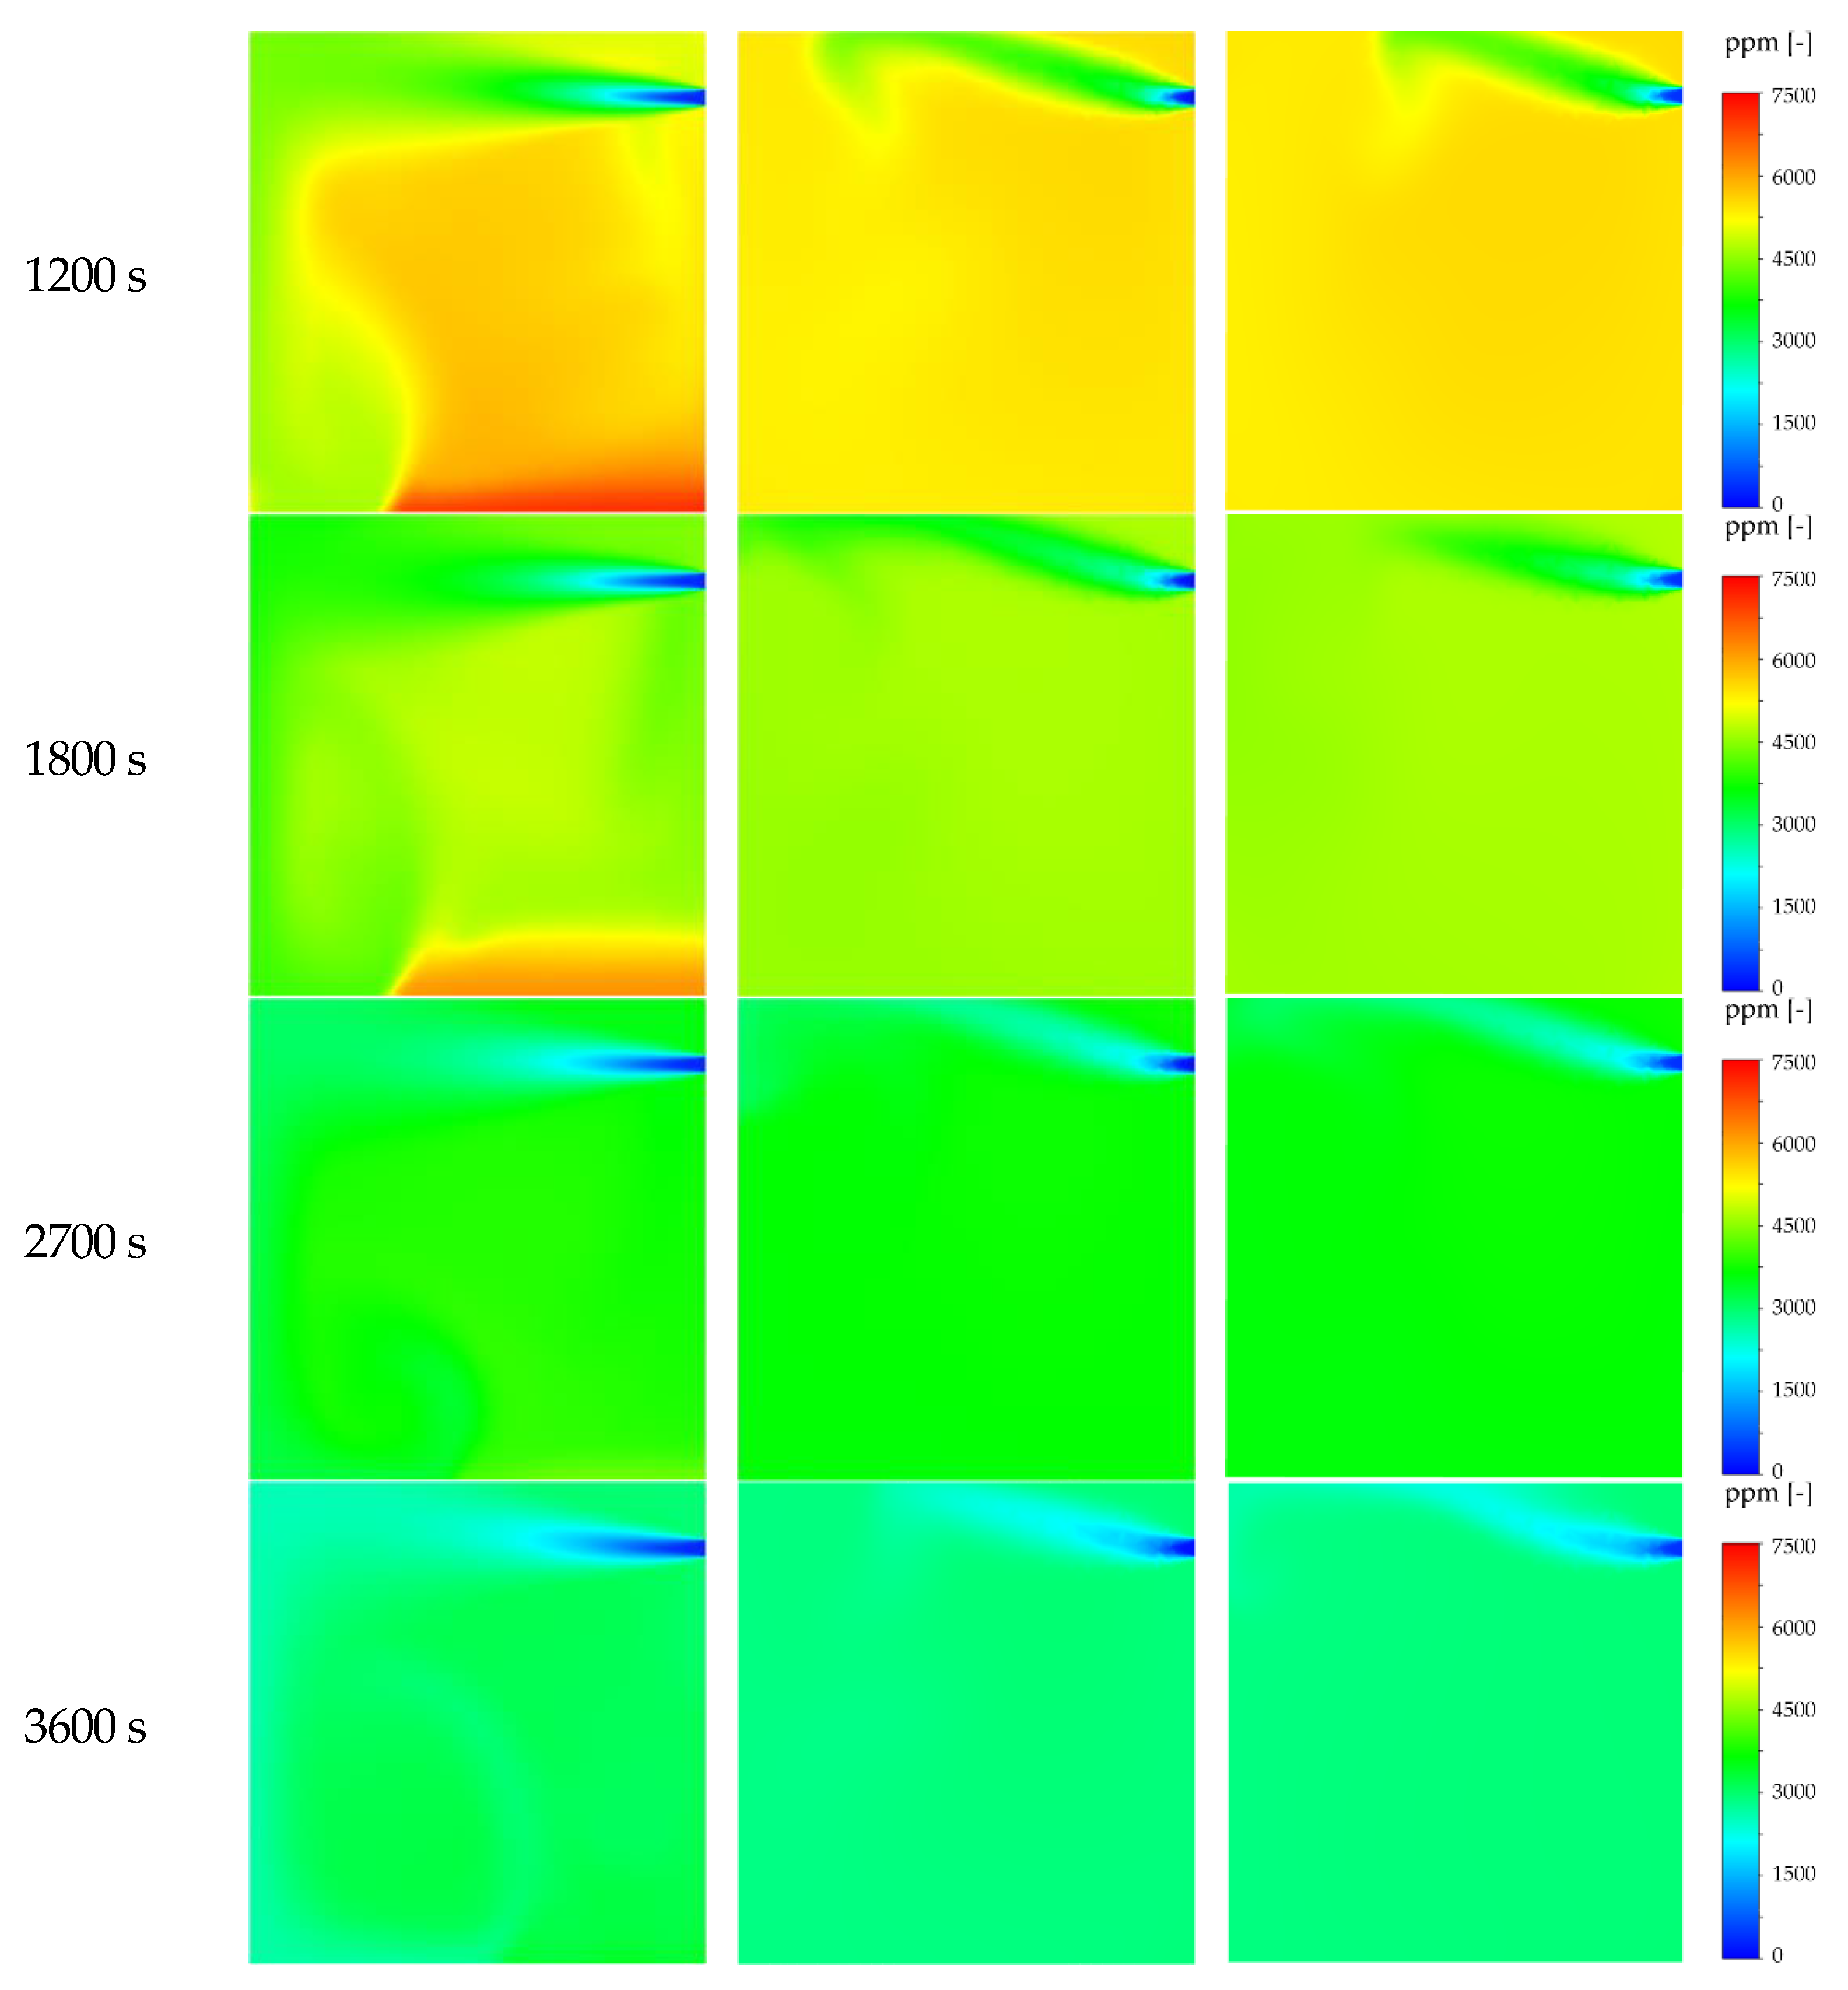
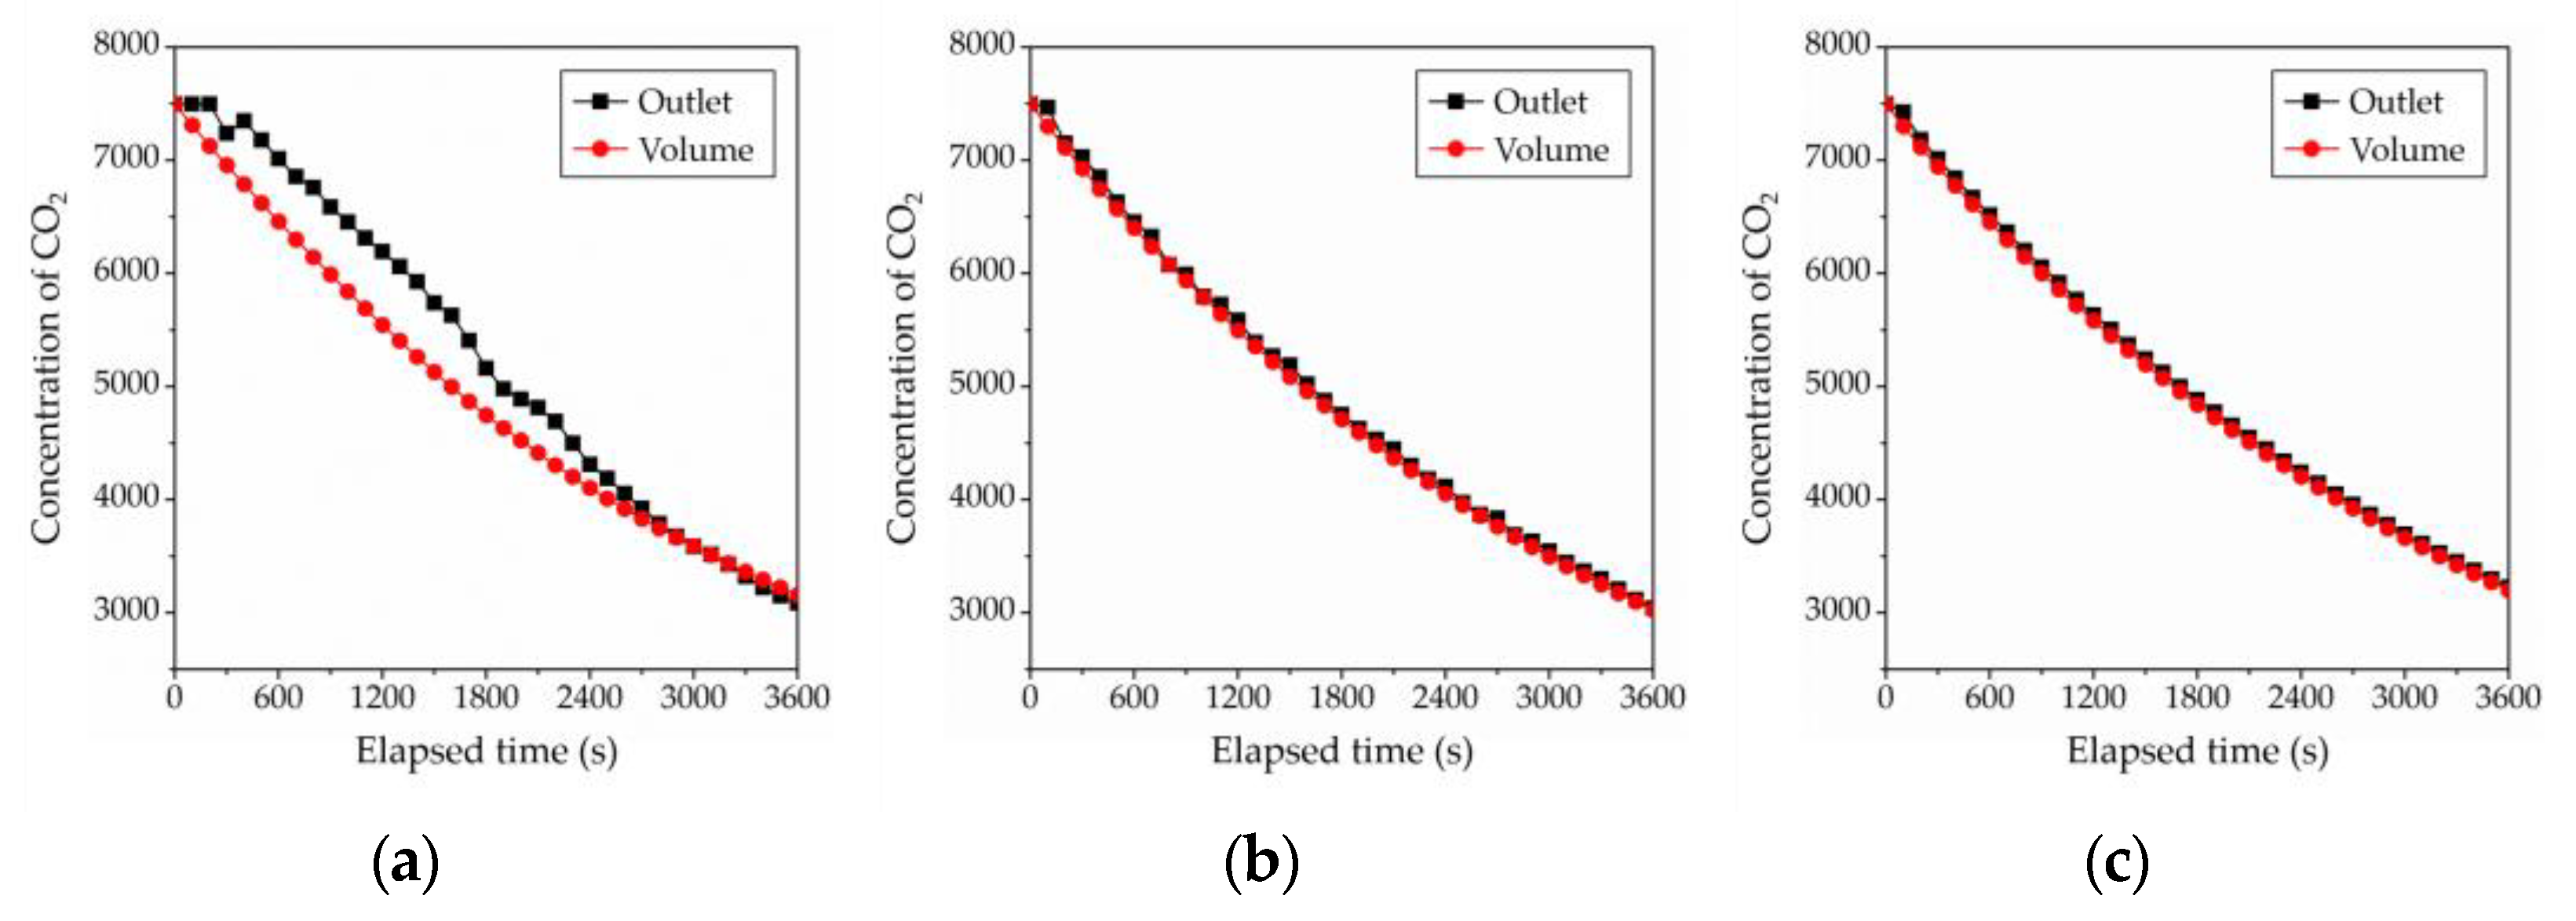
4.2. Comparison Measurements and CFD Depending on the Operation of the Fan
5. Conclusions
- Ventilation experiments could be performed without significant variation in ventilation efficiency, even with the operation of a fan.
- Ventilation experiments using a tracer gas with the operation of a fan solved the problem of concentration imbalance caused by the density difference between the gas and air, as a state of complete mixing was maintained throughout the experiment.
- As the concentration field was maintained uniform, the room mean age of air (RMA) could be estimated irrespective of location, even with the installation of a single instrument.
Author Contributions
Funding
Institutional Review Board Statement
Informed Consent Statement
Data Availability Statement
Acknowledgments
Conflicts of Interest
References
- Caron, F.; Guichard, R.; Robert, L.; Verriele, M.; Thevenet, F. Behaviour of individual VOCs in indoor environments: How ventilation affects emission from materials. Atmos. Environ. 2020, 243, 117713. [Google Scholar] [CrossRef]
- Zhang, Z.; Jiang, Z.; Shangguan, W. Low-temperature catalysis for VOCs removal in technology and application: A state-of-the-art review. Catal. Today 2016, 264, 270–278. [Google Scholar] [CrossRef]
- Shrubsole, C.; Dimitroulopoulou, S.; Foxall, K.; Gadeberg, B.; Doutsi, A. IAQ guidelines for selected volatile organic compounds (VOCs) in the UK. Build. Environ. 2019, 165, 106382. [Google Scholar] [CrossRef]
- Cheong, K.W. Airflow measurements for balancing of air distribution system—Tracer-gas technique as an alternative? Build. Environ. 2001, 36, 955–964. [Google Scholar] [CrossRef]
- Han, H.; Shin, C.Y.; Lee, I.B.; Kwon, K.S. Tracer gas experiment for local mean ages of air from individual supply inlets in a space with multiple inlets. Build. Environ. 2001, 46, 2462–2471. [Google Scholar] [CrossRef]
- Kiwan, A.; Berg, W.; Fiedler, M.; Ammon, C.; Gläser, M.; Müller, H.J.; Brunsch, R. Air exchange rate measurements in naturally ventilated dairy buildings using the tracer gas decay method with 85Kr, compared to CO2 mass balance and discharge coefficient methods. Biosyst. Eng. 2013, 116, 286–296. [Google Scholar] [CrossRef]
- Chao, C.Y.; Wan, M.P.; Law, A.K. Ventilation performance measurement using constant concentration dosing strategy. Build. Environ. 2004, 39, 1277–1288. [Google Scholar] [CrossRef]
- Cui, S.; Cohen, M.; Stabat, P.; Marchio, D. CO2 tracer gas concentration decay method for measuring air change rate. Build. Environ. 2015, 84, 162–169. [Google Scholar] [CrossRef]
- Almeida, R.M.S.F.; Barreira, E.; Moreira, P. A Discussion Regarding the Measurement of Ventilation Rates Using Tracer Gas and Decay Technique. Infrastructures 2020, 5, 85. [Google Scholar] [CrossRef]
- Hänninen, O.; Shaughnessy, R.; Turk, B.; Egorov, A. Combining CO2 data from ventilation phases improves estimation of air exchange rates. In Proceedings of the Healthy Buildings Conference, Brisbane, Australia, 24 February 2012. [Google Scholar]
- Kabirikopaei, A.; Lau, J. Uncertainty analysis of various CO2-Based tracer-gas methods for estimating seasonal ventilation rates in classrooms with different mechanical systems. Build. Environ. 2020, 179, 107003. [Google Scholar] [CrossRef]
- Standard 62.1-2019; Ventilation for Acceptable Indoor Air Quality. ASHRAE: Peachtree Corners, GA, USA, 2019.
- Kapsalaki, M. ASHRAE Position Document on Indoor Carbon Dioxide; ASHRAE: Atlanta, GA, USA, 2022. [Google Scholar]
- Batterman, S. Review and Extension of CO2-Based Methods to Determine Ventilation Rates with Application to School Classrooms. Int. J. Environ. Res. Public Health 2017, 14, 145. [Google Scholar] [CrossRef] [PubMed] [Green Version]
- Mahyuddin, N.; Awbi, H.B.; Alshitawi, M. The spatial distribution of carbon dioxide in rooms with particular application to classrooms. Indoor Built Environ. 2014, 23, 433–448. [Google Scholar] [CrossRef]
- Mahyuddin, N.; Awbi, H. The spatial distribution of carbon dioxide in an environmental test chamber. Build. Environ. 2010, 45, 1993–2001. [Google Scholar] [CrossRef]
- Khaoua, S.O.; Bournet, P.E.; Migeon, C.; Boulard, T.; Chasseriaux, G. Analysis of greenhouse ventilation efficiency based on computational fluid dynamics. Biosyst. Eng. 2006, 95, 83–98. [Google Scholar] [CrossRef]
- Chung, K.C.; Hsu, S.P. Effect of ventilation pattern on room air and contaminant distribution. Build. Environ. 2001, 36, 989–998. [Google Scholar] [CrossRef]
- Sandberg, M. What is ventilation efficiency? Build. Environ. 1981, 16, 123–135. [Google Scholar] [CrossRef]
- Han, H.T. Numerical approach to calculate ventilation effectiveness. Mag. Soc. Air Cond. Refrig. Eng. Korea 1992, 21, 271–281. [Google Scholar]
- Lu, T.; Lü, X.; Viljanen, M. A novel and dynamic demand-controlled ventilation strategy for CO2 control and energy saving in buildings. Energy Build. 2011, 43, 2499–2508. [Google Scholar] [CrossRef]
- Seo, S.Y.; Kim, M.H.; Han, H.; Kim, Y.I. Ventilation Effectiveness Measurements Utilizing Tracer Gas in a Thermal Environmental Chamber; The Society of Air-Conditioning and Refrigerating Engineers of Korea: Seoul, Korea, 1997; pp. 415–420. [Google Scholar]
- Han, H.T. Numerical analysis of ventilation effectiveness using turbulent airflow modeling. Mag. Soc. Air Cond. Refrig. Eng. Korea 1992, 4, 253–262. [Google Scholar]
- Fang, G.; Deng, S.; Liu, X. A numerical study on evaluating sleeping thermal comfort using a Chinese-Kang based space heating system. Energy Build. 2021, 248, 111174. [Google Scholar] [CrossRef]
- Kobayashi, T.; Sugita, K.; Umemiya, N.; Kishimoto, T.; Sandberg, M. Numerical investigation and accuracy verification of indoor environment for an impinging jet ventilated room using computational fluid dynamics. Build. Environ. 2017, 115, 251–268. [Google Scholar] [CrossRef]
- Pandey, B.; Prajapati, Y.K.; Sheth, P.N. CFD analysis of the downdraft gasifier using species-transport and discrete phase model. Fuel 2022, 328, 125302. [Google Scholar] [CrossRef]
- Kwon, K.S.; Lee, I.B.; Han, H.T.; Shin, C.Y.; Hwang, H.S.; Hong, S.W.; Han, C.P. Analysing ventilation efficiency in a test chamber using age-of-air concept and CFD technology. Biosyst. Eng. 2011, 110, 421–433. [Google Scholar] [CrossRef]


| Boundary Conditions | |
|---|---|
| Cells | 180,000 ± 10,000 |
| Turbulence model | SST k-ω |
| Temperature | 25 °C |
| Velocity inlet | The velocity of profile-centric: 0.6 m/s |
| Case 1 | Case 2 | Case 3 | Case 4 | Case 5 | |
|---|---|---|---|---|---|
| Age of air | 3573 s | 3715 s | 3967 s | 4299 s | 3643 s |
| Ventilation efficiency | 100.7% | 96.9% | 90.8% | 83.7% | 98.9% |
| Measurements Value | CFD Analysis | |||
|---|---|---|---|---|
| 0 RPM (No Fan) | 900 RPM | 1800 RPM | ||
| Age of air | 3659 s | 3701 s | 3545 s | 3779 s |
| Ventilation efficiency | 97.7% | 97.3% | 101.6% | 95.3% |
| Relative error | - | 0.41% | 2.47% | −3.98% |
Publisher’s Note: MDPI stays neutral with regard to jurisdictional claims in published maps and institutional affiliations. |
© 2022 by the authors. Licensee MDPI, Basel, Switzerland. This article is an open access article distributed under the terms and conditions of the Creative Commons Attribution (CC BY) license (https://creativecommons.org/licenses/by/4.0/).
Share and Cite
Park, S.; Park, S.; Seo, J. A Study of the Plan and Performance Evaluation Method of an 8-m3 Chamber Using Ventilation Experiments and Numerical Analyses. Int. J. Environ. Res. Public Health 2022, 19, 13556. https://doi.org/10.3390/ijerph192013556
Park S, Park S, Seo J. A Study of the Plan and Performance Evaluation Method of an 8-m3 Chamber Using Ventilation Experiments and Numerical Analyses. International Journal of Environmental Research and Public Health. 2022; 19(20):13556. https://doi.org/10.3390/ijerph192013556
Chicago/Turabian StylePark, Seonghyun, Seongwoo Park, and Janghoo Seo. 2022. "A Study of the Plan and Performance Evaluation Method of an 8-m3 Chamber Using Ventilation Experiments and Numerical Analyses" International Journal of Environmental Research and Public Health 19, no. 20: 13556. https://doi.org/10.3390/ijerph192013556