A Discussion Regarding the Measurement of Ventilation Rates Using Tracer Gas and Decay Technique


1
Department of Civil Engineering, Campus Politécnico de Repeses, Polytechnic Institute of Viseu, School of Technology and Management, 3504-510 Viseu, Portugal
2
CONSTRUCT-LFC, Faculty of Engineering (FEUP), University of Porto, 4200-465 Porto, Portugal
3
Faculty of Engineering (FEUP), University of Porto, Rua Dr. Roberto Frias s/n, 4200-465 Porto, Portugal
*
Author to whom correspondence should be addressed.
Infrastructures 2020, 5(10), 85; https://doi.org/10.3390/infrastructures5100085
Submission received: 1 October 2020
/
Revised: 9 October 2020
/
Accepted: 9 October 2020
/
Published: 12 October 2020
Abstract
:The measurement of ventilation rates is crucial in understanding buildings’ performances, but can be a rather complex task due to the time-dependency of wind and buoyancy forces, which are responsible for the pressure differences that induce air movement across the envelope. Thus, assessing air change rate through one-time measurements during brief periods of time may not be a reliable indicator. In this paper, the variability in the measurement of ventilation rates using the decay technique was evaluated. To that end, two compartments of a typical single-family detached dwelling were selected as a case study and 132 tests were performed, considering two different boundary conditions (door closed and door open). This work allowed the large variability of the results to be highlighted, as the coefficient of variation ranged from 20% to 64%. Wind speed had a key effect on the results, especially because during the measurements indoor–outdoor temperature differences were not so significant. The possibility of using occupant-generated carbon dioxide as tracer gas was also analyzed, but problems of cross-contamination were identified.
1. Introduction
The importance of buildings’ ventilation is enhanced by the growing energy concerns across the European Union [1,2], pointing to a reduction of the energy demand for ventilation. The importance of infiltration (uncontrolled and unintentional airflows) was clearly identified in recent studies, which indicate that it can be responsible for up to 27% on the energy balance of buildings [3]. On the other hand, adequate ventilation is crucial to maintain a comfortable indoor environment with good indoor air quality, since ventilation is the process of supplying (fresh) and removing (contaminated) air to and from any confined space. To completely understand the performance of a building, the ventilation rate is a key parameter [4]. The ventilation rate is particularly relevant in the context of mild climate countries where window opening is the main source for fresh air admission and is thus highly influenced by user behavior [5,6,7].
Moreover, in mild climate countries, natural ventilation is the most common strategy. The air movement required for natural ventilation occurs due to pressure differences produced by the combined effect of wind and buoyancy forces, which are both time-dependent [8]. Due to the unstable conditions that occur outdoors (wind and air temperature), one-time measurements of the ventilation rate, made over a short period, may not be an accurate indicator of the performance of the building [9,10,11]. This aspect is confirmed by several examples found in the literature in which differences between buildings real performance and prediction at design stage have been reported and discussed [12,13,14,15]. These issues reinforce the relevance of in-situ measurements to provide reliable data.
Several studies have already reported the time-variability of ventilation rates. This phenomenon is particularly important in naturally ventilated buildings, since ventilation is strongly dependent on the weather conditions. However, the uncertainty level of the measurement of the ventilation rates is also dependent on other factors such as the distribution and mixing of the tracer gas and the number and position of sampling points [16,17,18].
This paper aims to evaluate the variability in the measurement of ventilation rates using the decay technique and two different tracer gases. Two compartments of a typical single-family detached dwelling were selected as a case study and a large number of measurements were performed, considering two different situations: door closed and door open. A discussion about the strengths and weaknesses of the measurement technique was carried out. It is intended to:
- Assess the variability that can be found in the measurement of ventilation rates with tracer gas;
- Discuss the use of tracer gases other than sulfur hexafluoride (SF6) as its use is nowadays limited by environmental constrains;
- Compare the use of SF6 and occupant generated carbon dioxide (CO2) as tracer gases, stressing the importance of controlling cross-contamination of CO2;
- Evaluate the importance of the outdoor climate conditions on the results by tackling a relationship between the attained ventilation rates and the corresponding wind speed and indoor–outdoor temperature difference.
2. Literature Review
Accurately measuring ventilation rates can be a complex task. The most common technique to measure ventilation rates is using a tracer gas dilution method [8]. However, in very specific conditions as in very airtight buildings where airflows occur in ductwork, velocity transverse methods can be used to estimate airflow rates [19]. Infiltration rates in buildings are frequently assessed by pressurization techniques, commonly known as the Blower Door Test [20,21,22], sometimes in association with infrared thermography to obtain information about the air leakage pathways [23,24]. Bracke et al. [25] discussed the durability and measurement uncertainty of airtightness, focusing on the issues of repeatability and reproducibility, the impact of weather conditions, the impact of the age of the construction, and the reproducibility in repeated construction of virtually identical houses. A review of direct and indirect methods developed for measurement of airflow rates can be found in Ogink et al. [16].
The tracer gas dilution method is based on a mass balance of the tracer gas in the indoor air. There are three different techniques to measure ventilation rates in dwellings using this method [26]: (1) constant injection, the flow release rate must be known; (2) constant concentration, the gas concentration is kept constant and the flow release rate must be known; (3) concentration decay, the gas is released, mixed into the system, and the concentration decrease is then measured. The simplest approach is using the decay technique as it is cheaper and the system is far less complex. A comparison between constant concentration and decay techniques can be found in Chao et al. [27].
Several tracer gases can be used and its selection is an important issue. The tracer gas should be easily monitored and, normally, is not present in the atmosphere (this technique is also applicable if the outdoor concentration of the gas is known). A discussion regarding the potential and limitations of several tracer gases can be found in Grimsrud et al. [28]. The most common gas was, until a few years ago, SF6, however nowadays its use is limited by environmental constrains. Several studies can be found in the literature where CO2 is used as tracer gas, as it is considered reliable, simple and cheap. In fact, CO2 is often used as a “natural” tracer gas (occupant-generated) for estimating ventilation rates, especially because it is present in all buildings, usually well dispersed, and can be measured accurately with inexpensive logging instrumentation [29]. A comparison between the use of these two gases can be found in Edouard et al. [30]. In this study, both methods gave similar ventilation rates, being 10−12% lower with the CO2 mass balance method.
Another important issue is the sampling position. Buggenhout et al. [17] demonstrated that the errors could rise up to 86% in naturally ventilated spaces where perfect air mixing is sometimes hard to achieve. Bjerg et al. [31] studied five sampling locations and concluded that measuring in the middle of the building is the most accurate scenario. Nevertheless, this is still an open issue [16].
Some different approaches to measure ventilation rates have recently been tested. Vereecken et al. [32] used measured relative humidity to determine the ventilation rate and the moisture buffer potential of room enclosures. The main advantage of this methodology is that it allows a comprehensive characterization of the hygric inertia of the whole building enclosure. An attempt to determine ventilation rates through moisture balance was also made by Samer et al. [33], finding reliable results especially during winter seasons. The release rate of solid carbon dioxide (dry ice) in an insulated box was used by Cheng and Li [34]. The method was compared with traditional approaches and an uncertainty of less than 10% was found.
Besides the weather condition, one of the key aspects when assessing the uncertainty in building ventilation rates is the user behavior, such as window-opening habits and use of exhaust fans [8]. Howard-Reed et al. [35] made more than 300 air change rate experiments in two homes to evaluate the effect of opening windows. They concluded that, compared with temperature differences and wind effects, window opening produced the greatest increase in the air change rate. The influence of door opening on interzonal air exchange was quantified by Lee et al. [36]. The results showed that the interzonal air exchange volume through the door was higher with a swing door, in comparison with a sliding door.
3. Materials and Methods
3.1. Framework
The measurement campaign lasted from April to June. Throughout this period, the following data were recorded to evaluate both the indoor and the outdoor environmental conditions: the air temperature and relative humidity and the CO2 concentration in the living room and in the bedroom; and the outdoor air temperature and relative humidity and wind speed and direction. The set-up included two sensors in each compartment and the sampling interval was 5 min. The sensors were placed at a height of 0.90 m.
When using CO2 as a tracer gas to assess the ventilation rate by the decay technique, only the unoccupied periods were used to guarantee that the gas generation was null. The users’ presence in the rooms was therefore monitored both visually and through a questionnaire when no research team member was present and that information was combined with the decay of the CO2 concentration for estimating the ventilation rate. The measurements of the ventilation rate using SF6 as tracer gas were performed on a daily basis. For both gases, two boundary conditions were tested: (i) door open (O); and (ii) door closed (C). These conditions were applied to all interior doors. The information regarding the door position (open/closed) was also gathered through a questionnaire.
3.2. Tracer Gas Measurements
In this research, both SF6 and CO2 were used as tracer gases for estimating the ventilation rate by the concentration decay technique. This method is well established in the literature and the procedure is fully described in the standards ISO 12,569 [37] and ASTM E 741 [38], considering the linear regression method. Special attention was paid to guarantee the correct mixing of the tracer gas. According to this procedure the outdoor concentration of the tracer gas should be zero, which is not the case for the CO2. In this situation, the difference between the indoor and the outdoor concentration should be used as established in ASTM D6245 [39].
The method formulation that inside a single space, the mass balance of the tracer gas can be expressed by Equation (1).
where V [m3] is the volume of the space; C(t) [ppm] is the concentration of the tracer gas at instant t; t [s] is the time; G [cm3/s] is the generation rate of the tracer gas; Q [m3/s] is the internal–external exchange rate; and Cex [ppm] is the external concentration of the tracer gas.
The analytical solution of Equation (1) is as indicated in Equation (2).
where Cin [ppm] is the initial concentration of the tracer gas.
Since during the test there was no generation of the tracer gas, Equation (2) can be simplified, as presented in Equation (3).
where n [h−1] is the air change rate.
The statistical treatment of the results was implemented using the software IBM SPSS Statistics 24.
3.3. Equipment
Two portable thermohygrometers with data-logging capacity were placed inside each compartment for the recording of the interior air temperature and relative humidity. The precision and the resolution of these devices are ±0.35 °C and ±2.5% and 0.03 °C and 0.03%, for temperature and relative humidity, respectively. The CO2 concentration was recorded with a non-disperse infra-red (NDIR) type unit (two in each compartment) that has a resolution of ±1 ppm and a maximum accepted error resulting from the highest of two values (±50 ppm or 5% of the reading).
The outdoor air temperature and wind speed and direction were measured using a portable weather station. The air temperature sensor has an accuracy of ±1 °C and a resolution of 0.1 °C. The wind direction range includes 16 positions (accuracy of ±11.25°; resolution of 22.5°).
4. Case Study
4.1. Description
A two-storey single-family detached dwelling located near Porto, north of Portugal, was selected as the case study due to its proximity to the sea, which in this region typically corresponds to a high wind exposure area. The region of Porto has a mild climate with dry summers.
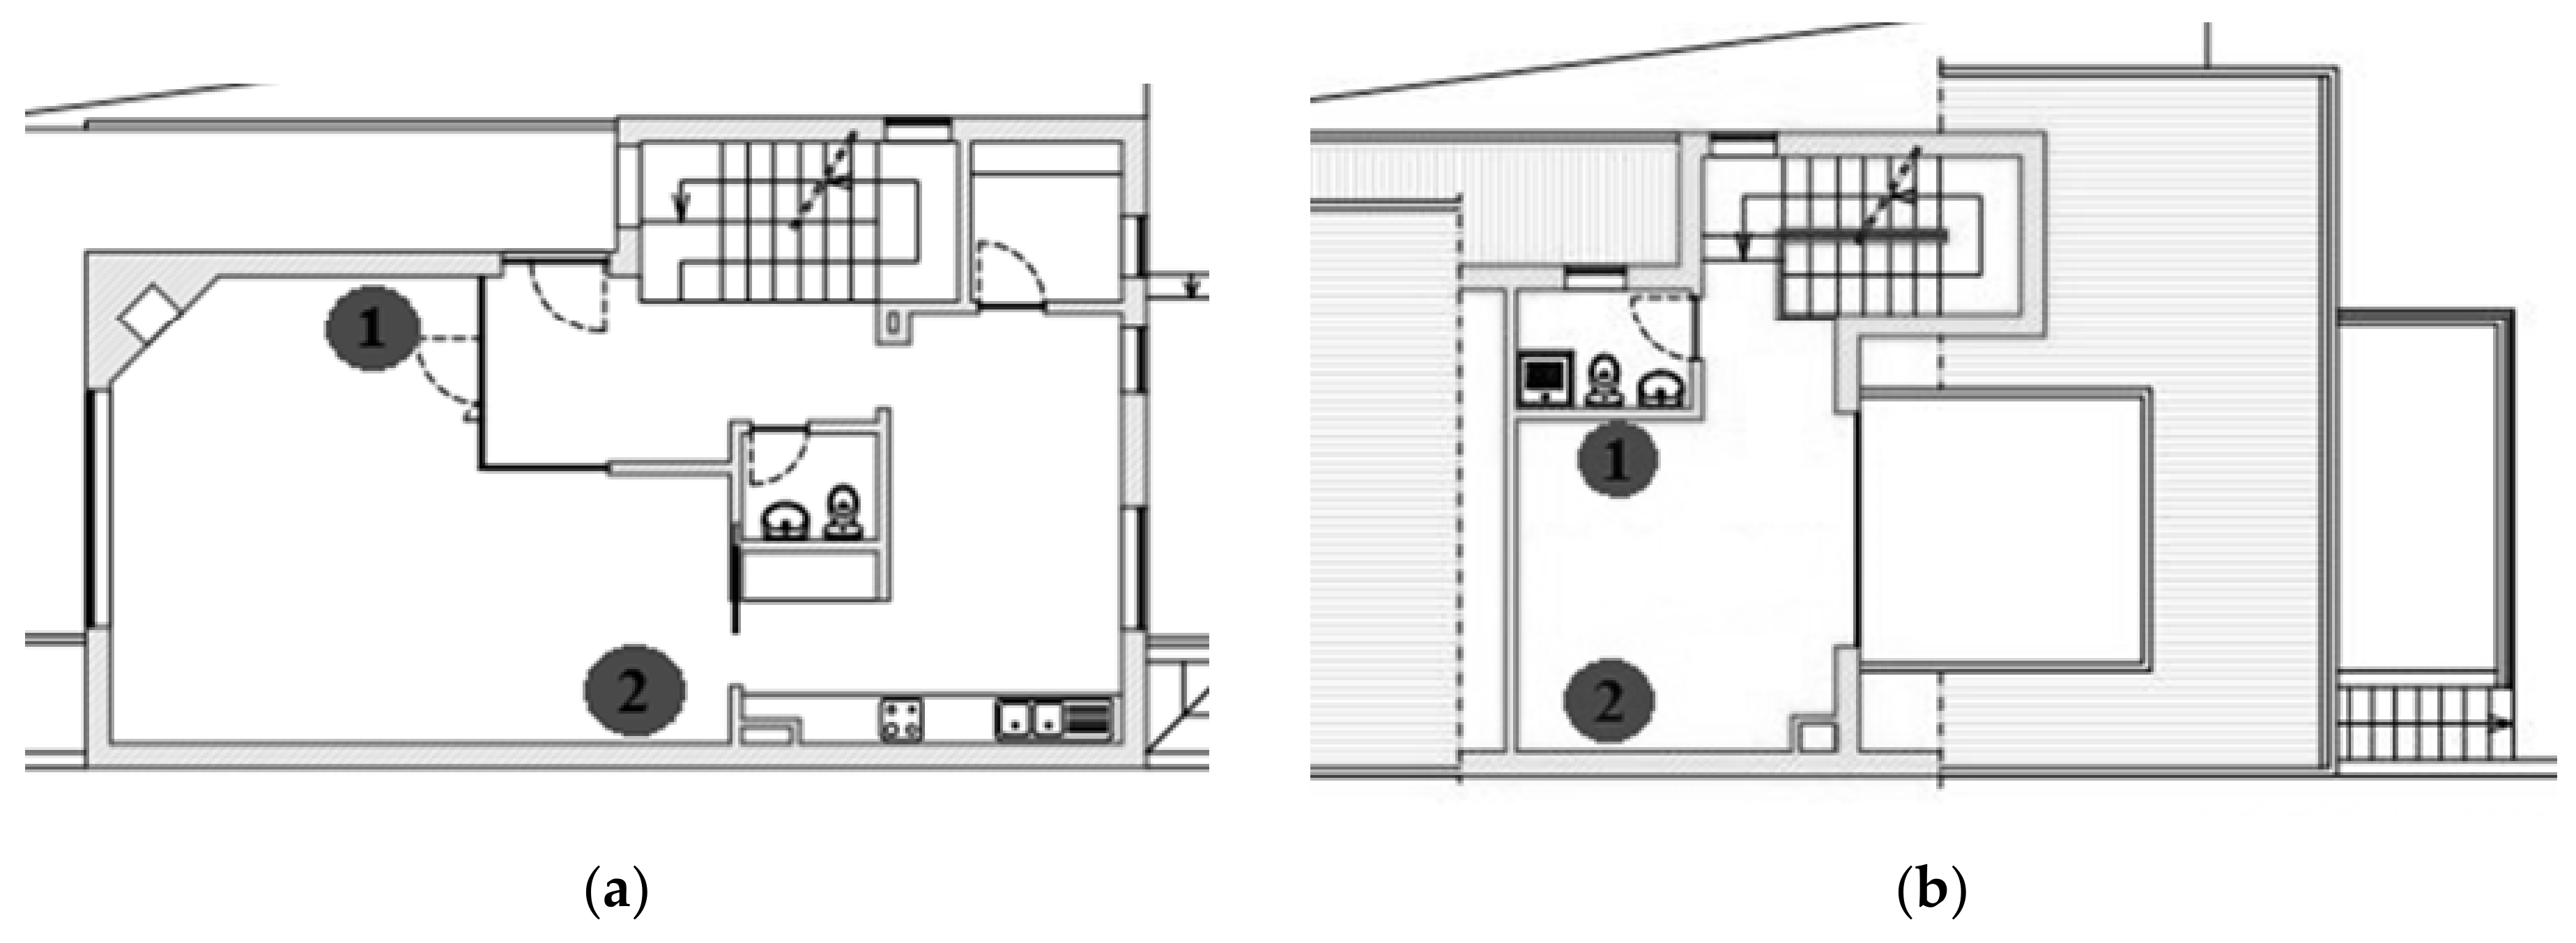
The living room (LR), on the ground floor, and a bedroom (BR), on the first floor, were chosen for the measurement campaign. Figure 1 shows the floor plans, including the sensors location in each compartment, and Table 1 summarizes the most relevant geometric data. The geometric characteristics of the two spaces are quite similar, except the door area, which is significantly higher in the LR. The other difference between the two spaces is their orientation: the LR is north oriented and the BR is south oriented.
The case study has a concrete frame structure and a two-layer brick wall with 3 cm of XPS in the air cavity. The interior doors have a 7 mm air gap in the base and are airtight in the remaining boundaries. The windows are composed of sliding aluminium frames with double glazing and have external aluminium shutters (tilt blades).
4.2. Characterisation of the Indoor and Outdoor Environment
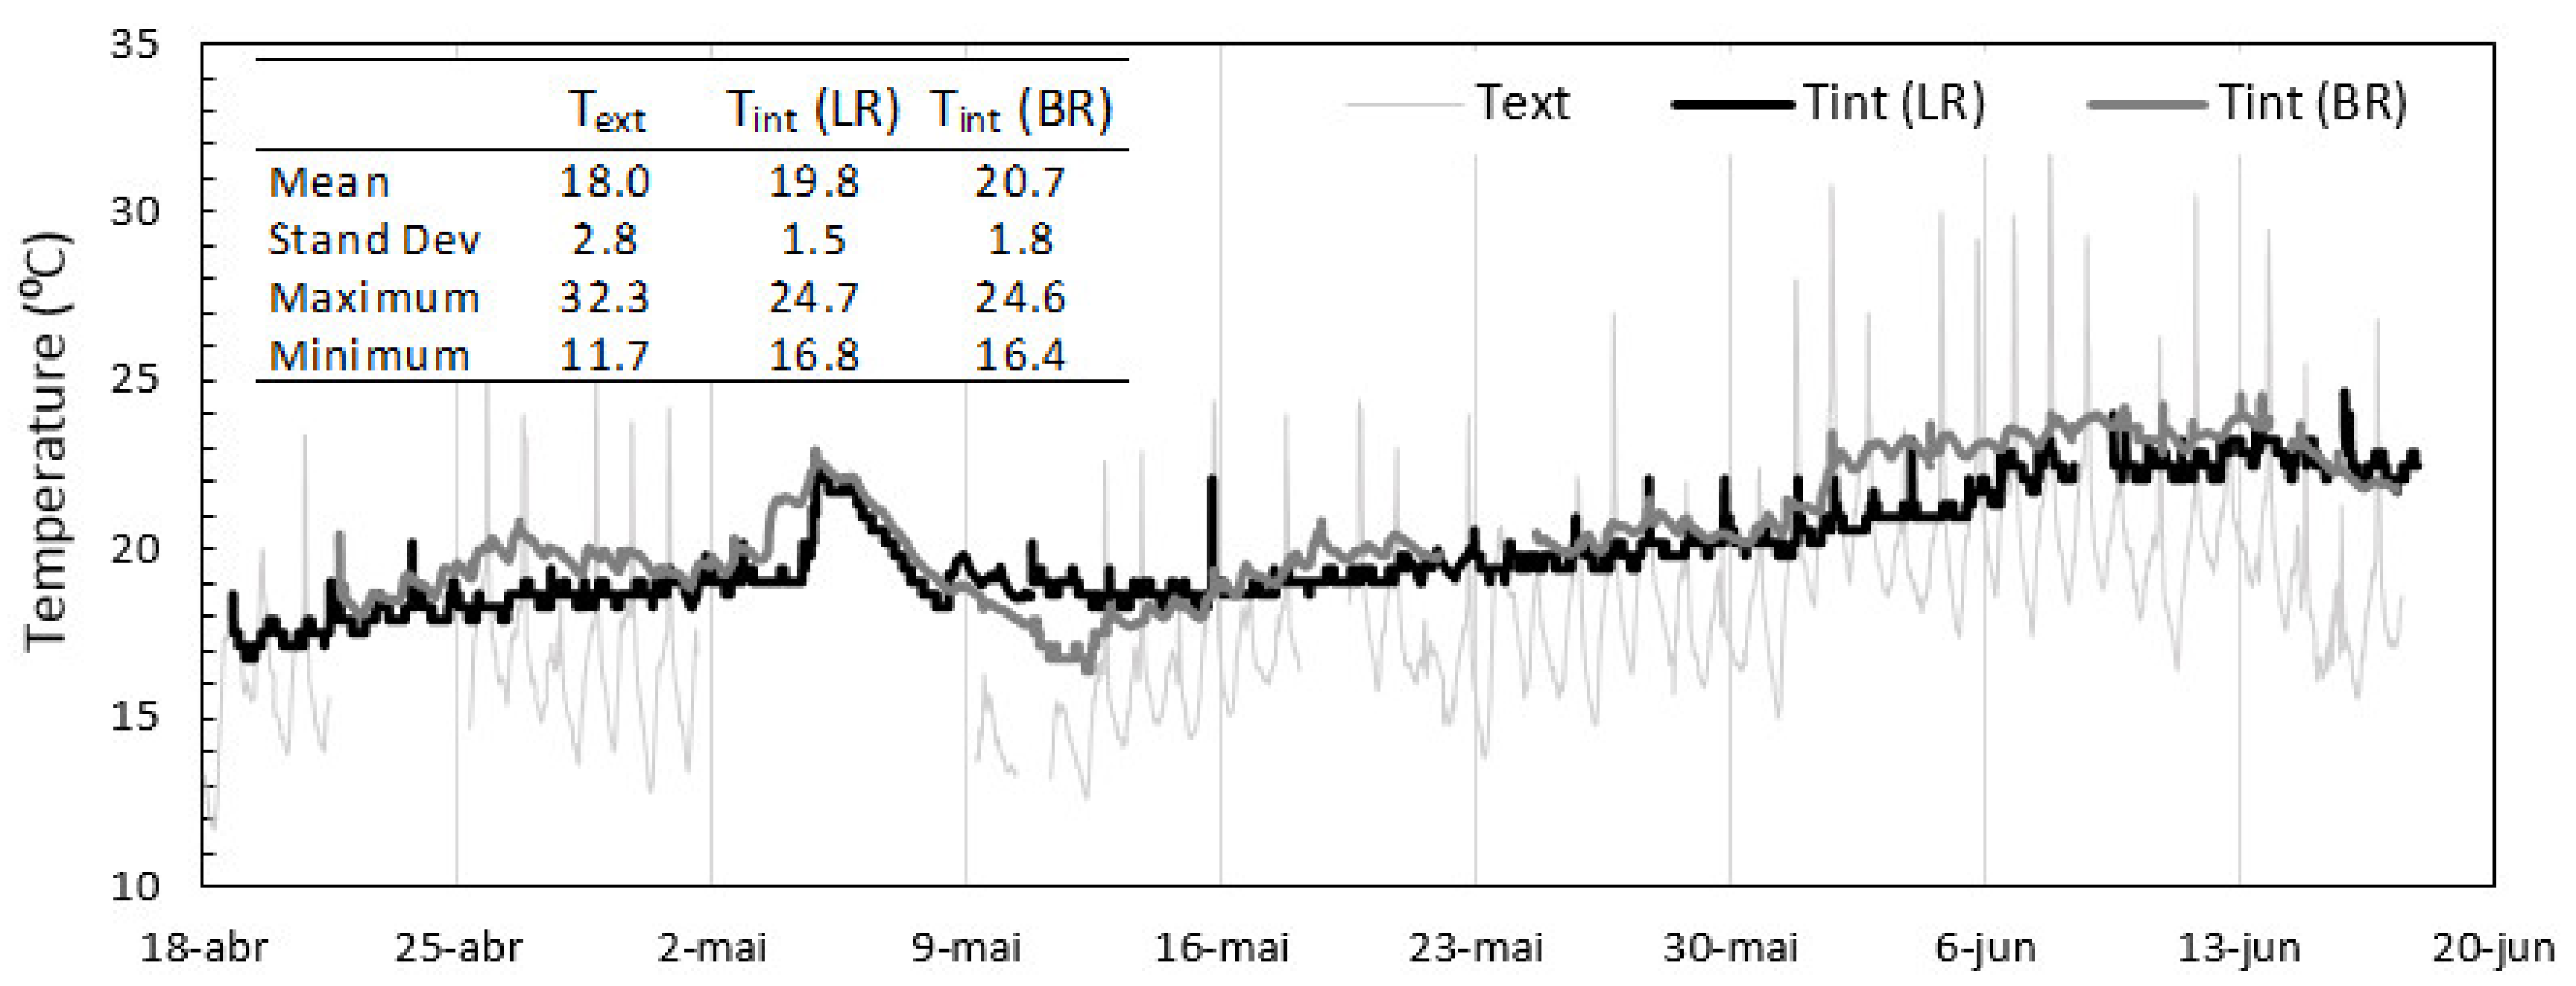
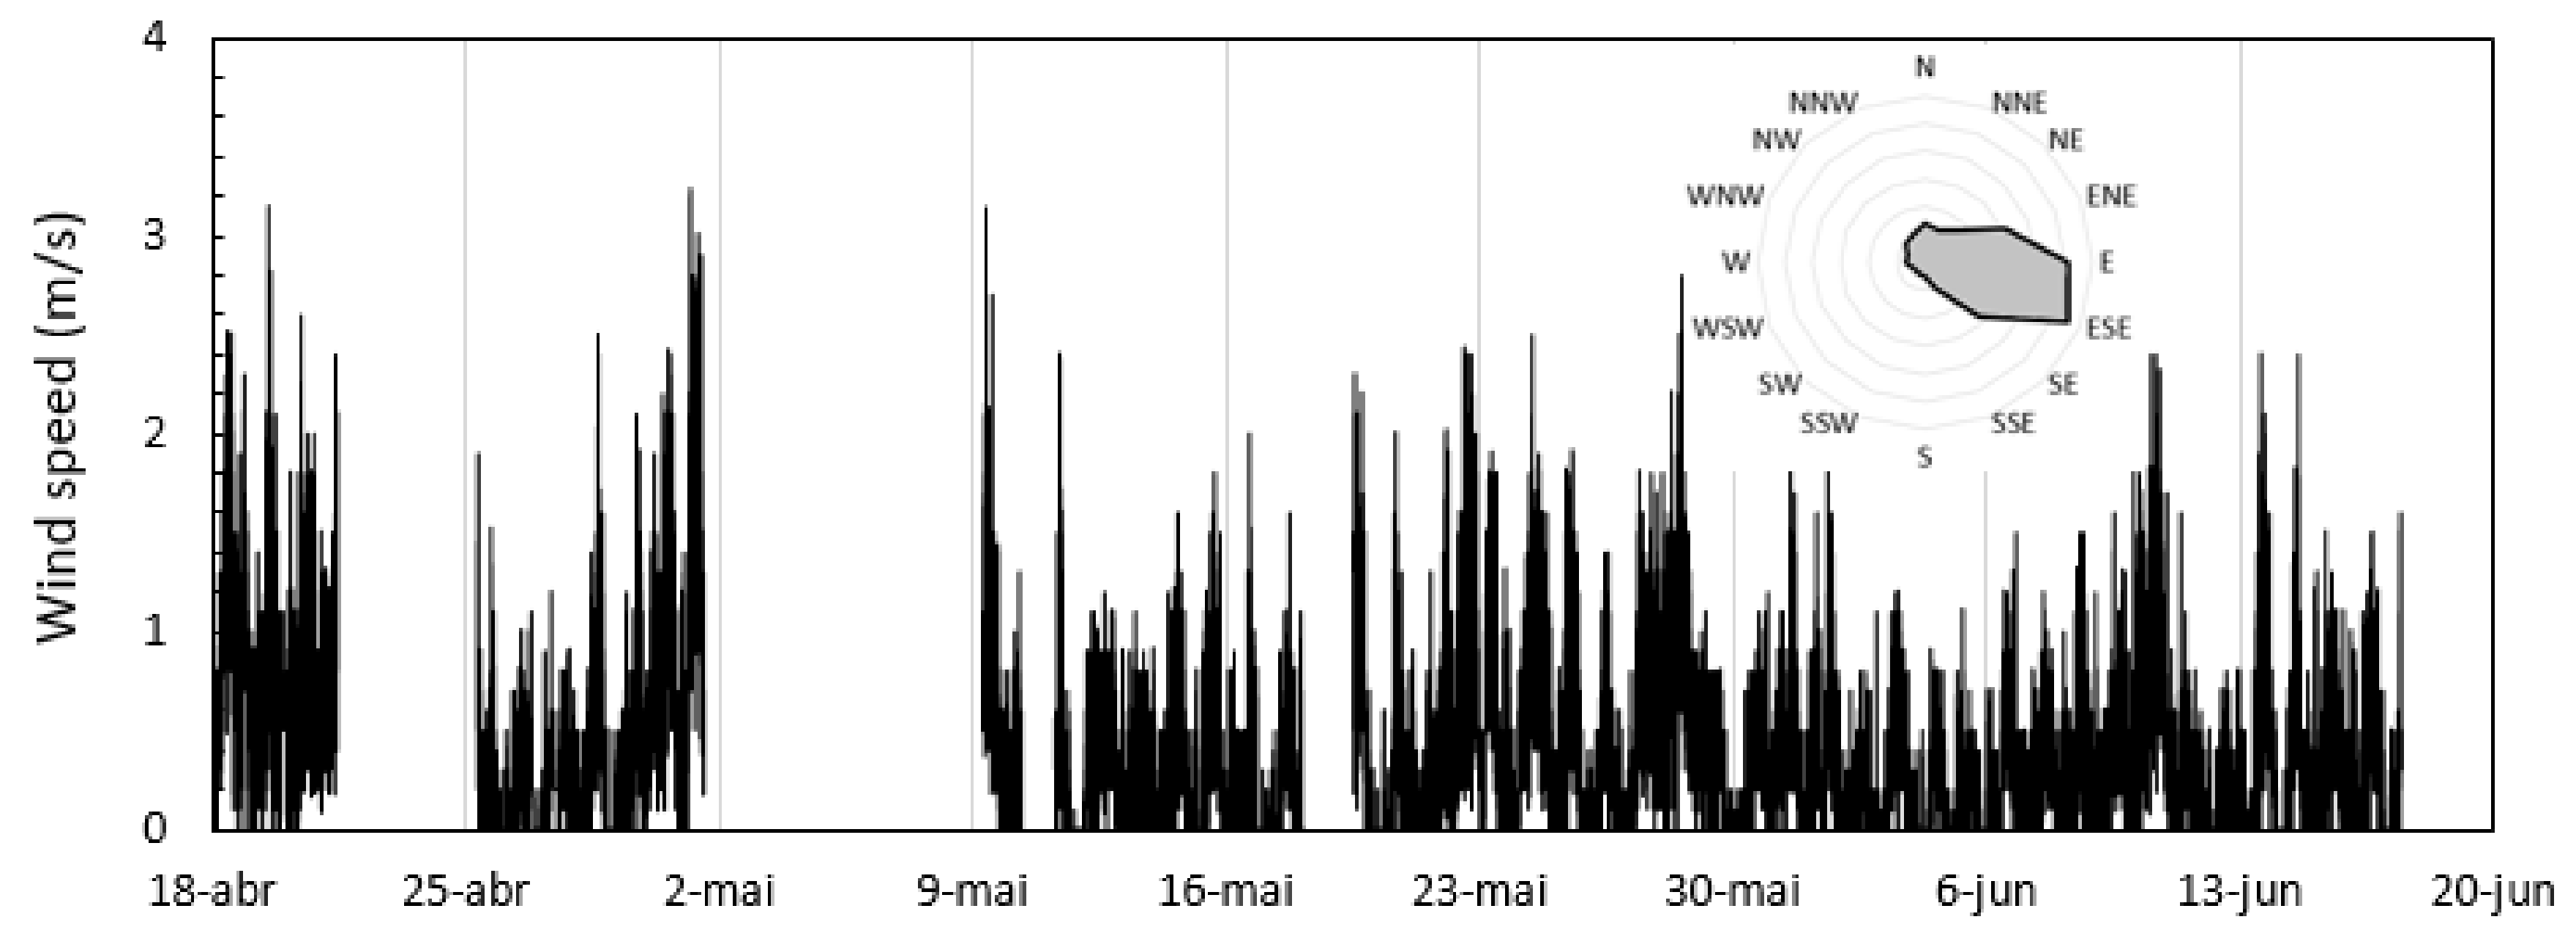
The experimental campaign was carried out during the mid-season period and, thus, no large air temperature fluctuations were expected. In fact, the standard deviation was 2.8 °C with an average air temperature of 18.0 °C. The range of variation was 20.6 °C with a maximum of 32.2 °C. The prevailing winds were easterly and south-easterly oriented and the average wind speed was 0.40 m/s. The maximum wind speed recorded was 3.2 m/s. The interior air temperature varied identically in the two compartments, ranging between 16.8 °C and 24.7 °C in the LR, and between 16.4 °C and 24.6 °C in the BR. The average value was 19.8 °C and 20.7 °C, respectively. The slightly higher average temperature in the BR, which is located on the first floor, is explained by the periods of higher outdoor temperature experienced from the beginning of June and the south orientation of the BR. The maximum indoor–outdoor temperature gradient was 9.1 °C and occurred in the LR.
Figure 2 shows the fluctuation of the air temperature in the two compartments and in the exterior and Figure 3 presents the wind speed and direction. During the experimental campaign, there were a few issues in the link between the weather station and the data-logger. For that reason, some gaps can be observed in Figure 2 and Figure 3.
5. Results
5.1. Sulfur Hexafluoride (SF6) Measurements
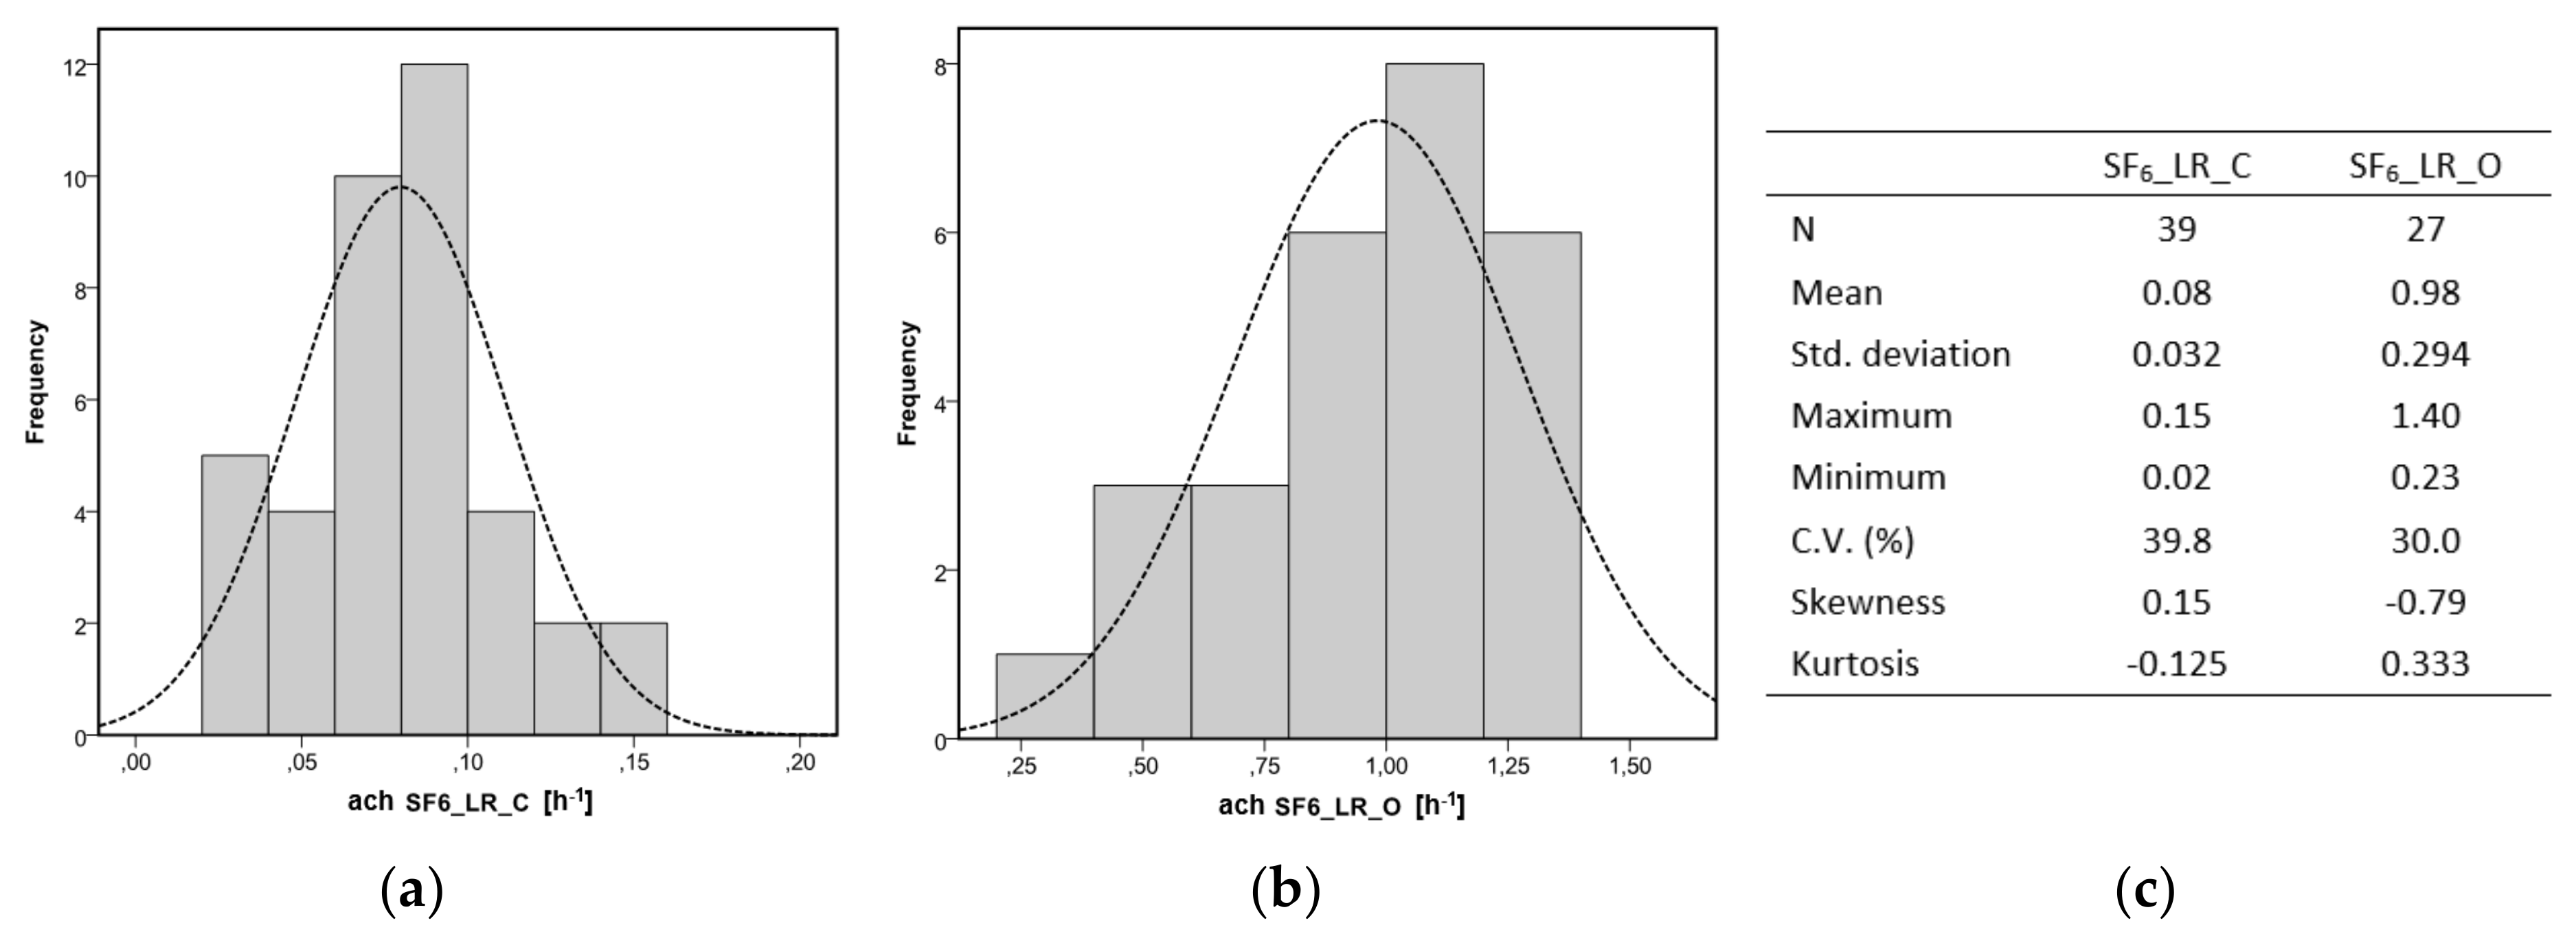
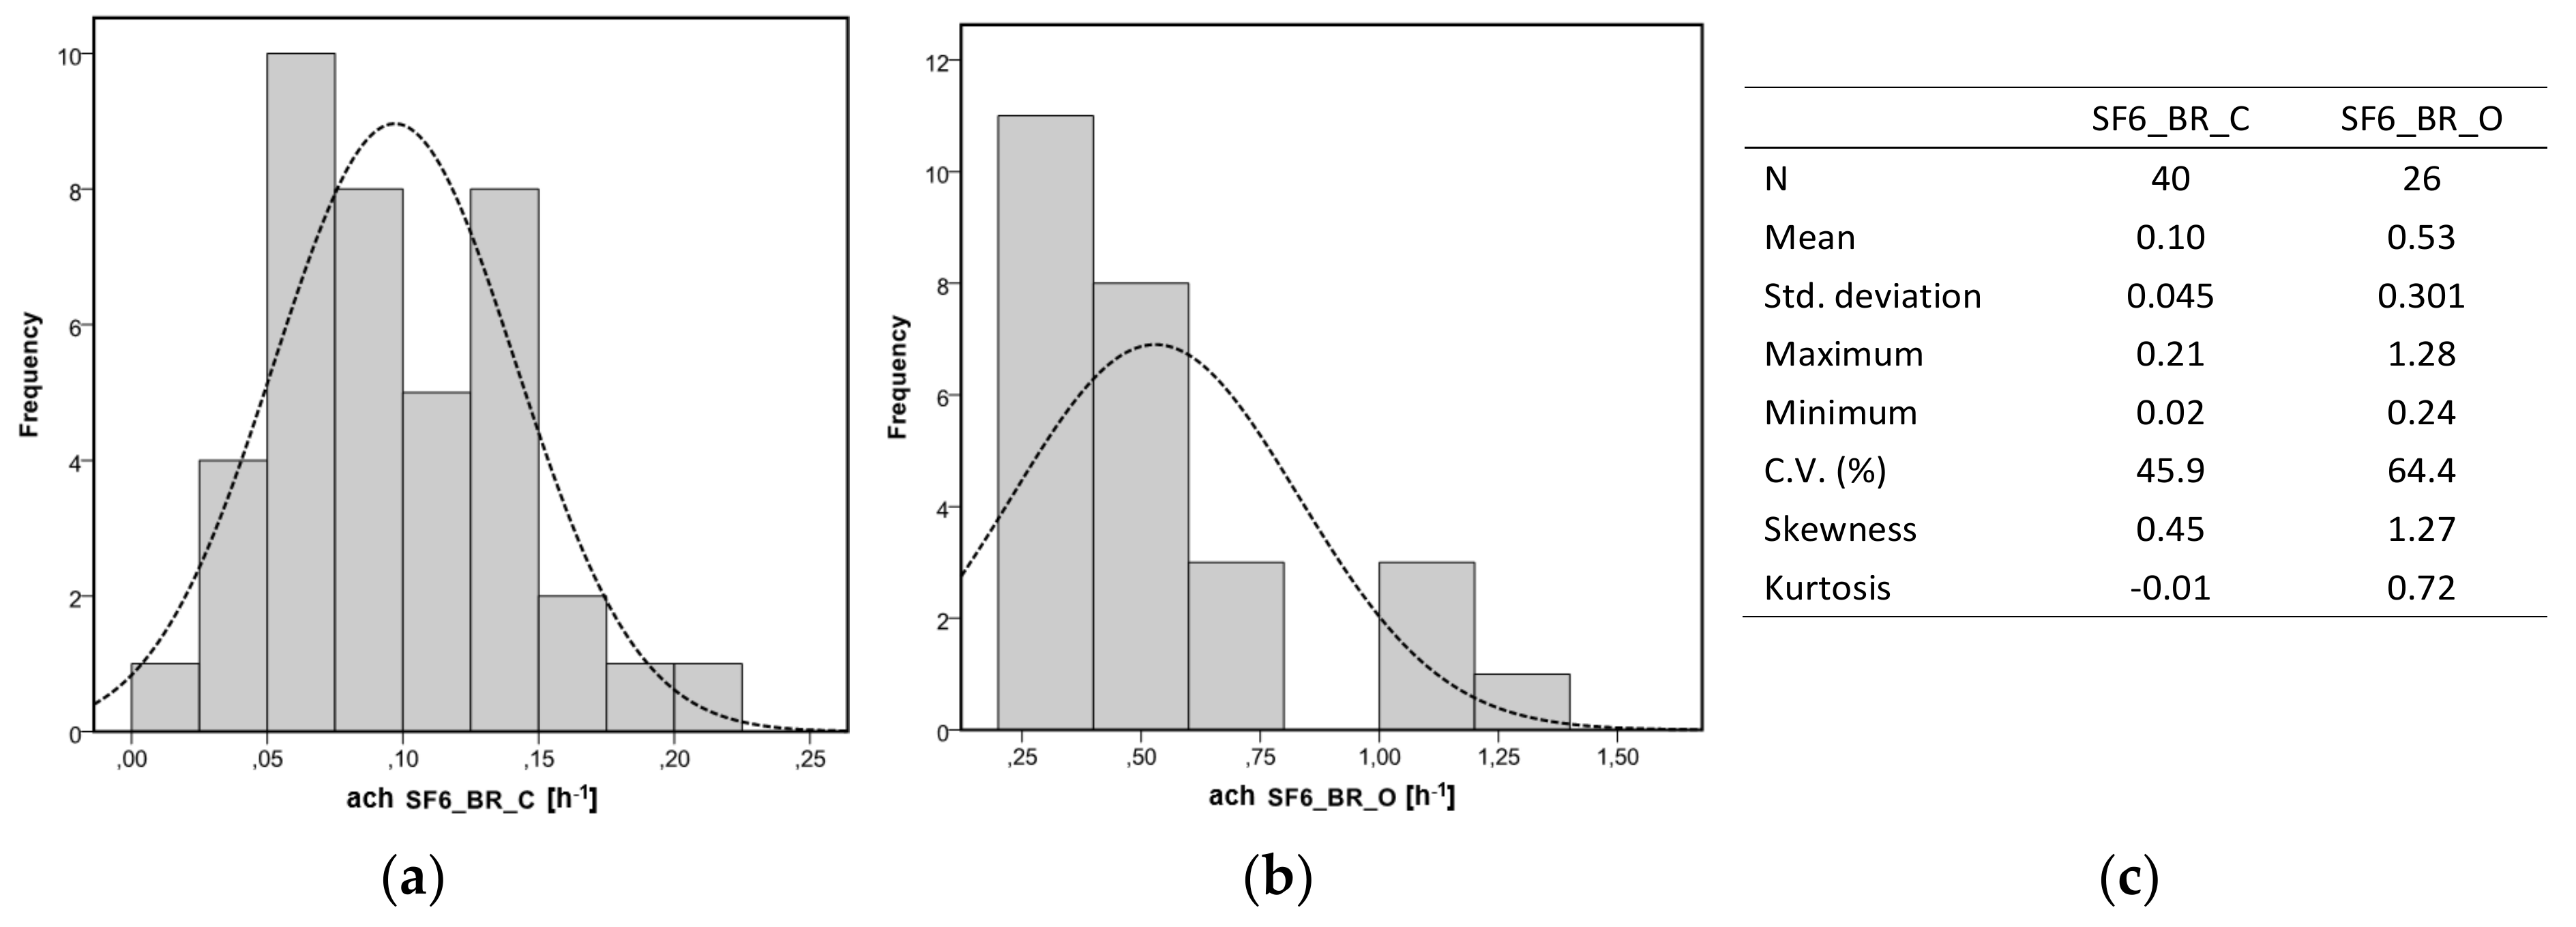
A total of 132 tests using SF6 as tracer gas were carried out, 66 in each compartment. The results were statistically analysed and Figure 4 and Figure 5 depict the histogram of the results separately for each compartment. The most important descriptive statistical indicators are also included.
For the door closed situation, the performance of both compartments was very similar, revealing a very airtight envelope. The average air change rates were 0.08 and 0.10 h−1 in the LR and in the BR, respectively. The corresponding standard deviations were 0.032 and 0.045 h−1. Although there are small differences in terms of absolute values, some variability can be pointed out as the coefficient of variation was 39.8 and 45.9%. Concerning the open door scenario, differences between the two rooms are more evident as the mean air change rate increases up to 0.98 h−1 in the LR and 0.53 h−1 in the BR. The results of the two compartments are now quite different and the most reliable reason to explain it is the door area, which is much larger in the LR. In terms of variability, the coefficient of variation decreased in LR (30.0%) and increased in the BR (64.4%). Considering the entire data set, the maximum air change rate was 1.40 h−1 and occurred in the LR for the door open scenario. Regarding the shape of the probability distribution, no clear trend was found for skewness and kurtosis in both compartments.
5.2. Carbon Dioxide (CO2) Measurements
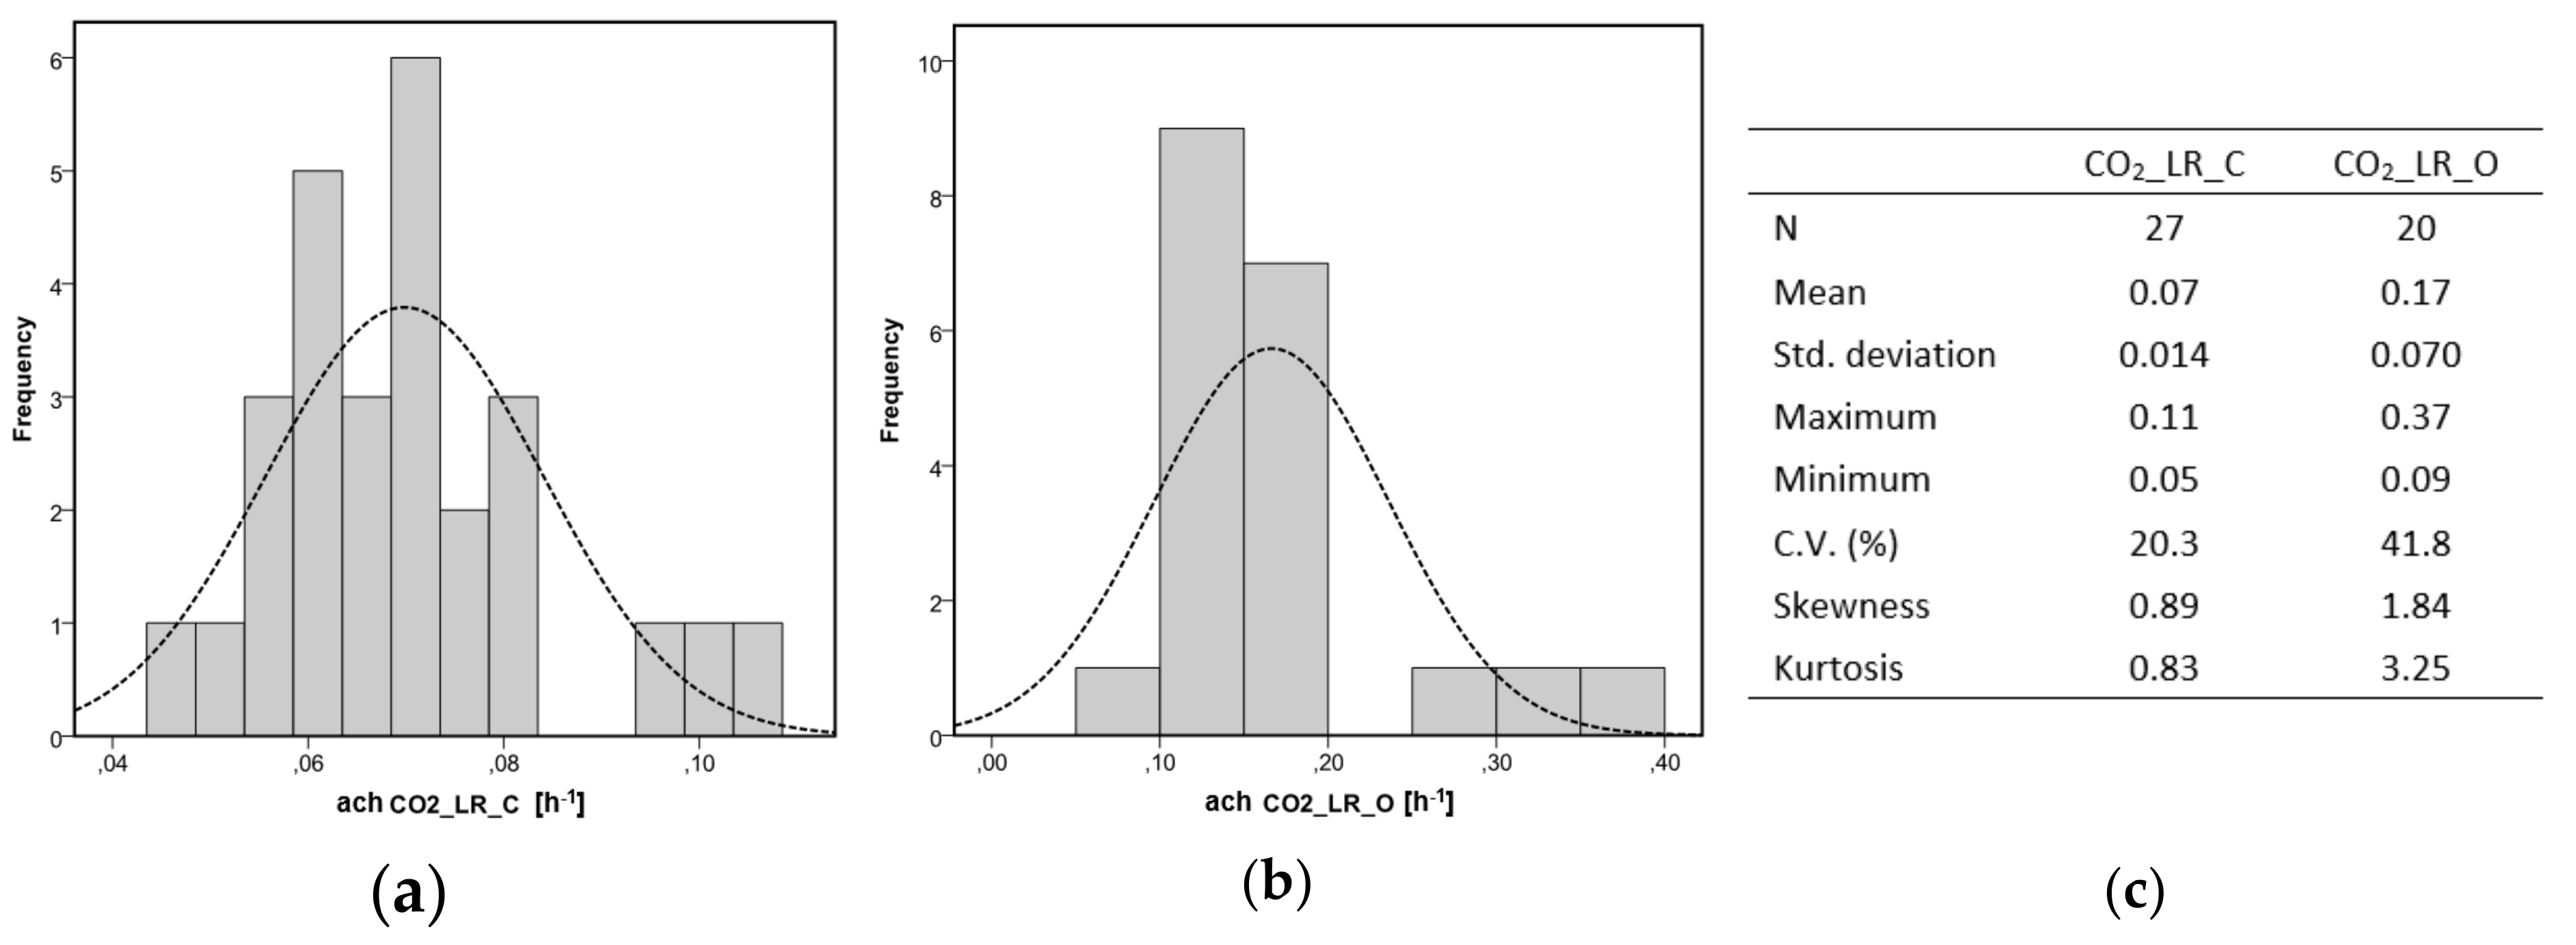
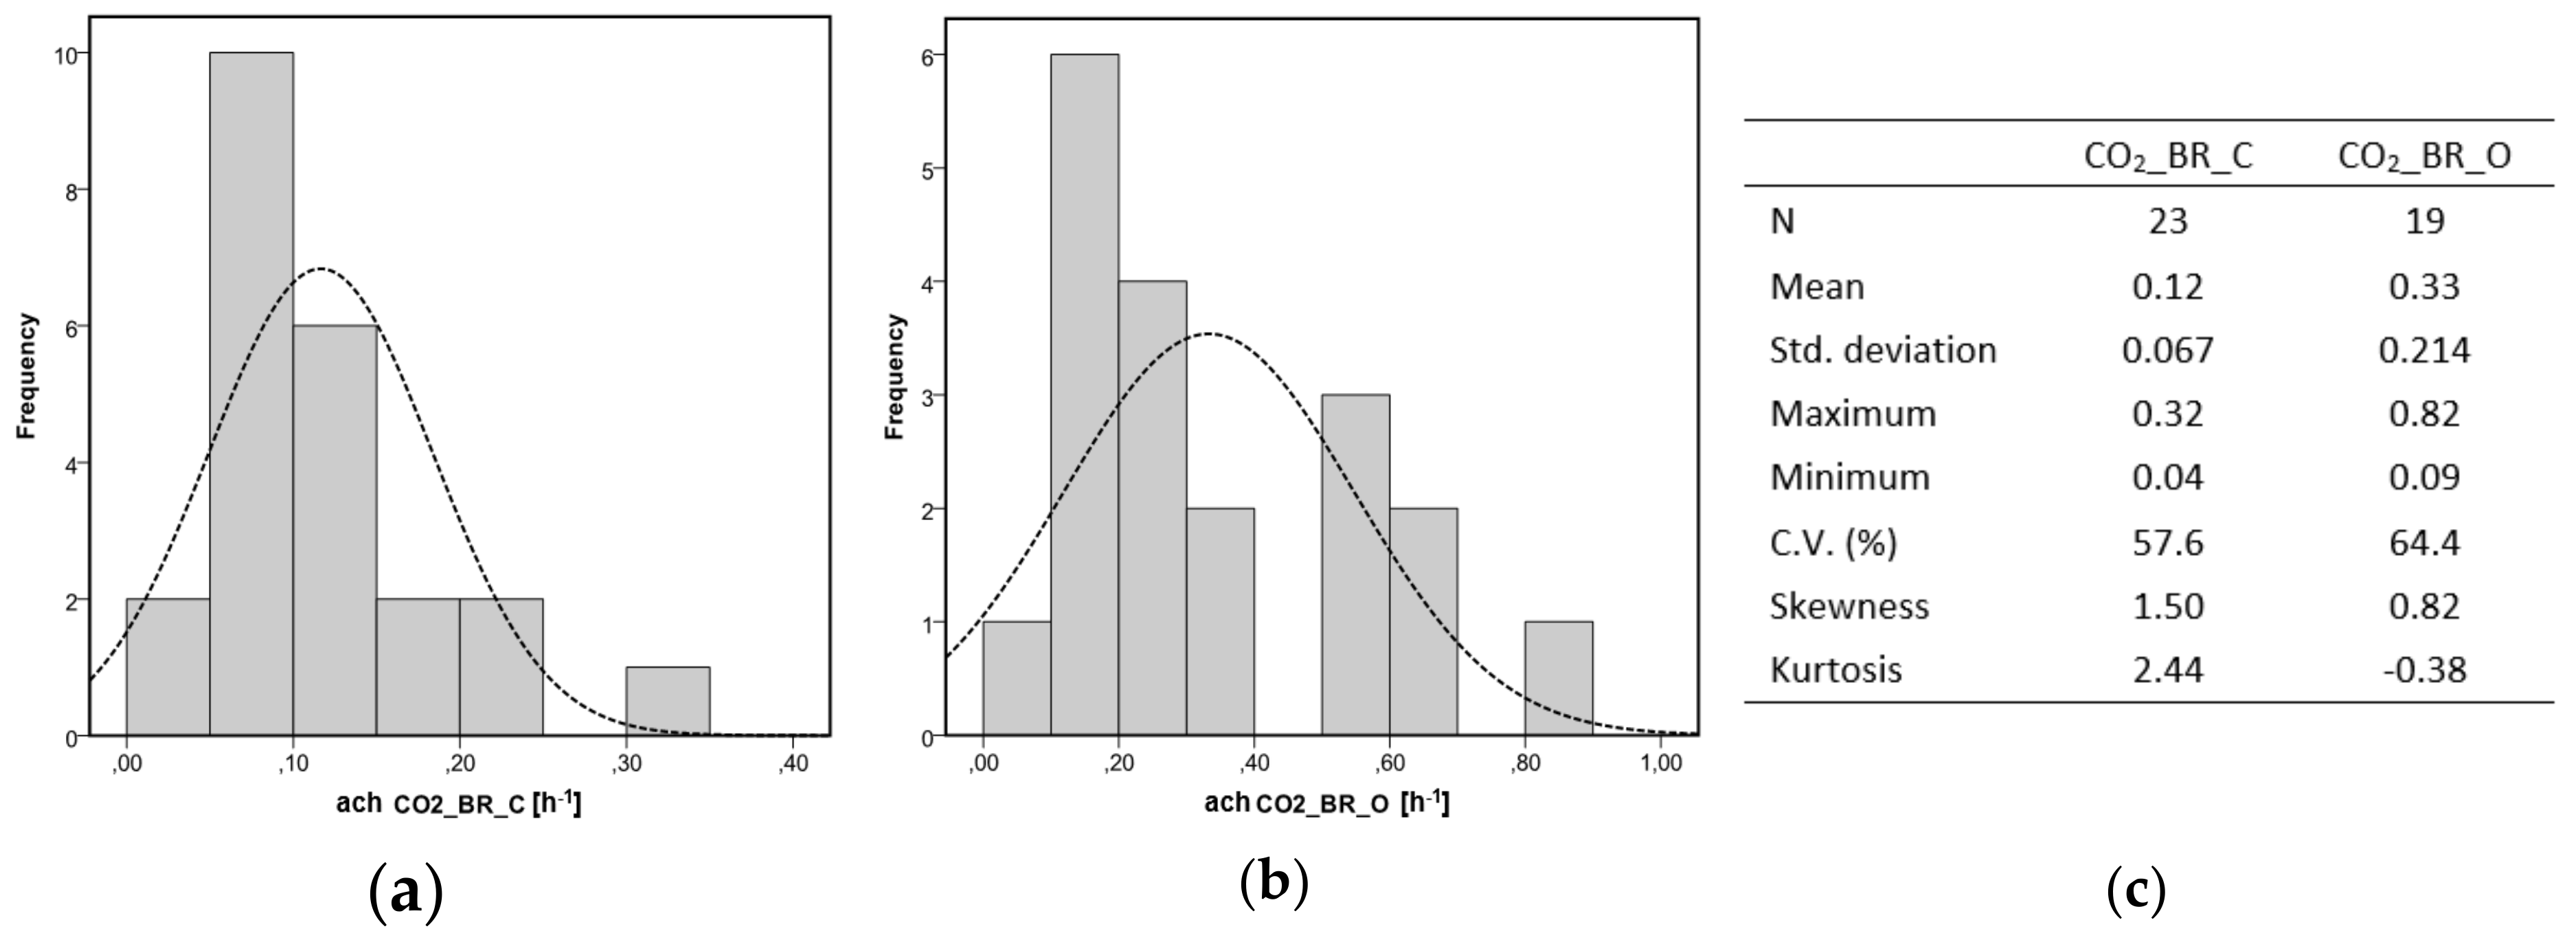
The procedure used for estimating the ventilation rates through the CO2 concentration requires selecting the period immediately after users leaving the compartment. In most cases, this situation occurred in the beginning of the night period in the LR and in the morning in BR. In the end, a total of 89 periods were selected, 47 in the LR and 42 in the BR. The results were statistically analysed and Figure 6 and Figure 7 depict the histogram of the results separately for each compartment. The most important descriptive statistical indicators are also included.
The average air change rates were 0.07 h−1 and 0.12 h−1 in the LR and in the BR, respectively, for the door closed scenario, and the corresponding standard deviations were 0.014 and 0.067 h−1. The coefficient of variation was significantly higher in the BR. In the open door scenario the air change rate was once again clearly different in the two spaces. In the LR the average air change rate was 0.17 h−1, while in the BR this value was 0.33 h−1. This was a rather unexpected result since the door area is higher in the LR, as previously discussed. The most logical explanation is the cross contamination of CO2 from the adjacent compartments. This issue is further discussed in Section 6.1. In line with the SF6 measurements, no clear trend was found for skewness and kurtosis in both compartments.
6. Discussion
6.1. Sulfur Hexafluoride (SF6) Versus Carbon Dioxide (CO2)
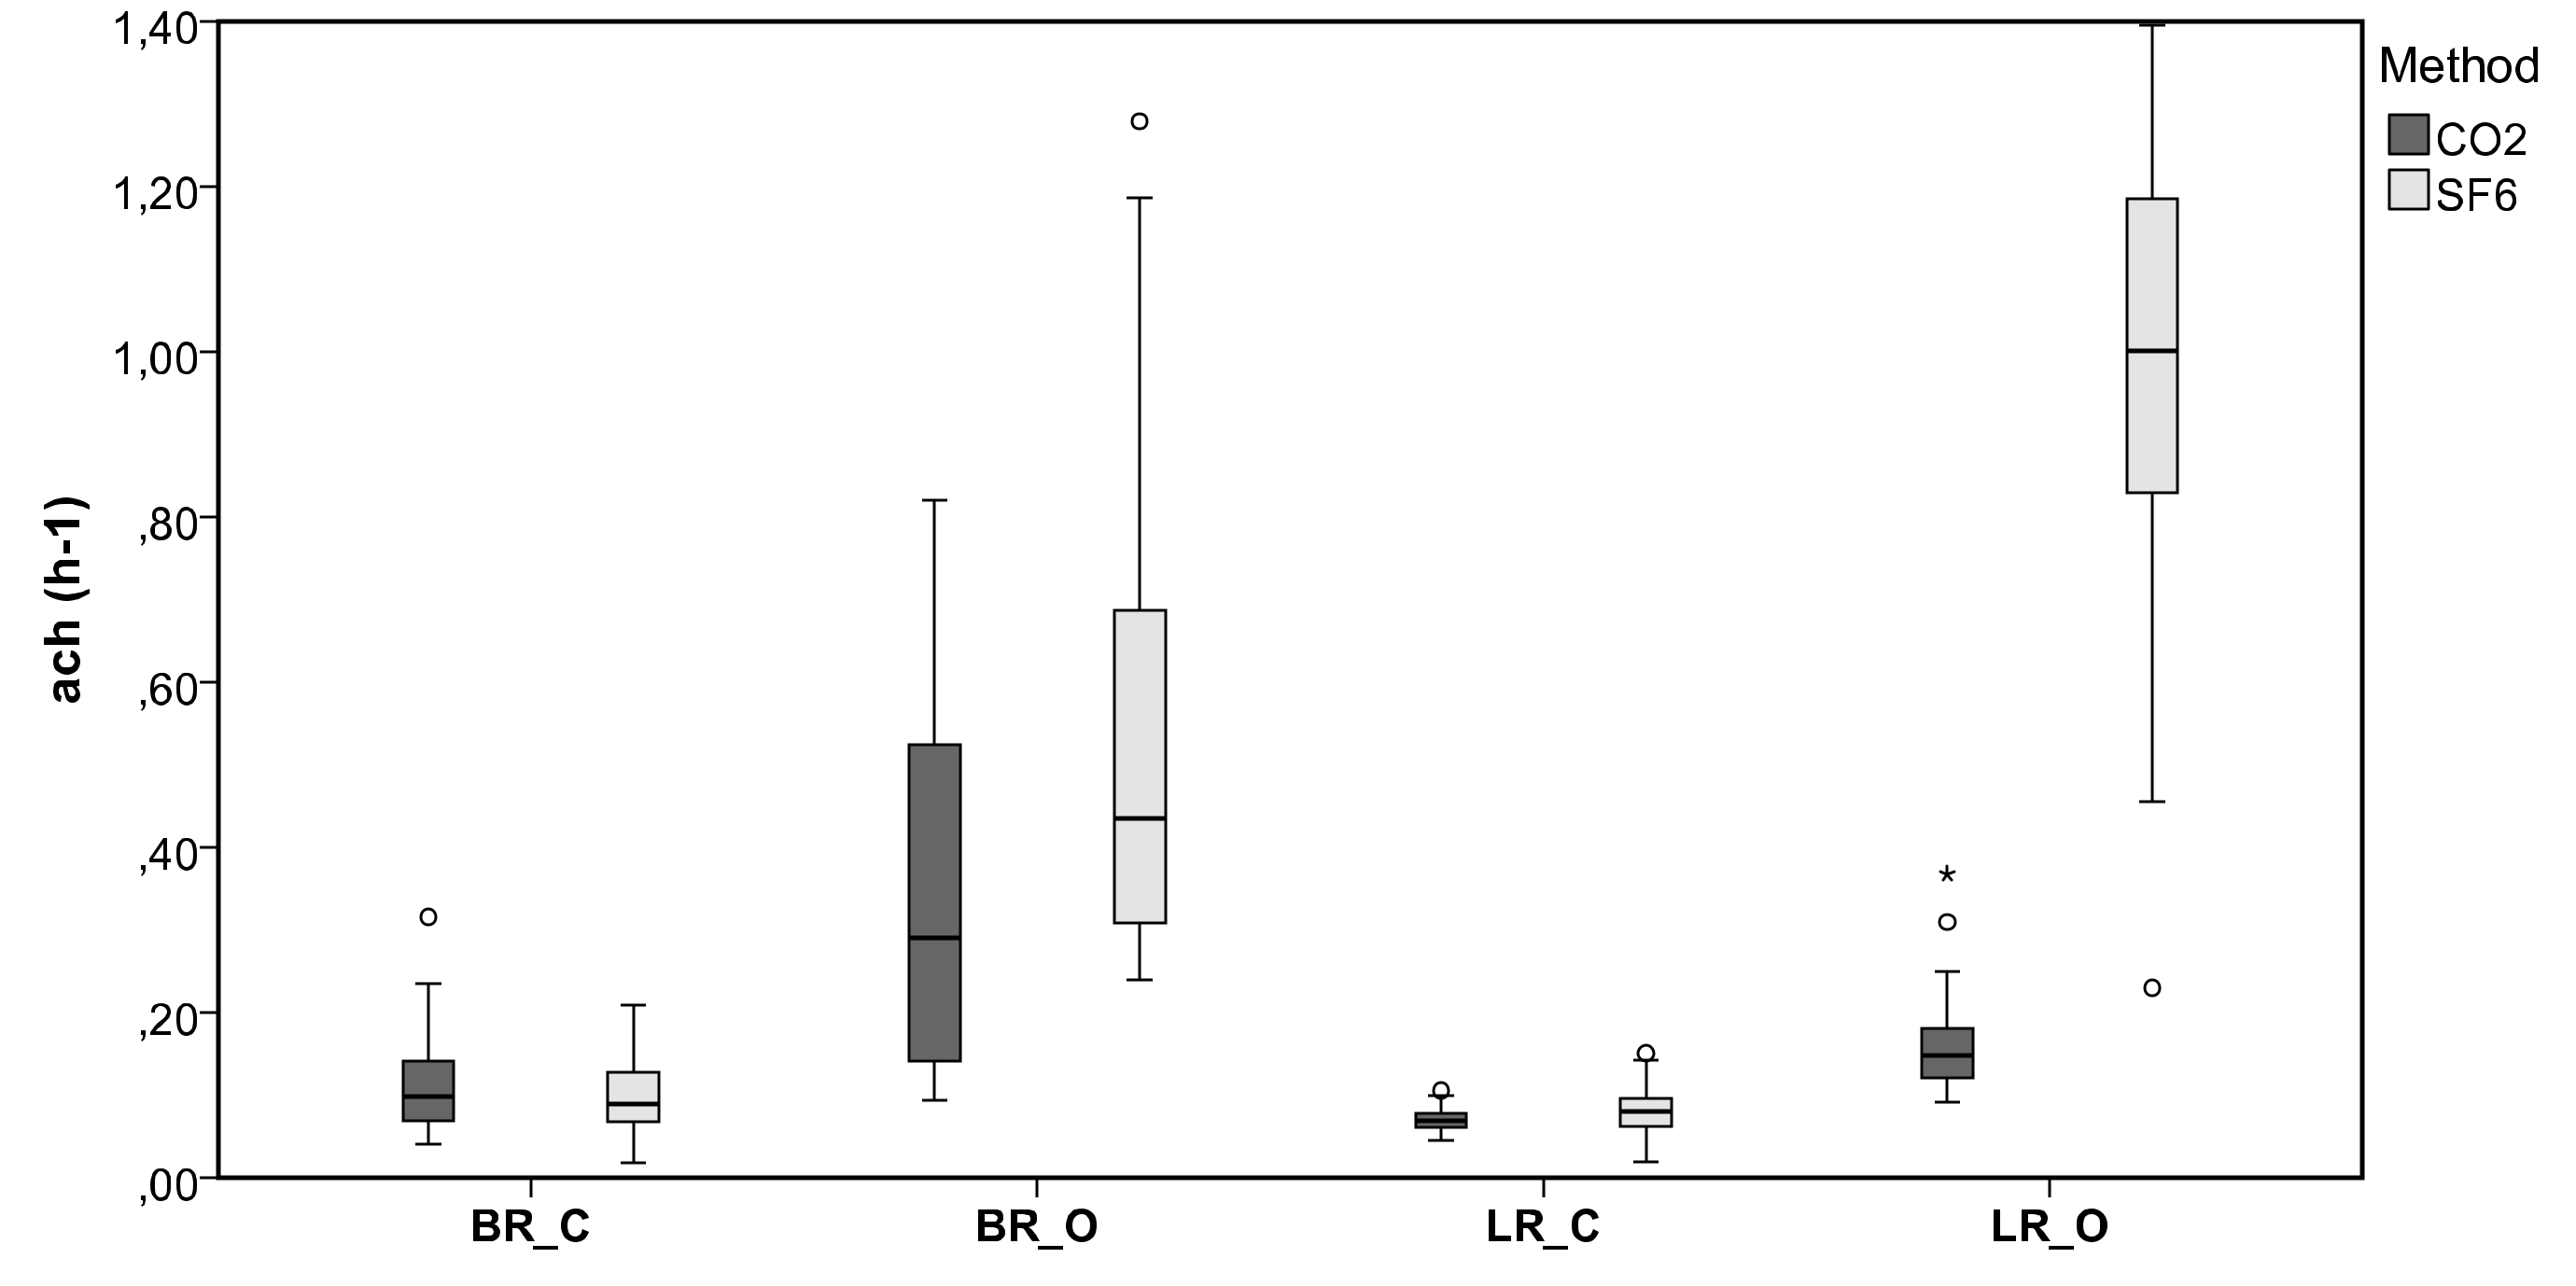
Although theoretically both tracer gases should produce the same result, in reality some important differences arise. To assess those differences, the results attained with the two methodologies were compared and a statistical analysis was performed. Figure 8 shows the box-plot representation of the results, separately for each compartment and boundary condition. Very similar distributions can be observed in the closed door scenarios; however, a very different situation can be observed when the door is open, especially in the living room. Moreover, a trend for higher ventilation rate is also noticeable when measured with SF6.
Using SF6 as tracer gas provides a more reliable result, since CO2 has a non-zero outdoor concentration, and presence of users in other spaces of the building affects the results due to the internal airflow. It is noteworthy that, when using occupant generated CO2 as tracer gas, most of the results in the BR were attained in the morning period, while the occupants were leaving the house. On the other hand, measurements in the LR occurred in the night, when the occupants left the space and went to bed in the upper floor. Thus, the results confirm that the impact of occupancy, even on another floor, cannot be neglected, since it leads to important differences in the ventilation rate. Indeed, in the LR, with the door open, the average air change rate attained in the measurements with SF6 was 0.98 h−1, decreasing up to 0.17 h−1 when using the occupant generated CO2 as tracer gas.
The statistical analysis of variance exposed differences between the data sets. The four groups of measurements were compared: living room with door closed (LR_C); living room with door open (LR_O); bedroom with door closed (BR_C); and bedroom with door open (BR_O). A significance level of 0.05 was used in the analysis.
In the closed door scenarios (LR_C and BR_C), the P-value of Levene’s test for equality of variances was 0.001 and the null hypothesis of equal variances was, thus, rejected. Therefore, additional robust tests of equality of means were carried out (Welch and Brown–Forsythe). Once again, no significant differences between means were found (P-value > 0.05).
In the open door scenarios, the result was different in the two spaces. In the BR_O, the resulting P-value of Levene’s test for equality of variances was 0.226, confirming the null hypothesis of equal variances. However, no significant differences between means were found (ANOVA; P-value > 0.05). On the other hand, in the LR_O, the resulting P-value of Levene’s test for equality of variances was 0.000, and the null hypothesis of equal variances was, once again, rejected. However, in the scenario, the additional robust tests of equality of means (Welch and Brown–Forsythe) revealed significant differences between means (P-value < 0.05).
6.2. Air Change Rate Versus Outdoor Conditions
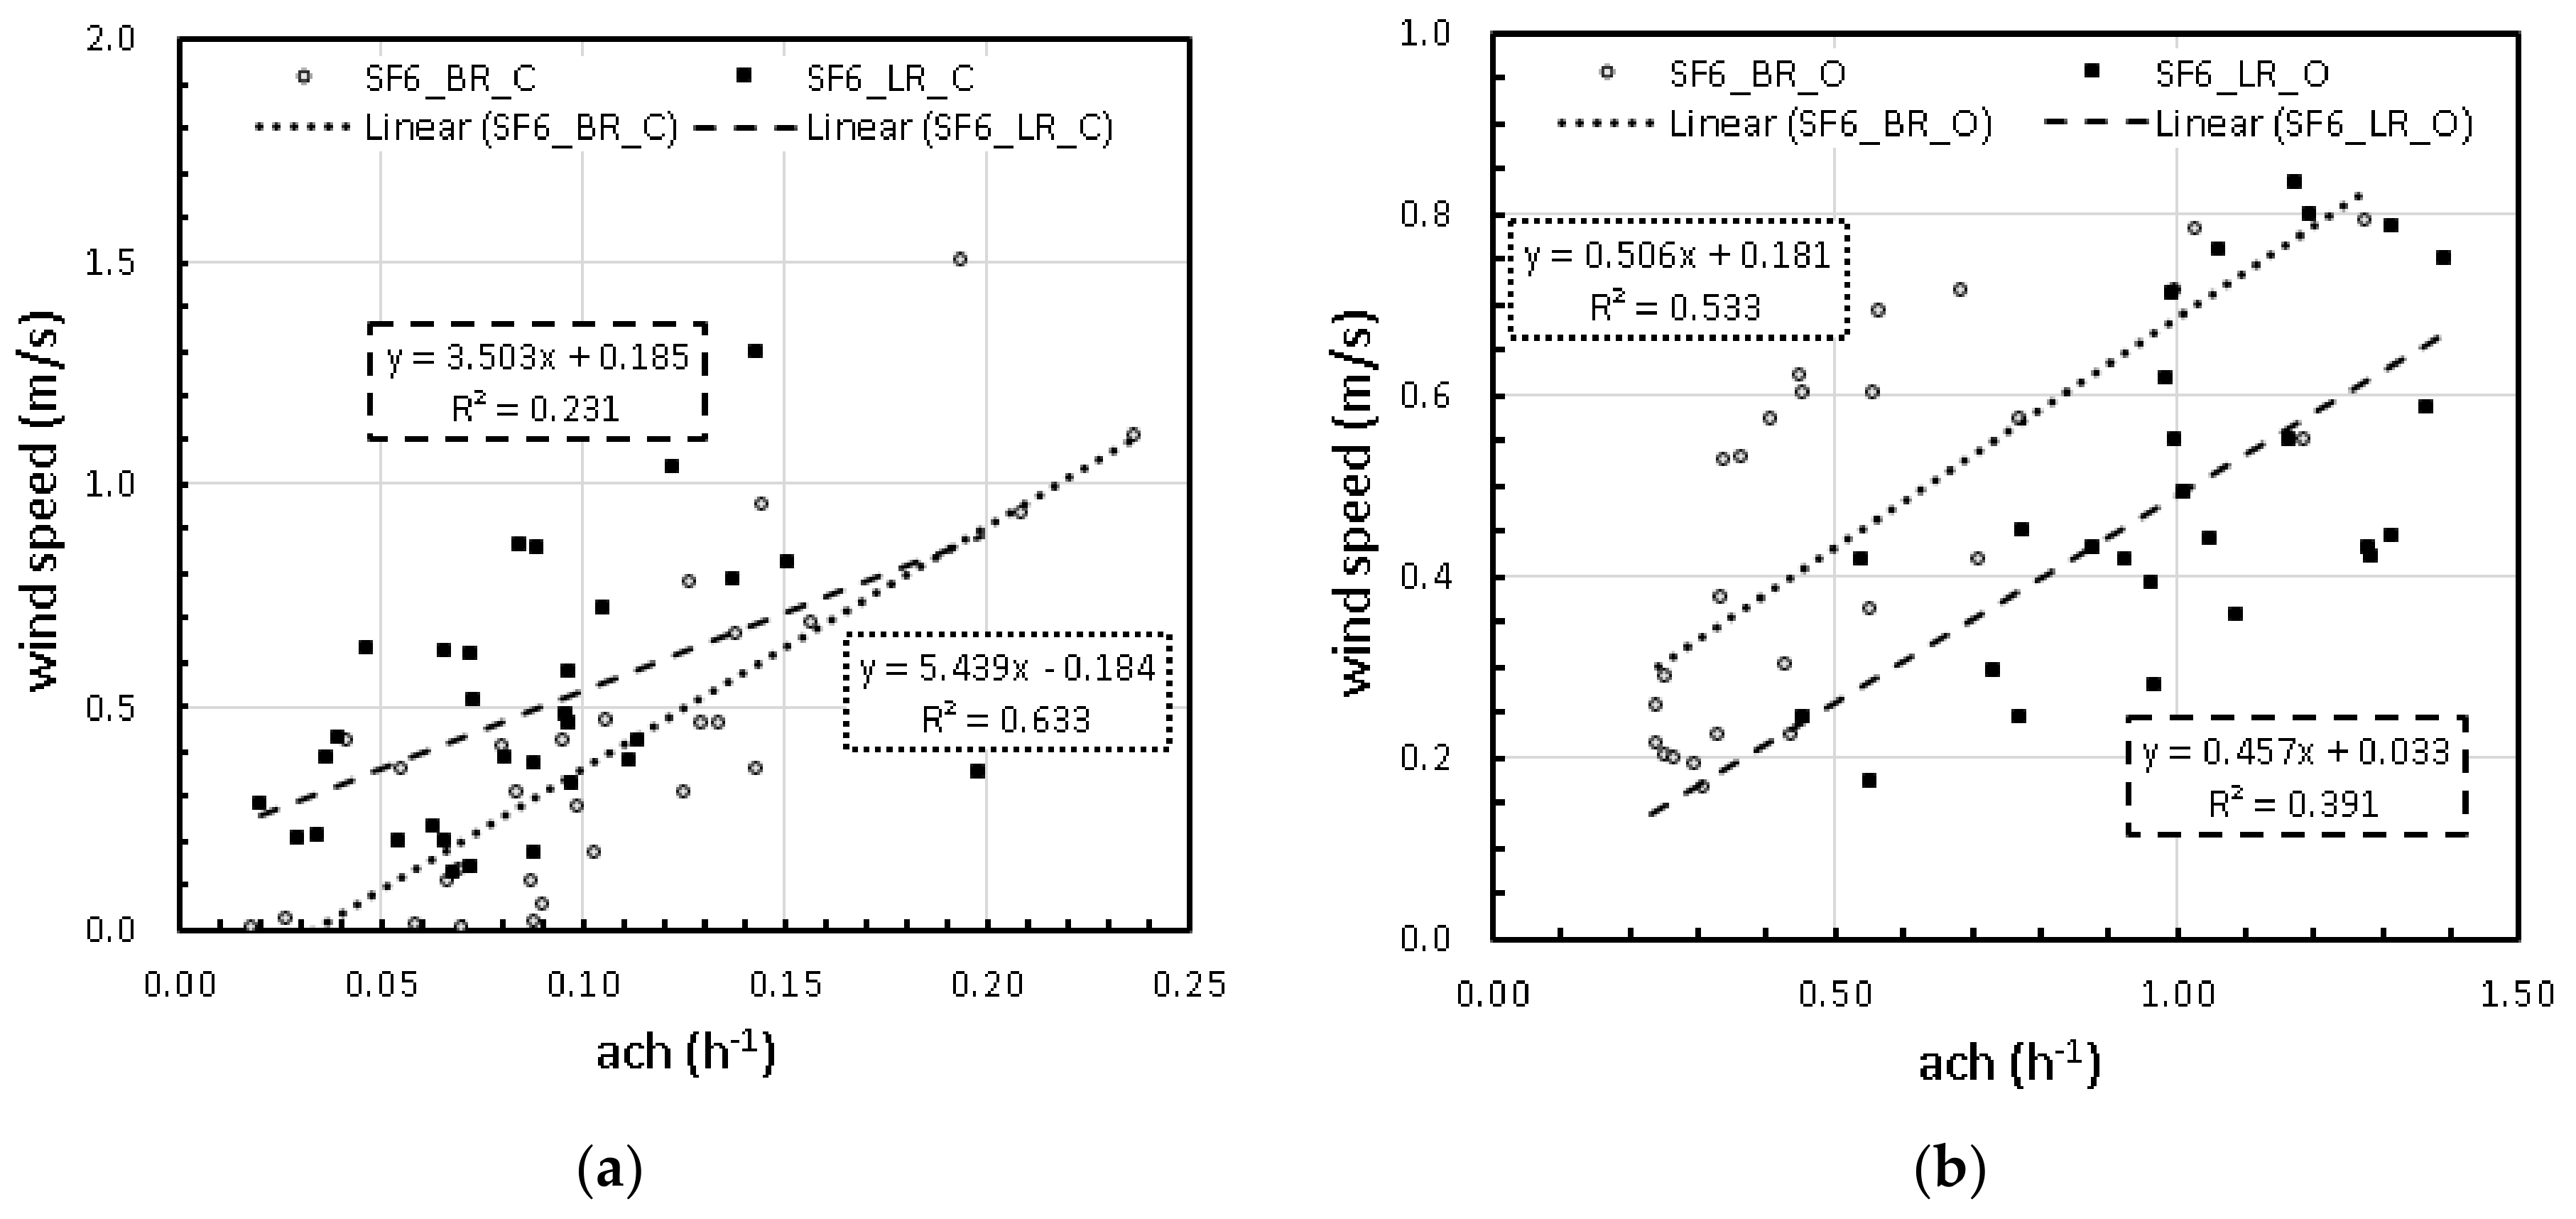
Wind speed and indoor–outdoor temperature difference (buoyancy forces) are the natural causes for pressure differences to occur and, therefore, the main drivers of natural ventilation. Since both are time-dependent, a relation between the measured air change rate and their absolute values is expected. Figure 9a,b plots the wind speed versus the air change rate attained in each compartment using SF6 as tracer gas, separately for the closed and the open door scenarios.
Despite the relatively low value of the wind speed, a trend for a correlation can be observed in the four data sets. However, the coefficient of determination, R2, is too low for a definitive conclusion as it varied between 0.231 and 0.634. This relation is stronger in the BR, which can be explained by the fact that this compartment is located on the first floor and, thus, more exposed to the wind pressure on the façade. If one compares the results attained with different boundary conditions, no clear difference can be identified.
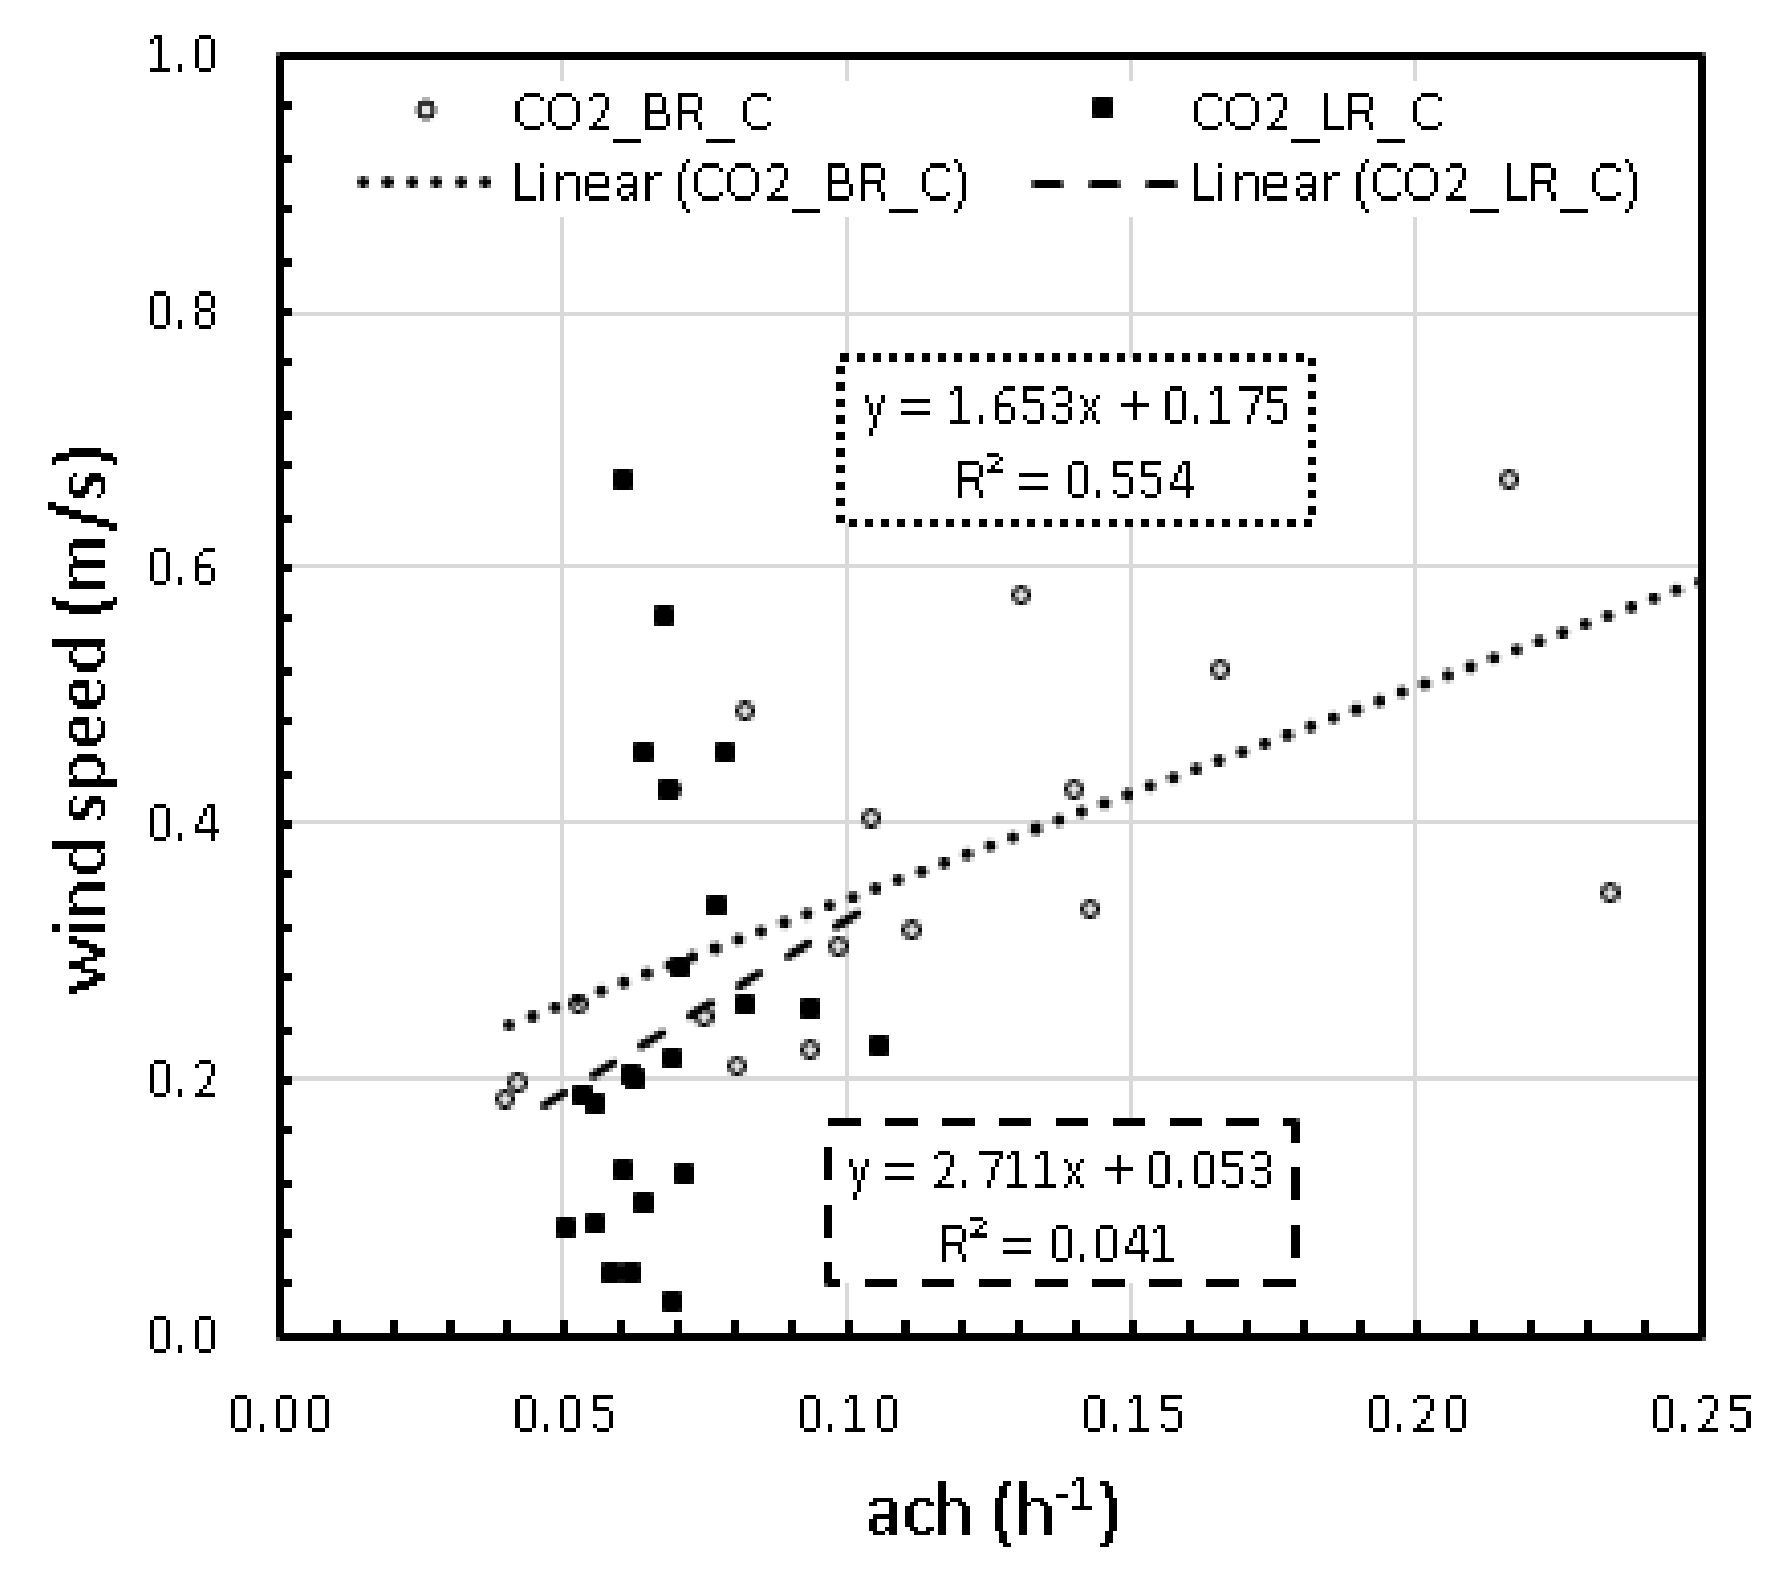
Figure 10 depicts the same result when using the occupant generated CO2 as tracer gas. For this situation, only the door closed scenario was tested, due to the cross-contamination problems identified in the open door scenario and already discussed in the previous section. The linear correlation between the two parameters is now only evident in the BR. Once again, the problems of cross-contamination in the LR can help explain this situation. Moreover, the wind speed found during these measurements is clearly lower with obvious consequences in the possible correlation between the two variables.
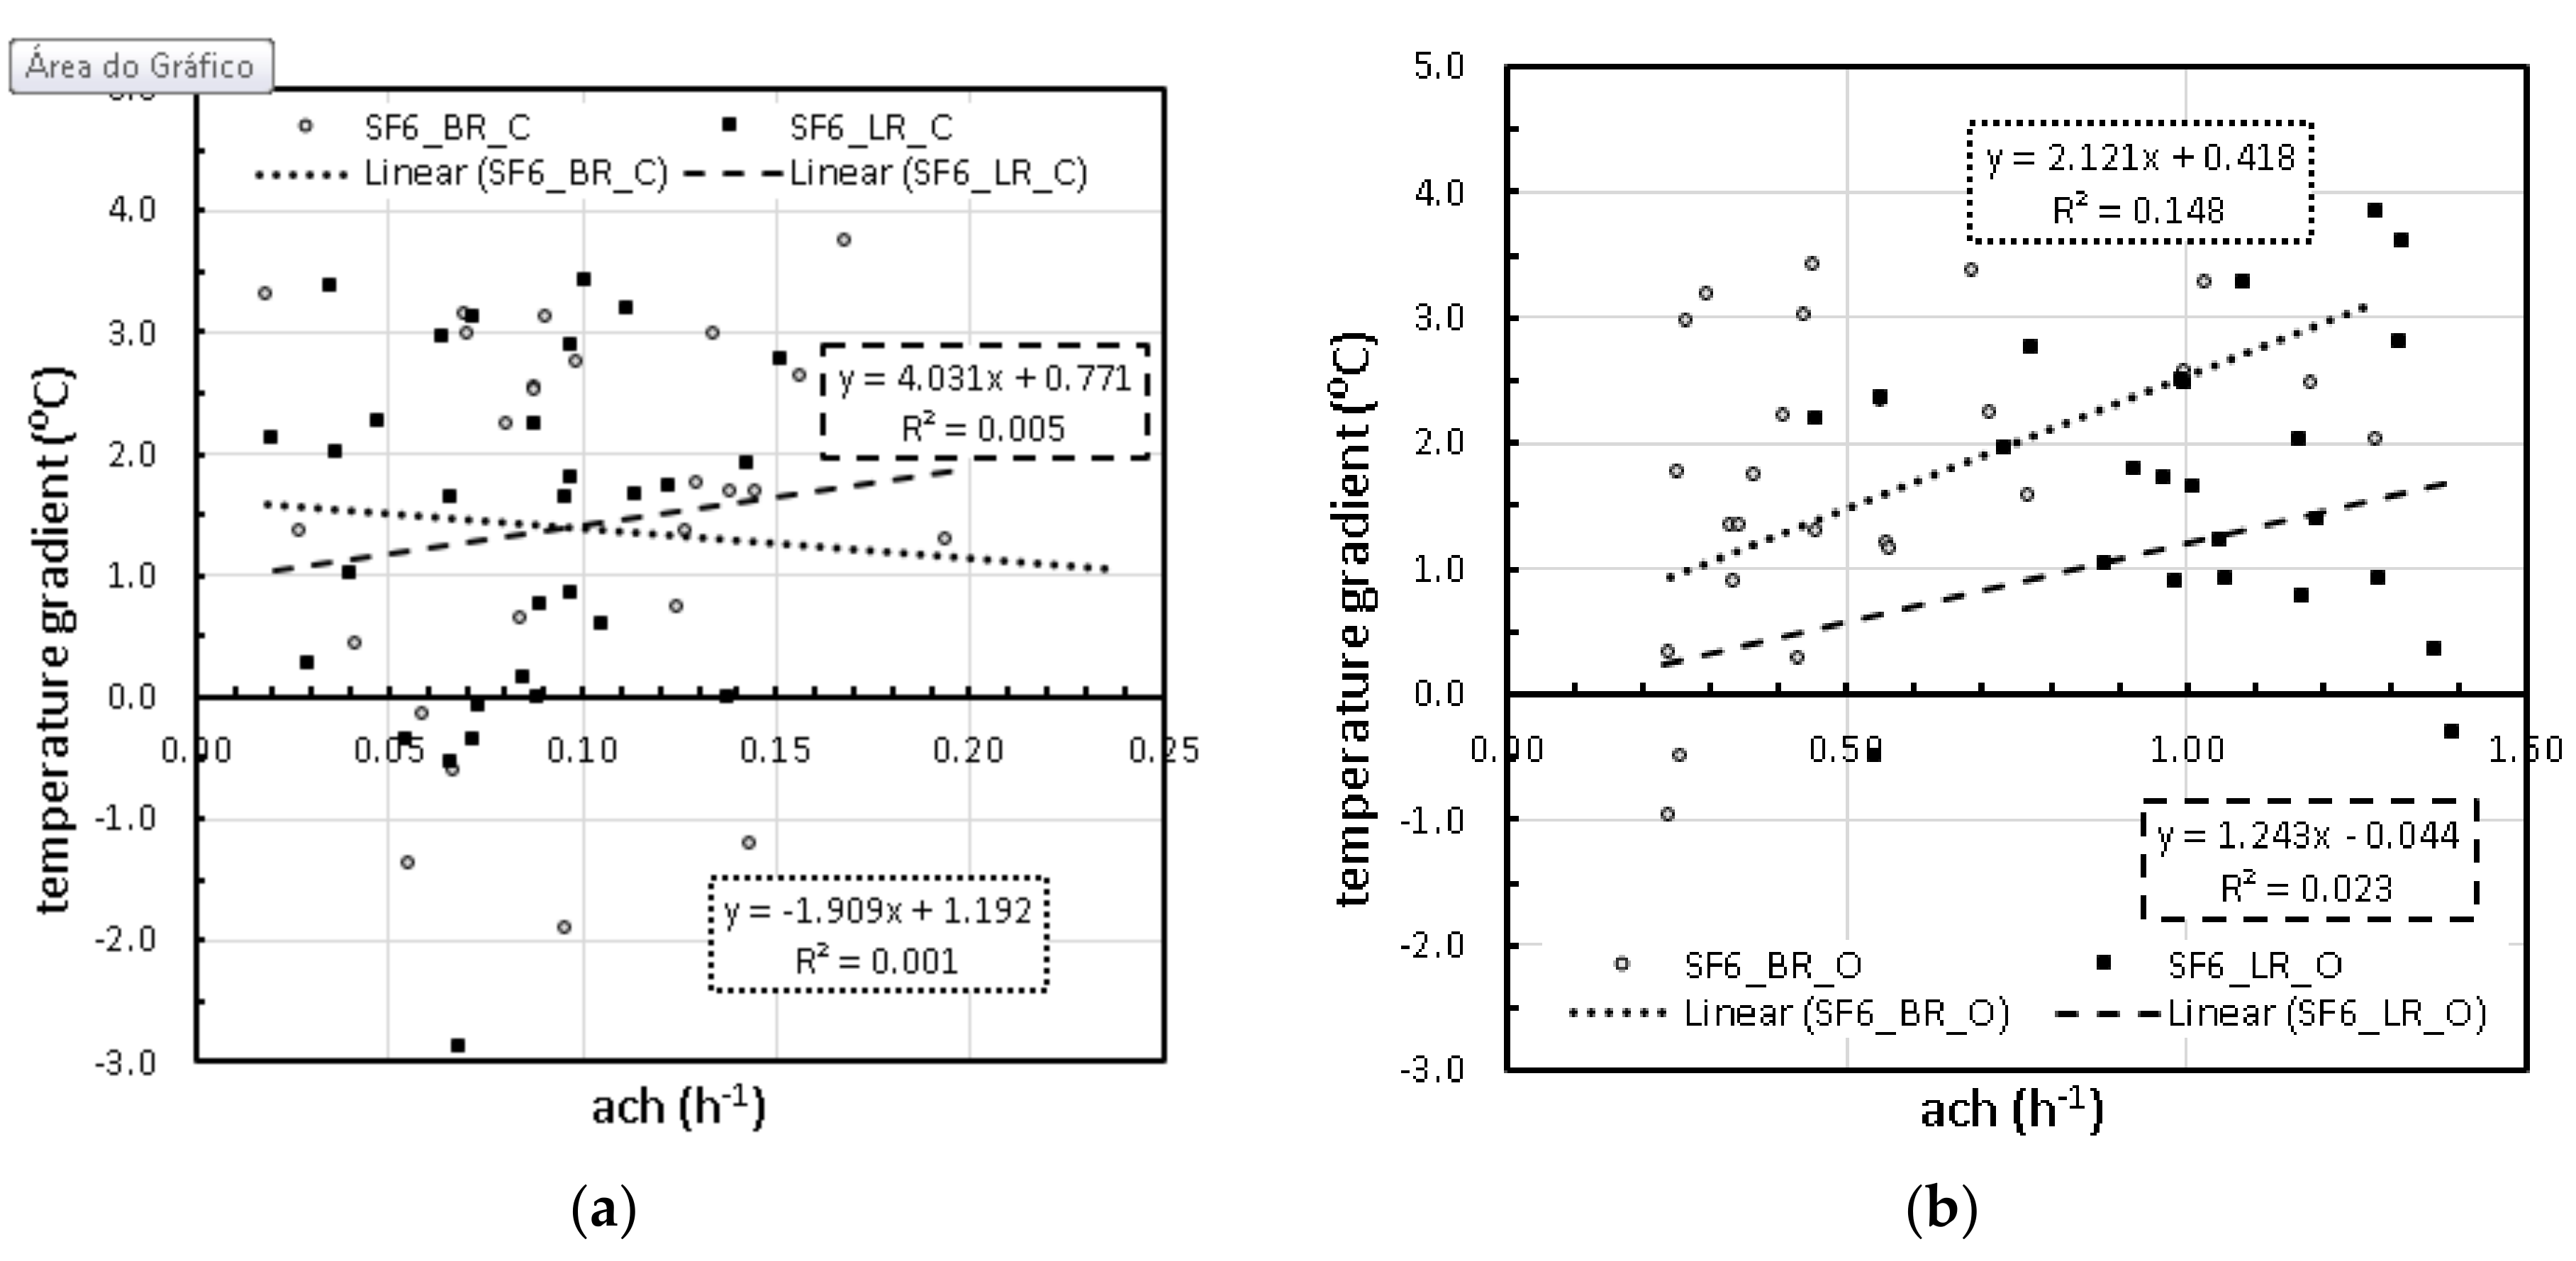
The same analysis is performed for the temperature gradient between the inside and the outside. Figure 11a,b shows the results separately for the open door and closed door scenarios, when using SF6 as tracer gas. Concerning the temperature gradient, a strong dispersion of the results was found and thus no clear relation was identified. Since the tests were performed during a mild period of the shoulder season, the temperature gradient was low (maximum value around 3.8 °C), which helps justify this result.
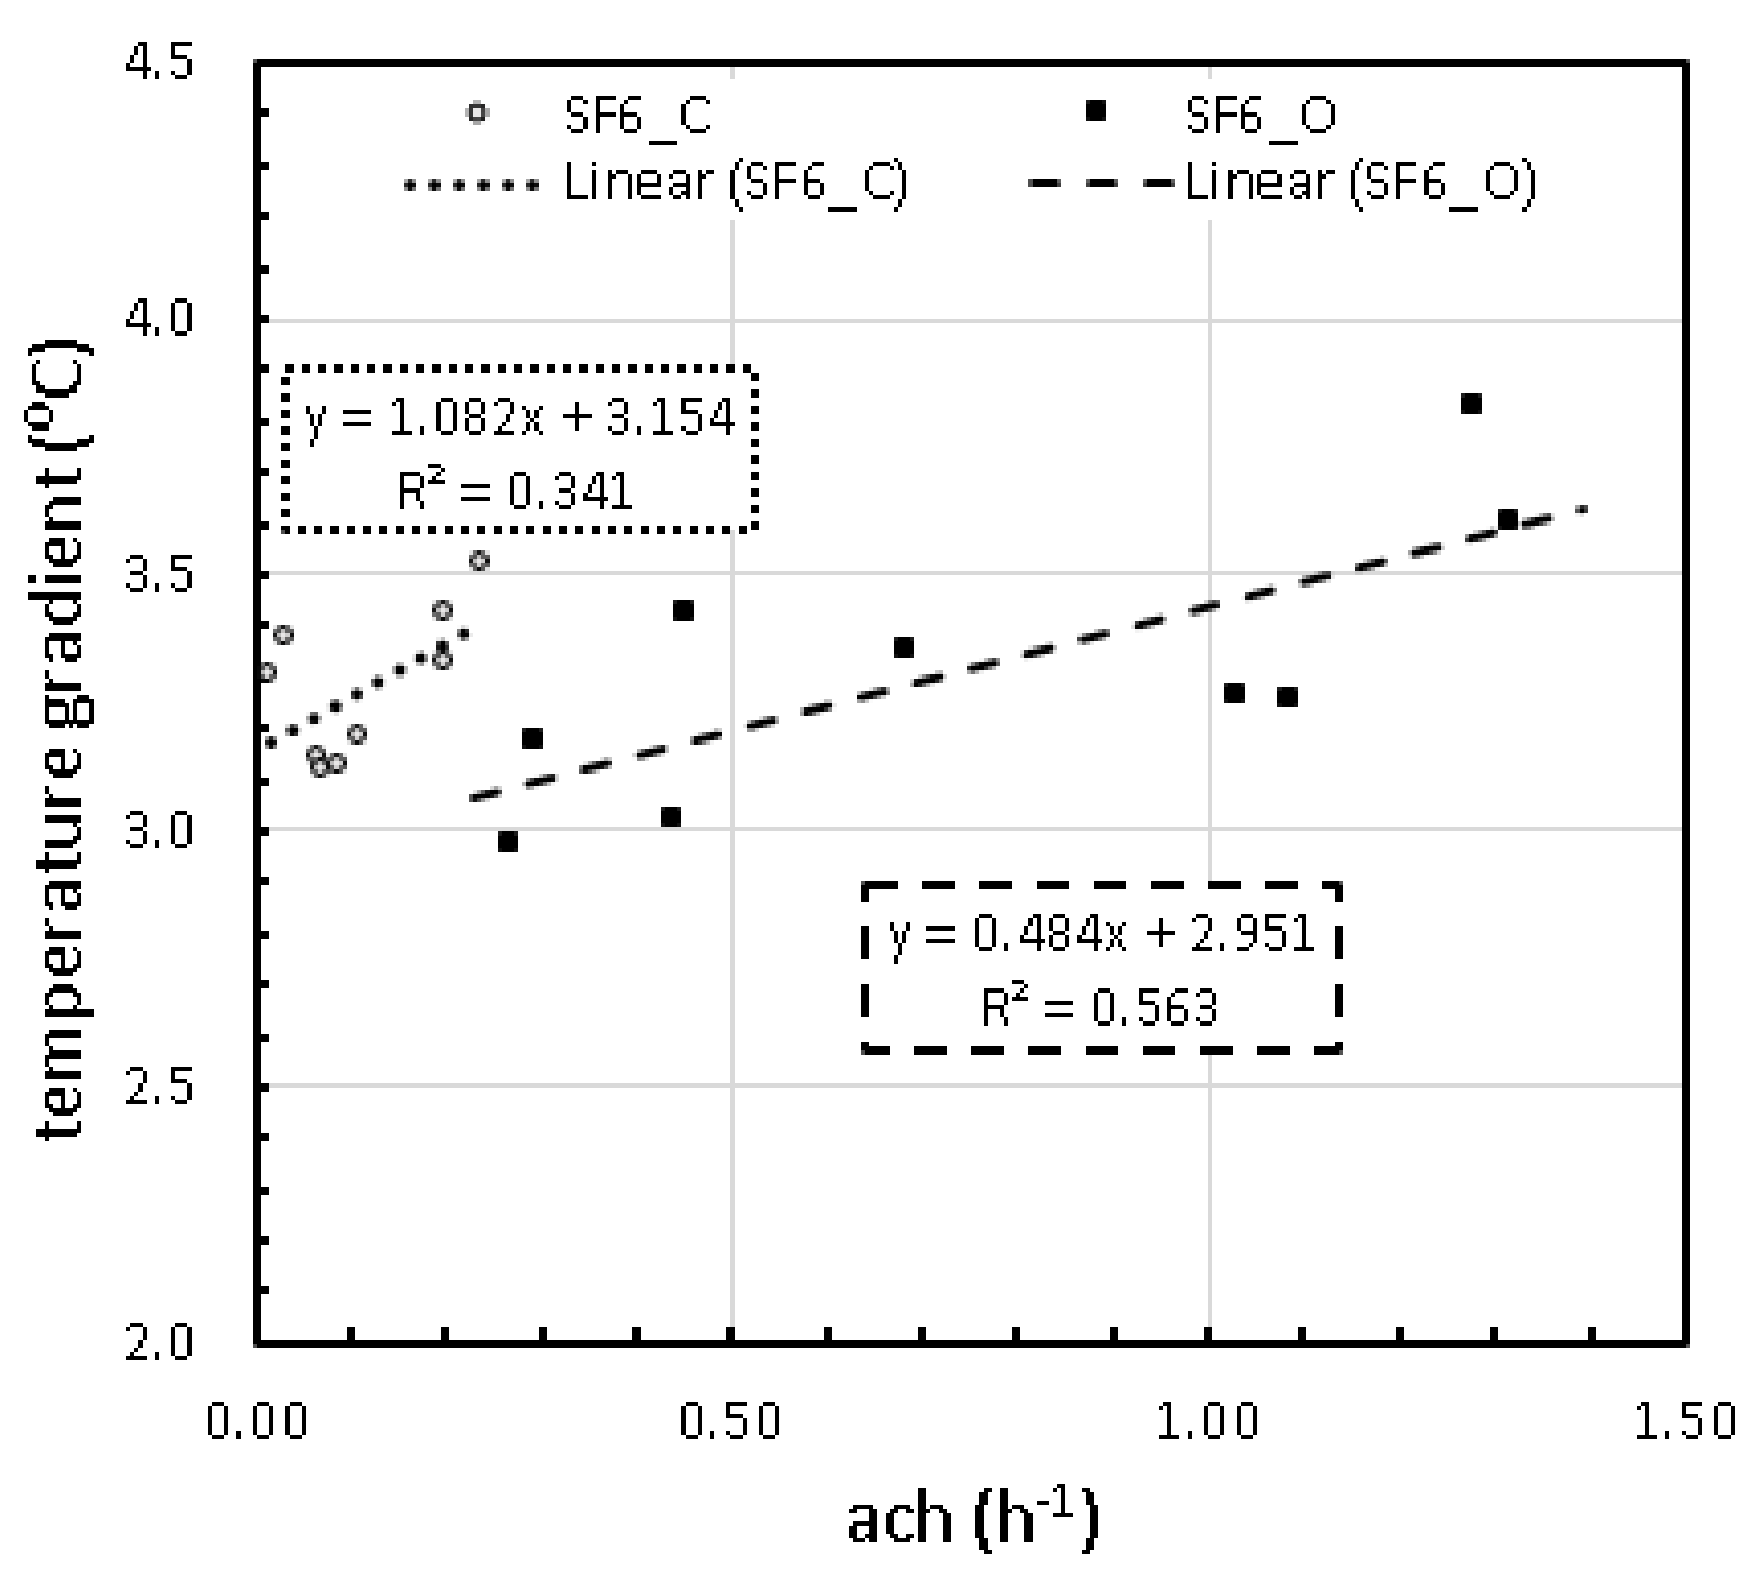
Despite this limitation of the sample, it was sought to identify the tests in which the effect of the temperature difference could be important. Thus, the tests in which this difference was higher than 3 °C were isolated. In order to give more robustness to this analysis by increasing the sample size, the measurements performed in the two compartments were combined, maintaining only the separation between the assemblies with the door open and the door closed. Figure 12 shows the results, where a trend for a linear correlation between the two variables can now be identified. The coefficient of determination, R2, attained for the closed door measurements was 0.34 and for the open door scenario was 0.56. Previously published research also led to identical findings as linear correlations between measurements of ventilation rate and temperature gradient were found but for temperature differences above 10 °C [12,40].
7. Conclusions
In naturally ventilated buildings, the air movement only depends on wind speed and indoor–outdoor temperature gradient (buoyancy forces). The time-dependency of these phenomena makes the accurate measurement of ventilation rates a rather complex task. In this paper, the variability in the measurement of ventilation rates using tracer gas and decay technique was evaluated and the following conclusions were drawn:
- If one intends to assess ventilation rates using tracer gas and the decay technique, one-time measurements are not enough. A large variability was found among the results with the coefficient of variation ranging from 20% (CO2_LR_C) to 64% (CO2_BR_O and SF6_BR_O). The variability was slightly higher in the BR, both for closed and open door scenarios, probably because it is located on the first floor. No large differences in variability were identified between open and closed door scenarios;
- Using occupant generated CO2 as tracer gas requires guaranteeing that no users are inside the dwelling when the decay starts. The results showed large differences in the air change rate attained using CO2 and SF6 in the LR, for the open door scenario, when the occupants left the space but were in the upper floor. These results confirm the impact of occupancy as a source of cross-contamination issues;
- The effect of wind speed was confirmed as the main trigger mechanism in this case study in the mid-season period, where the indoor–outdoor temperature difference is not so significant;
- Concerning the indoor–outdoor temperature gradient, the low values found in the majority of the measurements constrained the conclusions. However, the results indicated that a minimum difference of 3 °C was required to observe the effect of the temperature;
- Additional research is required as the effect of the wind direction was not considered. Future works include increasing the sample size and establishing the importance of wind direction and indoor–outdoor temperature gradient. The new results will also allow extending and validating the key achievements of the present work.
Author Contributions
Conceptualization, R.M.S.F.A. and E.B.; methodology, R.M.S.F.A. and E.B.; software, R.M.S.F.A.; formal analysis, R.M.S.F.A. and E.B.; investigation, P.M.; writing—original draft preparation, R.M.S.F.A.; writing—review and editing, E.B. All authors have read and agreed to the published version of the manuscript.
Funding
This research received no external funding.
Acknowledgments
This work was financially supported by: Base Funding—UIDB/04708/2020 of the CONSTRUCT—Instituto de I&D em Estruturas e Construções—funded by national funds through the FCT/MCTES (PIDDAC).
Conflicts of Interest
The authors declare no conflict of interest.
References
- European Parliament; Council of the European Union. Directive 2002/91/EC of the European Parliament and of the Council of 16 December 2002 on the energy performance of buildings. Off. J. Eur. Communities 2003, L1, 65–71. [Google Scholar]
- European Parliament; Council of the European Union. Directive 2010/31/EU of the European Parliament and of the Council of 19 May 2010 on the energy performance of buildings (recast). Off. J. Eur. Communities 2010, L153, 13–35. [Google Scholar]
- Meiss, A.; Feijó-Muñoz, J. The energy impact of infiltration: A study on buildings located in north central Spain. Energy Effic. 2014, 8, 51–64. [Google Scholar] [CrossRef]
- AIVC Air Infiltration and Ventilation Centre. Available online: www.aivc.org (accessed on 30 September 2020).
- Alfano, F.R.D.A.; Dell’Isola, M.; Ficco, G.; Tassini, F. Experimental analysis of air tightness in Mediterranean buildings using the fan pressurization method. Build. Environ. 2012, 53, 16–25. [Google Scholar] [CrossRef]
- Ramos, N.M.M.; Almeida, R.M.S.F.; Curado, A.; Pereira, P.F.; Manuel, S.; Maia, J. Airtightness and ventilation in a mild climate country rehabilitated social housing buildings—What users want and what they get. Build. Environ. 2015, 92, 97–110. [Google Scholar] [CrossRef]
- Pereira, P.F.; Ramos, N.M.M.; Almeida, R.M.S.F.; Simões, M.L.; Barreira, E. Occupant influence on residential ventilation patterns in mild climate conditions. Energy Procedia 2017, 132, 837–842. [Google Scholar] [CrossRef]
- Awbi, H.B. Ventilation of Buildings, 2nd ed.; E & FN Spon: New York, NY, USA, 2003. [Google Scholar]
- Wallace, L.A.; Emmerich, S.J.; Howard-Reed, C. Continuous measurements of air change rates in an occupied house for 1 year: The effect of temperature, wind, fans, and windows. J. Expo. Anal. Environ. Epidemiol. 2002, 12, 296–306. [Google Scholar] [CrossRef] [Green Version]
- Pan, W.; Liu, S.; Wang, Y.; Cheng, X.; Zhang, H.; Long, Z. Measurement of cross-ventilation rate in urban multi-zone dwellings. Build. Environ. 2019, 158, 51–59. [Google Scholar] [CrossRef]
- Yao, M.; Zhao, B. Measurement of natural ventilation rate of residences in Beijing, China. Procedia Eng. 2017, 205, 3435–3440. [Google Scholar] [CrossRef]
- Menezes, A.C.; Cripps, A.; Bouchlaghem, D.; Buswell, R. Predicted vs. actual energy performance of non-domestic buildings: Using post-occupancy evaluation data to reduce the performance gap. Appl. Energy 2012, 97, 355–364. [Google Scholar] [CrossRef] [Green Version]
- Ryan, E.M.; Sanquist, T.F. Validation of building energy modeling tools under idealized and realistic conditions. Energy Build. 2012, 47, 375–382. [Google Scholar] [CrossRef]
- Dasgupta, A.; Prodromou, A.; Mumovic, D. Operational versus designed performance of low carbon schools in England: Bridging a credibility gap. HVAC&R Res. 2012, 18, 37–50. [Google Scholar]
- De Wilde, P. The gap between predicted and measured energy performance of buildings: A framework for investigation. Autom. Constr. 2014, 41, 40–49. [Google Scholar] [CrossRef]
- Ogink, N.W.M.; Mosquera, J.; Calvet, S.; Zhang, G. Methods for measuring gas emissions from naturally ventilated livestock buildings: Developments over the last decade and perspectives for improvement. Biosyst. Eng. 2013, 116, 297–308. [Google Scholar] [CrossRef]
- Van Buggenhout, S.; Van Brecht, A.; Eren Özcan, S.; Vranken, E.; Van Malcot, W.; Berckmans, D. Influence of sampling positions on accuracy of tracer gas measurements in ventilated spaces. Biosyst. Eng. 2009, 104, 216–223. [Google Scholar] [CrossRef]
- Salehi, A.; Torres, I.; Ramos, A. Assessment of ventilation effectiveness in exiting residential building in mediterranean countries: Case study, existing residential building in Portugal. Sustain. Cities Soc. 2017, 32, 496–507. [Google Scholar] [CrossRef]
- Persily, A.K. Field measurement of ventilation rates. Indoor Air 2016, 26, 97–111. [Google Scholar] [CrossRef]
- Kalamees, T. Air tightness and air leakages of new lightweight single-family detached houses in Estonia. Build. Environ. 2007, 42, 2369–2377. [Google Scholar] [CrossRef]
- Fernández-Agüera, J.; Sendra, J.J.; Domínguez, S. Protocols for Measuring the Airtightness of Multi-Dwelling Units in Southern Europe. Procedia Eng. 2011, 21, 98–105. [Google Scholar] [CrossRef] [Green Version]
- Sinnott, D.; Dyer, M. Air-tightness field data for dwellings in Ireland. Build. Environ. 2012, 51, 269–275. [Google Scholar] [CrossRef]
- Barreira, E.; Almeida, R.M.S.F.; Moreira, M. An infrared thermography passive approach to assess the effect of leakage points in buildings. Energy Build. 2017, 140, 224–235. [Google Scholar] [CrossRef]
- Lerma, C.; Barreira, E.; Almeida, R.M.S.F. A discussion concerning active infrared thermography in the evaluation of buildings air infiltration. Energy Build. 2018, 168, 56–66. [Google Scholar] [CrossRef]
- Bracke, W.; Laverge, J.; Bossche, N.V.D.; Janssens, A. Durability and Measurement Uncertainty of Airtightness in Extremely Airtight Dwellings. Int. J. Vent. 2016, 14, 383–394. [Google Scholar] [CrossRef] [Green Version]
- Sherman, M.H. Tracer-gas techniques for measuring ventilation in a single zone. Build. Environ. 1990, 25, 365–374. [Google Scholar] [CrossRef]
- Chao, C.Y.; Wan, M.P.; Law, A.K. Ventilation performance measurement using constant concentration dosing strategy. Build. Environ. 2004, 39, 1277–1288. [Google Scholar] [CrossRef]
- Grimsrud, D.T.; Sherman, M.H.; Janssen, J.E.; Pearman, A.N.; Harrje, D.T. An intercomparison of tracer gases used for air infiltration measurements. ASHRAE Trans. 1980, 86, 258. [Google Scholar]
- Batterman, S. Review and Extension of CO2-Based Methods to Determine Ventilation Rates with Application to School Classrooms. Int. J. Environ. Res. Public Health 2017, 14, 145. [Google Scholar] [CrossRef]
- Edouard, N.; Mosquera, J.; van Dooren, H.J.C.; Mendes, L.B.; Ogink, N.W.M. Comparison of CO2- and SF6- based tracer gas methods for the estimation of ventilation rates in a naturally ventilated dairy barn. Biosyst. Eng. 2016, 149, 11–23. [Google Scholar] [CrossRef] [Green Version]
- Bjerg, B.; Zhang, G.; Madsen, J.; Rom, H.B. Methane emission from naturally ventilated livestock buildings can be determined from gas concentration measurements. Environ. Monit. Assess. 2012, 184, 5989–6000. [Google Scholar] [CrossRef]
- Vereecken, E.; Roels, S.; Janssen, H. In situ determination of the moisture buffer potential of room enclosures. J. Build. Phys. 2011, 34, 223–246. [Google Scholar] [CrossRef]
- Samer, M.; Ammon, C.; Loebsin, C.; Fiedler, M.; Berg, W.; Sanftleben, P.; Brunsch, R. Moisture balance and tracer gas technique for ventilation rates measurement and greenhouse gases and ammonia emissions quantification in naturally ventilated buildings. Build. Environ. 2012, 50, 10–20. [Google Scholar] [CrossRef]
- Cheng, P.L.; Li, X. Air Change Rate Measurements using Tracer Gas Carbon Dioxide from Dry Ice. Int. J. Vent. 2014, 13, 235–246. [Google Scholar] [CrossRef]
- Howard-Reed, C.; Wallace, L.A.; Ott, W.R. The Effect of Opening Windows on Air Change Rates in Two Homes. J. Air Waste Manag. Assoc. 2002, 52, 147–159. [Google Scholar] [CrossRef] [PubMed]
- Lee, S.; Park, B.; Kurabuchi, T. Numerical evaluation of influence of door opening on interzonal air exchange. Build. Environ. 2016, 102, 230–242. [Google Scholar] [CrossRef]
- ISO. Thermal Performance of Buildings. Determination of Air Change in Buildings. Tracer Gas Dilution Method; ISO 12569; International Organization for Standardization: Geneva, Switzerland, 2000. [Google Scholar]
- ASTM. Standard Test Method for Determining Air Change in a Single Zone by Means of a Tracer Gas Dilution; ASTM E 741; American Society for Testing and Materials: West Conshohocken, PA, USA, 2011. [Google Scholar]
- ASTM. Standard Guide for Using Indoor Carbon Dioxide Concentrations to Evaluate Indoor Air Quality and Ventilation; ASTM D 6245; American Society for Testing and Materials: West Conshohocken, PA, USA, 2012. [Google Scholar]
- Nabinger, S.; Persily, A. Impacts of airtightening retrofits on ventilation rates and energy consumption in a manufactured home. Energy Build. 2011, 43, 3059–3067. [Google Scholar] [CrossRef]
Figure 1.
Case study and location of the sensors: (a) Living room; (b) Bedroom.

Figure 2.
Indoor and outdoor air temperature during the monitoring period.

Figure 3.
Wind speed and direction during the monitoring campaign.

Figure 4.
Sulfur hexafluoride (SF6) measurements of the air change rate in the living room (LR): (a) Histogram—door closed (SF6_LR_C); (b) Histogram—door open (SF6_LR_O); (c) Descriptive statistics indicators.
Figure 4.
Sulfur hexafluoride (SF6) measurements of the air change rate in the living room (LR): (a) Histogram—door closed (SF6_LR_C); (b) Histogram—door open (SF6_LR_O); (c) Descriptive statistics indicators.

Figure 5.
Sulfur hexafluoride (SF6) measurements of the air change rate in the bedroom (BR): (a) Histogram—door closed (SF6_BR_C); (b) Histogram—door open (SF6_BR_O); (c) Descriptive statistics indicators.
Figure 5.
Sulfur hexafluoride (SF6) measurements of the air change rate in the bedroom (BR): (a) Histogram—door closed (SF6_BR_C); (b) Histogram—door open (SF6_BR_O); (c) Descriptive statistics indicators.

Figure 6.
Carbon dioxide (CO2) measurements of the air change rate in the living room (LR): (a) Histogram—door closed (CO2_LR_C); (b) Histogram—door open (CO2_LR_O); (c) Descriptive statistics indicators.
Figure 6.
Carbon dioxide (CO2) measurements of the air change rate in the living room (LR): (a) Histogram—door closed (CO2_LR_C); (b) Histogram—door open (CO2_LR_O); (c) Descriptive statistics indicators.

Figure 7.
Carbon dioxide (CO2) measurements of the air change rate in the bedroom (BR): (a) Histogram—door closed (CO2_BR_C); (b) Histogram—door open (CO2_BR_O); (c) Descriptive statistics indicators.
Figure 7.
Carbon dioxide (CO2) measurements of the air change rate in the bedroom (BR): (a) Histogram—door closed (CO2_BR_C); (b) Histogram—door open (CO2_BR_O); (c) Descriptive statistics indicators.

Figure 8.
Air change rate using Sulfur hexafluoride (SF6) and Carbon dioxide (CO2) as tracer gas.

Figure 9.
Air change rate versus wind speed: (a) Sulfur hexafluoride (SF6)—door closed; (b) Sulfur hexafluoride (SF6)—door open.
Figure 9.
Air change rate versus wind speed: (a) Sulfur hexafluoride (SF6)—door closed; (b) Sulfur hexafluoride (SF6)—door open.

Figure 10.
Air change rate versus wind speed: Carbon dioxide (CO2)—door closed.

Figure 11.
Air change rate versus indoor–outdoor temperature gradient: (a) Sulfur hexafluoride (SF6)—door closed; (b) Sulfur hexafluoride (SF6)—door open.
Figure 11.
Air change rate versus indoor–outdoor temperature gradient: (a) Sulfur hexafluoride (SF6)—door closed; (b) Sulfur hexafluoride (SF6)—door open.

Figure 12.
Air change rate versus indoor–outdoor temperature gradient: Sulfur hexafluoride (SF6)—only temperature differences higher than 3 °C.
Figure 12.
Air change rate versus indoor–outdoor temperature gradient: Sulfur hexafluoride (SF6)—only temperature differences higher than 3 °C.


Table 1.
Case study. Geometric characterization.
| Living Room | Bedroom | |
|---|---|---|
| Floor | Ground floor | First floor |
| Orientation | North | South |
| Area (m2) | 35 | 33 |
| Volume (m3) | 84.5 | 72.2 |
| Window area (m2) | 3.8 | 3.8 |
| Door area (m2) | 4.4 | 1.9 |
© 2020 by the authors. Licensee MDPI, Basel, Switzerland. This article is an open access article distributed under the terms and conditions of the Creative Commons Attribution (CC BY) license (http://creativecommons.org/licenses/by/4.0/).
Share and Cite
MDPI and ACS Style
Almeida, R.M.S.F.; Barreira, E.; Moreira, P. A Discussion Regarding the Measurement of Ventilation Rates Using Tracer Gas and Decay Technique. Infrastructures 2020, 5, 85. https://doi.org/10.3390/infrastructures5100085
AMA Style
Almeida RMSF, Barreira E, Moreira P. A Discussion Regarding the Measurement of Ventilation Rates Using Tracer Gas and Decay Technique. Infrastructures. 2020; 5(10):85. https://doi.org/10.3390/infrastructures5100085
Chicago/Turabian StyleAlmeida, Ricardo M. S. F., Eva Barreira, and Pedro Moreira. 2020. "A Discussion Regarding the Measurement of Ventilation Rates Using Tracer Gas and Decay Technique" Infrastructures 5, no. 10: 85. https://doi.org/10.3390/infrastructures5100085