

Source-Separated Industrial Wastewater Is a Candidate for Biogas Production through Anaerobic Digestion

1
ARC Training Centre for the Transformation of Australia’s Biosolids Resource, RMIT University, Bundoora, VIC 3083, Australia
2
School of Science, RMIT University, Bundoora, VIC 3083, Australia
*
Author to whom correspondence should be addressed.
Fermentation 2024, 10(3), 165; https://doi.org/10.3390/fermentation10030165
Submission received: 30 January 2024
/
Revised: 9 March 2024
/
Accepted: 12 March 2024
/
Published: 14 March 2024
(This article belongs to the Special Issue Energy Recovery Potential from Wastewater through Anaerobic Treatment)
Abstract
:Anaerobic digestion is a potential treatment for industrial wastewater that provides valuable end-products, including renewable energy (biogas). However, waste streams may be too variable, too dilute at high volumes, or missing key components for stable digestion; all factors that increase costs and operational difficulty, making optimisation crucial. Anaerobic digestion may benefit from process intensification, particularly the novel combination of high-strength source-separated wastewater to minimise volume, together with the use of biosolids biochar as a chemical and microbial stabiliser. This study investigates the stability, yield, and microbial community dynamics of the anaerobic digestion of source-separated industrial wastewater from a food manufacturer and a logistics company, using biosolids biochar as an additive, focusing on gas and volatile fatty acid (VFA) production, process stability, and the microbial community using bench-scale semi-continuous reactors at 30- and 45-day hydraulic retention time (HRT). While gas yields were lower than expected, stability was possible at high HRT. Methane production reached 0.24 and 0.43 L day−1 per litre reactor working volume at 30- and 45-day HRT, respectively, despite high VFA concentration, and was linked to the relative abundance of Methanosarcina in the microbial community. Interactions between substrate, VFA concentration, and the microbial community were observed. Biochar-assisted anaerobic digestion holds promise for the treatment of source-separated wastewater.
1. Introduction
Economic, regulatory, and environmental legislation often impact industries that discharge wastewater. Given the possible environmental implications associated with the release of inadequately treated liquid waste, limits have been placed by regulators and water service providers on the composition and volumes of effluent discharged. Achieving these conditions can be costly; however, with a shift in perspective towards a circular economy, previously unwanted components of wastewater may represent valuable resources to harvest [1]. Biogas production through anaerobic digestion is one method to convert otherwise undesirable elements of wastewater into a useful product.
Anaerobic digestion is the conversion of substrate by microorganisms in the absence of oxygen. In the case of biogas from wastewater, complex organic molecules such as proteins, fats, and carbohydrates undergo a multiple-stage process, summarised in Figure 1, ultimately producing a mixture of methane, carbon dioxide, and trace gases such as hydrogen sulphide. This biogas can be used directly in boilers and combined heat and power (CHP) units [2] or upgraded and sold back into the gas network [3].
The extent and stability of digestion, and therefore the composition and volume of biogas, are affected by a range of parameters, including design decisions such as reactor configuration [6], temperature [7,8], and retention time [8], together with chemical properties of the feedstock and reaction medium, such as pH and elemental balance, and the microbial community [9].
Utilisation of process intensification principles and the potential efficiencies that can result may increase yields at the cost of process stability [10,11,12,13]. For anaerobic digestion to be an attractive process option at scale, a compromise must be made between yields, reactor volume, and effluent volume treated, i.e., between capital costs, operation costs, and production and treatment performance. Decreased hydraulic retention time (HRT), a result of low reactor volume-to-throughput ratio, has been shown to decrease both yield and process stability in continuous stirred-tank reactors (CSTRs) [14,15]. The causative nature described by these findings is limited by the inverse relationship between organic loading rate (OLR) and HRT when feed concentration is held constant. It is widely reported that when OLR is too high, accumulation of volatile fatty acids (VFAs) can result, thereby lowering pH [11,16]. This inhibits methanogenic microbes, leading to decreased biogas yields, further accumulation of VFA, and eventually complete reactor failure [5,17]. When OLR is kept constant, HRT may be reduced, with minimal effects on gas production, as a result of significant changes in the microbial community [11]. An increase in OLR can also be beneficial due to an increase in the overall volume of gas produced and the yield per unit of solids [18]. Alkalinity and pH can be controlled through chemical additives before and during digestion [16,19,20], allowing higher OLR. Higher feed organics concentration, and therefore higher OLR at a given HRT, may be achieved through waste source separation. In the meat processing industry, improved resource recovery has been proposed by selecting and diverting internal waste streams for specialised treatment [21]. Through the selection of known waste streams as the feedstock for anaerobic digestion, substrate characteristics can be selected, including favourable carbon-to-nitrogen ratios or avoiding inhibitors, in a way that is not possible in combined streams.
A recent development in the study of anaerobic digestion is the use of biochar as an additive. Biochar is a solid product from the thermochemical treatment of organic materials, including plant biomass [22] and biosolids [23]. After conversion from biomass at high temperatures (300–1000 °C) in low oxygen environments, this product has a high surface area and can be further treated to modify characteristics including pH, porosity, and adsorption potential. Biochars from various sources, with and without treatment, have been shown to increase biogas yields by up to 88% in inhibitory conditions [24,25,26] through various mechanisms, including adsorbing inhibitors, controlling pH, providing electron transfer sites, and sheltering microbes [27,28]. Currently, most anaerobic digestion studies investigating biochar use lignocellulosic substrates, such as wood and woody agricultural waste, for the formation of biochar [24,27,29,30,31], with some biochar being made from manure [32]. Biosolids, also known as stabilised sewage sludge, can also be used as a substrate for biochar production; however, the main application for biosolids-derived biochar has been as a soil amendment [33,34]. Comparison of biochars produced from different sources shows visible structural differences, varying chemical composition, and a range of effects upon application [35]. The few studies of biosolids biochar as an additive for biogas production have used manure [25] or sewage sludge as the digestion substrate [36,37].
Microbes catalyse reactions across all phases of anaerobic digestion; hence, the analysis of microbial composition is essential for process optimisation. Genera such as Olsenella [38], Syntrophomonas [39], and Microthrix [40] produce enzymes that hydrolyse large organic molecules into monomers and oligomers [41]. These smaller organic molecules are then broken down further into VFAs by Sporanaerobacter [42], Succiniclasticum [43], and others. Acetogens, including Romboutsia [44] and NK4A214 [45], produce acetate before methanogens such as Methanobrevibacter and Methanosarcina convert H2, CO2, and acetate into methane [46]. Conversely, some bacteria, including Microthrix [40] and Gordonia [47], are implicated in foaming and inhibition events that negatively impact the operation of digesters.
The benefits of anaerobic co-digestion of industrial wastewater with biosolids-derived biochar for biogas production have not been sufficiently explored.
The aim of this study was to investigate the stability, yield, and microbial community dynamics of the semi-continuous anaerobic digestion of source-separated, high-strength industrial wastewater using biosolids biochar as an additive.
2. Materials and Methods
2.1. Sample Selection and Collection
Two industrial sites in the Greater Western Water catchment area of Melbourne, Australia, were chosen due to initial research identifying their high wastewater biomethane potential (BMP) [48]. For Site A, a food manufacturing facility, this was the discharge from the regular cleaning of a cooker vessel. For Site B, a logistics business, this was a general washdown pit. Representative samples (60 L each) were collected from the respective holding tank and drain pit and stored at 4 °C until required for use as feedstock. Total solids (TS) and volatile solids (VS) of samples were calculated using standard gravimetric methods [49], measuring the mass of samples after drying for 24 h at 105 °C and then after 2 h at 550 °C. Chemical oxygen demand (COD) and total nitrogen of the substrates were measured using Hach Test ‘N Tube™ methods with a Hach DR900 Colorimeter and DRB200 Reactor heating block (Hach, Loveland, CO, USA) [50,51].
VS were measured at 27.9% and 37.6%, COD at 146 g L−1 and 205 g L−1, and total nitrogen at 7.5 g L−1 and 1.0 g L−1 in Samples A and B, respectively.
Thickened sludge at 3.1 ± 0.02% VS was obtained from a full-scale mesophilic/thermophilic two-stage digester at the South East Water Mt Martha Water Reclamation Plant and also stored at 4 °C before use as inoculum.
Biosolids biochar was produced from the pyrolysis of dried biosolids using a semi-pilot scale fluidised bed pyrolysis reactor (described in [52]) at 600 °C and a flow rate of 10.2 kg h−1. Biosolids were obtained from a municipal wastewater treatment plant treating a mixture of domestic and industrial wastewater. The specific surface area of the biochar was 10.99 m2 g−1, and the fixed carbon and ash content were 13.97% and 62.57%, respectively, on a dry basis. The pH of the biochar was 9.6. Further properties of the original biosolids and the biochar can be found in Table 1.
2.2. Biomethane Potential Tests
To confirm the theoretical positive effects of biosolids biochar addition, preliminary BMP tests were carried out using a “Nautilus” system from “Anaero Technology”, Cambridge, UK [53]. Constantly stirred HDPE reactors (1 L) were filled in duplicate with inoculum sludge and substrate at an inoculum-to-substrate ratio (ISR) of 3.5 on a gVS basis (Table 2) and flushed with 10% CO2/90% N2 to provide anaerobic conditions. Inoculum-to-substrate ratios in the range of 3.5 have been shown to be effective for BMP tests on a range of substrates, including other wastewaters from the facilities in this study [48,54,55]. Biosolids biochar was added to the appropriately prepared vessels at a 1:2 ratio on a TS basis. This is similar to the TS ratios used in studies utilising wood biochar additives for the anaerobic digestion of chicken manure or wastewater sludge in batch reactors [26,31]. BMP tests of swine wastewater have used far higher [32] and far lower [56] concentrations of biochar. Successive feeds for the batch tests were carried out to simulate the acclimatisation of the sludge to the substrate occurring in semi-continuous digestion. This was performed by adding new substrate to the existing reactor sludge once biogas production had ceased [57,58]. Acclimatisation was especially important for the digesters containing biochar, as it is necessary for microbes to colonise pores in the biochar [25]. For the sequential runs, each reactor was fed the same quantity of substrate as originally fed and biochar in the same 2:1 gTS ratio as appropriate. Once acclimatised over two runs, each set of replicates was combined and measured back out into reactors, and again substrate and biochar were added for the third and final run. As the most applicable data, the results of only this run are presented below. The digesters were incubated at 37 °C. Gas volume was measured in a climate-controlled laboratory at 24 °C using the water-displacement tumbler gas flow meter capability of the Nautilus system [53].
2.3. Semi-Continuous Digestion Tests
Semi-continuous digestion was carried out using BioReactor Simulator II (BRS II) equipment (BPC Instruments, Lund, Sweden [59]) in 1.8 L working volume glass vessels at 37 °C. For the initiation phase, the reactors were filled once with inoculum and Substrate A at an ISR of 3.5 on a VS basis, and the headspace was purged with a 10% CO2/90% N2 mixture. The reactors were mixed at a 20% motor speed, with a 30 s on a 30 s off cycle. Gas volumes were measured using the BRS II equipment [59]. In brief, as it was produced, biogas from each reactor entered a specified, calibrated, submerged measurement cell. Upon accumulation of the calibrated volume (approximately 9 mL), a “tip” was measured, and this biogas was released, resetting the cell to measure the next volume of gas. The instantaneous gas production rate was calculated using the time taken for the relevant BRS II measurement cell to fill, equating to an instantaneous rate per unit volume of biogas produced. Periodic samples were taken for pH measurement, VFA measurement, and microbial community analysis. pH was measured at the time of sampling using a Hanna Instruments (Keysborough, VIC, Australia) HI5221 pH meter. Aliquots for VFA analysis were centrifuged at 9500 RPM and 4 °C and filtered through 0.45 µm cellulose acetate filters to remove solids before equal volumes from each reactor were combined. Composite samples were then prepared and analysed for VFA content using Thermo Scientific (Waltham, MA, USA) Dionex OnGuard Na II cartridges [60] and a Dionex (Sunnyvale, CA, USA) ion chromatography system, according to the manufacturer’s instructions [61]. This gave the mean concentration of acetic, propionic, butyric, iso-butyric, valeric, iso-valeric, and caproic acids across the replicate acclimatising reactors. Samples for microbial community analysis were snap-frozen in liquid nitrogen and stored at −20 °C for analysis.
After 24 d of acclimatisation to the initial dose of Substrate A, when the gas production rate was stable and no foaming events were occurring, contents of all reactors were combined, mixed, and equal volumes re-inoculated into four cleaned reactor vessels to provide a consistent baseline between treatments and replicates.
Using a syringe connected to a port, a specified volume of liquid was removed from each reactor and replaced with a volume of substrate daily, as detailed in Table 3, to achieve the required HRT and keep the working volume constant without short-circuiting fresh substrate into the overflow sample. Rest periods were undertaken to allow the reactors to recover when VFA accumulated and gas production dropped [62]. During rest periods (Stage III for Reactors 1–3 and Stage V for all reactors), HRT was maintained using milliQ water in place of the substrate. Biochar was added with inoculum and substrate in the initial setup and with substrate in all consequent feeds at a 2:1 ratio on a gTS basis.
pH was measured, and microbial samples were taken as previously described. VFA analysis was completed for each reactor as above. Methane concentration of the headspace gas was measured every 48–72 h using an MX6 iBrid Portable Multi Gas Monitor with O2 (electrochemical sensor) and CH4 (infrared sensor) capabilities (Industrial Scientific, Pittsburgh, PA, USA [63]), and values were linearly interpolated for analysis. pH was corrected from levels under 6.5 using 2 M Na2CO3, injected as the reactor was fed.
2.4. Sequencing of the Microbial Community
Frozen genomics samples were thawed, and DNA extracted using a DNeasy Powersoil Pro extraction kit (Qiagen, Hilden, Germany) as per the manufacturer’s instructions [64] and stored at −20 °C. DNA concentrations were quantified using a Qubit 4.0 fluorometer and 1X dsDNA BR Assay as per the manufacturer’s instructions (Invitrogen, Carlsbad, CA, USA) [65,66]. The 16S Metagenomic Sequencing Library Preparation Guide (Illumina, San Diego, CA, USA) was followed for amplicon and library preparation, using primers targeting the V3V4 region of the 16S-rRNA gene with primers Pro341FB (CCTACGGGNBGCWSCAG) and Pro805R (GACTACNVGGGTATCTAATCC) [67,68] prior to sequencing (Illumina MiSeq, 600 cycles) [69]. Blanks were included in library preparation to assess contamination.
Processing of sequences included primer trimming with cutadapt [70] followed by pairing forward and reverse reads, denoising, filtering, and dereplicating of sequences using DADA2 [71] after truncating all amplicon sequences to 273 and 220 nucleotides (forward and reverse reads, respectively) using default settings of the QIIME2 [72] pipeline apart from relaxing the expected error from 2 to 6 for reverse reads.
A total of 1,406,345 quality reads at a median frequency of 16,975 reads per sample and 2466 unique amplicon sequence variants (ASVs) were obtained. This followed taxonomic classification (qiime feature-classifier classify-sklearn) [73] of ASVs using the MiDAS5.1 database after training the classifier (qiime feature-classifier fit-classifier-naive-bayes) on taxonomy and sequence files [74,75].
2.5. Analysis
All data processing was performed in R version 4.2.2 [76]. Alpha diversity indices such as richness, Shannon (H′), and Pielou’s evenness (J′) were calculated from rarefied abundances on a subset of the data using the phyloseq package [77]. Other data processing and visualisation used the R packages cowplot [78], microbiome [79], colorspace [80], ggpubr [81], ggplot2 [82], tidyr [83], tibble [84], vegan [85], lattice [86], permute [87], stringr [88], and dplyr [89].
2.6. Statistics
3. Results
3.1. Biomethane Production
For a preliminary assessment of the biomethane potential of the samples and the effect of biochar addition, BMP tests were carried out. To allow for acclimatisation of the microbial community to the feedstock and biochar, successive tests were carried out [57], with the results of the final assay summarised in Figure 2.
Due to failures in the gas flow meter, triplicates were not possible. For comparison, relative standard deviation (RSD) has been quantified at 7.5–24.3% for BMP tests at different laboratories using complex solid substrates [92] and around 6% for intra-laboratory repetitions of cellulose digestion [92,93]. In a study of biogas production from various wastewaters [94], the mean RSD was approximately 10%.
Sample A achieved 390 mL biogas per gVS, both with and without biochar addition. The co-digestion mixture of Samples A and B achieved yields of 547 mL per gVS with biochar addition and 414 mL without. The pure A digester reached 80% of its maximum yield in 8.1 days with biochar and 14 days without, while the co-digestion mixture reached 80% at 7.3 days with biochar, compared to 9.5 days without. In the acclimatised reactors, biogas yields indicated that the addition of biochar did not negatively impact biogas production and may indeed have a positive effect.
As expected for a reaction mixture that had already been depleted in previous digestions and not replenished with new substrate, control reactors showed minimal gas evolution by the time of the third successive BMP test.
3.2. Acclimatisation
Acclimatisation is marked by unsteady state characteristics [95] and increased biogas production and resistance to inhibitors as the population of microbes adjusts [96]. As each feedstock is unique, a microbial community that can thrive despite selection pressures and metabolise the components of the substrate is vital. The acclimatisation period may also foreshadow eventual operational difficulties, such as foaming and pH fluctuations.
Given the results of the previous BMP tests, acclimatisation of inoculum sludge to the BioReactor Simulator configuration and substrate was conducted. This involved operating the reactors with a single batch feed at planned temperature and stirring conditions. As the substrate and metabolites were digested, the period of acclimatisation was characterised by changes in VFA concentration and associated pH, varied gas production, and multiple major foaming events (Figure 3). It is likely that these events were linked, particularly around foaming event B. Foaming events A and C occurred during periods of relatively steady gas production, whereas the lead-up to event B included a sharp increase in biogas production. This increase in biogas was accompanied by a decrease in acetate concentration as it was consumed [97] and a subsequent increase in pH. No anti-foaming agents were added. By the end of acclimatisation, the sludge had exhibited the ability to digest the substrate and was appropriately prepared for semi-continuous feeding.
3.3. Semi-Continuous Operation
Having indicated the BMP of the feed and prepared a sludge acclimatised to the bench-scale reactors, industrial application was simulated through semi-continuous feeding of the substrate (Figure 4).
After an initial increase in gas production once daily feeding commenced, the system showed stability of gas yield over Stage I while being fed with Sample A, with the 30-day HRT and 45-day HRT reactors averaging 719.8 ± 94.9 and 883.3 ± 145.5 mL of biogas per L of reactor working volume per day, or 162.0 ± 21.4 and 302.9 ± 49.9 mL per gVS added per day at 33.8% and 43.9% methane, respectively. Despite this apparent stability, VFAs accumulated, causing a gradual drop in pH. This was most pronounced in digesters 1 and 2, i.e., the digesters with the lowest retention time and highest OLR [11]. VFA accumulation, particularly propionate, is widely reported as an early indicator of process failure [98,99,100,101]. Total VFA concentration steadily increased in all but digester 4, reaching 9904 mg/L, 10,097 mg/L, 6603 mg/L, and 3798 mg/L in digesters 1, 2, 3, and 4, respectively, by day 39.
From this point, the feed substrate was changed to a mixture of Substrates A and B for co-digestion. In Stage II (initial co-digestion), digester stability decreased. Daily gas volumes dropped for the low HRT reactors (Table 4), while the volumes from the high HRT digesters remained steady. However, the instantaneous rates dropped much faster after feeding over the semi-continuous period, as shown in Figure 5. This phenomenon is not widely described in the literature, where the focus of research regarding pulse feeding and substrate shock additions is the response in the order of days and weeks, not minutes and hours [62,102,103,104]. The OLR of Reactors 1–3 decreased to zero to allow for process recovery [62,105]. Over the recovery period (Stage III), daily gas production remained depressed (17% of Stage I average in 30 d HRT reactors) as only residual substrate was available for digestion. While the addition of milliQ water does not add biomass, the positive effects of the microbial community in the influent are likely limited to the acclimatisation stage [106] and hence of minimal net value by the start of the rest periods. Turnover of reactor contents during this stage resulted in an increase in pH, potentially preventing washout [107]. Upon restarting feeding for Stage IV, gas production rates rapidly returned to levels previously seen late in Stage I, while pH continued to fall.
As Stage IV progressed, gas production decreased, coinciding with increasing salinity levels following the addition of sodium carbonate for pH correction. This was also marked by the largest increase in acetate concentration since the original acclimatisation stage, reaching 8402 ± 1570 mg/L and 6769 ± 215 mg/L in 30 d and 45 d HRT digesters by day 74 (Figure 4e). A decrease in the relative abundance of methanogens around this time may have caused methanogenesis to become the rate-limiting step of the overall digestion [5]. A further recovery period (Stage V) allowed the accumulated acetate to be consumed or diluted and the pH to increase. As shown in Figure 6, each reactor recovered to produce a pulse of gas at different times.
The delay between the final preceding feed and the peak of the pulse was related to the total VFA concentration at the time of feed cessation (p < 0.05). In the final stage of feeding, acetate concentrations returned to low levels as gas production rates stabilised, but propionate continued to accumulate.
3.4. Changes in the Microbial Community
The microbial community of digester sludge is one of the main factors responsible for effective anaerobic digestion. A more diverse community can metabolise a wider range of substrates and remain resistant to process shocks, while stable feedstock and conditions allow for specialisation [17,109]. The diversity, richness, and evenness of the acclimatising sludge were relatively high. Over time, especially as semi-continuous feeding was introduced, these measures significantly decreased (p < 0.05) (Figure 7), showing fewer different species of bacteria with very different relative abundances. In contrast to temporal impacts, there was no statistically significant difference between HRT treatments.
A representation of how each digester follows similar changes in community is shown in Figure 8. The community data in each of the reactors show close clustering for the first 17 days of the semi-continuous feeding stage before the 30- and 45-day HRT communities diverge. Over time, mapping of the longer HRT samples approaches that of the shorter HRT samples, at a delay. Figure 9 shows the relative abundance values for all genera that were present at over 2% relative abundance in any sample taken. Different genera are present at different abundances throughout the digestion. Some, like UCG-009, Rikenellaceae RC9 gut group, Mycobacterium, and Candidatus Microthrix, are present at their highest levels during the acclimatisation stage. Alistipes, NK4A214 group, and Ruminococcus are more abundant in the stable mono-digestion stage, while later stages show an increase in Midas g 91549 and Olsenella spp. S50 wastewater sludge group and Petrimonas are at increased levels in 45-day HRT, while Selenomonas and Leuconostoc are more common in the 30-day HRT digesters.
Regarding methanogens, the dominant genera were Methanobrevibacter and Methanona (Figure 10). Relative to other methanogens, Methanobrevibacter was more abundant in the lower HRT digesters and increased when the reactors were stressed, likely a result of the accumulating propionate [10]. Methanosarcina, which can utilise hydrogenotrophic or acetotrophic pathways [46], was found to be significantly more abundant in the longer retention time digesters, where gas yields were higher. Other methanogenic species detected in the digesters at lower levels than the 0.02 relative abundance threshold included Methanothrix, Methanoculleus, Methanofollis, Methanosphaerula, Methanosphaera, and Methanobacterium [46].
4. Discussion
4.1. Source-Separated Wastewater Potential
While some wastewater streams are under-utilised for resource recovery due to variability, unsuitable composition, and high volumes at high dilution, source-separated high-strength wastewater is a potential candidate for anaerobic digestion. With the possibility of being highly concentrated and consistent, combining selected feeds in co-digestion may also help overcome deficiencies in individual substrates. To investigate this potential in a configuration applicable to a commercial scale, BMP and semi-continuous digestion using source-separated wastewater were undertaken. In this study, initial BMP showed biogas yields approaching those of similar tests in the literature [25,110,111] but lower than expected biogas and methane yields under semi-continuous feeding conditions. This may be caused by the combination of operating conditions, inoculum, and feedstock composition unique to this study. Investigations into suitability are required whenever individual wastewater streams, source-separated or not, are identified as potential anaerobic digestion feedstock.
Due to source separation, VS concentrations in the studied substrates were up to ten times higher than other wastewater streams from similar industries [20,112] and approached levels found in solid waste used in dry anaerobic digestion [113]. Using source-separated strong wastewater, high OLRs can be achieved at long HRTs when compared with dilute wastewater. However, high OLR can often be a source of process instability [11,16], as products accumulate at rate-limiting steps, and a negative feedback loop affects the microbial community [5], resulting in digester failure [17]. In this study, each reactor digested Sample A with stable daily gas yields. However, in the low HRT reactors, this obscured a decline in microbial biomass and an accumulation of VFAs, particularly propionate, an early warning sign for digester operators [100,114] that can ultimately cause acidification. It is possible that propionate accumulation was influenced by ammonia levels [115]. As both substrates had high total nitrogen concentrations, biological production of ammonia is likely [96,116,117]. Ammonia stress has been shown to be a major factor in inhibiting propionate degradation [118]. Also occurring with the accumulation of VFAs was a shift in the methanogenic community. As the feedback loop continued and total microbial numbers decreased, the relative abundance of methanogens decreased further. Within that, the ratio of Methanobrevibacter to Methanosarcina increased. This decrease in the ammonia-tolerant Methanosarcina [119] implies a weaker effect of ammonia in the digesters than expected. The addition of wood biochar has been shown to reduce ammonia inhibition in batch anaerobic digestion [26], and the biosolids biochar additive in this work may have the same effect.
Interactions between VFA, yield, and community were also noticeable throughout Stages II–VI. The addition of Substrate B and the associated increase in OLR had a negative effect on stability, immediately apparent in instantaneous gas production rates. When examined at a fine resolution, the change in substrate resulted in a sharper peak and lower minimum gas production rate. Although some studies have investigated the effect of feeding schedule on biogas yields and reactor stability [104,120], more research into instantaneous gas production rates as an indicator of semi-continuous anaerobic digester health is required. This is particularly important in the case of source-separated strong wastes, which may be available in regular, if discrete, batches. As foaming has been found to be correlated with the gas flow rate in foam potential tests [121], the increased volumes of biogas produced immediately after feeding are also potential drivers of foaming [122].
The other factor affecting the extent of foaming is the presence of certain microbes and the biosurfactants and hydrophobic substances they produce [9]. Gordonia, a genus implicated in wastewater digester foaming [47,123], was detected from the beginning of the acclimatisation period until foaming event B. Microthrix was also identified but steadily decreased in relative abundance throughout the digestion period [40]. An increased level of Lachnoclostridium [124] was observed in digester 1 as Substrate A was fed but dwindled after the change in feed and associated process upset. Foaming remains a difficult problem in industrial anaerobic digestion, but the absence of foaming events after acclimatisation in this study, especially during process upsets, holds promise.
The recovery of failing digesters can be difficult or impossible [125] past a certain point, so it is important for continued operation that control is maintained, and changes are made at the first sign of process upsets. While propionate and other VFAs are lagging indicators of reactor health, and pH and overall biogas production rate are indicators that appear even later, OLR, HRT, inoculum, and feed composition are considerations that may have the greatest impact. The process upset caused by the changing of the substrate in this study is likely to have been driven by substrate composition and OLR changes. Although preliminary BMP tests indicated high yield, this was with an acclimatised sludge and, by definition, in a batch configuration. However, shifting from mono- to co-digestion or changing co-digestion substrate at constant OLR may not have a permanent effect on reaction stability, especially if initial VFA levels are low and the reactor is not under stress [126]. It is possible that, unlike BMP, the regular addition of organic load in the semi-continuous configuration does not allow for the degradation of VFAs, particularly at significant initial stress.
While a change in the feedstock is an obvious factor in OLR variations, an unnoticed decrease in effective reactor volume will also increase OLR. Effective reactor volume can be decreased through the accumulation of sludge and other solids, such as biochar [127]. As biochar was regularly added to the digesters, imperfect mixing could cause settling and accumulation of solid particles. The effective use of biochar as an additive [25,26,27,28], especially in large-scale continuous systems, should be investigated further. Using this work as a base, longer-term studies at a larger scale would provide important data around the impacts and effective methods of process control [128], requirements and results of maintenance and shutdowns [128], and seasonal shifts in conditions and feedstocks as weather and product demands change [129,130].
4.2. Microbial Community
Behind the changes in gas production rate and pH were shifts in the microbial community of the digesters. Many of the genera identified in the digesters have previously been reported [40,131] or linked to animal or human digestive systems [132,133] and range in metabolic capabilities and preferred conditions.
The highest diversity within the sludge was found during the acclimatisation process. The reactor was in an unsteady state as metabolites were consumed and by-products produced by various microbes in a sequential fashion after the initial feed [95]. This sludge was also the most closely temporally related to the inoculum sludge. Having been obtained from a resilient process with a variable feedstock and different conditions, diversity was expected in the inoculum [134]. Mycobacterium, Ca Microthrix, and Clostridium sensu stricto 1 were all more abundant during the acclimatisation stage than later. Clostridium sensu stricto 1 produces saccharolytic enzymes [135], and the family Clostridiaceae has been linked to propionate degradation [118]. Mycobacterium is known to degrade cholesterol in wastewater treatment plants [136], and Ca Microthrix can hydrolyse long-chain fatty acids [40]. The latter two have been implicated in foaming in anaerobic conditions, an undesirable outcome.
In contrast, Succiniclasticum, an acidogen that converts succinate to propionate as its sole energy source [43], was less common in the acclimatisation stage but increased as feed changed to Substrate A and then to co-digestion. Other genera that were at their highest relative abundances after co-digestion began include Olsenella, Midas g 91549, Midas g 249, Sporanaerobacter, and Pyramidobacter, which are capable of hydrolytic, acidogenic, and acetogenic pathways [28,38,42,137,138]. This suggests that it is not simply a case of microbes involved in earlier stages of methane production being lost as digestion time continues, nor that being able to metabolise only a narrow range of substrates guarantees elimination. Many members of the group flourishing during co-digestion are resistant to stresses within the reactor environment. Olsenella is acid tolerant [38], Midas g 249 has shown tetracycline resistance in biochar-assisted anaerobic digestion [28], and the relative abundance of Pyramidobacter has been found to increase in anaerobic digesters after overloading with propionic acid [10]. These microbes may be occupying the metabolic niches left by less resistant counterparts. Although some level of competition can increase the stability and resilience of microbial communities [139], if a taxon becomes dominant in a reactor, perhaps due to favourable substrate or high tolerance to conditions, other microbes can be suppressed, decreasing diversity [140].
Examples of genera that may not have tolerated conditions well include the acidogenic Petrimonas and Alistipes and the acetogens Romboutsia and NKA214 [44,45,132,141]. Petrimonas, Alistipes, and Romboutsia were also significantly more abundant at longer retention times, suggesting a link between them and low-stress, high gas production digester states. Indeed, some literature suggests that acetogens and methanogens are more susceptible to process disturbances [17]. This does not seem to be the case if a given species has other metabolic pathways available, e.g., Olsenella and Midas g 249, but held true for methanogens.
The overall abundance of methanogens reduced as pH and VFA stress increased. Within the group of methanogens identified in the reactors, the dominance of Methanobrevibacter and Methanosarcina is likely due to the former’s tolerance of propionate [10] and the latter’s tolerance of pH, sodium, and acetate concentration [142]. The delay between feeding events has also been shown to have an effect, especially selecting Methanosarcina over Methanothrix [120].
Regular feeding shocks, where the available organic load is increased within the digester, are likely to have influenced the microbial community. The similarity between replicate reactors and the similar trajectory of reactor profiles when mapped onto principal component analysis (PCA) indicate that changes in the microbial community are likely to be deterministic [142] rather than being random despite a diverse inoculum sludge; population dynamics appear to be driven by digester conditions, including directly controllable inputs like temperature, and indirectly influenceable parameters like metabolite concentrations. Determining and guiding these conditions will help improve the efficiency of biogas production.
5. Conclusions
In this work, biomethane yields of 0.24 and 0.39 L d−1 per litre of reactor volume were obtained through semi-continuous digestion of cooking vessel wastewater at HRTs of 30 and 45 days, respectively, with biosolids biochar amendment. With the addition of a logistics business wastewater, co-digestion achieved up to 0.43 L d−1 per litre of reactor volume biomethane production but was beset with process instability due mainly to the accumulation of propionate and other VFAs at high OLR. The final propionate concentration reached 11,964 ± 340 mg kg−1 and 8256 ± 157 mg kg−1 in the 30- and 45-day HRT reactors.
Parameters including pH and metabolite concentration have significant effects on microbial communities and, therefore, on biogas production. After a change in feed and increased OLR, the relative abundances of Petrimonas, Alistipes, Romboutsia, and Clostridium sensu stricto 1 all decreased as stability was lost and methane yields dropped.
Semi-continuous operation results in temporary spikes of biogas production immediately following feeding. This may have implications for efficient anaerobic digestion at scale and should be investigated further.
Source-separated industrial wastewater is a candidate for anaerobic digestion, depending on its properties, and biosolids-derived biochar holds promise as an additive to mitigate the inhibitory effects of fermentation by-products. Design considerations such as HRT, OLR, and feeding regimen must be tightly controlled to achieve best results. Future long-term pilot-scale studies are necessary to find optimal operating conditions.
Author Contributions
Conceptualization, J.A.K.E. and A.S.B.; data curation, J.A.K.E. and C.K.; formal analysis, J.A.K.E.; funding acquisition, A.S.B.; investigation, J.A.K.E.; methodology, J.A.K.E. and C.K.; project administration, A.S.B.; resources, A.S.B.; supervision, A.S.B.; visualization, J.A.K.E.; writing—original draft preparation, J.A.K.E. and C.K.; writing—review and editing, J.A.K.E., C.K. and A.S.B. All authors have read and agreed to the published version of the manuscript.
Funding
This research was supported by Greater Western Water. The authors acknowledge the support received for research through the provision of an Australian Government Research Training Program Scholarship.
Institutional Review Board Statement
Not applicable.
Informed Consent Statement
Not applicable.
Data Availability Statement
The data presented in this study are available upon request from the corresponding author and approval by sample suppliers. The data are not publicly available due to the privacy of sample suppliers.
Acknowledgments
The authors acknowledge the support of GWW and sample suppliers.
Conflicts of Interest
The authors declare no conflicts of interest.
References
- Elliott, J.A.K.; Ball, A.S. Selection of industrial trade waste resource recovery technologies—A systematic review. Resources 2021, 10, 29. [Google Scholar] [CrossRef]
- Bywater, A.; Kusch-Brandt, S. Exploring farm anaerobic digester economic viability in a time of policy change in the UK. Processes 2022, 10, 212. [Google Scholar] [CrossRef]
- Hu, Y.; Cai, X.; Du, R.; Yang, Y.; Rong, C.; Qin, Y.; Li, Y.Y. A review on anaerobic membrane bioreactors for enhanced valorization of urban organic wastes: Achievements, limitations, energy balance and future perspectives. Sci. Total Environ. 2022, 820, 153284. [Google Scholar] [CrossRef]
- Economou, E.A.; Dimitropoulou, G.; Prokopidou, N.; Dalla, I.; Sfetsas, T. Anaerobic digestion remediation in three full-scale biogas plants through supplement additions. Methane 2023, 2, 265–278. [Google Scholar] [CrossRef]
- Tsigkou, K.; Zagklis, D.; Parasoglou, M.; Zafiri, C.; Kornaros, M. Proposed protocol for rate-limiting step determination during anaerobic digestion of complex substrates. Bioresour. Technol. 2022, 361, 127660. [Google Scholar] [CrossRef]
- Zhang, C.; Xiao, G.; Peng, L.; Su, H.; Tan, T. The anaerobic co-digestion of food waste and cattle manure. Bioresour. Technol. 2013, 129, 170–176. [Google Scholar] [CrossRef]
- Cavinato, C.; Bolzonella, D.; Pavan, P.; Fatone, F.; Cecchi, F. Mesophilic and thermophilic anaerobic co-digestion of waste activated sludge and source sorted biowaste in pilot- and full-scale reactors. Renew. Energy 2013, 55, 260–265. [Google Scholar] [CrossRef]
- Kim, J.K.; Oh, B.R.; Chun, Y.N.; Kim, S.W. Effects of temperature and hydraulic retention time on anaerobic digestion of food waste. J. Biosci. Bioeng. 2006, 102, 328–332. [Google Scholar] [CrossRef]
- Krohn, C.; Khudur, L.; Dias, D.A.; van den Akker, B.; Rees, C.A.; Crosbie, N.D.; Surapaneni, A.; O’Carroll, D.M.; Stuetz, R.M.; Batstone, D.J.; et al. The role of microbial ecology in improving the performance of anaerobic digestion of sewage sludge. Front. Microbiol. 2022, 13, 1079136. [Google Scholar] [CrossRef]
- Khafipour, A.; Jordaan, E.M.; Flores-Orozco, D.; Khafipour, E.; Levin, D.B.; Sparling, R.; Cicek, N. Response of microbial community to induced failure of anaerobic digesters through overloading with propionic acid followed by process recovery. Front. Bioeng. Biotechnol. 2020, 8, 604838. [Google Scholar] [CrossRef]
- Ziganshin, A.M.; Schmidt, T.; Lv, Z.; Liebetrau, J.; Richnow, H.H.; Kleinsteuber, S.; Nikolausz, M. Reduction of the hydraulic retention time at constant high organic loading rate to reach the microbial limits of anaerobic digestion in various reactor systems. Bioresour. Technol. 2016, 217, 62–71. [Google Scholar] [CrossRef]
- Stankiewicz, A.; Moulijn, J.A. Process intensification. Ind. Eng. Chem. Res. 2002, 41, 1920–1924. [Google Scholar] [CrossRef]
- Srivastava, S.; Pandey, V.K.; Fatima, A.; Sachin, V.M.; Pandey, S.; Singh, R.; Dar, A.H.; Dhillon, B. A literature review on process intensification: An innovative and sustainable food processing method. Appl. Food Res. 2024, 4, 100363. [Google Scholar] [CrossRef]
- Dareioti, M.A.; Kornaros, M. Effect of hydraulic retention time (HRT) on the anaerobic co-digestion of agro-industrial wastes in a two-stage CSTR system. Bioresour. Technol. 2014, 167, 407–415. [Google Scholar] [CrossRef]
- Fitamo, T.; Boldrin, A.; Boe, K.; Angelidaki, I.; Scheutz, C. Co-digestion of food and garden waste with mixed sludge from wastewater treatment in continuously stirred tank reactors. Bioresour. Technol. 2016, 206, 245–254. [Google Scholar] [CrossRef]
- Yu, Q.; Feng, L.; Zhen, X. Effects of organic loading rate and temperature fluctuation on the microbial community and performance of anaerobic digestion of food waste. Environ. Sci. Pollut. Res. Int. 2021, 28, 13176–13187. [Google Scholar] [CrossRef]
- Nguyen, A.Q.; Nguyen, L.N.; Phan, H.V.; Galway, B.; Bustamante, H.; Nghiem, L.D. Effects of operational disturbance and subsequent recovery process on microbial community during a pilot-scale anaerobic co-digestion. Int. Biodeterior. Biodegrad. 2019, 138, 70–77. [Google Scholar] [CrossRef]
- Kazimierowicz, J.; Dzienis, L.; Dębowski, M.; Zieliński, M. Optimisation of methane fermentation as a valorisation method for food waste products. Biomass Bioenergy 2021, 144, 105913. [Google Scholar] [CrossRef]
- Akunna, J.C. Anaerobic Waste-Wastewater Treatment and Biogas Plants: A Practical Handbook; CRC Press: Boca Raton, FL, USA, 2018. [Google Scholar]
- Nguyen, V.T.; Beyer, E.; Neumann, J.; Awe, D.; Pfeiffer, W.; Tranckner, J. Anaerobic treatment of residuals from tanks transporting food and fodder. Environ. Sci. Pollut. Res. Int. 2019, 26, 32698–32707. [Google Scholar] [CrossRef]
- Jensen, P.D.; Sullivan, T.; Carney, C.; Batstone, D.J. Analysis of the potential to recover energy and nutrient resources from cattle slaughterhouses in Australia by employing anaerobic digestion. Appl. Energy 2014, 136, 23–31. [Google Scholar] [CrossRef]
- Weber, K.; Quicker, P. Properties of biochar. Fuel 2018, 217, 240–261. [Google Scholar] [CrossRef]
- Patel, S.; Kundu, S.; Halder, P.; Ratnnayake, N.; Marzbali, M.H.; Aktar, S.; Selezneva, E.; Paz-Ferreiro, J.; Surapaneni, A.; de Figueiredo, C.C.; et al. A critical literature review on biosolids to biochar: An alternative biosolids management option. Rev. Environ. Sci. Bio/Technol. 2020, 19, 807–841. [Google Scholar] [CrossRef]
- Deena, S.R.; Vickram, A.S.; Manikandan, S.; Subbaiya, R.; Karmegam, N.; Ravindran, B.; Chang, S.W.; Awasthi, M.K. Enhanced biogas production from food waste and activated sludge using advanced techniques—A review. Bioresour. Technol. 2022, 355, 127234. [Google Scholar] [CrossRef]
- Hassan, S.; Ngo, T.; Khudur, L.S.; Krohn, C.; Dike, C.C.; Hakeem, I.G.; Shah, K.; Surapaneni, A.; Ball, A.S. Biosolids-derived biochar improves biomethane production in the anaerobic digestion of chicken manure. Resources 2023, 12, 123. [Google Scholar] [CrossRef]
- Ngo, T.; Khudur, L.S.; Hakeem, I.G.; Shah, K.; Surapaneni, A.; Ball, A.S. Wood biochar enhances the valorisation of the anaerobic digestion of chicken manure. Clean. Technol. 2022, 4, 420–439. [Google Scholar] [CrossRef]
- Ma, J.; Chen, F.; Xue, S.; Pan, J.; Khoshnevisan, B.; Yang, Y.; Liu, H.; Qiu, L. Improving anaerobic digestion of chicken manure under optimized biochar supplementation strategies. Bioresour. Technol. 2021, 325, 124697. [Google Scholar] [CrossRef]
- Wang, G.; Chu, Y.; Zhu, J.; Sheng, L.; Liu, G.; Xing, Y.; Fu, P.; Li, Q.; Chen, R. Multi-faceted influences of biochar addition on swine manure digestion under tetracycline antibiotic pressure. Bioresour. Technol. 2022, 346, 126352. [Google Scholar] [CrossRef]
- Shen, R.; Jing, Y.; Feng, J.; Zhao, L.; Yao, Z.; Yu, J.; Chen, J.; Chen, R. Simultaneous carbon dioxide reduction and enhancement of methane production in biogas via anaerobic digestion of cornstalk in continuous stirred-tank reactors: The influences of biochar, environmental parameters, and microorganisms. Bioresour. Technol. 2021, 319, 124146. [Google Scholar] [CrossRef]
- Shen, R.; Jing, Y.; Feng, J.; Luo, J.; Yu, J.; Zhao, L. Performance of enhanced anaerobic digestion with different pyrolysis biochars and microbial communities. Bioresour. Technol. 2020, 296, 122354. [Google Scholar] [CrossRef] [PubMed]
- Wang, P.; Peng, H.; Adhikari, S.; Higgins, B.; Roy, P.; Dai, W.; Shi, X. Enhancement of biogas production from wastewater sludge via anaerobic digestion assisted with biochar amendment. Bioresour. Technol. 2020, 309, 123368. [Google Scholar] [CrossRef]
- Wang, G.; Zhu, J.; Xing, Y.; Yin, Y.; Li, Y.; Li, Q.; Chen, R. When dewatered swine manure-derived biochar meets swine wastewater in anaerobic digestion: A win-win scenario towards highly efficient energy recovery and antibiotic resistance genes attenuation for swine manure management. Sci. Total Environ. 2022, 803, 150126. [Google Scholar] [CrossRef]
- Paz-Ferreiro, J.; Nieto, A.; Mendez, A.; Askeland, M.P.J.; Gasco, G. Biochar from biosolids pyrolysis: A review. Int. J. Environ. Res. Public. Health 2018, 15, 956. [Google Scholar] [CrossRef] [PubMed]
- Chagas, J.K.M.; Figueiredo, C.C.; Silva, J.D.; Shah, K.; Paz-Ferreiro, J. Long-term effects of sewage sludge-derived biochar on the accumulation and availability of trace elements in a tropical soil. J. Environ. Qual. 2021, 50, 264–277. [Google Scholar] [CrossRef]
- de la Rosa, J.M.; Paneque, M.; Miller, A.Z.; Knicker, H. Relating physical and chemical properties of four different biochars and their application rate to biomass production of Lolium perenne on a calcic cambisol during a pot experiment of 79 days. Sci. Total Environ. 2014, 499, 175–184. [Google Scholar] [CrossRef] [PubMed]
- Zhang, M.; Li, J.; Wang, Y.; Yang, C. Impacts of different biochar types on the anaerobic digestion of sewage sludge. RSC Adv. 2019, 9, 42375–42386. [Google Scholar] [CrossRef]
- Chiappero, M.; Berruti, F.; Masek, O.; Fiore, S. Semi-continuous anaerobic digestion of mixed wastewater sludge with biochar addition. Bioresour. Technol. 2021, 340, 125664. [Google Scholar] [CrossRef]
- Kraatz, M.; Wallace, R.J.; Svensson, L. Olsenella umbonata sp. nov., a microaerotolerant anaerobic lactic acid bacterium from the sheep rumen and pig jejunum, and emended descriptions of Olsenella, Olsenella uli and Olsenella profusa. Int. J. Syst. Evol. Microbiol. 2011, 61, 795–803. [Google Scholar] [CrossRef] [PubMed]
- Ziels, R.M.; Karlsson, A.; Beck, D.A.C.; Ejlertsson, J.; Yekta, S.S.; Bjorn, A.; Stensel, H.D.; Svensson, B.H. Microbial community adaptation influences long-chain fatty acid conversion during anaerobic codigestion of fats, oils, and grease with municipal sludge. Water Res. 2016, 103, 372–382. [Google Scholar] [CrossRef]
- Rossetti, S.; Tomei, M.C.; Nielsen, P.H.; Tandoi, V. “Microthrix parvicella”, a filamentous bacterium causing bulking and foaming in activated sludge systems: A review of current knowledge. FEMS Microbiol. Rev. 2005, 29, 49–64. [Google Scholar] [CrossRef]
- Warren, R.A.J. Microbial hydrolysis of polysaccharides. Annu. Rev. Microbiol. 1996, 50, 183–212. [Google Scholar] [CrossRef]
- Hernandez-Eugenio, G. Sporanaerobacter acetigenes gen. nov., sp. nov., a novel acetogenic, facultatively sulfur-reducing bacterium. Int. J. Syst. Evol. Microbiol. 2002, 52, 1217–1223. [Google Scholar] [PubMed]
- Van Gylswyk, N.O. Succiniclasticum ruminis gen. nov., sp. nov., a ruminal bacterium converting succinate to propionate as the sole energy-yielding mechanism. Int. J. Syst. Bacteriol. 1995, 45, 297–300. [Google Scholar] [CrossRef] [PubMed]
- Gerritsen, J.; Fuentes, S.; Grievink, W.; van Niftrik, L.; Tindall, B.J.; Timmerman, H.M.; Rijkers, G.T.; Smidt, H. Characterization of Romboutsia ilealis gen. nov., sp. nov., isolated from the gastro-intestinal tract of a rat, and proposal for the reclassification of five closely related members of the genus Clostridium into the genera Romboutsia gen. nov., Intestinibacter gen. nov., Terrisporobacter gen. nov. and Asaccharospora gen. nov. Int. J. Syst. Evol. Microbiol. 2014, 64, 1600–1616. [Google Scholar] [PubMed]
- Liu, C.; Wu, H.; Liu, S.; Chai, S.; Meng, Q.; Zhou, Z. Dynamic alterations in yak rumen bacteria community and metabolome characteristics in response to feed type. Front. Microbiol. 2019, 10, 1116. [Google Scholar] [CrossRef]
- Garcia, J.L.; Patel, B.K.; Ollivier, B. Taxonomic, phylogenetic, and ecological diversity of methanogenic archaea. Anaerobe 2000, 6, 205–226. [Google Scholar] [CrossRef]
- Riesco, R.; Rose, J.J.A.; Batinovic, S.; Petrovski, S.; Sanchez-Juanes, F.; Seviour, R.J.; Goodfellow, M.; Trujillo, M.E. Gordonia pseudamarae sp. nov., a home for novel Actinobacteria isolated from stable foams on activated sludge wastewater treatment plants. Int. J. Syst. Evol. Microbiol. 2022, 72, 005547. [Google Scholar] [CrossRef]
- Elliott, J.A.K.; Ball, A.S.; Shah, K. Investigations into valorisation of trade wastewater for biomethane production. Heliyon 2023, 9, e13309. [Google Scholar] [CrossRef]
- Baird, R.B.; Eaton, A.D.; Rice, E.W. Standard Methods for the Examination of Water and Wastewater, 23rd ed.; American Public Health Association: Washington, DC, USA, 2012. [Google Scholar]
- Hach Company. Oxygen Demand, Chemical. 2021. Available online: https://au.hach.com/asset-get.download.jsa?id=7639983816 (accessed on 13 December 2021).
- Kundu, S.; Patel, S.; Halder, P.; Patel, T.; Hedayati Marzbali, M.; Pramanik, B.K.; Paz-Ferreiro, J.; de Figueiredo, C.C.; Bergmann, D.; Surapaneni, A.; et al. Removal of PFASs from biosolids using a semi-pilot scale pyrolysis reactor and the application of biosolids derived biochar for the removal of PFASs from contaminated water. Environ. Sci. Water Res. Technol. 2021, 7, 638–649. [Google Scholar] [CrossRef]
- Anaero Technology. Available online: www.anaerotech.com/bmp-reactors (accessed on 15 September 2022).
- Mpofu, A.B.; Kibangou, V.A.; Kaira, W.M.; Oyekola, O.O.; Welz, P.J. Anaerobic co-digestion of tannery and slaughterhouse wastewater for solids reduction and resource recovery: Effect of sulfate concentration and inoculum to substrate ratio. Energies 2021, 14, 2491. [Google Scholar] [CrossRef]
- Latifi, P.; Karrabi, M.; Danesh, S. Anaerobic co-digestion of poultry slaughterhouse wastes with sewage sludge in batch-mode bioreactors (effect of inoculum-substrate ratio and total solids). Renew. Sustain. Energy Rev. 2019, 107, 288–296. [Google Scholar] [CrossRef]
- Yang, S.; Chen, Z.; Wen, Q. Impacts of biochar on anaerobic digestion of swine manure: Methanogenesis and antibiotic resistance genes dissemination. Bioresour. Technol. 2021, 324, 124679. [Google Scholar] [CrossRef]
- Jimenez, J.; Charnier, C.; Kouas, M.; Latrille, E.; Torrijos, M.; Harmand, J.; Patureau, D.; Sperandio, M.; Morgenroth, E.; Beline, F.; et al. Modelling hydrolysis: Simultaneous versus sequential biodegradation of the hydrolysable fractions. Waste Manag. 2020, 101, 150–160. [Google Scholar] [CrossRef]
- Torrijos, M. Assessment of BMP and Kinetics in 6l-Batch Reactors with Successive Feedings. In Proceedings of the Workshop on the Conundrum of Biomethane Potential Tests, Leysin, Switzerland, 10–12 June 2015. [Google Scholar]
- BPC Instruments. Bioreactor Simulator. 2019. Available online: https://bpcinstruments.com/ (accessed on 12 July 2022).
- Thermo Fisher Scientific Inc. Dionex Onguard ii Cartridges 031688. 2017. Available online: https://assets.thermofisher.com/TFS-Assets%2FCMD%2Fmanuals%2FMan-031688-IC-OnGuard-II-Cartridges-Man031688-EN.pdf (accessed on 20 April 2023).
- Chantarasukon, C.; Tukkeeree, S.; Rohrer, J. Determination of Organic Acids in Wastewater Using Ion-Exclusion Chromatography and On-Line Carbonate Removal; Thermo Fisher Scientific Inc.: Waltham, MA, USA, 2016. [Google Scholar]
- Voelklein, M.A.; O’ Shea, R.; Jacob, A.; Murphy, J.D. Role of trace elements in single and two-stage digestion of food waste at high organic loading rates. Energy 2017, 121, 185–192. [Google Scholar] [CrossRef]
- Industrial Scientific. Available online: https://www.indsci.com/en/gas-detectors/multi/mx6-ibrid (accessed on 12 July 2022).
- Qiagen. Dneasy® Powersoil® Pro Kit Handbook. 2023. Available online: https://www.qiagen.com/us/resources/download.aspx?id=9bb59b74-e493-4aeb-b6c1-f660852e8d97&lang=en (accessed on 20 August 2023).
- Invitrogen. Comparison of Fluorescence-Based Quantitation with UV Absorbance Measurements; ThermoFisher Scientific: Waltham, MA, USA, 2018; Volume COL22609 0618. [Google Scholar]
- Invitrogen. Qubit™ 4 Fluorometer; ThermoFisher Scientific: Waltham, MA, USA, 2021; Volume MAN0017209. [Google Scholar]
- Mazzoli, L.; Munz, G.; Lotti, T.; Ramazzotti, M. A novel universal primer pair for prokaryotes with improved performances for anammox containing communities. Sci. Rep. 2020, 10, 15648. [Google Scholar] [CrossRef]
- Takahashi, S.; Tomita, J.; Nishioka, K.; Hisada, T.; Nishijima, M. Development of a prokaryotic universal primer for simultaneous analysis of bacteria and archaea using next-generation sequencing. PLoS ONE 2014, 9, e105592. [Google Scholar] [CrossRef]
- Illumina. 16s Metagenomic Sequencing Library Preparation; Illumina: San Diego, CA, USA, 2013. [Google Scholar]
- Martin, M. Cutadapt removes adapter sequences from high-throughput sequencing reads. EMBnet. J. 2011, 17, 10–12. [Google Scholar] [CrossRef]
- Callahan, B.J.; McMurdie, P.J.; Rosen, M.J.; Han, A.W.; Johnson, A.J.; Holmes, S.P. Dada2: High-resolution sample inference from illumina amplicon data. Nat. Methods 2016, 13, 581–583. [Google Scholar] [CrossRef]
- Bolyen, E.; Rideout, J.R.; Dillon, M.R.; Bokulich, N.A.; Abnet, C.C.; Al-Ghalith, G.A.; Alexander, H.; Alm, E.J.; Arumugam, M.; Asnicar, F.; et al. Reproducible, interactive, scalable and extensible microbiome data science using qiime 2. Nat. Biotechnol. 2019, 37, 852–857. [Google Scholar] [CrossRef] [PubMed]
- Bokulich, N.A.; Kaehler, B.D.; Rideout, J.R.; Dillon, M.; Bolyen, E.; Knight, R.; Huttley, G.A.; Gregory Caporaso, J. Optimizing taxonomic classification of marker-gene amplicon sequences with qiime 2’s q2-feature-classifier plugin. Microbiome 2018, 6, 90. [Google Scholar] [CrossRef] [PubMed]
- Dueholm, M.K.D.; Nierychlo, M.; Andersen, K.S.; Rudkjobing, V.; Knutsson, S.; MIDAS Global Consortium; Albertsen, M.; Nielsen, P.H. Midas 4: A global catalogue of full-length 16s rRNA gene sequences and taxonomy for studies of bacterial communities in wastewater treatment plants. Nat. Commun. 2022, 13, 1908. [Google Scholar] [CrossRef] [PubMed]
- Dueholm, M.K.D.; Andersen, K.S.; Petersen, A.-K.C.; Rudkjøbing, V.; Nielsen, P.H. MiDAS 5: Global diversity of bacteria and archaea in anaerobic digesters. bioRxiv 2023. [Google Scholar] [CrossRef]
- R Core Team. R: A Language and Environment for Statistical Computing; R Foundation for Statistical Computing: Vienna, Austria, 2022. [Google Scholar]
- McMurdie, P.J.; Holmes, S. Phyloseq: An r package for reproducible interactive analysis and graphics of microbiome census data. PLoS ONE 2013, 8, e61217. [Google Scholar] [CrossRef] [PubMed]
- Wilke, C. Cowplot: Streamlined Plot Theme and Plot Annotations for ‘ggplot2’, 1.1.1 ed.; 2020. Available online: https://CRAN.R-project.org/package=cowplot (accessed on 23 October 2023).
- Lahti, L.; Shetty, S. Microbiome r Package. 2012–2019. Available online: http://microbiome.github.io (accessed on 23 October 2023).
- Zeileis, A.; Fisher, J.C.; Hornik, K.; Ihaka, R.; McWhite, C.D.; Murrell, P.; Stauffer, R.; Wilke, C.O. Colorspace: A toolbox for manipulating and assessing colors and palettes. J. Stat. Softw. 2020, 96, 1–49. [Google Scholar] [CrossRef]
- Kassambara, A. Ggpubr: ‘Ggplot2’ Based Publication Ready Plots. 2023. Available online: https://CRAN.R-project.org/package=ggpubr (accessed on 23 October 2023).
- Wickham, H. Ggplot2; Springer: Cham, Switzerland, 2016. [Google Scholar]
- Wickham, H.; Vaughan, D.; Girlich, M. Tidyr: Tidy messy data. J. Stat. Softw. 2014, 59, 1–23. [Google Scholar] [CrossRef]
- Müller, K.; Wickham, H. Tibble: Simple Data Frames. 2023. Available online: https://CRAN.R-project.org/package=tibble (accessed on 23 October 2023).
- Oksanen, J.; Simpson, G.; Blanchet, F.; Kindt, R.; Legendre, P.; Minchin, P.; O’Hara, R.; Solymos, P.; Stevens, M.; Szoecs, E.; et al. Vegan: Community Ecology Package; R Foundation for Statistical Computing: Vienna, Austria, 2022. [Google Scholar]
- Sarkar, D. Lattice: Multivariate Data Visualization with r; Springer: New York, NY, USA, 2008. [Google Scholar]
- Simpson, G.L. Permute: Functions for Generating Restricted Permutations of Data. 2022. Available online: https://CRAN.R-project.org/package=permute (accessed on 23 October 2023).
- Wickham, H. Stringr: Simple, Consistent Wrappers for Common String Operations. 2022. Available online: https://CRAN.R-project.org/package=stringr (accessed on 23 October 2023).
- Wickham, H.; François, R.; Henry, L.; Müller, K.; Vaughan, D. Dplyr: A Grammar of Data Manipulation. 2023. Available online: https://CRAN.R-project.org/package=dplyr (accessed on 23 October 2023).
- Kassambara, A. Rstatix: Pipe-Friendly Framework for Basic Statistical Tests. 2023. Available online: https://CRAN.R-project.org/package=rstatix (accessed on 23 October 2023).
- Kassambara, A.; Mundt, F. Factoextra: Extract and Visualize the Results of Multivariate Data Analyses. 2020. Available online: https://CRAN.R-project.org/package=factoextra (accessed on 23 October 2023).
- Hafner, S.D.; Fruteau de Laclos, H.; Koch, K.; Holliger, C. Improving inter-laboratory reproducibility in measurement of biochemical methane potential (BMP). Water 2020, 12, 1752. [Google Scholar] [CrossRef]
- Weinrich, S.; Schäfer, F.; Bochmann, G.; Liebetrau, J. Value of Batch Tests for Biogas Potential Analysis; IEA Bioenergy: Paris, France, 2018. [Google Scholar]
- Maya-Altamira, L.; Baun, A.; Angelidaki, I.; Schmidt, J.E. Influence of wastewater characteristics on methane potential in food-processing industry wastewaters. Water Res. 2008, 42, 2195–2203. [Google Scholar] [CrossRef]
- Hai, F.I.; Yamamoto, K. 4.16 membrane biological reactors. In Treatise on Water Science; Wilderer, P., Ed.; Elsevier: Oxford, UK, 2011; pp. 571–613. [Google Scholar]
- Casallas-Ojeda, M.R.; Marmolejo-Rebellón, L.F.; Torres-Lozada, P. Identification of factors and variables that influence the anaerobic digestion of municipal biowaste and food waste. Waste Biomass Valorization 2020, 12, 2889–2904. [Google Scholar] [CrossRef]
- Zhuang, H.; Amy Tan, G.-Y.; Jing, H.; Lee, P.-H.; Lee, D.-J.; Leu, S.-Y. Enhanced primary treatment for net energy production from sewage—The genetic clarification of substrate-acetate-methane pathway in anaerobic digestion. Chem. Eng. J. 2022, 431, 133416. [Google Scholar] [CrossRef]
- Bjornsson, L.; Murto, M.; Mattiasson, B. Evaluation of parameters for monitoring an anaerobic co-digestion process. Appl. Microbiol. Biotechnol. 2000, 54, 844–849. [Google Scholar] [CrossRef] [PubMed]
- Jin, X.; Angelidaki, I.; Zhang, Y. Microbial electrochemical monitoring of volatile fatty acids during anaerobic digestion. Environ. Sci. Technol. 2016, 50, 4422–4429. [Google Scholar] [CrossRef] [PubMed]
- Boe, K.; Batstone, D.J.; Steyer, J.P.; Angelidaki, I. State indicators for monitoring the anaerobic digestion process. Water Res. 2010, 44, 5973–5980. [Google Scholar] [CrossRef]
- García-Sandoval, J.P.; Méndez-Acosta, H.O.; González-Alvarez, V.; Schaum, A.; Alvarez, J. VFA robust control of an anaerobic digestion pilot plant: Experimental implementation. IFAC-PapersOnLine 2016, 49, 973–977. [Google Scholar] [CrossRef]
- Nielsen, H.B.; Ahring, B.K. Responses of the biogas process to pulses of oleate in reactors treating mixtures of cattle and pig manure. Biotechnol. Bioeng. 2006, 95, 96–105. [Google Scholar] [CrossRef] [PubMed]
- Cavaleiro, A.J.; Pereira, M.A.; Alves, M. Enhancement of methane production from long chain fatty acid based effluents. Bioresour. Technol. 2008, 99, 4086–4095. [Google Scholar] [CrossRef] [PubMed]
- De Vrieze, J.; Verstraete, W.; Boon, N. Repeated pulse feeding induces functional stability in anaerobic digestion. Microb. Biotechnol. 2013, 6, 414–424. [Google Scholar] [CrossRef] [PubMed]
- Peces, M.; Astals, S.; Mata-Alvarez, J. Response of a sewage sludge mesophilic anaerobic digester to short and long-term thermophilic temperature fluctuations. Chem. Eng. J. 2013, 233, 109–116. [Google Scholar] [CrossRef]
- Yu, L.; Li, R.; Delatolla, R.; Zhang, R.; Yang, X.; Peng, D. Natural continuous influent nitrifier immigration effects on nitrification and the microbial community of activated sludge systems. J. Environ. Sci 2018, 74, 159–167. [Google Scholar] [CrossRef]
- Peces, M.; Astals, S.; Jensen, P.D.; Clarke, W.P. Transition of microbial communities and degradation pathways in anaerobic digestion at decreasing retention time. New Biotechnol. 2021, 60, 52–61. [Google Scholar] [CrossRef]
- Zhu, L.; Wu, B.; Liu, Y.; Zhang, J.; Deng, R.; Gu, L. Strategy to enhance semi-continuous anaerobic digestion of food waste by combined use of calcium peroxide and magnetite. Water Res. 2022, 221, 118801. [Google Scholar] [CrossRef]
- García-Ruíz, M.J.; Castellano-Hinojosa, A.; Armato, C.; González-Martínez, A.; González-López, J.; Osorio, F. Biogas production and microbial community structure in a stable-stage of a two-stage anaerobic digester. AIChE J. 2019, 66, e16807. [Google Scholar] [CrossRef]
- Camarillo, R.; Rincón, J. Effect of inhibitory compounds on the anaerobic digestion performance of diluted wastewaters from the alimentary industry. J. Chem. Technol. Biotechnol. 2009, 84, 1615–1623. [Google Scholar] [CrossRef]
- Edwiges, T.; Bastos, J.A.; Lima Alino, J.H.; d’avila, L.; Frare, L.M.; Somer, J.G. Comparison of various pretreatment techniques to enhance biodegradability of lignocellulosic biomass for methane production. J. Environ. Chem. Eng. 2019, 7, 103495. [Google Scholar] [CrossRef]
- Di Berardino, S.; Costa, S.; Converti, A. Semi-continuous anaerobic digestion of a food industry wastewater in an anaerobic filter. Bioresour. Technol. 2000, 71, 261–266. [Google Scholar] [CrossRef]
- Chiu, S.L.H.; Lo, I.M.C. Reviewing the anaerobic digestion and co-digestion process of food waste from the perspectives on biogas production performance and environmental impacts. Environ. Sci. Pollut. Res. Int. 2016, 23, 24435–24450. [Google Scholar] [CrossRef] [PubMed]
- Borth, P.L.B.; Perin, J.K.H.; Torrecilhas, A.R.; Lopes, D.D.; Santos, S.C.; Kuroda, E.K.; Fernandes, F. Pilot-scale anaerobic co-digestion of food and garden waste: Methane potential, performance and microbial analysis. Biomass Bioenergy 2022, 157, 106331. [Google Scholar] [CrossRef]
- Lay, J.J.; Li, Y.Y.; Noike, T. The influence of pH and ammonia concentration on the methane production in high-solids digestion processes. Water Environ. Res. 1998, 70, 1075–1082. [Google Scholar] [CrossRef]
- Song, L.; Song, Y.; Li, D.; Liu, R.; Niu, Q. The auto fluorescence characteristics, specific activity, and microbial community structure in batch tests of mono-chicken manure digestion. Waste Manag. 2019, 83, 57–67. [Google Scholar] [CrossRef]
- Yenigün, O.; Demirel, B. Ammonia inhibition in anaerobic digestion: A review. Process Biochem. 2013, 48, 901–911. [Google Scholar] [CrossRef]
- Li, Y.; Zhang, Y.; Kong, X.; Li, L.; Yuan, Z.; Dong, R.; Sun, Y. Effects of ammonia on propionate degradation and microbial community in digesters using propionate as a sole carbon source. J. Chem. Technol. Biotechnol. 2017, 92, 2538–2545. [Google Scholar] [CrossRef]
- Peng, Y.; Yang, P.; Zhang, Y.; Wang, X.; Peng, X.; Li, L. Consecutive batch anaerobic digestion under ammonia stress: Microbial community assembly and process performance. J. Environ. Chem. Eng. 2021, 9, 106061. [Google Scholar] [CrossRef]
- Conklin, A.; Stensel, H.D.; Ferguson, J. Growth kinetics and competition between methanosarcina and methanosaeta in mesophilic anaerobic digestion. Water Environ. Res. 2006, 78, 486–496. [Google Scholar] [CrossRef]
- Fryer, M.; O’Flaherty, E.; Gray, N.F. Evaluating the measurement of activated sludge foam potential. Water 2011, 3, 424–444. [Google Scholar] [CrossRef]
- Strom, N.; Ma, Y.; Bi, Z.; Andersen, D.; Trabue, S.; Chen, C.; Hu, B. Eubacterium coprostanoligenes and Methanoculleus identified as potential producers of metabolites that contribute to swine manure foaming. J. Appl. Microbiol. 2022, 132, 2906–2924. [Google Scholar] [CrossRef]
- Pagilla, K.R.; Craney, K.C.; Kido, W.H. Causes and effects of foaming in anaerobic sludge digesters. Wat. Sci. Technol. 1997, 36, 463–470. [Google Scholar] [CrossRef]
- He, Q.; Li, L.; Zhao, X.; Qu, L.; Wu, D.; Peng, X. Investigation of foaming causes in three mesophilic food waste digesters: Reactor performance and microbial analysis. Sci. Rep. 2017, 7, 13701. [Google Scholar] [CrossRef]
- Steinberg, L.M.; Regan, J.M. Response of lab-scale methanogenic reactors inoculated from different sources to organic loading rate shocks. Bioresour. Technol. 2011, 102, 8790–8798. [Google Scholar] [CrossRef]
- Fonoll, X.; Astals, S.; Dosta, J.; Mata-Alvarez, J. Anaerobic co-digestion of sewage sludge and fruit wastes: Evaluation of the transitory states when the co-substrate is changed. Chem. Eng. J. 2015, 262, 1268–1274. [Google Scholar] [CrossRef]
- Coggins, L.X.; Ghisalberti, M.; Ghadouani, A. Sludge accumulation and distribution impact the hydraulic performance in waste stabilisation ponds. Water Res. 2017, 110, 354–365. [Google Scholar] [CrossRef]
- Wang, L.K.; Hung, Y.-T.; Lo, H.H.; Yapijakis, C. Waste Treatment in the Food Processing Industry; Taylor & Francis: Boca Raton, FL, USA, 2006. [Google Scholar]
- Liang, H.; Luo, X.; Ye, D.; Yan, J.; Luo, L. Seasonal succession of bacterial communities, metabolic potential and ecological functions in soy sauce wastewater treatment system. Int. Biodeterior. Biodegrad. 2020, 154, 105083. [Google Scholar] [CrossRef]
- Austermann-Haun, U.; Seyfried, C.F.; Rosenwinkel, K.-H. Full scale experiences with anaerobic pre-treatment of wastewater in the food and beverage industry in Germany. Wat. Sci. Technol. 1997, 36, 321–328. [Google Scholar] [CrossRef]
- Guo, J.; Peng, Y.; Ni, B.J.; Han, X.; Fan, L.; Yuan, Z. Dissecting microbial community structure and methane-producing pathways of a full-scale anaerobic reactor digesting activated sludge from wastewater treatment by metagenomic sequencing. Microb. Cell Fact. 2015, 14, 33. [Google Scholar] [CrossRef]
- Jiang, F.; Gao, H.; Qin, W.; Song, P.; Wang, H.; Zhang, J.; Liu, D.; Wang, D.; Zhang, T. Marked seasonal variation in structure and function of gut microbiota in forest and alpine musk deer. Front. Microbiol. 2021, 12, 699797. [Google Scholar] [CrossRef]
- Morotomi, M.; Nagai, F.; Watanabe, Y. Description of Christensenella minuta gen. nov., sp. nov., isolated from human faeces, which forms a distinct branch in the order Clostridiales, and proposal of Christensenellaceae fam. Nov. Int. J. Syst. Evol. Microbiol. 2012, 62, 144–149. [Google Scholar] [CrossRef]
- Werner, J.J.; Knights, D.; Garcia, M.L.; Scalfone, N.B.; Smith, S.; Yarasheski, K.; Cummings, T.A.; Beers, A.R.; Knight, R.; Angenent, L.T. Bacterial community structures are unique and resilient in full-scale bioenergy systems. Proc. Natl. Acad. Sci. USA 2011, 108, 4158–4163. [Google Scholar] [CrossRef]
- Dworkin, M.; Falkow, S.; Rosenberg, E.; Schleifer, K.-H.; Stackebrandt, E. The Prokaryotes, 3rd ed.; Springer Science+Business Media: New York, NY, USA, 2006; Volume 4. [Google Scholar]
- Guo, F.; Zhang, T.; Li, B.; Wang, Z.; Ju, F.; Liang, Y.T. Mycobacterial species and their contribution to cholesterol degradation in wastewater treatment plants. Sci. Rep. 2019, 9, 836. [Google Scholar] [CrossRef]
- Bonk, F.; Popp, D.; Weinrich, S.; Strauber, H.; Kleinsteuber, S.; Harms, H.; Centler, F. Intermittent fasting for microbes: How discontinuous feeding increases functional stability in anaerobic digestion. Biotechnol. Biofuels 2018, 11, 274. [Google Scholar] [CrossRef]
- Kang, S.; Khan, S.; Webb, R.; Denman, S.; McSweeney, C. Characterization and survey in cattle of a rumen Pyrimadobacter sp. Which degrades the plant toxin fluoroacetate. FEMS Microbiol. Ecol. 2020, 96, fiaa077. [Google Scholar] [CrossRef]
- Coyte, K.Z.; Schluter, J.; Foster, K.R. The ecology of the microbiome: Networks, competition, and stability. Science 2015, 350, 663–666. [Google Scholar] [CrossRef]
- Gaio, J.; Lora, N.L.; Iltchenco, J.; Magrini, F.E.; Paesi, S. Seasonal characterization of the prokaryotic microbiota of full-scale anaerobic UASB reactors treating domestic sewage in southern Brazil. Bioprocess. Biosyst. Eng. 2023, 46, 69–87. [Google Scholar] [CrossRef]
- Zhang, L.; Loh, K.C.; Zhang, J.; Mao, L.; Tong, Y.W.; Wang, C.H.; Dai, Y. Three-stage anaerobic co-digestion of food waste and waste activated sludge: Identifying bacterial and methanogenic archaeal communities and their correlations with performance parameters. Bioresour. Technol. 2019, 285, 121333. [Google Scholar] [CrossRef]
- De Vrieze, J.; Hennebel, T.; Boon, N.; Verstraete, W. Methanosarcina: The rediscovered methanogen for heavy duty biomethanation. Bioresour. Technol. 2012, 112, 1–9. [Google Scholar] [CrossRef]
- Vanwonterghem, I.; Jensen, P.D.; Dennis, P.G.; Hugenholtz, P.; Rabaey, K.; Tyson, G.W. Deterministic processes guide long-term synchronised population dynamics in replicate anaerobic digesters. ISME J. 2014, 8, 2015–2028. [Google Scholar] [CrossRef]
Figure 1.
Schematic of the microbial process of anaerobic digestion, showing phases, metabolic compounds present, likely bacterial genera, and potential actions for increasing reaction rate. Adapted from [4,5]. The rate-limiting step is usually hydrolysis, acetogenesis, or methanogenesis, depending on substrate composition, reactor conditions, and microbial community. Maintaining a lower pH is beneficial for acidogenesis, and maintaining a higher pH is beneficial for methanogenesis.

Figure 2.
Biogas yield of food manufacturing wastewater (A) and co-digestion of food manufacturing and logistics wastewaters (A + B), with (+ BC) and without biochar additive using sludge acclimatised through successive digestions [92]. Yield for total biogas, including methane and carbon dioxide (mL gVS−1).

Figure 3.
Gas production (mL day − 1 L−1) (a), pH (b), and VFA concentration (mg kg−1) (c) during single-feed acclimatisation of sludge to Substrate A, indicating shifts in pH and VFA accumulation as microbial community adapts and metabolises substrate. The period of highest gas production rate is later after initialisation than that of the final acclimatised BMP assay (Figure 2). Foaming events are marked as A, B, and C.

Figure 4.
Daily gas production yield (mL gVS−1 day−1) (a), methane percentage (b), pH (c), calculated DNA content of digester (ng g−1) (d), and VFA concentration (e) during semi-continuous operation. Stage I (Sample A mono-digestion) shows stable gas production and methane percentage, with a slow decrease in pH and gradual accumulation of VFA in 30 d HRT reactors (digesters 1 and 2). For Stage II, the short initial period of co-digestion is shown further in Figure 5. Gas production rate decreased as VFA was steady and pH continued a gradual descent in recovery Stage III. Stage IV saw pH and gas production recover slightly before falling sharply as VFA concentrations, particularly acetate, increased. A second recovery period (Stage V) is detailed in Figure 6, but Stage VI showed instability similar to initial acclimatisation. DNA concentration, as an indicator of biomass, trends downwards throughout. Gas yields are summarised in Table 4.

Figure 5.
Instantaneous gas production rate at the end of Substrate A mono-digestion, during Substrates A and B co-digestion (Stage II), and at the beginning of the recovery period. Daily production rate peaks followed shortly after the digester was fed with the substrate. The presence of two distinct bands in digester 2 is likely due to minor foaming, with gas building up and being released when foam cells collapse. HRT was 30 days in digesters 1 and 2 and 45 days in digesters 3 and 4. The full feed program is shown in Table 3.

Figure 6.
Instantaneous gas production rates during recovery Stage V. HRT was 30 days in digesters 1 and 2 and 45 days in digesters 3 and 4. The full feed program is shown in Table 3. Digester 4 showed the earliest recovery, having the lowest VFA concentration when feeding ceased. Digester 2, with the highest VFA level and lowest gas production leading into the stage, took the longest to recover.

Figure 7.
Richness as unique operational taxonomic units (OTUs) observed (a), Shannon diversity (b), and Pielou Evenness (c) of digester community at different HRTs and over time (d). The microbial community became less rich and less even over time; that is, fewer OTUs were observed, and relative abundance was skewed towards certain taxa. No significant difference was found between HRT treatments during semi-continuous operation.

Figure 8.
Principal component analysis (PCA) ordination of anaerobic digester genomics samples at different HRTs over time.
Figure 8.
Principal component analysis (PCA) ordination of anaerobic digester genomics samples at different HRTs over time.

Figure 9.
Heatmap of genera present in any sample at 0.02 relative abundance over time and different HRT. Acclim and 30 and 45 refer to the acclimation stage and HRT during semi-continuous operation, respectively. Stages as per Table 3 are marked with dotted lines in 30 and 45 d HRT sections (left to right: Substrate A mono-digestion; Substrate A + B co-digestion; recovery period; Substrate A + B co-digestion; recovery period; Substrate A + B co-digestion).

Figure 10.
Plot of relative abundances of methanogens over time. The number in columns denotes the relative abundance of all methanogens in the entire sample. The digester is shown on the right. HRT was 30 days in digesters 1 and 2 and 45 days in digesters 3 and 4, as per Table 3. Feed changed from pure food manufacturing wastewater to co-digestion of food manufacturing and logistics wastewaters between day 38 and day 45 samples.


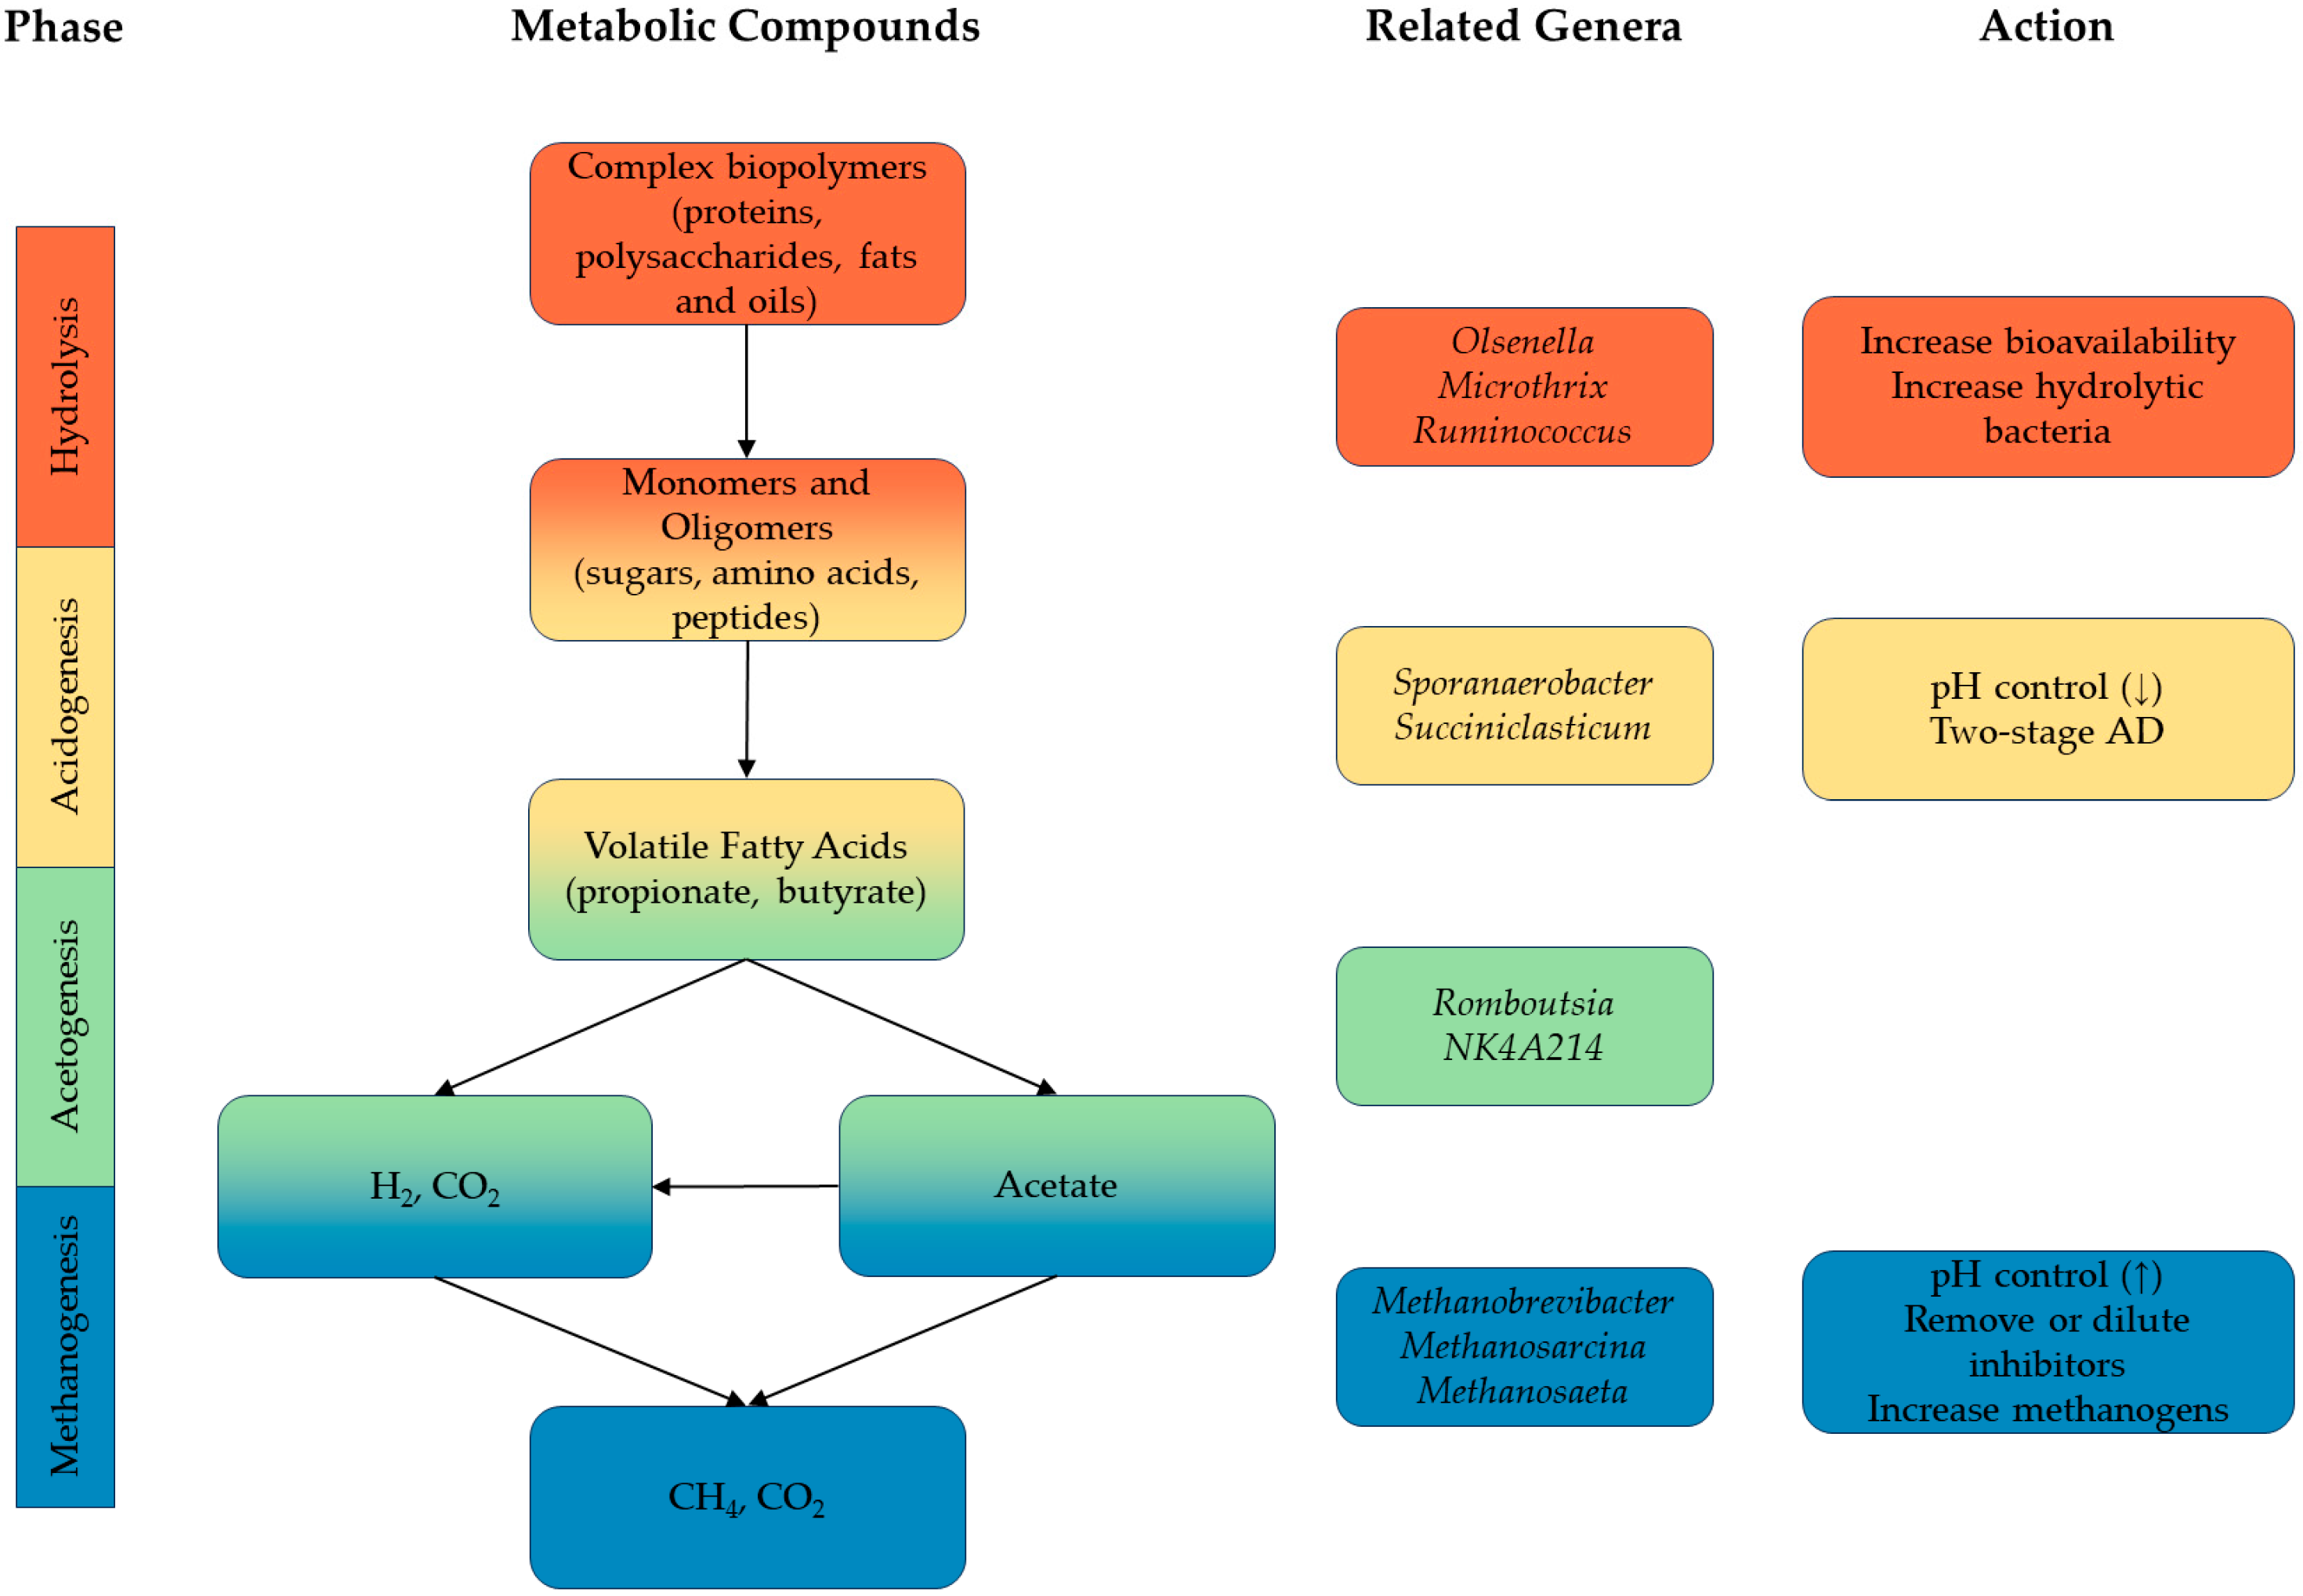
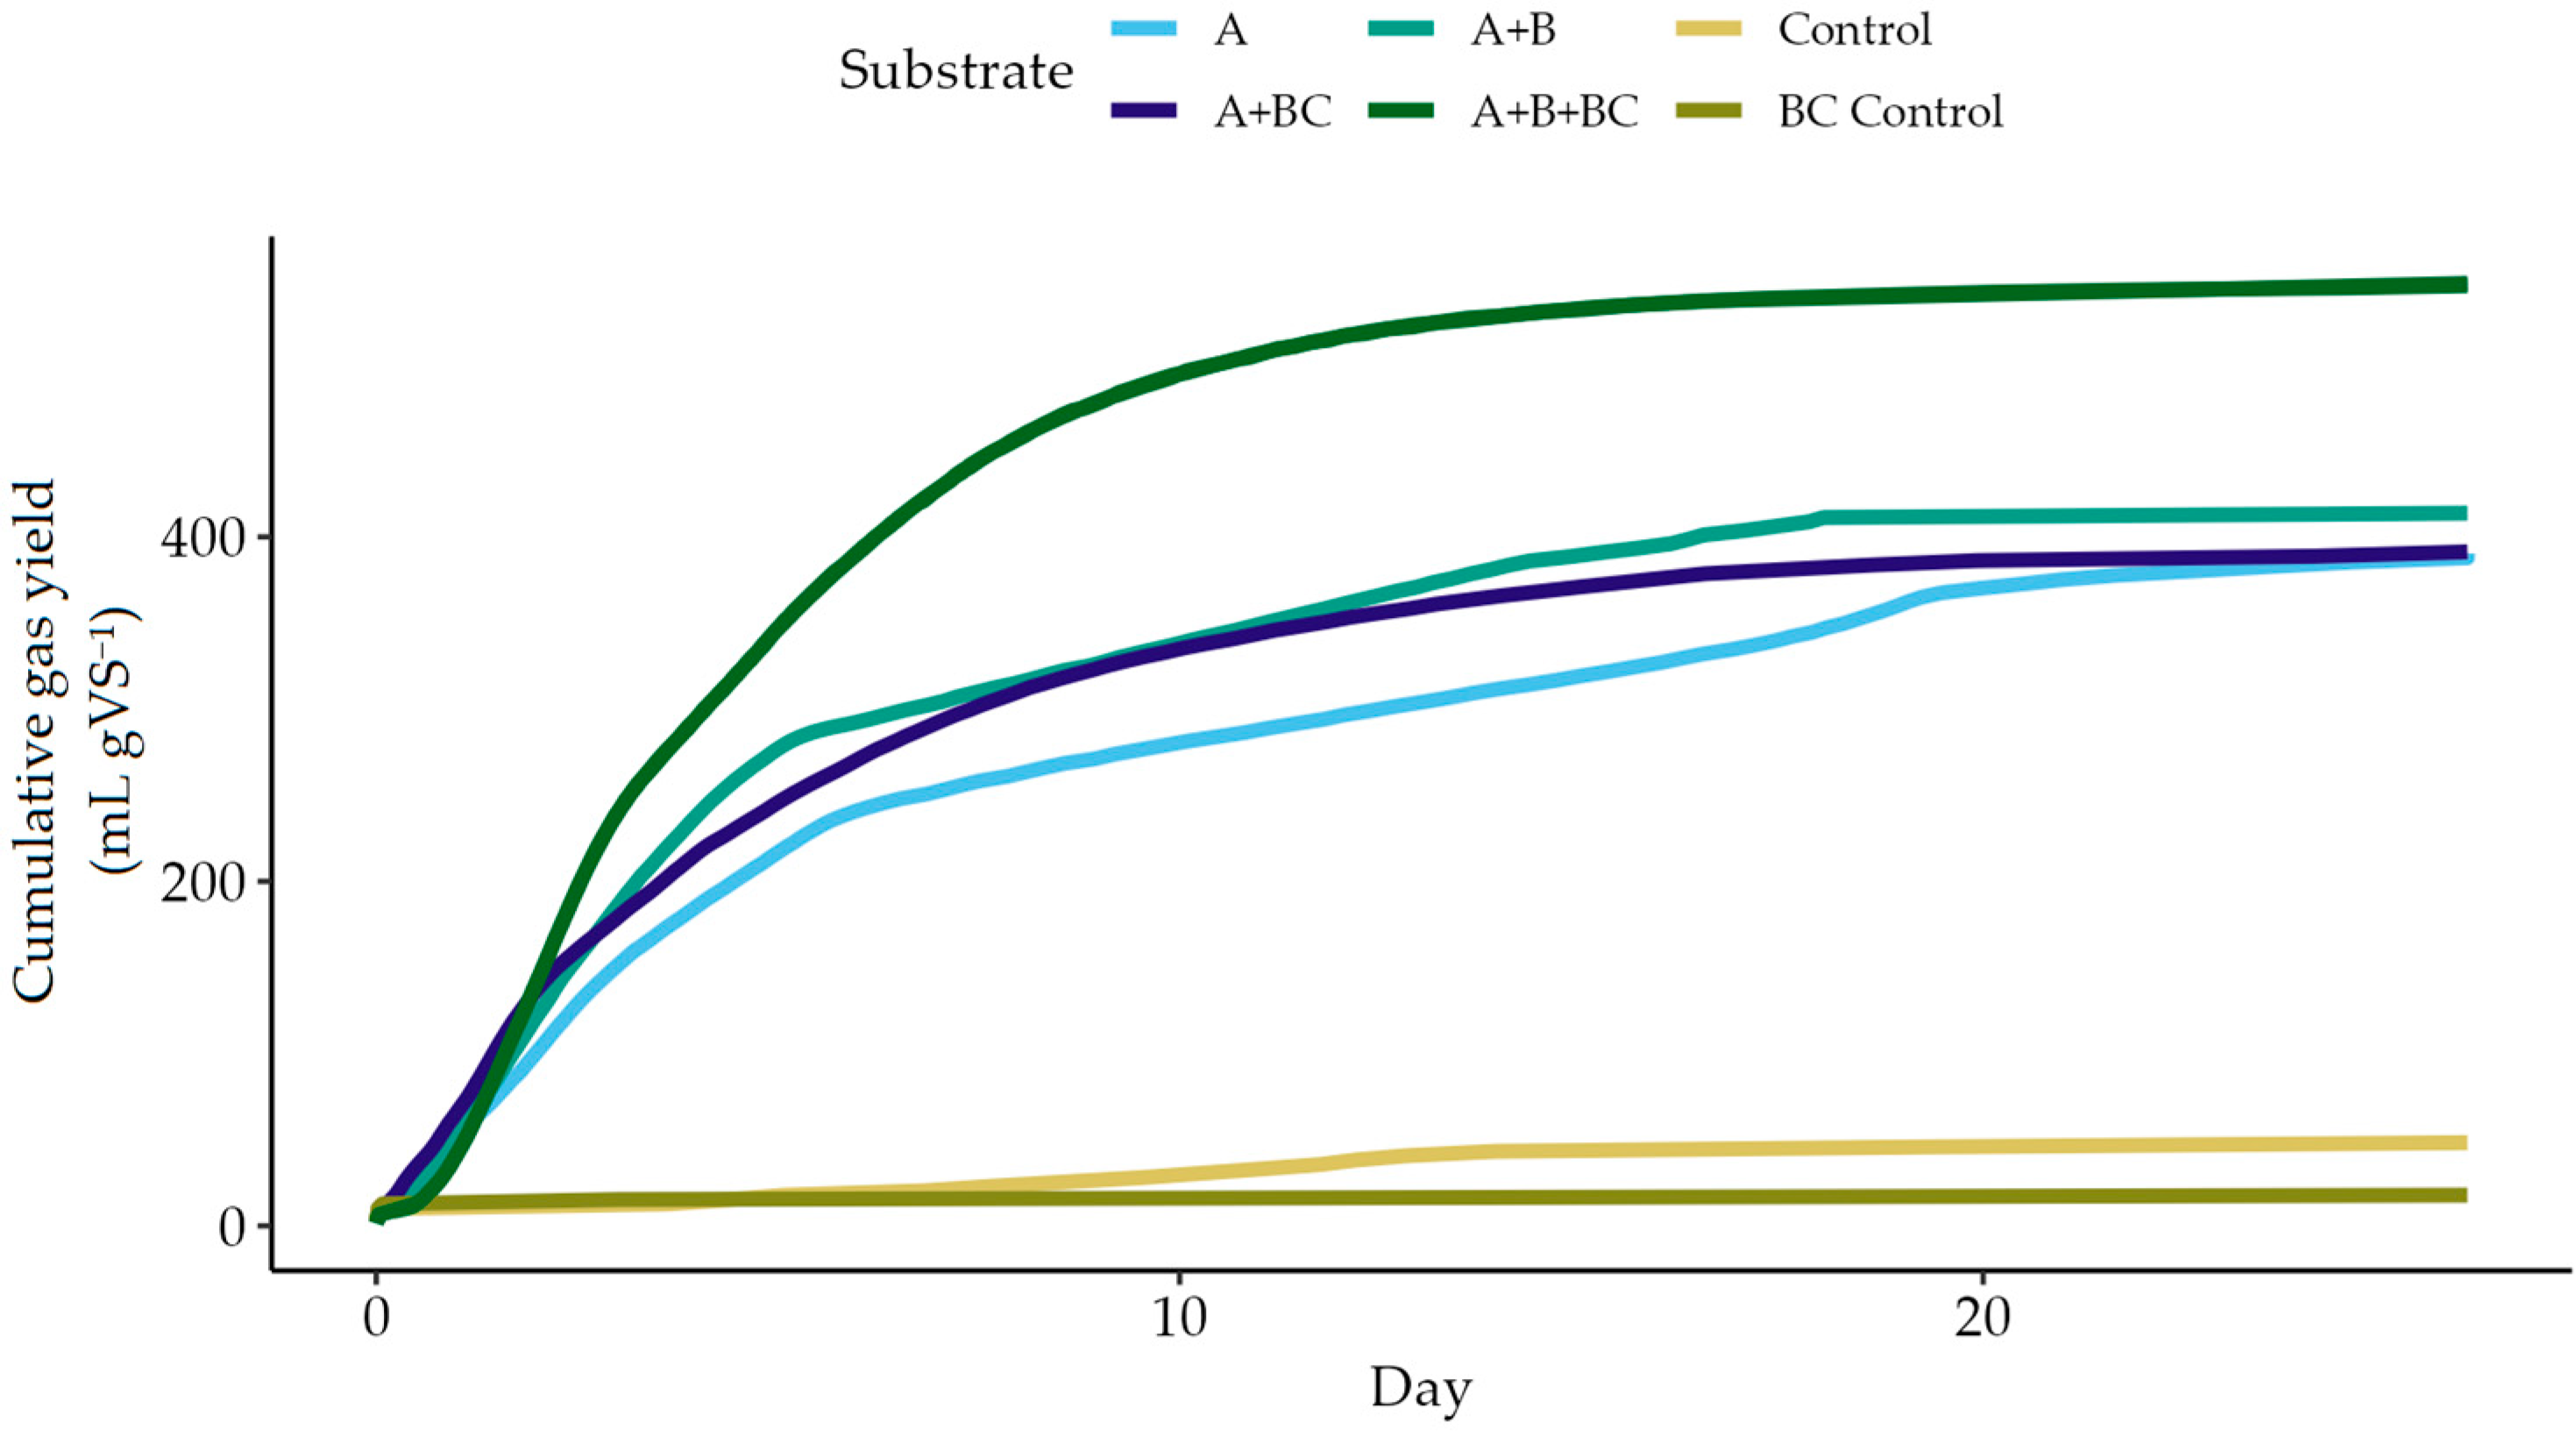
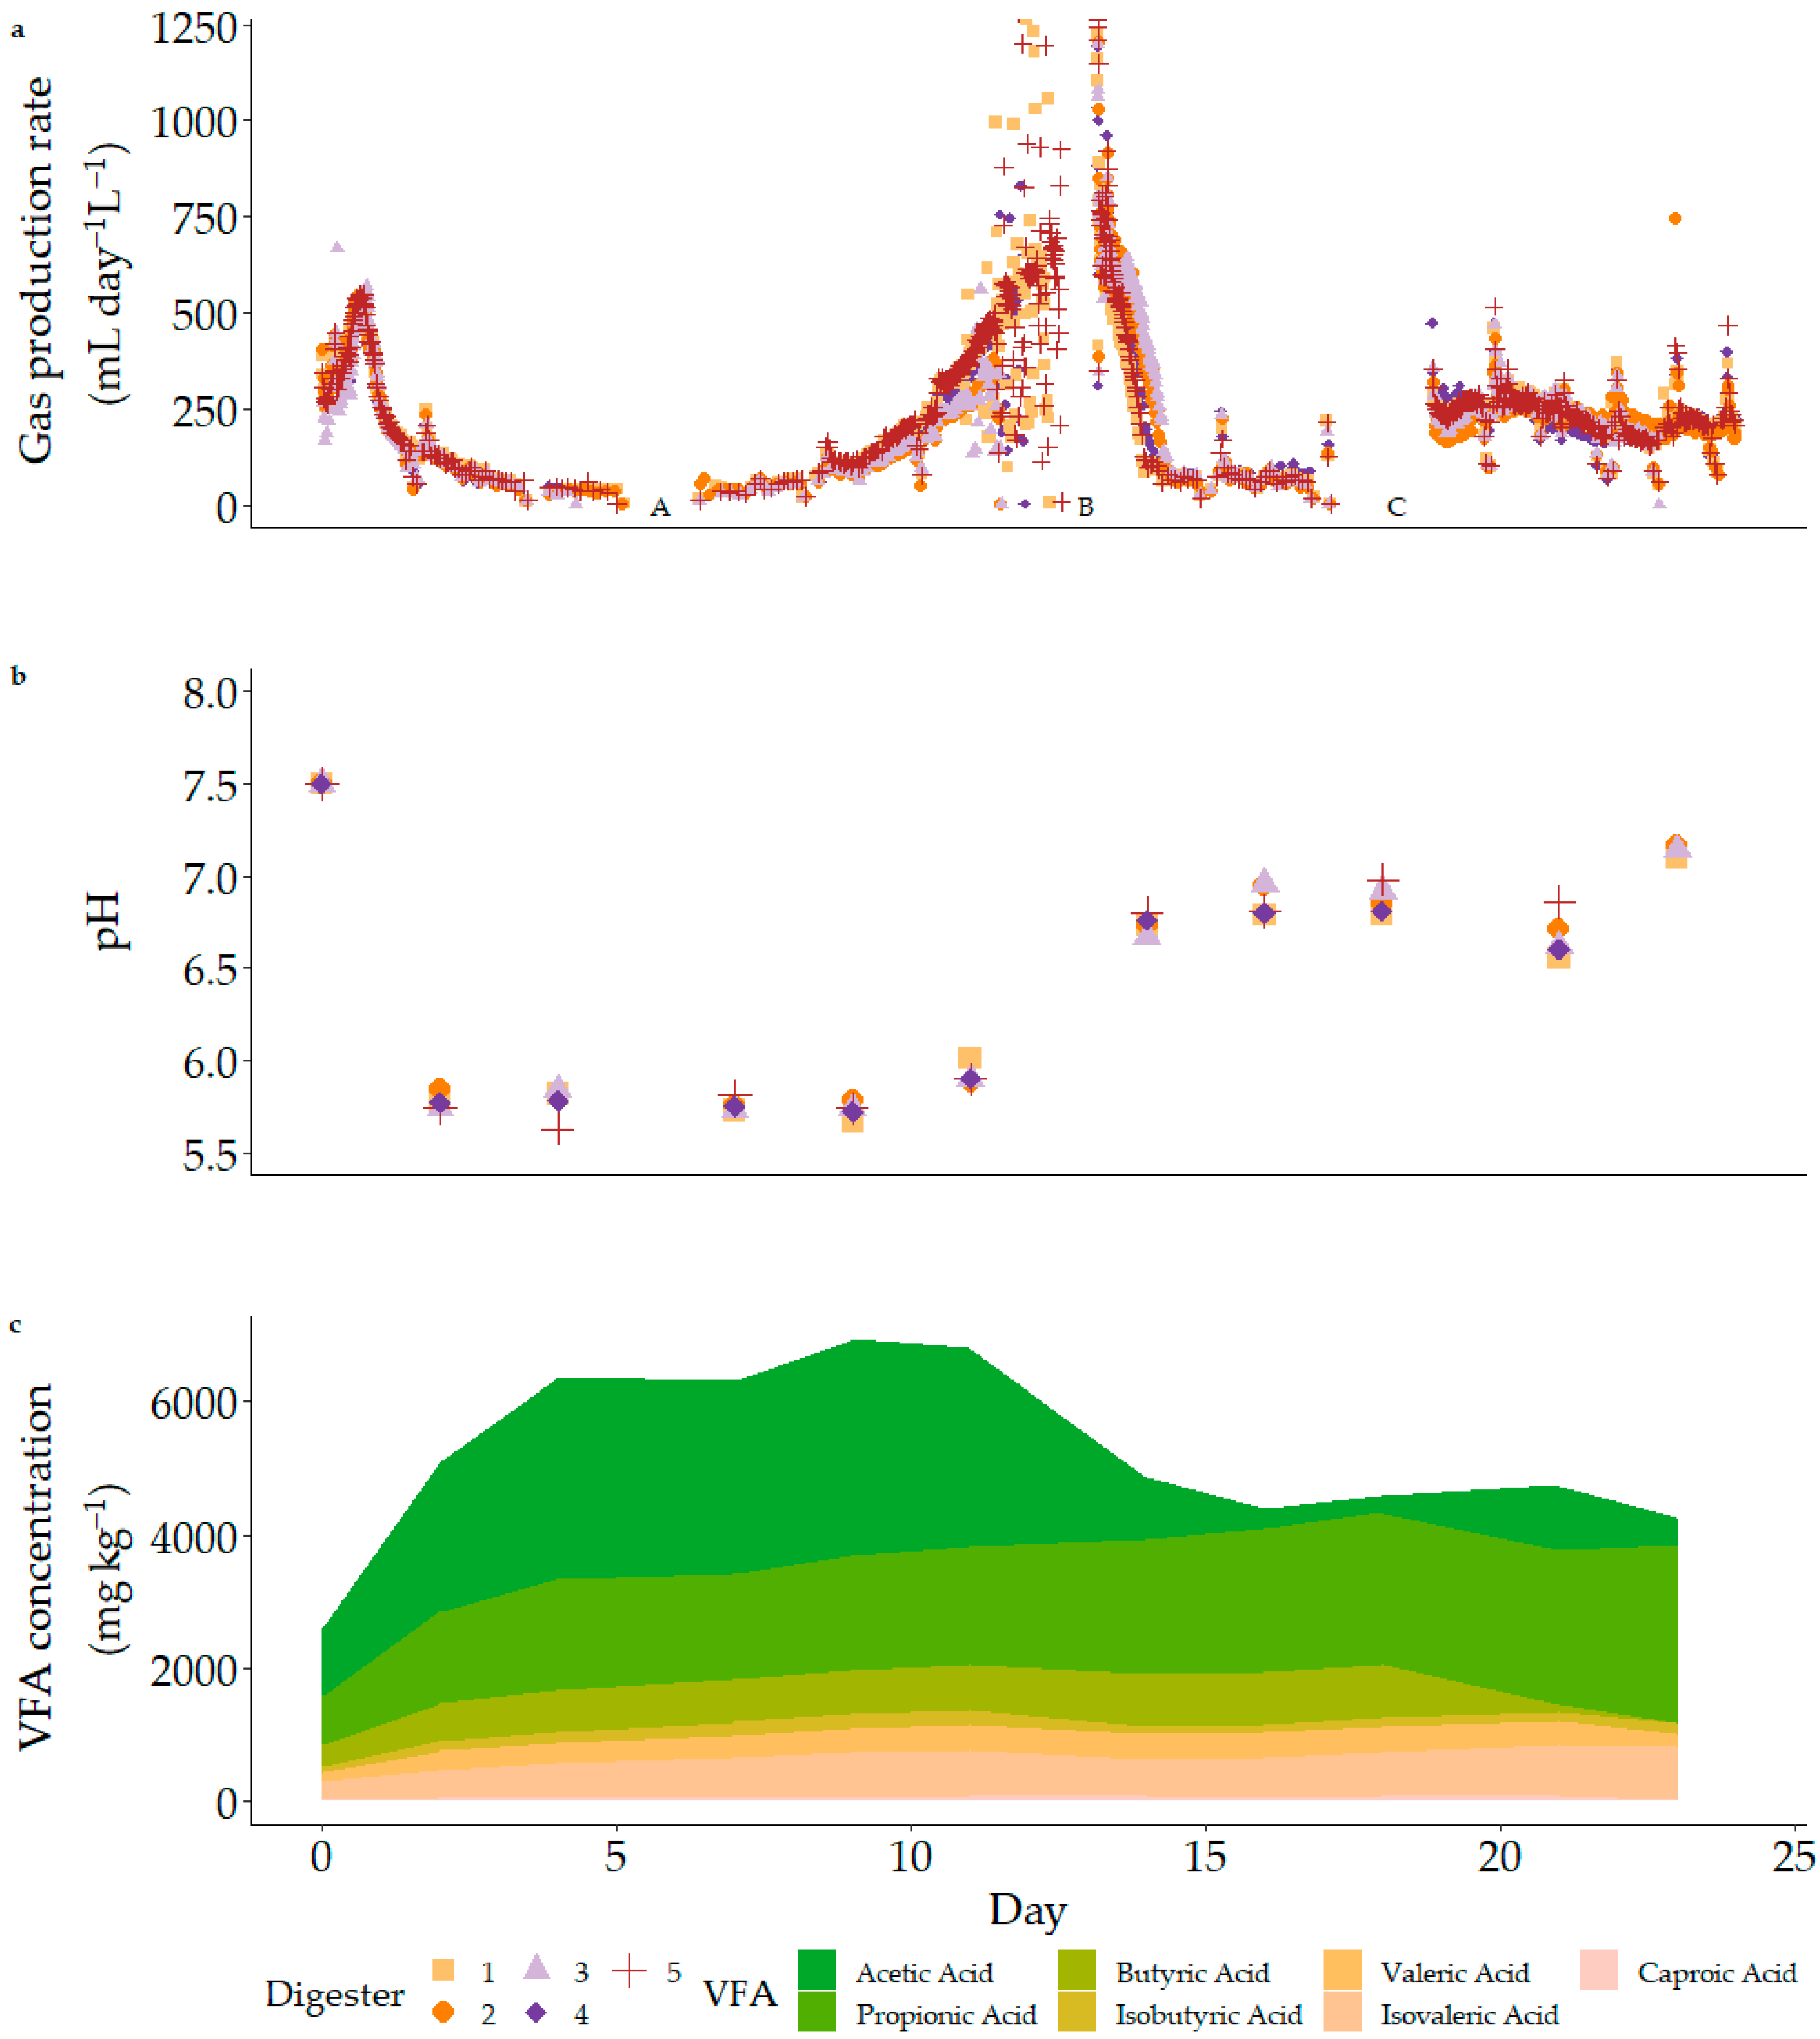
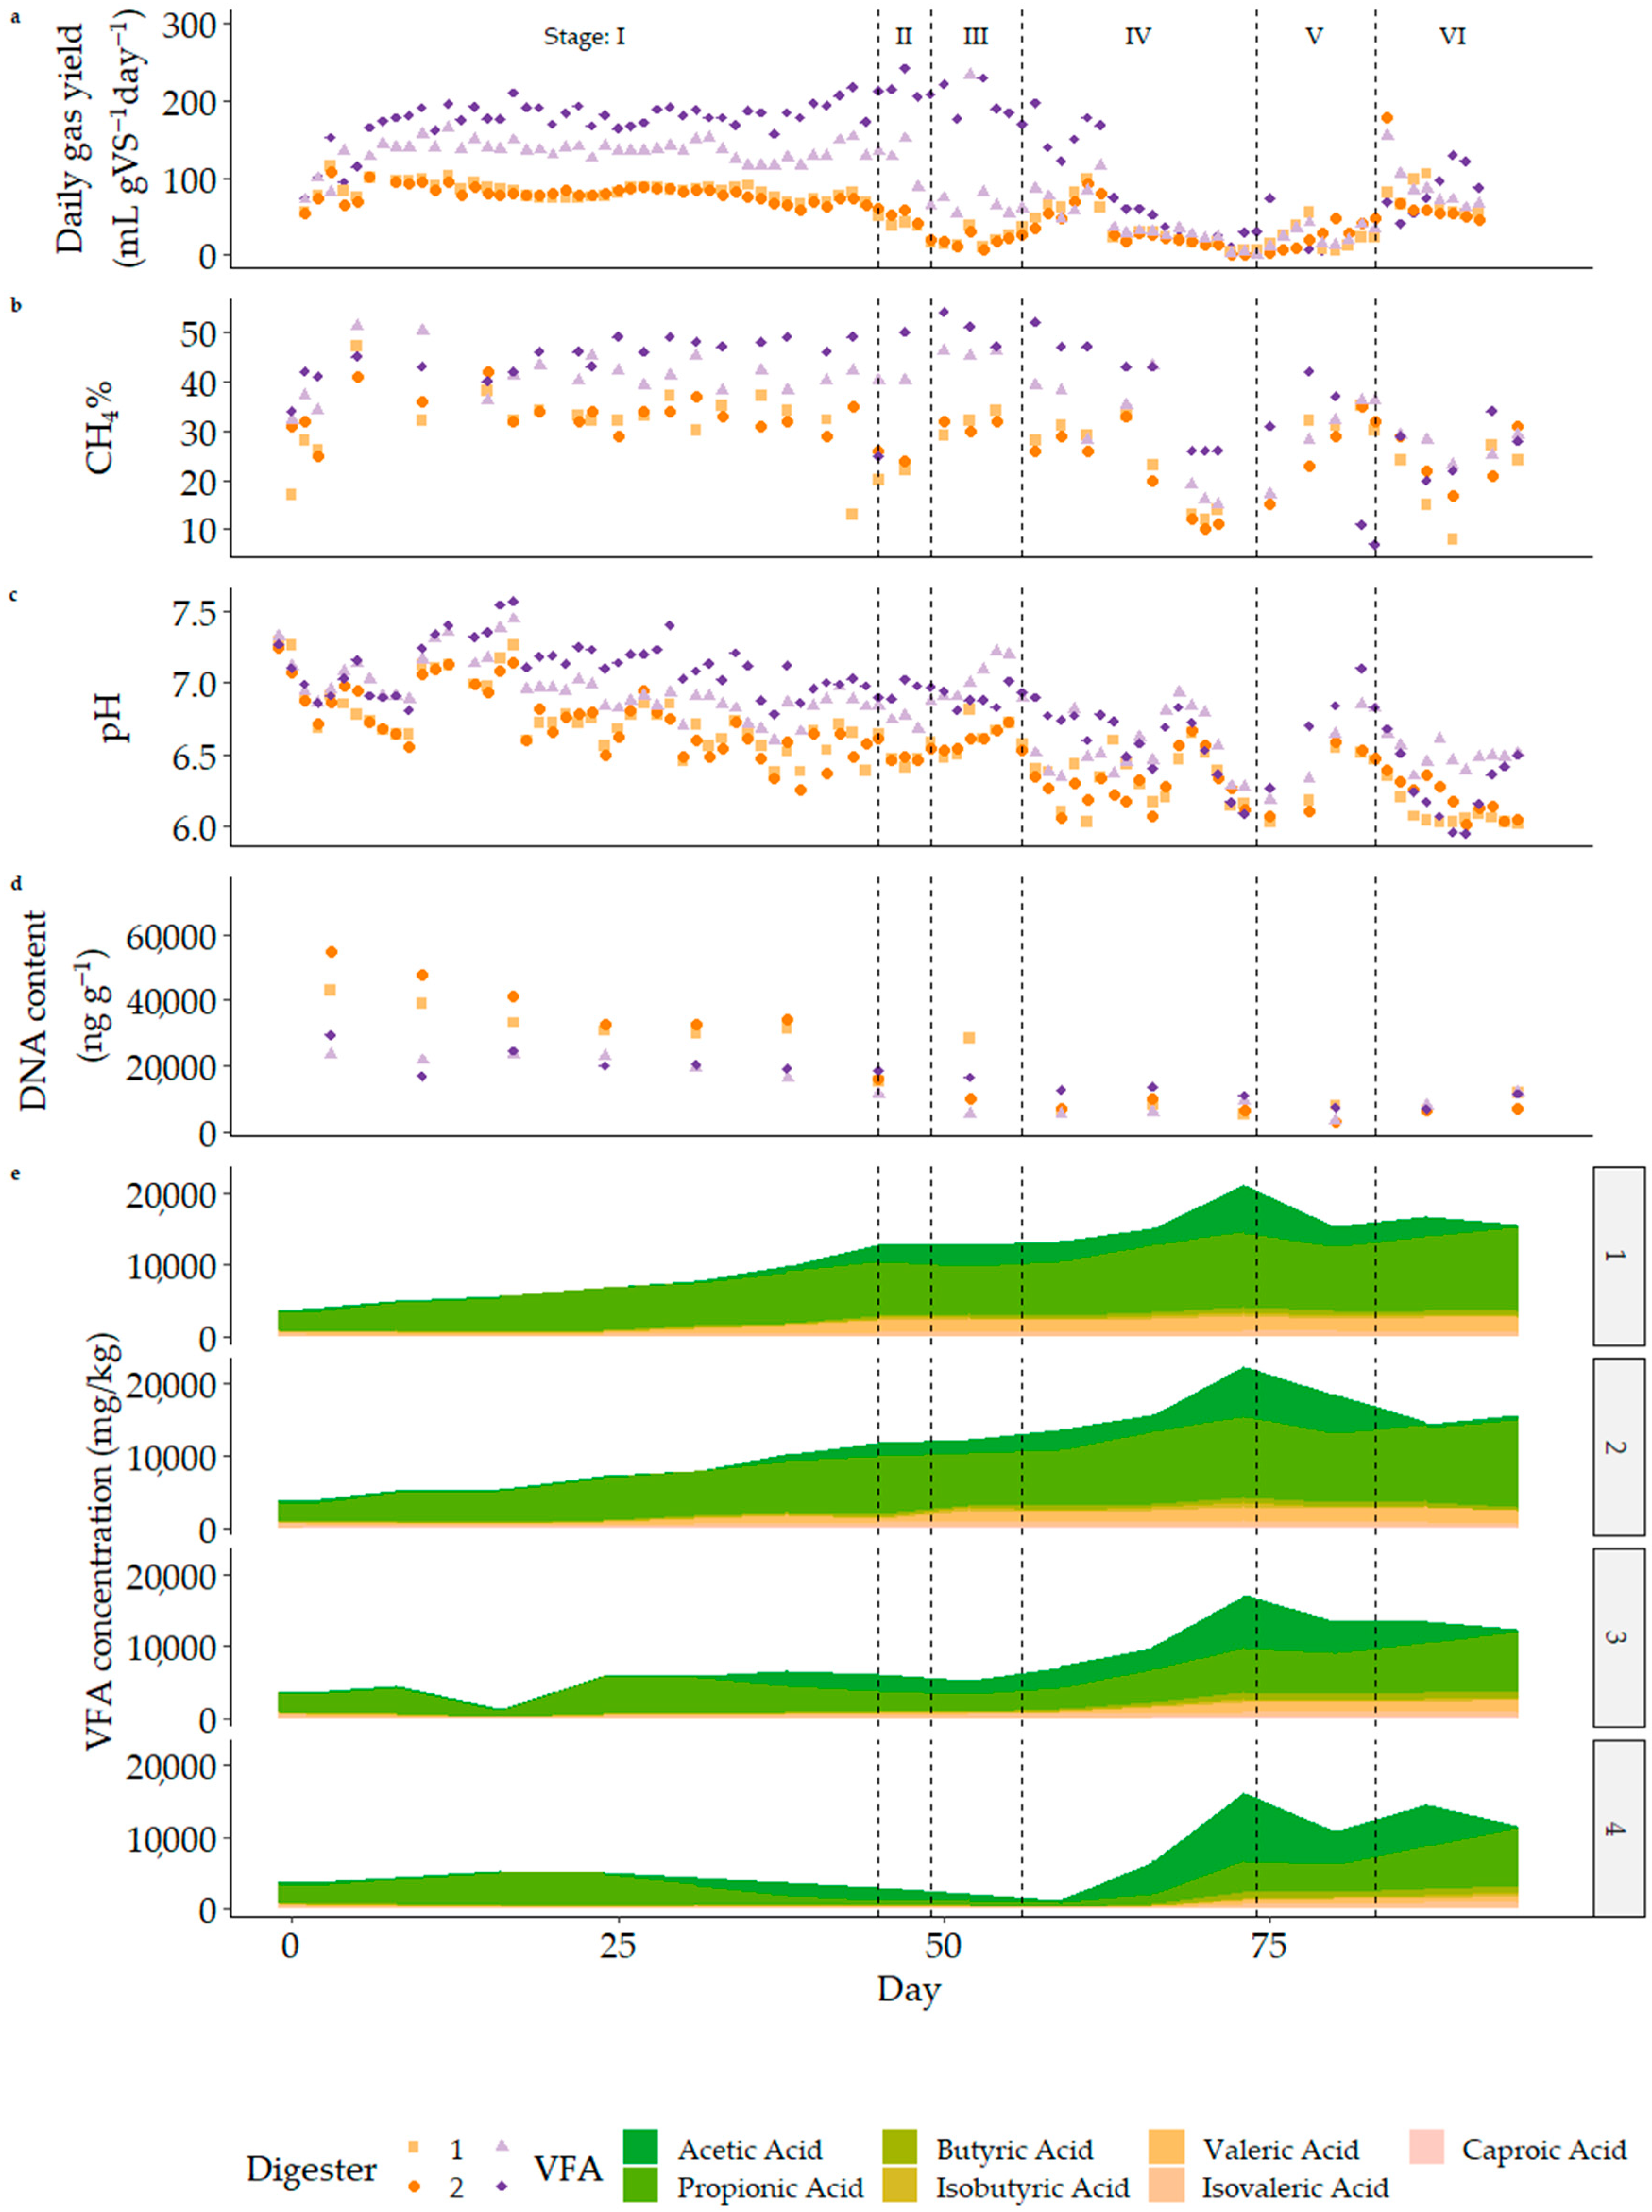
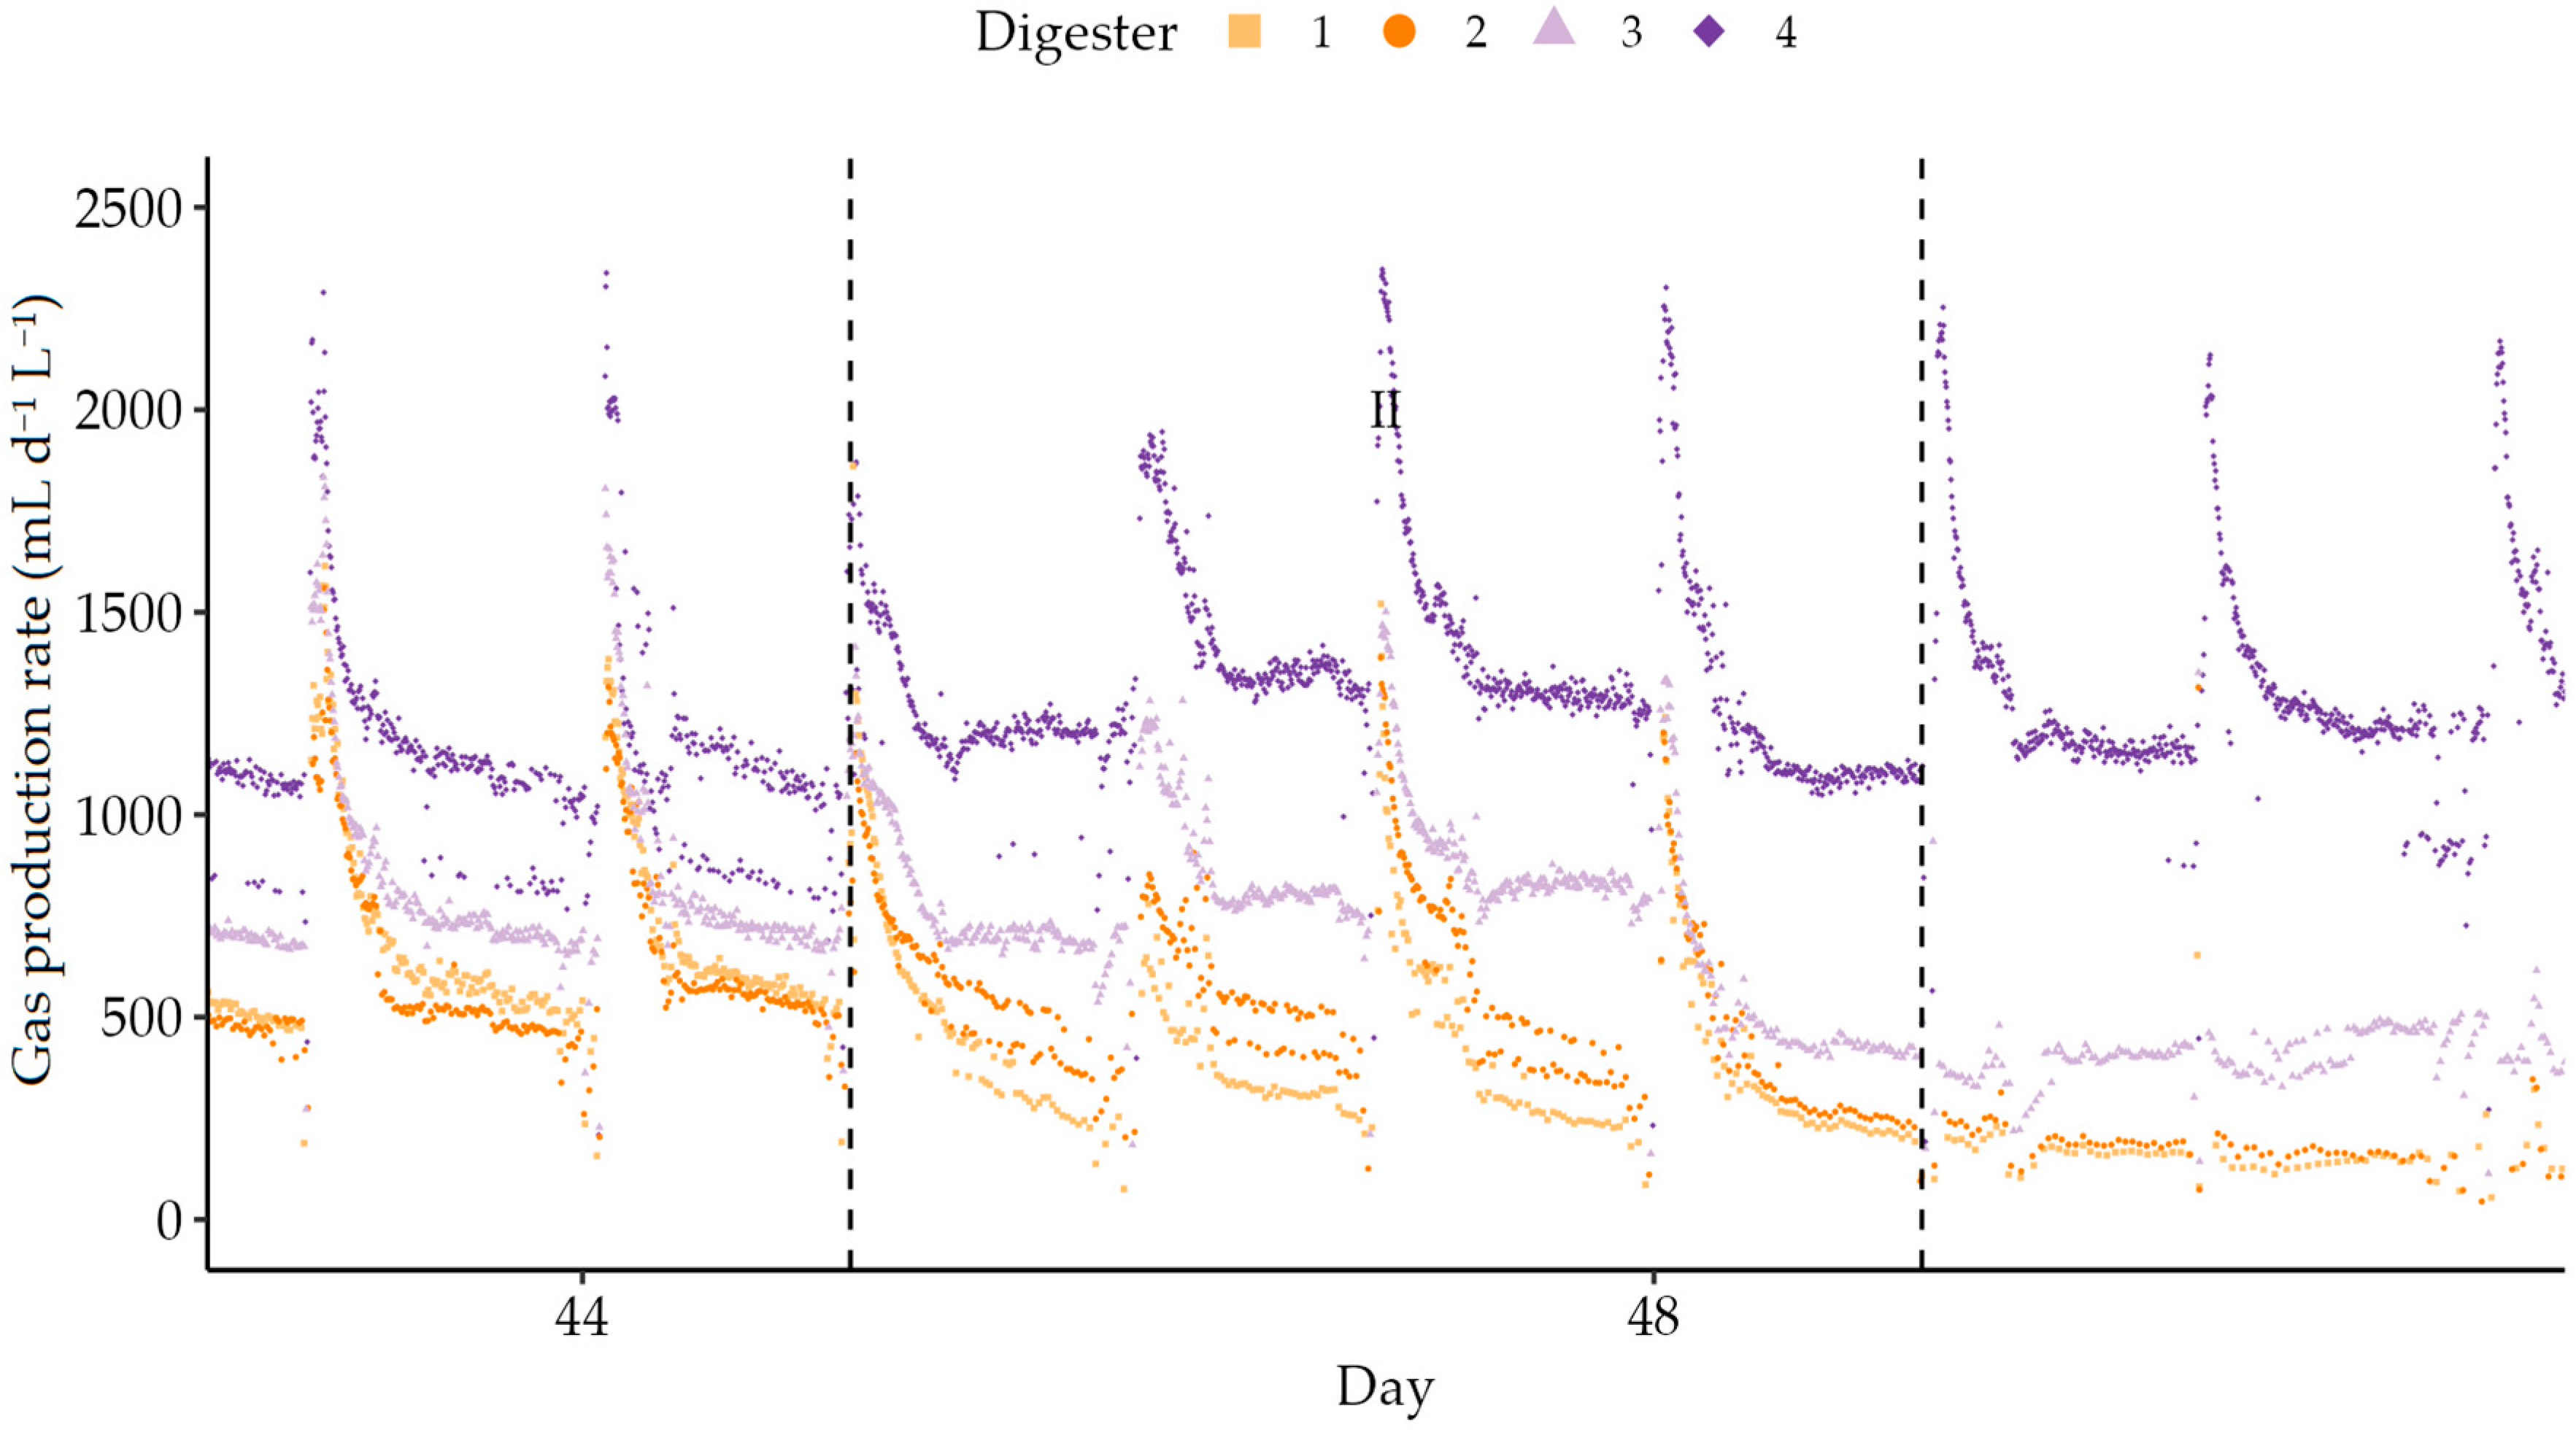
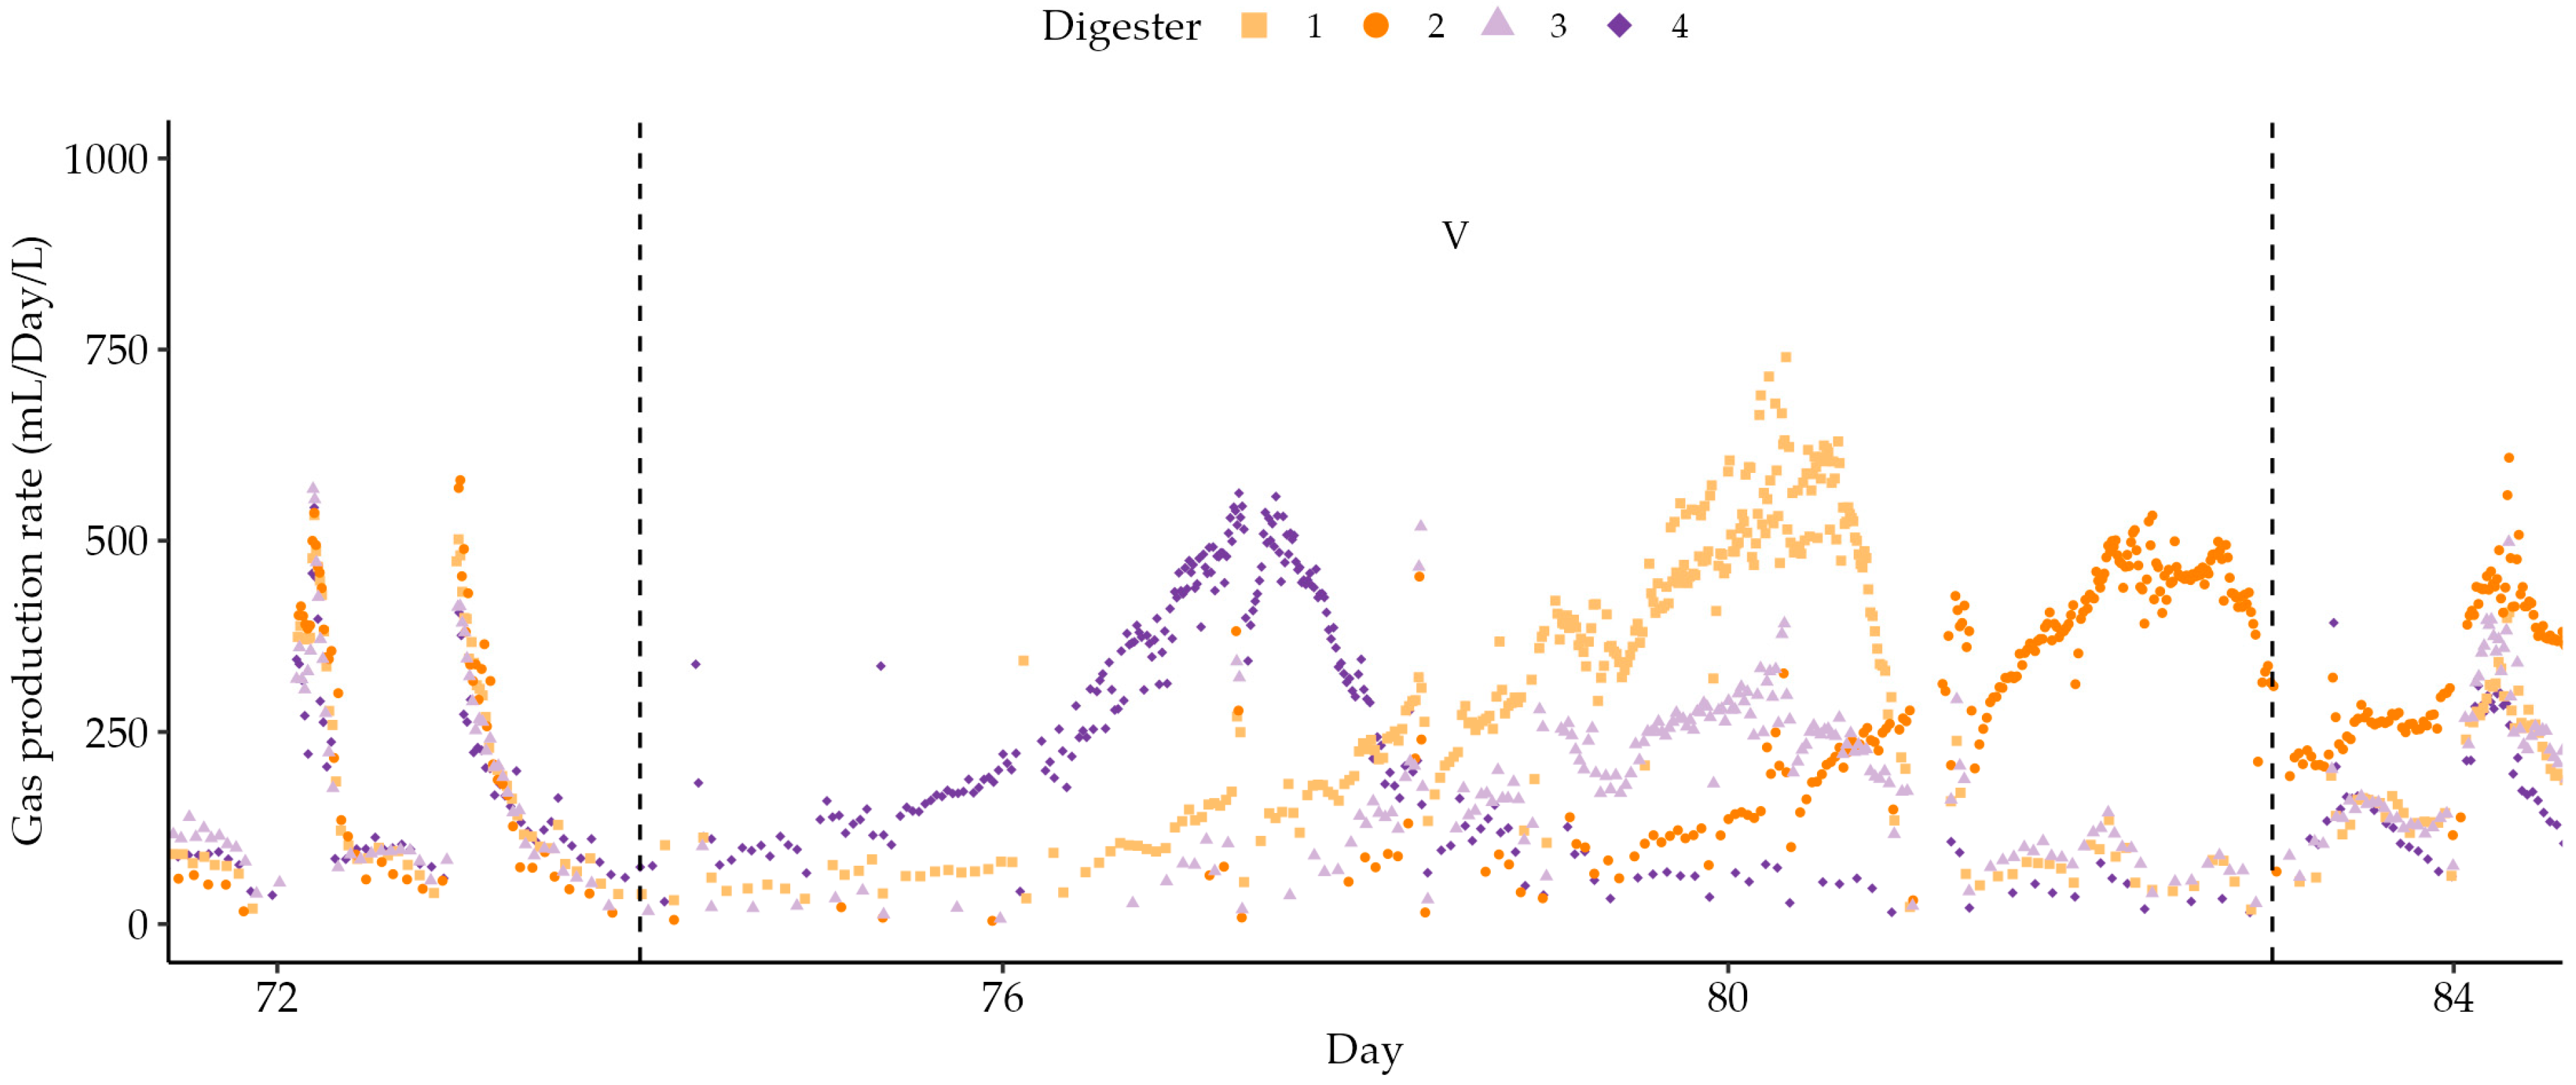
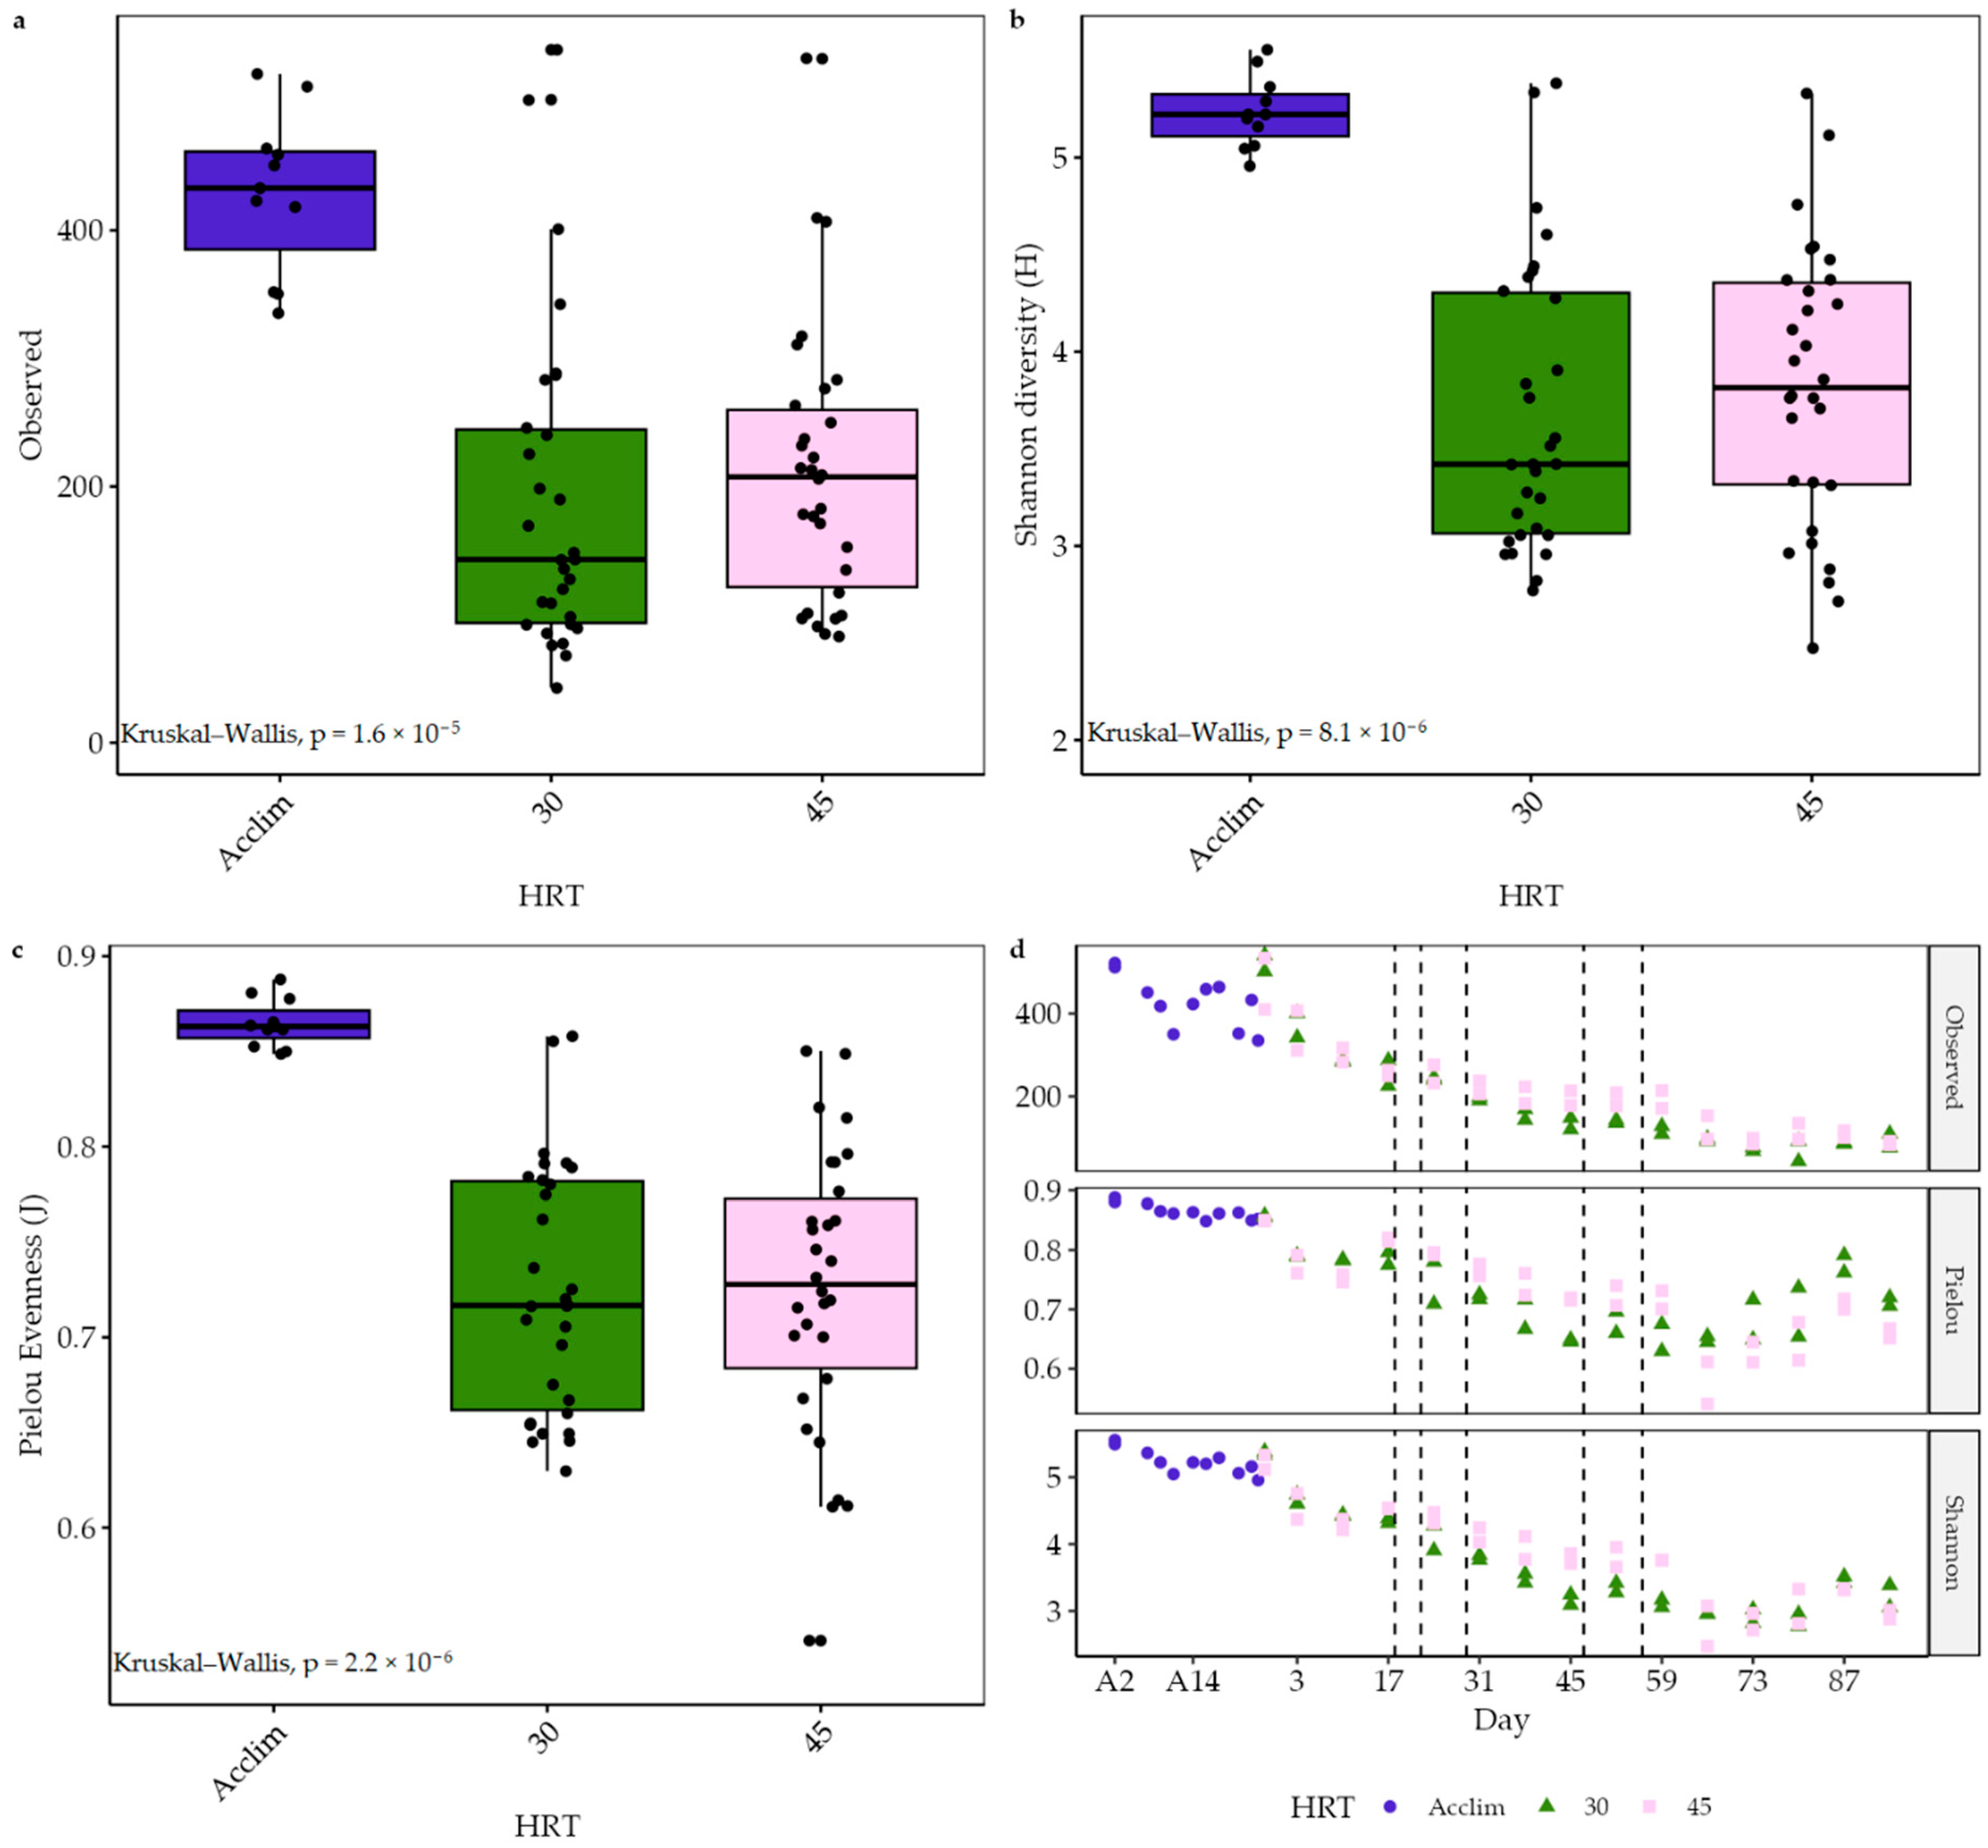
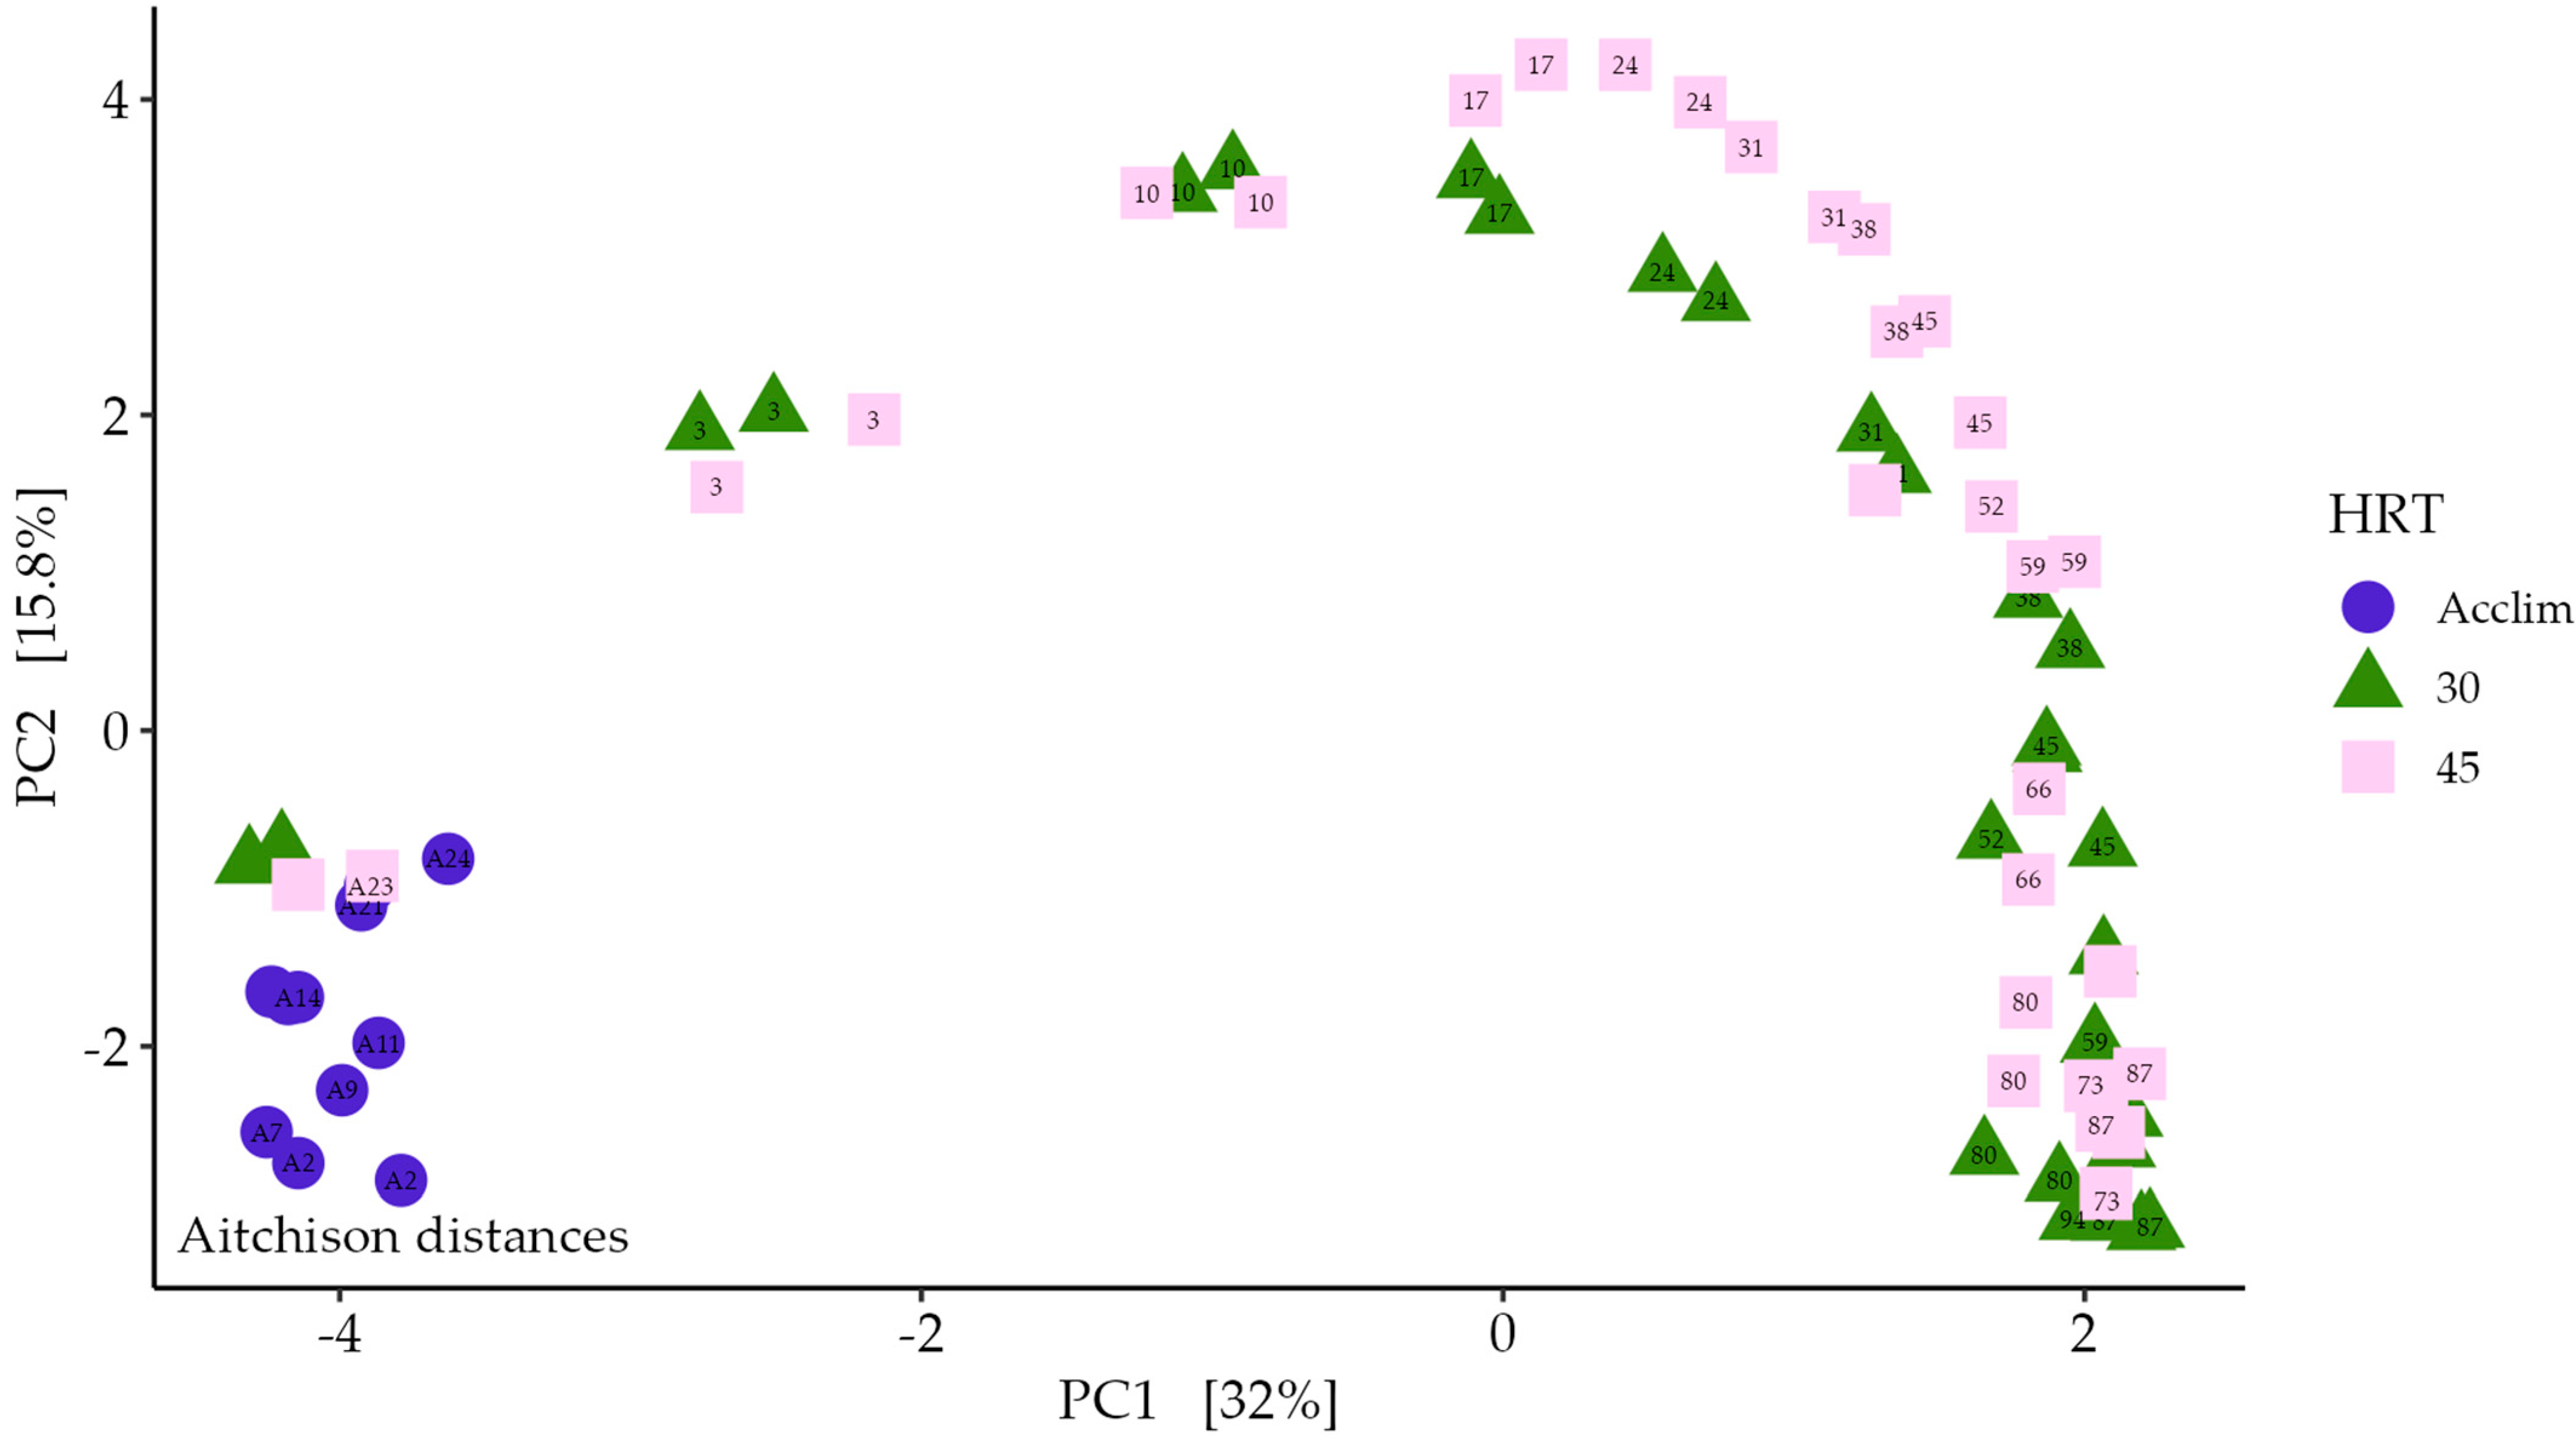
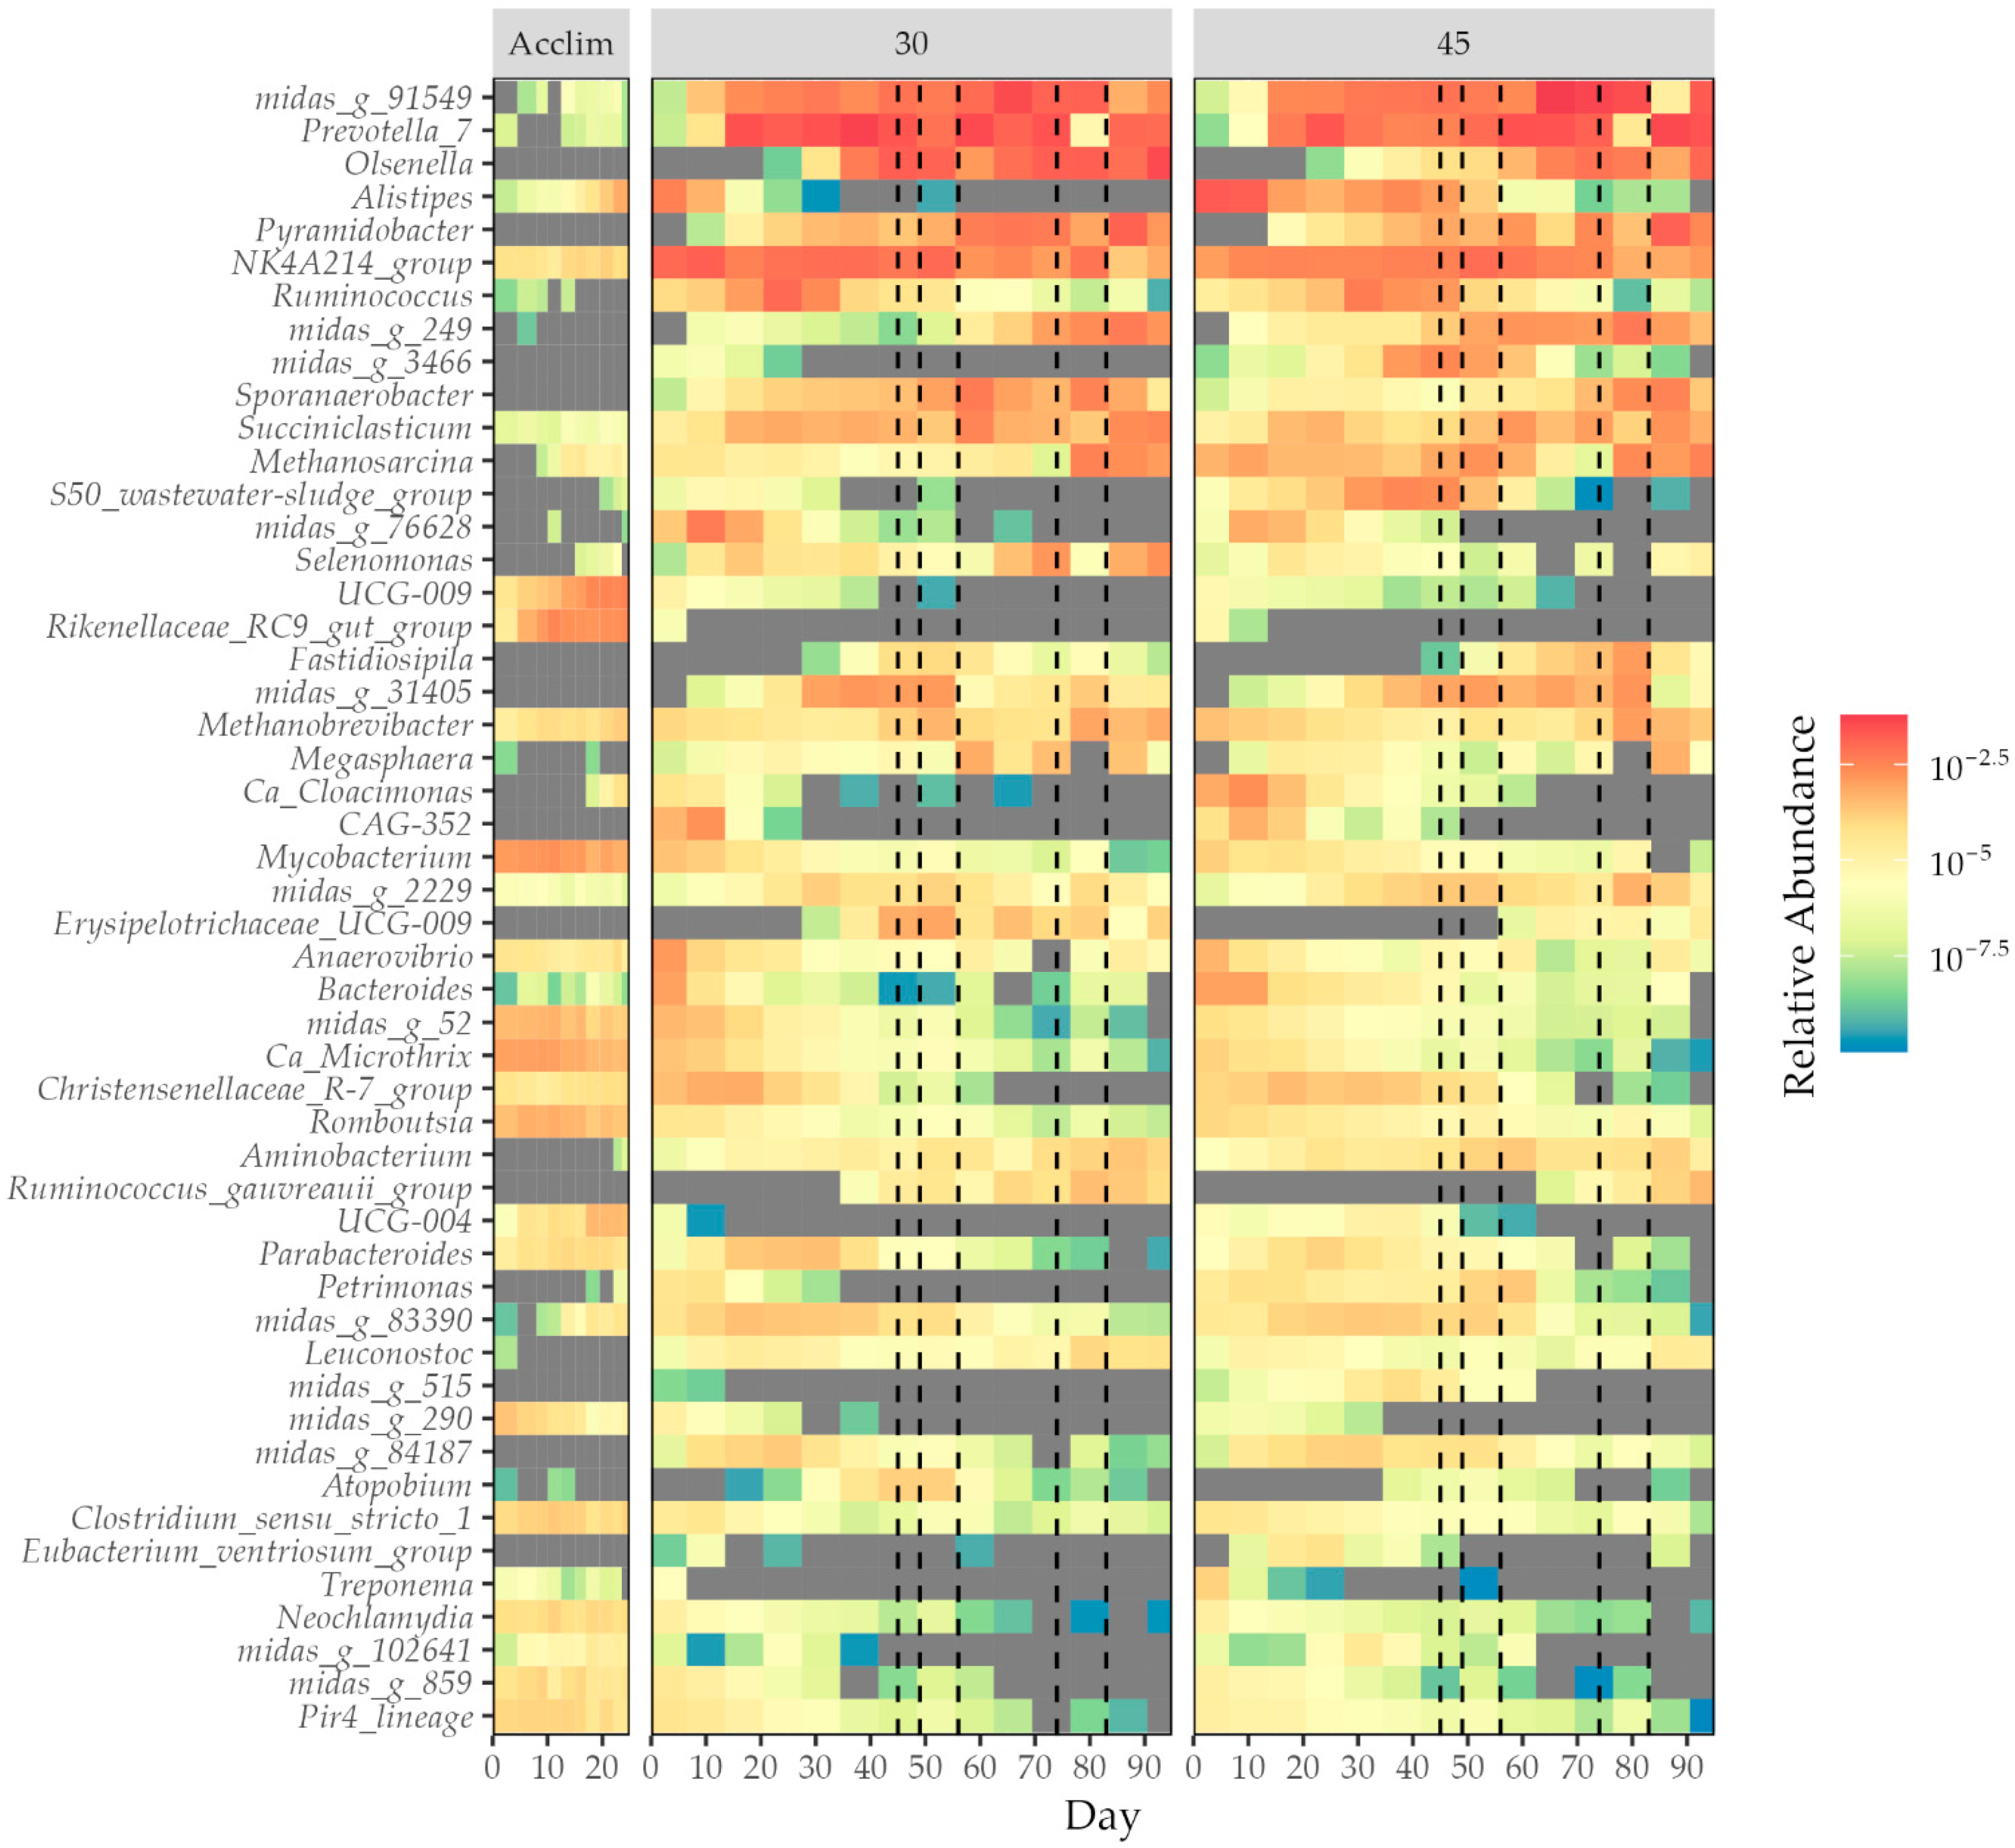
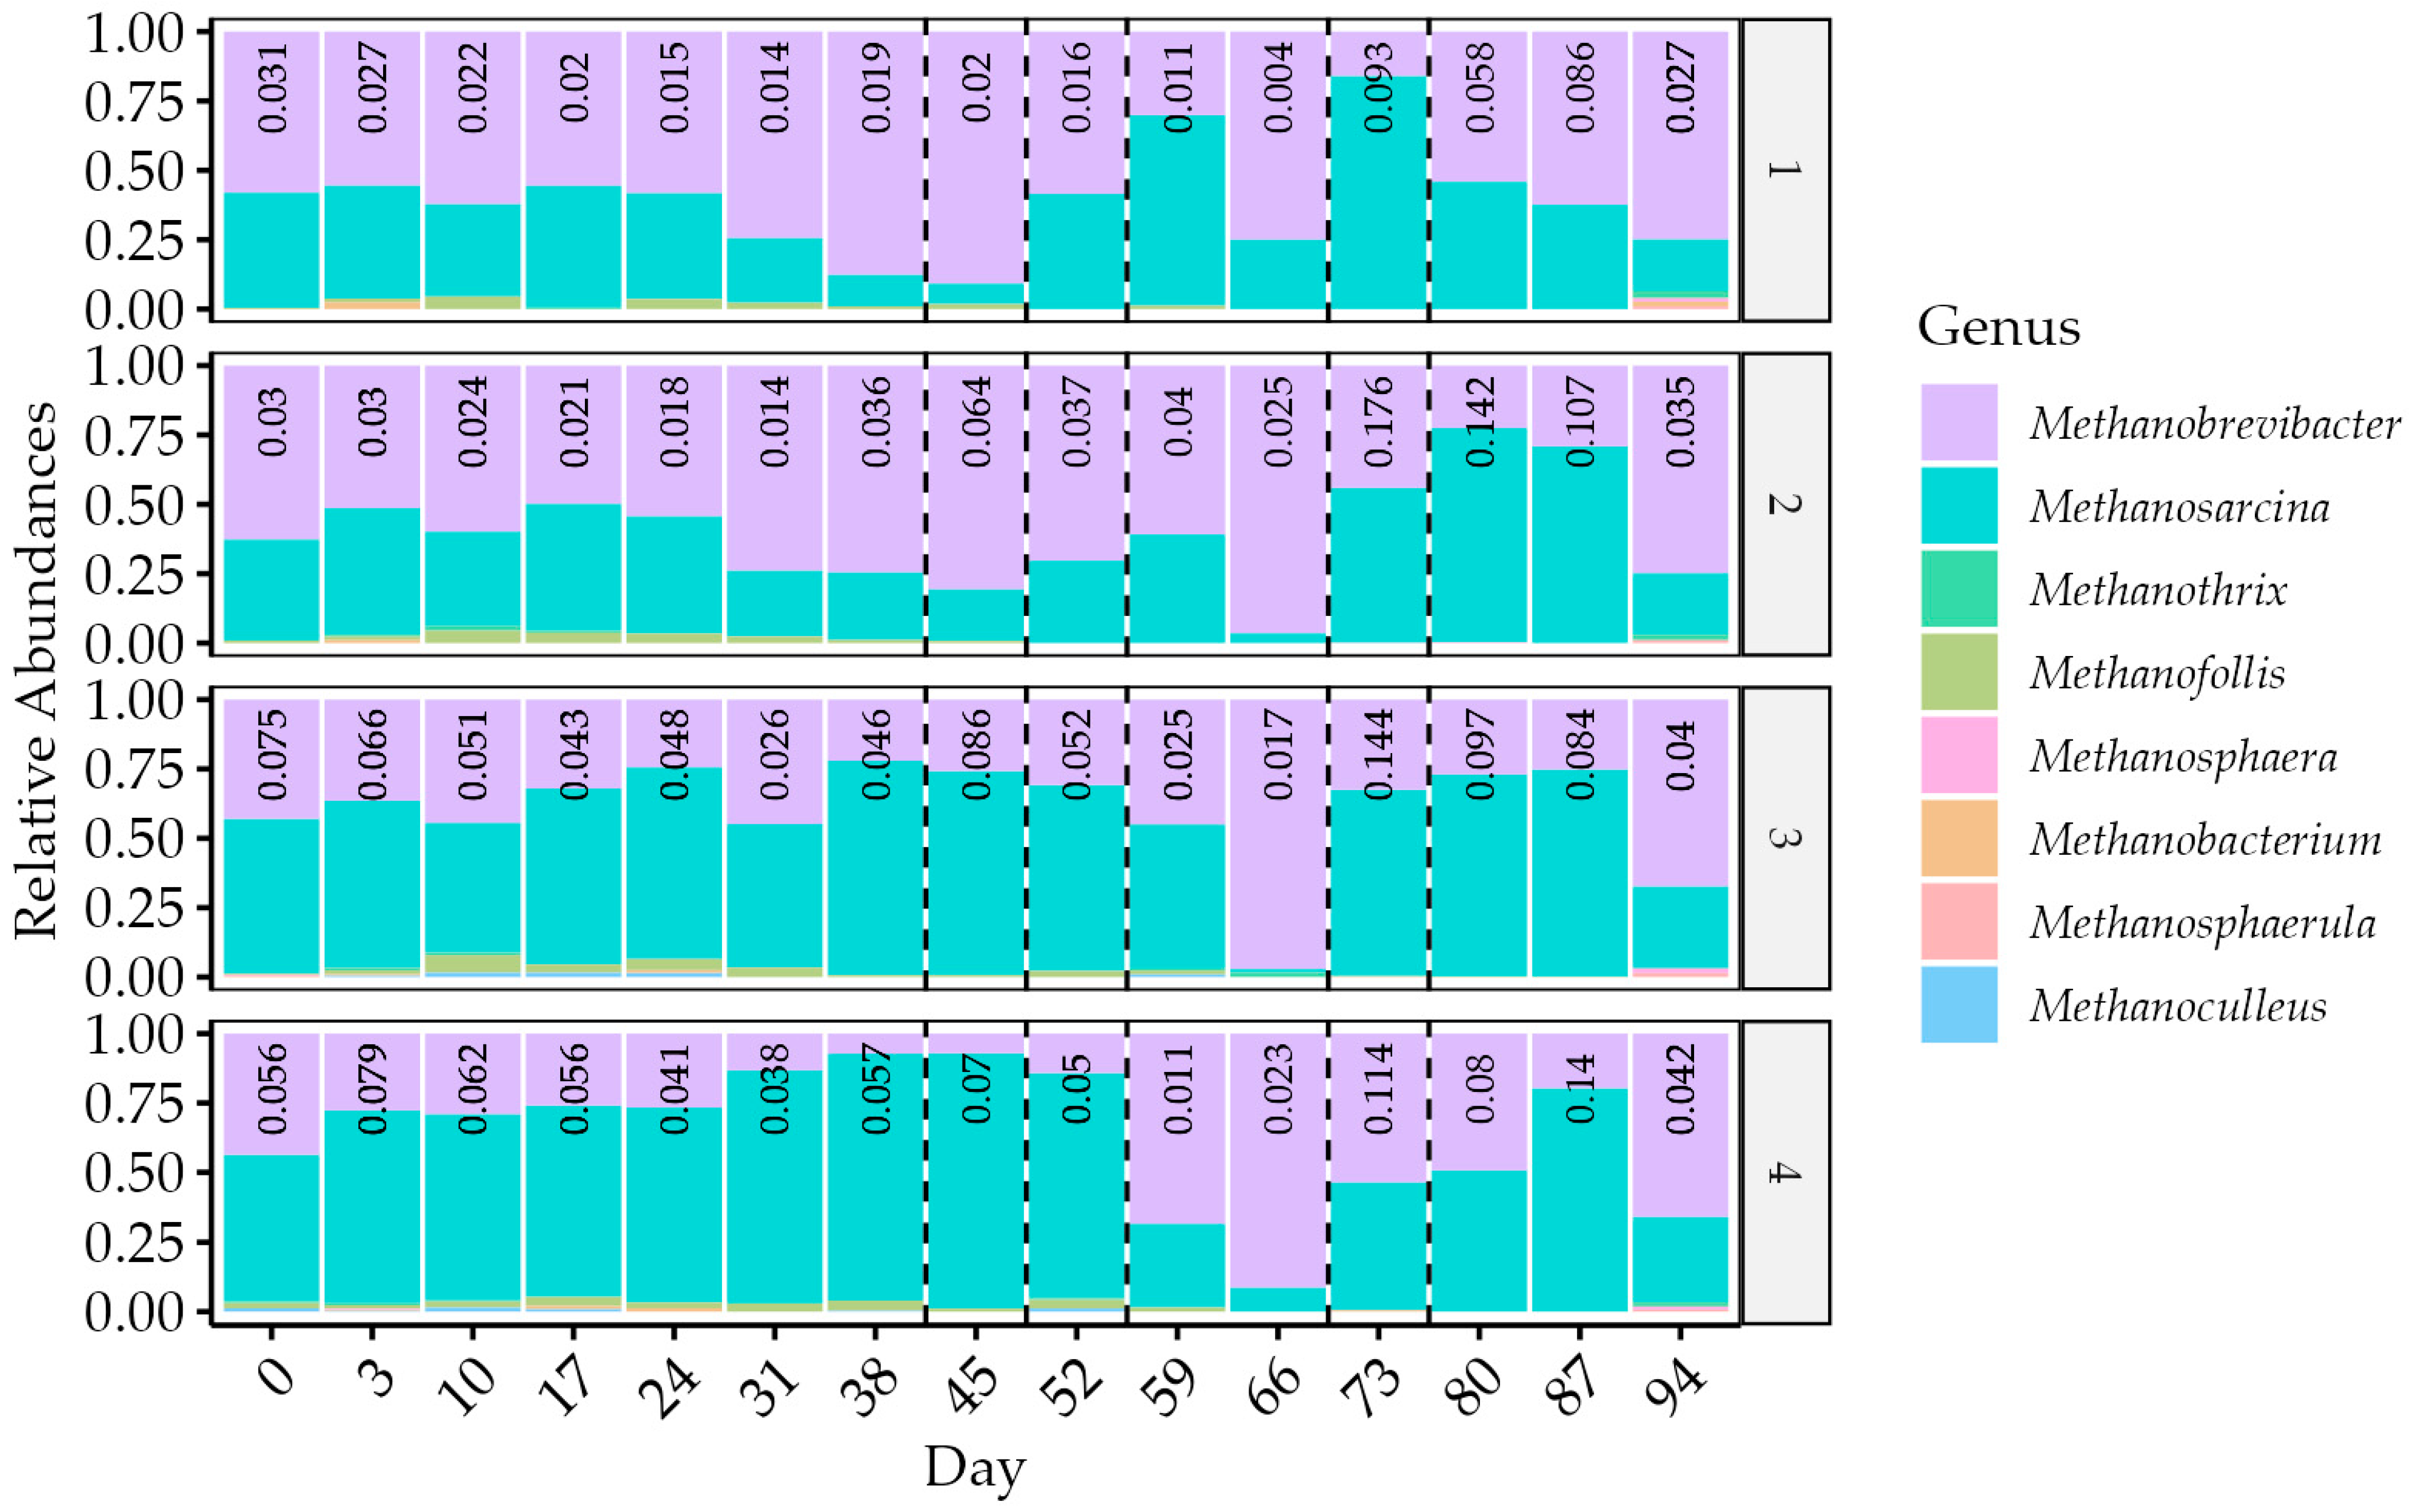
Table 1.
Properties of biochar used in this experiment and the biosolids used to produce them.
| Biosolids | Biochar | |
|---|---|---|
| Total solids (%) | 84% | 100% |
| Volatile solids (%) | 43% | 14% |
| pH | 6.7 | 9.6 |
| Total organic carbon (g/kg) | 230 | 120 |
| Total nitrogen (g/kg) | 41 | 24 |
| C:N | 5.6 | 5 |
| Total phosphorus (g/kg) | 20 | 12 |
| Total sulphur (g/kg) | 5 | 7 |
Table 2.
BMP feed composition, including the ratio of inoculum sludge to substrate (ISR) and the Substrate A to Substrate B ratio (A:B), both on a VS:VS weight/weight basis, and the ratio of inoculum sludge and substrate to biochar (I + S:BC), on a TS:TS weight/weight basis.
Table 2.
BMP feed composition, including the ratio of inoculum sludge to substrate (ISR) and the Substrate A to Substrate B ratio (A:B), both on a VS:VS weight/weight basis, and the ratio of inoculum sludge and substrate to biochar (I + S:BC), on a TS:TS weight/weight basis.
| Type | ISR | A:B | I + S:BC |
|---|---|---|---|
| Control | 1:0 | - | 1:0 |
| Sample A | 3.5:1 | 1:0 | 1:0 |
| Co-digestion | 3.5:1 | 1:1 | 1:0 |
| BC control | 1:0 | - | 2:1 |
| BC Sample A | 3.5:1 | 1:0 | 2:1 |
| BC co-digestion | 3.5:1 | 1:1 | 2:1 |
Table 3.
Feed composition of semi-continuous operation. Hydraulic retention time (HRT) and organic loading rate (OLR) were maintained by feeding an appropriate volume of a given ratio of substrates daily. The ratio of substrates was calculated on a VS:VS, weight/weight basis. HRT was maintained without organics loading in Reactors 1–3 in Stage III, and all reactors in Stage V, by feeding milliQ water instead of the substrate to allow for the recovery of digesters.
| Stage | Day | Reactor | HRT (d) | OLR (gVSsubstrate L−1 d−1) | Substrate A:Substrate B |
|---|---|---|---|---|---|
| I | 0–45 | 1 | 30 | 8.14 | 1:0 |
| 2 | 30 | 8.14 | 1:0 | ||
| 3 | 45 | 5.42 | 1:0 | ||
| 4 | 45 | 5.42 | 1:0 | ||
| II | 45–49 1 | 1 | 30 | 9.18 | 1:1 |
| 2 | 30 | 9.18 | 1:1 | ||
| 3 | 45 | 6.12 | 1:1 | ||
| 4 | 45 | 6.12 | 1:1 | ||
| III | 49–56 | 1 | 30 | 0.00 | - |
| 2 | 30 | 0.00 | - | ||
| 3 | 45 | 0.00 | - | ||
| 4 | 45 | 6.12 | 1:1 | ||
| IV | 56–74 | 1 | 30 | 9.18 | 1:1 |
| 2 | 30 | 9.18 | 1:1 | ||
| 3 | 45 | 6.12 | 1:1 | ||
| 4 | 45 | 6.12 | 1:1 | ||
| V | 74–83 | 1 | 30 | 0.00 | - |
| 2 | 30 | 0.00 | - | ||
| 3 | 45 | 0.00 | - | ||
| 4 | 45 | 0.00 | - | ||
| VI | 83–95 | 1 | 30 | 9.18 | 1:1 |
| 2 | 30 | 9.18 | 1:1 | ||
| 3 | 45 | 6.12 | 1:1 | ||
| 4 | 45 | 6.12 | 1:1 |
1 The mixture for day 45 erroneously consisted of a 3:4 A:B ratio and, accordingly higher OLR of 9.35 and 6.23 gVSsubstrate L−1 d−1 for the 30 and 45 d HRT reactors, respectively.
Table 4.
Average biogas yields across HRT and stages, ±SD. Daily gas production is shown in Figure 4a.
Table 4.
Average biogas yields across HRT and stages, ±SD. Daily gas production is shown in Figure 4a.
| HRT (d) | Stage | Feed Substrate | Gas Volume (mL L−1 d−1) | Gas Yield (mL gVSadded−1 d−1) | CH4 Volume (mL L−1 d−1) | CH4 Yield (mL gVSadded−1 d−1) |
|---|---|---|---|---|---|---|
| 30 | I | A | 719.8 ± 94.9 | 162.0 ± 21.4 | 243.3 ± 50.2 | 54.7 ± 11.3 |
| 30 | II | A + B | 451.2 ± 66.3 | 95.5 ± 14 | 107.0 ± 12.3 | 22.7 ± 2.6 |
| 30 | III | - * | 180.3 ± 82.7 | 38.2 ± 17.5 | 55.8 ± 25.7 | 11.8 ± 5.4 |
| 30 | IV | A + B | 329.5 ± 246.3 | 69.8 ± 52.2 | 86.7 ± 75.8 | 18.4 ± 16 |
| 30 | V | - | 198.9 ± 101.7 | 42.1 ± 21.5 | 52.5 ± 30.8 | 11.1 ± 6.5 |
| 30 | VI | A + B | 634.3 ± 258.7 | 134.3 ± 54.8 | 150.4 ± 95.5 | 31.9 ± 20.2 |
| 45 | I | A | 883.3 ± 145.5 | 302.9 ± 49.9 | 387.9 ± 70.3 | 133.0 ± 24.1 |
| 45 | II | A + B | 1047.2 ± 123.3 | 342.7 ± 40.4 | 427.9 ± 94.2 | 140.0 ± 30.8 |
| 45 | III | - * | ||||
| 45 | IV | A + B | 396.5 ± 283.1 | 129.8 ± 92.7 | 163.7 ± 134.8 | 53.6 ± 44.1 |
| 45 | V | - | 137.3 ± 64 | 44.9 ± 20.9 | 37.1 ± 19.5 | 12.1 ± 6.4 |
| 45 | VI | A + B | 483.8 ± 142.5 | 158.3 ± 46.6 | 124.1 ± 37.6 | 40.6 ± 12.3 |
* 45 d HRT Reactor 4 continued being fed Substrate A + B mixture through Stage III.
Disclaimer/Publisher’s Note: The statements, opinions and data contained in all publications are solely those of the individual author(s) and contributor(s) and not of MDPI and/or the editor(s). MDPI and/or the editor(s) disclaim responsibility for any injury to people or property resulting from any ideas, methods, instructions or products referred to in the content. |
© 2024 by the authors. Licensee MDPI, Basel, Switzerland. This article is an open access article distributed under the terms and conditions of the Creative Commons Attribution (CC BY) license (https://creativecommons.org/licenses/by/4.0/).
Share and Cite
MDPI and ACS Style
Elliott, J.A.K.; Krohn, C.; Ball, A.S. Source-Separated Industrial Wastewater Is a Candidate for Biogas Production through Anaerobic Digestion. Fermentation 2024, 10, 165. https://doi.org/10.3390/fermentation10030165
AMA Style
Elliott JAK, Krohn C, Ball AS. Source-Separated Industrial Wastewater Is a Candidate for Biogas Production through Anaerobic Digestion. Fermentation. 2024; 10(3):165. https://doi.org/10.3390/fermentation10030165
Chicago/Turabian StyleElliott, Jake A. K., Christian Krohn, and Andrew S. Ball. 2024. "Source-Separated Industrial Wastewater Is a Candidate for Biogas Production through Anaerobic Digestion" Fermentation 10, no. 3: 165. https://doi.org/10.3390/fermentation10030165
Note that from the first issue of 2016, this journal uses article numbers instead of page numbers. See further details here.