Article

Wood Biochar Enhances the Valorisation of the Anaerobic Digestion of Chicken Manure

1
School of Science, RMIT University, Melbourne, VIC 3083, Australia
2
ARC Training Centre for the Transformation of Australia’s Biosolids Resource, RMIT University, Bundoora, VIC 3083, Australia
3
School of Engineering, RMIT University, Melbourne, VIC 3000, Australia
4
South East Water, 101 Wells Street, Frankston, VIC 3199, Australia
*
Author to whom correspondence should be addressed.
Clean Technol. 2022, 4(2), 420-439; https://doi.org/10.3390/cleantechnol4020026
Submission received: 1 April 2022 / Revised: 6 May 2022 / Accepted: 12 May 2022 / Published: 13 May 2022
(This article belongs to the Special Issue Biochar Technology for Waste Reclamation)

Abstract

:
In this study, the efficacy of biochar to mitigate ammonia stress and improve methane production is investigated. Chicken manure (CM) was subjected to high-solid mesophilic anaerobic digestion (15% total solid content) with wood biochar (BC). Wood biochar was further treated using HNO3 and NaOH to produce acid–alkali-treated wood biochar (TBC), with an improvement in its overall ammonium adsorption capacity and porosity. Three treatments were loaded in triplicate into the digesters, without biochar, with biochar and with acid–alkali-treated biochar and maintained at 37 °C for 110 days. The study found a significant improvement in CH4 formation kinetics via enhanced substrate degradation, leading to CH4 production of 74.7 mL g−1 VS and 70.1 mL g−1 VS by BC and TBC treatments, compared to 39.5 mL g−1 VS by control treatments on the 28th day, respectively. However, only the use of TBC was able to prolong methane production during the semi-inhibition phase. The use of TBC also resulted in the highest removal of total ammonia nitrogen (TAN) of 86.3%. In addition, the treatment with TBC preserved the highest microbial biomass at day 110. The presence of TBC also resulted in an increase in electrical conductivity, possibly promoting DIET-mediated methanogenesis. Overall, the acid–alkali treatment of biochar can be a novel approach to improve biochar’s existing characteristics for its utilisation as an additive in anaerobic digestion.

Graphical Abstract

1. Introduction

Chicken manure (CM) is an abundant primary by-product of the poultry industry, consisting of chicken faeces, wasted feed, feathers and bedding materials, such as wood chips, sawdust, wheat straw and rice husks [1]. The global annual production of chicken manure is estimated to be 20,708 million tonnes [2]. Untreated CM can cause various environmental impacts, including air pollution, eutrophication, pathogen contamination and greenhouse gas emissions, and, consequently, cannot be directly applied to agricultural soil [3]. Nowadays, CM must generally undergo composting as a pre-treatment in order to limit its negative environmental impacts before beneficial use in agriculture [3]. However, composting CM incurs an opportunity cost in bioenergy production. Aside from its use as fertiliser, CM contains similar calorific values to low-rank coals and can be combusted for energy [4].
Another method of waste treatment available for CM is anaerobic digestion (AD). Anaerobic digestion is the use of microorganisms to decompose CM into a digestate with high agricultural value, while generating valuable renewable energy in the form of biogas. However, the use of CM for AD is hampered by various operational constraints. Chicken manure is a high-protein feedstock containing an elevated level of organic nitrogen, mainly in the form of undigested protein and uric acid. Chicken manure can contain up to 6.5 and 7.8 times more nitrogen than cow manure and swine manure, respectively [5]. As CM undergoes AD, ammonia is produced and accumulated as a by-product. The hydrolysis of undigested protein and uric acid yields high levels of amino acids [6]. Consequently, the acidogenesis of amino acids results in the production and build-up of ammonia [6]. A high concentration of ammonia within AD systems is detrimental to digester performance. In the short term, ammonia accumulation can increase digester pH resulting in several inhibitory effects on methanogenic activity, decreasing biogas production. Yuan and Zhu [7] reported that methanogenic activity can decrease up to 10% at ammonia nitrogen concentrations between 170 and 3720 mg/L, and up to 50% at ammonia nitrogen concentrations between 4090 and 5550 mg/L. In the long term, high levels of ammonia nitrogen result in ammonia inhibition, an irreversible phenomenon resulting in the complete inhibition of methanogenesis and biogas production. Yuan and Zhu [7] showed that all methanogenic activity was inhibited in ammonia nitrogen concentrations above 6000 mg/L. In addition, the digestate obtained from ammonia-inhibited AD cannot be applied to soil as high concentration of ammonia is toxic to plants.
Ammonia in anaerobic digestion systems exists in two forms: unionised free ammonia nitrogen (NH3) and ionised ammonium nitrogen (NH4+) [5,8]. Ammonia (NH3) is considered to be more toxic compared to NH4+, due to its uncharged nature and solubility in lipids [8]. This allows NH3 to freely diffuse across biological cell membranes. Within the methanogenic cells, NH3 reacts with H+ to form NH4+. Unlike NH3, NH4+ cannot diffuse freely across cell membranes. Hence, high extracellular concentrations of NH3 result in the high intracellular accumulation of NH4+. The accumulation of NH4+ coupled with the inability of NH4+ to diffuse across cell membranes results in the increase in intracellular protons. Therefore, high concentrations of NH3 can lead to imbalances in intracellular pH. In addition, when proton pumps that regulate intracellular pH by pumping K+ out of the cell fail to keep up with the accumulation of NH4+, cytotoxicity can occur as a result of K+ depletion [9].
In recent years, the use of biochar to mitigate ammonia accumulation and inhibition during the AD of CM has gained considerable interest. Biochar is a carbonaceous material derived from the pyrolysis of biomass, such as agricultural residues, forest wastes, municipal solid wastes and sewage sludge. Biochar possesses a range of useful physicochemical and structural characteristics, such as porosity, absorptive capacity, high-specific surface area, cation exchange capacity and abundant surface functional groups, which can help to alleviate ammonia inhibition [3,10,11]. Biochar can mitigate ammonia stress via two main mechanisms: surface adsorption of ammonia nitrogen and microbial sheltering. Firstly, surface functional groups of biochar, such as hydroxyl (OH) and carboxyl (COO), can react with NH4+ using electrostatic attraction or surface complexation to promote its uptake [12,13]. Secondly, existing metal elements, such as sodium (Na), can perform cation exchange with NH4+, resulting in surface adsorption [12]. This adsorption of NH4+ reduces its bioavailability to methanogens. In addition, the pores of biochar provide an ideal habitat for methanogens to colonise and proliferate [14]; this allows them to be sheltered from ammonia and predators present in the environment.
Furthermore, biochar has been widely modified using acid or alkali, or both to increase their NH4+ adsorption capacity and porosity. A study by Vu, Trinh [15] demonstrated that, by changing the surface chemistry of biochar using an acid–alkali treatment, ammonium adsorption was improved through an increase in carboxylic acid groups and sodium containing functional groups. This increase in NH4+ adsorption is beneficial to mitigating ammonia stress from the AD of CM. In addition, Zhang, Li [16] reported that acid treatment of biochar can lead to an increase in porosity and specific surface area, as the use of acid can remove ash and open up blocked pores on the biochar. This increase in porosity can facilitate better microbial sheltering from ammonia stress in the AD of CM. Biochar has also been shown to exhibit the ability to enhance Direct Interspecies Electron Transfer (DIET) as a non-biological conductive material [10]. Direct Interspecies Electron Transfer is a naturally occurring phenomenon under anaerobic conditions that can transfer electrons from syntrophic bacteria to methanogenic archaea more efficiently [10]. With the use of biochar as a conduit for electron flow, this electron transfer can be channelled to limit redundant electron transfers that occur in un-mediated DIET. Direct Interspecies Electron Transfer can enhance the rate of methane (CH4) production, especially in ammonia-stressed systems, as it is a more energy-efficient pathway compared to the conventional acetate splitting pathway [5,10,17]. Direct Interspecies Electron Transfer can be further enhanced by doping biochar with N atoms via the use of acid, such as nitric acid (HNO3). Nitric acid is an ideal agent for N-doping biochar and can react with the abundant oxygen-containing functional groups of biochar to establish new N-containing functional groups [18]. These newly established N-functional groups can have significant impacts on the DIET potential of biochar, even at concentrations below 10% [19]. Firstly, N-groups can donate electrons with high reactivity to methanogens [18,19]. Secondly, they can reduce the electron density of the carbonaceous biochar and enhance its electron accepting capacity [20]. This improvement in electron flow can improve biochar’s quality as an electron conduit for DIET. Thus, the use of acid–alkali modified biochar in the AD of CM can help to mitigate ammonia inhibition as well as improve CH4 production.
Many other methods have been employed to mitigate ammonia stress in the AD of CM. In China, Bi, Westerholm [21] enhanced the methanogenic performance of AD of CM via Fe2+ and Ni2+ supplementation. In Ukraine, a company named PJSC Oril-Leader’s poultry farm employs NH3 stripping as the mode of NH3 stress mitigation in their biogas plant utilising chicken manure as a feedstock [22]. In Northern Ireland, the Tully biogas plant in Ballymena employs their own patented nitrogen stripping technology known as “Byoflex” to prevent NH3 inhibition during their mono-anaerobic digestion of CM [22]. However, biochar has the advantage of being economically viable due to the low cost of production as well as its effectiveness, even at low concentrations [5].
Various studies have reported the efficacy of wood-based biochar in alleviating NH3 stress within AD systems utilising CM as a feedstock [10,23,24,25]. For example, Ma, Chen [10] utilised kiwi fruitwood biochar to enhance the AD of CM. Similarly, Indren, Birzer [23], Indren, Birzer [24] utilised biochar produced from wood-pellets to improve the AD of CM. Lastly, Pan, Ma [25] added biochar produced from kiwi fruitwood to their AD of CM. However, no research to date has compared the effects of biochar and its acid–alkali-treated version on these systems. Acid–alkali-treated biochar can be hypothesised to have a higher NH4+ adsorption, better microbial sheltering and higher degree of DIET facilitation, as stated above. Specifically, this study aims to provide insights into (i) the adverse effects of ammonia stress on microbes during the AD of CM, (ii) compare the effects of increased porosity between the two types of biochar and (iii) correlate CH4 production with the degree of DIET facilitation by these biochars.

2. Materials and Methods

2.1. Anaerobic Digestion Feedstock and Inoculant Characterisation

Chicken manure (feedstock) was sourced from Bellarine Worms in Point Lonsdale, Victoria, Australia. The CM was collected from dropping boards, dried and packed into 20 kg bags. The source of wastewater sludge inoculant (source of methanogens) was from Mount Martha municipal wastewater recycling plant, South East Water Corporation, Melbourne, Australia. Both the feedstock and inoculant were transported to the laboratory and stored at 4 °C in air-tight containers until use. The feedstock was sieved to a 0.5–2 mm particle size before being used in the experiment, and the inoculant was used as received.
The physicochemical characterisation of the feedstock, inoculant and their mixture were conducted in triplicate, prior to the start of the experiment. Total chemical oxygen demand (CODt), soluble chemical oxygen demand (CODs), electrical conductivity (EC), salinity and pH were determined using a 1:10 ratio of dry sample weight to Milli-Q deionised water. Total chemical oxygen demand (CODt) was determined using COD digestion reagents using a HACH-DRB 200 heating block; the digested solutions were analysed using a HACH DR 900 colourimeter to obtain CODt values [26]. Soluble chemical oxygen demand (CODs) was determined by centrifuging the samples at 9500 rpm for 10 min to obtain supernatants that were analysed using the same process as CODt [26]. A Compact Conductivity Meter (LAQUAtwin–EC–11, HORIBA Scientific) and a Compact Salt Meter (LAQUAtwin-Salt-11, HORIBA Scientific) were used to measure conductivity and salinity, respectively. The pH was measured using a HANNA Instruments edgepH. A 1:80 ratio of dry sample weight to deionised water was used to test total ammonia nitrogen (TAN). Briefly, TAN was determined using the salicylate method by adding samples to a diluent reagent, followed by ammonia salicylate powder and, lastly, ammonia cyanurate powder. The solutions were analysed using a HACH DR 900 colourimeter to obtain TAN values. Total solids (TSs) were determined by heating 25 g of samples in an oven at 105 °C for 24 h. The sample was cooled in a desiccator, and the final weight was obtained as the TS. Volatile solids (VSs) were determined by heating the moisture-free samples obtained earlier to 550 °C for 2 h in a furnace. After cooling to room temperature in a desiccator, the VS was estimated as the difference between the initial and final weights of the samples.
The physicochemical properties of the CM, wastewater sludge inoculant as well as the mixture of CM and inoculant (3:1 VS ratio) used in the digestion are summarised in Table 1.

2.2. Biochar Preparation and Characterisation

The biochar used was purchased from Grayson Australia, Tecnica Pty. Ltd. Melbourne, Australia. The biochar was produced from 100% recycled hardwood following pyrolysis at 550 °C for 2 h. The biochar denoted as BC was sieved 0.5 to 2 mm. Prior to use, the BC was washed with Milli-Q water to remove surface impurities and dried in an oven at 105 °C for 2 h. Acid–alkali-treated biochar was produced in the laboratory using HNO3 and NaOH following the procedure described in Vu, Trinh [15]. Dried BC was soaked in a solution of 8 M HNO3 in a 1:5 w/v ratio and left to stand for 8 h. Following this, the acid-treated BC was filtered and washed 3 times with Milli-Q water. Acid-treated biochar was then soaked in a solution of 0.4 M NaOH in a 1:20 ratio (w/v) for 24 h, and then washed several times with Milli-Q water until the filtrate reached a constant pH of 8.47. The final residue was oven dried at 105 °C for 2 h and was denoted as treated biochar (TBC).
Untreated biochar (BC) and TBC were subjected to X-ray photoelectron spectroscopy (XPS) analysis to measure the surface C, O, N and Na elemental compositions of the char materials [27]. The XPS results were analysed using the CasaXPS program. In addition, the XPS spectra of BC and TBC provided information about the bonding characteristics of the CHO, such as C-C/C-H, C-O and COOH [27]. Fourier Transformed Infrared (FTIR) Spectroscopy was used to assess the surface chemical functional groups of BC and TBC in the waveband of 4000–650 cm−1. The cation exchange capacity (CEC) of the biochars was measured externally by ALS Global. Briefly, exchangeable cations were replaced by neutral ammonium ions by means of filtration through a Buchner funnel; the extract was collected and analysed for exchangeable cations using the Inductively Coupled Plasma Optical Emission Spectroscopy (ICP-OES). X-ray Fluorescence (XRF) was used to analyse the inorganic compositions, given as percentage of different metal oxides of the biochars. The surface morphology of BC and TBC were examined using Scanning Electron Microscopy (SEM). All images were captured at ×1600 magnification using a spot size of 5.0 and voltage of 30.0 kV.

2.3. Anaerobic Digestion Set-up and Biogas Sampling

Chicken manure and inoculant mixture (3:1 VS ratio) were batch-digested to determine biomethane potential in sealed Schott bottles (250 mL) using four different treatments: (i) BC, (ii) TBC, (iii) no biochar and (vi) inoculant only. All treatments were performed in triplicate. The digesters were placed in a 37 °C water bath controlled by a thermo-regulator; a pump was used to ensure thermal equilibrium was maintained throughout the experiment through the constant circulation of water at 37 °C. The water-bath temperature was monitored daily using a thermometer. The gas produced was measured using the water displacement method and collected at the top of gas capture cylinders, similar to the method used in a study by Kassongo, Shahsavari [28].
The VS content of the feedstock (CM) to the inoculant was 3:1 in all the digesters. A TS content of 15%, excluding biochar, was used in all digesters. A known mass of BC and TBC was added to achieve a CM to biochar ratio of 2:1 by dry weight. Each digester had a total working volume of 110 mL (excluding biochar additions). The TS content with biochar addition did not exceed 20% (Supplementary Table S2). A TS content between 15% to 20% is typical of large scale industrial anaerobic digestion of CM [29]. During the preparation of the digesters, Schott bottles were flushed with high-purity nitrogen to create an anaerobic environment. The digesters were agitated using an orbital shaker at 37 °C for 1 day before connecting to the anaerobic digestion set-up. The digestion period was 110 days, and the biogas was sampled every 24 h by extracting the trapped biogas within the headspace of the gas capture cylinders using a 50 mL syringe. The biogas was analysed for CO2 and CH4 using a GEM2000 Landfill Gas Analyser (Geotech, UK) via the built-in dual-wavelength infrared sensor.

2.4. Methane-Production Determination

Daily CH4 production was calculated using the total biogas volume (tBiogas) collected and the percentage composition of CH4 determined (% CH4). The daily CH4 production of each treatment was further calibrated by subtracting the daily CH4 production from the digesters with inoculant only; this would exclude any residual CH4 production from the inoculant. Methane production was recorded as cumulative CH4 production, in ml g−1 VS, over 110 days. The equation below outlines the daily CH4 measurements:
Daily CH4 = [tBiogas treatment × (% CH4)] − [tBiogas inoculant × (% CH4)]

2.5. Post-Digestion Chemical Analysis

The digestates from the different treatments were tested for CODt, CODs, EC, salinity, pH and TAN using dilution ratios and methods described earlier. The remaining digestates were stored at 4 °C. After sampling for each measurement, Schott bottles were flushed using high-purity nitrogen before sealing to maintain an anaerobic condition.

2.6. DNA Extraction

An aliquot (0.25 g) of digestate samples (in triplicate) were processed for DNA extraction using the DNeasy PowerSoil Kit following the Quick-start Protocol provided by QIAGEN (Hilden, Germany). Additionally, the quantity and quality of the extracted DNA were screened using a NanoDrop Lite Spectrophotometer manufactured by Thermo Fisher Scientific (Waltham, MA, USA) at absorbance ratios of 260 nm and 280 nm.

2.7. Real-Time Quantitative Polymerase Chain Reaction

The extracted DNA of the digestate from day 0 and day 110 were subjected to a real-time polymerase chain reaction (qPCR) using a QIAGEN Rotor-Gene machine using a method previously described by Shahsavari, Aburto-Medina [30]. The primer set 341F/518R was used for qPCR amplification of the 16S rDNA. Quantification of the 16S rDNA provides an indication of how total bacterial biomass changed between day 0 feedstock and day 110 digestates. Data obtained from qPCR were log-transformed before analysis.

2.8. Data Analysis

Data are presented as the mean and standard deviation of triplicates. MS Excel was used for data manipulation, and data analysis was performed using the MINITAB-19 software. All experimental data were subjected to a One-Way Analysis of Variance (ANOVA). Any significant differences between data set were determined at the p < 0.05.

3. Results and Discussions

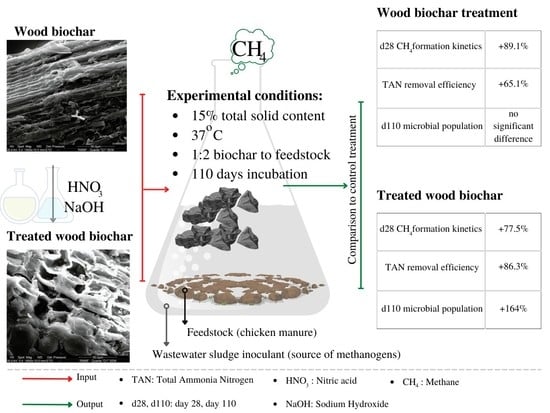
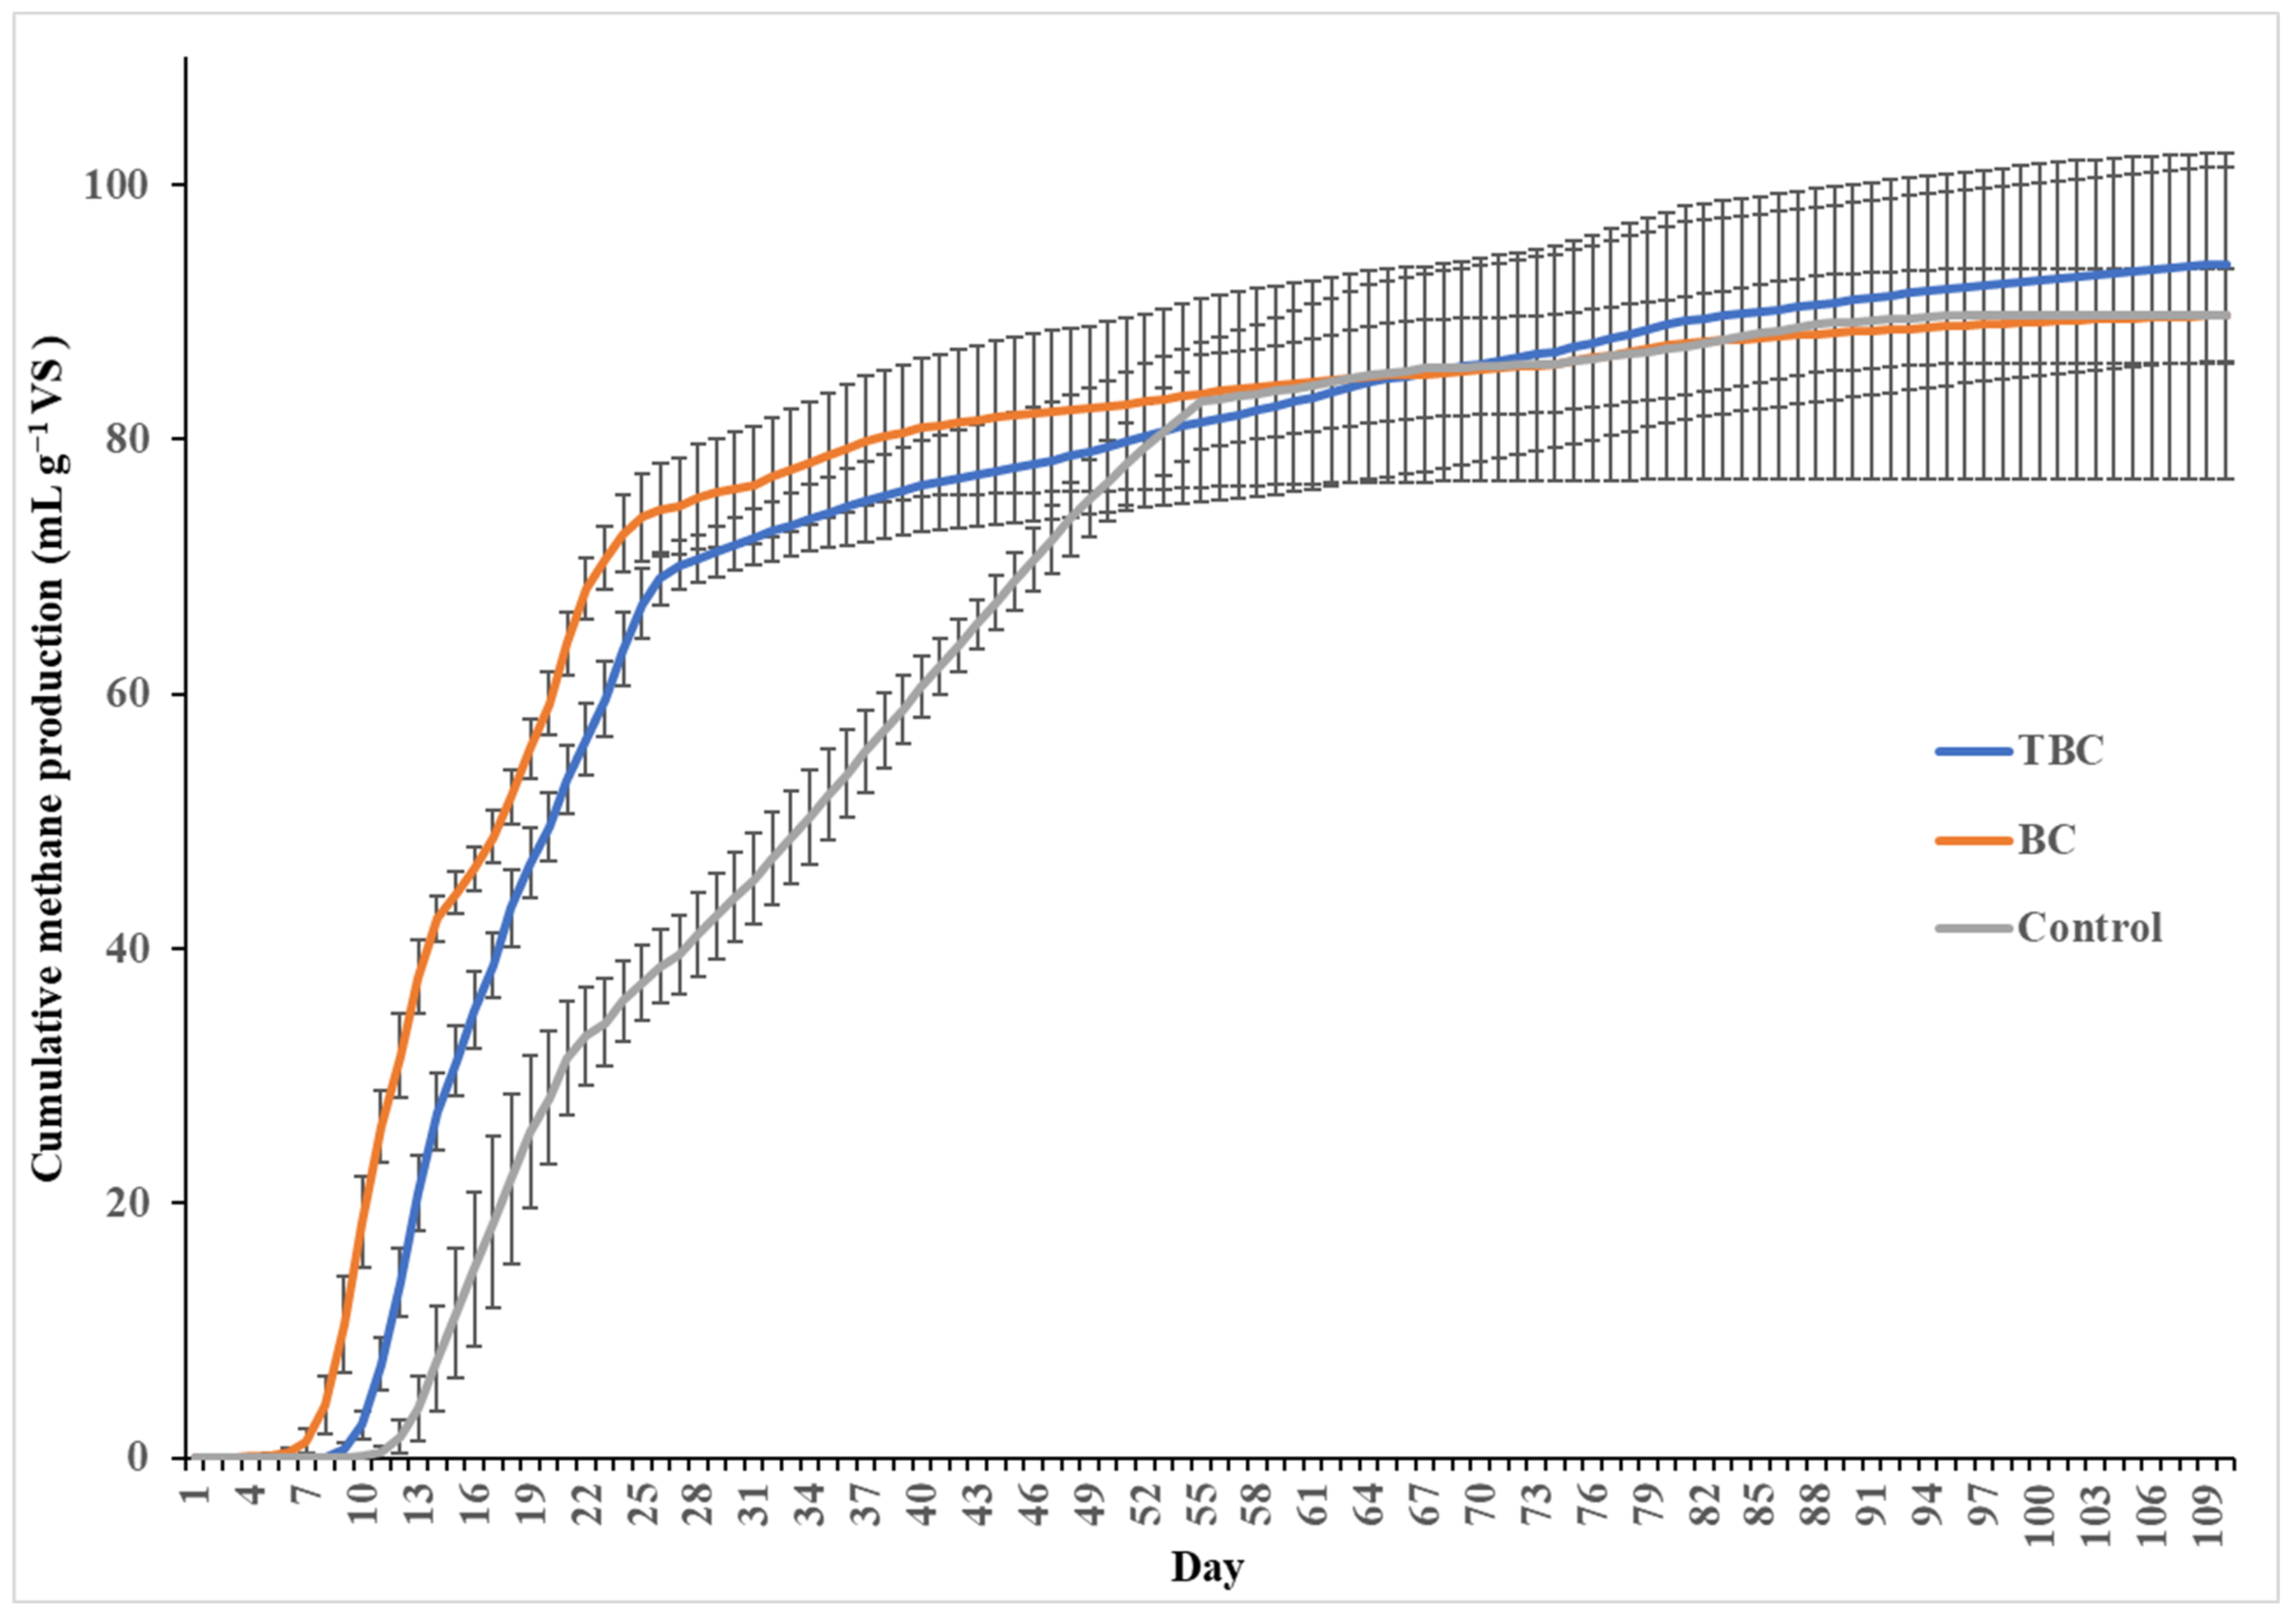
3.1. Effects of Biochar (BC) and Treated-Biochar (TBC) Treatments on Biomethane Production

The effects of biochar addition (BC and TBC) on biomethane production volume are shown in Figure 1. The cumulative CH4 production rate shows a profile having a lag (up to 11 days), growth (4–55 days), substrate depletion (28 days onwards, for BC and TBC treatments) and semi-inhibition phases (26 days onwards) (Figure 1). The experiment was run at an extended time of 110 days to study the performance and stability of biochar in the process over a long residence time. From day 0 to day 28, it was observed that treatments containing BC and TBC produced significantly higher volumes of CH4 than the treatment without biochar (p < 0.05). On the 28th day, the cumulative CH4 production was 74.7 mL g−1 VS for treatments containing BC, 70.1 mL g−1 VS for treatments containing TBC and 39.5 mL g−1 VS for treatments containing no biochar (Figure 1). On day 28, the use of BC and TBC induced an increase in CH4 formation kinetics; the addition of TBC and BC enhanced the rate of substrate degradation by 89.1% and 77.5% prior to substrate depletion compared to the control, respectively. However, no significant difference was observed between the cumulative CH4 volume of BC and TBC treatments at 28 days of AD (p > 0.05). While biochar addition did not increase the biomethane potential of the system, it led to a substantial improvement in the CH4 formation kinetics in the AD of CM prior to substrate depletion up to day 28. Indren, Birzer [24] reported similar results, where the addition of biochar to the high-solid anaerobic digestion of chicken manure in a 1:1 biochar-to-feedstock ratio resulted in a 39% increase in the cumulative methane yield compared to controls. Pan, Ma [25] also report a 69% increase in the total methane yield when fruitwood biochar was added to the AD of CM.
Despite this insignificant difference in CH4 production at 28 days, the use of BC resulted in a significant reduction in lag time compared to TBC (p < 0.05). Against the control, lag time was reduced by 64% using BC, with CH4 production was observed after 4 days compared to 8 days for TBC and 11 days in the control, respectively. Consequently, BC treatments produced 18.5 mL g−1 VS of CH4 in the first 8 days compared to the 2.59 mL g−1 VS from TBC treatments.
For treatments utilising BC and TBC, the exponential phase of CH4 production ended at around day 28 and began to enter a substrate depletion phase (Figure 1). However, the exponential phase of CH4 production for the control treatment without biochar continued up to day 55 before entering the semi-inhibition phase (Figure 1). The addition of BC and TBC accelerated the rate of macromolecule transformation, resulting in faster initial digestion, as shown by the higher volume of CH4 produced compared to the control (Figure 1). Similar observations were made by Pan, Ma [25], where the addition of biochar enhanced organic acid utilisation efficiency and dissolved substrate utilisation. As macromolecular substances are transformed into dissolved substrates and consequently into CH4 at a faster rate by the addition of BC and TBC, more ammonia is inevitably released into the system compared to the control from days 0 to 26. Therefore, treatments containing BC and TBC experienced semi-inhibition 29 days before the control treatment due to an accelerated release of ammonia from AD.
Statistical analysis revealed that, from the start of the semi-inhibition phase to the end of the digestion period, only the cumulative CH4 volume produced by treatments containing TBC showed a significant difference (p < 0.05). From days 26 to 110, TBC treatments produced 24.7 mL g−1 VS of CH4, despite experiencing ammonia stress, showing a higher level of ammonia stress mitigation. In contrast, the cumulative CH4 produced by BC and control treatments from the start of their semi-inhibition phases (days 26 or 55, respectively) to the end of the incubation period (day 110), showed no significant differences between the two points (p > 0.05). This suggests that both BC and control treatments experienced a higher level of ammonia inhibition.

3.2. Total Ammonia Nitrogen (TAN) Removal Efficiency

Total ammonia nitrogen was observed to increase in all treatments from days 0 to 110 (Table 2). The highest percentage increase in TAN was observed in the control treatment with a 68.6% increase, followed by a 21.4% increase in BC treatments and the lowest increase (8.33%) in TBC treatments (Table 2). Day 110 TAN concentrations across the three treatments showed a significant difference (p < 0.05), indicating that the addition of BC and TBC was successful in adsorbing NH4+ compared to the control. Yin, Liu [12] highlighted the ability of biochar to adsorb NH4+ via electrostatic attraction or cation exchange. The BC and TBC in this study successfully reduced TAN concentration from the digesters through the mechanisms mentioned above. The TAN reduction observed in this study is similar to that reported elsewhere. Ma et al. [8] used 0.45 mm fruitwood-derived biochar pyrolysed at 550 °C and observed a 16% reduction in TAN compared to untreated controls. Similarly, Yu, Sun [31] reported a 19.5% TAN reduction using 0.425 mm rice-husk biochar pyrolysed at 550 °C. Lastly, Pan, Ma [25] reported a 25% and 21.4% reduction in TAN when 2 mm fruitwood and wheat straw biochar were used, respectively.
The TAN removal efficiency of 86.3% by TBC was significantly higher than the 65.1% achieved by BC (p < 0.05). Hence, the treated biochar achieved a higher rate of NH4+ removal, which supports the overall performance of TBC in ammonia semi-inhibition phase during the AD process. To date, no other studies have simultaneously compared the differences in TAN removal between a type of biochar and its acid–alkali-treated version in the AD of CM. The observations in this study suggest that treatment of biochar using HNO3 and NaOH improved TAN removal efficiency by 21.2%.

3.3. Digestate Characteristics

The digestates at the end of 110 days of incubation were subjected to a series of chemical analyses to determine its CODt, CODs, EC, salinity and pH. The d110 chemical characteristics were compared to the d0 chemical characteristics from Table 1.

3.3.1. Chemical Oxygen Demand (COD)

The characteristics of the digestate after 110 days differ to that at the beginning. For CODt and CODs, treatments containing TBC produced significantly higher COD removal compared to the BC treatment and control (p < 0.05). Total chemical oxygen demand and CODs removal were 76.2% and 77.0%, respectively (Table 3). Using TBC as an additive led to an increase in the removal of CODt and CODs, indicating a higher rate of organics utilisation. This observation is further supported by the continued production of CH4 during the semi-inhibition phase and the higher rate of TAN removal, for treatments with TBC.

3.3.2. Electrical Conductivity (EC)

It has been previously reported that the conservation of the EC of a feedstock enhances the rate of methanogenesis during AD [26]. In addition, high EC has been associated with a higher degree of DIET [32]. Among the three treatments, EC significantly increased for the control and TBC treatments, showing an increase of 24.1% and 21.7%, respectively (p < 0.05) (Table 3), suggesting a possible increase in DIET-mediated methanogenesis. In contrast, the treatment containing BC did not show a significant increase in EC over time (p < 0.05). Direct Interspecies Electron Transfer-mediated methanogenesis is more dominant in ammonia-stressed systems [33], and hence continued CH4 production was observed during the semi-inhibition phase for TBC treatments (Figure 1). This increase in EC could be attributed to two factors: the partial dissociation of acids into ions by acid functional groups on TBC and the presence of N-containing functional groups with redox activity [27,34]. The increase (24.1%) in EC observed in the control treatment was unlikely to be linked to an increase in DIET-mediated methanogenesis due to a lack of a conductive material. This is further reflected by the absence of a significant increase in CH4 production during the semi-inhibition stage of the control treatment (Figure 1). As such, this increase in EC was likely a result of the unmediated increase in NH4+ within the system after 110 days [34]. This observation is further supported by the high increase in TAN for the control treatments (Table 2).

3.3.3. Salinity

Salinity was observed to increase across all treatments over the 110 days. The highest increase was observed in TBC treatments, followed by the control and finally BC treatments, with increases of 37.6%, 32.4% and 9.4%, respectively (Table 3). However, this increase in salinity did not appear to be detrimental to the production of CH4 as reported by other studies [35,36]. Furthermore, Zhang, Zhang [35] reported that certain species of methanogens, such as Methanosaeta and Methanosarcina, demonstrated the ability to adapt to increasingly saline environments over time. This is achieved via the formation of aggregates or irregular cell clumps, which increase their resistance towards toxic ionic agents. As soluble minerals in granular form were slowly broken down over the 110 days, the release of salts into the AD system was gradual, allowing for a prolonged acclimatisation phase by methanogenic species. This greatly limited the adverse effects of increased salinity.

3.3.4. pH

After 110 days of incubation, pH increased across all treatments from 7.41 in day 0 to 8.32, 8.30 and 8.41 for the control, BC and TBC treatments, respectively. These changes in pH were not statistically significant (p < 0.05). While biochar was not effective in limiting the increase in pH over time compared to the control, the final pH remained within the optimal range of 7–9 for the chemisorption of NH4+ as previously highlighted in a study by Kizito, Wu [37]. The optimal pH of 7–9 increases the presence of more negatively charged biochar particles, reducing the level of electrostatic repulsion between NH4+ and positively charged biochar particles and promoting more surface adsorption. Yin, Liu [12] reported in their study that the highest NH4+ adsorption was reached at pH 8. Therefore, the final pH obtained in the digestate for this study was still within ideal conditions for efficient TAN removal.

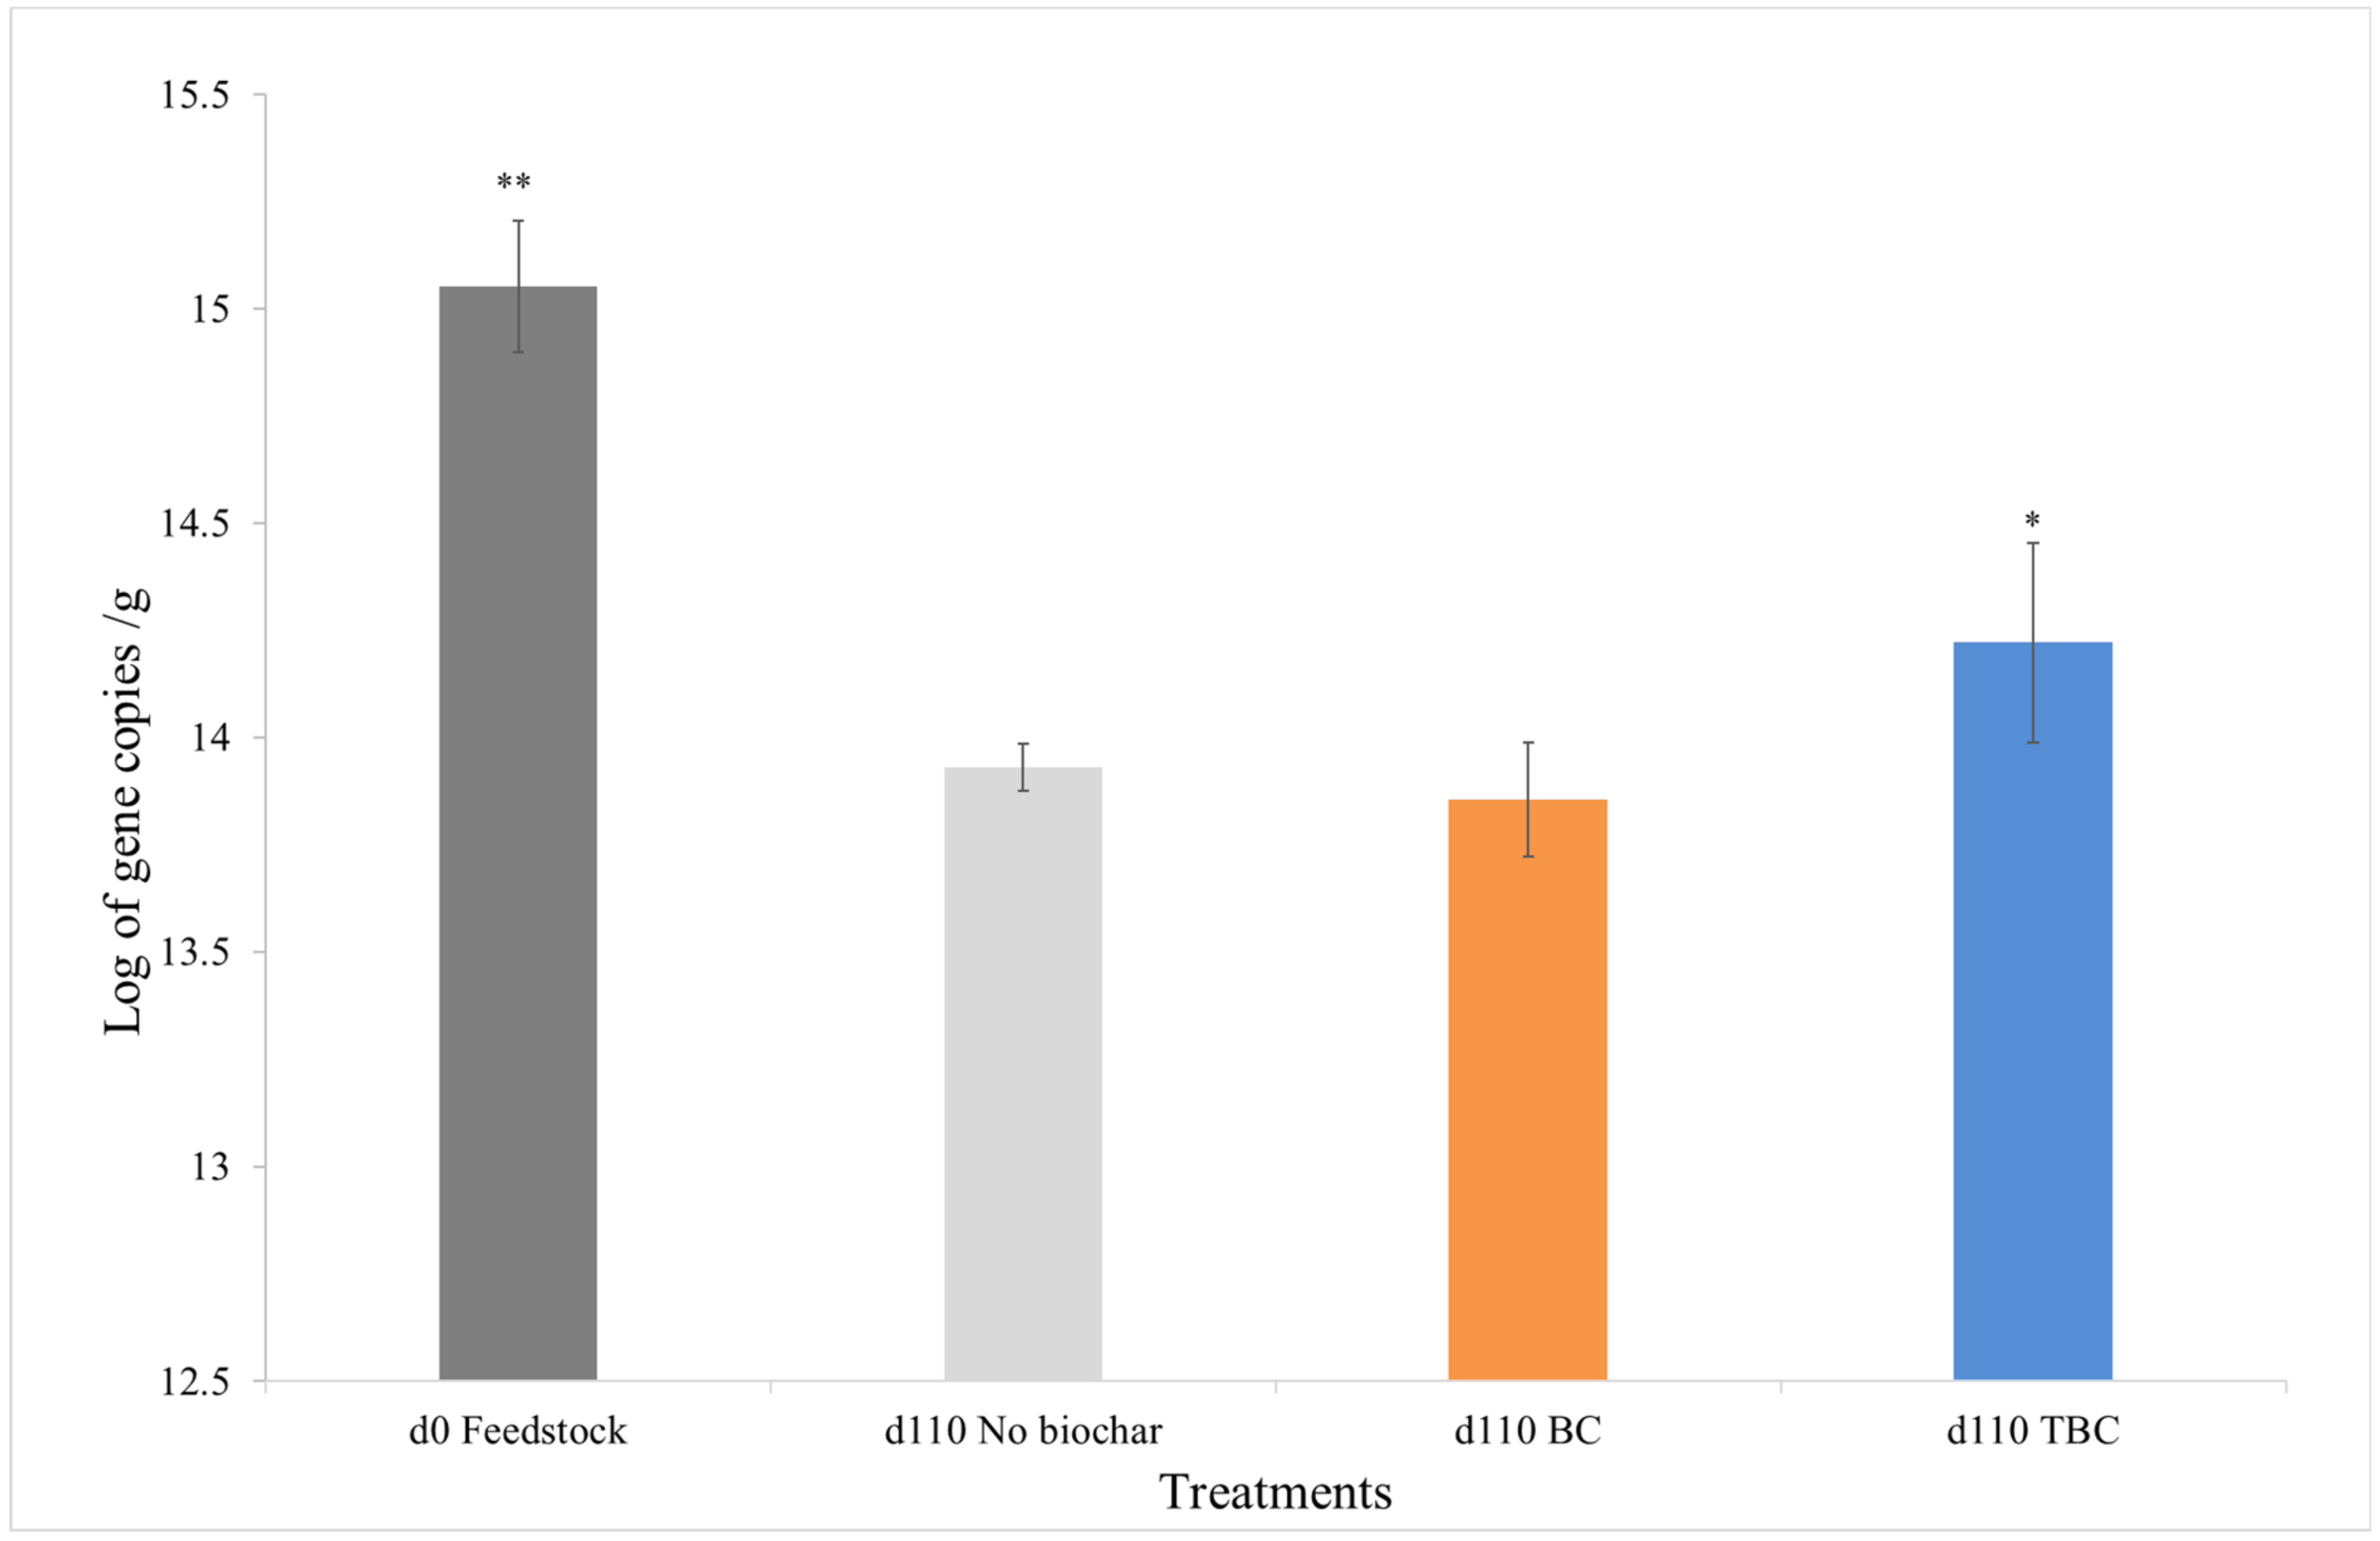
3.4. Changes in Microbial Biomass during Anaerobic Digestion

The results from qPCR analysis reveal a reduction in 16S rRNA gene copies after 110 days of incubation, suggesting a significant reduction in the microbial population in all samples (p < 0.05) (Figure 2). The reduction in microbial population over time was likely a result of ammonia accumulation within the digesters (Table 2). Similar to a study conducted by Puig-Castellví, Cardona [9], high levels of ammonia addition resulted in a continuous decline in relative microbial abundance over 133 days, increasing ammonia exposure produced adverse effects on the microbial communities.
A comparison between the day 110 digestates from the 3 different treatments showed that the treatment containing TBC retained the highest number of gene copies (p < 0.05) (Figure 2). No significant differences in microbial populations were observed between the control and BC treatments after 110 days (p < 0.05). The result suggests that TBC was better at preserving the microbial communities in the ammonia-stressed system. Over 110 days, the use of TBC maintained 19.2%, BC maintained just 6.4% and the control preserved about 7.3% of the day 0 microbial population.
Lü, Liu [38] found that the use of biochar increased the microbial population by 162.9%, compared to controls without biochar in digesters relatively free from inhibitory compounds. In contrast, the addition of BC and TBC in this study did not increase microbial growth (Figure 2). However, the higher level of NH4+ adsorption by TBC significantly reduced the rate at which ammonia was released into the system over the 110 days incubation compared to the other 2 treatments (Table 3). This slower release of ammonia over time allowed for microbial acclimation, a process involving gradual adjustments within an existing microbial population induced by a change in the immediate environment [39]. Microbial acclimation has been shown to improve microbial survival and digester’s performance, and, in this study, only the use of TBC allowed microbial communities to acclimatise to increasing ammonia concentrations [40]. This observation is consistent with the results from a study by Yan, Yan [41], where the use of biochar was successful in protecting the microbial community from ammonia stress. Similar, Giwa, Xu [42] reported that methanogens were able to colonise biochar surfaces and tolerate ammonia stress. The increase in microbial colonisation also led to a higher rate of TAN removal via nutrient utilisation as shown in Table 3. The microbial acclimation is further confirmed by the significantly higher volume of gas produced during the semi-inhibition phase (Figure 1) in treatments containing TBC. From an industry’s perspective, the use of biochar represents a cost-efficient and practical method of ammonia mitigation compared to other complex methods, such as ammonia stripping and trace element supplementation, incurring high operational costs [9].

3.5. Direct Interspecies Electron Transfer

The conjugation of DIET and AD has been shown to be an effective method to improve CH4 production under ammonia stress [5]. While biochar is a conductive material used to promote DIET, its efficacy can be further improved by enhancing its redox activity through chemical treatment [43,44,45]. In this study, treatment of biochar using HNO3 may have resulted in an increase in N and N-containing functional groups. In turn, this might have caused an increase in phenazines, a nitrogenous surface functional group with high redox activity [45]. The presence of phenazines in TBC could have allowed for a higher degree of DIET compared to BC; this is further confirmed by the higher EC from TBC treatments as high levels of DIET have been associated with high EC (Table 3) [45]. Furthermore, the EC of TBC was determined to be 30.3% higher than that of BC (Supplementary Table S1). These N-containing groups are highly reactive electron donors and can also improve biochar’s role as an electron conduit [19]. As a result of this modification, only TBC treatments were able to prolong methane production during the semi-inhibition phase (Figure 1). A recent study by Gao, Wang [27] reported similar observations; biochar modified with HNO3 developed increased redox activity, enhanced DIET and increased CH4 production by 90%.
In this study, the increase in the EC of TBC in the digestate (Table 3) and the higher EC in the TBC treatment (Supplementary Table S1) suggest the presence of DIET; more data is needed to confirm this phenomenon. A recent review by Cai, Zhu [46] highlighted that high-throughput sequencing technology and q-PCR should be employed to confirm the presence of electroactive microorganisms. In addition, the isolation of electroactive microorganisms and subsequent testing for their proposed DIET ability should be undertaken [46]. Future studies on AD of CM should consider these additional methods to confirm the presence of DIET.

3.6. Biochar Characteristics

An analysis of the biochar was conducted to investigate any contributing factors for the varying levels of methane production, TAN removal, preservation of microbial communities and DIET during the AD process. The results of the analyses are presented in Table 4.
The pH of BC increased from 7.93 to 8.47 in TBC due to the chemical treatment. Despite the strong oxidation ability of HNO3, which generally lowers the pH of biochar to as low as 2.89, as observed in a study by Gao, Wang [27], NaOH treatment caused a rise in the final pH of TBC to slightly basic. Acidic biochar likely results in poor NH4+ adsorption due to a higher degree of electrostatic repulsion between the positively charged biochar particles and NH4+; the production of basic biochar is more desirable [5]. In addition, the optimum pH for NH4+ adsorption is between 7 to 9, making the TBC produced in this study a suitable agent for ammonia mitigation [5].

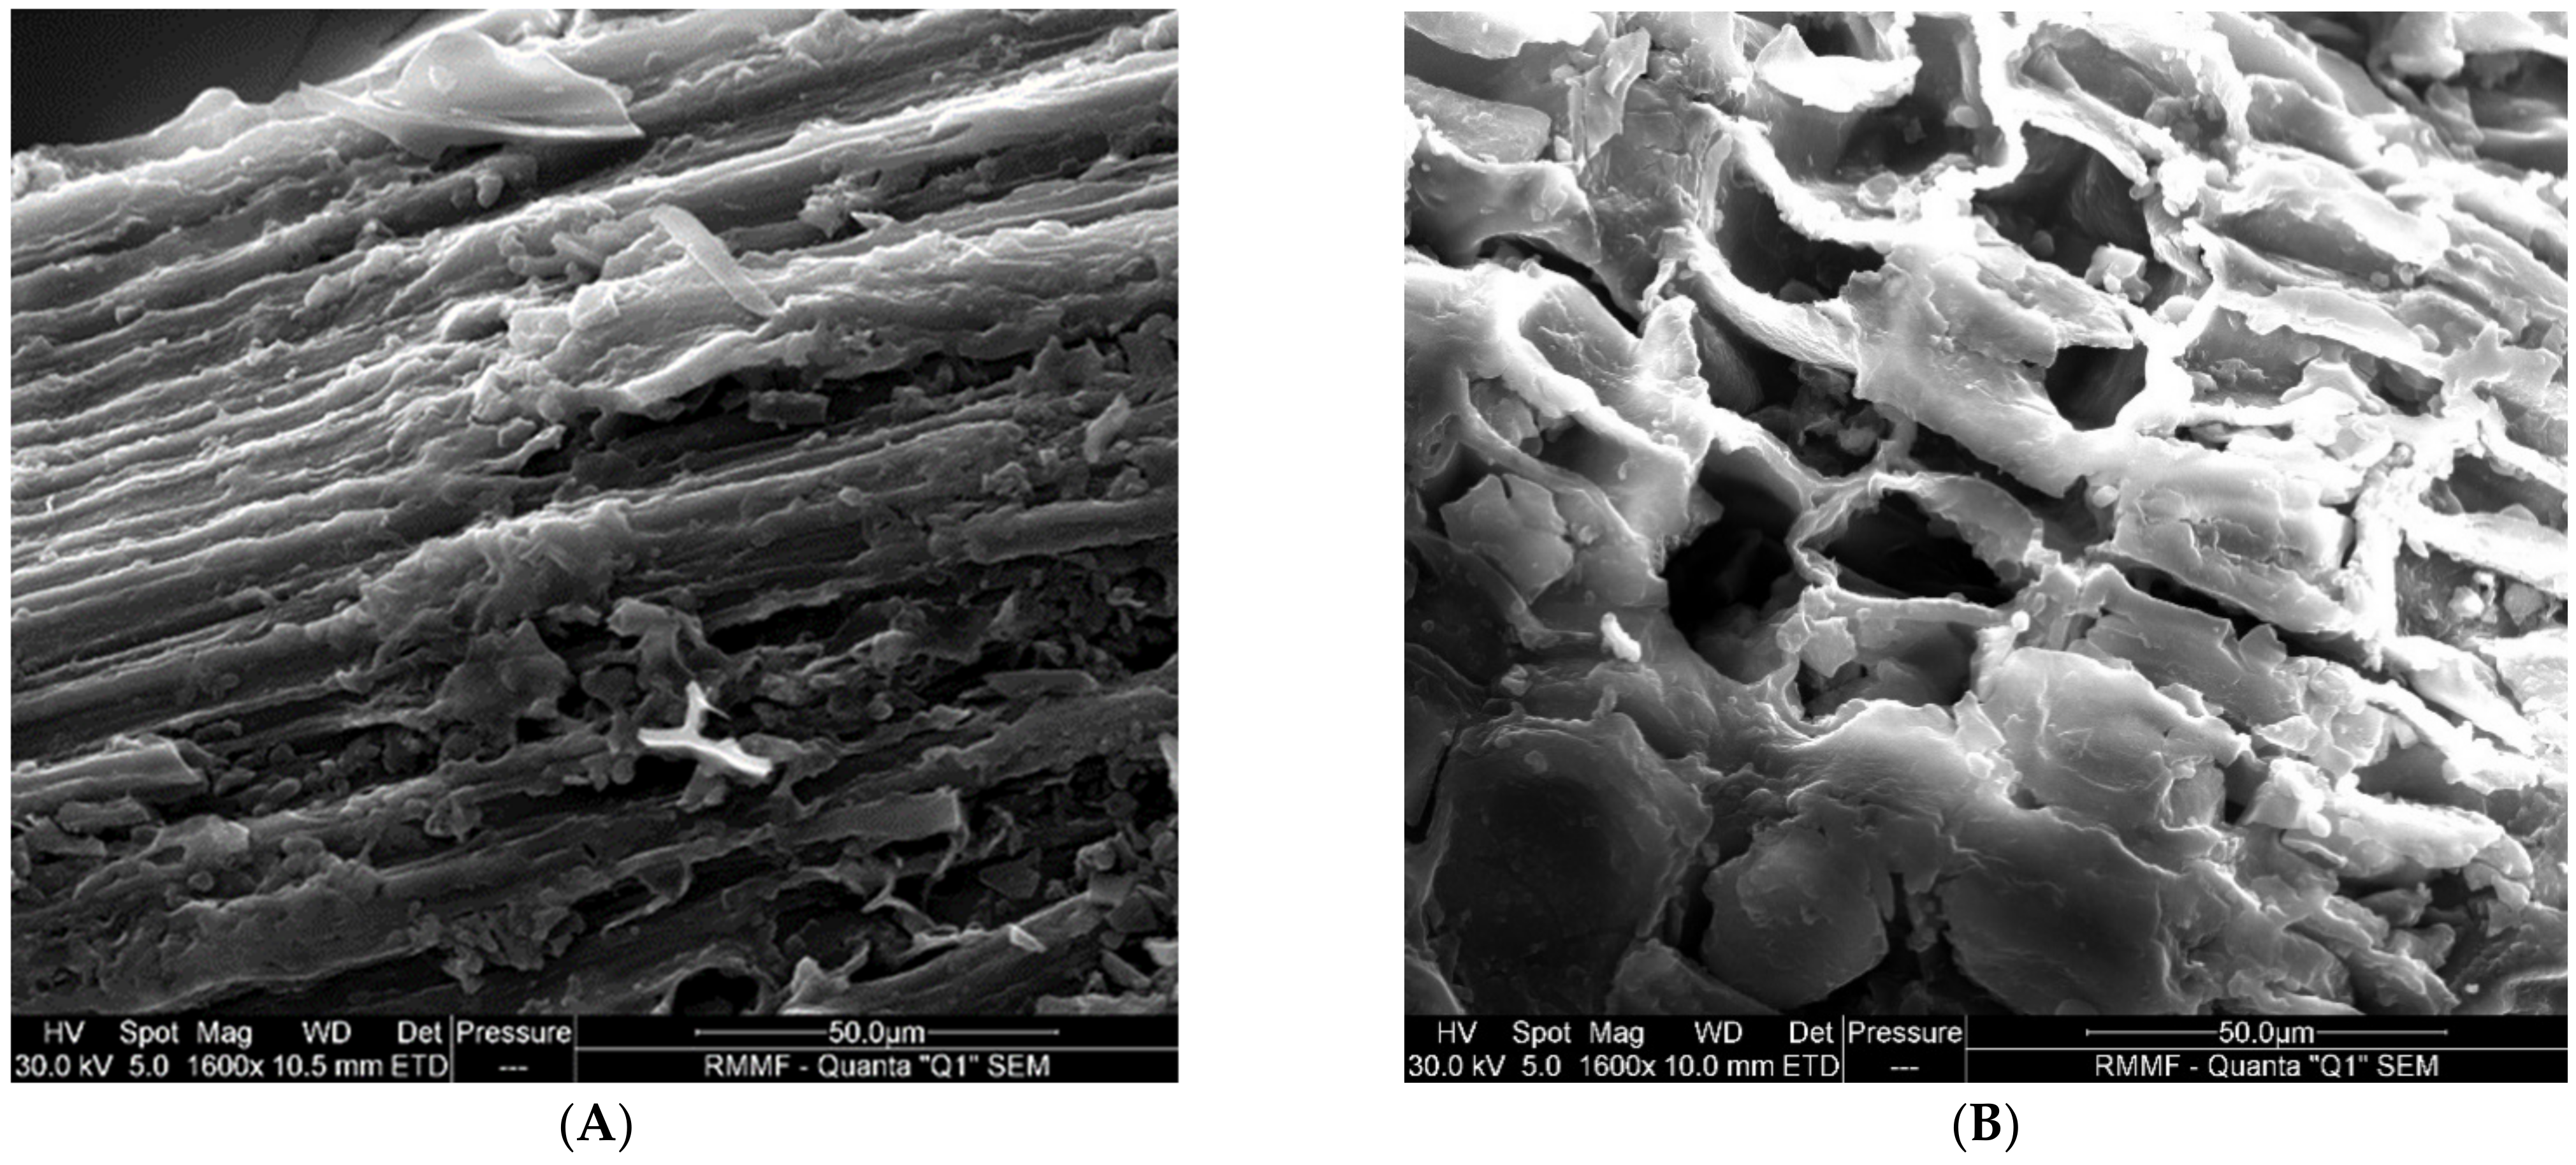
3.6.1. Biochar Surface Morphology

Scanning Electron Microscopy (SEM) revealed the surface structures of BC and TBC (Figure 3). The surface morphology of BC differs largely from that of TBC, exhibiting a rough and flaky structure with some shallow, under-developed pores. In contrast, the surface morphology of TBC was found to be rough with a well-developed pore structure (Figure 3). The acid–alkali treatment resulted in the corrosion of the organic structure, increasing the abundance and quality of pores on the biochar surface through the volatilisation of organic compounds. This observation is consistent with the work of Wang, Miao [47], where the use of acid–alkali treatment resulted in an increase in the porosity of biochar. This increase in porosity can facilitate faster microbial attachment and colonisation [48]. This can enhance the survival of microbial communities in ammonia-stressed systems due to a higher degree of microbial sheltering [5,14]. Furthermore, Jiang, Li [49] reported that porosity heavily influences the rate of adsorption of NH4+, since it determines the rate at which absorbates can enter the biochar’s inner surface.
As a result, the increase in porosity of TBC, as shown in Figure 3, may have further enhanced the acclimation of microbes during AD through a higher degree of microbial sheltering. The highly developed pores of TBC allowed for better colonisation of the biochar by microbes, offered more physical protection from ammonia and preserved a higher microbial population during AD as compared to BC (Figure 3).

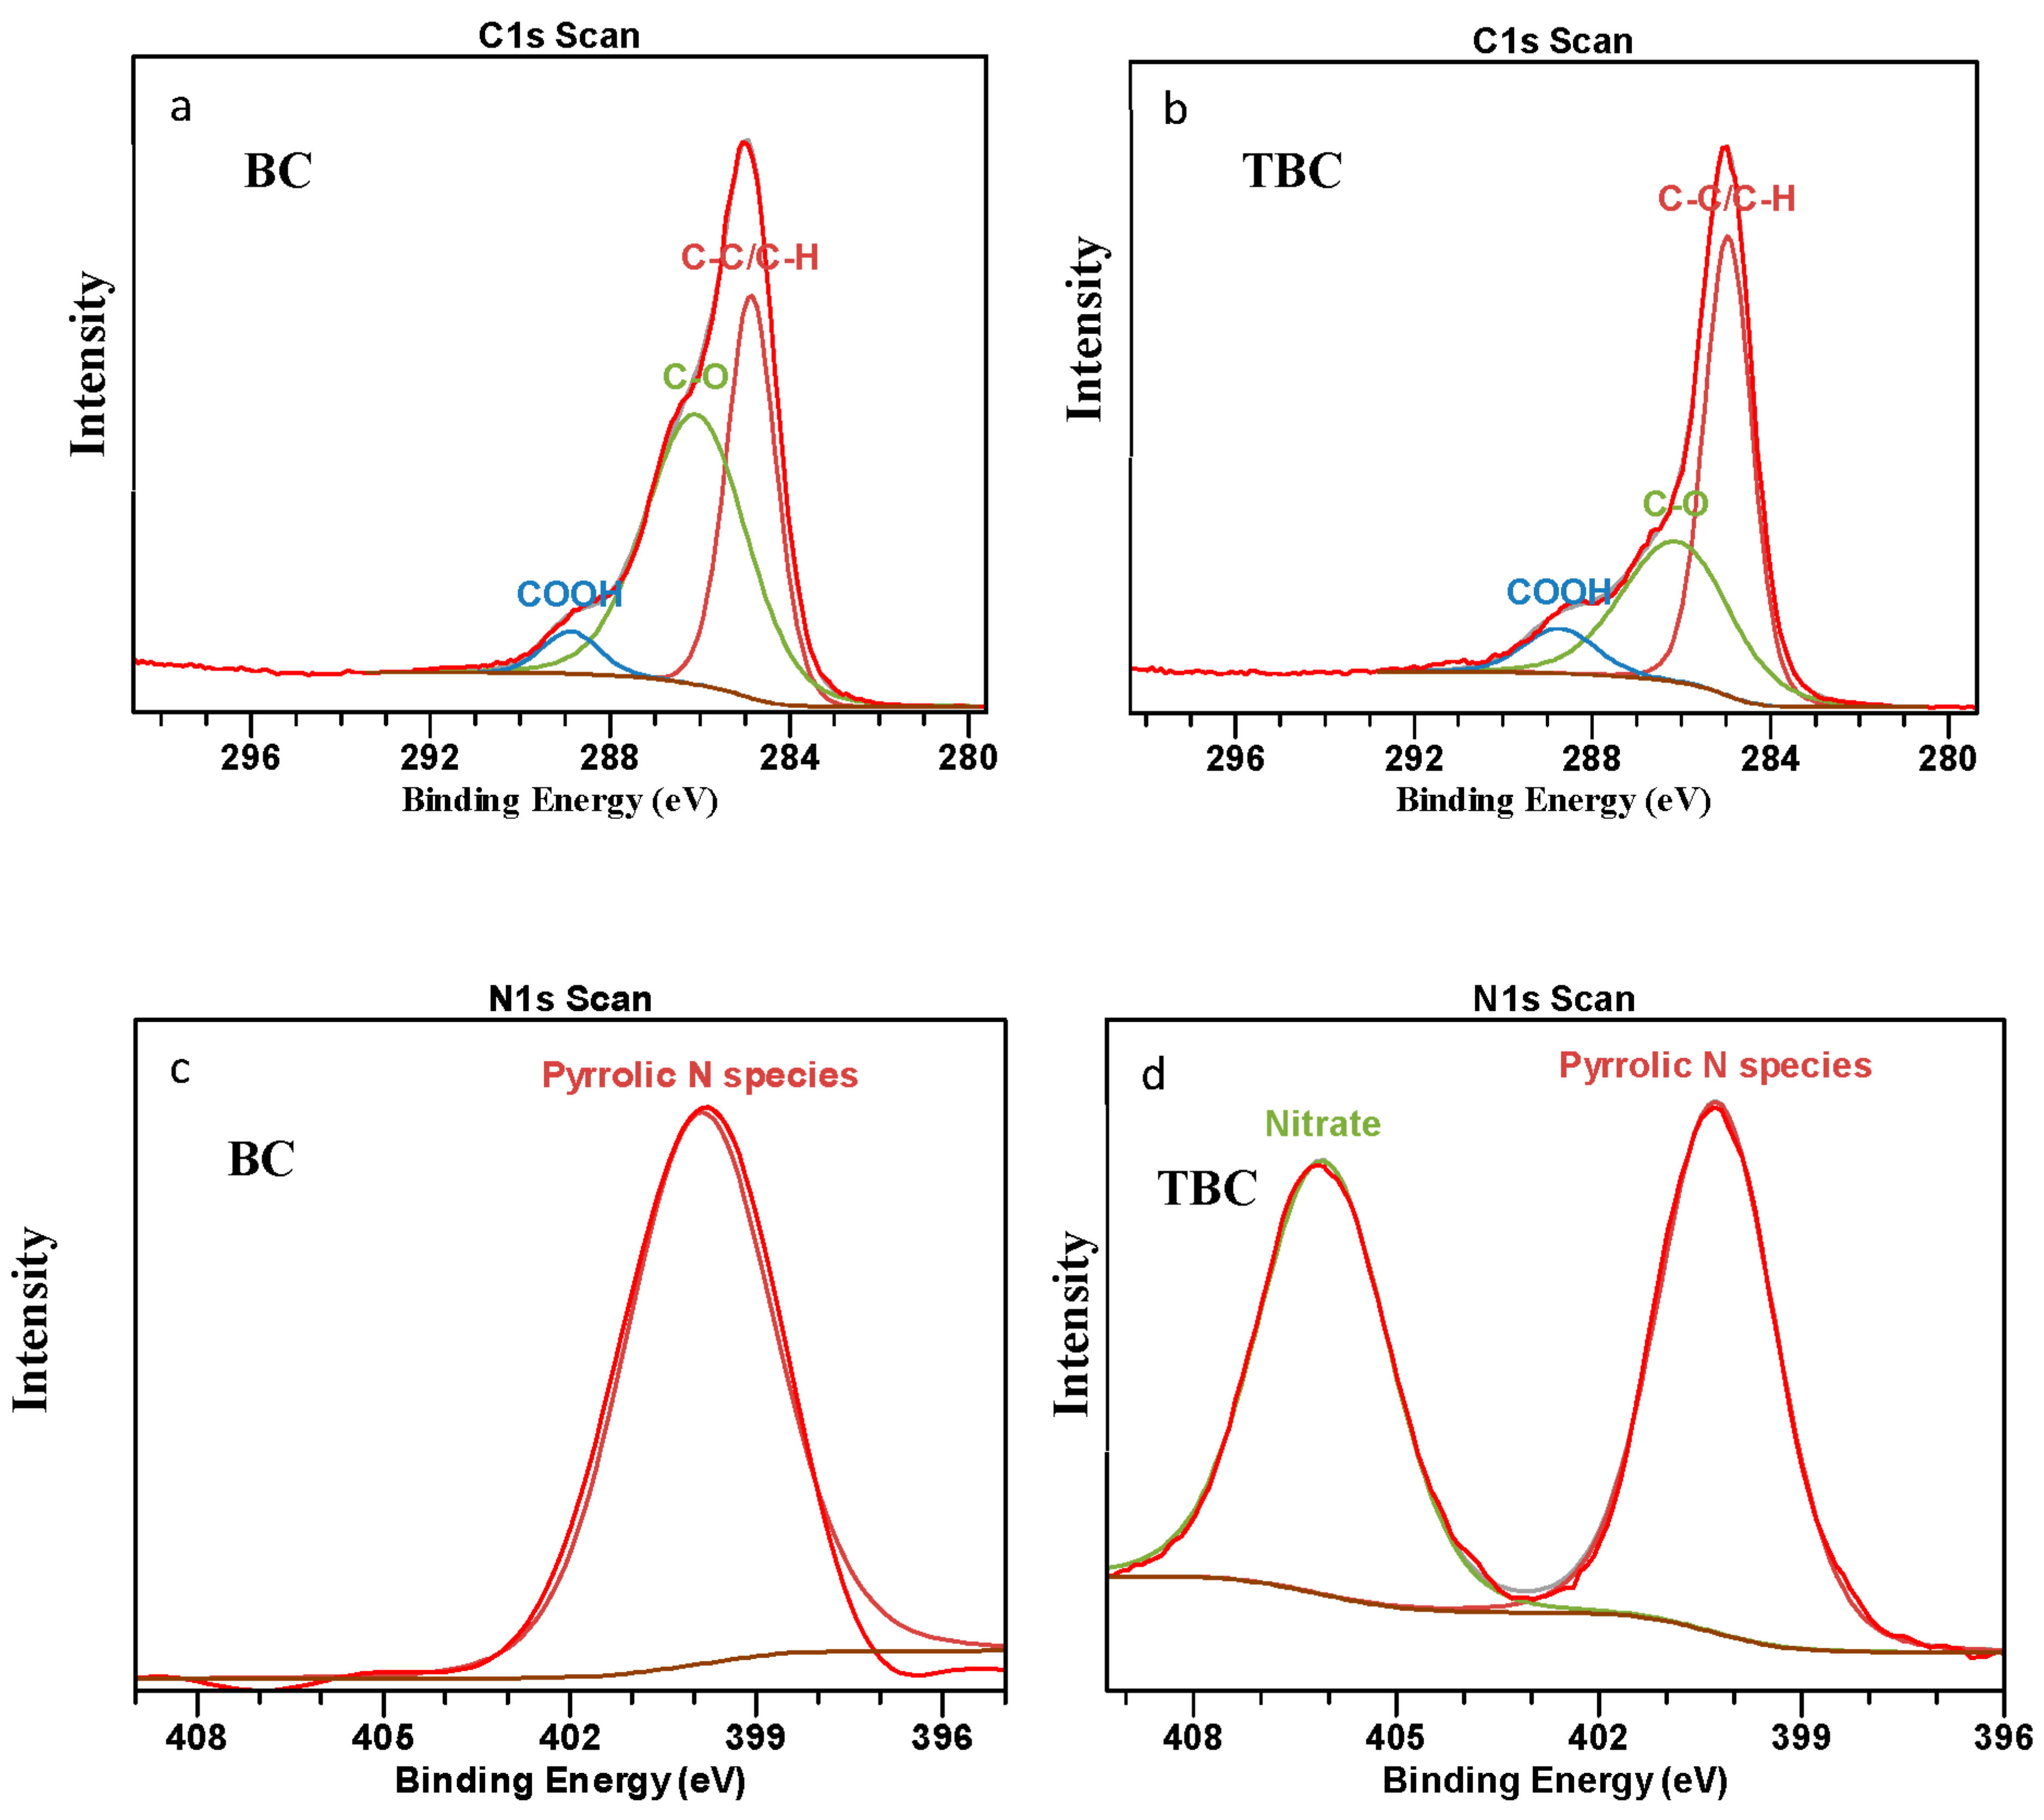
3.6.2. X-ray Photoelectron Spectroscopy (XPS) Analysis

A comparison of the surface composition of C, O, N and Na between the two biochars (BC and TBC) was studied using XPS analysis to investigate the chemical changes occurring from the acid–alkali treatment (Figure 4). The XPS spectra of BC (Figure 4a) and TBC (Figure 4b) showed three Gaussian peaks classified as C1s to correspond to the C-C/C-H, C-O and COOH groups located at 284.8, 286.3 and 289 eV, respectively [27]. Two other Gaussian peaks (Figure 4c,d) were also identified as N1s to correspond to the pyrrolic N species and NO3 groups located at 400 and 406 eV, respectively [50,51,52,53].
From Figure 4a,b, it can be observed that the outer contours of the C1s peak encompass the three subpeaks of the three types of C groups (C-C/C-H, C-O, COOH), showing a satisfactory fit. The acid- and alkali-treated biochar (TBC) has a higher degree of C bonding by C-C/C-H bonds, 40.2% compared to 32.0% for BC (Table 4). The C-O bonds decreased following modification, from 44.5% to 27.9% (Table 4). The increase in C-C/C-H bonds and decrease in C-O bonds are both deemed undesirable to the NH4+ adsorption capacity of the TBC [27]. However, COOH bonds increased from 3.94% to 5.98% post modification, indicating an improvement in the overall NH4+ adsorption capacity of the TBC; the COOH groups on the biochar surface can react with NH4+ via electrostatic attraction to promote surface adsorption [12]. Moreover, the decrease in the C-O bond could be attributed to the change from acidic into salt forms of many surfaces functional groups during the modification step involving NaOH [15].
Figure 4c shows the N1s peak encompassing the singular peak for pyrrolic N species in BC. In contrast, Figure 4d shows two distinct peaks belonging to pyrrolic N species and NO3 in TBC. It can be concluded that the HNO3 treatment resulted in the oxidation of organic compounds to produce new NO3 bonds in TBC.
The treatment of biochar resulted in a reduction in surface C, from 80.4% to 74.1% (Table 4). In contrast, the treatment resulted in an increase in surface O and N, from 18.9% and 0.7% to 20.8% and 2.9%, respectively (Table 4). This simultaneous decrease in surface C and increase in surface O and N can be attributed to biochar oxidation by HNO3. During the first step of the treatment, HNO3 oxidised various functional groups on the biochar surface to produce more O-containing functional groups. This is a desirable outcome as the increase in O-containing functional groups have been shown to increase the NH4+ adsorption potential of biochar [15]. Some N was also incorporated onto the biochar surface due to HNO3 modification, mainly more pyrrolic N species and new NO3 species due to the oxidation of organic functional groups (Table 4). These N-containing groups participate in redox activity that can potentially aid in promoting DIET [27,45]. While the N content on TBC was relatively low (2.9%), a recent study by Deng, Lin [19] reported that a nitrogen content of ≤10% in biochar yielded significant positive effects on its electrical characteristics and DIET potential [23,30]. Firstly, these N-containing groups can donate electrons to methanogens with a high reactivity [18,19]. Secondly, when electronegative N atoms were introduced into the carbonaceous mass of the biochar, the TBC’s electron density was reduced, which in turn enhanced its electron accepting capacity. This increase in the electron accepting capacity of TBC may have improved its performance as an electron conduit for promoting DIET [19].
The second treatment step involving NaOH increased surface Na on the TBC—Na increased from 0% to 2.2% (Table 2). This increase in the presence of Na on surface functional groups resulted from the formation of R-COONa+ and R-ONa+ when acid functional groups reacted with NaOH. These Na-containing surface functional groups and metal oxides are beneficial to the overall NH4+ adsorption capacity of TBC as they can facilitate cation exchange [54,55]. R-COONa+ in TBC can also increase its segregation in an aqueous solution and improve its cation exchange capacity [15]. This is further reflected by the higher CEC of TBC as compared to BC, 31 meq/100 g and 17 meq/100 g, respectively. As a result, TBC achieved the higher TAN removal efficiency than BC (Table 2).

3.6.3. X-ray Fluorescence (XRF) Analysis

The metal oxides CaO, K2O and SiO2 were the most abundant in BC prior to the acid–alkali treatment with concentrations of 10.91%, 1.93% and 0.62%, respectively (Table 4). Following treatment, significant changes were observed in the inorganic composition of the biochar; CaO, K2O and SiO2 compositions were reduced to 2.59%, 0.31% and 0.25%, respectively (Table 4). In addition, MgO, Al2O3 and Fe2O3 concentrations were reduced by 60%, 75% and 42%, respectively (Table 4). The reduction in metal oxides was due to the acid treatment, which leached out the metals. Acid-treated biochar samples are known to have reduced the inorganic content [56]. The reduction in metal oxides could have negatively affected the NH4+ adsorption capacity of the biochar, as metal oxides can adsorb NH4+ via surface complexation and electrostatic attraction [13,49]. However, the lower degree of porosity in BC, as highlighted in Figure 3, limited the rate of which NH4+ could be adsorbed; the entry rate of NH4+ into the inner surface of BC was greatly hindered [49]. This was further confirmed by the higher CEC value of TBC as compared to BC (Table 4). In addition, Na was incorporated into the biochar through alkali (NaOH) treatment, and the Na2O concentration increased from 0% in BC to 3.09% in TBC (Table 2). This finding corroborates the XPS data for Na, which increased from 0% to 2.21%. While the acid treatment reduced the concentration of metal oxides in the biochar, the alkali treatment could supplement the lost metals with Na. This Na supplementation coupled with the increase in the porosity of TBC improved its NH4+ adsorption capacity as compared to BC, leading to a higher rate of TAN removal (Table 2).

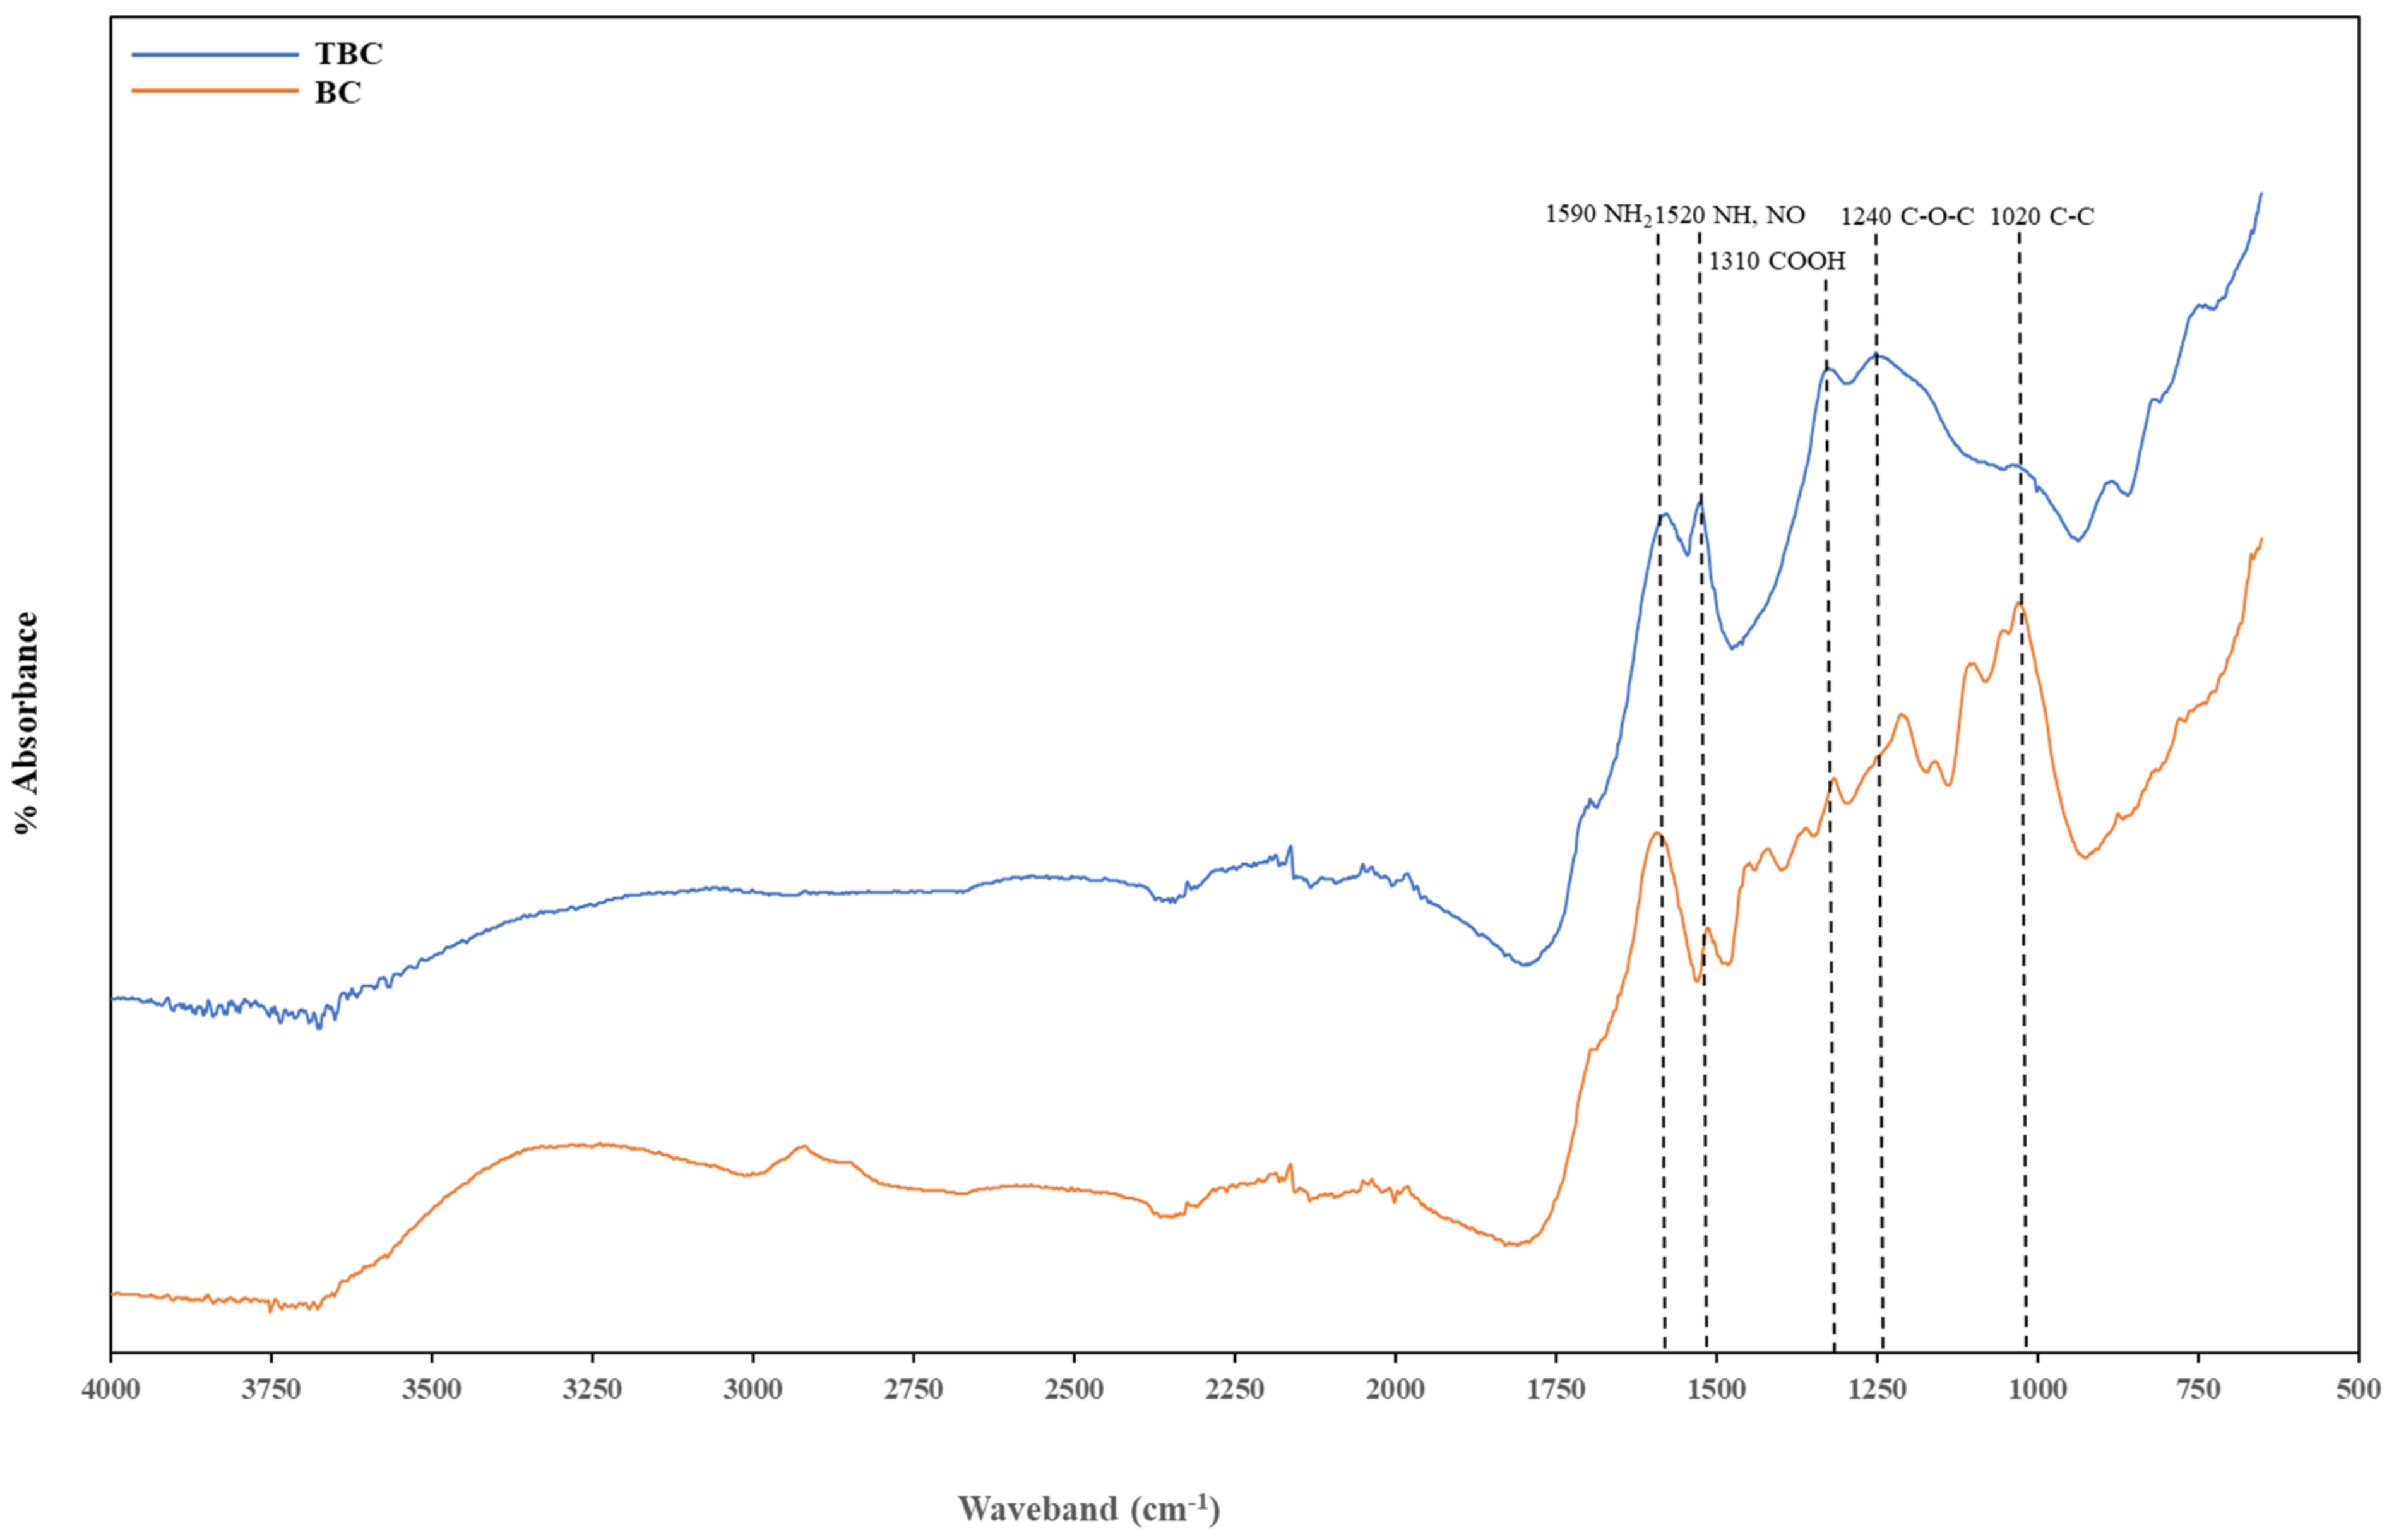
3.6.4. Fourier Transformed Infrared (FTIR) Analysis

FTIR was used to assess the changes in the surface functional groups between BC and TBC arising from the acid–alkali treatment. Five main functional groups were detected from both biochar spectra. The peak in the waveband of 1670–1543 cm−1 is attributed to the NH2 group, the peak at 1543–1470 cm−1 represents N-H and NO2 groups, the signature at 1470–1290 cm−1 is attributed to COOH stretching, the C-O-C (esters) bond occurs between 1290–1160 cm−1, and the C-C aliphatic bond is found around 1043–922 cm−1 (Table 5) (Figure 5).
Biochar treatment (BC) contained more functional groups compared to TBC. These functional groups that could have contributed to the overall NH4+ adsorption capacity were also identified (Table 5) (Figure 5). The peak in the waveband of 3500–3250 cm−1 was attributed to the -OH group in oximes, the peak at 3100-2834 cm−1 represented -OH group in carboxylic acid, the signature at 1440–1400 cm−1 represented the -OH group and the various peaks between 1200–1000 cm−1 represent C-OH in alcohols. The organic functional groups within these wavebands disappeared in the FTIR spectra of TBC. This observation confirmed that the acid treatment reduced the abundance of the functional groups available on the biochar at these wavebands due to the oxidation of organics. This could partly explain the difference in lag time observed between BC and TBC treatments. The higher the variety of -OH functional groups present on BC, the more beneficial in terms of ammonium adsorption in the early stages of AD. These hydroxyl groups can react with NH4+ using electrostatic attraction or surface complexation to promote its uptake, reducing the ammonia stress and improving methane production [13] (Figure 1). However, the abundance of oxygen-containing functional groups could enhance the biochar’s steric hindrance, resulting in difficulties of NH4+ to contact reactive sites on the biochar’s surface [57]. This could also explain the lower CEC observed in BC, despite the higher availability of metal oxides (Table 4). Cumulative gas production by day 28 for both BC and TBC also showed no significant difference; this suggests that the initial higher NH4+ adsorption by BC was eventually hindered by steric hindrance when all the available -OH functional groups reacted with NH4+ (Figure 1). A recent study by Han, Wu [58] reported that increasing oxygen-containing functional groups on biochar enhanced its steric hindrance and limited its sorption capacity.
The acid–alkali treatment reduced the intensity of C-C bonds at 1020 cm−1. However, the treatment increased the intensities of the peaks associated with C-O-C, COOH, NH, NO2 and NH2 bonds found at 1240 cm−1, 1310 cm−1, 1520 cm−1 and 1590 cm−1, respectively. This increase in N-containing functional groups can be attributed to the HNO3 treatment as oxygen functional groups can directly bond with the introduced N [18]. These observations align with the conclusions presented by Wan, Sun [18], where a positive correlation was observed between the abundance of oxygen-containing functional groups and the level of N-doping of a biochar.
Overall, acid–alkali treatment produced biochar with fewer functional groups compared to BC. However, BC’s effectiveness in NH4+ adsorption was reduced by its enhanced steric hindrance. Fourier Transformed Infrared spectra of TBC showed an increase in the intensity of wavebands belonging to N-containing function groups. This was most likely due to the strong oxidation of organic compounds by HNO3 and subsequent nitration effects [59,60]. The increase in N-containing functional groups is desirable as they carried redox activity that greatly enhanced DIET in TBC treatments [27,45] (Figure 1) (Table 3). Wan, Sun [18] also reported that N-doped biochar induced high performances for biological conversion and degradation processes.

4. Conclusions

Wood biochar (BC) and treated-wood biochar (TBC) were effective in removing total ammonium nitrogen (TAN) and improving AD. Digesters containing BC and TBC demonstrated significant improvements in CH4 production for the initial 28 days. The use of BC led to the greatest reduction in lag time and an accelerated initial production of CH4 in the first 8 days compared to TBC, while the cumulative CH4 production between BC and TBC showed no significant difference on the 28th day, possibly due to the enhanced steric hindrance of BC. Acid–alkali treatment of wood biochar resulted in the loss of -OH functional groups, reducing TBC’s steric hindrance. This was observed to increase TBC’s CEC and its overall NH4+ adsorption capacity. Thus, the use of TBC resulted in the highest rate of TAN removal and organic utilisation, as well as the continuity of CH4 production during the semi-inhibition phase of AD. The use of TBC also increased the EC of the digestate, suggesting the presence of DIET-mediated methanogenesis. However, more work is needed to confirm this phenomenon. In addition, digesters with TBC experienced the smallest decrease in microbial population over the course of 110 days. This was most likely due to a higher degree of microbial sheltering from the more porous biochar as a result of the acid treatment. Overall, the use of TBC proved to be the most effective in reducing TAN concentrations, improving CH4 formation kinetics via enhancing substrate degradation, and maintaining the microbial community in an ammonia-stressed environment. At the industry level, both BC and TBC can be economically viable additives to enhance the anaerobic digestion of chicken manure since the study has shown their effectiveness in mitigating ammonia stress and microbial sheltering, even at low concentrations.
Future studies on the AD of chicken manure should consider the use of treated biochar similar to the one used in this study to maximise TAN removal efficiency and CH4 production. In addition, these studies should consider an investigation into the structural changes in the microbial communities over time. This would better reflect the effects of ammonia stress and mitigation on methanogenesis, as well as reveal the intricacy of DIET and its participating methanogens. A recent study conducted by Liu et al. [61] revealed the major methanogenic species that can accept electrons from conductive materials. Similarly, Li et al. [62] related the growth and abundance of certain methanogenic species to the increase in methane production using microbial community analyses. Lastly, these studies should adhere to the usual wastewater industry use of a 20-day retention time, excluding the lag phase, to investigate the cost-effectiveness of using CM as a feedstock for AD.

Supplementary Materials

The following supporting information can be downloaded at: https://www.mdpi.com/article/10.3390/cleantechnol4020026/s1, Table S1: Proximate, ultimate and metal composition analyses of wood biochar (BC) and treated biochar (TBC); Table S2: The mass of material added to the digesters in each treatment.

Author Contributions

Conceptualization, T.N. and A.S.B.; methodology, T.N.; software, T.N.; validation, T.N., A.S.B., A.S. and K.S.; formal analysis, T.N., I.G.H., L.S.K.; investigation, T.N.; resources, T.N. and A.S.B.; data curation, T.N., I.G.H., L.S.K.; writing—original draft preparation, T.N.; writing—review and editing, T.N., A.S.B., A.S., K.S., I.G.H., L.S.K.; visualization, T.N.; supervision, A.S.B., K.S., A.S.; project administration, A.S.B.; funding acquisition, T.N., A.S.B. All authors have read and agreed to the published version of the manuscript.

Funding

This research was funded by the RMIT Research Scholarship (RRSS-SC) from RMIT University.

Acknowledgments

We would like to acknowledge the staff at RMIT Microscopy and Microanalysis Facility for their assistance with X-ray photoelectron spectroscopy analysis. We would also like to acknowledge South East Water for their financial contributions to the project. The first author would like to acknowledge the Australian Research Council Industrial Transformation Training Centre (IC190100033) for providing the top-up scholarship.

Conflicts of Interest

The authors declare that they have no known competing financial interest or personal relationships that could have appeared to influence the work reported in this paper.

References

  1. Moore, P.A.; Daniel, T.C.; Sharpley, A.N.; Wood, C.W. Poultry Manure Management; United States Department of Agriculture, Ed.; United States Department of Agriculture: Washington, DC, USA, 2021.
  2. Jurgutis, L.; Slepetiene, A.; Volungevicius, J.; Amaleviciute-Volunge, K. Biogas production from chicken manure at different organic loading rates in a mesophilic full scale anaerobic digestion plant. Biomass Bioenergy 2020, 141, 105693. [Google Scholar] [CrossRef]
  3. Chen, B.; Shao, Y.; Shi, M.; Ji, L.; He, Q.; Yan, S. Anaerobic digestion of chicken manure coupled with ammonia recovery by vacuum-assisted gas-permeable membrane process. Biochem. Eng. J. 2021, 175, 108135. [Google Scholar] [CrossRef]
  4. Junga, R.; Knauer, W.; Niemiec, P.; Tańczuk, M. Experimental tests of co-combustion of laying hens manure with coal by using thermogravimetric analysis. Renew. Energy 2017, 111, 245–255. [Google Scholar] [CrossRef]
  5. Ngo, T.; Shahsavari, E.; Shah, K.; Surapaneni, A.; Ball, A.S. Improving bioenergy production in anaerobic digestion systems utilising chicken manure via pyrolysed biochar additives: A review. Fuel 2022, 316, 123374. [Google Scholar] [CrossRef]
  6. Shi, X.; Lin, J.; Zuo, J.; Li, P.; Li, X.; Guo, X. Effects of free ammonia on volatile fatty acid accumulation and process performance in the anaerobic digestion of two typical bio-wastes. J. Environ. Sci. 2017, 55, 49–57. [Google Scholar] [CrossRef]
  7. Yuan, H.; Zhu, N. Progress in inhibition mechanisms and process control of intermediates and by-products in sewage sludge anaerobic digestion. Renew. Sustain. Energy Rev. 2016, 58, 429–438. [Google Scholar] [CrossRef]
  8. Jiang, Y.; McAdam, E.; Zhang, Y.; Heaven, S.; Banks, C.; Longhurst, P. Ammonia inhibition and toxicity in anaerobic digestion: A critical review. J. Water Process Eng. 2019, 32, 100899. [Google Scholar] [CrossRef]
  9. Puig-Castellví, F.; Cardona, L.; Bureau, C.; Bouveresse, D.J.-R.; Cordella, C.B.; Mazéas, L.; Rutledge, D.N.; Chapleur, O. Effect of ammonia exposure and acclimation on the performance and the microbiome of anaerobic digestion. Bioresour. Technol. Rep. 2020, 11, 100488. [Google Scholar] [CrossRef]
  10. Ma, J.; Chen, F.; Xue, S.; Pan, J.; Khoshnevisan, B.; Yang, Y.; Liu, H.; Qiu, L. Improving anaerobic digestion of chicken manure under optimized biochar supplementation strategies. Bioresour. Technol. 2021, 325, 124697. [Google Scholar] [CrossRef]
  11. Chen, M.; Wang, F.; Zhang, D.-L.; Yi, W.-M.; Liu, Y. Effects of acid modification on the structure and adsorption NH4+-N properties of biochar. Renew. Energy 2021, 169, 1343–1350. [Google Scholar] [CrossRef]
  12. Yin, Q.; Liu, M.; Ren, H. Biochar produced from the co-pyrolysis of sewage sludge and walnut shell for ammonium and phosphate adsorption from water. J. Environ. Manag. 2019, 249, 109410. [Google Scholar] [CrossRef] [PubMed]
  13. Shakoor, M.B.; Ye, Z.-L.; Chen, S. Engineered biochars for recovering phosphate and ammonium from wastewater: A review. Sci. Total Environ. 2021, 779, 146240. [Google Scholar] [CrossRef] [PubMed]
  14. Wang, G.; Chu, Y.; Zhu, J.; Sheng, L.; Liu, G.; Xing, Y.; Fu, P.; Li, Q.; Chen, R. Multi-faceted influences of biochar addition on swine manure digestion under tetracycline antibiotic pressure. Bioresour. Technol. 2022, 346, 126352. [Google Scholar] [CrossRef] [PubMed]
  15. Vu, T.M.; Trinh, V.T.; Doan, D.P.; Van, H.T.; Nguyen, T.V.; Vigneswaran, S.; Ngo, H.H. Removing ammonium from water using modified corncob-biochar. Sci. Total Environ. 2017, 579, 612–619. [Google Scholar] [CrossRef]
  16. Zhang, Y.; Li, Z.; Zhang, R.; Zhao, R. Adsorption characters of ammonium-nitrogen in aqueous solution by modified corn cob biochars. CIESC J. 2014, 65, 960–966. [Google Scholar]
  17. Surendra, K.; Takara, D.; Hashimoto, A.G.; Khanal, S.K. Biogas as a sustainable energy source for developing countries: Opportunities and challenges. Renew. Sustain. Energy Rev. 2014, 31, 846–859. [Google Scholar] [CrossRef]
  18. Wan, Z.; Sun, Y.; Tsang, D.C.; Khan, E.; Yip, A.C.; Ng, Y.H.; Rinklebe, J.; Ok, Y.S. Customised fabrication of nitrogen-doped biochar for environmental and energy applications. Chem. Eng. J. 2020, 401, 126136. [Google Scholar] [CrossRef]
  19. Deng, C.; Lin, R.; Kang, X.; Wu, B.; Wall, D.M.; Murphy, J.D. What physicochemical properties of biochar facilitate interspecies electron transfer in anaerobic digestion: A case study of digestion of whiskey by-products. Fuel 2021, 306, 121736. [Google Scholar] [CrossRef]
  20. Lian, F.; Cui, G.; Liu, Z.; Duo, L.; Zhang, G.; Xing, B. One-step synthesis of a novel N-doped microporous biochar derived from crop straws with high dye adsorption capacity. J. Environ. Manag. 2016, 176, 61–68. [Google Scholar] [CrossRef] [Green Version]
  21. Bi, S.; Westerholm, M.; Qiao, W.; Mahdy, A.; Xiong, L.; Yin, D.; Fan, R.; Dach, J.; Dong, R. Enhanced methanogenic performance and metabolic pathway of high solid anaerobic digestion of chicken manure by Fe2+ and Ni2+ supplementation. Waste Manag. 2019, 94, 10–17. [Google Scholar] [CrossRef]
  22. Bhatnagar, N.; Ryan, D.; Murphy, R.; Enright, A.M. A comprehensive review of green policy, anaerobic digestion of animal manure and chicken litter feedstock potential—Global and Irish perspective. Renew. Sustain. Energy Rev. 2022, 154, 111884. [Google Scholar] [CrossRef]
  23. Indren, M.; Birzer, C.; Kidd, S.; Medwell, P.R. Effect of total solids content on anaerobic digestion of poultry litter with biochar. J. Environ. Manag. 2020, 255, 109744. [Google Scholar] [CrossRef] [PubMed]
  24. Indren, M.; Birzer, C.H.; Kidd, S.P.; Hall, T.; Medwell, P.R. Effect of wood biochar dosage and re-use on high-solids anaerobic digestion of chicken litter. Biomass Bioenergy 2021, 144, 105872. [Google Scholar] [CrossRef]
  25. Pan, J.; Ma, J.; Liu, X.; Zhai, L.; Ouyang, X.; Liu, H. Effects of different types of biochar on the anaerobic digestion of chicken manure. Bioresour. Technol. 2019, 275, 258–265. [Google Scholar] [CrossRef] [PubMed]
  26. Kassongo, J.; Shahsavari, E.; Ball, A.S. Renewable energy from the solid-state anaerobic digestion of grape marc and cheese whey at high treatment capacity. Biomass Bioenergy 2020, 143, 105880. [Google Scholar] [CrossRef]
  27. Gao, B.; Wang, Y.; Huang, L.; Liu, S. Study on the performance of HNO3-modified biochar for enhanced medium temperature anaerobic digestion of food waste. Waste Manag. 2021, 135, 338–346. [Google Scholar] [CrossRef]
  28. Kassongo, J.; Shahsavari, E.; Ball, A.S. Dynamic Effect of Operational Regulation on the Mesophilic BioMethanation of Grape Marc. Molecules 2021, 26, 6692. [Google Scholar] [CrossRef]
  29. IEA Bioenergy. Mono-Digestion of Chicken Litter: Tully Biogas Plant, Ballymena, Northern Ireland. 2019. Available online: https://www.ieabioenergy.com/blog/publications/mono-digestion-of-chicken-litter-tully-biogas-plant-ballymena-northern-ireland/ (accessed on 15 April 2022).
  30. Shahsavari, E.; Aburto-Medina, A.; Taha, M.; Ball, A.S. A quantitative PCR approach for quantification of functional genes involved in the degradation of polycyclic aromatic hydrocarbons in contaminated soils. MethodsX 2016, 3, 205–211. [Google Scholar] [CrossRef]
  31. Yu, Q.; Sun, C.; Liu, R.; Yellezuome, D.; Zhu, X.; Bai, R.; Liu, M.; Sun, M. Anaerobic co-digestion of corn stover and chicken manure using continuous stirred tank reactor: The effect of biochar addition and urea pretreatment. Bioresour. Technol. 2021, 319, 124197. [Google Scholar] [CrossRef]
  32. Wang, Z.; Zhang, C.; Watson, J.; Sharma, B.K.; Si, B.; Zhang, Y. Adsorption or direct interspecies electron transfer? A comprehensive investigation of the role of biochar in anaerobic digestion of hydrothermal liquefaction aqueous phase. Chem. Eng. J. 2022, 435, 135078. [Google Scholar] [CrossRef]
  33. Bonk, F.; Popp, D.; Weinrich, S.; Sträuber, H.; Kleinsteuber, S.; Harms, H.; Centler, F. Ammonia Inhibition of Anaerobic Volatile Fatty Acid Degrading Microbial Communities. Front. Microbiol. 2018, 9, 2921. [Google Scholar] [CrossRef] [PubMed]
  34. Waltham, B.; Örmeci, B. Fluorescence intensity, conductivity, and UV–vis absorbance as surrogate parameters for real-time monitoring of anaerobic digestion of wastewater sludge. J. Water Process Eng. 2020, 37, 101395. [Google Scholar] [CrossRef]
  35. Zhang, J.; Zhang, R.; He, Q.; Ji, B.; Wang, H.; Yang, K. Adaptation to salinity: Response of biogas production and microbial communities in anaerobic digestion of kitchen waste to salinity stress. J. Biosci. Bioeng. 2020, 130, 173–178. [Google Scholar] [CrossRef] [PubMed]
  36. Tsapekos, P.; Kovalovszki, A.; Alvarado-Morales, M.; Rudatis, A.; Kougias, P.G.; Angelidaki, I. Anaerobic co-digestion of macroalgal biomass with cattle manure under high salinity conditions. J. Environ. Chem. Eng. 2021, 9, 105406. [Google Scholar] [CrossRef]
  37. Kizito, S.; Wu, S.; Kirui, W.K.; Lei, M.; Lu, Q.; Bah, H.; Dong, R. Evaluation of slow pyrolyzed wood and rice husks biochar for adsorption of ammonium nitrogen from piggery manure anaerobic digestate slurry. Sci. Total Environ. 2015, 505, 102–112. [Google Scholar] [CrossRef]
  38. Lü, F.; Liu, Y.; Shao, L.; He, P. Powdered biochar doubled microbial growth in anaerobic digestion of oil. Appl. Energy 2019, 247, 605–614. [Google Scholar] [CrossRef]
  39. Madigou, C.; Poirier, S.; Bureau, C.; Chapleur, O. Acclimation strategy to increase phenol tolerance of an anaerobic microbiota. Bioresour. Technol. 2016, 216, 77–86. [Google Scholar] [CrossRef]
  40. Tian, H.; Fotidis, I.A.; Mancini, E.; Treu, L.; Mahdy, A.; Ballesteros, M.; González-Fernández, C.; Angelidaki, I. Acclimation to extremely high ammonia levels in continuous biomethanation process and the associated microbial community dynamics. Bioresour. Technol. 2018, 247, 616–623. [Google Scholar] [CrossRef] [Green Version]
  41. Yan, Y.; Yan, M.; Ravenni, G.; Angelidaki, I.; Fu, D.; Fotidis, I.A. Novel bioaugmentation strategy boosted with biochar to alleviate ammonia toxicity in continuous biomethanation. Bioresour. Technol. 2022, 343, 126146. [Google Scholar] [CrossRef]
  42. Giwa, A.S.; Xu, H.; Chang, F.; Wu, J.; Li, Y.; Ali, N.; Ding, S.; Wang, K. Effect of biochar on reactor performance and methane generation during the anaerobic digestion of food waste treatment at long-run operations. J. Environ. Chem. Eng. 2019, 7, 103067. [Google Scholar] [CrossRef]
  43. Gahlot, P.; Ahmed, B.; Tiwari, S.B.; Aryal, N.; Khursheed, A.; Kazmi, A.; Tyagi, V.K. Conductive material engineered direct interspecies electron transfer (DIET) in anaerobic digestion: Mechanism and application. Environ. Technol. Innov. 2020, 20, 101056. [Google Scholar] [CrossRef]
  44. Beckmann, S.; Welte, C.; Li, X.; Oo, Y.M.; Kroeninger, L.; Heo, Y.; Zhang, M.; Ribeiro, D.; Lee, M.; Bhadbhade, M.; et al. Novel phenazine crystals enable direct electron transfer to methanogens in anaerobic digestion by redox potential modulation. Energy Environ. Sci. 2016, 9, 644–655. [Google Scholar] [CrossRef] [Green Version]
  45. Wang, G.; Li, Q.; Li, Y.; Xing, Y.; Yao, G.; Liu, Y.; Chen, R.; Wang, X. Redox-active biochar facilitates potential electron tranfer between syntrophic partners to enhance anaerobic digestion under high organic loading rate. Bioresour. Technol. 2020, 298, 122524. [Google Scholar] [CrossRef] [PubMed]
  46. Cai, Y.; Zhu, M.; Meng, X.; Zhou, J.L.; Zhang, H.; Shen, X. The role of biochar on alleviating ammonia toxicity in anaerobic digestion of nitrogen-rich wastes: A review. Bioresour. Technol. 2022, 351, 126924. [Google Scholar] [CrossRef] [PubMed]
  47. Wang, Y.; Miao, J.; Saleem, M.; Yang, Y.; Zhang, Q. Enhanced adsorptive removal of carbendazim from water by FeCl3-modified corn straw biochar as compared with pristine, HCl and NaOH modification. J. Environ. Chem. Eng. 2022, 10, 107024. [Google Scholar] [CrossRef]
  48. Liu, Y.; Chen, H.; Zhao, L.; Li, Z.; Yi, X.; Guo, T.; Cao, X. Enhanced trichloroethylene biodegradation: Roles of biochar-microbial collaboration beyond adsorption. Sci. Total Environ. 2021, 792, 148451. [Google Scholar] [CrossRef]
  49. Jiang, Y.-H.; Li, A.-Y.; Deng, H.; Ye, C.-H.; Wu, Y.-Q.; Linmu, Y.-D.; Hang, H.-L. Characteristics of nitrogen and phosphorus adsorption by Mg-loaded biochar from different feedstocks. Bioresour. Technol. 2019, 276, 183–189. [Google Scholar] [CrossRef]
  50. Osadchii, D.Y.; Olivos-Suarez, A.I.; Bavykina, A.V.; Gascon, J. Revisiting Nitrogen Species in Covalent Triazine Frameworks. Langmuir 2017, 33, 14278–14285. [Google Scholar] [CrossRef] [Green Version]
  51. Liu, S.-H.; Huang, Y.-Y. Valorization of coffee grounds to biochar-derived adsorbents for CO2 adsorption. J. Clean. Prod. 2018, 175, 354–360. [Google Scholar] [CrossRef]
  52. Hu, J.; Zhang, L.; Lu, B.; Wang, X.; Huang, H. LaMnO3 nanoparticles supported on N doped porous carbon as efficient photocatalyst. Vacuum 2019, 159, 59–68. [Google Scholar] [CrossRef]
  53. Mahaninia, M.H.; Rahimian, P.; Kaghazchi, T. Modified activated carbons with amino groups and their copper adsorption properties in aqueous solution. Chin. J. Chem. Eng. 2015, 23, 50–56. [Google Scholar] [CrossRef]
  54. Yin, Q.; Wang, R.; Zhao, Z. Application of Mg–Al-modified biochar for simultaneous removal of ammonium, nitrate, and phosphate from eutrophic water. J. Clean. Prod. 2018, 176, 230–240. [Google Scholar] [CrossRef]
  55. Wang, S.; Ai, S.; Nzediegwu, C.; Kwak, J.-H.; Islam, S.; Li, Y.; Chang, S.X. Carboxyl and hydroxyl groups enhance ammonium adsorption capacity of iron (III) chloride and hydrochloric acid modified biochars. Bioresour. Technol. 2020, 309, 123390. [Google Scholar] [CrossRef]
  56. Munar-Florez, D.A.; Varón-Cardenas, D.A.; Ramírez-Contreras, N.E.; García-Núñez, J.A. Adsorption of ammonium and phosphates by biochar produced from oil palm shells: Effects of production conditions. Results Chem. 2021, 3, 100119. [Google Scholar] [CrossRef]
  57. Zhang, M.; Shu, L.; Guo, X.; Shen, X.; Zhang, H.; Shen, G.; Wang, B.; Yang, Y.; Tao, S.; Wang, X. Impact of humic acid coating on sorption of naphthalene by biochars. Carbon 2015, 94, 946–954. [Google Scholar] [CrossRef]
  58. Han, L.; Wu, W.; Chen, X.; Chen, M. Co-sorption/co-desorption mechanism of the mixed chlorobenzenes by fresh bulk and aged residual biochar. J. Hazard. Mater. 2022, 429, 128349. [Google Scholar] [CrossRef]
  59. Boguta, P.; Sokołowska, Z.; Skic, K.; Tomczyk, A. Chemically engineered biochar—Effect of concentration and type of modifier on sorption and structural properties of biochar from wood waste. Fuel 2019, 256, 115893. [Google Scholar] [CrossRef]
  60. Yang, G.-X.; Jiang, H. Amino modification of biochar for enhanced adsorption of copper ions from synthetic wastewater. Water Res. 2014, 48, 396–405. [Google Scholar] [CrossRef]
  61. Liu, H.; Wang, X.; Fang, Y.; Lai, W.; Xu, S.; Lichtfouse, E. Enhancing thermophilic anaerobic co-digestion of sewage sludge and food waste with biogas residue biochar. Renew. Energy 2022, 188, 465–475. [Google Scholar] [CrossRef]
  62. Li, X.; Wu, M.; Xue, Y. Nickel-loaded shrimp shell biochar enhances batch anaerobic digestion of food waste. Bioresour. Technol. 2022, 352, 127092. [Google Scholar] [CrossRef]
Figure 1. Cumulative CH4 production (mL g−1 VS) over 110 days, by acid–alkali-treated biochar (TBC), wood biochar (BC) and no biochar treatments (Control).
Cleantechnol 04 00026 g001
Figure 2. Changes in microbial biomass (assessed as log10 16SrRNA gene copies) per gram of day 0 feedstock and 3, day 110 digestates: control (No biochar), wood biochar treatments (BC) and treated biochar treatments (TBC), with error bars. The results shown are the means of three replicates, ** represents significant differences between d0 and d110 samples, * represents significant differences between all d110 samples for the three treatments.
Cleantechnol 04 00026 g002
Figure 3. Scanning electron microscopy images of wood biochar (A) and treated-wood biochar (B).
Cleantechnol 04 00026 g003
Figure 4. X-ray photoelectron spectroscopy spectra showing the C1s spectrum of (a) wood biochar (BC) and (b) treated biochar (TBC); and N1s spectrum of (c) wood biochar (BC) and (d) treated biochar (TBC).
Cleantechnol 04 00026 g004
Figure 5. Fourier Transformed Infrared (FTIR) spectra of biochar (BC) and treated biochar (TBC).
Cleantechnol 04 00026 g005
Table 1. Characteristics of chicken manure, inoculant and their mixture prior to anaerobic digestion (day 0), with the respective units.
PropertiesUnitChicken ManureInoculantChicken Manure and Inoculant
Total chemical oxygen demand (CODt) g L−114.4 ± 0.402.48 ± 0.0712.6 ± 0.31
Soluble chemical oxygen demand (CODs) g L−113.5 ± 0.852.14 ± 0.167.78 ± 0.17
Volatile solids (VSs) %59.7 ± 3.311.89 ± 0.4311.9 ± 0.53
Total solids (TSs) %80.9 ± 0.362.67 ± 0.0314.4 ± 0.38
Electrical conductivity (EC) mS cm−152.6 ± 0.173.82 ± 0.0925.8 ± 0.26
Salinity %23.0 ± 1.732.33 ± 0.5811.3 ± 0.57
pH -8.61 ± 0.017.49 ± 0.027.41 ± 0.01
Total ammonia nitrogen (TAN) mg L−12600 ± 0.00200 ± 0.002267 ± 46.2
Values presented as the means of triplicates with standard deviation (SD) of the mean.
Table 2. The total ammonia nitrogen (TAN) concentration and TAN removal efficiency of the experimental treatments at the start of the experiment (d0) and the end of the experiment (d110).
Treatmentd0 TAN
(mg-TAN l−1)
d110 TAN
(mg-TAN l−1)
Increase in TAN
(mg-TAN l−1)
Increase in TAN (%)TAN Removal Efficiency
(%)
Control
(No biochar)
22673822155668.60
Wood biochar
(BC)
2533307554221.465.1
Treated biochar
(TBC)
256027732138.3386.3
Values given in mean of triplicates.
Table 3. Properties of day 110 digestates and percentage changes relative to day 0 material.
ParametersChicken Manure and Inoculant (No Biochar) Chicken Manure and Inoculant + Biochar (BC Treatment)Chicken Manure and Inoculant+ Treated Biochar (TBC Treatment)
Value% ChangeValue% ChangeValue% Change
Total chemical oxygen demand (g L−1) 3.71 ± 0.19−70.43.6 ± 0.25−71.42.98 ± 0.3−76.2
Soluble chemical oxygen demand (g L−1) 2.18 ± 0.11−71.92.1 ± 0.11−72.91.77 ± 0.11−77.0
Electrical conductivity
(mS cm−1)
32.0 ± 1.73+24.126.2 ± 0.95+1.5531.4 ± 1.75+21.7
Salinity (%) 15 ± 0.87+32.412.4 ± 0.53+9.415.6 ± 0.53+37.6
pH 8.31 ± 0.01N/A8.30 ± 0.05N/A8.41 ± 0.08N/A
Values, excluding the % change, are given in mean of triplicates while the error bars represent standard deviation (SD) of the mean. N/A: non-applicable.
Table 4. Surface and physicochemical analyses of BC and TBC.
Analytical MethodCharacteristics/UnitsBCTBC
pH7.938.47
X-Ray photoelectron spectroscopySurface composition (%)C80.3874.10
O18.9020.79
N0.712.90
Na0.002.21
Carbon bonding (%)C-C/C-H31.9540.22
C-O44.4927.9
C-OOH3.945.98
Nitrogen bonding (%)Pyrrolic N0.711.34
Nitrate (NO3)0.001.56
Cation exchange capacitymeq/100 g1731
X-ray fluorescenceMetal oxide composition (%)Na2O0.003.09
CaO10.912.59
MgO0.180.07
Al2O30.160.04
SiO20.620.25
Fe2O30.590.34
K2O1.930.31
Table 5. Functional groups identified from Fourier Transformed Infrared (FTIR) spectra of biochar (BC) and treated biochar (TBC).
Waveband (cm−1)Functional Groups
3500–3250-OH groups in oximes
2834–3100 -OH groups in carboxylic acids
1670–1543-NH2 groups
1543–1470-NH, NO2 groups
1470–1290COOH stretching
1400–1440 -OH groups
1290–1160C-O-C (esters) bond
1200–1000C-OH group in alcohols
1043–922C-C aliphatic bond
Publisher’s Note: MDPI stays neutral with regard to jurisdictional claims in published maps and institutional affiliations.

