
Investigating the Relationship between Fire Severity and Post-Fire Vegetation Regeneration and Subsequent Fire Vulnerability

School of Science, Technology and Engineering and Centre for Bioinnovation, University of the Sunshine Coast, Maroochydore, QLD 4558, Australia
*
Author to whom correspondence should be addressed.
Forests 2023, 14(2), 222; https://doi.org/10.3390/f14020222
Submission received: 12 January 2023
/
Accepted: 19 January 2023
/
Published: 24 January 2023
(This article belongs to the Special Issue Post-fire Regeneration in a Changing Climate)
Abstract
:The Australian 2019–2020 wildfires impacted the subtropical rainforest with a variety of burn severities, making them vulnerable to another burn. Rainforest post-fire regenerated vegetation could be highly flammable, containing fire-promoting species such as Lantana camara and fire-suppressing species such as Phytolacca octandra. This study investigated whether early post-fire regeneration may make rainforests more flammable and if this varies with fire severity. This study sampled three national parks where rainforest burnt in 2019–2020 across different fire severities to test if there were consistent patterns in post-fire regeneration flammability. We found that flammable species increased in the regions where fire severity was higher.
1. Introduction
Extreme temperatures, increased fire frequencies, and prolonged fire seasons are expected to continue as a result of climate change [1]. Fire is an ecological disturbance that can shape the structure of a community and ecosystem processes globally [2,3,4,5]. For over 60,000 years, fire has been used as a tool to manipulate flora and fauna by Indigenous Australians [3,4,6]. Vegetation types that have more dry flammable characteristics, such as sclerophyll forests and eucalypt forests, contain species that will promote future flammability [7]. Historically, rainforests have been less flammable due to their high moisture content and categorised as fire-sensitive [8,9,10,11]. However, extreme droughts have increased the frequency of fires in rainforests [12,13,14]. Thus, it is important to explore traits that could increase the flammability of rainforests because less is known compared to fire-prone ecosystems [15].
Flammability is defined as the ability of a material to ignite, combust, and sustain fire [16,17,18,19]. Flammability can be increased by fuel availability in an ecosystem [19,20,21]. Plant species exhibit different flammable traits based on their leaf morphology, bark and wood structure; and are classified as fire-promoting (woody) or fire-suppressing (herbaceous) [17,18,19,20,21,22]. In areas of secondary succession, sites can be dominated by highly flammable shrubs [23]. These areas are at risk of human ignitions and entering high-frequency fire cycles that arrest succession [23]. In wet rainforest, dense canopies block out sunlight, creating a dark and humid atmosphere for rainforest seedlings [24]. Dry leaf litter, which can be caused by the opening of the canopy, creates a more combustible material for rainforest fires. Thus, flammable characteristics of species in fire-sensitive ecosystems are an important area of research.
The impact of fire on the diversity, structure, and composition of an ecosystem can be attributed to the frequency and intensity of a fire event [25]. Murphy et al. [26] suggested that changes in one aspect of the fire regime can cause a collapse in the entire ecosystem. Altered fire regimes now impact more than 60% of the world’s terrestrial habitats, and approximately 20% of these habitats are listed as fire-sensitive [27]. Evidence suggests human interference is increasing the risk of fire events in rainforests [28,29]. However, due to the scarcity of fires in rainforests, there are gaps in the available data regarding their natural fire regime [18].
The Australian 2019–2020 wildfires spread across approximately 8 million hectares of South-eastern Australia, affecting mostly woodland and eucalypt forests [30,31]. In addition to these flammable vegetation types, large areas of subtropical rainforests in Southeast Queensland and New South Wales were impacted by wildfires [32,33]. These unprecedented, sometimes high-intensity burns were considered abnormal to contemporary Australian fire history [7]. The 2019–2020 fires provide an opportunity, nationally and globally, to determine whether extreme fires are changing structural patterns in rainforests [32,34].
Rainforests that burn at a high intensity are thought to result from a combination of high horizontal and vertical fuel connectivity, extreme drought, and low relative humidity [35,36]. High-intensity burns have been shown to impact mature rainforest canopy species [37,38]. Maintaining a closed canopy is one of the most important aspects to restore wet rainforests [24]. However, small canopy openings enable the establishment of pioneer species [39]. Under normal environmental conditions, trees regrow to form mature canopies within these openings [39]. However, Cheal [40] suggests that frequent fires in the future will impact seed establishment. The varying impacts regarding the effects of fire severity on tree canopy recovery and native regeneration have been reported [32,41,42]. Thus, it is important to focus on regeneration post-fire and the potential flammability for future rainforest fire events.
Human-induced disturbances such as repetitive burning, shifting cultivation, and land clearing, can alter the composition of vegetative fuels, increasing rainforest flammability [28,43]. This was evident in the Amazon rainforest, where human-induced degradation resulted in extensive subsequent burns; and, according to Bonal et al. [44], disturbance has led to the diminishing of rainforest trees and vegetation cover, creating higher risk of flammable conditions in the understorey. Fire events may add to ongoing disturbance impacting rainforests and play a major role in the establishment of invasive species under open canopies [45,46]. The subsequent effect on rainforest fires needs to be further explored because some of these invasive species contain either fire-promoting or fire-supressing qualities [46].
Blossey and Notzold [47] observed that during post-disturbance regeneration, weeds tend to out-compete native species for access to space, water, sunlight, and nutrients. Early successional weeds such as Lantana camara, have been identified to colonise sites with propagules, as post-disturbed conditions become less suitable to native species [48,49,50]. Post-fire domination by Lantana camara can be problematic in rainforests due to its thicket-forming and woody characteristics [51,52]. According to [53] Berry et al., these characteristics make an ecosystem more flammable due to their low moisture content and high fuel load. Additionally, invasive grasses that occupy disturbed rainforests contribute to increased flammability under drier conditions [54,55]. However, the flammability of regenerating plant communities is not clearly known [56].
Flammability may also be modified by fire-supressing species such as Phytolacca octandra (inkweed), which grows in disturbed areas at a very high density [57,58]. Its fire-suppressing benefits are likely attributed to its moist and succulent characteristics [58]. While there are gaps in the literature concerning the overall benefit of non-flammable weeds to rainforests, there is more information on how fires impact rainforest species due to their thinner bark and slower regeneration period [59]. Species that rely on regeneration from seed require longer fire-free periods to establish and out-compete invasive understory species [40].
Narsey et al. [60] identified climate change-related fires as a key threat for the broader Gondwana World Heritage Area rainforests, including those within Lamington and Main Range National Parks in Queensland, Australia. This area experienced prolonged fires for several months, resulting in significant areas of burnt subtropical rainforests [33,61]. Thorley et al. [33] studied the extent and severity of the 2019 wildfires across subtropical rainforest types in several Protected Areas, providing a basis for further monitoring and study. These enable estimates of fire severity rather than fire intensity. This study uses a combination of field data from study sites, remote sensing derived from burned area products, and a number of spatial layers in geographical information systems (GIS) to gain an understanding of recent burnt areas within Southeast Queensland rainforests while building on previous studies [33,62].
Spatial parameters related to disturbances and topographic spatial layers (i.e., roads, water bodies, elevation, slope, and their distances to a specific area) were related to fire-prone vegetation maps for field analysis [62,63]. Spatial data and pre/post-burn remote sensing images can contribute to a better understanding of the risks associated with wildfire, particularly weed abundance in areas that have experienced prolonged durations between burns [62]. After the 2019–2020 fires, research gaps regarding species’ fire response and post-fire population perseverance have impacted management solutions for Australian vegetation in an increasingly pyrrhic world.
This study aims to identify whether early post-fire regeneration (1.5 years after burn) will make the regenerating rainforest more flammable and hence vulnerable to a second burn, and whether this varies depending on the fire severity. Specifically, this study asks the following questions:
- How has fire of different severity impacted the structure of rainforests 1.5 years after burn, particularly the percentage coverage of each strata?
- Is the regeneration different depending on fire severity?
- Has the flammability of regenerating vegetation increased in relation to fire intensity and the openness of the canopy, and could this make the site more flammable or less flammable to a second fire?
- Did rainforest burn with higher severity in previously disturbed locations?
2. Materials and Methods
2.1. Study Area
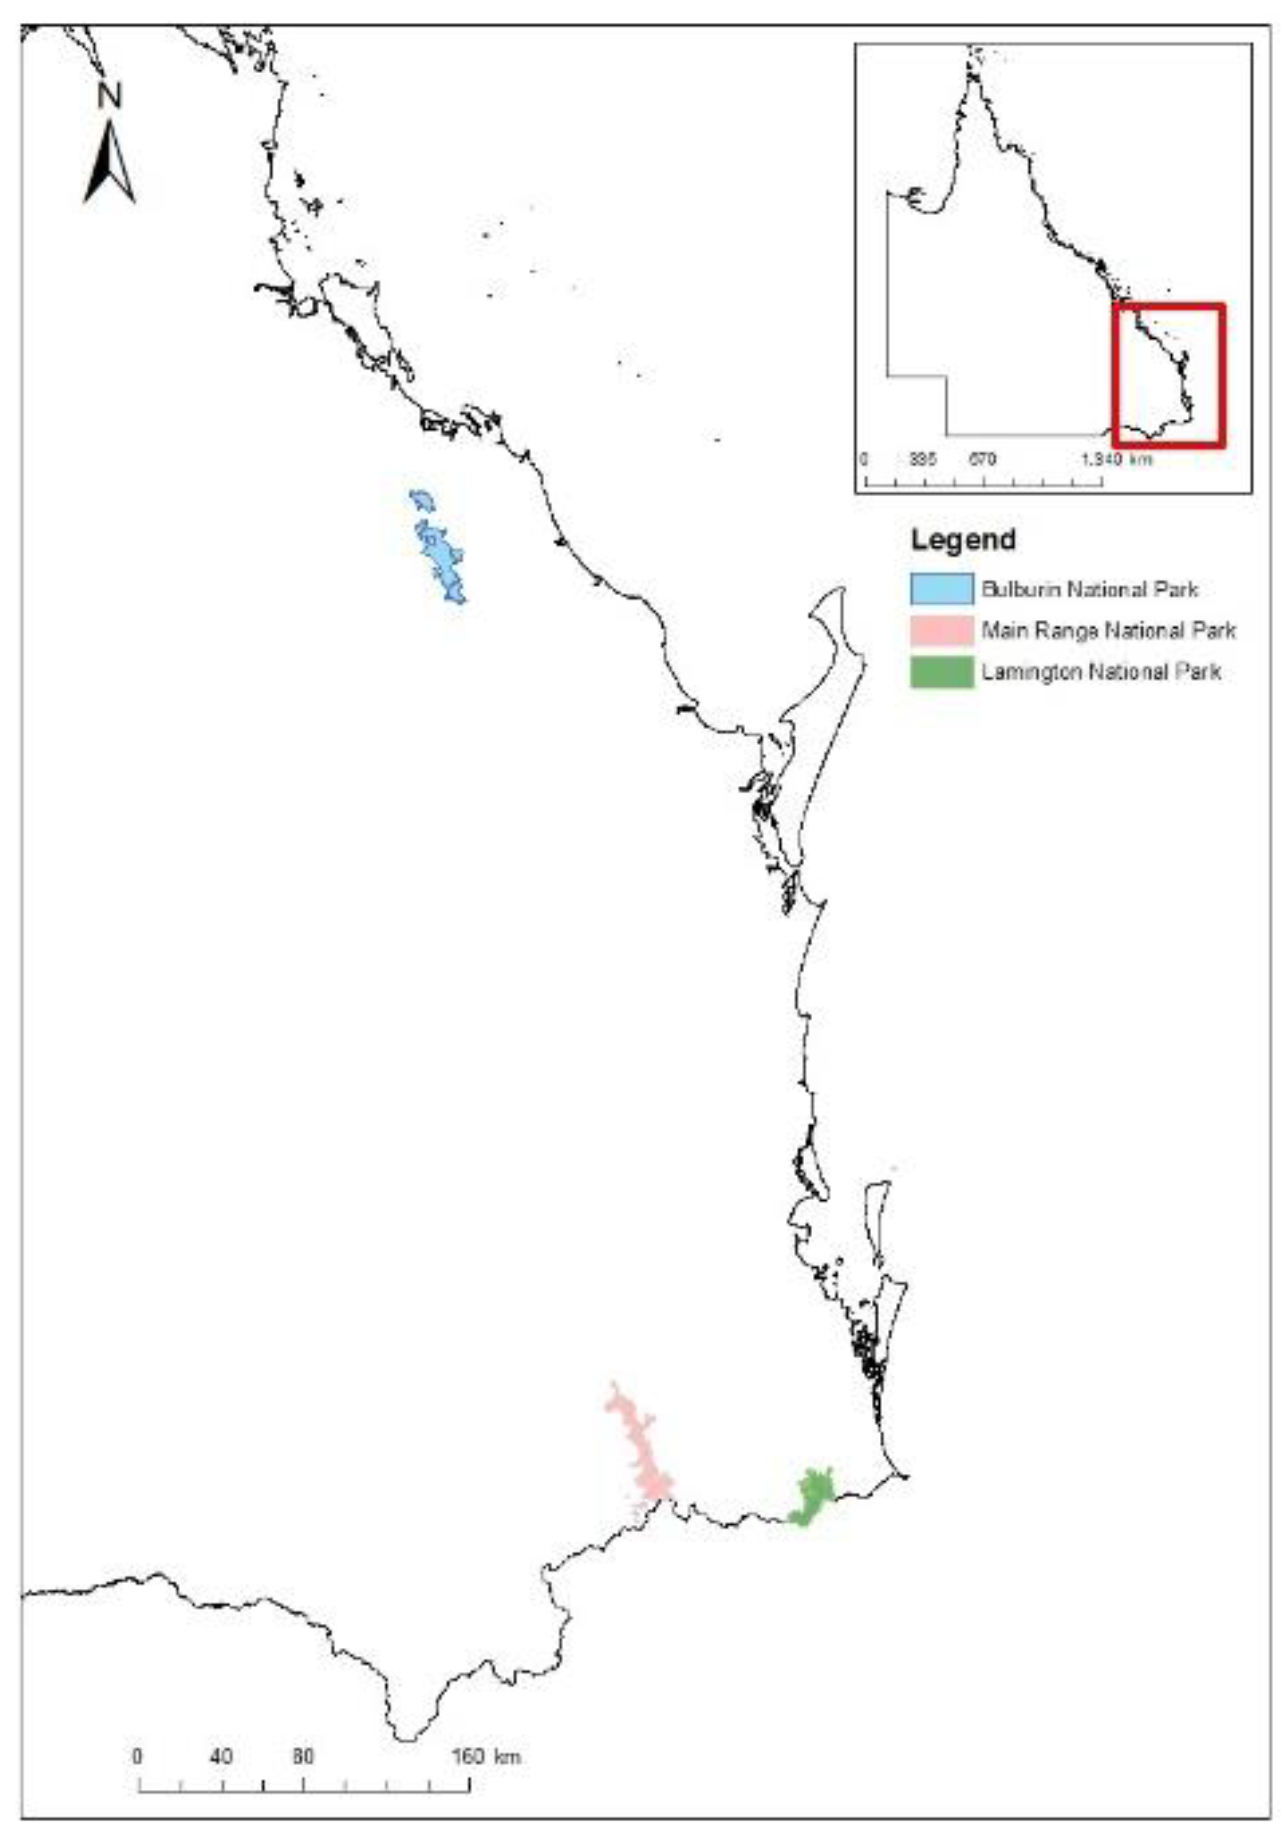
Rainforest recovery approximately 1.5 years post the 2019–2020 fires was examined across three National Parks (NP); Bulburin NP, Main Range NP, and Lamington NP (Figure 1). These locations were identified by previous studies as high priority areas for their extensive range of rainforest burnt in the 2019–2020 wildfires [31,33].
2.2. Experimental Design
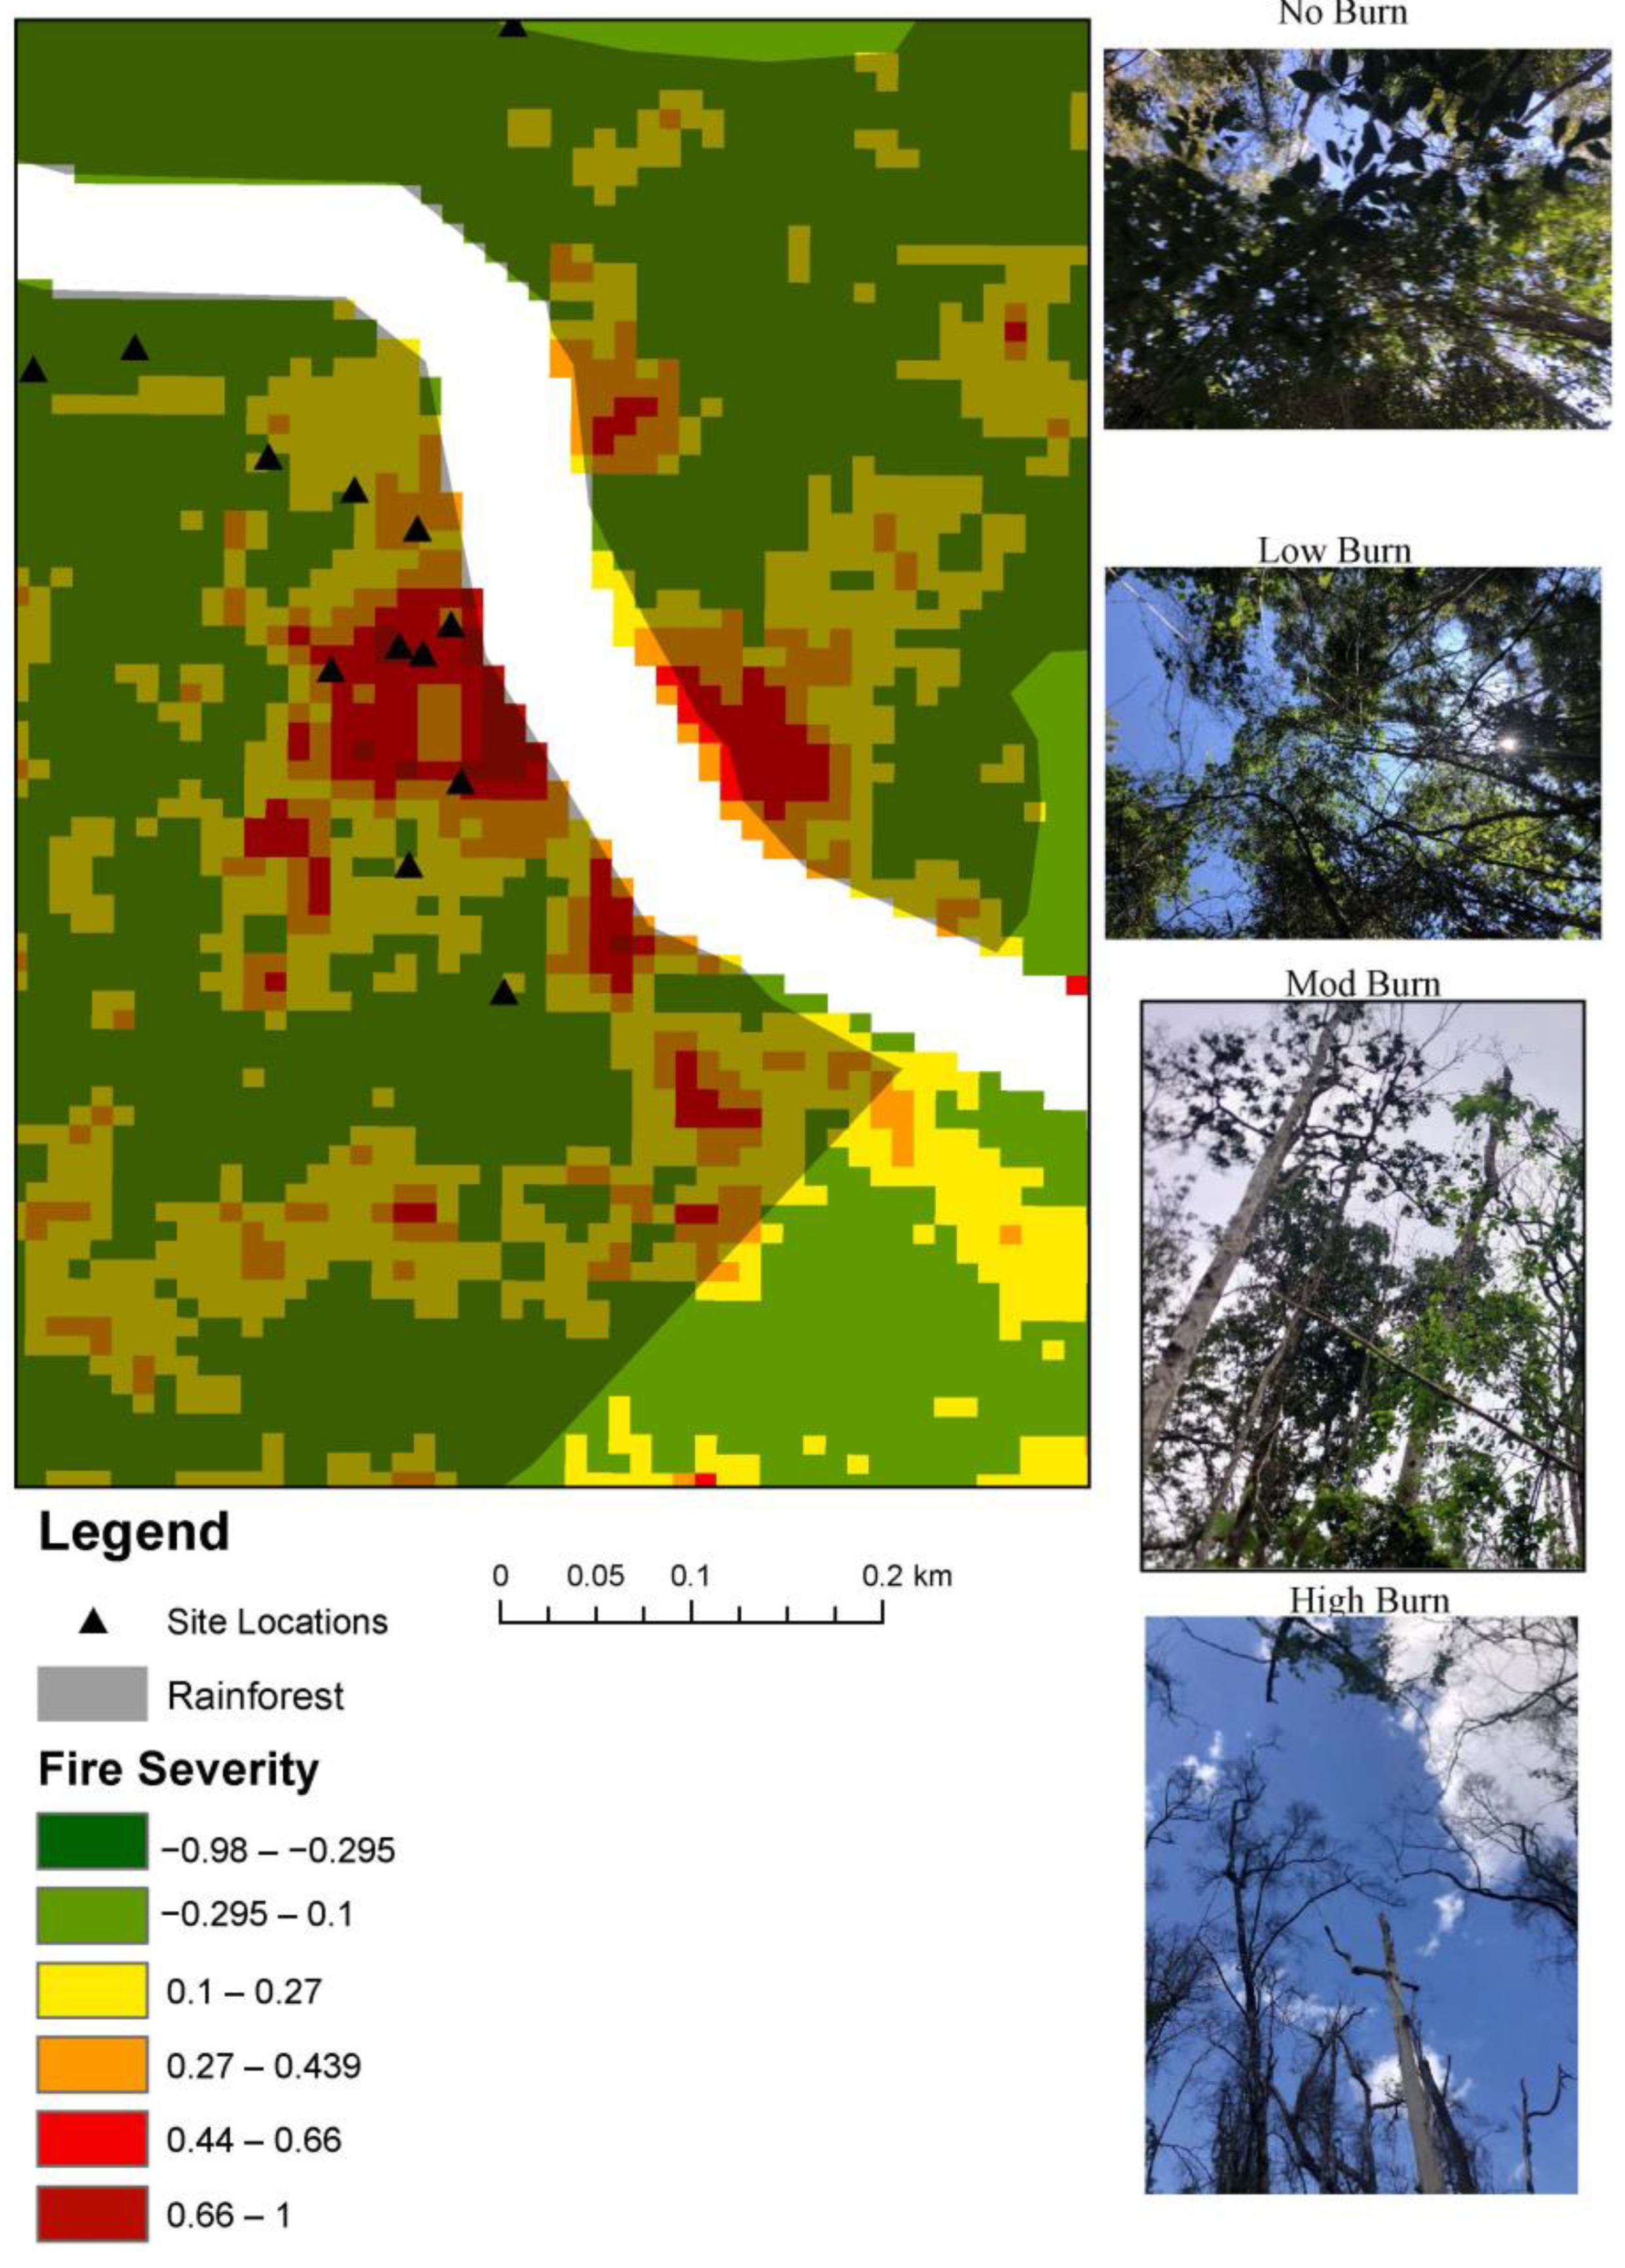
The study was designed to capture the variation of post-fire regeneration at differing fire severities, within sites and between locations. This involved replicating the data collection across three National Parks (Figure 1) at 5–10 sites per National Park in each of the following four burn severities; 1 = No burn (NB), 2 = Low severity (LS), 3 = Moderate severity (MS), 4 = High severity (HS). A total of 90 study sites across three National Parks were surveyed in total. Previously developed fire-severity mapping and fire-severity categories [33] were used in this study to determine sampling locations (Figure 2) (QLD Herbarium 2018). The categories were classified as the following: 1. No burn (0–0.1), 2. Low severity (0.1–0.269), 3. Moderate severity (0.27–0.439), 4. High severity (0.66–0.440), and extreme severity (>0.66) consistent with [33] Thorley et al. (2022). For an even sample size across the categories, the extreme burn sites were not included in the data collection due to their inaccessibility and limited amount These were determined using a zonal operation to acquire the mean and maximum differenced normalised burn ratio (dNBR) values derived from pre- and post-burn Sentinel-2 images [33,64,65].
2.3. Remote Sensing and GIS Data
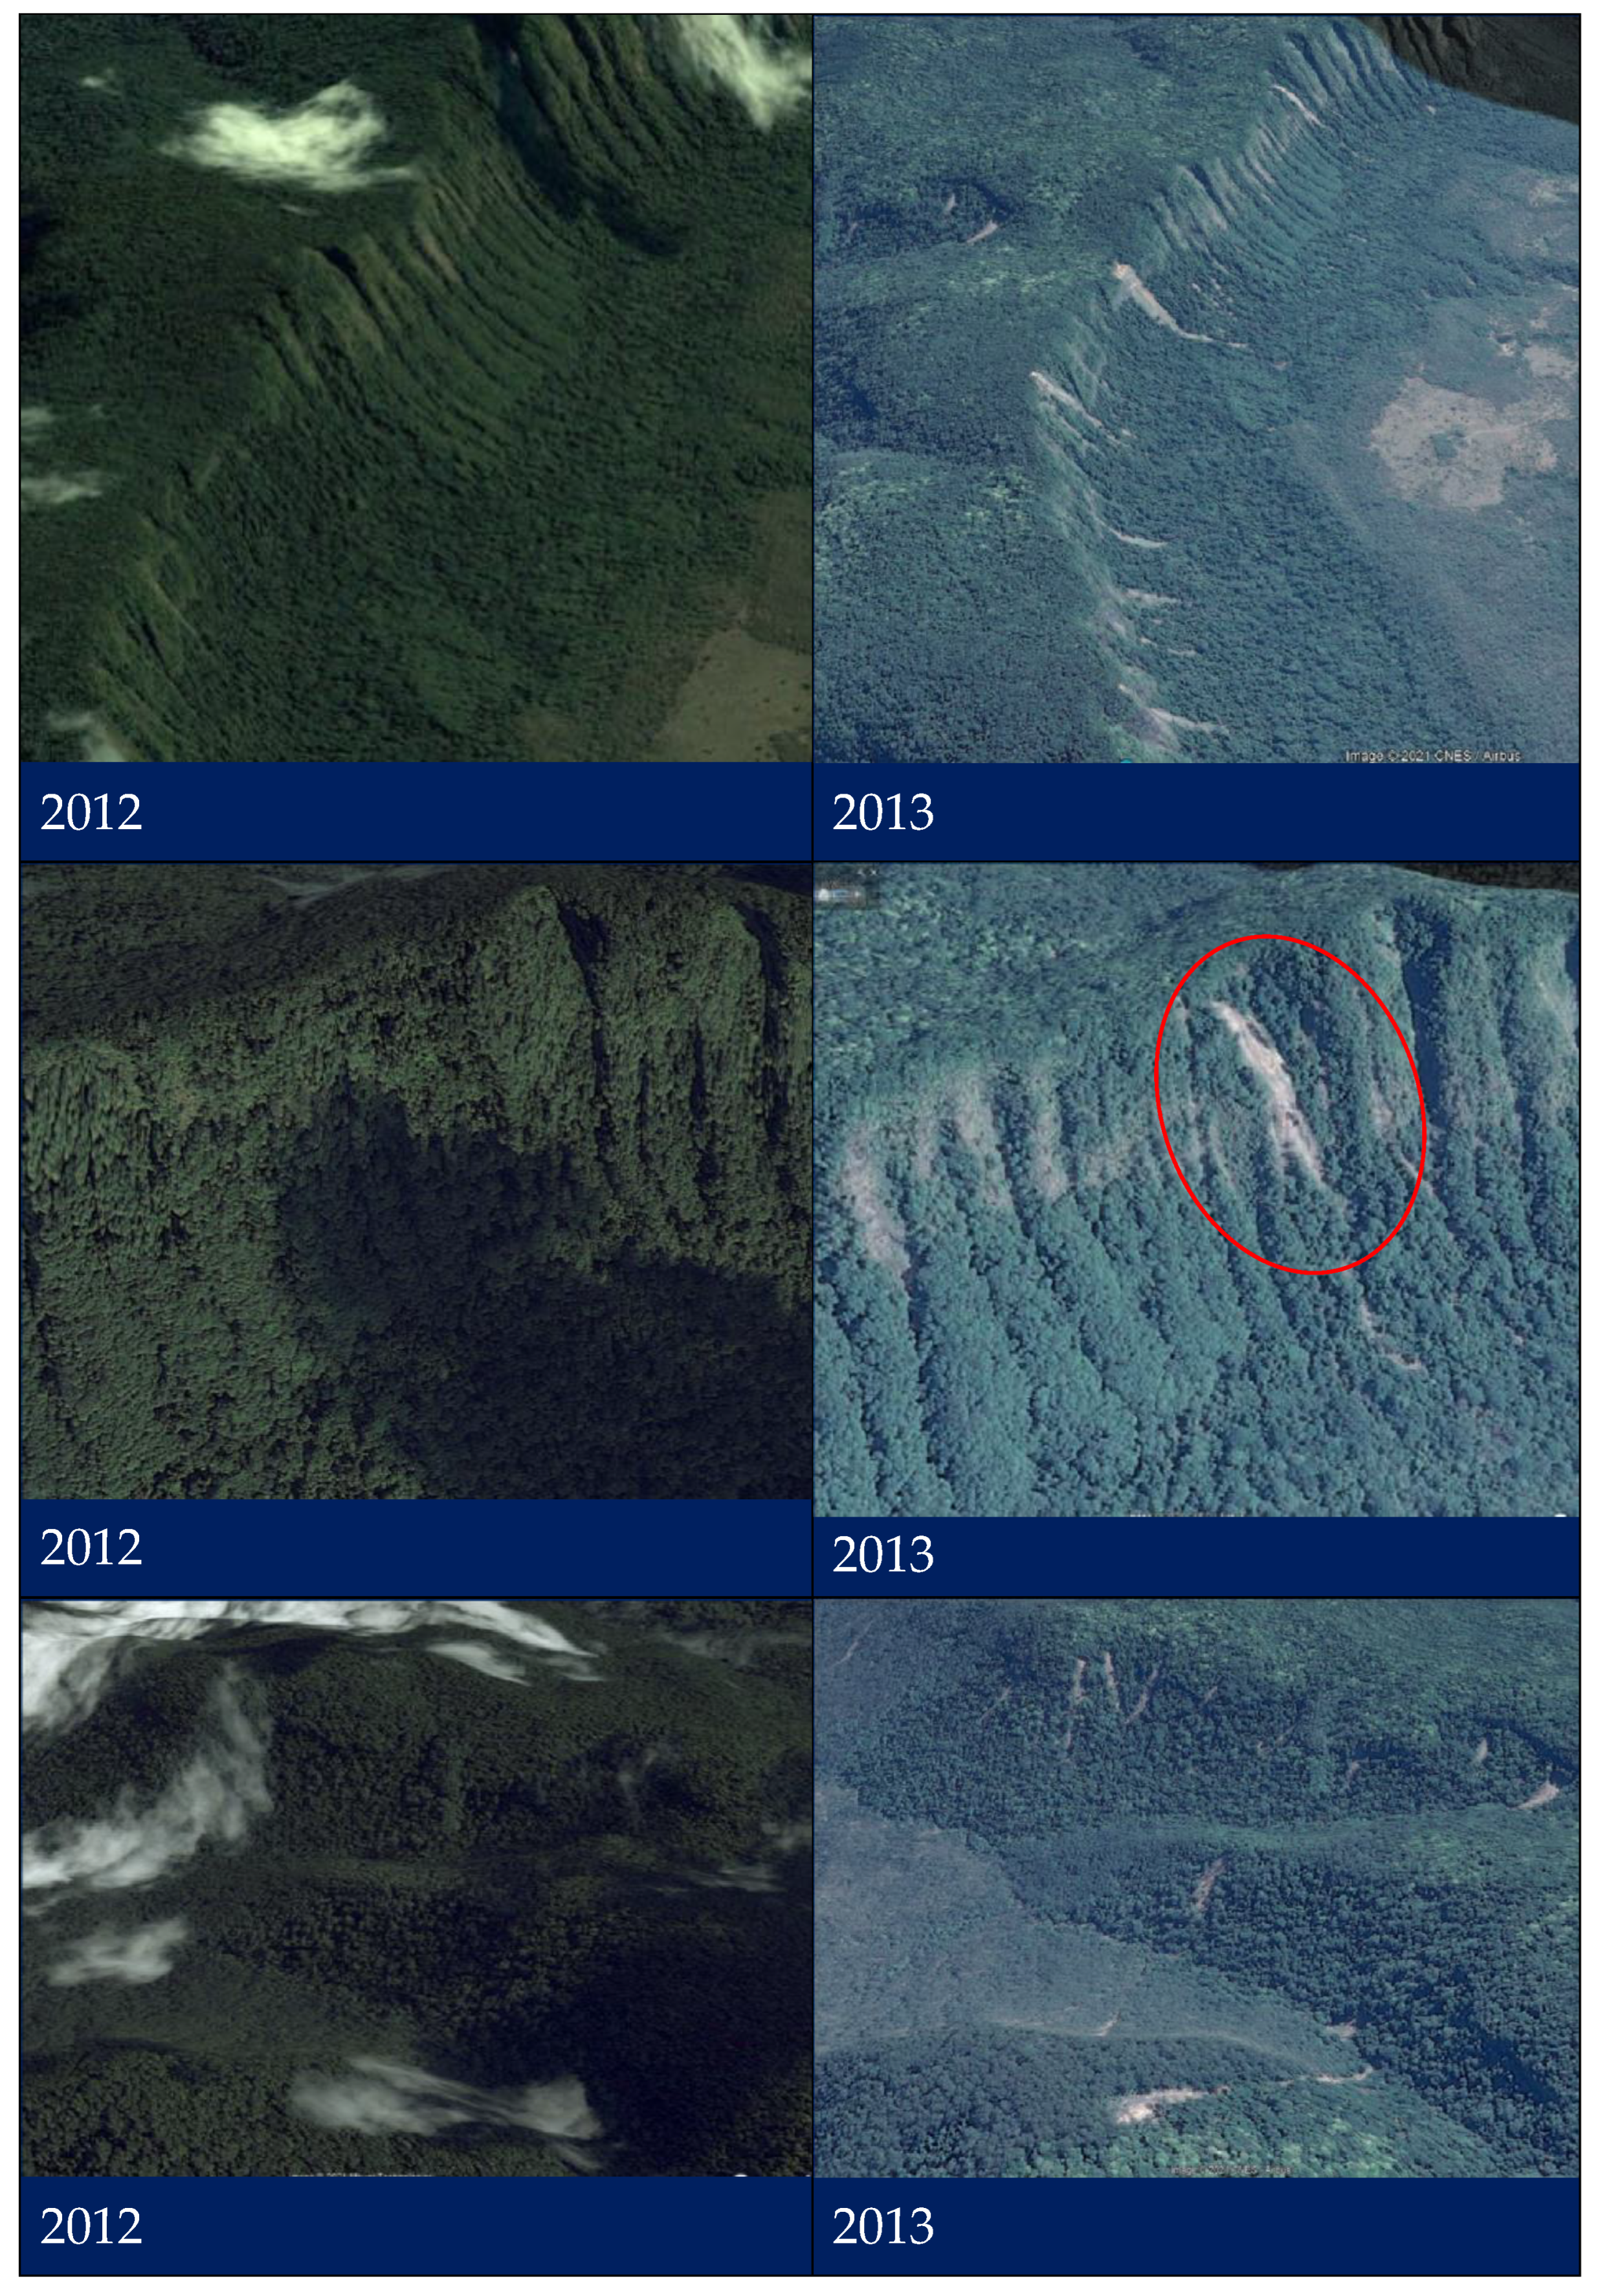
The differenced normalised burn ratio (dNBR) has been found to differentiate between burn severity classes [66]. Sentinel 2 images were used in an earlier study [33] to derive pre- and post-burn normalised burn ratio (NBR) that were used to calculate differenced NBR (dNBR) following standard methods [66]. The dNBR data was further classified into different fire severity classes that were used in this study. Archived image data such as chronological Google Earth images were used as a primary resource in visually identifying historic evidence of disturbance activity, such as walking tracks, landslips, logging tracks, fire breaks, and clearings (Figure 3). Additionally, recognising remnant vegetation cover and regrowth patches over recent satellite imagery in post-disturbed sites was a primary indicator of early successional weed hotspots [67,68]. For further geographical analysis, GIS layers of clearings from 2012, acquired from the Queensland spatial catalogue, were applied to fire-severity mapping to identify cleared areas (Figure S1). Approximately 50–70 locations for each of the NPs were selected on Google Earth to identify a range of disturbed areas. The aim was to identify a range of historical disturbance points; however, with restrictions in digitising old forestry mapping, this limited the potential to acquire more points.
2.4. Field Data Collection: Fire Severity
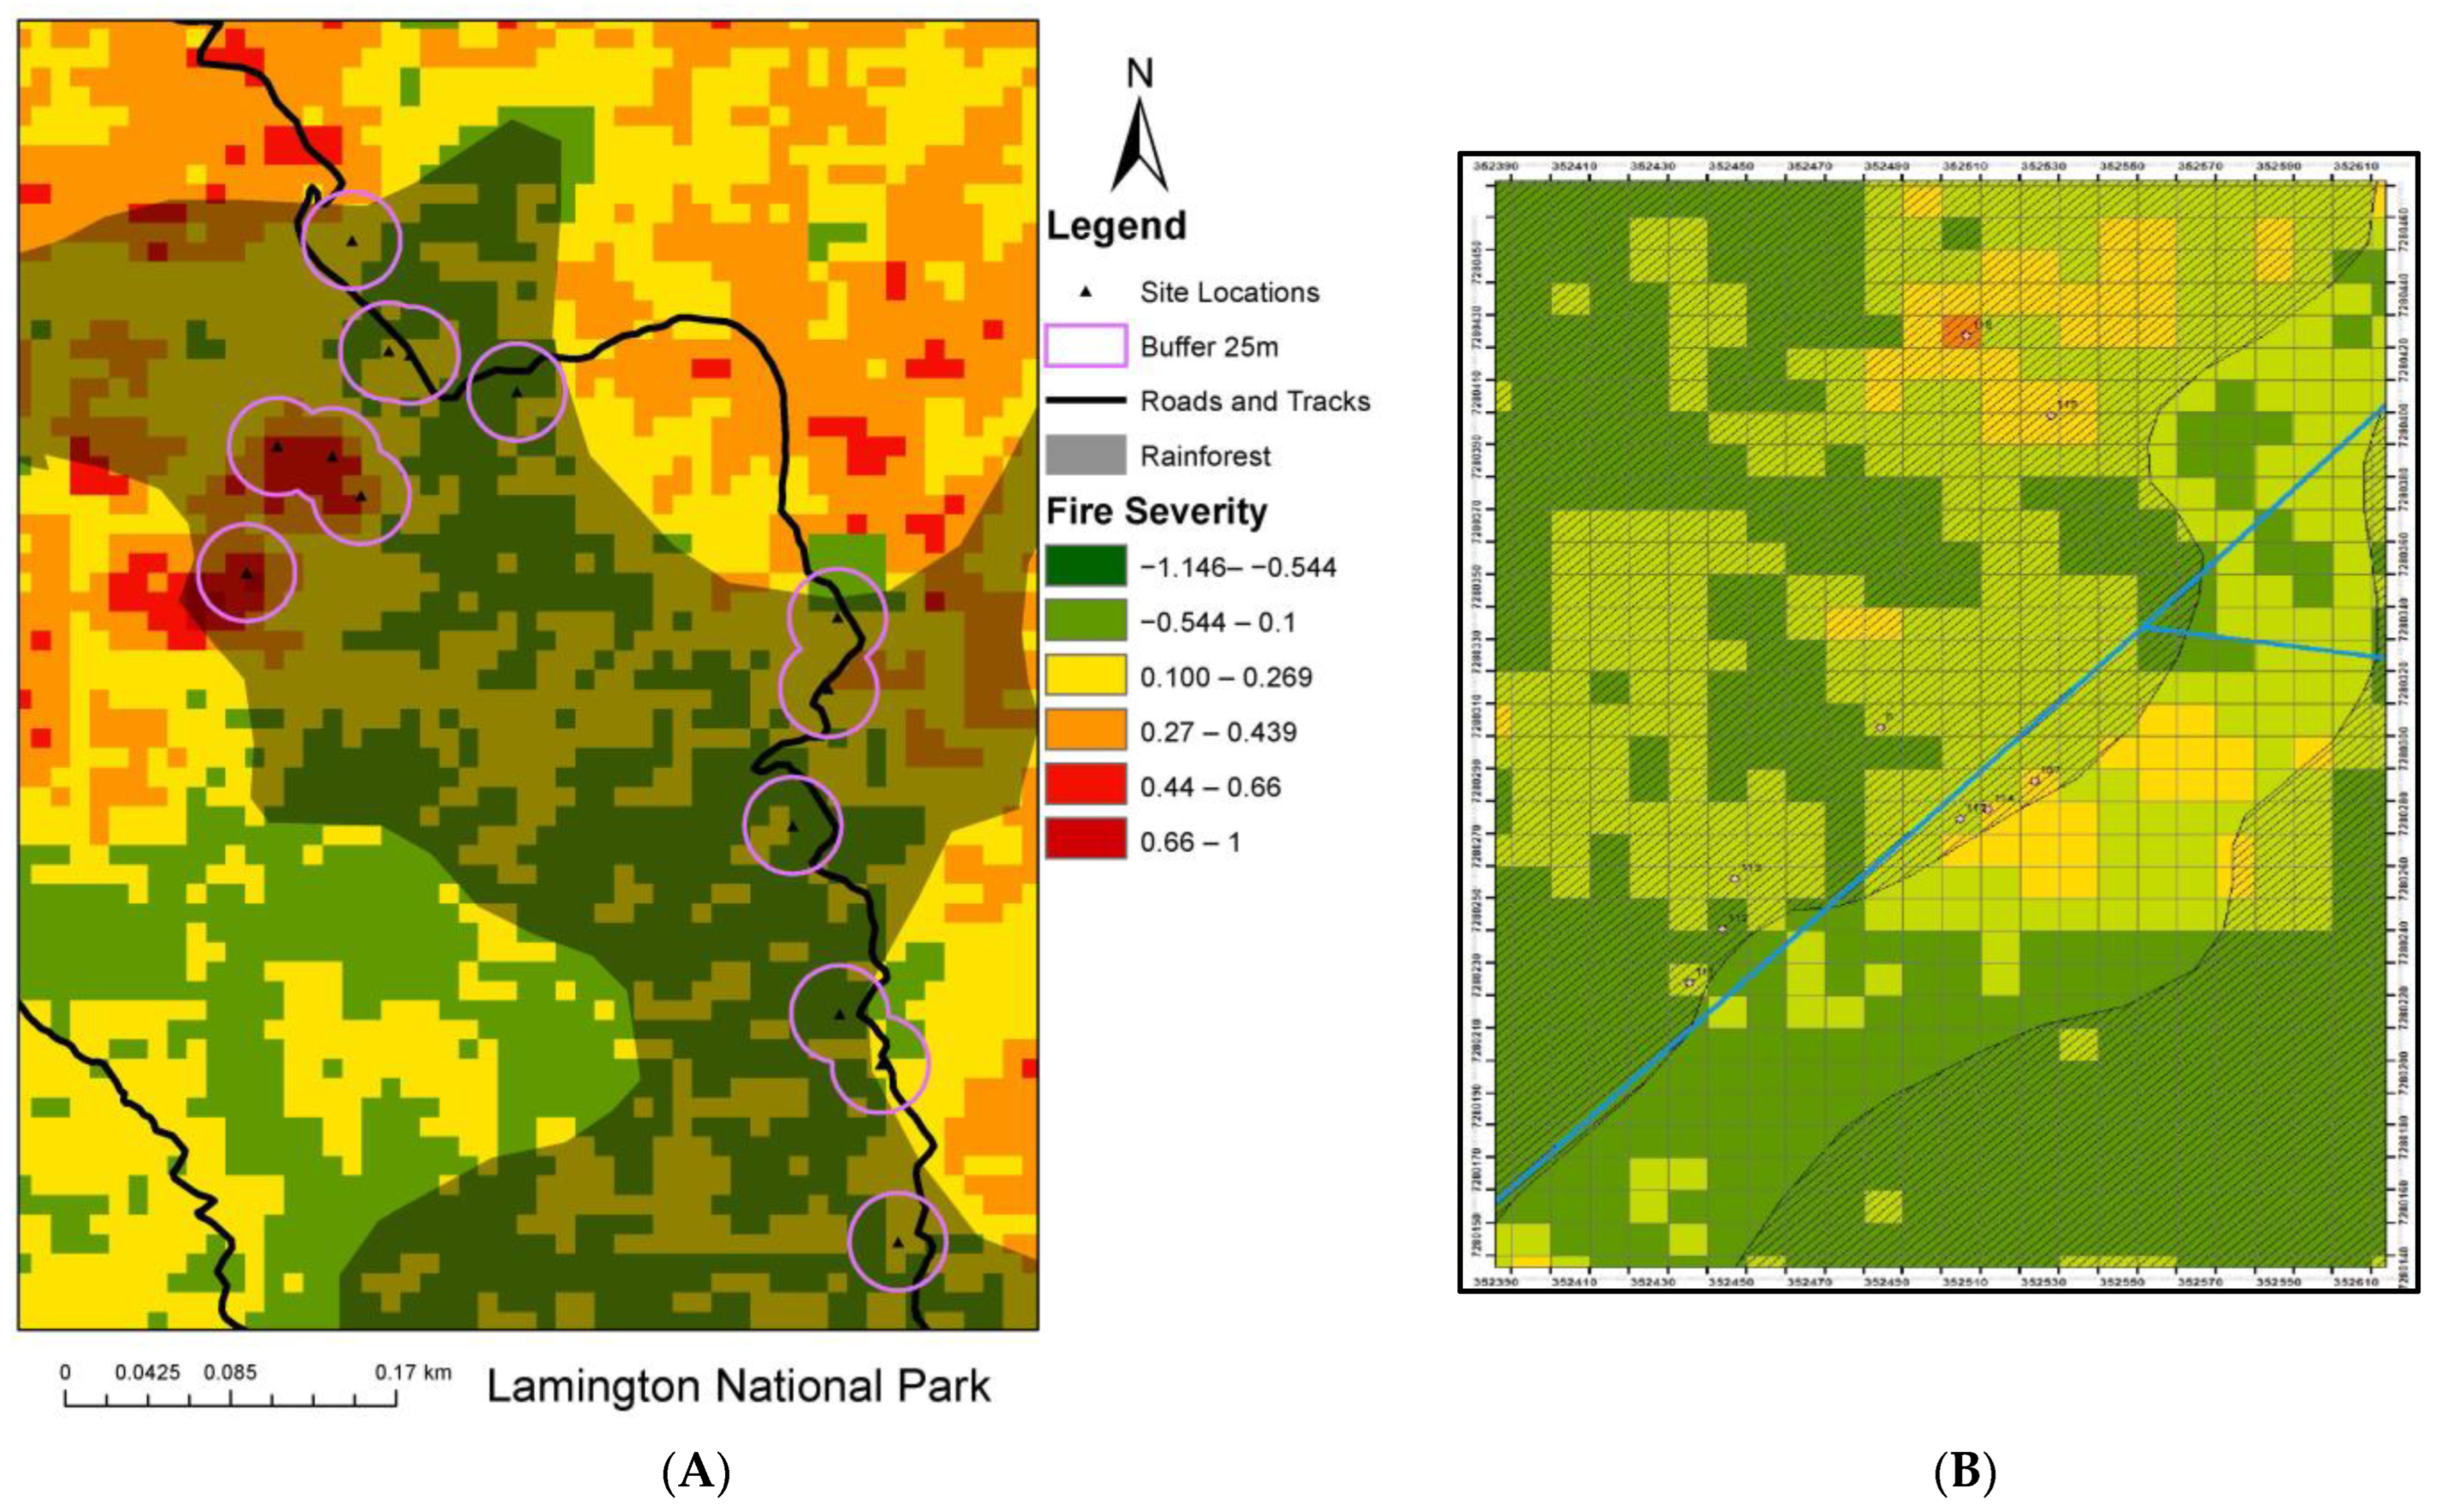
For Bulburin and Main Range NPs, field data on fire severity were collected during September/October 2020 for the study by [33] Thorely et al. using the geometrically structured composite burn index (GeoCBI). During the field trip for this study in September/October 2021, we reused previously surveyed sites [33] to build on this data, and new locations were created wherever earlier sites could not be located/accessed. The new sites were randomly selected within the fire severity categories required to complete the sampling replication across fire severities using the fire severity mapping for these locations and constrained by field site accessibility. For Lamington NP, there were no predetermined sites; therefore, the following methods were used for site selection. First, rainforest areas were identified (polygons); then, a buffer of 25 m was created around roads and track data [67] to ensure accessibility of preselected sampling sites as a number of preselected field sites were inaccessible (i.e., steep terrains, dense regrowth of vines and stinger trees). Random locations were created using ArcGIS software in the rainforest areas intersecting with road/track buffer to ensure sites would be accessible. Finally, the dNBR values were extracted for each random location and thereafter, random locations belonging to each burn severity category were selected.
All locations were converted into X and Y coordinates of the UTM Zone 56S coordinate system with GDA1994 datum to enable easier navigation in the field. These locations were converted to GPX file format using ArcGIS Pro software and were subsequently uploaded to the GPS receiver (Garmin GPSMAP 64×; Garmin Australasia, Eastern Creek, NSW, Australia). For this study, Sentinel 2 image-derived burn products with a spatial resolution of 10 m were used. This image resolution matched with the error level of the GPS receiver used for this study (Figure 4).
Data were collected in 10 × 10 m plots, consistent with standardised field mapping techniques for testing fire severity and vegetation cover, and for relating field data to Sentinel 2 image-derived burned area products [33,69,70]. With plots larger than 10 × 10 m, there is greater risk of crossing over to different fire-severity categories. Two key methods were used to achieve the desired replication of sample sites per fire severity category. The first was to relocate previously ground-truthed sites, the second was by locating and identifying new sites as described above. Both of these techniques involved applying fire-severity mapping within the field and prior to visiting the field.
2.5. Field Data Collection: Vegetation
At each 10 × 10 m plot, the vegetation structural attributes were documented using the following strata height definitions; canopy (>10 m) % cover (C); sub-canopy (5–10 m) % cover (SC); (>1–5 m) shrub layer (SL) % cover; (<1 m) herb layer (HL) % cover; and substrate (S) % cover, to be consistent with the previous studies [33,71]. All stratum layers utilised a vegetation structure field guide to determine repeatable measures of percentage cover [72]. Measurements for sub-canopy and canopy cover were gathered individually using a densitometer to score approximately 30 points obstructed by the canopy, with additionally a vegetation structure field guide to determine the approximate percentage cover of the overstorey [68,71]. This process was crucial for rainforest data to give an accurate measure of the level of impact the fire severity had on the varying stratum layers and understorey patterns [72,73]. Finally, the substrate was determined by the absence of coverage identified as the bare soil exposure [68,71].
2.6. Vegetation Flammability
All variables were grouped into specific measures based on their potential flammability and their abundance in each stratum there they occur was documented. Those that were considered to contain potentially higher flammability attributes were categorised by their woody, dry-like material, and these specific variables were documented as follows: Grasses (G) measured as percent cover, Lantana camara (L.): abundance was measured by approximate plant count; then, for some analyses classified into the following abundance classes where 1 = 1–10; 2 = 11–25; 3 = 26–50; 4 = 51–75; 5 = 76+ plants. The presence of old Lantana camara towers were also considered part of site observations for the mid-strata. Woody vines (WV) and woody clumps (WVC) were measured by counting the number of towers/clumps present in the overstory (Figure S1). Woody-vine clumps (WVC) abundance: to save time in the field, these were recorded using the following classification groupings: 1 = 1; 2 = 2–3; 3 = 4–5; 4 = 6+ clumps. Woody vines (WV) were classified by the number of towers, where; 0 no woody vines; 1 = few vines not forming towers; 2 = 1; 3 = 2–3; 4 = 4–5; 5 = 6 + towers.
Alternatively, succulent and fleshy leaves were considered as indicators of potentially lower flammability, and the specific variables we documented were as follows; Phytolacca octandra (Inkweed, I) and fleshy monocots (FM); these were measured as percent cover in each of the herb and shrub layer strata, and then the Braun Blanquet cover classes were used for creating the flammability index. Due to the variation among plots, the presence and abundance of rainforest species seedlings (SE) were determined by an average seedling count per square meter within the plot and classified according to five abundance classes to save time and error in the field as follows. 1 = <10; 2 = 11–50; 3 = 51–100; 4 = 101–500; 5 = 500+ seedlings. Resprouting plants abundance (R) was classified as 0 for absent, 1 for present, and 2 for abundant. Non-woody vines (NWV) were classified as 0 = absent; 1 = few fines present not forming towers; 2 = present (1–5 towers), and 3 = abundant (6–10 towers). Ferns (F) were classified as 0 = absent; 1 = present; 2 = abundant but were considered variable regarding flammability, as many factors including the species type and condition of the environment need to be considered before categorising into fire-supressing or fire-promoting.
A flammability index was then created for both the more flammable and less flammable vegetation. Each index was created from the sum of the individual variable scores (classes 1–5) given above for each site and compared with fire severity. The flammable index included previously described variables of Lantana camara, woody vines, dry vine clumps, and disturbance (F index = L + WV + WVC + D). The non-flammable vegetation index included ferns, seedlings, resprouting, and non-woody vines (NFindex = F + SE + R + NWV). These were used in some analyses.
2.7. Disturbance Mapping
Disturbance (D) was documented in each plot and generally at each site location site for each National Park and classified as follows: according to presence of 1 = branches, 2 = logs, 3 = trees, 4 = landslip (Figure S2). If sites had multiple variables existing, the largest level of disturbance was listed. Additionally, general site data also recorded evidence of old tracks, past clearing, and other disturbance factors observed.
2.8. Data Analysis
Vegetation strata (canopy C (>10 m), sub-canopy SC (5–10 m), shrub layer SL (1–5 m), herb layer HL (<1 m), and seedlings S were tested to see if there were significant differences among fire-severity classes (no burn NB, low burn LB, medium severity MS, high severity HS using a one-way ANOVA, as this data was suitable for parametric analysis in SPSS [74] (IBM 2017), within each National Park and across combined park data. The post hoc tests on the ANOVA outputs were used to identify at what level the structure was most impacted by fire severity and if any significant differences existed among the structural layers. A non parametric Spearman’s rank correlation was then undertaken in (SPSS) to see if correlations existed between dNBR raster values and all non-categorical data (HL, SL, SC, C, I, G, FM). To avoid a type 2 error, the Bonferroni correction was applied to determine significance where needed.
Furthermore, a nonparametric Kruskal Wallis test, undertaken in SPSS [73] (IBM 2017), was used to test if there were significant differences in the categorial understorey regrowth measures that potentially increased flammability (L, WV, WVC, D) or potentially decreased flammability (SE, F, R, NWV) between different fire-severity classes. Canopy cover was assessed against specific understorey variables (G, I, F, L, NWV), using Spearman’s rank correlation to determine whether decreasing canopies had a further impact on regrowth patterns undertaken in SPSS. Using Fishers z-tests performed in Excel, fire severity values were tested against disturbance points. This was to assess whether fire severity was hotter where there was previous disturbance (non-random), or if disturbance points were identified across all fire-severity categories (random). The overall aim was to understand if the disturbed rainforests consistently have a higher fire-severity or if the events of the 2019–20 fires were a random irregular occurrence.
3. Results
Across the National Parks, increasing burns impacted various levels of the rainforest structure. The percentage cover in the sub-canopy (SC) and canopy (C) were significantly negatively correlated with fire-severity (dNBR) values (rho = −0.747, p < 0.05: rho = −0.640, p < 0.05, respectively: Figure 2; Table 1). The percentage cover for the sub-canopy and canopy were significantly lower in the moderate- (MS) and high-severity (HS) burn sites, compared with no burn and low burn sites for the pooled National Parks data (F = 16.345, p < 0.05: F = 41.425, p < 0.05, respectively: Figure 5, Table 1). Additionally, the consistently low percentage cover in the upper stratum documented in moderate- and high-severity fires remains absent at least 1.5 years post-fire (Table 1). While increasing fire severity (dNBR) did not strongly affect shrub layer percentage cover (rho = 0.254, p = 0.016: Table 2), the percentage cover of the shrub layer was significantly less in no burn sites (mean 19%), compared with moderate burn categories in all three pooled National Parks (F = 3.531, p = 0.018: Table 1). Thus, suggesting that moderate-severity burns have possible benefits for the growth of certain understorey species.
Overall, across the three National Parks, the herb layer had a weak but significant correlation with fire severity (dNBR), showing a minor increase in percentage cover since the fires (rho = 0.326, p < 0.05: Table 2). However, no significant differences were identified between the fire-severity categories for the herb layer percentage cover overall (p > 0.05). Notably, the herb layer at Lamington NP had a significantly higher percentage cover in the high burn sites (88% cover) compared with the low burn sites (53% cover) (F = 5.547, p = 0.004: Table 1). Furthermore, Lamington NP also showed a significant positive correlation, indicating the percentage cover for the herb layer increased with increasing fire-severity (dNBR) values (rho = 0.612, p < 0.05: Table 2).
Finally, no differences were identified for the substrate in the pooled National Parks data (p > 0.05). However, the substrate was the only significant strata when looking at the overall difference between the National Parks (F = 8.107, p < 0.001) (Table 1). Furthermore, Main Range NP had the most bare soil (substrate), and the lowest herb layer (56%) at the high burn sites (22%) (Table 1). This suggests that lower understorey layers at Main Range NP were the most affected by high burns in comparison with the other parks.
The composite index for fire-promoting species showed significant positive correlations with increasing fire severity (dNBR) for the pooled National Parks (rho = 0.490, p < 0.05: Table 2). Thus, suggesting that during post-fire recovery, higher-severity fires have led to greater abundance of fire=promoting species (Table 2).
Overall Lantana camara abundance increased with decreasing canopy cover present across the National Parks (rho = −0.369, p = 0.003: Table 2). Among the fire-promoting variables in the National Parks, Lantana camara was significantly more abundant in the high-severity (HS) burn sites (H = 22.17, p < 0.05: Table 3). Bulburin NP had the highest Lantana camara abundance across the three National Parks (Table 3). No correlations or significant differences (p > 0.05) were identified at Main Range, where there was minimal evidence of Lantana camara present (Table 3).
With regards to other factors that might increase flammability (grasses G, woody vines WV woody clumps WVC and disturbance D), no other significant differences (p > 0.05) were identified among the pooled National Parks (Table 3). A reduced canopy showed a weak negative correlation (p < 0.005) with increased grasses (G) abundance at Bulburin NP (rho = −0.313, p = 0.003; Table 2). Significant differences were identified for woody vines (WV) abundance and disturbance (D) between the three national parks (H = 11.52, p = 0.003, H = 23.45, p < 0.05, respectively: Table 3). There were higher abundance of both woody vines (WV) and disturbance (D) present at Lamington and Bulburin NP compared with Main range NP (Table 3).
Among the fire-supressing growth types overall for the pooled National Parks, there were significantly fewer seedlings (H = 23.79, p < 0.05: Table 4) and reduced fern abundance (H = 14.84, p = 0.002: Table 4) in the high-severity (HS) burn sites compared with unburnt (NB) sites. The abundance of seedlings and ferns decreased as the fires grew hotter (dNBR) (rho = −0.518, p < 0.05; rho = −0.369, p < 0.05, respectively: Table 2). There was a significant positive correlation between the canopy cover and seedlings abundance in the understorey (rho = 0.434, p < 0.05; Table 2). This suggests higher seedling recovery post-fire in the less burnt rainforest, where the canopy was intact. No other differences could be identified in the fire-suppressing growth types (Inkweed, fleshy monocots, resprouts) in the pooled National Park data (p < 0.05).
The composite index for fire-supressing species was significantly negatively correlated with increasing fire severity (dNBR) at Main Range NP (rho = −0.660, p < 0.05: Table 2) and Bulburin NP (rho = −0.412, p = 0.021: Table 2). This indicates that increasing fire severity impacted the regrowth of fire-suppressing plants at these parks. Bulburin and Lamington NP did not have high Inkweed presence. The Main Range NP recorded a significantly higher percentage of Phytolacca octandra (Inkweed) at the high severity (HS) burn sites compared with other burn severities (H = 8.982, p = 0.030: Table 4). Phytolacca octandra (Inkweed) abundance was significantly positively correlated with increasing fire severity (dnBR) (rho = 0.596, p < 0.05: Table 2). This suggests that Phytolacca octandra (Inkweed) grows with increased levels of light, as it was more abundant in higher burn sites. Of the 60 disturbance points identified at Bulburin NP, all were located in unburnt rainforest (Figure 5). Of the 22 disturbance points identified at Lamington NP, only 10 were found in burnt rainforest (Figure 5). Finally, of the 70 disturbed sites located in Main Range, 38 were identified in burnt areas, with approximately 20 located in severely burnt rainforest (Figure 6). Notably, disturbed sites appeared to follow a line of high-severity burns, where approximately 6 points were located in severely burnt non-rainforest vegetation, adjacent to burnt rainforest in Main Range (Figure 6). Extremely severe fires in non-rainforest were identified crossing into the adjacent rainforest vegetation (Figure 6). The z-test results were non-significant for Main Range and Lamington NP (p < 0.05). This indicates that for disturbed sites in rainforest, the dNBR values were random across all fire-severity categories.
4. Discussion
There is increasing global evidence suggesting that catastrophic climatic events such as prolonged drought and extensive fires are pushing terrestrial networks into sudden ecosystem change [31,75]. Additionally, anthropogenic changes have altered fire regimes where ecosystems with higher moisture content are burning at a greater frequency and severity than ever historically recorded [13]. Despite the high moisture and humidity, extensive areas of rainforests were burnt in the 2019–2020 fires [32,33]. The differing fire severity burns identified in burnt rainforest ecosystems can be attributed to the flammability of vegetation [31]. Overall, the findings of our study identified significant structural impacts in the protected rainforest estate in SEQ 1.5 years after the 2019–2020 fires. Furthermore, it is important to note that although the effects of these fires were extensive, they burnt to a lower intensity in comparison with seasonally dry or temperate forests [29,33].
4.1. Vegetation Structure and Fire Severity
Various studies have identified that high-severity fires within rainforest and woodland communities cause extensive tree mortality and foliage loss of the canopy [14,76,77]. Due to the timeline of the study 1.5 years after the 2019–2020 wildfires, minimal structural regeneration was expected in the rainforest, at high-severity sites. According to Collin et al. [14], 44% percent of the fire-affected areas in the 2019–2020 wildfires were high severity. The results for our study identified that the sites which had experienced high-severity fires still experienced significant reduction in rainforest sub-canopy and canopy cover 1.5 years post-burn. Our results indicate notable implications for rainforest species in a future with shortening fire intervals at increasing intensity [78].
Low-severity burns have been identified by previous studies to cause considerably lower impacts on rainforests, as they do not exceed the threshold for the survival of canopy species [42,79]. Most of the 2019–2020 fires in rainforests in these National Parks burnt at a lower severity [33]. It was expected that low-severity fires would impact the lower stratum layers in our study. According to Lowman [80], light that penetrates through the canopy maintains the understorey vegetation and can determine the level of suppression or the vitality of its growth. Baker et al. [32] found significant increases in lower strata density due to resprouting and seeding emergence post-fire. Our results showed that the herb layer density was significantly variable among fire-severity classes and was weakly but significantly positively correlated with increasing burn severity since the 2019–2020 fires, with a significantly higher cover at the high severity burn sites compared to low severity burn sites in Lamington NP 1.5 years post-burn.
4.2. The Effect of Canopy Cover and Fire Severity on Fire-Promoting Regrowth
Burnt ecosystems are predicted to be likely to receive competition from non-native flammable vegetation [13]. A study by Duggin and Gentle [81] found that invasion of weed species developed when the overstorey was burnt by high-intensity wildfires Lantana camara has successfully dominated various ecosystems, particularly those that have been affected by wildfire [51,52]. Many studies have identified that fire can encourage the invasion of Lantana camara just as the presence of Lantana camara can further encourage fire [81,82]. It was expected that Lantana camara would be present at various burnt sites within the study locations, but its abundance varied among the three National Parks with little recorded at Main Range National Park. However, Lantana camara was present in Bulburin and Lamington NP, 1.5 years post-fire and its abundance significantly increased with increasing burn severity and lower canopy cover despite some post-fire weeding at Lamington NP. While Lantana camara may therefore pose a problem post-fire, Debuse and Lewis [83] demonstrated that subsequent fires may in fact control its ongoing regeneration.
Our results found a growing presence of fire-promoting species as fire severity increased. High-fire severity can limit the diversity of native rainforest species due to their inability to regenerate after post-fire, subsequently increasing the presence of fire-promoting grasses [84]. Douglas et al. [85] found burning had significant effects on the composition and structure of riparian vegetation despite the position along the stream, with higher severity fires impacting the extent of tree basal areas, vines, and canopy cover, and these areas had increasing grass cover. The burnt sites in Bulburin NP, situated in a riparian area with multiple braided river flats, displayed significant correlations for increasing fire-promoting species and fire severity. Furthermore, Bulburin was the only National Park with grasses present and corresponding tree fall disturbance. According to McDonald [86], the invasion of grasses is assisted by trees that have fallen onto the ground surface.
4.3. The Effect of Canopy Cover and Fire Severity on Fire-Suppressing Regrowth
It is predicted that the diminishment of native and succulent species that normally reside in rainforests may cause higher flammability [13,87,88]. Phytolacca octandra (Inkweed) is an invasive species but was identified as containing high levels of moisture due to its succulent nature [58]. Our results showed the presence of Phytolacca octandra (Inkweed) in Main Range National Park was associated with areas of direct sunlight and a more open canopy in areas of high-severity burns, suggesting its presence could reduce potential flammability in some severely burnt sites. Rainforest seedlings were identified growing beneath and through Phytolacca octandra (Inkweed), which appeared to facilitate their growth, creating further growth of potentially fire-supressing rainforest species [87,88].
Cury et al. [89] proposed that rainforest seedlings might not resprout under open canopies; due to the seed source being killed, or the foliage loss of rainforest canopies destroy the soil stored seed bank by drying the surface. A study by Thusithana et al. [90] found that seed germination of evergreen rainforest species varied after prolonged seasonal drought. The desiccation-sensitive seeds had low oil content and high seed moisture (low flammability), where the desiccation-tolerant had high oil content and low seed moisture (high flammability) [90]. Hill and Reed [91], found rainforest species were regenerating to their naturally occurring vegetation structure, post low-severity fires. More recently, Baker et al. [32] found considerable subtropical and temperate rainforest seedlings germination post the 2019–2020 fires. Our study found seedlings were decreasing in abundance as burn severity increased and canopy cover declined 1.5 years post-fire. Godfree et al. [31] suggest that species unable to survive fire depend on dispersal of propagules from unburnt sites.
It is expected that climatic drought conditions will continue to affect seed germination and flammability of resprouting rainforest species in the future [92]. Basal resprouters, which make up 91% of all rainforest species, are thought to be more vulnerable to the effects of high-severity fires [77]. On the other hand, aerial resprouters, which consist of 5% of rainforest species, have been found to be more resilient to hotter burns and experience lower mortality post-fire [77]. Baker et al. [32] found that approximately 60% of species resprouted post-fire from a wide range of size ranges and fire intensities. Our study also showed that at 1.5 years after the fires, resprouting regrowth was identified in all burn severities. Overall, our composite index of fire-supressing indicators at Main Range and Bulburin National Park showed decreasing abundance under more open canopies, as the fire severity increased.
4.4. Effect of Disturbance
Rainforest undergoing secondary succession post-disturbance sites can be dominated by highly flammable shrubs and are thought to be at higher risk of ignitions [23]. Abedi Gheshlaghi et al. [93] modelled landscape-level fire susceptibility and included distance to roads and clearings as predictive factors. A study by Collins and Gibson [94] examined how mapping of remotely sensed fire severity can indicate the potential spatial extent of ecological impacts of fires in Queensland ecosystems. Additionally, Godfree et al. [31] developed historical fire hotspot data in Australia, and identified that 200 major fires burnt through 10.4 million hectares in Southeastern Australia in the 2019–2020 fire season. We found that fire severity was randomly associated with local and medium-scale disturbance.
Rainforests that are adjacent to regularly burnt ecosystems are expected to be at higher threat from wildfires [95]. Thorley et al. [33] found that SE Qld rainforests that burnt were significantly more likely to be adjacent to flammable schlerophyllous vegetation types. Incursions of fire into cooler, moist, upland rainforests are causing greater concerns for the future of fire-sensitive subtropical rainforests [95]. Our results showed Main Range experienced fires that spotted from sclerophyll forest over a steep ridge. Flammable weeds can also be found occupying these elevated areas [96]. During the fire season in summer, wildfires can surge up hillslopes burning through the edge of the rainforest [30].
4.5. Implications of Future Flammability for Rainforest
A study by Prestes et al. [97] showed a decline in over 50% of plant populations in the frequently burnt sites, within the Amazonian rainforest. Their results showed that the structure and basal area of plants were consequently affected by fire frequency. Additionally, studies have highlighted that shorter intervals between fires threaten the recovery of ecosystems in the future [37,78]. Altered fire regimes can be attributed to more frequent fires, which impact the juvenile and resprouting plants and their ability to withstand subsequent fires [98]. A study by Cary [99] found that fuels were estimated to be unchanged and the intervals between fires were projected to shorten by 2070. Thus, our results highlight that rainforest native species may not tolerate increased flammable conditions, as higher-severity burns lead to an increasing presence of fire-promoting regrowth and a decline in rainforest seedling presence. However, low-intensity burns had little significant negative impacts on rainforest seedling regeneration and structure after this short-time period.
5. Conclusions
We found that high-severity fires caused significant structural impacts in the Southeast Queensland rainforest estate, 1.5 years after the 2019–2020 wildfires. This creates great concern for native species and regeneration due to the subsequent growth of fire-promoting species under more open canopies. Despite this study’s preliminary hypothesis, Lantana camara was not as prevalent in disturbed rainforest as expected. Nevertheless, we identified in some locations, Lantana camara and invasive grasses responding well to the high-severity fires. Furthermore, drier conditions are predicted to increase the flammability of rainforest through shorter fire intervals. However, there is speculation that the fire-supressing benefits of Phytolacca octandra (Inkweed) can limit this risk. However, this requires further investigation and the protection of naturally occurring fire-suppressing seedlings and resprouts should be prioritised. Furthermore, disturbance was not significantly correlated with hotter burns. This provides a positive result for future fire-related disturbances.
Supplementary Materials
The following supporting information can be downloaded at: https://www.mdpi.com/article/10.3390/f14020222/s1; Figure S1. Photographs captured in the field to assist identification of vine presence and abundance and disturbance across all National Parks. Top; The (left) displays few vines considered less than 1 tower, the (middle) shows a cluster of vines grouped into a tower and the (right) shows a clump of vines that were identified both in the canopy and on the ground level. Bottom; The (left) displays branches dispersed on the forest floor, the (middle) shows an example of logs burnt down from a tree, and (right) shows a tree fall identified at most burnt locations. Figure S2. Disturbance map of Main Range NP displaying 2012 clearings data, rainforest polygon, site locations and disturbance points. Figure S3. Fire severity (dNBR) mapping of all Bulburin National Park. Figure S4. Fire severity mapping at Main Range National Park. Figure S5. Fire-severity mapping at Lamington National Park.
Author Contributions
Conceptualisation, A.S.; Methodology, S.K.S., A.S. and T.R.; Writing, T.R., A.S. and S.K.S.; Analysis, T.R. and S.K.S.; Supervision, A.S. and S.K.S.; Investigation, T.R.; Field work, T.R. and A.S.; Data curation, T.R. and S.K.S. All authors have read and agreed to the published version of the manuscript.
Funding
This project was funded by the University of the Sunshine Coast and the Queensland Department of Environment and Science, Bushfire Recovery Program and supported by the Australian Government’s ‘Bushfire recovery package for wildlife and their habitat’.
Data Availability Statement
This study used publically available datasets in combination with project-generated field data. The project data will be stored in the UniSC Research Repository and made available on request or will be made available as open access via the UniSC Research Bank.
Acknowledgments
This study builds on the work by James Thorley who assisted with data and field expertise. We wish to especially thank Bill McDonald, Queensland Herbarium; Will Buch, Harry Hines, Steve Finlayson, Lisa Emmert, Rhonda Melzer, Queensland Parks and Wildlife Service; as well as Gidarjil Development Corporation for their support and assistance.
Conflicts of Interest
The authors declare no conflict of interest.
References
- Masson-Delmotte, V.; Zhai, P.; Pirani, A.; Connors, S.; Péan, C.; Berger, S.; Caud, N.; Chen, Y.; Goldfarb, L.; Gomis, M.; et al. (Eds.) IPCC Summary for Policymakers. In Climate Change 2021: The Physical Science Basis. Contribution of Working Group I to the Sixth Assessment Report of the Intergovernmental Panel on Climate Change; Cambridge University Press: Cambridge, UK; New York, NY, USA, 2021; pp. 3–32. [Google Scholar] [CrossRef]
- Bond, W.J. Large parts of the world are brown or black: A different view on the ‘Green World’ hypothesis. J. Veg. Sci. 2005, 16, 261–266. [Google Scholar] [CrossRef]
- Olsen, P.; Weston, M. Fire and Birds: Fire Management for Biodiversity. Wingspan 2005, 15, 10367810. [Google Scholar]
- Whelan, R.; Kanowski, K.; Gill, M.; Andersen, A. Living in a Land of Fire; Australia State of the Environment Committee Department of Environment and Heritage: Canberra, Australia, 2006.
- Bowman DM, J.S.; Balch, J.K.; Artaxo, P.; Bond, W.J.; Carlson, J.M.; Cochrane, M.A.; D’Antonio, C.M.; DeFries, R.S.; Doyle, J.C.; Harrison, S.P.; et al. Fire in the Earth system. Science 2009, 324, 481–484. [Google Scholar] [CrossRef] [PubMed]
- Pyke, D.; Brooks, M.; D’Antonio, C. Fire as a Restoration Tool: A Decision Framework for Predicting the Control or Enhancement of Plants Using Fire. Restor. Ecol. 2010, 18, 274–284. [Google Scholar] [CrossRef]
- Nolan, R.H.; Boer, M.M.; Collins, L.; Resco de Dios, V.; Clarke, H.; Jenkins, M.; Kenny, B.; Bradstock, R.A. Causes and consequences of eastern Australia’s 2019–2020 season of mega-fires. Glob. Chang. Biol. 2020, 26, 1039–1041. [Google Scholar] [CrossRef] [Green Version]
- Cochrane, M.A. Fire science for rainforests. Nature 2003, 421, 913–919. [Google Scholar] [CrossRef]
- Greenwood, D.; Christophel, D. The origins and Tertiary history of Australian “Tropical” rainforests. In Tropical Rainforests: Past, Present and Future; Bermingham, E., Dick, C.W., Moritz, C., Eds.; University of Chicago Press: Chicago, IL, USA, 2005; pp. 336–373. [Google Scholar]
- Hardesty, J.; Myers, R.; Fulks, W. Fire, ecosystems, and people: A preliminary assessment of fire as a global conservation issue. Georg. Wright Forum 2005, 22, 78–87. [Google Scholar]
- Pivello, V. The Use of Fire in the Cerrado and Amazonian Rainforests of Brazil: Past and Present. Fire Ecol. 2011, 7, 24–39. [Google Scholar] [CrossRef]
- Silva Junior, C.; Anderson, L.; Silva, A.; Almeida, C.; Dalagnol, R.; Pletsch, M.; Penha, T.; Paloschi, R.; Aragão, L. Fire Responses to the 2010 and 2015/2016 Amazonian Droughts. Front. Earth Sci. 2019, 7, 97. [Google Scholar] [CrossRef] [Green Version]
- Halofsky, J.E.; Peterson, D.L.; Harvey, B.J. Changing wildfire, changing forests: The effects of climate change on fire regimes and vegetation in the Pacific Northwest, USA. Fire Ecol. 2020, 16, 4. [Google Scholar] [CrossRef] [Green Version]
- Collins, L.; Bradstock, R.; Clarke, H.; Clarke, M.; Nolan, R.; Penman, T. The 2019/2020 mega-fires exposed Australian ecosystems to an unprecedented extent of high-severity fire. Environ. Res. Lett. 2021, 16, 044029. [Google Scholar] [CrossRef]
- Russell-Smith, J.; Whitehead, P.J.; Cook, G.D.; Hoare, J.L. Response of Eucalyptus-dominated savanna to frequent fires: Lessons from Munmarlary, 1973–1996. Ecol. Mono 2003, 73, 349–375. [Google Scholar] [CrossRef] [Green Version]
- Gill, A.M.; Zylstra, P. Flammability of Australian forests. Aust. For. 2005, 68, 87–93. [Google Scholar] [CrossRef] [Green Version]
- White, R.H.; Zipperer, W.C. Testing and classification of individual plants for fire behaviour: Plant selection for the wildland-urban interface. Int. J. Wildland Fire 2010, 19, 213–227. [Google Scholar] [CrossRef]
- Varner, J.; Kane, J.; Kreye, J.; Engber, E. The Flammability of Forest and Woodland Litter: A Synthesis. Curr. For. Rep. 2015, 1, 91–99. [Google Scholar] [CrossRef]
- Pausas, J.; Keeley, J.; Schwilk, D. Flammability as an ecological and evolutionary driver. J. Ecol. 2016, 105, 289–297. [Google Scholar] [CrossRef]
- Ormeño, E.; Céspedes, B.; Sánchez, I.A.; Velasco-García, A.; Moreno, J.M.; Fernandez, C.; Baldy, V. The relationship between terpenes and flammability of leaf litter. For. Ecol. Manag. 2009, 257, 471–482. [Google Scholar] [CrossRef]
- Tumino, B.J.; Duff, T.J.; Goodger, J.; Cawson, J.G. Plant traits linked to field-scale flammability metrics in prescribed burns in Eucalyptus forest. PLoS ONE 2019, 14, 221–403. [Google Scholar] [CrossRef]
- Gill, A.M.; Bradstock, R.A. A national register for the fire responses of plant species. Cunninghamia 1992, 2, 653–660. [Google Scholar]
- Baeza, M.J.; Valdecantos, A.; Alloza, J.A.; Vallejo, V.R. Human disturbance and environmental factors as drivers of long-term post-fire regeneration patterns in Mediterranean forests. J. Veg. Sci. 2007, 18, 243–252. [Google Scholar] [CrossRef]
- Cochrane, M.A.; Alencar, A.; Schulze, M.D.; Souza, C.M.; Neptstad, D.C.; Lefebvre, P.; Davidson, E.A. Positive feedbacks in the fire dynamic of closed canopy tropical forests. Science 1999, 284, 1832–1835. [Google Scholar] [CrossRef] [PubMed]
- Xaud, H.A.M.; Martins, F.; Dos Santos, J.R. Tropical forest degradation by mega-fires in the northern Brazilian Amazon. For. Ecol. Manag. 2013, 294, 97–106. [Google Scholar] [CrossRef]
- Murphy, B.; Bradstock, R.; Boer, M.; Carter, J.; Cary, G.; Cochrane, M.; Fensham, R.; Russell-Smith, J.; Williamson, G.; Bowman, D. Fire regimes of Australia: A pyrogeographic model system. J. Biogeogr. 2013, 40, 1048–1058. [Google Scholar] [CrossRef]
- Shlisky, A.; Alencar, A.A.C.; Nolasco, M.M.; Curran, L.M. Overview: Global fire regime conditions, threats, and opportunities for fire management in the tropics. In Tropical Fire Ecology; Springer Praxis Books; Springer: Berlin/Heidelberg, Germany, 2009. [Google Scholar] [CrossRef]
- Lewis, S.L.; Edwards, D.P.; Galbraith, D. Increasing human dominance of tropical forests. Science 2015, 349, 827–832. [Google Scholar] [CrossRef]
- Juárez-Orozco, S.; Siebe, C.; Fernández y Fernández, D. Causes and Effects of Forest Fires in Tropical Rainforests: A Bibliometric Approach. Trop. Conserv. Sci. 2017, 10, 1940082917737207. [Google Scholar] [CrossRef]
- Gallagher, R.V.; Allen, S.; Mackenzie, B.D.E.; Yates, C.J.; Gosper, C.R.; Keith, D.A.; Merow, C.; White, M.D.; Wenk, E.; Maitner, B.S.; et al. High fire frequency and the impact of the 2019–2020 megafires on Australian plant diversity. Divers. Distrib. 2021, 27, 1166–1179. [Google Scholar] [CrossRef]
- Godfree, R.C.; Knerr, N.; Encinas-Viso, F.; Albrecht, D.; Bush, D.; Cargill, D.C.; Clements, M.; Gueidan, C.; Guja, L.K.; Harwood, T.; et al. Implications of the 2019–2020 megafires for the biogeography and conservation of Australian vegetation. Nat. Commun. 2021, 12, 1023. [Google Scholar] [CrossRef]
- Baker, A.G.; Catteral, C.; Wiseman, M. Rainforest persistence and recruitment after Australia’s 2019–2020 fires in subtropical, temperate, dry and littoral rainforests. Aust. J. Bot. 2021, 70, 189–203. [Google Scholar] [CrossRef]
- Thorley, J.; Srivastava, S.K.; Shapcott, A. What type of rainforest burnt in the South East Queensland’s 2019/20 bushfires and how might this impact biodiversity. Aust. Ecol. 2023; accepted. [Google Scholar]
- Boer, M.M.; Resco de Dios, V.; Bradstock, R.A. Unprecedented burn area of Australian mega forest fires. Nat. Clim. Chang. 2020, 10, 171–172. [Google Scholar] [CrossRef]
- Bradstock, R.A.; Hammill, K.A.; Collins, L.; Price, O. Effects of weather, fuel and terrain on fire severity in topographically diverse landscapes of south-eastern Australia. Landsc. Ecol. 2010, 25, 607–619. [Google Scholar] [CrossRef]
- Cheney, N.; Gould, J.S.; McCaw, W.L.; Anderson, W.R. Predicting fire behaviour in dry eucalypt forest in southern Australia. For. Ecol. Manag. 2012, 280, 120–131. [Google Scholar] [CrossRef]
- Keith, D.A. Fire-driven extinction of plant populations: A synthesis of theory and review of evidence from Australian vegetation. Proc. Linn. Soc. N. S. W. 1996, 116, 37–78. [Google Scholar]
- Eidenshink, J.; Schwind, B.; Brewer, K.; Zhu, Z.; Quayle, B.; Howard, S. A project for monitoring trends in burn severity. Fire Ecol. 2007, 3, 3–21. [Google Scholar] [CrossRef]
- Poorter, L.; Rose, S.A. Light-dependent changes in the relationship between seed mass and seedling traits: A meta-analysis for rain forest tree species. Oecologia 2005, 142, 378–387. [Google Scholar] [CrossRef]
- Cheal, D. Growth Stages and Tolerable Fire Intervals for Victoria’s Native Vegetation Data Sets: Fire and Adaptive Management; Report No. 84; Department of Sustainability and Environment: East Melbourne, VIC, Australia, 2010.
- Coop, J.D.; Parks, S.A.; McClernan, S.R.; Holsinger, L.M. Influences of prior wildfires on vegetation response to subsequent fire in a reburned southwestern landscape. Ecol. Appl. 2016, 26, 346–354. [Google Scholar] [CrossRef]
- Collins, L. Eucalypt forests dominated by epicormic resprouters are resilient to repeated canopy fires. J. Ecol. 2020, 108, 310–324. [Google Scholar] [CrossRef]
- Cochrane, M.A. Synergistic interactions between habitat fragmentation and fire in evergreen tropical forests. Conserv. Biol. 2001, 15, 1515–1521. [Google Scholar] [CrossRef]
- Bonal, D.; Burban, B.; Stahl, C. The response of tropical rainforests to drought—Lessons from recent research and future prospects. Ann. For. Sci. 2016, 73, 27–44. [Google Scholar] [CrossRef] [Green Version]
- Sousa, W.P. The role of disturbance in natural communities. Ann. Rev. Ecol. Syst. 1984, 15, 353–391. [Google Scholar] [CrossRef]
- Glenn-Lewin, D.C.; Van der Maarel, E. Patterns and processes of vegetation dynamics. In Plant Succession: Theory and Prediction; Glenn-Lewin, D.C., Peet, R.K., Veblen, T.T., Eds.; Chapman and Hall: London, UK, 1992; pp. 11–59. [Google Scholar]
- Blossey, B.; Notzold, R. Evolution of increased competitive ability in invasive nonindigenous plants: A hypothesis. J. Ecol. 1995, 83, 887–889. [Google Scholar] [CrossRef]
- Hobbs, R.J.; Hunneke, L.F. Disturbance, diversity, and invasion: Implications for conservation. Conserv. Biol. 1992, 6, 324–337. [Google Scholar] [CrossRef] [Green Version]
- Cochrane, M.A.; Schulze, M.D. Fire as a recurrent event in tropical forests of the eastern Amazon: Effects on forest structure, biomass, and species composition. Biotropica 1999, 31, 2–16. [Google Scholar] [CrossRef]
- Ross, K.A.; Fox, B.J.; Fox, M.D. Changes to plant species richness in forest fragments: Fragment age, disturbance and fire history may be as important as area. J. Biogeogr. 2002, 29, 749–765. [Google Scholar] [CrossRef]
- Hiremath, A.; Sundaram, B. The fire-lantana cycle hypothesis in Indian forests. Conserv. Soc. 2005, 3, 26–42. [Google Scholar]
- Gooden, B.; French, K.; Turner, P. Invasion and management of a woody plant, Lantana camara L., alters vegetation diversity within wet sclerophyll forest in Southeastern Australia. For. Ecol. Manag. 2009, 257, 960–967. [Google Scholar] [CrossRef] [Green Version]
- Berry, Z.; Wevill, K.; Curran, T. The invasive weed Lantana camara increases fire risk in dry rainforest by altering fuel beds. Weed Res. 2011, 51, 525–533. [Google Scholar] [CrossRef]
- Simpson, K.J.; Ripley, B.S.; Christin, P.A.; Belcher, C.M.; Lehmann, C.E.R.; Thomas, G.H.; Osborne, C.P. Determinants of flammability in savanna grass species. J. Ecol. 2016, 104, 138–148. [Google Scholar] [CrossRef] [Green Version]
- Simpson, K.J.; Jardine, E.C.; Archibald, S.; Forrestel, E.J.; Lehmann, C.E.R.; Thomas, G.H.; Osborne, C.P. Resprouting grasses are associated with less frequent fire than seeders. New Phytol. 2021, 230, 832–844. [Google Scholar] [CrossRef]
- Tierney, D.; Watson, P. Fire and the Vegetation of the Namoi CMA. A Report Prepared by the Hotspots Project; Nature Conservation Council: Sydney, NSW, Australia, 2009. [Google Scholar] [CrossRef]
- Chu, J.K.Y. Weed ID Phytolacca Octandra. 2005. Available online: https://www.iewf.org/weedid/Phytolacca_octandra.htm (accessed on 18 January 2023).
- Kohout, M.; Coupar, P.; Elliot, M. Battling an “aggressive pioneer” after fire: Phytolacca octandra (Inkweed). Australas. Plant Conserv. 2020, 29, 7–8. [Google Scholar]
- Ondei, S.; Prior, L.D.; Vigilante, T.; Bowman, D.M. Post-fire resprouting strategies of rainforest and savanna saplings along the rainforest–savanna boundary in the Australian monsoon tropics. Plant Ecol. 2016, 217, 711–724. [Google Scholar] [CrossRef]
- Narsey, S.; Laidlaw, M.; Colman, R.; Pearce, K.; Hopkins, M.; Dowdy, A. Impact of Climate Change on Cloud Forests in the Gondwana Rainforests of Australia. World Heritage Area; Earth Systems and Climate Change Hub Report No. 20; NESP Earth Systems and Climate Change Hub: Brisbane, QLD, Australia, 2020. [Google Scholar]
- Hines, H.B.; Laidlaw, M.J.; Buch, W.; Olyott, L.; Levy, S.; Melzer, R.; Meiklejohn, A. Post-Fire Assessment Report—Natural Values: 2019 Bushfire, Lamington National Park, South East Queensland Region; Brisbane Department of Environment and Science, Queensland Government: Brisbane, QLD, Australia, 2020.
- Srivastava, S.; Lewis, T.; Behrendorff, L.; Phinn, S. Spatial databases and techniques to assist with prescribed fire management in the south-east Queensland bioregion. Int. J. Wildland Fire 2021, 30, 90. [Google Scholar] [CrossRef]
- Pyne, S.J.; Andrews, P.L.; Laven, R.D. Introduction to Wildland Fire; Wiley: New York, NY, USA, 1996. [Google Scholar]
- Sobrino, J.A.; Llorens, R.; Fernández, C.; Fernández-Alonso, J.M.; Vega, J.A. Relationship between soil burn severity in forest fires measured in situ and through spectral indices of remote detection. Forests 2019, 10, 457. [Google Scholar] [CrossRef] [Green Version]
- Liu, P.; Jia, S.; Han, R.; Liu, Y.; Lu, X.; Zhang, H. RS and GIS Supported Urban LULC and UHI Change Simulation and Assessment. J. Sens. 2020, 2020, 5863164. [Google Scholar] [CrossRef]
- Miller, J.D.; Thode, A.E. Quantifying burn severity in a heterogeneous landscape with a relative version of the delta Normalized Burn Ratio (dNBR). Remote Sens. Environ. 2007, 109, 66–80. [Google Scholar] [CrossRef]
- Queensland Government. Queensland Spatial Catalogue—QSpatial. 2022. Available online: http://qldspatial.information.qld.gov.au/catalogue/ (accessed on 17 November 2022).
- Neldner, V.J.; Wilson, B.A.; Dillewaard, H.A.; Ryan, T.S.; Butler, D.W.; McDonald, W.J.F.; Addicott, E.P.; Appelman, C.N. Methodology for Survey and Mapping of Regional Ecosystems and Vegetation Communities in Queensland; Queensland Herbarium, Science and Technology Division, Department of Environment and Science: Brisbane, QLD, Australia, 2020.
- Lindenmayer, E.; Burns Thurgate, N.; Lowe, A. Biodiversity and Environmental Change; CSIRO Publishing: Melbourne, VIC, Australia, 2014. [Google Scholar]
- Gordon, C.E.; Price, O.F.; Tasker, E.M. Mapping and exploring variation in post-fire vegetation recovery following mixed severity wildfire using airborne LiDAR. Ecol. Appl. 2017, 27, 1618–1632. [Google Scholar] [CrossRef] [Green Version]
- Gillison, A.N. A Field Manual for Rapid Vegetation Survey and Classification for General Purpose; CIFOR and ACIAR Bogor: Jawa Barat, Indonesia, 2001; ISBN 979-8764-62-5. [Google Scholar]
- Hnatiuk, R.J.; Thackway, R.; Walker, J. Vegetation. In Australian Soil and Land Survey Field Handbook, 3rd ed.; The National Committee on Soil and Terrain, Ed.; CSIRO Publishing: Melbourne, VIC, Australia, 2009; pp. 73–126. ISBN 9780643093959. [Google Scholar]
- Korhonen, L.; Korhonen, K.T.; Rautiatinen, M.; Stenberg, P. Estimation of forest canopy cover: A comparison of field measurement techniques. Silva Fenn. 2006, 40, 577–588. [Google Scholar] [CrossRef] [Green Version]
- IBM. IBM SPSS Statistics for Windows, Version 25.0; IBM Corp.: Armonk, NY, USA, 2017. [Google Scholar]
- Davis, K.T.; Dobrowski, S.Z.; Higuera, P.E.; Holden, Z.A.; Veblen, T.T.; Rother, M.T.; Parks, S.A.; Sala, A.; Maneta, M.P. Wildfires and climate change push low-elevation forests across a critical climate threshold for tree regeneration. Proc. Natl. Acad. Sci. USA 2019, 116, 6193–6198. [Google Scholar] [CrossRef] [Green Version]
- Gill, A.M.; Catling, P.C. Fire regimes and biodiversity of forested landscapes of southern Australia. In Flammable Australia: Fire Regimes, Biodiversity and Ecosystems in a Changing World; Bradstock, R.A., Gill, A.M., Williams, R.J., Eds.; CSIRO Publishing: Melbourne, VIC, Australia, 2002; pp. 351–369. [Google Scholar]
- Clarke, P.J.; Lawes, M.J.; Murphy, B.P.; Russell-Smith, J.; Nano, C.E.M.; Bradstock, R.; Enright, N.J.; Fontaine, J.B.; Gosper, C.R.; Radford, I.; et al. A synthesis of postfire recovery traits of woody plants in Australian ecosystems. Sci. Total Environ. 2015, 534, 31–42. [Google Scholar] [CrossRef]
- Gill, A.M.; McCarthy, M.A. Intervals between prescribed fires in Australia: What intrinsic variation should apply? Biol. Conserv. 1998, 85, 161–169. [Google Scholar] [CrossRef]
- Bennett, L.T.; Bruce, M.J.; Machunter, J.; Kohout, M.; Krishnaraj, S.J.; Aponte, C. Assessing fire impacts on the carbon stability of fire-tolerant forests. Ecol. Appl. 2017, 27, 2497–2513. [Google Scholar] [CrossRef] [PubMed]
- Lowman, M.D. Light interception and its relation to structural differences in three Australian rainforest canopies. Aust. J. Ecol. 1986, 11, 163–170. [Google Scholar] [CrossRef]
- Duggin, J.; Gentle, C. Experimental evidence on the importance of disturbance intensity for invasion of Lantana camara L. in dry rainforest–open forest ecotones in north-eastern NSW, Australia. For. Ecol. Manag. 1998, 109, 279–292. [Google Scholar] [CrossRef]
- Sundaram, B.; Krishnan, S.; Hiremath, A.; Joseph, G. Ecology and Impacts of the Invasive Species, Lantana camara, in a social-ecological system in South India: Perspectives from Local Knowledge. Hum. Ecol. 2012, 40, 931–942. [Google Scholar] [CrossRef]
- Debuse, V.J.; Lewis, T. Long-term repeated burning reduces Lantana camara regeneration in a dry eucalypt forest. Biol. Invasions 2014, 16, 2697–2711. [Google Scholar] [CrossRef]
- Holl, K.D.; Loik, M.E.; Lin, E.H.; Samuels, I.A. Tropical montane forest restoration in Costa Rica: Overcoming barriers to dispersal and establishment. Restor. Ecol. 2000, 8, 339–349. [Google Scholar] [CrossRef]
- Douglas, M.; Setterfield, S.; McGuinness, K.; Lake, P. The impact of fire on riparian vegetation in Australia’s tropical savanna. Freshw. Sci. 2015, 34, 1351–1365. [Google Scholar] [CrossRef]
- McDonald, W.J.F. National Recovery Plan for the “Semi-Evergreen Vine Thickets of the Brigalow Belt (North and South) and Nandewar Bioregions” Ecological Community. Report to Department of the Environment, Water, Heritage and the Arts, Canberra. Queensland Department of Environment and Resource Management, Brisbane. 2010. Available online: http://www.environment.gov.au/resource/national-recovery-plan-semi-evergreen-vine-thickets-brigalow-belt-north-and-south-and (accessed on 20 November 2022).
- Morris, R.J. Anthropogenic impacts on tropical forest biodiversity: A network structure and ecosystem functioning perspective. Philos. Trans. R. Soc. B Biol. Sci. 2010, 365, 3709–3718. [Google Scholar] [CrossRef] [Green Version]
- Zimmer, H.C.; Auld, T.D.; Hughes, L.; Offord, C.A.; Baker, P.J. Fuel flammability and fire responses of juvenile canopy species in a temperate rainforest ecosystem. Int. J. Wildland Fire 2015, 24, 349–360. [Google Scholar] [CrossRef]
- Cury, R.; Montibeller-Santos, C.; Balch, J.; Brando, P.; Torezan, J. Effects of fire frequency on seed sources and regeneration in Southeastern Amazonia. Front. For. Glob. Chang. 2020, 3, 82. [Google Scholar] [CrossRef]
- Thusithana, V.; Bellairs, S.; Bach, C. Seed germination of coastal monsoon vine forest species in the Northern Territory, Australia, and contrasts with evergreen rainforest. Aust. J. Bot. 2018, 66, 218–229. [Google Scholar] [CrossRef]
- Hill, R.; Read, J. Post-fire regeneration of rainforest and mixed forest in western Tasmania. Aust. J. Bot. 1984, 32, 481. [Google Scholar] [CrossRef]
- Hamilton, K.; Offord, C.; Cuneo, P.; Deseo, M. A comparative study of seed morphology in relation to desiccation tolerance and other physiological responses in 71 Eastern Australian rainforest species. Plant Species Biol. 2012, 28, 51–62. [Google Scholar] [CrossRef]
- Abedi Gheshlaghi, H.; Feizizadeh, B.; Blaschke, T.; Lakes, T.; Tajbar, S. Forest fire susceptibility modeling using hybrid approaches. Trans. GIS 2021, 25, 311–333. [Google Scholar] [CrossRef]
- Collins, L.; Gibson, R. A remote sensing approach to mapping fire severity in south-eastern Australia using sentinel 2 and random forest. Remote Sens. Environ. 2020, 240, 111–702. [Google Scholar]
- Artés, T.; Oom, D.; de Rigo, D. A global wildfire dataset for the analysis of fire regimes and fire behaviour. Sci. Data 2019, 6, 296. [Google Scholar] [CrossRef] [Green Version]
- Barker, P. A Technical Manual for Vegetation Monitoring. Resource Management and Conservation; Department of Primary Industries, Water and Environment: Hobart Tasmania, TAS, Australia, 2001.
- Prestes, N.; Massi, K.; Silva, E.; Nogueira, D.; de Oliveira, E.; Freitag, R.; Marimon, B.; Marimon-Junior, B.; Keller, M.; Feldpausch, T. Fire Effects on Understory Forest Regeneration in Southern Amazonia. Front. For. Glob. Chang. 2020, 3, 10. [Google Scholar] [CrossRef]
- McCarthy, M.A.; Gill, A.M.; Lindenmayer, D.B. Fire Regimes in Mountain ash forest: Evidence from forest age structure, extinction models and wildlife habitat. For. Ecol. Manag. 1999, 124, 193–203. [Google Scholar] [CrossRef]
- Cary, G.J. Importance of a changing climate for fire regimes in Australia. In Flammable Australia: Fire Regimes, Biodiversity and Ecosystems in a Changing World; Bradstock, R.A., Gill, A.M., Williams, R.J., Eds.; CSIRO Publishing: Melbourne, VIC, Australia, 2002; pp. 26–46. [Google Scholar]
Figure 1.
Site Locations: Bulburin NP (blue); Main Range NP (pink); Lamington NP (green).

Figure 2.
Fire-severity mapping displaying dNBR, rainforest polygon, and site locations. Images taken at different fire-severity sites for Rainforest. No burn sites had no scorches present on the trunk, understorey was dense, sub-canopy and canopy were full (1st photo). Low burn sites were identified through minimal burn in the understorey and a full canopy (2nd photo). Moderate burn sites were determined through increased height of scorched trunks up to the shrub layer and occasionally the sub-canopy (3rd photo). High burn was identified by the loss of canopy and minimal regeneration in all stratum layers (4th photo).

Figure 3.
Images assembled from Google Earth, displaying significant historic disturbance events at Main Range National park between 2012–2013. The landslips post the 2012 flooding can be identified as the exposed ground or cleared hill face (for example, see red circle).
Figure 3.
Images assembled from Google Earth, displaying significant historic disturbance events at Main Range National park between 2012–2013. The landslips post the 2012 flooding can be identified as the exposed ground or cleared hill face (for example, see red circle).

Figure 4.
(A) Fire-severity mapping displaying site locations, rainforest polygons, roads and tracks data and the interface of areas previously burnt shown as the fire-severity image. (B) Fire-severity mapping displaying E/N axis and 10 × 10 m grid lines used to navigate in the field.
Figure 4.
(A) Fire-severity mapping displaying site locations, rainforest polygons, roads and tracks data and the interface of areas previously burnt shown as the fire-severity image. (B) Fire-severity mapping displaying E/N axis and 10 × 10 m grid lines used to navigate in the field.

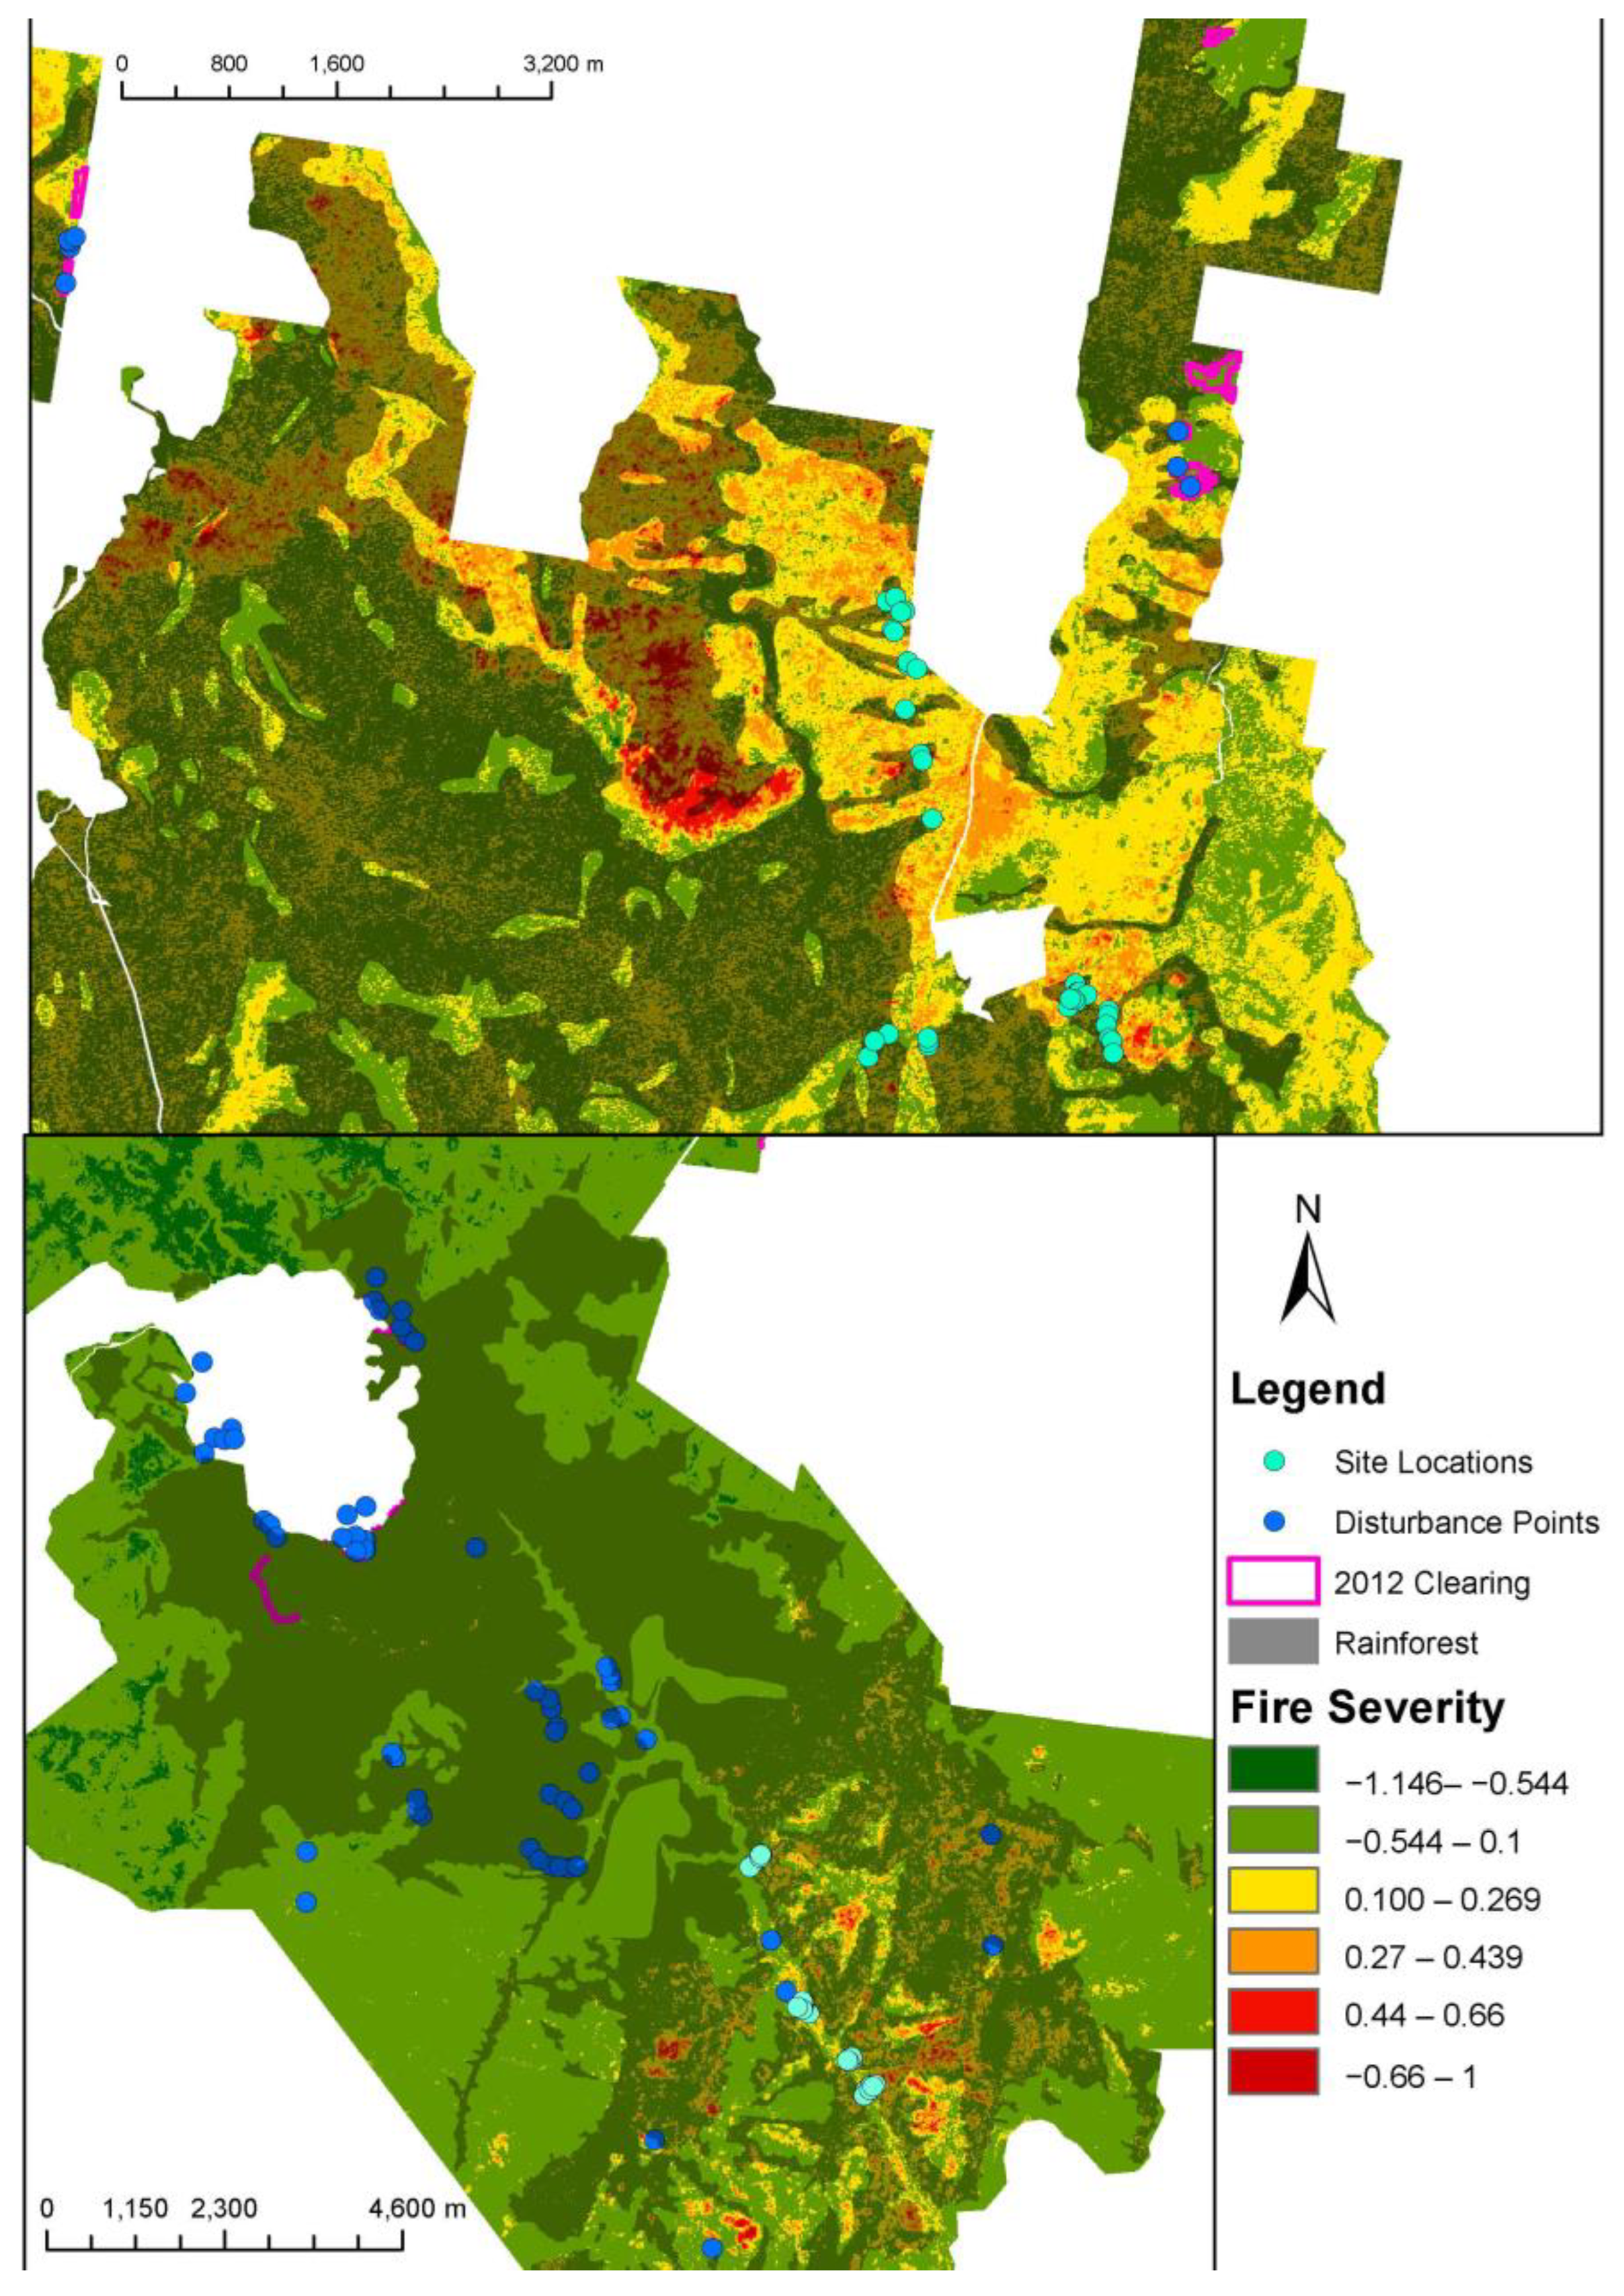
Figure 5.
Locations; Lamington NP (top). Bulburin NP (below) with dNBR raster, site locations, disturbance points, rainforest, and clearings 2012 data.
Figure 5.
Locations; Lamington NP (top). Bulburin NP (below) with dNBR raster, site locations, disturbance points, rainforest, and clearings 2012 data.

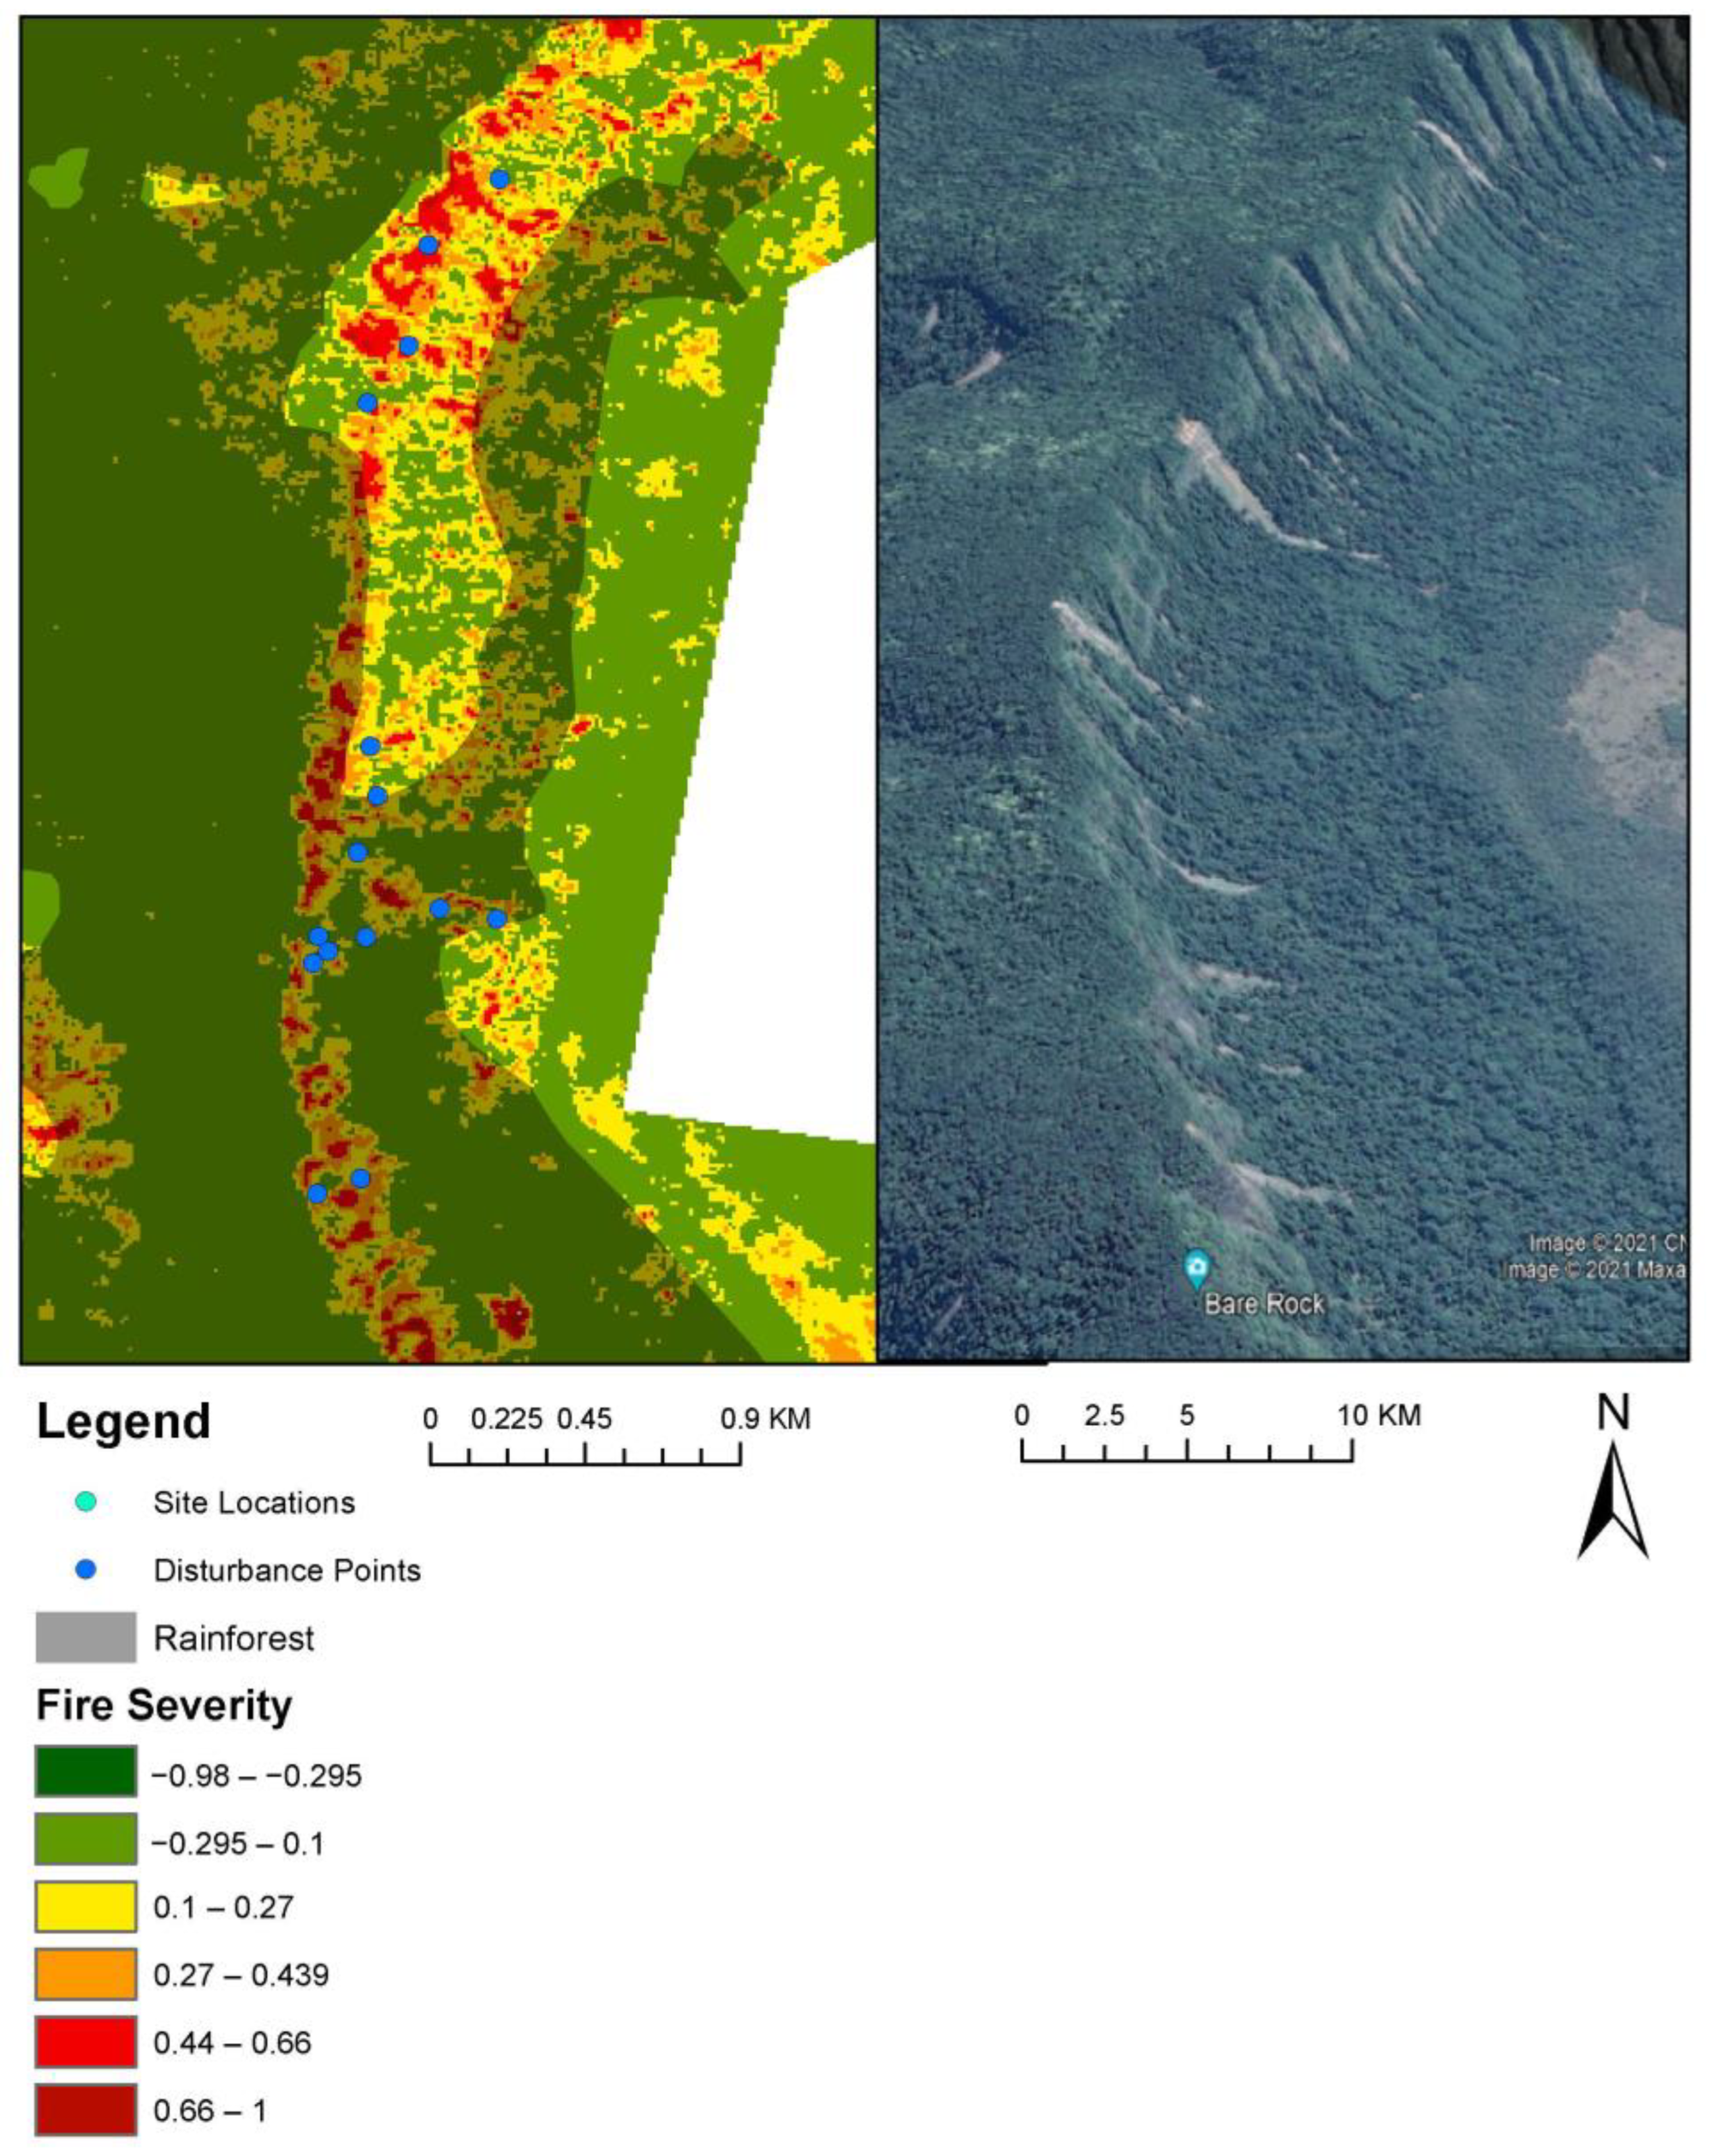
Figure 6.
Disturbance at Main Range NP showing the extent of burns (dNBR raster) and disturbance points on left. Rainforest polygon overlayed. Google Earth satellite imagery of Main Range landslips disturbance on right.
Figure 6.
Disturbance at Main Range NP showing the extent of burns (dNBR raster) and disturbance points on left. Rainforest polygon overlayed. Google Earth satellite imagery of Main Range landslips disturbance on right.


Table 1.
Summary table of the mean % cover of each stratum layer against each fire-severity (FS) category (1–4) for pooled National Park (NP) data and individual park assessment (BUL = Bulburin NP, MR = Main Range NP and LAM = Lamington NP). Where substrate (S); herb layer (<1 m) (HL); shrub layer (>1–5 m (SL); sub-canopy (5–10 m) (SC); (canopy (>10 m) (C). Mean values are shown with standard deviation in brackets. The ANOVA F test statistic and p values indicate if there were significant differences among stratum, as well as among the three National Parks.
| FS | N | S | HL | SL | SC | C | |
|---|---|---|---|---|---|---|---|
| Pooled NP | 1 | 23 | 9.6 (11.3) | 54.8 (26.3) | 19.3 (16.7) | 36.7 (24.3) | 48.7 (16.8) |
| 2 | 29 | 9.7 (9.6) | 61.4 (27.4) | 31.9 (18.9) | 28.6 (23.8) | 42.3 (22.3) | |
| 3 | 20 | 9.0 (11.2) | 73.5 (21.8) | 38.3 (24.6) | 6.3 (10.1) | 10.5 (11.1) | |
| 4 | 18 | 12.2 (16.5) | 76.4 (26.8 | 34.7 (22.3) | 2.8 (3.1) | 3.3 (3.4) | |
| F | 0.27 | 3.26 | 3.53 | 16.35 | 41.43 | ||
| P | 0.847 | 0.025 | 0.018 | 0.000 | 0.000 | ||
| BUL | 1 | 9 | 4.4 (3.9) | 53.3 (32.5) | 22.2 (15.4) | 52.2 (22.4) | 51.1 (17.9) |
| 2 | 8 | 7.5 (4.6) | 75.0 (25.2) | 26.9 (27.1) | 38.1 (27.1) | 46.6 (29.2) | |
| 3 | 7 | 12.1 (15.2) | 67.1 (31.7) | 42.9 (30.1) | 8.6 (11.4) | 10.0 (15.5) | |
| 4 | 7 | 10.0 (12.2) | 85.7 (18.6) | 24.3 (20.7) | 1.4 (2.4) | 2.1 (2.7) | |
| F | 0.92 | 1.92 | 1.45 | 12.33 | 12.70 | ||
| P | 0.444 | 0.151 | 0.250 | 0.000 | 0.000 | ||
| MR | 1 | 8 | 15.6 (15.2) | 62.5 (16.9) | 15.0 (18.5) | 26.9 (21.3) | 50.0 (17.5) |
| 2 | 6 | 18.3 (16.9) | 65.0 (20.0) | 36.7 (24.6) | 17.5 (17.8) | 41.7 (19.1) | |
| 3 | 5 | 14.0 (10.8) | 71.0 (20.1) | 28.0 (24.9) | 4.0 (8.9) | 11.0 (8.9) | |
| 4 | 6 | 21.7 (23.4) | 55.8 (32.6) | 30.8 (15.3) | 4.2 (3.8) | 4.2 (4.9) | |
| F | 0.22 | 0.37 | 1.39 | 3.08 | 15.52 | ||
| p | 0.881 | 0.778 | 0.274 | 0.050 | 0.000 | ||
| LAM | 1 | 6 | 9.2 (10.2) | 46.7 (21.6) | 20.8 (17.7) | 26.7 (19.1) | 43.3 (15.7) |
| 2 | 15 | 7.3 (5.6) | 52.7 (29.1) | 32.7 (17.8) | 28.0 (23.4) | 40.7 (20.6) | |
| 3 | 8 | 3.1 (2.6) | 80.6 (9.8) | 40.6 (20.3) | 5.6 (10.5) | 10.6 (9.0) | |
| 4 | 5 | 4.0 (4.2) | 88.0 (15.7) | 54.0 (22.2) | 3.0 (2.7) | 4.0 (2.2) | |
| F | 1.59 | 5.55 | 3.07 | 4.14 | 11.71 | ||
| P | 0.212 | 0.004 | 0.043 | 0.014 | 0.000 | ||
| Between | F | 8.11 | 0.51 | 1.53 | 2.24 | 0.01 | |
| Parks | P | 0.001 | 0.601 | 0.222 | 0.113 | 0.994 |
Table 2.
Spearman’s Rho correlation of structure; HL = Herb Layer % cover, SL = Shrub Layer % cover, SC = Sub-canopy % cover, C = Canopy % cover and regrowth parameters S = Seedlings, I = Phytolacca octandra (inkweed) % cover, L = Lantana camara, F = Ferns, FP = Sum of fire-promoting variables (L = Lantana, WV = Woody Vines, WVC = WoodyVine Clumps, D = Disturbance), FS = sum of fire-supressing variables (SE = Seedlings R = Resprouting F = Ferns, NWV = Non-Woody Vines) against dnBR fire-severity values. Results (Rho and p) for combined NP as well as at each individual National Park (LAM = Lamington, BUL = Bulburin, MR = Main Range) are shown. The following Bonferroni variables were considered, where significance is identified by the p-values.
| HL | SL | SC | C | SE | I | L | F | FP | FS | |
|---|---|---|---|---|---|---|---|---|---|---|
| Pooled NP | ||||||||||
| Rho | 0.326 | 0.254 | −0.64 | −0.747 | −0.518 | 0.321 | 0.49 | −0.369 | 0.49 | −0.144 |
| (P) | 0.002 | 0.016 | 0.000 | 0.000 | 0.000 | 0.002 | 0.000 | 0.000 | 0.000 | 0.177 |
| LAM | ||||||||||
| Rho | 0.612 | 0.358 | −0.576 | −0.749 | −0.357 | 0.335 | 0.595 | −0.272 | 0.41 | −0.131 |
| (P) | 0.000 | 0.038 | 0.000 | 0.000 | 0.038 | 0.053 | 0.000 | 0.12 | 0.16 | 0.46 |
| BUL | ||||||||||
| Rho | 0.345 | 0.063 | −0.765 | −0.706 | −0.571 | 0.1 | 0.653 | −0.154 | 0.46 | −0.412 |
| (P) | 0.057 | 0.737 | 0.000 | 0.000 | 0.000 | 0.592 | 0.000 | 0.407 | 0.009 | 0.021 |
| MR | ||||||||||
| Rho | 0.035 | 0.418 | −0.478 | −0.706 | −0.659 | 0.596 | 0.26 | −0.816 | 0.104 | −0.66 |
| (P) | 0.868 | 0.038 | −0.016 | 0.000 | 0.000 | 0.000 | 0.209 | 0.000 | 0.62 | 0.000 |
Table 3.
Summary table showing the mean or median results of fire-promoting regrowth, for each fire severity in each NP, as well as for pooled NP data. The sample sizes are given (N). For categorical data; L = Lantana (1 = 1–10; 2 = 11–25; 3 = 26–50; 4 = 51–75; 5 = 76+ plants), WV = Woody Vines (1 = few vines, 2 = 1; 3 = 2–3; 4 = 4–5; 5 = 6+ towers), D= Disturbance (1 = branches, 2 = logs, 3 = trees, 4 = landslip) the classes were given median, Kruskal Wallis H, and p-values, and against each fire-severity category. For non-categorical data; G = Grasses % cover), mean, Kruskal Wallis H, and p-values values were given for each fire-severity category, as well as for a comparison among National Parks.
| FS | N | L | WV | WVC | G | D | |
|---|---|---|---|---|---|---|---|
| Pooled | |||||||
| NP | 1 | 23 | 0 (0.3) | 2 (1.3) | 0 (0.9) | 6.5 (21.5) | 0 (1.2) |
| 2 | 29 | 0 (0.7) | 3 (1.5) | 1 (0.9) | 2.4 (11.2) | 2 (1.3) | |
| 3 | 20 | 0 (1.3) | 2 (1.3) | 1.(0.8) | 15.0 (30.6) | 0 (1.3) | |
| 4 | 18 | 1.5 (1.5) | 2 (1.2) | 1 (0.7) | 19.2 (32.4) | 1.5 (1.3) | |
| H | 22.17 | 2.47 | 4.73 | 8.52 | 4.79 | ||
| P | 0.000 | 0.482 | 0.193 | 0.036 | 0.188 | ||
| BUL | |||||||
| 1 | 9 | 0 (0.3) | 2 (1.0) | 0 (0.9) | 17 (32.8) | 0 (1.6) | |
| 2 | 8 | 1 (1.1) | 3 (1.0) | 2 (0.9) | 9 (22.4) | 3 (1.3) | |
| 3 | 7 | 2 (1.3) | 2 (1.4) | 1 (0.9) | 43 (39.8) | 0 (1.5) | |
| 4 | 7 | 3 (1.5) | 3 (0.5) | 2 (0.5) | 49 (35.3) | 1 (1.4) | |
| H | 14.15 | 5.23 | 6.07 | 10.24 | 3.79 | ||
| P | 0.003 | 0.156 | 0.108 | 0.017 | 0.286 | ||
| MR | |||||||
| 1 | 8 | 0 (0.4) | 1 (1.7) | 0.5 (1.2) | 0 (0.0) | 0 (0.0) | |
| 2 | 6 | 0 (0.0) | 1 (1.8) | 2 (1.0) | 0 (0.0) | 0 (0.0) | |
| 3 | 5 | 0 (1.7) | 1 (1.7) | 2 (1.1) | 0 (0.0) | 0 (0.0) | |
| 4 | 6 | 0 (0.5) | 0.5 (0.8) | 0.5 (0.5) | 0 (0.0) | 0 (1.5) | |
| H | 3.74 | 4.40 | 3.80 | 0.00 | 6.61 | ||
| P | 0.291 | 0.221 | 0.284 | 1.000 | 0.085 | ||
| LAM | |||||||
| 1 | 6 | 0 (0.0) | 2 (1.4) | 0 (0.4) | 0 (0.0) | 1 (0.0) | |
| 2 | 15 | 0 (0.3) | 2 (1.5) | 0 (0.8) | 0 (0.0) | 3 (0.0) | |
| 3 | 8 | 0 (0.4) | 2 (1.1) | 0 (1.0) | 0 (0.0) | 3 (0.0) | |
| 4 | 5 | 3 (1.3) | 2 (1.3) | 1 (0.4) | 0 (0.0) | 3 (0.6) | |
| H | 17.70 | 0.73 | 2.96 | 0.00 | 4.67 | ||
| P | 0.001 | 0.865 | 0.398 | 1.000 | 0.198 | ||
| Between Parks | |||||||
| H | 14.90 | 9.77 | 6.80 | 8.52 | 23.45 | ||
| P | 0.001 | 0.008 | 0.033 | 0.036 | 0.000 |
Table 4.
Summary table showing the mean and median results of fire-supressing regrowth variables, for each fire-severity class (FS) in each NP, as well as for pooled NP data. For categorical data median values are given with standard deviation in brackets (SE = Seedlings (1 = <10; 2 = 11–50; = 51–100; 4 = 101–500; 5 = 500+), R = Resprouting and F = Ferns (0 = absent, 1 = present and 2 = abundant), NWV = Non-Woody Vines (1 = few vines, 2 = present, 3 = abundant), as well as the Kruskal Wallis H and p-values for comparisons among fire severity (FS). For non-categorical data; (I = Phytolacca octandra (Inkweed) % cover and FM = Fleshy Monocot % cover, the mean values are given with standard deviation values in brackets; Kruskal Wallis H and p-values were given for comparisons among fire-severity categories within each National Park, as well as among the 3 National parks.
| FS | SE | R | F | I | FM | NWV | |
|---|---|---|---|---|---|---|---|
| 1 | 4 (0.5) | 1 (0.2) | 1 (0.7) | 5 (15.5) | 8 (11.9) | 2 (1.0) | |
| Pooled NP | 2 | 4 (0.7) | 1 (0.2) | 1 (0.5) | 12 (21.3) | 8 (9.3) | 2 (1.0) |
| 3 | 3 (1.0) | 1 (0.2) | 0.5 (0.7) | 16 (26.6) | 9 (14.4) | 2 (1.0) | |
| 4 | 2 (0.5) | 1 (0.0) | 0 (0.5) | 20 (28.3) | 6 (7.9) | 2 (0.7) | |
| H | 23.79 | 0.858 | 14.84 | 7.105 | 1.384 | 4.871 | |
| P | 0 | 0.836 | 0.002 | 0.069 | 0.709 | 0.18 | |
| BUL | 1 | 4 (0.5) | 1 (0.0) | 0 (0.5) | 1 (1.7) | 4 (5.8) | 2 (0.9) |
| 2 | 4 (0.5) | 1 (0.0) | 0.5 (0.5) | 1 (1.9) | 5 (5.8) | 2 (1.0) | |
| 3 | 3 (0.7) | 1 (0.0) | 0 (0.5) | 0 (0.0) | 4 (10.5) | 2 (0.6) | |
| 4 | 2 (0.5) | 1 (0.0) | 0 (0.4) | 1 (3.8) | 6 (10.7) | 2 (0.4) | |
| H | 13.31 | 0.00 | 2.16 | 1.02 | 2.25 | 0.27 | |
| P | 0.004 | 1.000 | 0.539 | 0.795 | 0.522 | 0.967 | |
| MR | 1 | 3 (0.5) | 1 (0.4) | 1.5 (0.5) | 10 (24.3) | 13 (17.5) | 1 (0.7) |
| 2 | 3 (0.9) | 1 (0.4) | 1 (0.4) | 43 (28.9) | 13 (10.4) | 2 (1.0) | |
| 3 | 2 (0.5) | 1 (0.4) | 0 (0.5) | 57 (17.5) | 17 (19.9) | 2 (1.2) | |
| 4 | 2 (0.4) | 1 (0.0) | 0 (0.4) | 46 (35.0) | 6 (6.3) | 1 (0.9) | |
| H | 15.10 | 1.20 | 15.14 | 8.98 | 1.69 | 4.89 | |
| P | 0.002 | 0.754 | 0.002 | 0.030 | 0.639 | 0.180 | |
| LAM | 1 | 4 (0.5) | 1 (0.0) | 1 (0.4) | 5 (12.2) | 8 (8.7) | 1 (1.1) |
| 2 | 4 (0.6) | 1 (0.0) | 1 (0.3) | 5 (7.7) | 8 (10.3) | 2 (1.1) | |
| 3 | 4 (0.7) | 1 (0.0) | 1 (0.8) | 4 (10.6) | 9 (12.7) | 2 (1.1) | |
| 4 | 3 (0.4) | 1 (0.0) | 1 (0.4) | 16 (14.7) | 6 (6.5) | 2 (0.0) | |
| H | 6.86 | 0.00 | 1.88 | 6.08 | 0.30 | 2.84 | |
| P | 0.077 | 1.000 | 0.598 | 0.108 | 0.959 | 0.417 | |
| Between Parks | H | 12.73 | 7.98 | 23.50 | 7.11 | 1.38 | 11.52 |
| P | 0.002 | 0.019 | 0.000 | 0.069 | 0.709 | 0.003 |
Disclaimer/Publisher’s Note: The statements, opinions and data contained in all publications are solely those of the individual author(s) and contributor(s) and not of MDPI and/or the editor(s). MDPI and/or the editor(s) disclaim responsibility for any injury to people or property resulting from any ideas, methods, instructions or products referred to in the content. |
© 2023 by the authors. Licensee MDPI, Basel, Switzerland. This article is an open access article distributed under the terms and conditions of the Creative Commons Attribution (CC BY) license (https://creativecommons.org/licenses/by/4.0/).
Share and Cite
MDPI and ACS Style
Ross, T.; Srivastava, S.K.; Shapcott, A. Investigating the Relationship between Fire Severity and Post-Fire Vegetation Regeneration and Subsequent Fire Vulnerability. Forests 2023, 14, 222. https://doi.org/10.3390/f14020222
AMA Style
Ross T, Srivastava SK, Shapcott A. Investigating the Relationship between Fire Severity and Post-Fire Vegetation Regeneration and Subsequent Fire Vulnerability. Forests. 2023; 14(2):222. https://doi.org/10.3390/f14020222
Chicago/Turabian StyleRoss, Thalia, Sanjeev K. Srivastava, and Alison Shapcott. 2023. "Investigating the Relationship between Fire Severity and Post-Fire Vegetation Regeneration and Subsequent Fire Vulnerability" Forests 14, no. 2: 222. https://doi.org/10.3390/f14020222
Note that from the first issue of 2016, this journal uses article numbers instead of page numbers. See further details here.