

Abstract
Extreme fire seasons characterised by very large 'mega-fires' have demonstrably increased area burnt across forested regions globally. However, the effect of extreme fire seasons on fire severity, a measure of fire impacts on ecosystems, remains unclear. Very large wildfires burnt an unprecedented area of temperate forest, woodland and shrubland across south-eastern Australia in 2019/2020, providing an opportunity to examine the impact of extreme fires on fire severity patterns. We developed an atlas of wildfire severity across south-eastern Australia between 1988 and 2020 to test (a) whether the 2019/2020 fire season was more severe than previous fire seasons, and (b) if the proportion of high-severity fire within the burn extent (HSp) increases with wildfire size and annual area burnt. We demonstrate that the 2019/2020 wildfires in south-eastern Australia were generally greater in extent but not proportionally more severe than previous fires, owing to constant scaling between HSp and annual fire extent across the dominant dry-forest communities. However, HSp did increase with increasing annual fire extent across wet-forests and the less-common rainforest and woodland communities. The absolute area of high-severity fire in 2019/2020 (∼1.8 M ha) was larger than previously seen, accounting for ∼44% of the area burnt by high-severity fire over the past 33 years. Our results demonstrate that extreme fire seasons are a rare but defining feature of fire regimes across forested regions, owing to the disproportionate influence of mega-fires on area burnt.
Export citation and abstract BibTeX RIS

Original content from this work may be used under the terms of the Creative Commons Attribution 4.0 license. Any further distribution of this work must maintain attribution to the author(s) and the title of the work, journal citation and DOI.
1. Introduction
The occurrence of very large and destructive wildfires is increasing across forested regions globally [1–4]. These extreme fires have caused substantial shifts in fire regimes, including increased area burnt and fire frequency [5–7]. Climate change is increasing the frequency and duration of climatic conditions conducive for very large wildfires, hence upward trends in area burnt are projected to continue into the future in many regions [8–13]. Fires occurring during extreme fire seasons are often assumed to burn at high-intensity, resulting in widespread and severe impacts on ecosystems [14–16], though the evidence to test this assumption is sparse and shows equivocal results [17–20]. Establishing whether very large wildfires are proportionally more intense or damaging is vital to estimate the profound social and environmental impacts of future fires [21].
Fire severity is an important characteristic of the fire regime that describes the effect of fire intensity on ecosystems. Operationally, fire severity is measured as the degree of consumption of or change in organic matter resulting from fire, including partial or whole plant mortality [22]. Patterns in fire severity have a greater influence on biodiversity and ecosystem function than area burnt per se. This is particularly evident across temperate forest and woodland communities, where most tree species display some resistance to fire through thick insulative bark and tall canopies [23, 24]. Consequently, fire impacts and recovery trajectories often vary in response to high-intensity fires that affect the tree canopy compared with low-intensity fires that are confined to the understorey [25, 26]. Habitat within the fire extent that remains unburnt or minimally affected, due to either inherent community fire resistance or chance, will also provide important fire refugia for fire-sensitive species and communities [27]. Quantification of fire severity patterns is critical for understanding the immediate and long-term effects of increasing fire activity and impacts on forest dynamics, biodiversity, carbon emissions and rates of carbon uptake and storage [24, 26, 28, 29].
Wildfires burnt ∼7 M ha across south-eastern Australia between September 2019 and March 2020 (referred hereon as the '2019/2020 fires') [30], representing what is likely the most extensive fire season across the region since the arrival of Europeans [21]. The 2019/2020 fires were the most recent in a sequence of large destructive fire seasons spanning several decades, which have included numerous mega-fires (i.e. 100 000–1.5 M ha in size) [1, 5, 31]. Recent analyses of historical fire records indicate that the occurrence of large wildfires and annual area burnt have increased across south-eastern Australia since the 1950s [1, 5], owing in part to an increased occurrence of severe fire weather and drought [32, 33]. The extraordinary extent of the 2019/2020 fires, on both a national and global scale [7], provides an opportunity to test whether extreme fires are also driving changes in patterns of fire severity.
Here, we established a baseline of fire severity mapping for past fires to test (a) whether the unprecedented 2019/2020 fire season was more severe than previous fire seasons, and (b) if the proportion of high-severity fire within fire perimeters (HSp) increases with increasing wildfire extent. The study focused on native woody vegetation communities across the temperate biome of south-eastern Australia (figure 1) owing to the frequent occurrence of major wildfires [2, 5] and availability of a widely validated technique to produce very accurate fire severity mapping (∼88% classification accuracy) [34]. We used an environmental definition of high-severity fire, which included severity classes that result in widespread mortality or foliage loss in the canopy layer of a vegetation community (i.e. fires that cause substantial changes to ecosystem structure and function) [25, 29, 35].

Figure 1. Location of the study region and fire severity mapping for the 2019/2020 wildfires. A detailed view of three mega-fires is provided to highlight heterogeneous patterns in fire severity within the mapped fire perimeters. These fires are the (a) Gospers Mountain fire, (b) South Coast fire complex and (c) Tambo-Snowy fire complex. Fire severity classes include unburnt vegetation (>90% of the ground-layer unburnt), low canopy scorch (<20% canopy scorch), moderate canopy scorch (20%–80% canopy scorch), high canopy scorch (>80% canopy scorch) and canopy consumption (canopy foliage mostly consumed). The severity maps have been masked to only show patterns in dry-forest, wet-forest, shrubland, woodland, forested wetland and rainforest communities.
Download figure:
Standard image High-resolution imageOur analysis focuses on severity patterns during extreme fire seasons and mega-fires, given their disproportionate contribution to area burnt. Here, we define an extreme fire season as one that includes one or more mega-fire(s). The definition of 'mega-fire' varies across biomes and studies, and may incorporate fire size, difficulty of suppression, and impact [36]. Here, we define a 'mega-fire' as a wildfire or wildfire complex that encompasses more than 100 000 ha of native woody vegetation. The mega-fires identified in our study also consisted of large areas burnt at high-severity (>50 000 ha). This definition is broadly consistent with prior studies of mega-fires in temperate forests of south-eastern Australia [31].
2. Methods
2.1. Study area
The study focused on native woody vegetation communities in the temperate biome of mainland south-eastern Australia, extending from the Sydney basin in the north to the western border of Victoria in the south-west (figure 1). The study region encompassed ∼13 million ha of native forest, woodland and shrubland, with dry- and wet-eucalypt forests dominating the region (figure S1). We focused on large wildfires (>2500 ha) that burnt within the temperate biome between 1988 and 2020 (n = 260). We targeted large fires because they account for ∼92% of the area burnt by wildfire across the biome, and can have the greatest social and environmental impacts [30, 37].
2.2. Vegetation communities
Vegetation maps (∼15 m resolution) were acquired from the Victorian Department of Environment, Land, Water and Planning; New South Wales Department of Planning, Industry and Environment; and Australian Capital Territory Government. Vegetation classes were reclassified into a consistent schema based on broad vegetation communities described in Keith [38]. Native woody vegetation communities considered in our study included dry-forest (5.53 M ha), wet-forest (4.81 M ha), woodland (1.94 M ha), shrubland (0.55 M ha), forested wetland (0.26 M ha), and rainforest (0.19 M ha). All six vegetation communities occur across the extent of the study biome (figure S1). However, forested wetland and rainforest communities rarely form large expansive stands. Forested wetland and rainforest communities are typically restricted in their distribution, the former being confined to riparian corridors and floodplains and the latter to mesic gullies or misty mountains and plateaus [38].
The majority (>95%) of plant species occurring in the dry-forest, wet-forest, wetland, woodland and shrubland communities possess the capacity to regenerate shortly following fire through vegetative recovery (i.e. resprouters) or post-fire seedling recruitment (i.e. seeders) [39]. Rainforests have a higher composition of species lacking a persistent seedbank or the capacity to resprout (∼18% of species) [39]. Dry- and wet-forests are largely dominated by eucalypt trees (i.e. Eucalyptus, Corymbia and Angophora spp.) that can resprout from branches and stems following high-severity fire (i.e. epicormic resprouting), with fire-sensitive obligate seeder eucalypts being restricted to wetter and cooler environments [40]. Woodlands are dominated by eucalypts that resprout from the stem base (i.e. basal resprouters) in montane areas and epicormic resprouters on the coast and plains [38, 41]. Shrubland and rainforest canopies are dominated by a combination of basal resprouters and obligate seeders, while forested wetlands are typically dominated by epicormic resprouters [38, 40, 41]. Descriptions of the communities and the fire response of dominant canopy species are provided in table 1.
Table 1. Description of woody vegetation formations and the fire response of canopy species. Canopy species response refers to the dominant fire response syndrome(s) for the canopy species within the vegetation community. Response codes are: epicormic resprouter (Re), basal resprouter (Rb) and obligate seeder (OS). Canopy resistance threshold refers to the fire severity classes which cause major change to the structure and/or composition of the canopy layer, via consumption of foliage and/or high rates of branch, stem or whole plant mortality. References are provided in parentheses.
| Vegetation formation | Description | Canopy species response [39] | Canopy resistance exceeded |
|---|---|---|---|
| Wet forest | Open canopy layer (30%–70% cover), 30–100 m tall, dominated by species from the genera Eucalyptus, Corymbia and Angophora [38, 40]. | Re, OS | High canopy scorch, canopy consumption [42–45] |
| Dry forest | Open canopy layer (30%–70% cover), <30 m tall, dominated by species from the genera Eucalyptus, Corymbia and Angophora [38, 40]. | Re | High canopy scorch, canopy consumption [25, 43, 44] |
| Forested wetlands | Open to closed canopy layer (<70% cover), <40 m tall, dominated by species from the genera Eucalyptus, Angophora, Casuarina, Melaleuca [38]. | Re, OS | High canopy scorch, canopy consumption [25, 43, 44] |
| Rainforest | Closed canopy (>70% cover), 10–30 m tall. Canopy is dominated by species from numerous genera e.g. Acacia, Acmena, Atherosperma, Doryphora, Elaeocarpus, Nothofagus, Pittosporum [38]. | Rb, OS | Moderate to high canopy scorch, canopy consumption [46] |
| Woodland | Open canopy layer (10%–30% cover), <30 m tall, dominated by species from the genera Eucalyptus, Corymbia and Angophora [38, 40]. | Re, Rb | High canopy scorch, canopy consumption [25, 43, 45] |
| Shrubland | Open to dense canopy layer composed of shrub species up to 5 m tall, with sparse distribution of emergent eucalypts [38]. Shrub canopy is dominated by species from numerous genera e.g. Allocasuarina, Banksia, Hakea, Isopogon, Kunzea, Leptospermum. | Rb, OS | Low to high canopy scorch, canopy consumption |
Fire regimes vary across vegetation communities, with typical inter-fire intervals being shorter in the dry-forests and shrublands (∼5–20 years), than woodlands, wet-forests and forested wetlands (∼20 to >100 years) or rainforests (>100 years) [40, 41, 47]. Dry- and wet-forest communities are characterised by mixed-severity fires [15], with fire intensity typically ranging from 1000 to 10 000 kW m−1, though intensity can exceed 50 000 kW m−1 under extreme conditions [40, 47]. Shrublands typically experience canopy defoliating fires, which burn at moderate- to high-intensity (i.e. 1000–10 000 kW m−1), whereas woodlands typically experience low- to moderate-intensity (<5000 kW m−1) surface fires [47]. Rainforest communities are fire resistant [40] and only burn during periods of extreme drought [48], with fires typically being patchy and of low-intensity (<100 kW m−1) [47].
2.3. Fire severity mapping
Fire severity mapping was derived using Landsat imagery (30 m resolution) and a random forest classifier that had been rigorously trained and validated using 43 wildfires that occurred across the study area [34, 49] (see supplementary information (available online at stacks.iop.org/ERL/16/044029/mmedia)). The fires used in the training dataset occurred between 2006 and 2019, covered the entire extent of the study region, and incorporated all woody vegetation communities considered in the study [34]. The wildfires used to train and validate the random forest classifier included major fires during periods of extreme drought (e.g. 2007, 2009), as well as conditions of less severe water deficit (e.g. 2006, 2011, 2014) [48]. The breadth of environmental conditions included in the training data makes the random forest approach well suited for mapping fire severity across space and time over the temperate biome [34].
Five fire severity classes are mapped by the random forest classifier based on the amount of scorching and consumption of foliage observed in the understorey and canopy layers. Classes included unburnt vegetation, low canopy scorch (<20% canopy scorch), moderate canopy scorch (20%–80% canopy scorch), high canopy scorch (>80% canopy scorch) and canopy consumption (canopy foliage mostly consumed) [34]. The unburnt class occasionally included a low level of understorey fire (<10% of the ground-layer burnt), owing to sub-pixel patchiness of fire. These classes are routinely applied across eucalypt forests as they are meaningful both ecologically and from a fire management perspective [50, 51]. Spatially independent cross-validation of the random forest classifier has found a very high user's accuracy (i.e. how often a mapped class is present on ground) for the unburnt (89%), high canopy scorch (89%) and canopy consumption classes (97%), and high accuracy for the low canopy scorch (81%) and moderate canopy scorch (72%) classes [34], outperforming traditional single-index severity mapping approaches using only the normalised burn ratio [52].
The fire severity mapping process involved the following steps: (a) defining the fire perimeter, start- and end-dates; (b) creating cloud-free pre- and post-fire mosaics within the fire perimeter using Landsat imagery; (c) deriving spectral indices using the Landsat mosaics; and (d) producing a severity map for the fire perimeter using the spectral indices and random forest classifier [34]. The pre- and post-fire mosaics were derived over a short window (i.e. ∼1–3 months) that commenced immediately before and after the fire, respectively. The immediate post-fire period was targeted because of the rapid recovery of the spectral signal following fire across the fire-resilient forest and woodland communities of south-eastern Australia [49]. We used Google Earth Engine [53] for image acquisition and processing, and the implementation of the random forest classifier [52]. A detailed overview of the mapping procedure is provided as supplementary information (S2).
Mapped wildfire perimeters were obtained from state government agencies (Victorian Department of Environment, Land, Water and Planning; New South Wales Department of Planning, Industry and Environment; New South Wales Rural Fire Service) and were used to identify all large wildfires over the study period. These manually mapped fire perimeters have a stated accuracy of ∼10–100 m [54] and were deemed suitable for defining the fire extent for the severity mapping. Inspection of the mapped perimeters during the fire severity mapping process revealed some inconsistencies in the accuracy of fire perimeter mapping over time and jurisdiction, owing to the implementation of technological and methodological improvements (e.g. use of post-fire aerial photography for perimeter delineation) [51]. During the severity mapping process, we adjusted the mapped perimeters in instances where the perimeter clearly underestimated fire extent (i.e. where scorched canopies fell outside the burn perimeter), based on visual assessment of Landsat scenes obtained post-fire. We did not alter perimeters in instances where fire extent appeared to be overestimated, due to difficulties in detecting patchy low-intensity fires using satellite imagery. Such discrepancies in perimeter mapping will likely be a minor source of error in calculations of the absolute area of unburnt vegetation and vegetation experiencing low canopy scorch, given the large size of fires (thousands to millions of hectares) and generally small error of the perimeter mapping (∼10–100 m). This level of error is present in all assessments of burn extent based on satellite imagery.
2.4. Fire severity metrics
We calculated the area affected by each fire severity class over the duration of a fire season (1 July to 30 June) for each of the six native vegetation communities from 1988 to 2020. The study covered the period over which Landsat imagery was available for south-eastern Australia in Google Earth Engine. We did not consider communities such as grasslands, plantations or cleared habitat that had been revegetated. The proportional contribution of each fire severity class to annual fire extent was also calculated to provide a relativised measure of fire severity. Calculations of annual fire extent included unburnt patches within fire perimeters. Area and proportion burnt by each severity class was calculated at both the biome and vegetation community scale.
High-severity fire was defined by using canopy species fire resistance thresholds, which are those fire severity classes that trigger widespread canopy foliage loss and/or branch, stem or whole plant mortality within a vegetation community (see table 1). The proportion of high-severity fire across the entire extent within the fire perimeters (i.e. HSp), including unburnt patches, was calculated (a) for each discrete wildfire event and (b) for every fire season. The per-fire calculations focused on HSp irrespective of vegetation community. HSp was calculated at both the biome and vegetation community scales for each fire season. The area of high-severity patches was also calculated for each wildfire.
2.5. Statistical analysis
Analysis of fire severity data summarised per fire season excluded years when annual fire extent was considered small to minimise the influence of localised fire behaviour on the proportional contribution of the severity classes. Fire seasons were excluded from analysis for the dry-forest, wet-forest, woodland and shrubland communities if less than 1000 ha fell within the mapped fire perimeters. A 100 ha threshold was used for the forested wetland and rainforest communities because of their restricted distribution. A 5000 ha threshold was used when analysis was undertaken at the biome scale. Sample sizes were n= 26 for the biome, n = 20 for shrubland, n = 20 for woodland, n = 26 for dry-forest, n = 25 for wet-forest, n = 21 for forested wetland and n= 20 for rainforest. For analysis at the wildfire scale, we only considered fires that affected more than 1000 ha of native woody vegetation (n = 247).
We examined the area and proportion burnt by each severity class annually to assess whether the 2019/2020 fire season was more severe than previous fire seasons (i.e. 1988–2019). Analysis was undertaken independently for each vegetation community. Boxplots of the annual area and proportion burnt by each severity class were produced for each vegetation community using data from 1988 to 2019, to provide context for the 2019/2020 wildfires. The 5th and 95th percentiles were calculated over this period (i.e. 1988–2019) for each combination of severity class and vegetation community to determine if the 2019/2020 wildfires exceeded the 32 year baseline.
The relationship between wildfire extent and HSp was analysed independently for each vegetation community using beta regression, as this is appropriate when modelling continuous proportions [55]. Generalised additive models were used to account for non-linear relationships between wildfire extent and HSp [56], which were evident in the woodland, dry-forest and wet-forest communities. Generalised linear mixed-models were used to model the relationship between fire size and HSp for discrete wildfire events, with fire season being included as a random effect in the models. Fire extent was transformed using a natural logarithm for both sets of analysis. Pearsons residuals were plotted against fitted values to check for any systematic patterns in variance [55]. We tested the significance of models containing fire extent through comparison to the null model using the likelihood-ratio test [56]. Bootstrapping (n = 1000 simulations) was used to derive 95% confidence intervals for model predictions.
The relationship between the maximum and mean size of high-severity patches and wildfire size was assessed using a mixed-model approach with a gaussian distribution, with fire size included as a fixed effect and fire season included as a random effect in the models. Analysis focused on patches greater than 0.25 ha (i.e. ⩾3 connected pixels) to ensure the results were not influenced by very localised occurrences of high-severity fire. Mean and maximum patch size (×1000 ha) were transformed using a natural logarithm to meet the model assumptions. Wildfire size was transformed using a natural logarithm. We found evidence of non-linearity in the relationship between high-severity patch size and fire size, so generalised additive models were used. Models were tested using the likelihood ratio test as described above. Confidence intervals were derived using bootstrapping (n = 1000).
Statistical analysis was undertaken in R statistical software [57]. Generalised additive models were fitted using the 'mgcv' package [58] and generalised linear mixed-models were fitted using the 'glmmTMB' package [59].
3. Results
A total of 10.5 million ha of native woody vegetation was mapped within the fire perimeters over the 33 year study period. Dry-forests accounted for most of the area affected by fire (47.5%), followed by wet-forests (35.5%), woodlands (11.3%), shrublands (3.6%), rainforests (1.3%) and forested wetlands (0.8%). Low canopy scorch was the most common fire severity class recorded (30.7%), followed by high canopy scorch (26.7%), moderate canopy scorch (19.9%), canopy consumption (11.9%) and unburnt refugia (10.8%). Three extreme fire seasons (i.e. 2003, 2007, 2020), each impacting >1 M ha of native woody vegetation, accounted for 70.7% of the total fire extent (7.4 M ha) (figure 2(a)). Mega-fires (n = 15) represented only 5.8% of fires greater than 2500 ha over the study period, but accounted for 67.8% of the total fire extent (figures 2(b) and (c)). The 2019/2020 fire extent encompassed 4.0 M ha, with 8.8% recorded as unburnt in our severity mapping (figure 1). Approximately 14% (1.8 M ha) of native woody vegetation across the study biome was impacted by high-severity fire during the 2019/2020 season, accounting for 43.6% of the total area burnt by high-severity fire recorded over the past 33 years.
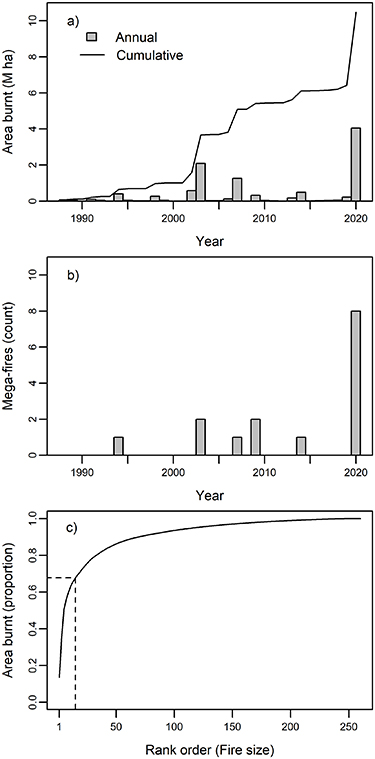
Figure 2. (a) Annual and cumulative area burnt (million ha), (b) number of mega-fires, and (c) the contribution of fires to total area burnt from 1988 to 2020. Fires in (c) have been ranked from largest to smallest, with the broken line identifying the contribution of mega-fires to the total area burnt and number of fires.
Download figure:
Standard image High-resolution imageThe total area burnt within each severity class in 2019/2020 exceeded that of any of the other 32 fire seasons for most vegetation communities, with the exception of four severity classes in woodlands and one in forested wetlands, which fell between the 75th percentile and the maximum (figure 3). Despite their massive extent, fire severity patterns were highly heterogeneous across the 2019/2020 fires, with no single severity class accounting for >40% of the area burnt in a vegetation community (figure 3). The proportion of the overall area burnt in each severity class in the 2019/2020 season mostly fell within the range recorded over the previous 32 years (figure 3). However, rainforest and woodland communities experienced proportionally greater extent of canopy consuming fire than previously recorded, and in the case of rainforest, proportionally less unburnt refugia (figure 3).
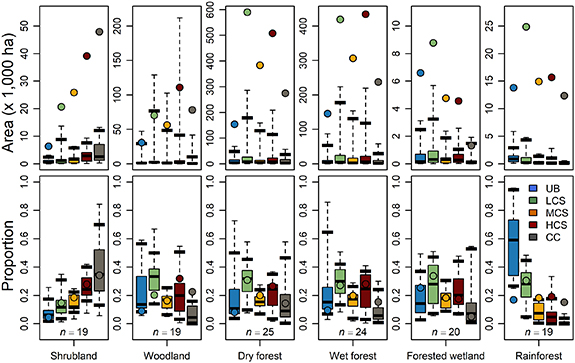
Figure 3. Boxplots depicting the extent and proportion of each severity class from 1988 to 2019 for each vegetation formation with circles showing data for the 2019/2020 season. Boxplots depict the median (bold line), quartiles (box) and extreme values (whiskers). The bold horizontal bars on the whiskers are the 5th and 95th percentiles (1988–2019). Fire severity classes represented in the legend are unburnt (UB), low canopy scorch (LCS), moderate canopy scorch (MCS), high canopy scorch (HCS) and canopy consumption (CC). We used data for fire seasons in which the burn extent exceeded 1000 ha for the widespread dry-forest, wet-forest, woodland and shrubland communities. A 100 ha threshold was used for rainforest and forested wetland communities because of their restricted distribution. Sample sizes refer to the number of seasons that were used to derive the boxplots and percentiles for each vegetation community.
Download figure:
Standard image High-resolution imageHigh-severity fire accounted for less than 50% of the total area burnt during most extreme fire seasons characterised by one or more mega-fires (i.e. 1994, 2003, 2007, 2014, 2020), the exception being the 2009 fires (figure 4(a)). HSp did not increase with annual fire extent when assessed at the biome scale, or within the dry-forest community (p > 0.05; figures 4(a)–(b)). However, HSp increased as annual fire extent increased within wet-forest, woodland and rainforest communities (p < 0.05), reaching an asymptote at ∼50 000 ha in woodlands and wet-forests (figures 4(c)–(e)). Rainforest showed the greatest absolute change in HSp with fire extent (figure 4).

Figure 4. Fitted relationships between the proportion of high-severity fire (HSp) within the fire extent and total fire extent (natural log-scale). Solid lines show the fitted mean and shaded areas show the 95% confidence intervals. Confidence intervals were derived through bootstrapping (n = 1000 samples). Extreme fire seasons with one or more mega-fire events have been highlighted. Boxplots depict the median (bold line), quartiles (box) and extreme values (whiskers) for HSp. We used data for fire seasons in which the annual area burnt exceeded 5000 ha across the entire biome or 1000 ha for the widespread dry-forest, wet-forest and woodland communities. A 100 ha threshold was used for rainforest communities because of their restricted distribution. Shrublands are not presented as canopy loss generally occurs when these communities are burnt. Forested wetlands are not presented due to the small area burnt in this community.
Download figure:
Standard image High-resolution imageWildfire size had a significant effect on HSp (χ2 1 = 9.388, n= 247, p =0.002), with HSp increasing as wildfire extent increased over several orders of magnitude (102–106ha; figure 5(a)). However, this largely reflected differences between the extremes in fire size, with constant scaling between high-severity fire and fire size being observed for wildfires greater than 20 000 ha (χ2 1 = 0.019, n= 61, p =0.890) and those less than 20 000 ha (χ2 1 = 1.687, n = 186, p = 0.194; figure 5(a)). High-severity fire accounted for between 26.8% and 62.9% (mean = 45.7%) of the total extent of mega-fires (i.e. fires > 100 000 ha; figure 5(b)). There was considerably less variation in HSp for mega-fires than other smaller fires (figure 5(b)).
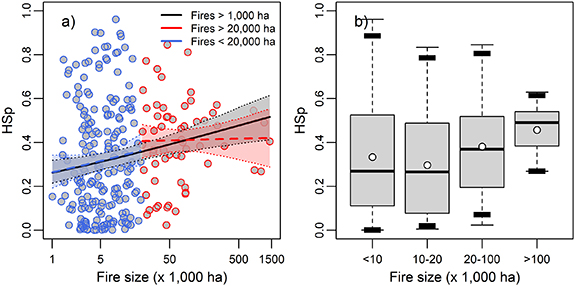
Figure 5. Relationship between fire size and proportion of high-severity fire (HSp). (a) Fitted relationships are for models using fires that burnt more than 1000 ha (black line), between 1000 and 20 000 ha (blue line) and greater than 20 000 ha (red line) of native woody vegetation. Lines show the fitted mean and shaded polygons show the 95% confidence intervals derived using bootstrapping (n = 1000 simulations). Statistically significant relationships are depicted with solid lines and non-significance is depicted with broken lines. The red and blue circles show fires greater and less than 20 000 ha, respectively. (b) Boxplots showing variation in HSp across four fire size classes. Boxplots depict the median (bold line), mean (white circle), quartiles (box) and extreme values (whiskers). The bold horizontal bars on the whiskers are the 2.5th and 97.5th percentiles.
Download figure:
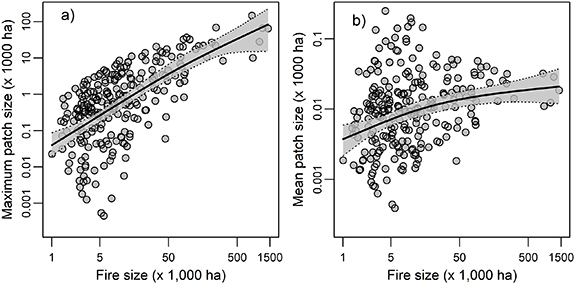
Standard image High-resolution imageThe maximum size of high-severity patches increased with wildfire size (χ2 4.87 = 524.908, n = 247, p < 0.001), whereas the mean size of high-severity patches showed a somewhat asymptotic relationship with fire size, ranging between 160 and 200 ha for mega-fires (χ2 3.69 = 37.163, n = 247, p < 0.001) (figure 6). The maximum size of high-severity patches ranged between 8431 and 148 681 ha for mega-fires (mean = 38 005 ha), which exceeded the median size of large fires considered in the study (i.e. 7417 ha).
Figure 6. Relationship between wildfire size and (a) maximum and (b) mean high-severity patch size. Lines show the fitted mean and shaded polygons show the 95% confidence intervals derived using bootstrapping (n = 1000 simulations).
Download figure:
Standard image High-resolution image
4. Discussion
Extreme fire seasons characterised by mega-fires have shaped contemporary fire regimes across the temperate forest biome of south-eastern Australia, owing to their disproportionate contribution to area burnt [5, 7]. By considering the 2019/2020 season in the context of the last 33 fire seasons, we have developed insight into the nature of extreme fires in terms of their severity. Our analysis reveals that the 2019/2020 fires were not proportionally more severe than previous fires (1988–2019), owing to the constant scaling between high-severity fire and annual fire extent across the fire prone dry-forest communities. However, the sheer size of the 2019/2020 fires means that an unprecedented area of south-eastern Australia experienced high-severity fire in a single season. These fires account for almost half (∼44%) the high-severity fire experienced in the past 33 years, demonstrating the potentially transformative effects of extreme fire seasons on fire regimes and Australian ecosystems [2].
The vast expanse of high-severity fire recorded during the 2019/2020 season will leave a severe and long-lasting imprint on native vegetation communities across south-eastern Australia. The loss of canopy cover and vegetation structure will have immediate impacts on ecosystem condition and function, including substantial emissions of greenhouse gases, loss of habitat and biodiversity, and increased surface water flow and likelihood of erosion [2]. Although vegetation communities across south-eastern Australia are characteristically resilient to wildfire [39], the time required for vegetation to recover to pre-fire conditions will vary considerably. For example, the time required for the recovery of canopy structure and biomass following high-severity fire in communities dominated by eucalypts that are obligate seeders (e.g. E. regnans, E. delegatensis) or basal resprouters (e.g. E. pauciflora; >100 years) can be an order of magnitude greater than in forests dominated by epicormic resprouters (i.e. 10–20 years) [40, 60]. The severity and longevity of such impacts will be considerably less in areas affected by low-severity fires that do not exceed the resistance thresholds of canopy species [25, 29]. Thus, while ecosystem recovery may be rapid across much of the biome (e.g. dry- and wet-eucalypt forests), it may take centuries across some fire-sensitive communities affected by high-severity fire (e.g. rainforest and montane woodlands) [40].
Fire refugia are critical for the survival and persistence of many populations of fire-sensitive plants and animals within the fire perimeter [61]. Initial assessments of biodiversity loss arising from the 2019/2020 fires, which did not account for fire severity, paint an extremely grim picture e.g. nearly 3 billion animals impacted and substantial loss of habitat for many threatened fauna [37, 62]. A positive message arising from our analysis is that ∼9% of the total mapped extent of the fires remained unburnt and a further 28% experienced low canopy scorch (i.e. minimal disturbance to the canopy). The large extent of the 2019/2020 fires will undoubtably elevate the importance of fire refugia for population recovery of fire-sensitive fauna with poor dispersal ability [27]. The protection and management of unburnt and minimally affected habitat both within and surrounding the 2020 fire perimeters should be of high priority for decades to come [37].
There has been a common misconception that mega-fires burn homogeneously at high-severity, owing to the occurrence of expansive 'runs' of high-intensity fire during these events [14, 15]. We found that extreme fire seasons characterised by mega-fires display heterogeneous fire severity patterns, with high-severity fire rarely exceeding 50% of the total fire extent. Mega-fires typically burn for several weeks or months across complex terrain and fuel types under a broad range of weather conditions, resulting in a high degree of heterogeneity in fire behaviour and severity across the fire extent (figure 1) [15, 63]. Consequently, mega-fires display a more balanced and less variable composition of high- and low-severity fire than other fires (i.e. <100 000 ha; figure 5(b)), as smaller fires typically burn under a more restricted range of environmental conditions. These results are important, given that many regions globally are experiencing an increased incidence of mega-fires, e.g. California [64], Chile [65], Canada [3], Portugal [66] and Siberia [67]. However, the positive correlation between the maximum size of high-severity patches and wildfire size, highlights that mega-fires will have widespread and severe impacts on ecosystems within burned areas (figure 1). Many of these large (>10 000 ha) patches of high-severity fire are the result of extreme fire behaviour occurring during pyroconvective events [68], which although rare, are commonly associated with mega-fire development in Australian forests (e.g. 2003, 2007, 2009 and 2020 mega-fires) [1, 21, 68]. Similar relationships between high-severity patch size and wildfire extent have been observed across the forested biome of North America [17, 69]. Further, in the same region, there is no evidence of changes in fire intensity (which influences fire severity) in recent history, despite increases in fire size and frequency over the same period (2003–2016, [4]).
We found evidence that high-severity fire had a proportionally greater contribution to area burnt during extreme fire seasons within specific vegetation communities, which is consistent with observed fire severity patterns elsewhere (e.g. Western United States; [17, 70]). Wet-forest, woodland and rainforest communities had an increased propensity for high-severity fire with increasing annual area burnt. This likely reflects the impact of extreme antecedent drought on the flammability of mesic microclimates occupied by these communities [48]. Fire extent within temperate forests and woodlands is strongly constrained by fuel moisture [71, 72], which varies as a function of drought and microclimate [73, 74]. In wet-forests, rainforests and montane woodlands, high spatial connectivity of dry fuel is confined to periods of extreme drought coupled with low relative humidity [48], which are conditions that are favourable for high-intensity fire [75, 76]. In contrast, the dry-forest communities burn under a much broader range of weather conditions [48], resulting in heterogenous fire severity patterns, irrespective of fire size.
Extreme fire seasons may have profound consequences for the conservation of temperate rainforests across south-eastern Australia. Although many rainforest trees can resprout following low-severity fire, they are top-killed by intense fires that cause high canopy scorch or consumption, with most species lacking the capacity to recruit following these extreme events [39]. The 2019/2020 fires may have transformed between 15% and 23% (28 043–42 962 ha) of temperate rainforest to an alternative state, requiring centuries for recovery, if recovery is at all possible under south-eastern Australia's drying climate [77]. Increasing drought, coupled with large wildfires, will undoubtably result in the contraction of temperate rainforest communities, many of which are World Heritage listed, to the most fire-resistant topographic refugia in the future [77, 78].
Large and extreme wildfires typically occur across temperate forests when periods of extreme fuel desiccation (i.e. drought) coincide with weather conditions that promote rapid fire spread, such as severe surface fire weather or conditions that facilitate fire-atmosphere coupling (i.e. pyroconvective fires) [68, 72, 79]. Climate change is projected to increase the length and severity of drought and increase the frequency of days with severe fire weather and conditions conducive to the development of pyroconvective fires across large areas of south-eastern Australia [33, 68, 78]. Consequently, fire size, annual area burnt and fire intensity are projected to increase over the coming decades [80–82], with greater exposure of ecosystems to high-severity fire being a probable outcome, owing to the proportionality between area burnt and high-severity fire (figure 4) [83]. Fire severity patterns in rainforest, wet-forest and montane woodland communities may show greater sensitivity to the effects of increased area burnt under climate change than dry-forest communities. Although feedbacks between vegetation, climate and fire have the potential to mitigate the effect of climate change on fire extent and severity [84, 85], broadscale climate and fire-induced fuel limitation appears unlikely across much of south-eastern Australia this century [82, 86].
5. Conclusions
The 2019/2020 fires have substantially increased area burnt across forested regions of south-eastern Australia [5, 7], exposing approximately 14% (1.8 M ha) of native woody vegetation across the study biome to the effects of high-severity fire. These fires account for almost half the high-severity fire recorded over the 33 year study period, highlighting that their impact on ecosystem structure and function will greatly exceed that of recent major fire seasons across south-eastern Australia (i.e. 2003, 2007 and 2009). Despite the extent of high-severity fire, fire severity patterns displayed considerable heterogeneity, with areas of unburnt and minimally impacted vegetation offering opportunities for the persistence and recovery of fire sensitive organisms. Observed proportionality between area burnt and high-severity fire suggests that increased fire activity over recent decades has resulted in increased exposure of ecosystems to high-severity fire [5, 83], as has been observed across forested regions elsewhere [17, 87]. Identification and implementation of management actions that increase ecosystem resistance to high-severity fire will likely be necessary to mitigate the elevated risk of extreme fire seasons in the future [2, 88].
Acknowledgments
L C was supported by Post-doctoral Fellowships at La Trobe University and Arthur Rylah Institute, and the University of Melbourne. We thank Dr Rebecca Gibson for compiling the vegetation mapping and assisting with validation of fire severity mapping in New South Wales. We thank Dr Ashley Sparrow for providing feedback on an earlier draft of the manuscript.
Data availability statement
The data that support the findings of this study are available upon reasonable request from the authors.
Author contributions
L C, R A B, H C, M F C, R H N and T D P conceived the ideas for the paper. L C undertook the analysis and led the writing. R A B, H C, M F C, R H N and T D P contributed to writing the paper.