
Effects of Soil Nitrogen Addition on Crown CO2 Exchange of Fraxinus mandshurica Rupr. Saplings
by
 , ,
, ,
Chunjuan Gong
1,2 ,
,
Anzhi Wang
1,
Fenghui Yuan
1,
Yage Liu
1,2,
Chen Cui
1,2,
Kai Zhu
3,
Dexin Guan
1,* and
Jiabing Wu
1 1
Key Laboratory of Forest Ecology and Management, Institute of Applied Ecology, Chinese Academy of Sciences, Shenyang 110016, China
2
College of Resources and Environment, University of Chinese Academy of Sciences, Beijing 100049, China
3
College of Resources and Environment, Shanxi Agricultural University, Jinzhong 030801, China
*
Author to whom correspondence should be addressed.
Forests 2021, 12(9), 1170; https://doi.org/10.3390/f12091170
Submission received: 16 July 2021
/
Revised: 24 August 2021
/
Accepted: 26 August 2021
/
Published: 29 August 2021
(This article belongs to the Special Issue How Environmental Conditions Affect Photosynthesis of Tree Species – Limitations and Potentials)
Abstract
:The impact of atmospheric nitrogen deposition on carbon exchange between forest and atmosphere is one of the research hotspots of global change ecology, past researchers have extensively studied the impacts on leaf level, while the impacts on crown CO2 exchange are still unclear. Therefore, we explored the impacts of different nitrogen addition levels on crown CO2 exchange of Fraxinus mandshurica saplings and their responses to the changes of major meteorological factors (photosynthetically active radiation, PAR; vapor pressure deficiency, VPD; and air temperature, Tair) with a novel automated chamber system. There are four levels of nitrogen addition treatments: control (no nitrogen addition, CK), 23 (low nitrogen addition, LN), 46 (medium nitrogen addition, MN), and 69 kgN·hm−2·a−1 (high nitrogen addition, HN). Our results showed that all nitrogen addition treatments increased daily average and accumulated gross primary production (GPP), crown respiration (R), and net crown CO2 exchange (Ne), especially at medium and high nitrogen levels. Similarly, maximum net photosynthetic rate (Nemax) and apparent quantum efficiency (α) were promoted. The change of Ne with PAR, Tair, and VPD showed that nitrogen addition postponed the appearance of photosynthesis midday depression. In addition, the monthly accumulation of R with all nitrogen addition treatments showed an increasing trend (June to July), and then decreased (July to September) during the growing season, while the Ne and GPP decreased gradually with seasonal vegetation senescence. Finally, the crown shifted from carbon sink to carbon source at the end of the growing season, however, the change under high nitrogen treatment occurred 3 days later. The crown CO2 exchange measurements provide a new perspective to better understand the response of forest ecosystem CO2 exchange to elevated nitrogen deposition and provide a basis for related carbon model parameter correction under the influence of nitrogen deposition.
1. Introduction
In recent years, the atmospheric nitrogen deposition rate has risen dramatically due to rapid agricultural, industrial, and urban development. The monitoring study found that the nitrogen deposition of European forests was 25–60 kg N·hm−2·a−1 [1], and that of Los Angeles forests was 35–50 kg N·hm−2·a−1 [2], the annual bulk nitrogen deposition in China has increased from 13.2 kg N·hm−2·a−1 in the 1980s to 21.1 kg N·hm−2·a−1 in the 2000s [3]. Forests are the most important part of terrestrial ecosystems and the direct carriers of nitrogen deposition. Increasing enhanced atmospheric nitrogen deposition increases the availability of nitrogen in forest ecosystems and affects the carbon cycle by influencing the photosynthesis and respiration of plant’s canopy leaves [4,5,6,7].
For now, there are some routine methods to predict changes in forest carbon cycles, including eddy covariance techniques and biomass survey methods [8,9]. However, the eddy covariance technology needs large homogenous areas to be applied and is not suitable for control experiments with multi-plot grades. In addition, low friction velocity (laminar conditions) often makes consistent measurements difficult during night-time [10,11,12]. Wang et al. [13] found the eddy covariance approach, compared with the biometric and chamber methods, overestimated net ecosystem production by 25%, and underestimated ecosystem respiration by 10% and gross primary production by 3%. The differences between eddy covariance and the other methods were greater at the sites with complex topography and dense canopy than at the sites with flat topography and open canopy. Some other studies on biomass carbon sink and net ecosystem production estimation based on forest inventory data at the regional scale have developed considerably [14,15], however, which is limited in terms of replication (due to labor-intensive) and time resolution (often performed over annual or longer time intervals) [16]. In addition, this method is difficult to explain the influence of different factors on forest carbon source and sink changes in mechanism, especially in the context of global climate change.
Therefore, substantial researches have recently been conducted on the effects of nitrogen deposition on the forest canopy carbon cycle at the leaf level [17,18,19]. Nevertheless, single-leaf measurements can be problematic for several reasons. First, the forest ecosystems usually have high heterogeneity due to the complexity of vegetation. Not only do environmental factors such as sunlight, temperature and humidity, wind speed, and wind direction in the forest have spatial gradients, but they also have the characteristics of time gradients. Changes in these environmental factors will directly affect the gas exchange characteristics of plants [20]. Additionally, carbon assimilation generally varies with different parts and different azimuth blades (e.g., due to differences in stomatal distribution) [21,22]. Furthermore, the leaf-chamber measurements were discontinuous (once every few days and even to once a month), which ignores the carbon assimilation rate dependent upon the age and developmental stage of the plant [23].
Such limitations can be avoided by using a novel automatic-chamber system, which allows long term and continuous monitoring of changes in net photosynthetic and respiration of the canopies under different meteorological conditions at a whole plant scale. This way not only quantitatively evaluates the impact of environmental changes on the physiological and biochemical processes of a single plant, but is also the key to linking single leaf scale and ecosystem scale. Most importantly, it can provide a reference to accurate estimation of gas exchange between different scales. Now, chamber systems to measure gas exchange in plants have been developed for different species such as grass and crops, while there were few studies carried on tree crowns and which do not isolate root respiratory CO2 production from photosynthetic CO2 assimilation [24,25,26,27,28]. Therefore, it is necessary to study the photosynthesis and respiration of trees crown to reliably predict changes in the forest carbon cycle under conditions of elevated atmospheric nitrogen deposition.
Manchurian ash (Fraxinus mandshurica Rupr.) is one of the most economically important forest tree species and is primarily distributed in the temperate forests of the northern hemisphere [29]. It is not only a high-quality material for decoration, but also an important tree species for landscaping [30]. In this study, we used automatic observation chambers to measure the net crown CO2 exchange rate of Fraxinus mandshurica saplings (Ne) and meteorological factors continuously in high frequency during the growing season. Our objectives were to explore (1) the impact of nitrogen addition levels on the net crown CO2 exchange rate of saplings, and (2) the impact of the main driving variables (air temperature, photosynthetically active radiation, and vapor pressure deficit) on the net crown CO2 exchange rate under different nitrogen addition levels. We expect to provide a basis for forest ecosystem carbon budget estimation and related carbon model parameter correction under the influence of nitrogen deposition.
2. Materials and Methods
2.1. Study Site
The experiment was conducted from 1 June (Julian Day 151) to 30 September 30 (Julian Day 273) in 2019 in the Shenbei New District of the Institute of Applied Ecology, Chinese Academy of Sciences, located in Shenyang, Liaoning Province, Northeast China (123°60′ E, 41°91′ N). The region has a temperate subhumid continental climate, a mean annual air temperature of 11.3 °C, and an average annual precipitation of 760 mm.
2.2. Experimental Materials and Nitrogen Treatments
Three-year-old saplings with similar growth status were grown in pots, each with a volume of 14.9 L (26.0 cm height, 26.0 cm bottom diameter, 28 cm top diameter) and containing 14 L of soil used in the experiment. The initial height and stem base diameter of the saplings were 71.38 ± 3.01 cm and 12.63 ± 0.20 mm, respectively. The carbon (C) and nitrogen (N) of the soil were 1.19 ± 0.30 and 0.12 ± 0.03 g·kg−1 and C/N ratio being 8.79 ± 0.43, available phosphorus being 0.47 ± 0.04 g·kg−1, containing poor biological productivity. Based on the average nitrogen deposition in the area, we set four nitrogen addition levels, control (CK), 23(LN), 46(MN), and 69 kgN·hm−2·a−1 (HN), which were applied as the nitrogen treatments. Each treatment had three replicates and were placed in chambers in rotation every ten days. Owing to the main nitrogen sources for plants in nature are ammonium and nitrate nitrogen, an NH4NO3 solution was used to simulate nitrogen deposition [31]. In addition, the impact of atmospheric nitrogen deposition on the ecosystem is a slow and long-term accumulation process, one-time or only several times nitrogen addition may overestimate the effect of nitrogen [32]. Therefore, ammonium nitrate solutions were sprayed ten times into the pots, with a time interval of about ten days, with 100 mL per pot from June to September in 2019. Control trees were sprayed with the same volume of nitrogen-free water. All plots were in the chambers and exposed to the same temperature, light, precipitation, and other environmental factors. The top windows of chamber were closed, only with two side windows open, so the plants were hardly affected by atmospheric nitrogen deposition. Saplings were watered and weeded regularly during the growing seasons so that soil water content remained relatively high and the seedlings were not water limited.
2.3. Measurement of Whole Crown CO2 Exchange
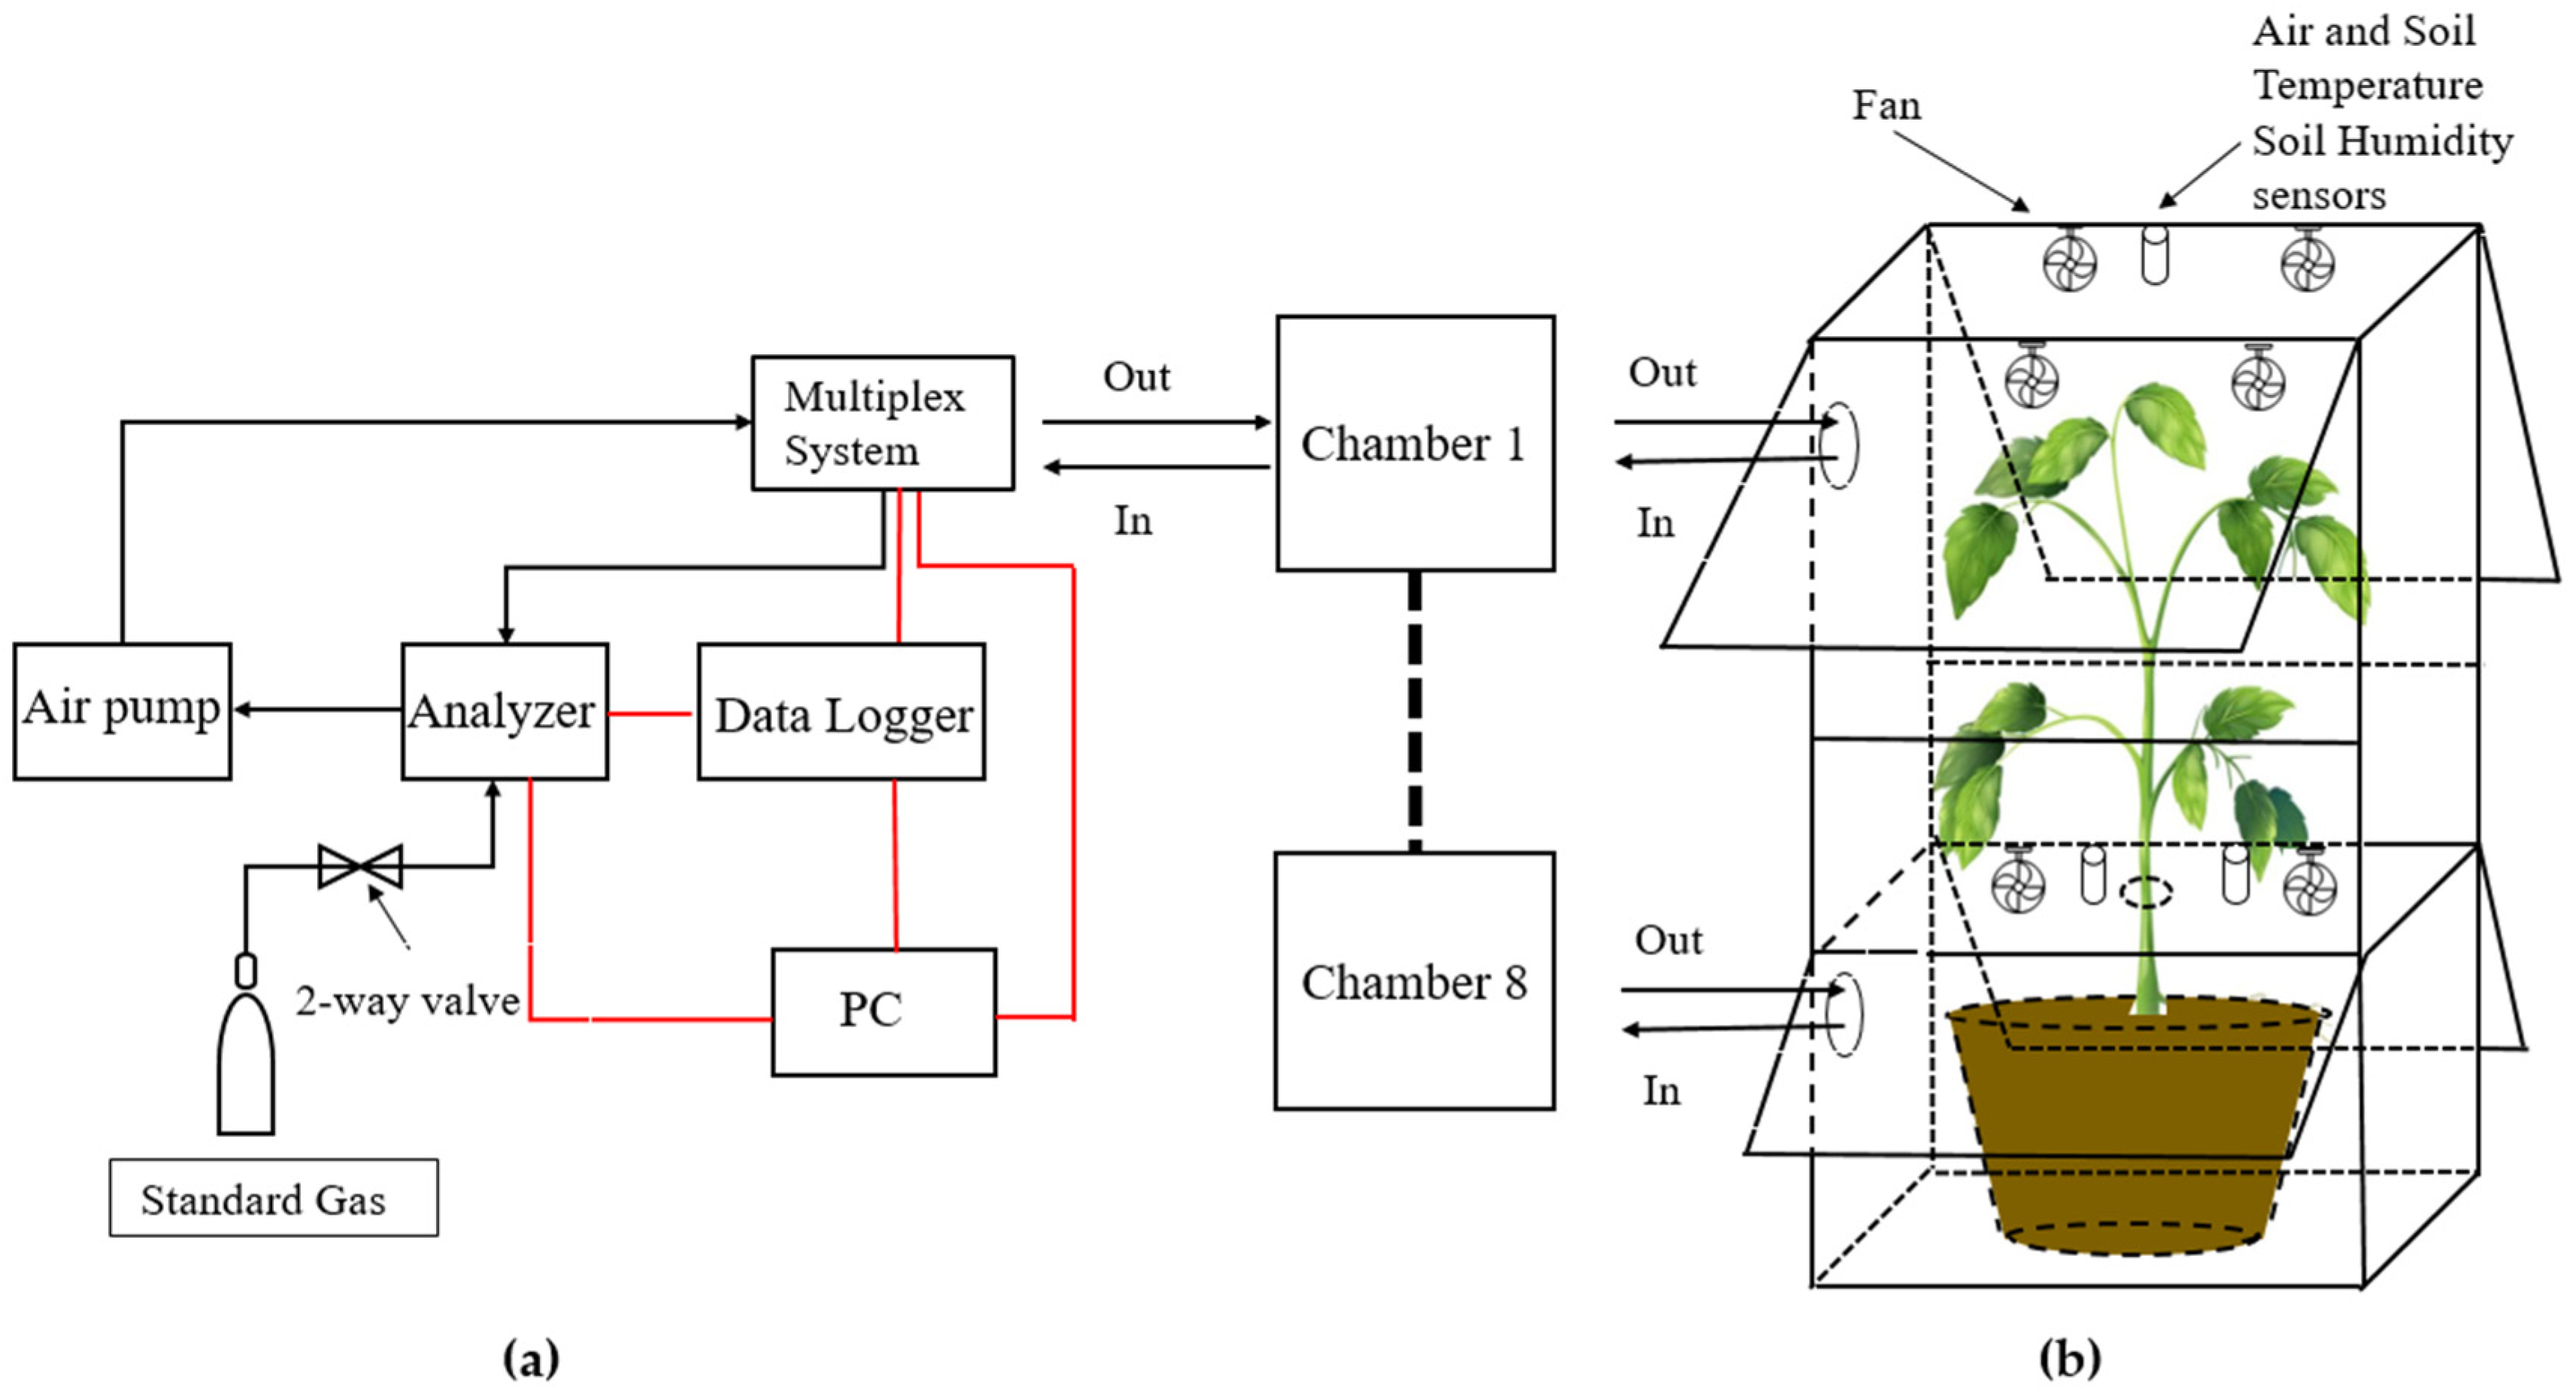
The fully automated observation system used in this study offers a means of continuous measurements at short intervals (18 times per day at 1.5 h interval), allowing not only day and night-time high-frequency measurements, but also measurements in special weather conditions (e.g., hot and raining days). The system consists of eight whole-plant chambers, a high precision Picarro G2508 analyzer (Picarro, Inc., Santa Clara, CA, USA) based on cavity ring-down spectroscopy (CRDS) [33] (Picarro Inc., 2013), a multiplex system (PRI-8160, Beijing Pri-eco Technology Co., Ltd., Beijing, China), an air pump A2000 (Picarro Inc., Santa Clara, CA, USA), and a computer for data acquisition. The multiplex system controlled the closure of different chambers and the switching of air channels, as well as temperature and humidity sensors. Driven by the air pump, the air in the closed chamber passed through the multiplex system air inlet port, analyzer, pump, and the multiplex system air outlet port and then returned to the chamber, forming a closed-circuit system. A schematic overview is shown in Figure 1a. The Picarro G2508 Greenhouse Gas Analyzer was used to measure concentration changes of CO2 and H2O in the chamber.
Each chamber consisted of a cuboidal aluminum frame and transparent PVC board (2 mm), with light transmission in the visible range of 90%. The chamber was a square cube with a base area of 90 × 70 cm, which was divided into two sections by transparent acrylic plate; the top section was 100 cm high, the bottom section was 60 cm. Likewise, the tree crown (in top section) was separated from the roots and soil (in the bottom section) by transparent acrylic plate, through which the tree trunk passes, allowing gas exchange measurements of the whole crown while excluding CO2 released from the root respiration. Electric fans were running continuously to promote air mixing within the chamber. Each chamber had four windows (two for both the top and bottom sections) that were open except when monitoring Ne to ensure air circulation and reduce the heating effect in the chamber under the light. A schematic overview is shown in Figure 1b. All raw data were recorded every 1–2 s and displayed in real time on a monitor, collected through a custom LabVIEW application, and automatically saved in user-determined forms. Data were continuous except for short periods when power was lost (about 170 h). In this paper, only the observation results of the crown (top-section of the chamber) were analyzed. Each chamber measured Ne for 6 min each hour, and 15 data points were collected each day. The chambers were cleaned at least once a week, and the Picarro high-precision analyzer was calibrated to 380 ppm CO2 once a month.
In order to avoid the influence of gas path pollution by the air from the previous sample remaining in the flow path, invalid data were eliminated in the first 80 s and end 10 s of each 6 min sampling. During measurement, the CO2 concentration in the top-section chamber was allowed to draw down in the daytime due to photosynthesis or build up in the night-time due to respiration over time, from which net crown carbon exchange rate was determined from the time series of the concentration as follows:
where F is the value of instantaneous flux and the unit is g Cm−2 s−1, P0 and T0 are the pressure (101.325 kPa) and absolute air temperature (273.15 K) under standard condition respectively, P and Tair are the pressure and absolute temperature values at the time of sampling respectively, dc/dt is the slope of CO2 concentration over time, α = 1.963 is the unit conversion coefficient of CO2 gas, and V is closed-circuit system volume (chamber, Picarro chamber and airway). A is the total leaf area of the saplings, which was calculated as follows: leaves of each sapling were divided into three grades: large, medium, and small, and the leaf area was calculated using the digital image processing technique (Image J 1.51j8, National Institutes of Health, Bethesda, MD, USA).
2.4. Meteorological Factors in the Chamber and at the Site
Air temperature sensors (HMP45C, Vaisala, Finland) were installed in the upper chamber to monitor the air temperature in real time. Soil temperature (8600-201, Beijing Puriyike Technology Co., Ltd., Beijing, China) and moisture (EcH2O EC-5, Decagon Devices, Pullman, WA, USA) at 10 cm depth in each bottom chamber were also measured. Site meteorological factors, including air temperature, humidity (HMP45C, Vaisala, Finland), and photosynthetically active radiation (PAR) (LI-190Sb, Licor Inc., Lincoln, NE, USA) of 1.5 m height were provided by a meteorological station about 15 m away from the experimental plots. A data logger (CR1000, Campbell Scientific, Logan, UT, USA) was used to collect data every minute, which were stored every 10 min on average.
2.5. Calculation of Daily and Monthly GPP, R and Ne
The CO2 flux value measured during the day was the net crown CO2 exchange rate (Ne), and at night was the night-time crown respiration (Rn). The relationship between crown respiration Rn and air temperature (Tair) was expressed as an exponential function Equation (2) [34]:
where Rn is night-time crown respiration and Tair is night-time mean air temperature. The constants a and b are determined by using non-linear optimization.
Daytime crown respiration (Rd) was estimated by applying Equation (2) [35]. The sum of Rd and Rn was the total crown respiration (R = Rd + Rn). The Ne is the net carbon exchange in a definite temporal scale, crown absorption is defined as negative and crown release as positive. Gross primary productivity (GPP) was obtained as follows:
Plant CO2 exchange responding to light (or light response curve) was fitted by using a right-angle hyperbola model [36]:
where α is initial quantum efficiency, Nemax is maximum net photosynthetic rate of crown. The parameters, α, Nemax, and Rd were estimated by iteration method using Origin 8.0.
2.6. Gap Filling and Statistical Analysis
To calculate the daily and seasonal variations of Ne, it was necessary to interpolate missing values due to problems such as power outages and equipment failure. Linear interpolation was used to fill gaps that were shorter than 3 h. For longer gaps, Ne was filled based on the light-response curve to daytime data (PAR ≥ 5 μmol·m−2·s−1) with 10-days windows, and the night-time exchange (PAR < 5 μmol·m−2·s−1) was filled based on measured Tair with Equation (2) in whole measurement duration. For simple statistical analysis, Microsoft Excel functions were used. Correlation analysis was applied to check if environmental variables had an influence on light response parameters and analysis of variance was used to analyze the differences among nitrogen addition treatments in GPP, R and Ne, using SPSS 23.0 (SPSS Inc., Chicago, IL, USA).
3. Results
3.1. Meteorological Conditions
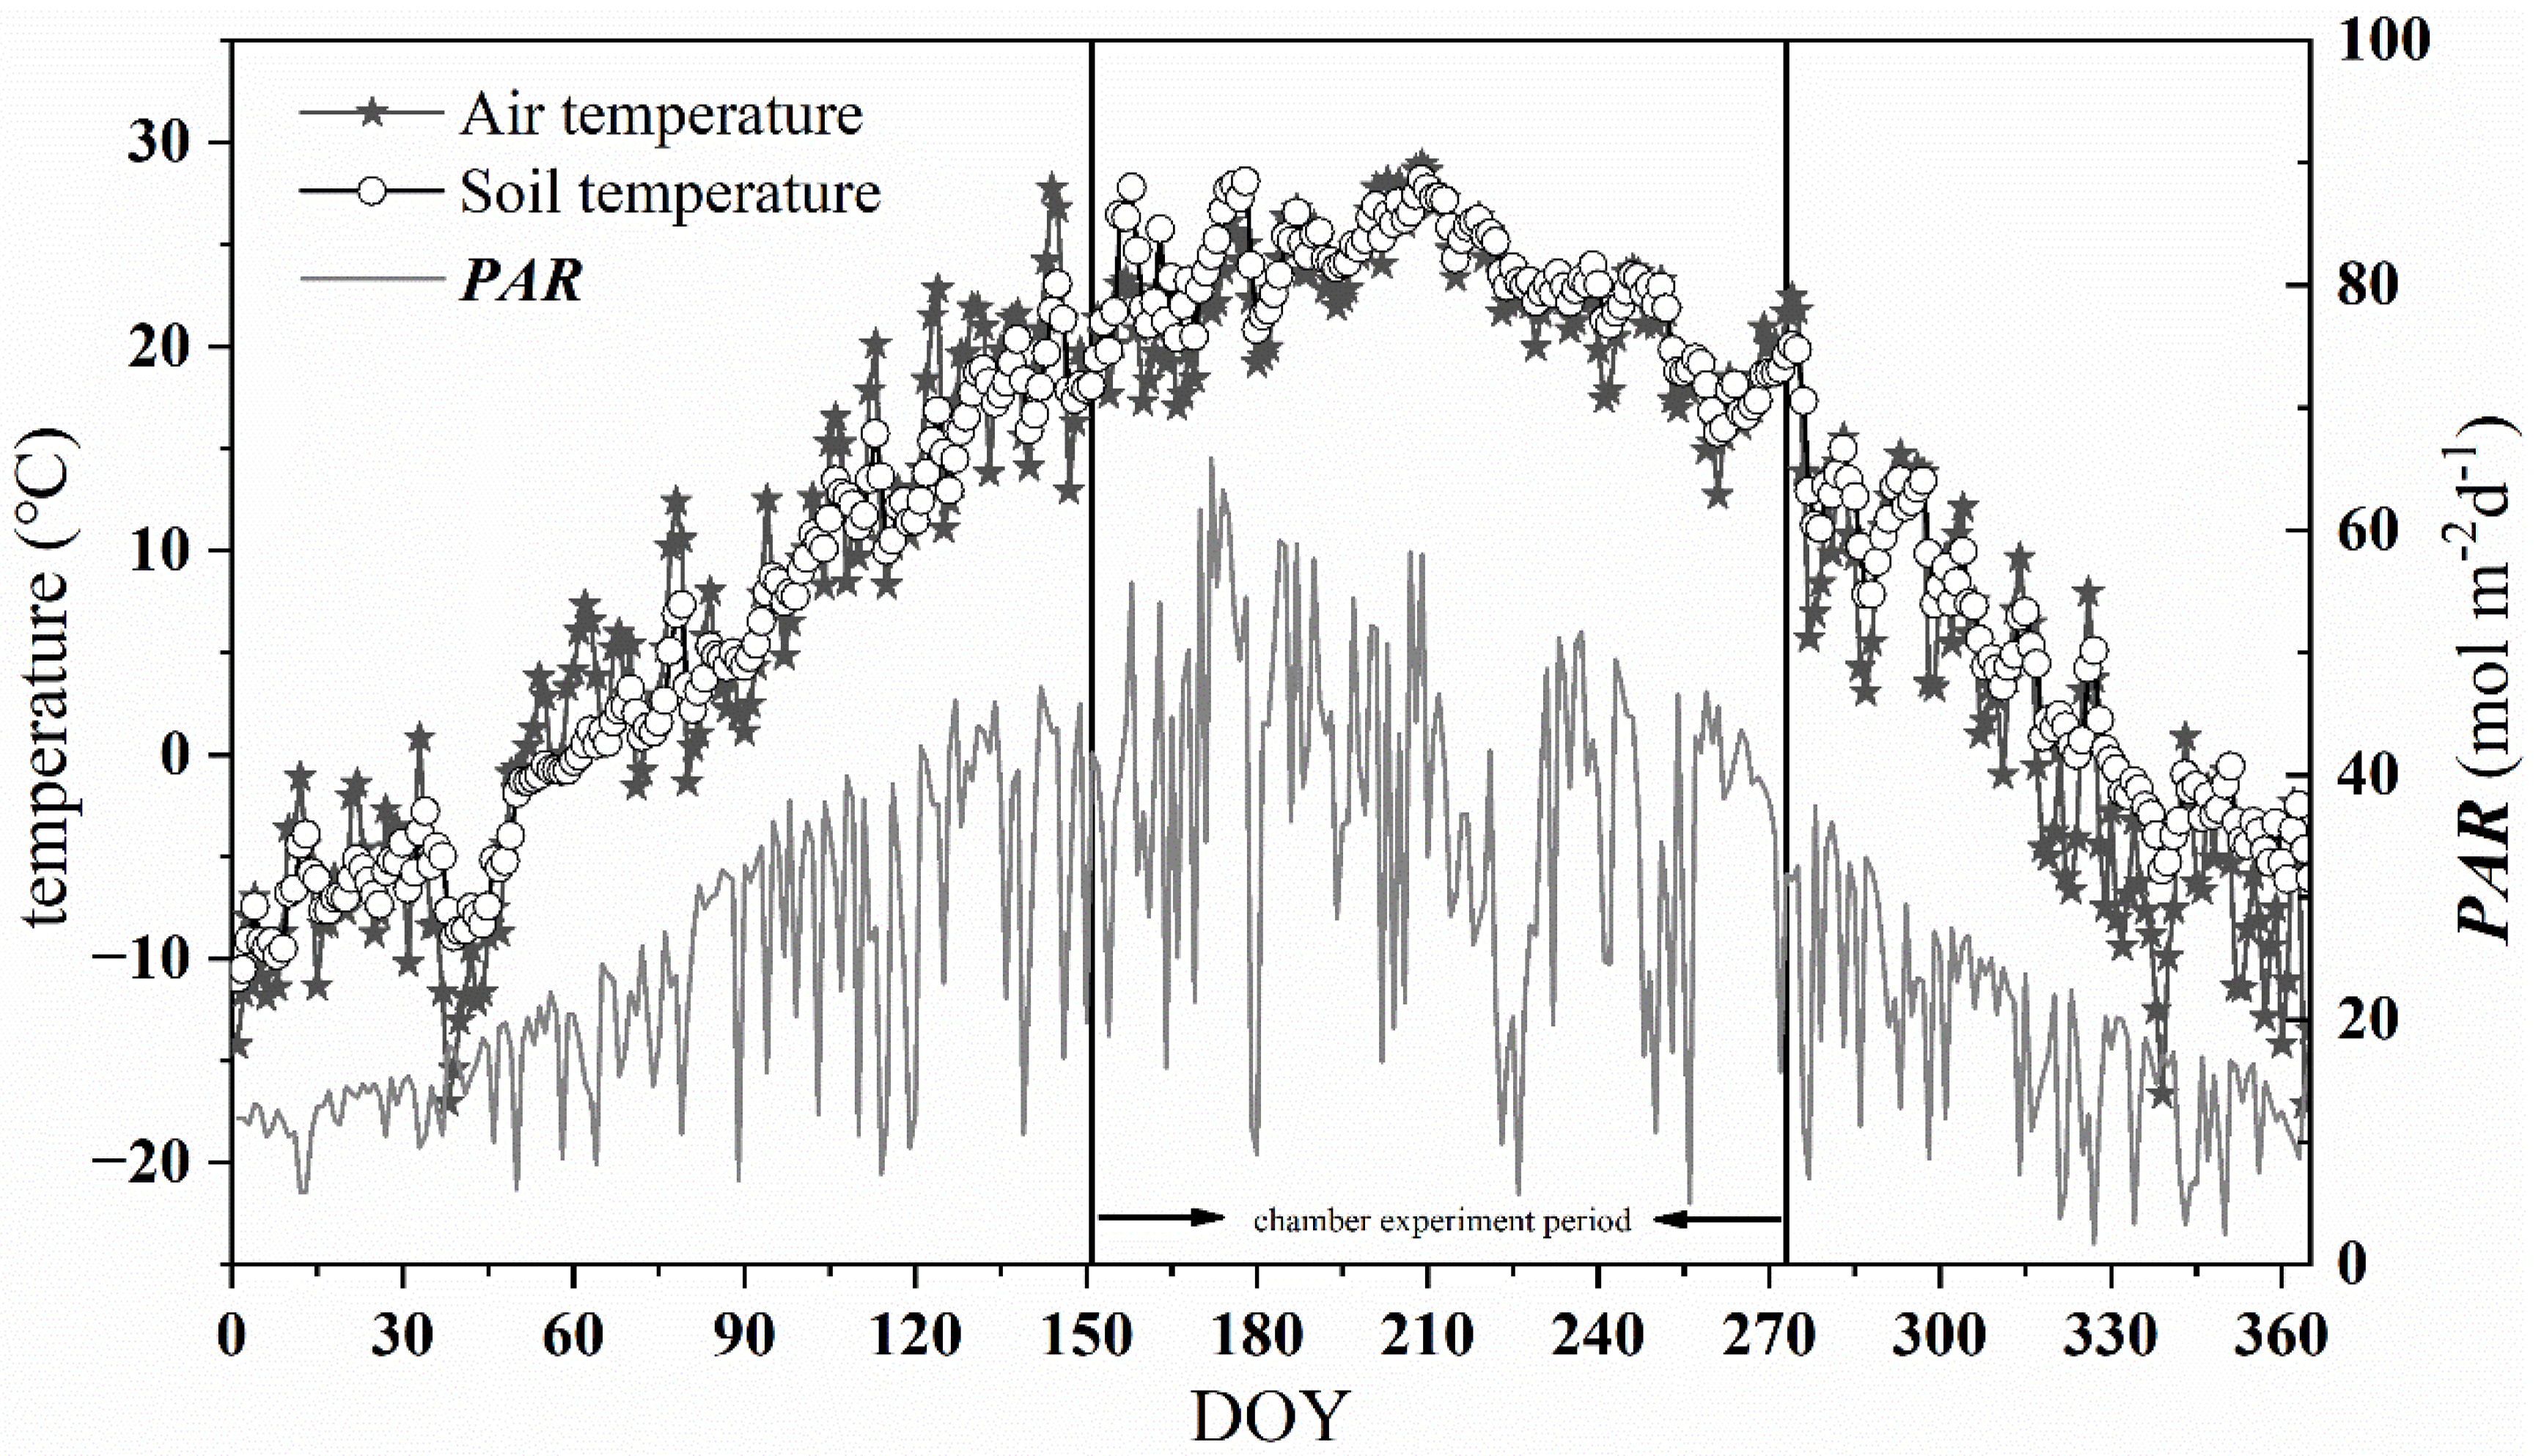
According to the measurement of the site meteorological station, we found the mean daily air temperature (Tair), soil temperature (Tsoil), and daily total PAR showed unimodal seasonal variation in the year (Figure 2). The mean annual air temperature and soil temperature were 9.4 °C and 10.2 °C, respectively. The daily mean air temperature ranged from −17.1 °C to 28.9 °C, with the highest in July and the lowest in December. The variation trend of Tsoil was consistent with that of Tair, but more gentle than that of Tair. The daily total PAR varied from 1.72 to 65.88 mol·m−2·d−1, with the peak value appeared in June.
3.2. The Influence of Chamber Closure on Meteorological Conditions
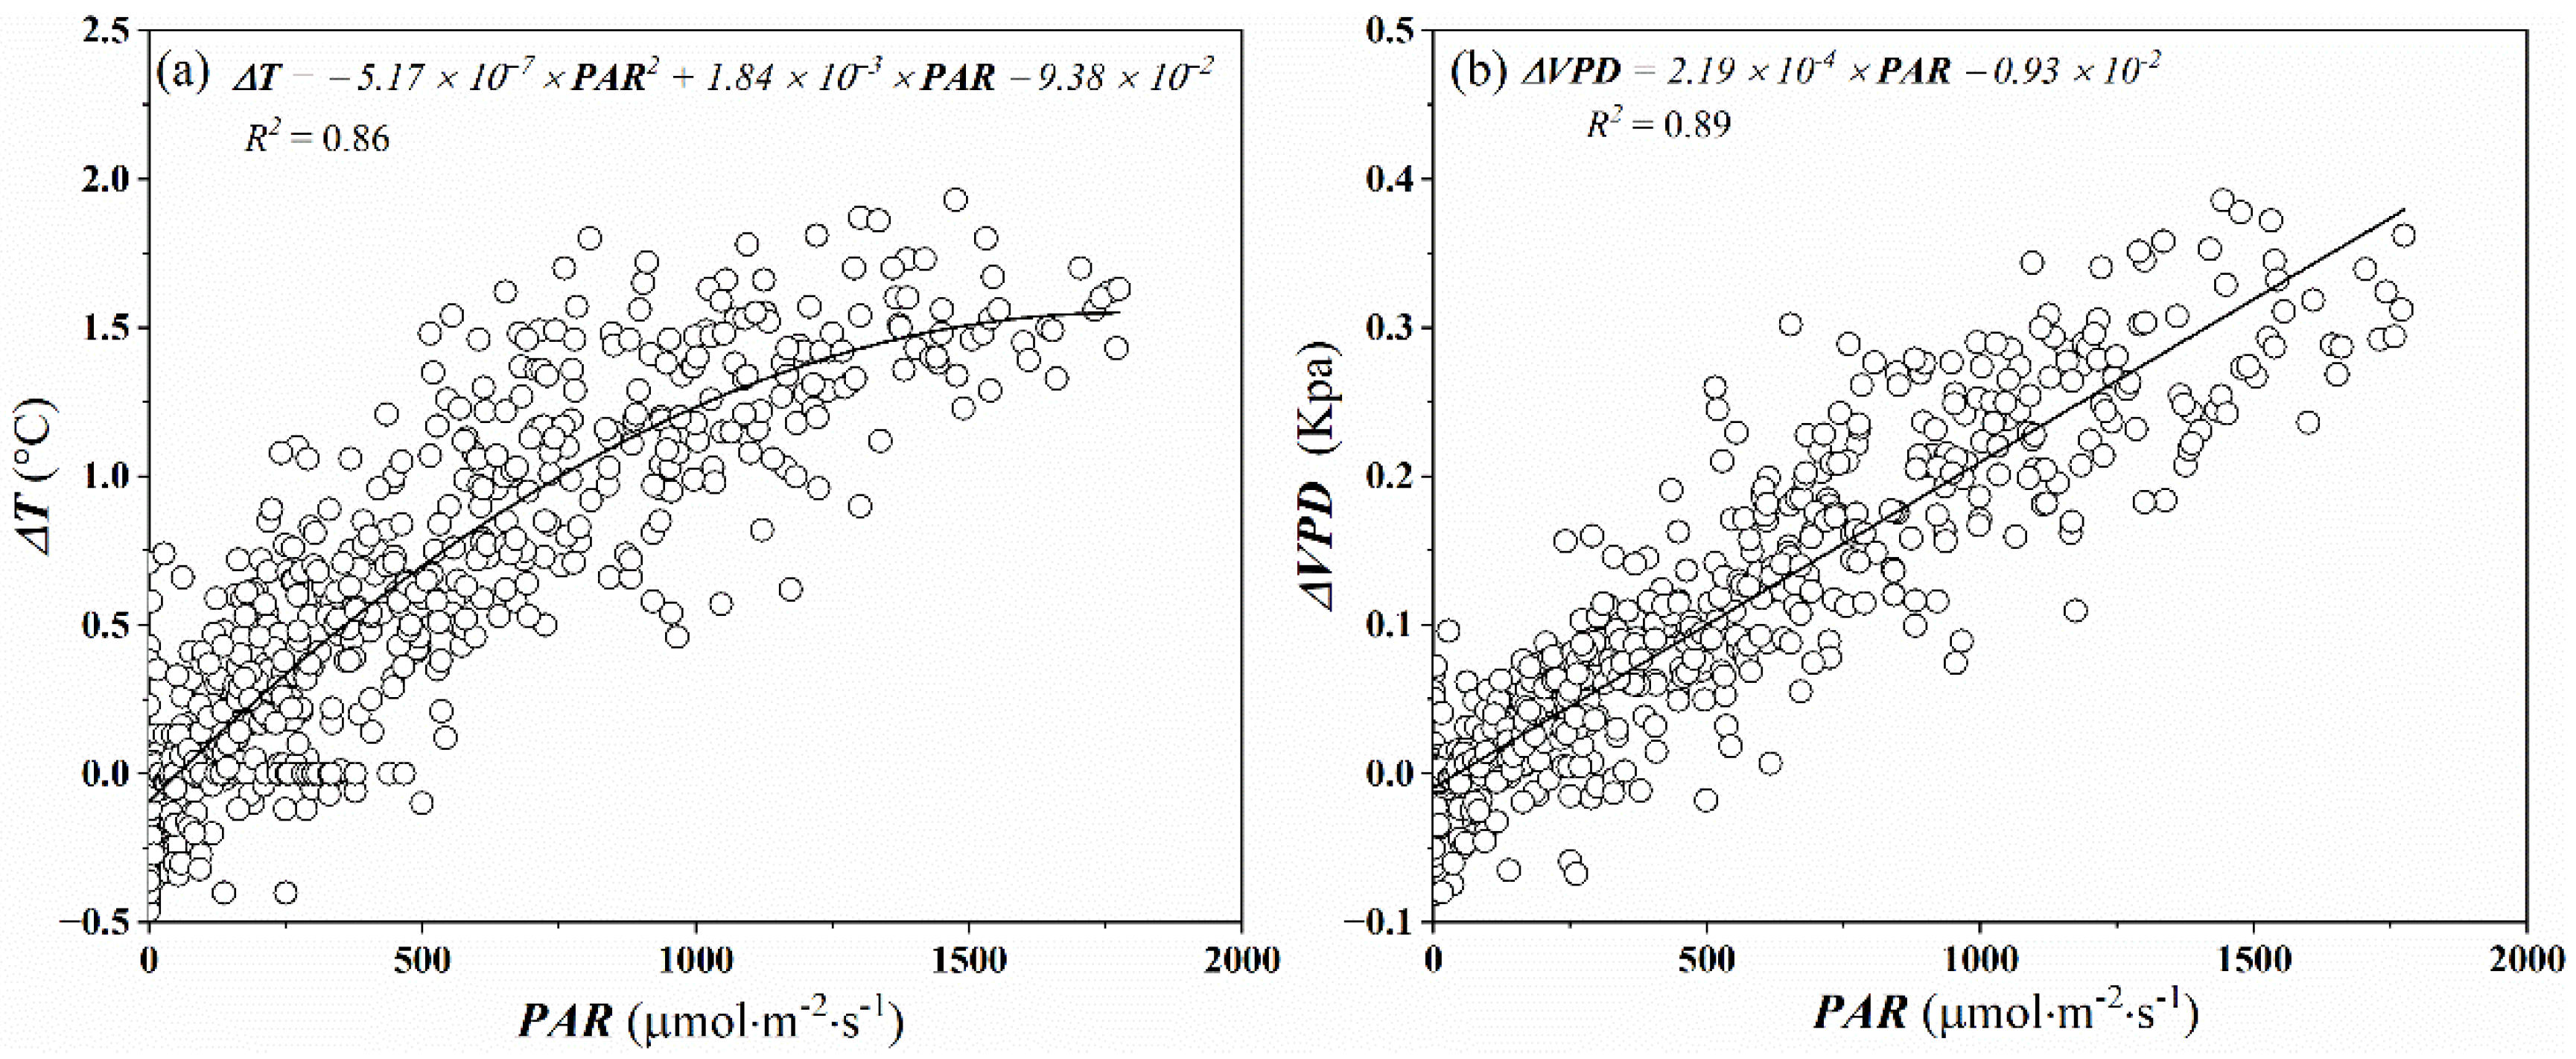
The chamber walls altered the energy balance between the chamber and the outside environment, producing a slight increase in air temperature inside the chamber. Low air temperature difference inside and outside the chamber (∆T) is desirable to make the environment within the chamber representative of the surrounding environment of plants evaluated. Burkart et al. [24] found the ∆T should be below 5 °C to avoid increasing evapotranspiration due to increasing sensible heat, and prevent substantial modification of the natural surrounding environment of plants evaluated within the chamber. In our experiment, although ∆T was non-linearly increased as PAR increased in the measurement interval (360 s), they were always below 2 °C (Figure 3a). The recorded ΔT was similar to that from a larger canopy chamber [25,37] and considerably lower than the 2–4 °C found in many other closed chambers [24,38,39]. Due to the increase of temperature in the chamber, increasing saturation vapor pressure and air humidity caused the increase of the VPD. The vapor pressure deficit difference inside and outside the chamber in our experiment was always below 0.4 kPa (Figure 3b).
3.3. Effects of Nitrogen Addition on GPP, R, and Ne
3.3.1. Diurnal Variation of Crown CO2 Exchange
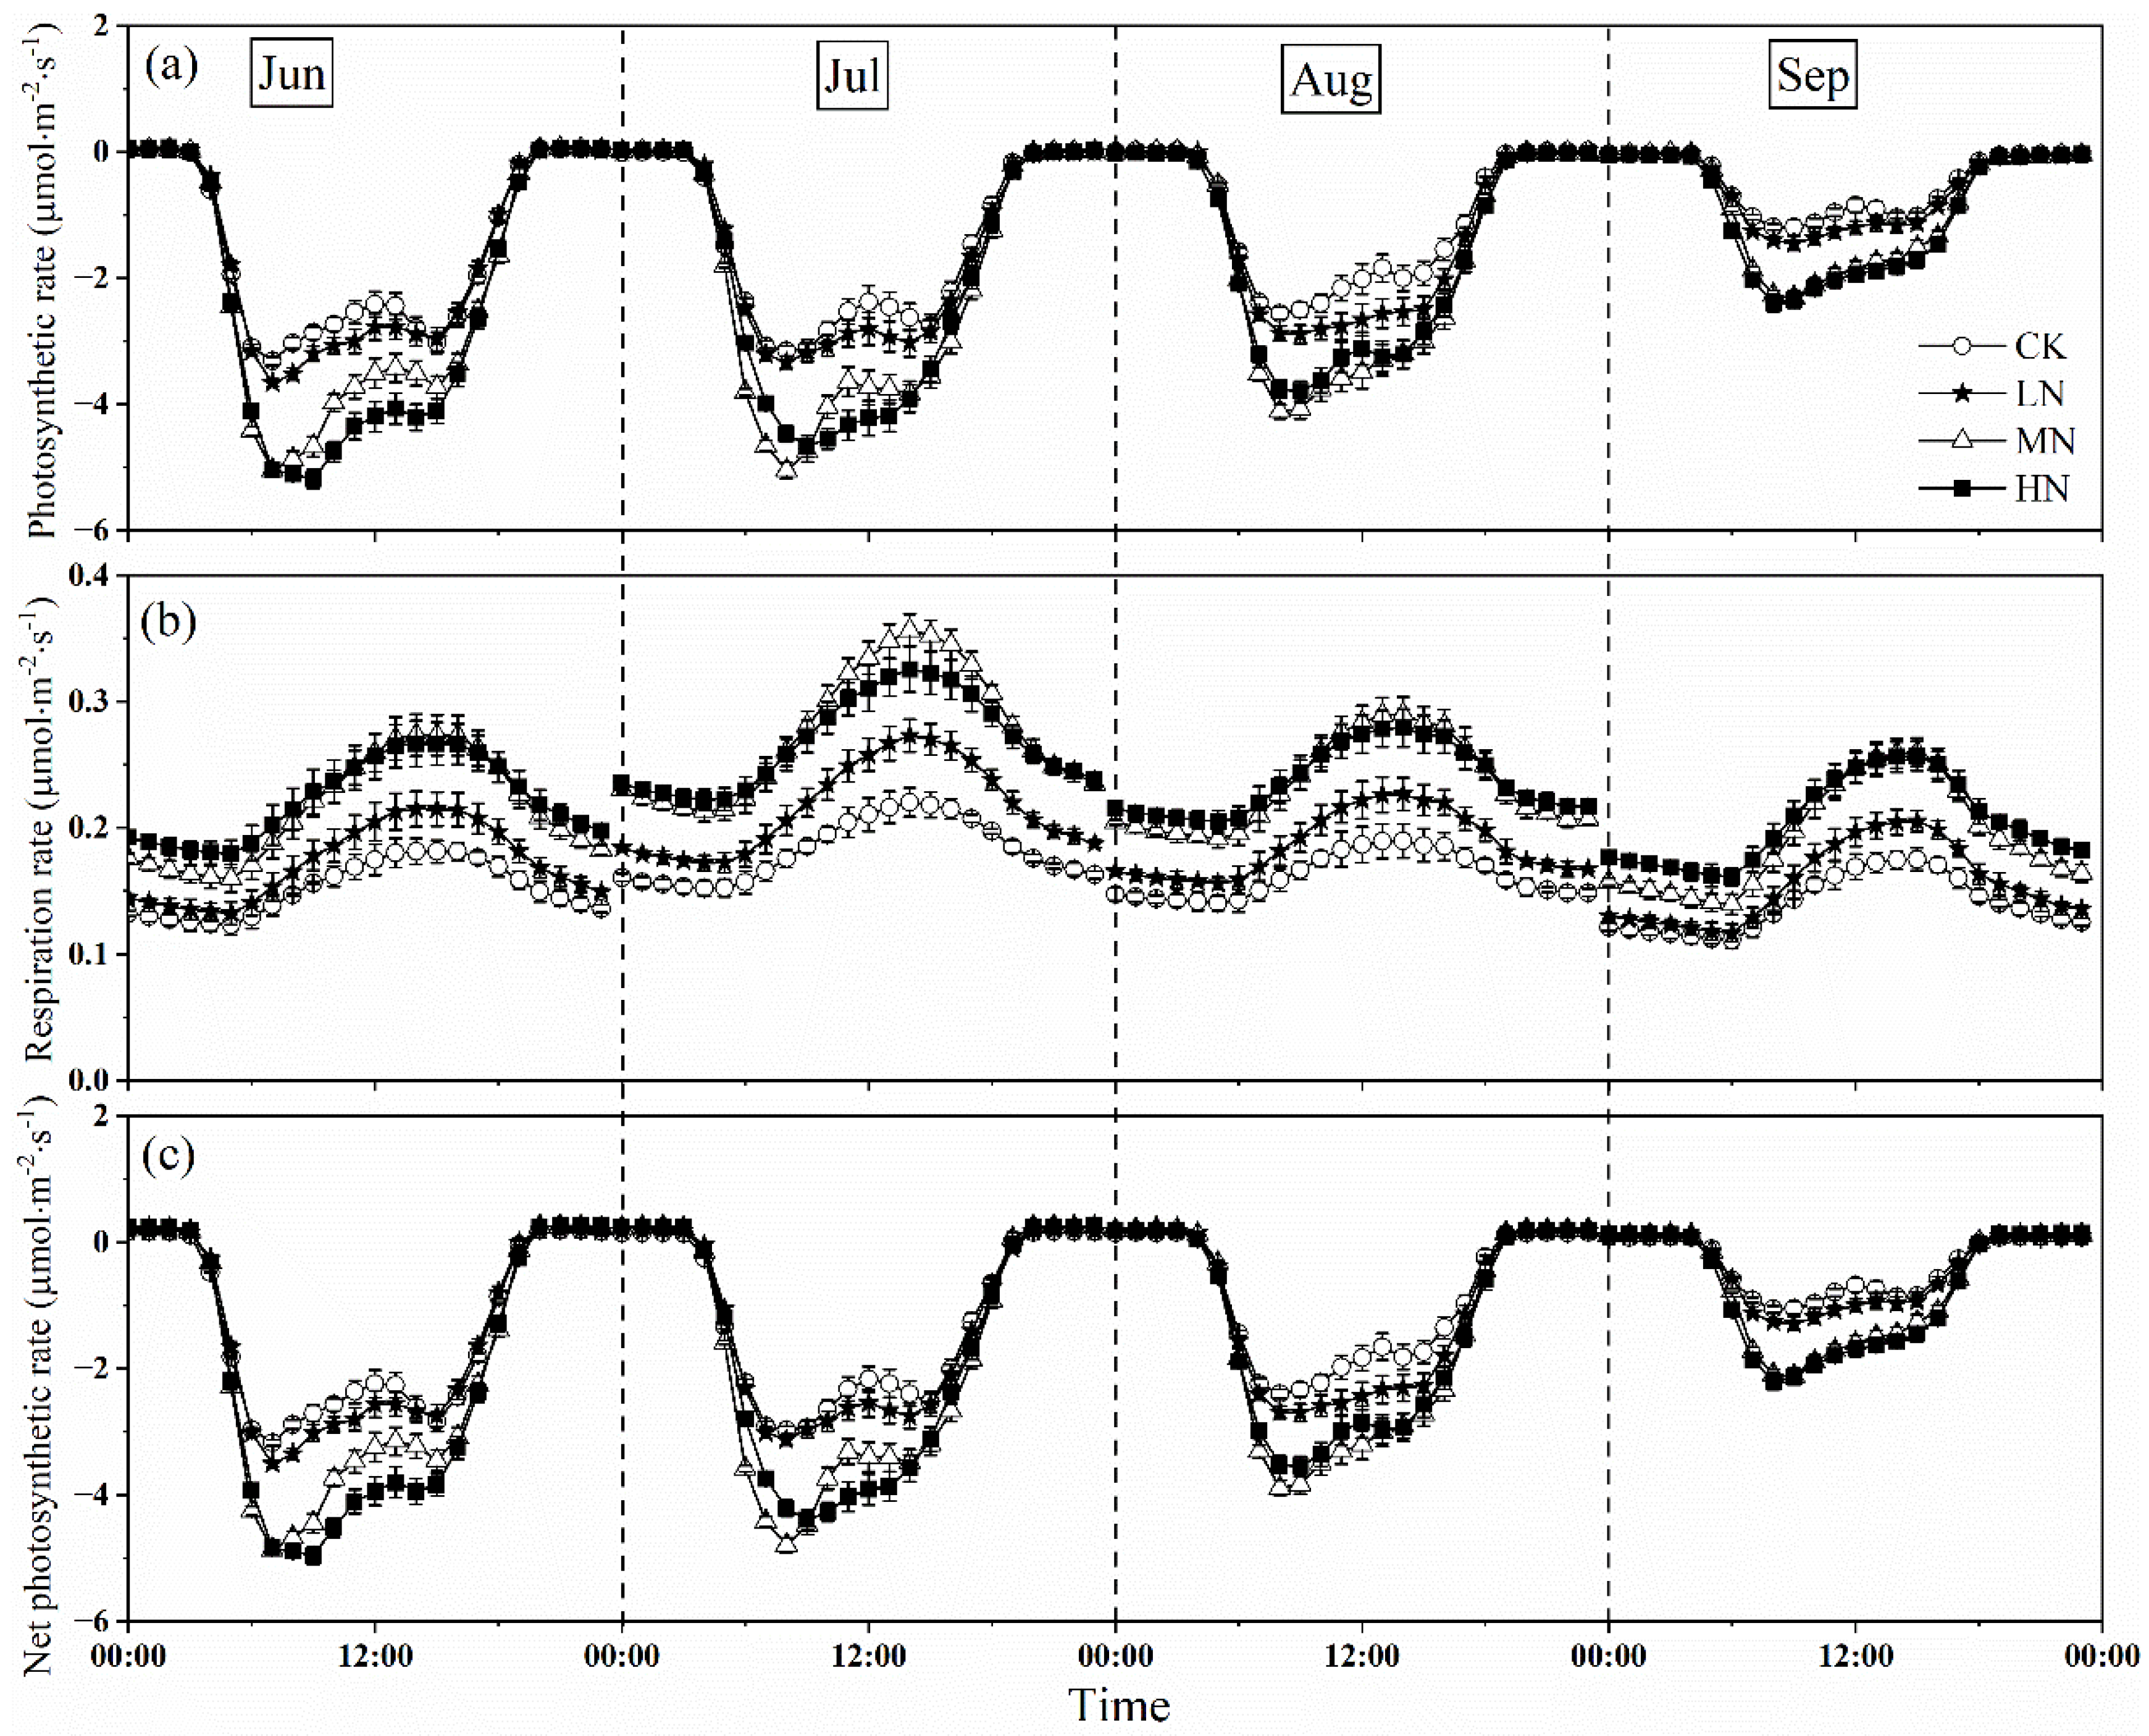
The measurements showed that nitrogen addition increased the crown photosynthetic rate, with MN and HN, were larger than that of LN in every month (Figure 4a). At the beginning of nitrogen addition (June), the peak value of photosynthetic rate under HN treatment was highest, however, which under MN treatment it was greater than that of HN and LN in July and August. At the end of the growing season, the peak value of photosynthetic rate in HN was slightly higher than that in MN, but there was no significantly different (p > 0.05), which was 2.14 and 2.12 μmol CO2·m−2·s−1, respectively. However, the influence of different nitrogen addition levels on the diurnal variation in crown photosynthetic rate showed a similar pattern. In general, the crown photosynthetic rate increased with the increasing of PAR, reaching the peak at around 7:00–9:00, and decreasing in the afternoon. However, the photosynthesis weakened as photoinhibition occurred at noon under different nitrogen treatments in some months. In the afternoon, a small peak appeared at about 14:00–15:00 under some nitrogen treatments with the temperature and VPD dropped. Among the different nitrogen treatments, CK treatment showed double peak phenomenon in each month, while LN and MN only in August and September, and HN in June and August showed that. We also found the peak values of crown photosynthetic rate ranged from −3.44 to −5.52 μmol CO2·m−2·s−1, −3.15 to −5.04 μmol CO2·m−2·s−1, −2.78 to −4.56 μmol CO2·m−2·s−1, −1.66 to −3.25 μmol CO2·m−2·s−1 in June, July, August, and September, respectively, which showed a variable and downward trend during the growing season.
The response of crown respiration rate to nitrogen addition was similar to that of photosynthetic rate, with MN and HN higher than that of LN (p < 0.05), the peak of respiration rate under MN treatment was greater than that under HN and other treatments during the growing season (Figure 4b). The peak of respiration rate ranged from 0.18 to 0.27 μmol CO2·m−2·s−1, 0.21 to 0.34 μmol CO2·m−2·s−1, 0.19 to 0.29 μmol CO2·m−2·s−1, 0.17 to 0.25 μmol CO2·m−2·s−1 in June, July, August, and September, respectively, which were an order of magnitude lower than that of crown photosynthetic rate. The daytime crown respiration rate (5:00–19:00) firstly increased and decreased later, and the maximum value appeared at around 14:00–15:00. However, the night-time crown respiration rate (19:00–5:00) linearly declined at around 0:00–5:00 and 21:00–23:00, with the highest values appearing in the HN treatment. Diurnal variation of respiration rate varied from month to month, but the daytime crown respiration rate was always greater than the night-time crown respiration rate.
Owing to the small change of respiration rate, the response of net photosynthetic rate to nitrogen addition was similar to the photosynthetic rate with MN, HN was higher than that of LN (p < 0.05) (Figure 4c), and the diurnal variation exhibited double peak phenomenon under different nitrogen treatments in some months. In addition, the patterns of daytime uptake and night-time release were evident. The value of net photosynthetic rate turned from positive to negative by sunrise at around 4:00–5:00, which decreased (C sequestration increased) with increasing light intensity during the day, reached the first and second peaks at around 7:00–9:00 and 14:00–15:00, respectively. The net photosynthetic rate increased until sunset when the whole net photosynthetic rate changed from net carbon uptake to net carbon release at around 19:00–20:00. At night, when photosynthesis ceased, the net photosynthetic rate was equal to the respiration rate.
3.3.2. Seasonal Dynamics and Monthly Accumulation of Net Crown CO2 Exchange
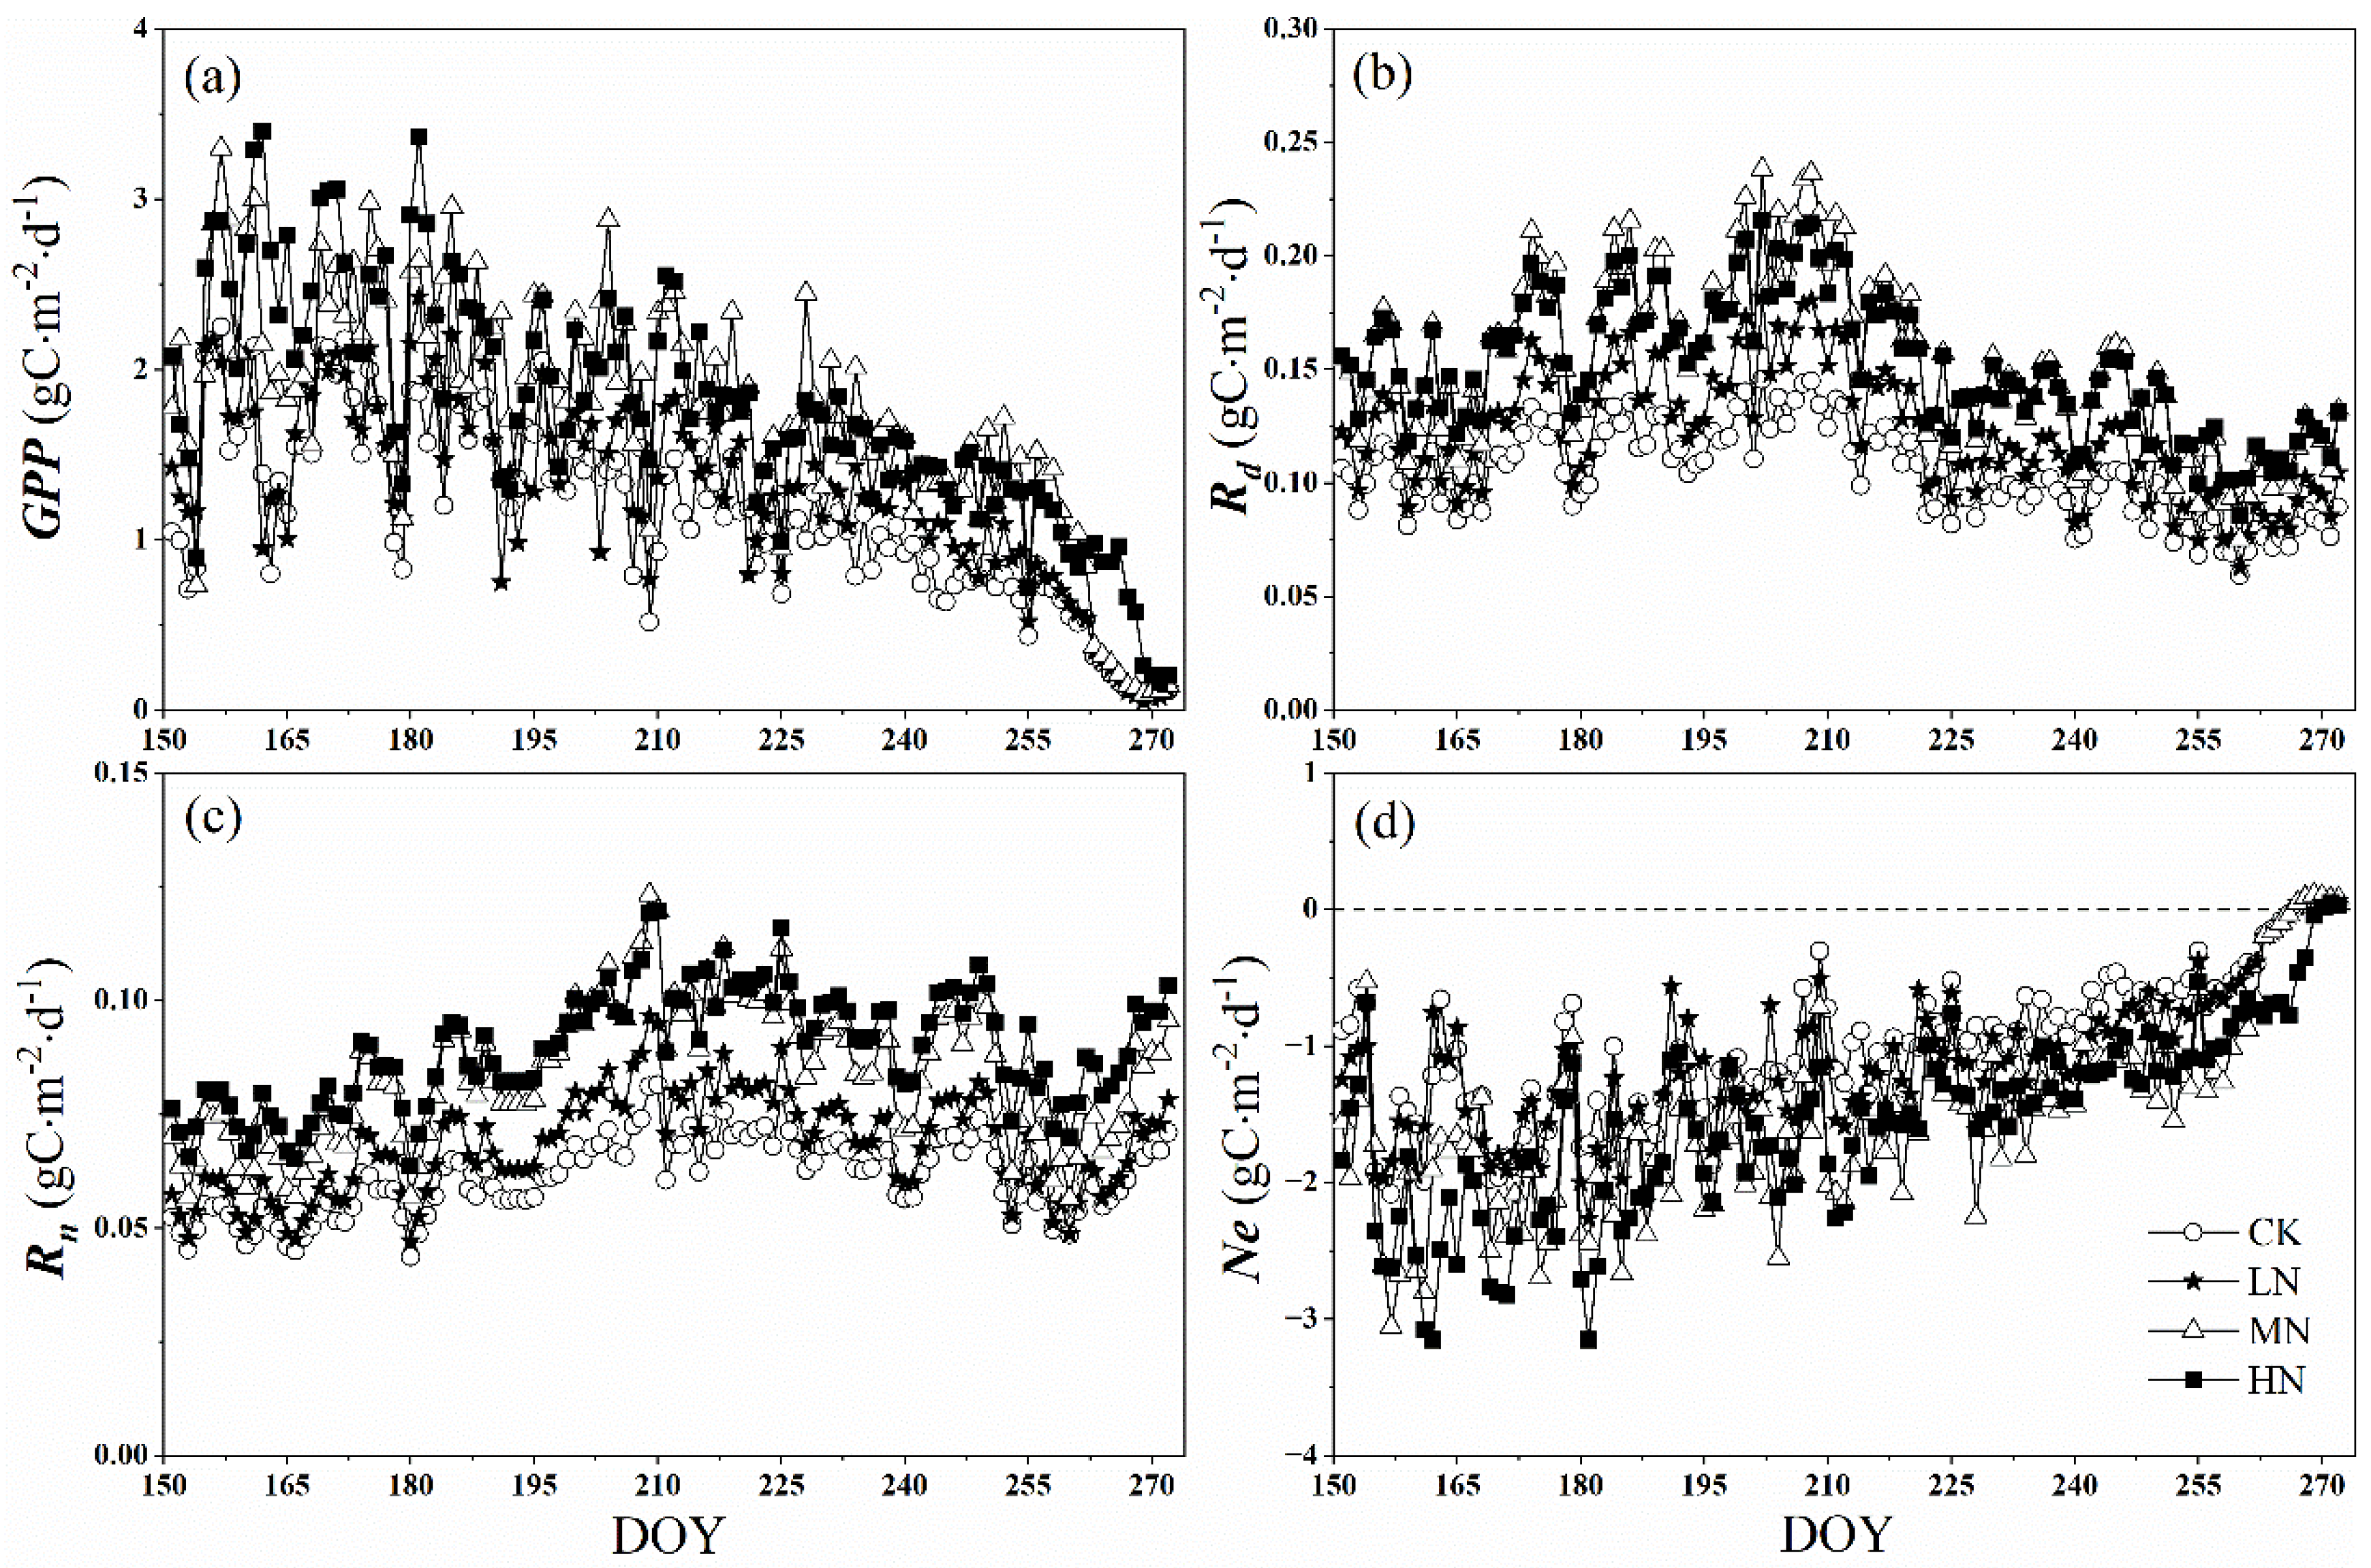
As shown in Figure 5a, the daily accumulation of GPP increased with the nitrogen addition levels, with the average values being 1.16, 1.30, 1.76, and 1.79 g Cm−2 d−1 in the control, low, medium, and high nitrogen treatments, respectively. There is a significant difference between LN and MN (p < 0.05), while there is no significant difference between CK and LN, and MN and HN treatments (p > 0.05). We also observed that daily sums of GPP have obvious seasonal variation from June to September. With seasonal vegetation senescence, the values of GPP decreased gradually, which were below the average values at the end of August. At the end of the growing season (25 September), the value of GPP declined sharply under control, low, and medium nitrogen treatments, which were an order of magnitude lower than the average values and ranged from 0.06 to 0.10 g Cm−2 d−1. The same was true of HN, but which occurred 3 days later (28 September).
Similarly, the daytime respiration (Rd) and the night-time respiration (Rn) increased with nitrogen addition levels, which also have obvious seasonal variation (Figure 5b,c). Affected by Tair, the peak occurred in early August or late July. The peak values of Rd in the control, low, medium, and high nitrogen treatments were 0.15, 0.18, 0.24, and 0.22 g C m−2d−1, respectively (Figure 5b). Moreover, all nitrogen addition treatments showed a smaller magnitude changes in Rn than in Rd, which ranged from 0.04 to 0.08 g C m−2d−1, 0.05 to 0.10 g C m−2 d−1, 0.06 to 0.12 g C m−2 d−1, 0.06 to 0.12 g C m−2 d−1 in control and low, medium and high nitrogen addition treatments, respectively (the inhibitory effect of light on dark respiration was not considered in this paper).
Owing to the small range of R, the response of Ne to nitrogen addition was similar to GPP, with MN, HN higher than LN (p < 0.05) (Figure 5d). At the end of the growing season (25 September), the value of GPP declined sharply to less than R, leading to the change of Ne from a negative value to a positive value, indicating the crown shifted from carbon sink to carbon source. However, the change of Ne under HN occurred 3 days later (28 September).
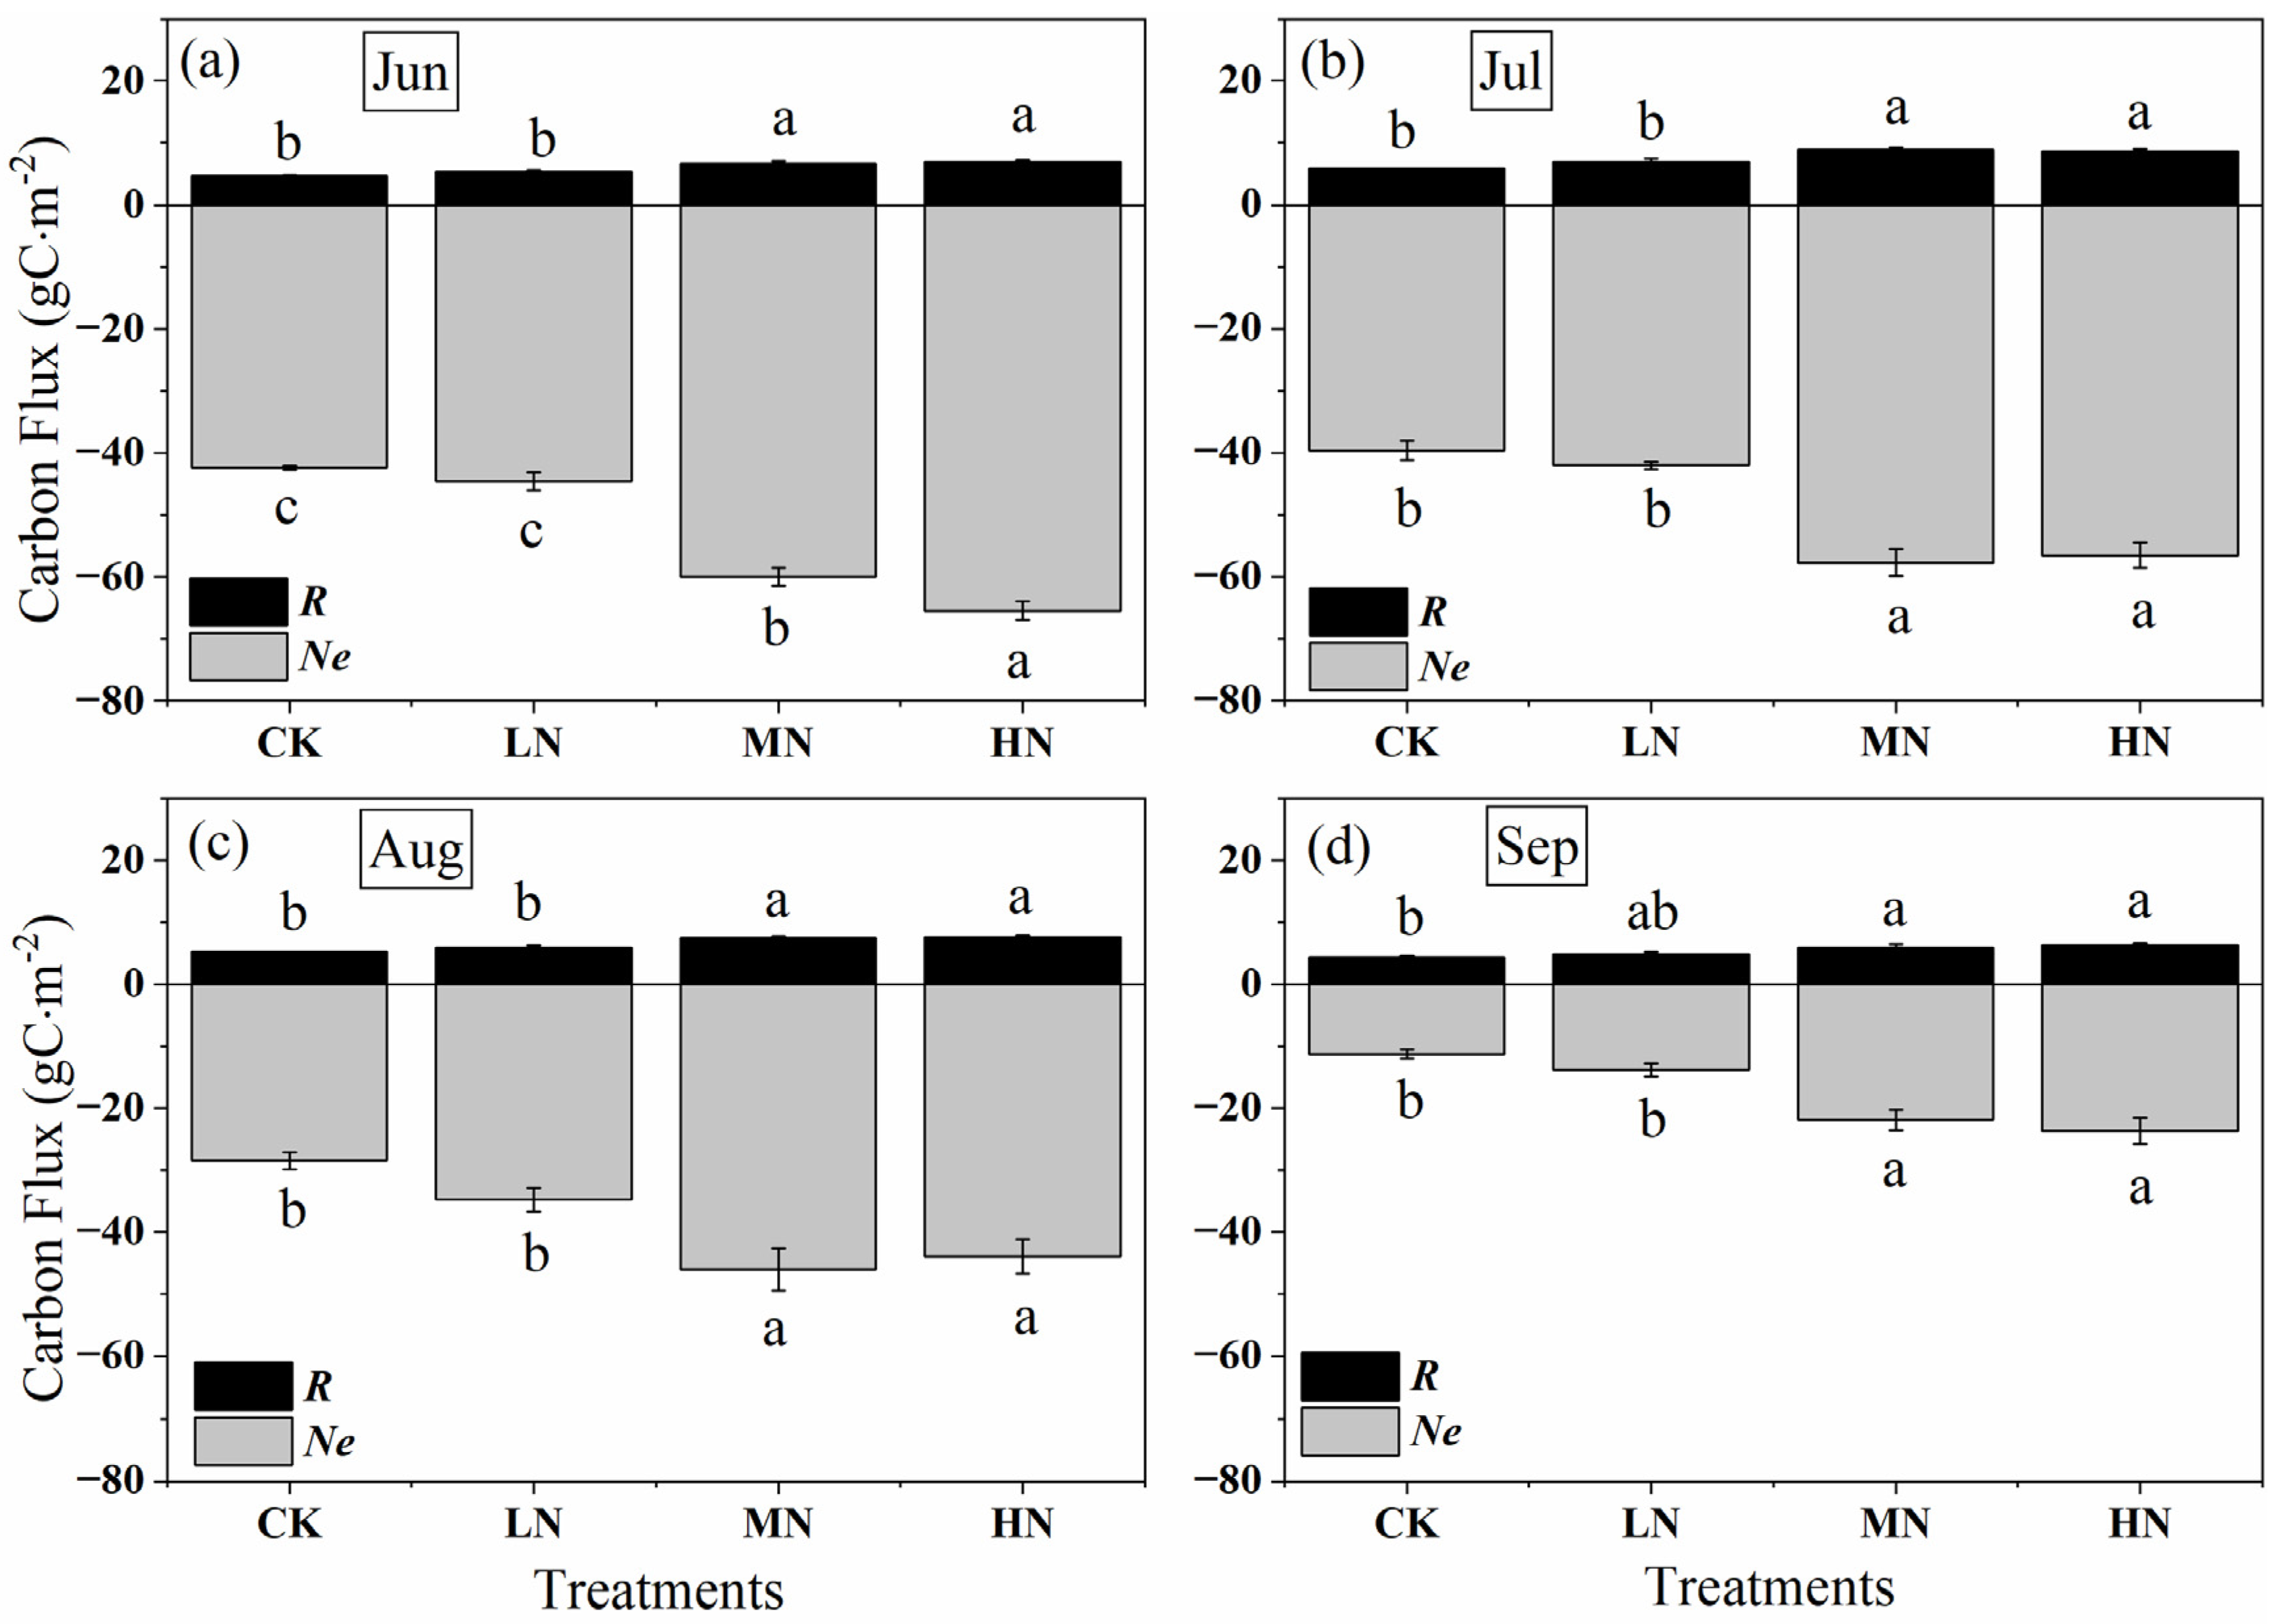
Nitrogen addition increased crown carbon sink from June to September, with MN and HN higher than LN (p < 0.05) (Figure 6). The monthly accumulation negative Ne value ranged from −11.25 to −42.42 g C m−2month−1 in controls, whereas which ranged from −13.78 to −44.61, −21.82 to −59.95 and −23.65 to −65.47 g C m−2month−1 for the same time in low, medium, and high nitrogen addition treatments. In addition, the monthly cumulative amount of GPP and Ne dropped gradually under all treatments from June to September. At the beginning and end of the growing season (in June and September), the carbon uptake reached the maximum under HN, which were −65.47 and −23.65 g C m−2month−1, respectively. However, the carbon uptake under MN was greater than that of HN and LN in July and August, there is no significant difference between MN and HN (p > 0.05), while there is a significant difference between MN and LN (p > 0.05). Similar to Ne, R was increased by nitrogen addition, but the range of values was very small, from 4.35 to 8.82 g C m−2month−1 under different nitrogen treatments. The respiration rate under HN was greater than that of MN and LN except in July. Similarly, the monthly accumulation of respiration showed seasonal variation, with an increasing trend during the early growing season (June to July), and then decreased from the late growing season (July to September) with the change of the temperature, the peak values occurred in July, and were 5.84, 6.92, 8.82 and 8.58 g C m−2month−1 in control, low, medium, and high nitrogen addition treatments.
3.3.3. The Growing Season Accumulation of Net Crown CO2 Exchange
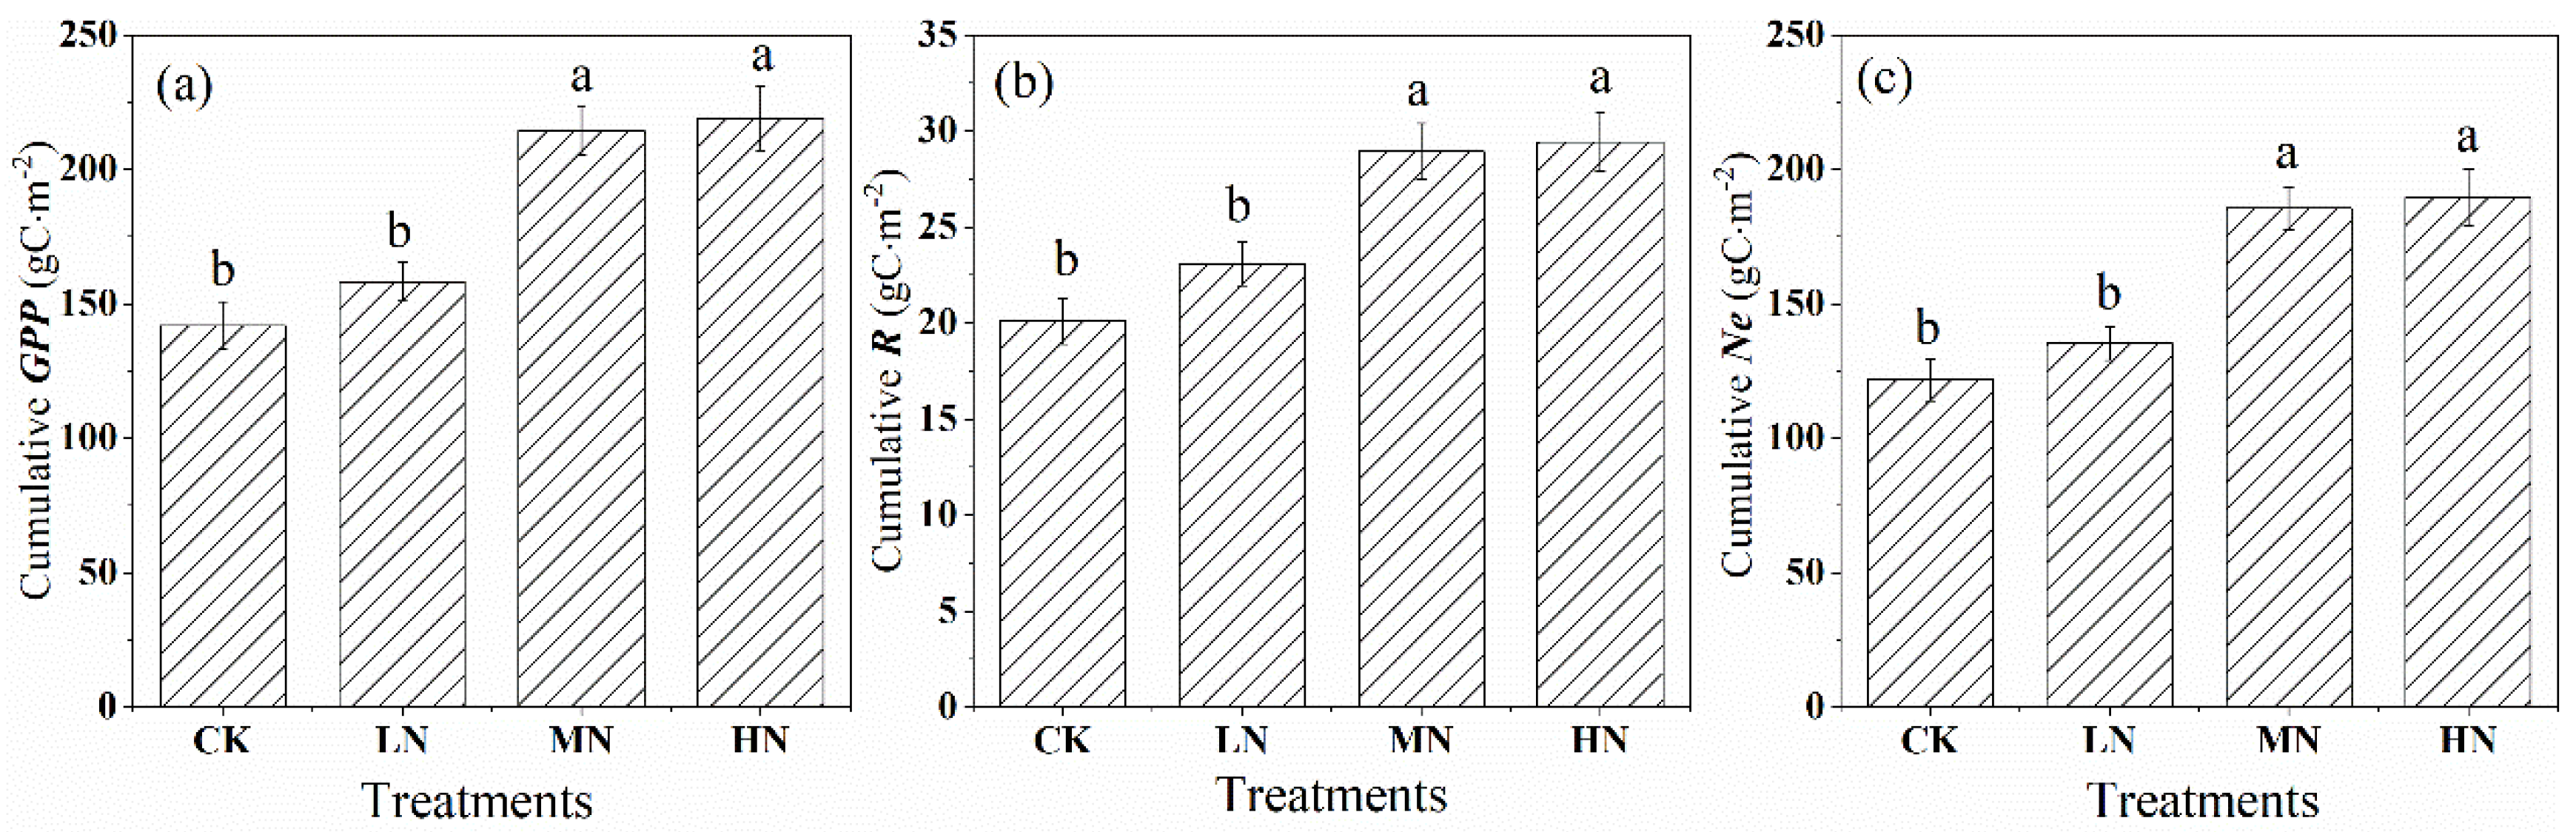
Throughout the growing season, nitrogen addition increased the carbon assimilation (GPP) in the saplings but also increased the release rate of crown carbon dioxide (R) (Figure 7a,b). Compared with the control group, the GPP accumulation increased by 11.56, 51.13, and 54.37% in the low, medium, and high nitrogen treatments (Figure 7a), and the growing season accumulation of R increased by 14.88, 43.93, and 46.40% (Figure 7b), respectively. Our results provided strong evidence that nitrogen addition enhanced the net crown carbon exchange (Ne), especially MN and HN treatments, which increased by 52.31 and 55.68% compared with the control, respectively, while the LN was only by 11.01% (Figure 7c).
3.4. The Change of Crown CO2 Exchange with Environmental Variables
3.4.1. The Change of Crown CO2 Exchange with PAR
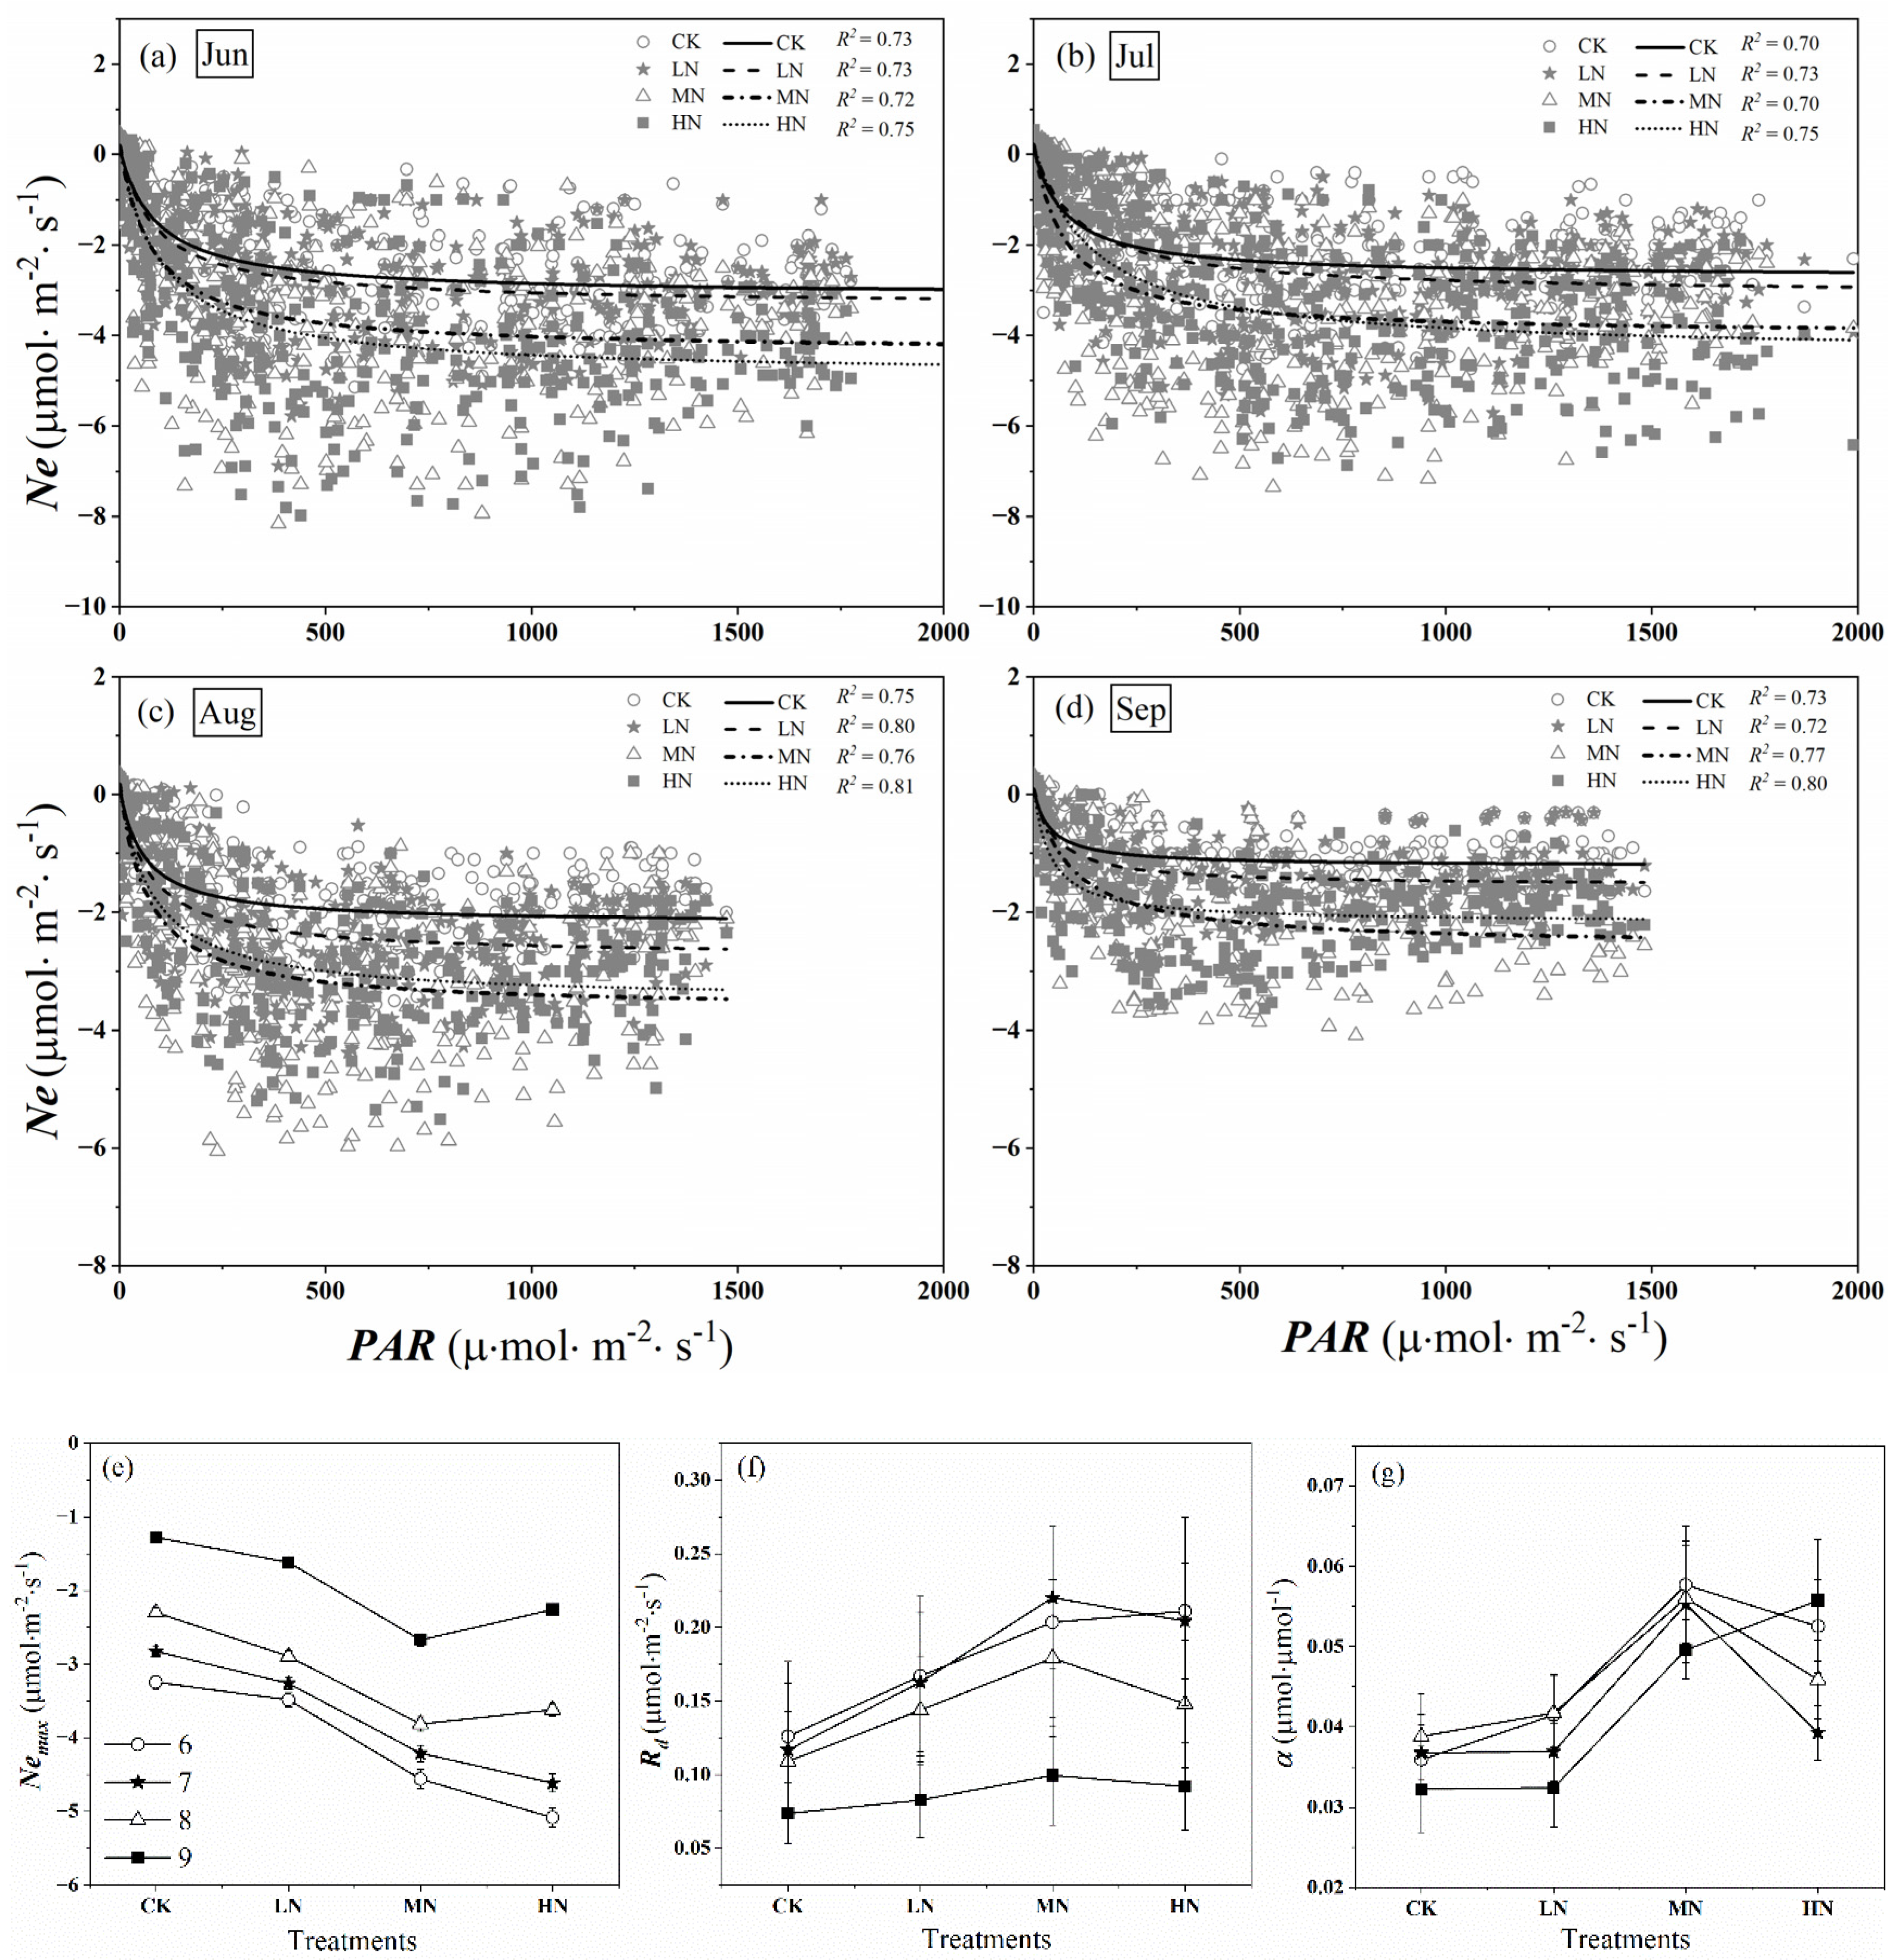
Figure 8a–d shows the relationship between Ne and PAR at an hour scale from June to September, respectively. For all treatments, the carbon uptake rose as the PAR increased at low PAR (about PAR < 200 μmol·m−2·s−1), then increased slowly with PAR increased (about 200 μmol·m−2·s−1 < PAR < 800 μmol·m−2·s−1). Eventually, there was a strong sign of the possible saturation of Ne when PAR > 800 μmol·m−2·s−1.
Parameters in Equation (4) fitting these data are shown in Figure 8 e–g. The absolute value of Nemax, Rd, and α in nitrogen addition treatments were higher than that in control during the growing season. With the increase of nitrogen addition concentration, the absolute value of Nemax showed first increased, then decreased levels (Figure 8a). At the beginning of the growing season, the absolute value of Nemax of HN treatment was the highest among the treatments (from June to July), while at the middle and late stage, that in MN was the highest (from August to September). Similarly, high nitrogen treatment promoted the daytime respiration rate of saplings at the beginning of the growing season, at the middle and late stage, which in MN was greater than that in HN (Figure 8f). We found α in nitrogen addition treatments were higher than that in control, however, there was no uniform rule for α under different treatments, which ranged from 0.032 to 0.058 μmol·μmol−1 (Figure 8g). Compared with the control group, the average α of the whole growing season increased by 6.18, 52.10, and 34.59% in the low, medium, and high nitrogen treatments.
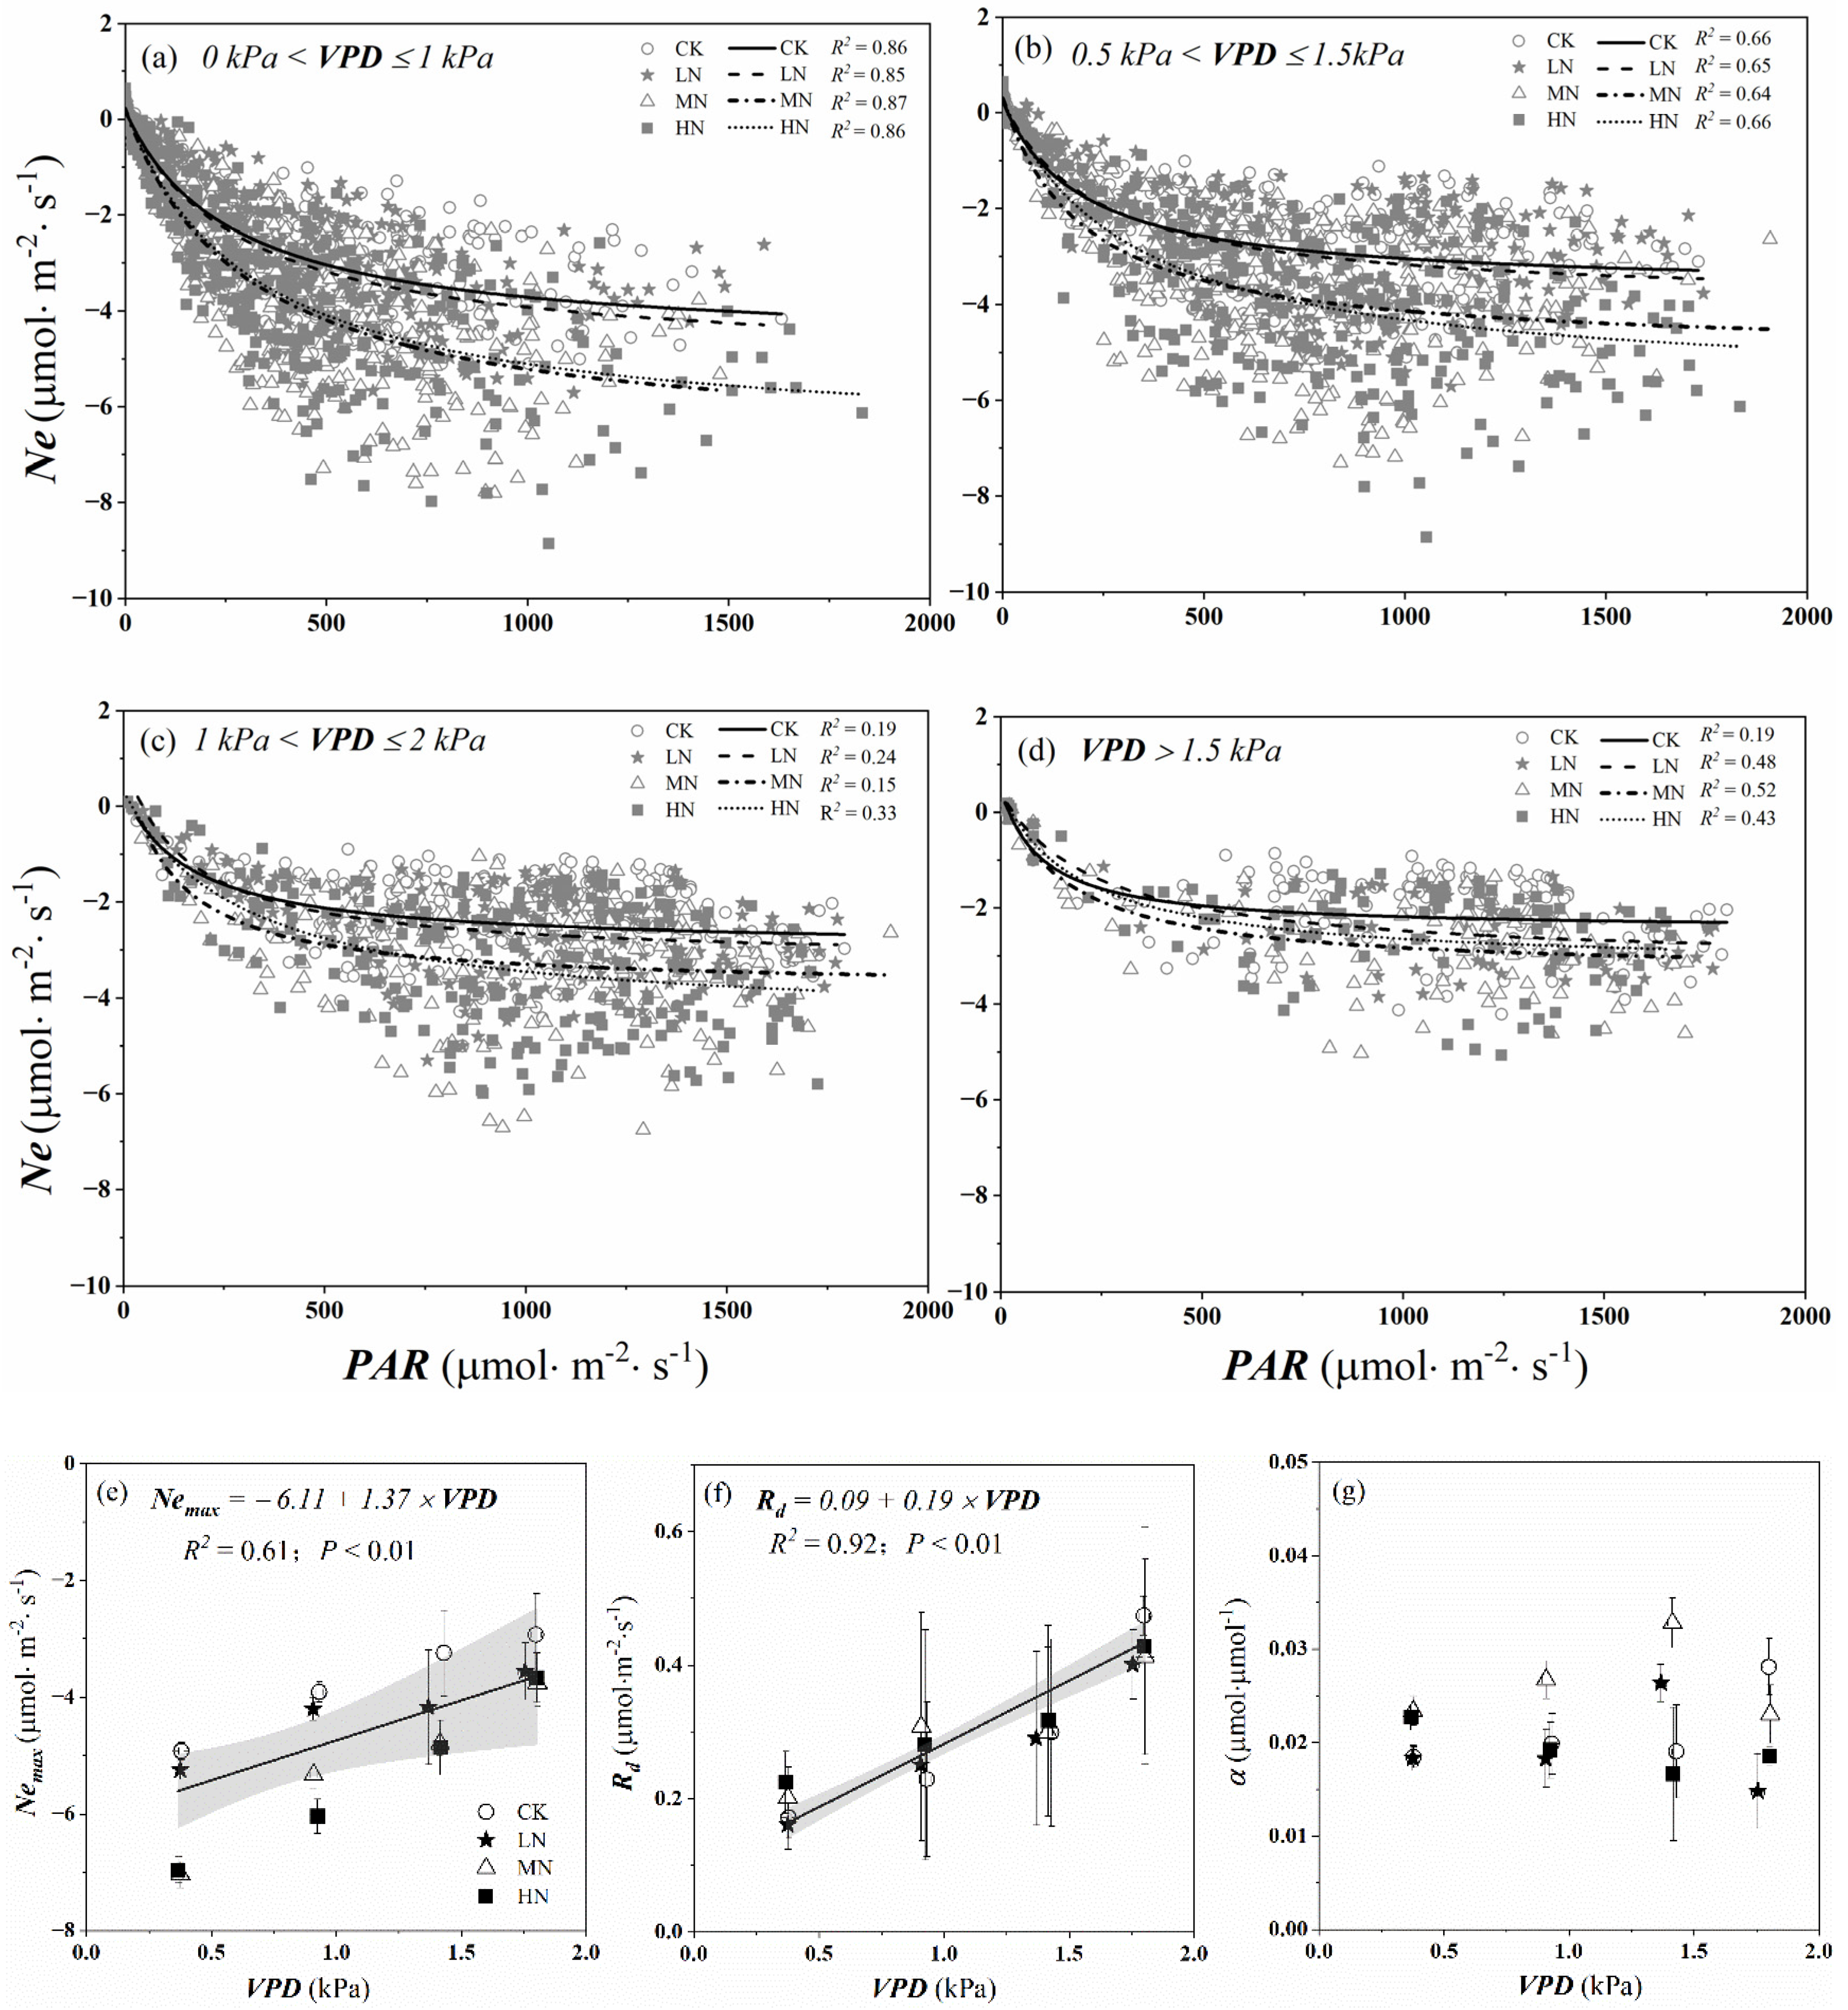
3.4.2. The Change of Crown CO2 Exchange with PAR under Different VPD Ranges
Similarly, we used light response curves (Equation (4)) to assess the influence of PAR on daytime Ne values under different VPD ranges and nitrogen addition levels. As can be seen from Figure 9a–d, the absolute value of Ne in MN and HN were much higher than that of LN when 0 kPa < VPD < 1 kPa, and there was little difference between MN and HN. The carbon assimilation decreased under different nitrogen addition treatments when VPD > 1 kPa. Similarly, the absolute value of Nemax in different nitrogen treatments linearly declined with the increasing of VPD during the growing season (p < 0.01), especially the MN and HN treatments, which were about twice as large when VPD was low (0 kPa < VPD ≤ 1 kPa) as those were when VPD was high (VPD > 1.5 kPa) (Figure 9e). However, the daytime respiration linearly increased with increasing VPD under different nitrogen addition levels (p < 0.01) (Figure 9f). From Figure 9g, we found α changed irregularly as VPD increased under different nitrogen addition levels, which ranged from 0.015 to 0.033 μmol·μmol−1.
4. Discussion
4.1. The Response of GPP, R, and Ne to Nitrogen Addition
In our study, nitrogen addition increased the carbon fixation rate (GPP), other simulated nitrogen deposition experiments at leaf and stand levels in N-limited forests also found similar results [40,41,42]. However, the effect of nitrogen deposition on GPP or plant growth also varies with the amount of nitrogen deposition, showing a general non-linear relationship [43]. At the leaf level, studies have found that there is a “threshold effect” on the effect of nitrogen input on plant photosynthesis [19,44,45,46,47]. Excessive nitrogen addition will cause a nutritional imbalance in plants and inhibit photosynthesis [4,48,49]. However, we found that the accumulation of GPP under HN treatment (69 kgN·hm−2·a−1) was the highest, followed by MN treatment (46 kgN·hm−2·a−1), which increased by 53.62 and 52.42% compared with the control, respectively. Similar results were gained by Wang et al. [19] that the threshold of nitrogen addition was about 80 kgN·hm−2·a−1 for two-year-old F. mandshurica seedlings in northeastern China. Novriyanti et al. [17] also found high nitrogen load (50 kgN·ha−1) significantly increased the net photosynthetic rate of two eucalypt species. The reasons for these differences lay in many aspects. One of them is the difference in the soil’s available N content. Some researchers found that when the soil available nitrogen content was not enough to meet the needs of plant growth, high nitrogen concentration can still promote the accumulation of biomass [42,50]. In our study, the experimental soil was relatively poor in nutrients (concentrations of C and N: 1.19 ± 0.30 and 0.12 ± 0.03 g·kg −1) and in a nitrogen-restricted state. As shown in Figure 6, the GPP and Ne under HN treatment were the highest at the beginning of the growing season (June), however, under MN were greater than that under HN in July and August (p > 0.05), which was probably because of the increasing of nitrogen input, the saplings under high nitrogen treatment tended to be saturated with nitrogen. In addition, the difference in measurement methods of the CO2 gas exchange leads to different results. Some authors have already pointed out that the inadequacy of single-leaf-based sampling to represent variability encountered at the whole-canopy level (due to the differences in stomatal distribution) [21,22].
We found the response of R to nitrogen addition was similar to that of GPP (Figure 4, Figure 5, Figure 6 and Figure 7). Probably due to the relationship between leaf respiration and photosynthesis, which can be explained in the following two aspects. On the one hand, sugars produced by photosynthesis are the main substrates for respiration [51]. On the other hand, respiration provides the carbon backbone for photosynthesis and energy for the synthesis of sugars. At the same time, the consumption of matter by respiration can also relieve the feedback inhibition of photosynthesis, thus further improving the efficiency of carbon assimilation [52]. Therefore, there is usually a positive correlation between respiration rate and photosynthetic rate (R2 = 0.995, p < 0.01). Similarly, the R was the largest under HN treatment in our experiment, followed by MN treatment, 23.44 and 23.14% higher than that in control, respectively (Figure 7). However, some studies found R showed a decreasing trend under high nitrogen treatment [6,53], which is probably due to the different response of photosynthetic rates to nitrogen addition levels, resulting in different photosynthetic substrates. In addition, leaf respiration varied with leaf age, canopy position, and tree species [54,55,56]. And beyond that, only leaf respiration was observed at the leaf level, while the respiration of trunk and branches also accounted for a large proportion of the total respiration, ignorance of them would result in measurement deviation.
Net carbon exchange is an important indicator for evaluating carbon cycle and balance, which is jointly determined by the gross primary productivity and respiration. In our study, nitrogen addition has been observed to increase Ne during the growing season because of the larger stimulation in GPP than that in R (Figure 4, Figure 5, Figure 6 and Figure 7). A similar observation has also been reported by Xia et al. [57]. Owing to the small change of R, the response of Ne to different nitrogen addition levels was similar to GPP, with HN slightly higher than that in MN (p > 0.05), 55.68 and 52.31% higher compared with the control, respectively (Figure 7). Some other studies have found similar results, such as Jose et al. [58] found the net photosynthetic rate of 1-year growing Pinus palustris seedlings in high nitrogen treatment was significantly higher than that in low nitrogen treatment. However, the response of Ne to nitrogen addition in other studies were somewhat different from our study; they found the Ne under MN were highest. Probably, soil’s available nitrogen content was small in our experiment, the addition nitrogen was absorbed as a nutrient. In addition, experiment duration was short, and the nitrogen threshold value, which can inhibit the net photosynthetic rate, was probably not been reached.
4.2. The Response of Plant Photosynthesis Parameters to Nitrogen Addition
The maximum net photosynthetic rate (Nemax), apparent quantum efficiency (α), and the daytime respiration rate (Rd) are important indicators for studying the photosynthetic physiological characteristics of plants and their ability to adapt to environmental conditions [59]. As shown in (Figure 8e–g), the influences on the photosynthesis parameters vary in different nitrogen treatment levels. It could be explained as plants under high nitrogen no longer use excess nitrogen to synthesize more Rubisco enzymes, but instead synthesize a plant stress indicator–putrosamine [60], so that there exists a threshold value for leaf nitrogen content to promote Nemax.
Similarly, high nitrogen treatment (69 kgN·hm−2·a−1) promoted the daytime respiration rate of saplings at the beginning of the growing season in this study. Probably because that Ne and Nemax under high nitrogen treatment were higher than other treatments (Figure 6, Figure 7 and Figure 8e), and nitrogen accumulated to a certain concentration could improve the crown carbon sequestration ability, generated more photosynthetic product to rich respiration substrates and improved the respiratory rate [51]. Similar to Nemax, at the middle and late stage, the daytime respiration rate in MN (46 kgN·hm−2·a−1) was greater than that in HN (69 kgN·hm−2·a−1).
Apparent quantum efficiency reflects the utilization of light energy by leaves, especially the utilization ability of low light. In our study, we found α in nitrogen addition treatments were higher than that in control. Compared with the control group, the average of the whole growing season increased by 6.18, 52.10, and 34.59% in the low, medium, and high nitrogen treatments. Meanwhile, the synchronously improved α indicated the enhanced capacity to use the low light and assimilate CO2 for seedlings, which was consistent with the impact of Ne in nitrogen treatments, as presented in other studies [6,61].
4.3. The Change of Crown CO2 Exchange with Environmental Variables
There are several meteorological factors that affect GPP, R, and Ne, the most essential of them are Tair, PAR, and VPD. Temperature mainly affects the activities of various enzymes in plant’s photosynthesis, especially a series of enzymatic reactions in the dark reaction of photosynthesis [62]. The increasing VPD signifies a growing moisture deficit in the atmosphere that results in the increased transpiration by plants. Transpiration and photosynthesis are two closely coupled processes regulated by stomata [11]. Affected by Tair, PAR, and VPD, the GPP and Ne in CK treatment showed double peak phenomenon in each month, while that in LN and MN treatments only in August and September, and HN in June and August showed that phenomenon (Figure 4a). From Figure 9a–e, we find the carbon uptake decreased with increasing VPD during the growing season, probably because VPD beyond a threshold must have decreased the activity of photosynthesis-related enzymes and induced restricted opening of stomata for the conservation of moisture, [63]. However, the absolute value of Nemax in nitrogen addition treatments were higher than that of the controls (Figure 9f). These phenomena indicated that nitrogen addition slows down the phenomenon of photosynthesis midday depression.
We also found crown carbon fixation increased in the early and middle of the growing season (Figure 5), which probably because that temperature was suitable for plant growth, thereby increasing photosynthesis, maintaining and building their own material increased, so did leaf, branch, and trunk respiration, resulting in an increase in overall crown respiration, which reached a peak at the end of July and early August. At the end of the growing season, photosynthesis of trees decreased when the temperature dropped, and the physiological metabolic activities could only maintain the survival needs, while the branch and trunk respiration also decreased correspondingly (Figure 5). In addition, the reduction of the demand for ATP and carbon skeleton for leaf growth and photosynthetic photosynthate synthesis with seasonal vegetation senescence occurred, ultimately leading to reducing the respiration rate. Due to the value of GPP declining sharply and being less than R, the value of Ne changed from negative value to positive value, indicating the crown shifted from carbon sink to carbon source under control, low, and medium nitrogen treatments at the end of September (25 September). However, the time when crown shifted from carbon sink to carbon source under HN occurred 3 days later (28 September), probably because the growing season cumulative GPP was highest under HN (Figure 5).
4.4. Evaluation of Our Proposed Chamber Method
Strictly speaking, there are some possible causes which may have led to the reduction of Ne within the chamber. Firstly, incoming sunlight was attenuated through the chamber wall even though it was made of transparent material, and this would reduce photosynthetic carbon uptake. We estimated a reduction of 1.7% in Ne. Secondly, the saplings were exposed under high temperature and humidity conditions when the chamber was closed at noon, and the increased VPD average value would inhibit photosynthesis, resulting in an underestimation of 3.5% of the total crown Ne (Figure 3b and Figure 9e,f). Similarly, increased temperature in the chamber increased R. We found that the mean Q10 of crown respiration under different nitrogen treatment levels was 1.67 (the respiration rate increased 1.67 times with a temperature increase of 10 °C; not listed in this article). Therefore, the increased temperature average value (Figure 3a) resulted in an underestimation of 0.3% of the total crown respiration. Through the above analysis, the chamber method underestimated the Ne by 5.5% (the inhibitory effect of light on dark respiration was not considered in this paper). Yet the closed-circuit chamber method outlined here nevertheless potentially provides a scientific and accurate method to observe the carbon-water exchange in the crown (or other components), and the acquisition of accurate and high-frequency data cannot be replaced by other methods so far. More importantly, the chamber approach provides useful information about long-term responses because of short-term differences in plant crown-level CO2 exchange under different nitrogen addition levels can scale up to long-term changes in forest ecosystem carbon cycle and atmospheric nitrogen deposition.
5. Conclusions
The net crown CO2 exchange rate of Fraxinus mandshurica saplings were measured continuously using fully automated closed chambers and the results indicated that nitrogen addition increased the crown daily average and cumulative amount of GPP, R and Ne during the growing season, especially under MN and HN treatments. Similarly, the maximum net photosynthetic rate of crown (Nemax) and initial quantum efficiency (α) were promoted.
The change of monthly averaged diurnal variations of Ne with PAR, Tair and VPD showed that nitrogen addition postponed the appearance of photosynthesis midday depression. The daily and monthly cumulated GPP, R, and Ne under all treatments have obvious seasonal variation. At the end of the growing season, the crown shifted from carbon sink to carbon source, however, the change under HN occurred a few days (3 days) later.
Author Contributions
All authors contributed to the development of ideas and analysis of output results. D.G. designed the study; C.G. performed the research; A.W., J.W. and F.Y. provided the resources; C.G., D.G., Y.L., C.C., K.Z. and J.W. contributed to the data analysis; D.G. and A.W. contributed to the funding acquisition; C.G. wrote the first draft and all authors contributed to the final manuscript. All authors have read and agreed to the published version of the manuscript.
Funding
This research was supported by grants from the National Natural Science Foundation of China (grant number 41975150,31971728,32171873) and the Scientific Instrument and Equipment Development Project of the Chinese Academy of Sciences (grant number YJKYYQ20200035).
Data Availability Statement
The data presented in this study are available on request from the corresponding author.
Conflicts of Interest
The authors declare no conflict of interest.
References
- Xu, G.L.; Mo, J.M.; Zhou, G.Y. Effects of N deposition on soil fauna:a summary for one year. J. Beijing For. Univ. 2006, 28, 1–7. [Google Scholar]
- Riddell, J.; Nash, T.H.; Padgett, P. The effect of HNO3 gas on the lichen Ramalina menziesii. Flora—Morphol. Distrib. Funct. Ecol. Plants 2008, 203, 47–54. [Google Scholar] [CrossRef]
- Liu, X.; Zhang, Y.; Han, W.; Tang, A.; Shen, J.; Cui, Z.; Vitousek, P.; Erisman, J.W.; Goulding, K.; Christie, P.; et al. Enhanced nitrogen deposition over China. Nature 2013, 494, 459–462. [Google Scholar] [CrossRef]
- Mo, J.; Li, D.; Gundersen, P. Seedling growth response of two tropical tree species to nitrogen deposition in southern China. Eur. J. For. Res. 2008, 127, 275–283. [Google Scholar] [CrossRef]
- Liu, M.; Wang, Y.; Li, Q.; Xiao, W.; Song, X. Photosynthesis, Ecological Stoichiometry, and Non-Structural Carbohydrate Response to Simulated Nitrogen Deposition and Phosphorus Addition in Chinese Fir Forests. Forests 2019, 10, 1068. [Google Scholar] [CrossRef] [Green Version]
- Wang, J.; Zhang, H.; Fu, X.; Wang, J.; Ni, H. Effects of Nitrogen Deposition on Photosynthetic Characteristics of Calamagrostis angustifolia. Chin. Agric. Sci. Bull. 2013, 29, 45–49. [Google Scholar]
- Liang, X.; Zhang, T.; Lu, X.; Ellsworth, D.S.; BassiriRad, H.; You, C.; Wang, D.; He, P.; Deng, Q.; Liu, H.; et al. Global response patterns of plant photosynthesis to nitrogen addition: A meta-analysis. Glob. Chang. Biol. 2020, 26, 3585–3600. [Google Scholar] [CrossRef]
- Clark, D.A.; Brown, S.; Kicklighter, D.W.; Chambers, J.Q.; Thomlinson, J.R.; Ni, J. Measuring Net Primary Production in Forests: Concepts and Field Methods. Ecol. Appl. 2001, 11, 356–370. [Google Scholar] [CrossRef]
- Curtis, P.S.; Hanson, P.J.; Bolstad, P.; Barford, C.; Randolph, J.C.; Schmid, H.P.; Wilson, K.B. Biometric and eddy-covariance based estimates of annual carbon storage in five eastern North American deciduous fore. Agric. For. Meteorol. 2002, 113, 3–19. [Google Scholar] [CrossRef]
- Reichstein, M.; Falge, E.; Baldocchi, D.; Papale, D.; Aubinet, M.; Berbigier, P.; Bernhofer, C.; Buchmann, N.; Gilmanov, T.; Granier, A.; et al. On the separation of net ecosystem exchange into assimilation and ecosystem respiration: Review and improved algorithm. Glob. Chang. Biol. 2005, 11, 1424–1439. [Google Scholar] [CrossRef]
- Niu, Y.; Li, Y.; Yun, H.; Wang, X.; Gong, X.; Duan, Y.; Liu, J. Variations in diurnal and seasonal net ecosystem carbon dioxide exchange in a semiarid sandy grassland ecosystem in China’s Horqin Sandy Land. Biogeosciences 2020, 17, 6309–6326. [Google Scholar] [CrossRef]
- Watham, T.; Srinet, R.; Nandy, S.; Padalia, H.; Sinha, S.K.; Patel, N.R.; Chauhan, P. Environmental control on carbon exchange of natural and planted forests in Western Himalayan foothills of India. Biogeochemistry 2020, 151, 291–311. [Google Scholar] [CrossRef]
- Wang, X.C.W.; Wang, C.K.; Bond-Lamberty, B. Quantifying and reducing the differences in forest CO 2 -fluxes estimated by eddy covariance, biometric and chamber methods: A global synthesis. Agric. For. Meteorol. 2017, 247, 93–103. [Google Scholar] [CrossRef]
- Fang, J.; Chen, A.; Peng, C.; Zhao, S.; Ci, L. Changes in forest biomass carbon storage in China between 1949 and 1998. Science 2001, 292, 2320–2322. [Google Scholar] [CrossRef]
- Wang, B.; Huang, J.; Yang, X.; Zhang, B.; Liu, M. Estimation of biomass, net primary production and net ecosystem production of China’s forests based on the 1999–2003 National Forest Inventory. Scand. J. For. Res. 2010, 25, 544–553. [Google Scholar] [CrossRef]
- Baldocchi, D. Measuring fluxes of trace gases and energy between ecosystems and the atmosphere—The state and future of the eddy covariance method. Glob. Chang. Biol. 2014, 20, 3600–3609. [Google Scholar] [CrossRef]
- Novriyanti, E.; Watanabe, M.; Kitao, M.; Utsugi, H.; Uemura, A.; Koike, T. High nitrogen and elevated [CO2] effects on the growth, defense and photosynthetic performance of two eucalypt species. Environ. Pollut. 2012, 170, 124–130. [Google Scholar] [CrossRef] [PubMed] [Green Version]
- Sun, J.; Wu, J.; Ren, L.; Zhang, G.; Ren, F.; Yao, F. Response of photosynthetic characteristies to nitrogen addition by seedlings of two dominant tree species in a broadleaved-Korean pine mixed forest on Changbai Mountain. Acta Ecol. Sin. 2016, 36, 6777–6785. [Google Scholar]
- Wang, M.; Zhang, W.-W.; Li, N.; Liu, Y.-Y.; Zheng, X.-B.; Hao, G.-Y. Photosynthesis and growth responses of Fraxinus mandshurica Rupr. seedlings to a gradient of simulated nitrogen deposition. Annal. For. Sci. 2017, 75. [Google Scholar] [CrossRef] [Green Version]
- Fenghui, Y. Study on Gas Exchange Measurements at Whole-Tree Scale. Master’s Thesis, University of Chinese Academy of Sciences, Beijing, China, 2008. [Google Scholar]
- Cheeseman, J.M. PATCHY: Simulating and visualizing the effects of stomatal patchiness on photosynthetic CO2 exchange studies. Plant Cell Environ. 1991, 14, 593–599. [Google Scholar] [CrossRef]
- Escalona, J.M.; Pou, A.; Tortosa, I.; Hernández-Montes, E.; Tomás, M.; Martorell, S.; Bota, J.; Medrano, H. Using whole-plant chambers to estimate carbon and water fluxes in field-grown grapevines. Theor. Exp. Plant Physiol. 2016, 28, 241–254. [Google Scholar] [CrossRef]
- Kolling, K.; George, G.M.; Kunzli, R.; Flutsch, P.; Zeeman, S.C. A whole-plant chamber system for parallel gas exchange measurements of Arabidopsis and other herbaceous species. Plant Methods 2015, 11, 48. [Google Scholar] [CrossRef] [PubMed] [Green Version]
- Burkart, S.; Manderscheid, R.; Weigel, H.-J. Design and performance of a portable gas exchange chamber system for CO2- and H2O-flux measurements in crop canopies. Environ. Exp. Bot. 2007, 61, 25–34. [Google Scholar] [CrossRef]
- Pérez-Priego, O.; Testi, L.; Orgaz, F.; Villalobos, F.J. A large closed canopy chamber for measuring CO2 and water vapour exchange of whole trees. Environ. Exp. Bot. 2010, 68, 131–138. [Google Scholar] [CrossRef] [Green Version]
- Chen, H.; Fan, M.; Kuzyakov, Y.; Billen, N.; Stahr, K. Comparison of net ecosystem CO2 exchange in cropland and grassland with an automated closed chamber system. Nutr. Cycl. Agroecosyst. 2014, 98, 113–124. [Google Scholar] [CrossRef]
- Bunce, J.A. Responses of soybeans and wheat to elevated CO2 in free-air and open top chamber systems. Field Crop Res. 2016, 186, 78–85. [Google Scholar] [CrossRef]
- Guidolotti, G.; De Dato, G.; Liberati, D.; De Angelis, P. Canopy Chamber: A useful tool to monitor the CO2 exchange dynamics of shrubland. iForest—Biogeosci. For. 2017, 10, 597–604. [Google Scholar] [CrossRef] [Green Version]
- Wang, M.; Shi, S.; Lin, F.; Hao, Z.; Jiang, P.; Dai, G. Effects of soil water and nitrogen on growth and photosynthetic response of Manchurian ash (Fraxinus mandshurica) seedlings in northeastern China. PLoS ONE 2012, 7, e30754. [Google Scholar] [CrossRef] [PubMed] [Green Version]
- Yan, L.L. Analysis on Seedling Breeding and Management Technology of Fraxinus mandshurica in Liaoning. J. Temp. For. Res. 2021, 4, 60–62. [Google Scholar]
- Zhou, W.M.; Guo, Y.; Zhu, B.K. Seasonal variations of nitrogen flux and composition in a wet deposition forest ecosystem on Changbai Mountain. Acta Ecol. Sin. 2015, 163, 125–133. [Google Scholar]
- Zhang, X.L.; Zhai, P.H.; Huang, J.H. Advances in the Influences of Precipitation and Nitrogen Deposition Change on the Carbon Cycle of Grassland Ecosystem. Acta Agrestia Sin. 2018, 26, 21–25. [Google Scholar]
- Fleck, D.; He, Y.; Alexander, C.; Jacobson, G.; Cunningham, K. Simultaneous soil Flux Measurements of Five Gases—N2O, CH4, CO2, NH3, and H2O—With the Picarro G2508; Picarro Inc.: Santa Clara, CA, USA, 2013. [Google Scholar]
- Xu, L.B.; Dennis, D. Seasonal variation in carbon dioxide exchange over a Mediterranean annual grassland in California. Agric. For. Meteorol. 2004, 123, 79–96. [Google Scholar] [CrossRef] [Green Version]
- Zhou, L.; Zhou, G.; Jia, Q. Annual cycle of CO2 exchange over a reed (Phragmites australis) wetland in Northeast China. Aquat. Bot. 2009, 91, 91–98. [Google Scholar] [CrossRef]
- Baly, E.C.C. The Kinetics of Photosynthesis; Royal Society: London, UK, 1935; Volume 117, pp. 218–239. [Google Scholar]
- Burkart, S.; Manderscheid, R.; Wittich, K.P.; Lopmeier, F.J.; Weigel, H.J. Elevated CO2 effects on canopy and soil water flux parameters measured using a large chamber in crops grown with free-air CO2 enrichment. Plant Biol. 2011, 13, 258–269. [Google Scholar] [CrossRef]
- Grau, A. A closed chamber technique for field measurement of gas exchange of forage canopies. N. Z. J. Agric. Res. 2010, 38, 71–77. [Google Scholar] [CrossRef] [Green Version]
- Steduto, P.; Çetinkökü, Ö.; Albrizio, R.; Kanber, R. Automated closed-system canopy-chamber for continuous field-crop monitoring of CO2 and H2O fluxes. Agric. For. Meteorol. 2002, 111, 171–186. [Google Scholar] [CrossRef]
- Braun, S.; Thomas, V.F.; Quiring, R.; Fluckiger, W. Does nitrogen deposition increase forest production? The role of phosphorus. Environ. Pollut. 2010, 158, 2043–2052. [Google Scholar] [CrossRef]
- Fan, H.B.; Huang, Y.Z.; Yuan, Y.H.; Li, Y.Y.; Huang, R.Z.; Fan, H.Y. Carbon cycling of forest ecosystems in response to global nitrogen deposition: A review. Acta Ecol. Sin. 2007, 27, 2997–3009. [Google Scholar]
- Zhang, L.; Zeng, C.; Hu, W. Reviews on effects of nitrogen addition on plant photosynthetic carbon fixation. Acta Ecol. Sin. 2017, 37, 147–155. [Google Scholar]
- De Vries, W.; Du, E.; Butterbach-Bahl, K. Short and long-term impacts of nitrogen deposition on carbon sequestration by forest ecosystems. Curr. Opin. Environ. Sustain. 2014, 9, 90–104. [Google Scholar] [CrossRef]
- Dejun, L.; Jiangming, M.; Yunting, F.; Shaolin, P.; Gundersen, P. Impact of nitrogen deposition on forest plants. Acta Ecol. Sin. 2003, 23, 1891–1900. [Google Scholar]
- Wang, F.; Zhang, J.H.; Gu, Y.; Zhao, T.; Han, S.J. Meta-analysis of the effects of nitrogen addition on photosynthesis of forests. Chin. J. Ecol. 2017, 36, 1539–1547. [Google Scholar]
- Bai, Y.; Wu, J.; Clark, C.M.; Naeem, S.; Pan, Q.; Huang, J.; Zhang, L.; Guohan, X. Tradeoffs and thresholds in the effects of nitrogen addition on biodiversity and ecosystem functioning: Evidence from inner Mongolia Grasslands. Glob. Chang. Biol. 2010, 16, 889. [Google Scholar] [CrossRef]
- Zhang, H.; Yuan, F.; Wu, J.; Jin, C.; Pivovaroff, A.L.; Tian, J.; Li, W.; Guan, D.; Wang, A.; McDowell, N.G. Responses of functional traits to seven-year nitrogen addition in two tree species: Coordination of hydraulics, gas exchange and carbon reserves. Tree Physiol. 2021, 41, 190–205. [Google Scholar] [CrossRef]
- Li, D.J.; Mo, J.M.; Peng, S.L.; Fang, Y.T. Effects of simulated nitrogen deposition on elemental concentrations of Schima superba and Cryptocarya concinna seedlings in subtropical China. Acta Ecol. Sin. 2005, 25, 2165–2172. [Google Scholar]
- Lu, X.K.; Mo, J.M.; Li, D.J.; Zang, W.; Fang, Y.T. Effects of simulated N deposition on the photosynthetic and physiologic characteristics of dominant understorey plants in Dinghushan Mountain of subtropical China. J. Beijing For. Univ. 2007, 29, 1–9. [Google Scholar]
- Pei, H.; Gao, W.; Fang, J.; Ye, K.; Zhu, Y.; Huang, F.; Li, Q. Effects of simulated nitrogen deposition on growth and photosynthetic characteristics of one-year-old Toona sinensis seedlings. Chin. J. Eco-Agric. 2019, 10, 1546–1552. [Google Scholar] [CrossRef]
- Reich, P.B.; Walters, M.B.; Tjoelker, M.G.; Vanderklein, D.; Buschena, C. Photosynthesis and Respiration Rates Depend on Leaf and Root Morphology and Nitrogen Concentration in Nine Boreal Tree Species Differing in Relative Growth Rate. Funct. Ecol. 1998, 12, 395–405. [Google Scholar] [CrossRef]
- Kromer, S. Respiration during photosynthesis. Annu. Rev. Plant Biol. 1995, 46, 45–70. [Google Scholar] [CrossRef]
- You, C.M.; Hu, Z.M.; Guo, Q.; Gan, Y.M.; Li, L.H.; Bai, W.M.; Li, S.G. Effects of nitrogen addition on carbon exchange in a typical steppe in Inner Mongolia. Acta Ecol. Sin. 2016, 36, 2142–2150. [Google Scholar]
- Ryan, M.G.; Hubbard, R.M.; Pongracic, S.; Raison, R.J. Foliage, fine-root, woody-tissue and stand respiration in Pinus radiata in relation to nitrogen status. Tree Physiol. 1996, 16, 333–343. [Google Scholar] [CrossRef]
- Weerasinghe, L.K.; Creek, D.; Crous, K.Y.; Xiang, S.; Liddell, M.J.; Turnbull, M.H.; Atkin, O.K. Canopy position affects the relationships between leaf respiration and associated traits in a tropical rainforest in Far North Queensland. Tree Physiol. 2014, 34, 564–584. [Google Scholar] [CrossRef] [Green Version]
- Asao, S.; Bedoya-Arrieta, R.; Ryan, M.G. Variation in foliar respiration and wood CO2 efflux rates among species and canopy layers in a wet tropical forest. Tree Physiol. 2015, 35, 148–159. [Google Scholar] [CrossRef] [Green Version]
- Xia, J.; Niu, S.; Wan, S. Response of ecosystem carbon exchange to warming and nitrogen addition during two hydrologically contrasting growing seasons in a temperate steppe. Glob. Chang. Biol. 2009, 15, 1544–1556. [Google Scholar] [CrossRef]
- Jose, S.; Merritt, S.; Ramsey, C.L. Growth, nutrition, photosynthesis and transpiration responses of longleaf pine seedlings to light, water and nitrogen. For. Ecol. Manag. 2003, 180, 335–344. [Google Scholar] [CrossRef]
- Wang, M.; Xu, X.; Wei, L.; Chen, J.; Wen, X.; Hu, X.; Zhang, F. Photosynthetic Response to Light in Clones of Casuarina equisetifolia. J. S. China Agric. Univ. 2011, 32, 76–79. [Google Scholar]
- Minocha, R.; Stephanie, L.; Bauer, G.A.; Berntson, G.M.; Magill, A.H.; Aber, J.; Bazzaz, F.A. Nitrogen Availability and Net Primary Production in Temperate Forests: The Role of Leaf Physiology, Foliage Turnover and Canopy Structure. Available online: http://abstracts.aspb.org/pb2001/public/P34/0093.html (accessed on 13 May 2021).
- Xiao, L.; Liu, G.B.; Zhang, J.Y.; Yang, T.; Xue, S. Effects of Elevated CO2,Drought Stress and Nitrogen Deposition on Photosynthesis Light Response Curves of Bothriochloa ischaemum. Acta Ecol. Sin. 2016, 24, 69–75. [Google Scholar]
- Li, X.; Li, Z.; Liu, H.; Shi, S.; Feng, J. Foliage Respiratory Characteristics of 5 Evergreen Tree Species Native to the Temperate Deciduous Evergreen Mixed Forest of North American. Sci. Silvae Sin. 2016, 52, 1–10. [Google Scholar]
- Deb Burman, P.K.; Shurpali, N.J.; Chowdhuri, S.; Karipot, A.; Chakraborty, S.; Lind, S.E.; Martikainen, P.J.; Chellappan, S.; Arola, A.; Tiwari, Y.K.; et al. Eddy covariance measurements of CO2 exchange from agro-ecosystems located in subtropical (India) and boreal (Finland) climatic conditions. J. Earth Syst. Sci. 2020, 129. [Google Scholar] [CrossRef]
Figure 1.
Schematic diagram of the observation process of CO2/H2O exchange in sapling crown by chamber method. (a) Schematic overview of the automated multichannel gas-exchange measuring chamber system. Air in the closed chamber passed through the multiplex system air inlet port, analyzer, pump, and the multiplex system air outlet port and then returned to the chamber. The connecting cables are depicted in red lines; (b) schematic drawing of the chamber, showing the opening windows and other assistive devices.

Figure 2.
Daily average air temperature (Tair), soil temperature (Tsoil) at a depth of 10 cm, and daily total photosynthetically active radiation (PAR) at the study site. The chamber experiment period (from 1 June to 30 September 2019) was especially marked.
Figure 2.
Daily average air temperature (Tair), soil temperature (Tsoil) at a depth of 10 cm, and daily total photosynthetically active radiation (PAR) at the study site. The chamber experiment period (from 1 June to 30 September 2019) was especially marked.

Figure 3.
Variations in air temperature difference (ΔT) (a) and vapor pressure deficit difference (ΔVPD) (b) between inside and outside of the chamber were measured at the end of the 6 min chamber closing period with incident light (PAR). Non-linear and linear regressions (black lines) are also shown.

Figure 4.
Monthly averaged diurnal variations in photosynthetic rate (a), respiration rate (b), and net photosynthetic rate (c) of Fraxinus mandshurica saplings after nitrogen addition and the control during the growing season (from 1 June to 30 September). CK, LN, MN and HN represent control (no nitrogen addition), low nitrogen addition (23 kgN·hm−2·a−1), medium nitrogen addition (46 kgN·hm−2·a−1) and high nitrogen addition (69 kgN·hm−2·a−1), respectively.

Figure 5.
Daily sums of gross primary productivity (GPP) (a) the daytime respiration rate (Rd), (b) the night-time respiration rate (Rn), (c) and net crown CO2 exchange rate (Ne), (d) after nitrogen addition and the control during the growing season (from 1 June to 30 September). CK, LN, MN and HN represent control (no nitrogen addition), low nitrogen addition (23 kgN·hm−2·a−1), medium nitrogen addition (46 kgN·hm−2·a−1) and high nitrogen addition (69 kgN·hm−2·a−1), respectively.

Figure 6.
Monthly accumulation of net crown CO2 exchange (Ne, the grey column), crown respiration (R, the black column), and gross primary production (GPP, the total length of the grey and black column) after nitrogen addition and the control during the growing season from (a–d) June to September. CK, LN, MN and HN represent control (no nitrogen addition), low nitrogen addition (23 kgN·hm−2·a−1), medium nitrogen addition (46 kgN·hm−2·a−1) and high nitrogen addition (69 kgN·hm−2·a−1), respectively. Letters (a, b, or c) suggest significant differences between treatments at α = 0.05.

Figure 7.
Cumulative values of gross primary productivity (GPP). (a) crown respiration (R), and (b) net crown carbon exchange (Ne), (c) after nitrogen addition and the control during the growing season (from June to September). CK, LN, MN and HN represent control (no nitrogen addition), low nitrogen addition (23 kgN·hm−2·a−1), medium nitrogen addition (46 kgN·hm−2·a−1) and high nitrogen addition (69 kgN·hm−2·a−1), respectively. Letters (a, b, or c) suggest significant differences between treatments at α = 0.05.

Figure 8.
Ne − PAR relations from June to September (a–d). Dots represent hourly daytime Ne values; curves are Michaelis–Menten equation fits (Equation (4)). The solid lines, dashed lines, dot-dash lines, and dotted lines show the Ne − PAR curves under CK (control, no nitrogen addition), LN (low nitrogen addition, 23 kgN·hm−2·a−1), MN (medium nitrogen addition, 46 kgN·hm−2·a−1), and HN (high nitrogen addition, 69 kgN·hm−2·a−1) treatments, respectively. Equation fitting parameters for these months are presented in (e–g): maximum net photosynthetic rate of crown (Nemax), the daytime respiration of crown (Rd), and initial quantum efficiency (α).

Figure 9.
Ne − PAR relations for different VPD ranges (0 kPa < VPD ≤ 1 kPa, 0.5 kPa < VPD ≤ 1.5 kPa, 1 kPa < VPD ≤ 2 kPa and VPD > 1.5 kPa) and nitrogen addition levels (a–d) during the growing season. Dots represent hourly daytime Ne values and lines are Michaelis–Menten equation fits (Equation (4)). The solid lines, dashed lines, dot-dash lines, and dotted lines show the Ne − PAR curves under CK (control, no nitrogen addition), LN (low nitrogen addition, 23 kgN·hm−2·a−1), MN (medium nitrogen addition, 46 kgN·hm−2·a−1), and HN (high nitrogen addition, 69 kgN·hm−2·a−1) treatments, respectively. Equation fitting parameters for these months are presented in (e–g): maximum net photosynthetic rate of crown (Nemax), the daytime respiration of crown (Rd), and initial quantum efficiency (α). The black lines represent the linear regression across all N treatments, and the light grey shading represents the 95% confidence intervals.

Publisher’s Note: MDPI stays neutral with regard to jurisdictional claims in published maps and institutional affiliations. |
© 2021 by the authors. Licensee MDPI, Basel, Switzerland. This article is an open access article distributed under the terms and conditions of the Creative Commons Attribution (CC BY) license (https://creativecommons.org/licenses/by/4.0/).
Share and Cite
MDPI and ACS Style
Gong, C.; Wang, A.; Yuan, F.; Liu, Y.; Cui, C.; Zhu, K.; Guan, D.; Wu, J. Effects of Soil Nitrogen Addition on Crown CO2 Exchange of Fraxinus mandshurica Rupr. Saplings. Forests 2021, 12, 1170. https://doi.org/10.3390/f12091170
AMA Style
Gong C, Wang A, Yuan F, Liu Y, Cui C, Zhu K, Guan D, Wu J. Effects of Soil Nitrogen Addition on Crown CO2 Exchange of Fraxinus mandshurica Rupr. Saplings. Forests. 2021; 12(9):1170. https://doi.org/10.3390/f12091170
Chicago/Turabian StyleGong, Chunjuan, Anzhi Wang, Fenghui Yuan, Yage Liu, Chen Cui, Kai Zhu, Dexin Guan, and Jiabing Wu. 2021. "Effects of Soil Nitrogen Addition on Crown CO2 Exchange of Fraxinus mandshurica Rupr. Saplings" Forests 12, no. 9: 1170. https://doi.org/10.3390/f12091170
Note that from the first issue of 2016, this journal uses article numbers instead of page numbers. See further details here.