
Parameter Extraction of Solar Module Using the Sooty Tern Optimization Algorithm
by
 , , ,
, , ,
Abha Singh
1 ,
,
Abhishek Sharma
2,3,
Shailendra Rajput
2 ,
,
Amit Kumar Mondal
4,
Amarnath Bose
5,* and
Mangey Ram
6 
1
Department of Basic Science, College of Science and Theoretical Study, Saudi Electronic University, Dammam-Female Branch, Dammam 32242, Saudi Arabia
2
Department of Electrical and Electronic Engineering, Ariel University, Ariel 40700, Israel
3
Department of Research & Development, University of Petroleum and Energy Studies, Dehradun 248007, India
4
Department of Mechatronics Engineering, School of Engineering & Information Technology, Manipal Academy of Higher Education, Dubai 345050, United Arab Emirates
5
Sustainability Cluster, School of Engineering (SOE), University of Petroleum & Energy Studies, Dehradun 248007, India
6
Department of Mathematics, Computer Science and Engineering, Graphic Era (Deemed to be University), Dehradun 248002, India
*
Author to whom correspondence should be addressed.
Electronics 2022, 11(4), 564; https://doi.org/10.3390/electronics11040564
Submission received: 7 January 2022
/
Revised: 2 February 2022
/
Accepted: 11 February 2022
/
Published: 13 February 2022
(This article belongs to the Special Issue Energy Harvesting and Energy Storage Systems)
Abstract
:Photovoltaic module parameter estimation is a critical step in observing, analyzing, and optimizing the efficiency of solar power systems. To find the best value for unknown parameters, an efficient optimization strategy is required. This paper presents the implementation of the sooty tern optimization (STO) algorithm for parameter assessment of a solar cell/module. The simulation findings were compared to four pre-existing optimization algorithms: sine cosine (SCA) algorithm, gravitational search algorithm (GSA), hybrid particle swarm optimization and gravitational search algorithm (PSOGSA), and whale optimization (WOA). The convergence rate and root mean square error evaluations show that the STO method surpasses the other studied optimization techniques. Additionally, the statistical results show that the STO method is superior in average resilience and accuracy. The superior performance and reliability of the STO method are further validated by the Friedman ranking test.
1. Introduction
Recently, clean energy usage has increased significantly as demand for all other fuels declined because of environmental concerns. As a result,, the scientific community made substantial efforts to harvest energy from different ambient sources [1,2,3,4,5]. Solar energy harvesting has become the most ideal option since it surpasses all traditional nonrenewable and renewable resources [6]. As a result, the worldwide solar electricity sector is expanding significantly, with a current value of more than $10 billion each year [6,7,8].
Solar energy is converted into electrical energy by employing photovoltaic (PV) panels [9]. Numerous PV panels are linked together in serial and/or parallel arrangements to create bulky solar energy plants equipped with maximum power point tracking (MPPT) systems to increase power generation. The primary goal of MPPT systems is to regulate the parameters of the PV system to generate optimum power [9]. The rapid deviation of electrical energy production is a well-known property of solar plants [9]. Many solar facilities are linked to local grids, and their operation at the same time as the grids causes voltage instability in distribution lines [10]. Hence, stable and maximized power generation from solar plants is an essential requirement of the green energy movement. To obtain maximum power density, both theoretical and experimental studies were performed to optimize the parameters of PV panels [4,11,12,13]. Single, double, and triple diode models of PV cells are widely employed to identify the current-voltage parameters [14,15,16]. These parameters are helpful for determining the accuracy and steadiness of the models. However, parameter assessment is not an easy task because of unbalanced operational cases such as faults and ageing. In most cases, the single diode model is employed because of ease and acceptance. On the other hand, the double diode model is anticipated to be more than the three-diode model accurate in case of lower solar irradiance.
Different types of algorithms were proposed and studied to get more accurate and precise parameters from nonlinear implicit equations with high accuracy [17,18,19,20,21,22,23,24,25,26,27,28,29,30,31,32,33]. The merits and demerits of these algorithms are categorized because of the trade-off between exploration and exploitation capabilities [17]. Some became caught in local optima solutions because of a lack of exploration capabilities for finding an optimal solution in the search space. Heuristic and deterministic are the two main groups of algorithms. Heuristic algorithms contain particle swarm optimization (PSO) [18], cuckoo search algorithm [19], harmony search [20], cat swarm optimization (CSO) [21], differential evolution (DE) [22], artificial bee colony [23], chaos CPSO [24], simulated annealing [25], biogeography-based optimization algorithm with mutation strategies [26], genetic algorithms [27], improved adaptive differential evolution [28], pattern search [29], generalized opposition-based teaching-learning-based optimization [30], and Nelder–Mead modified PSO [31]. The Lambert W-functions [32], least squares [33], iterative curve-fitting methods [34], conductivity method [35], Levenberg–Marquardt algorithm [36], Newton–Raphson, and nonlinear least square are categorized as deterministic algorithms. The applicability of deterministic algorithms is restricted because of continuity, differentiability, and convexity related to objective functions. These algorithms are likewise sensitive to the starting solution and settle at local optima in most cases. Because they do not include difficult mathematics, biorelated algorithms are more realistic and robust optimization methods for simplifying complex transcendental equations.
The sooty tern optimization (STO) algorithm mimics the attack and migration behavior of sooty terns (birds of tropical oceans). This algorithm provides a good balance between exploration and exploitation strategy and thus reaches optimal solution without getting trapped in a local solution. These benefits allow researchers to apply the STO for parameter extraction of a solar module. The key purposes of this research investigation are as follows:
- To first present the experimental results that verify the performance of the STO in handling the parameter extraction problem of the solar module.
- To use two test cases—R.T.C France solar cell and SS2018P polycrystalline PV module—to evaluate the effectiveness of the STO and compare it with other metaheuristic algorithms.
- To use the experimental results to comprehensively confirm that STO is competitive compared to other existing methods in literature.
This study utilizes the STO algorithm for the parameter assessment of PV cells/modules. Initially, the mathematical model for PV cell/module and problem formulation is discussed. At the second stage, the STO algorithm is briefly introduced and used to assess the optimal magnitude of undetermined parameters. Next, the output results are examined with a measured dataset, and the algorithm is compared to pre-existing metaheuristic algorithms. Section 5 contains the discussion and conclusion of manuscript.
2. Problem Formulation and Methodology
2.1. Mathematical Modeling of Solar Panels
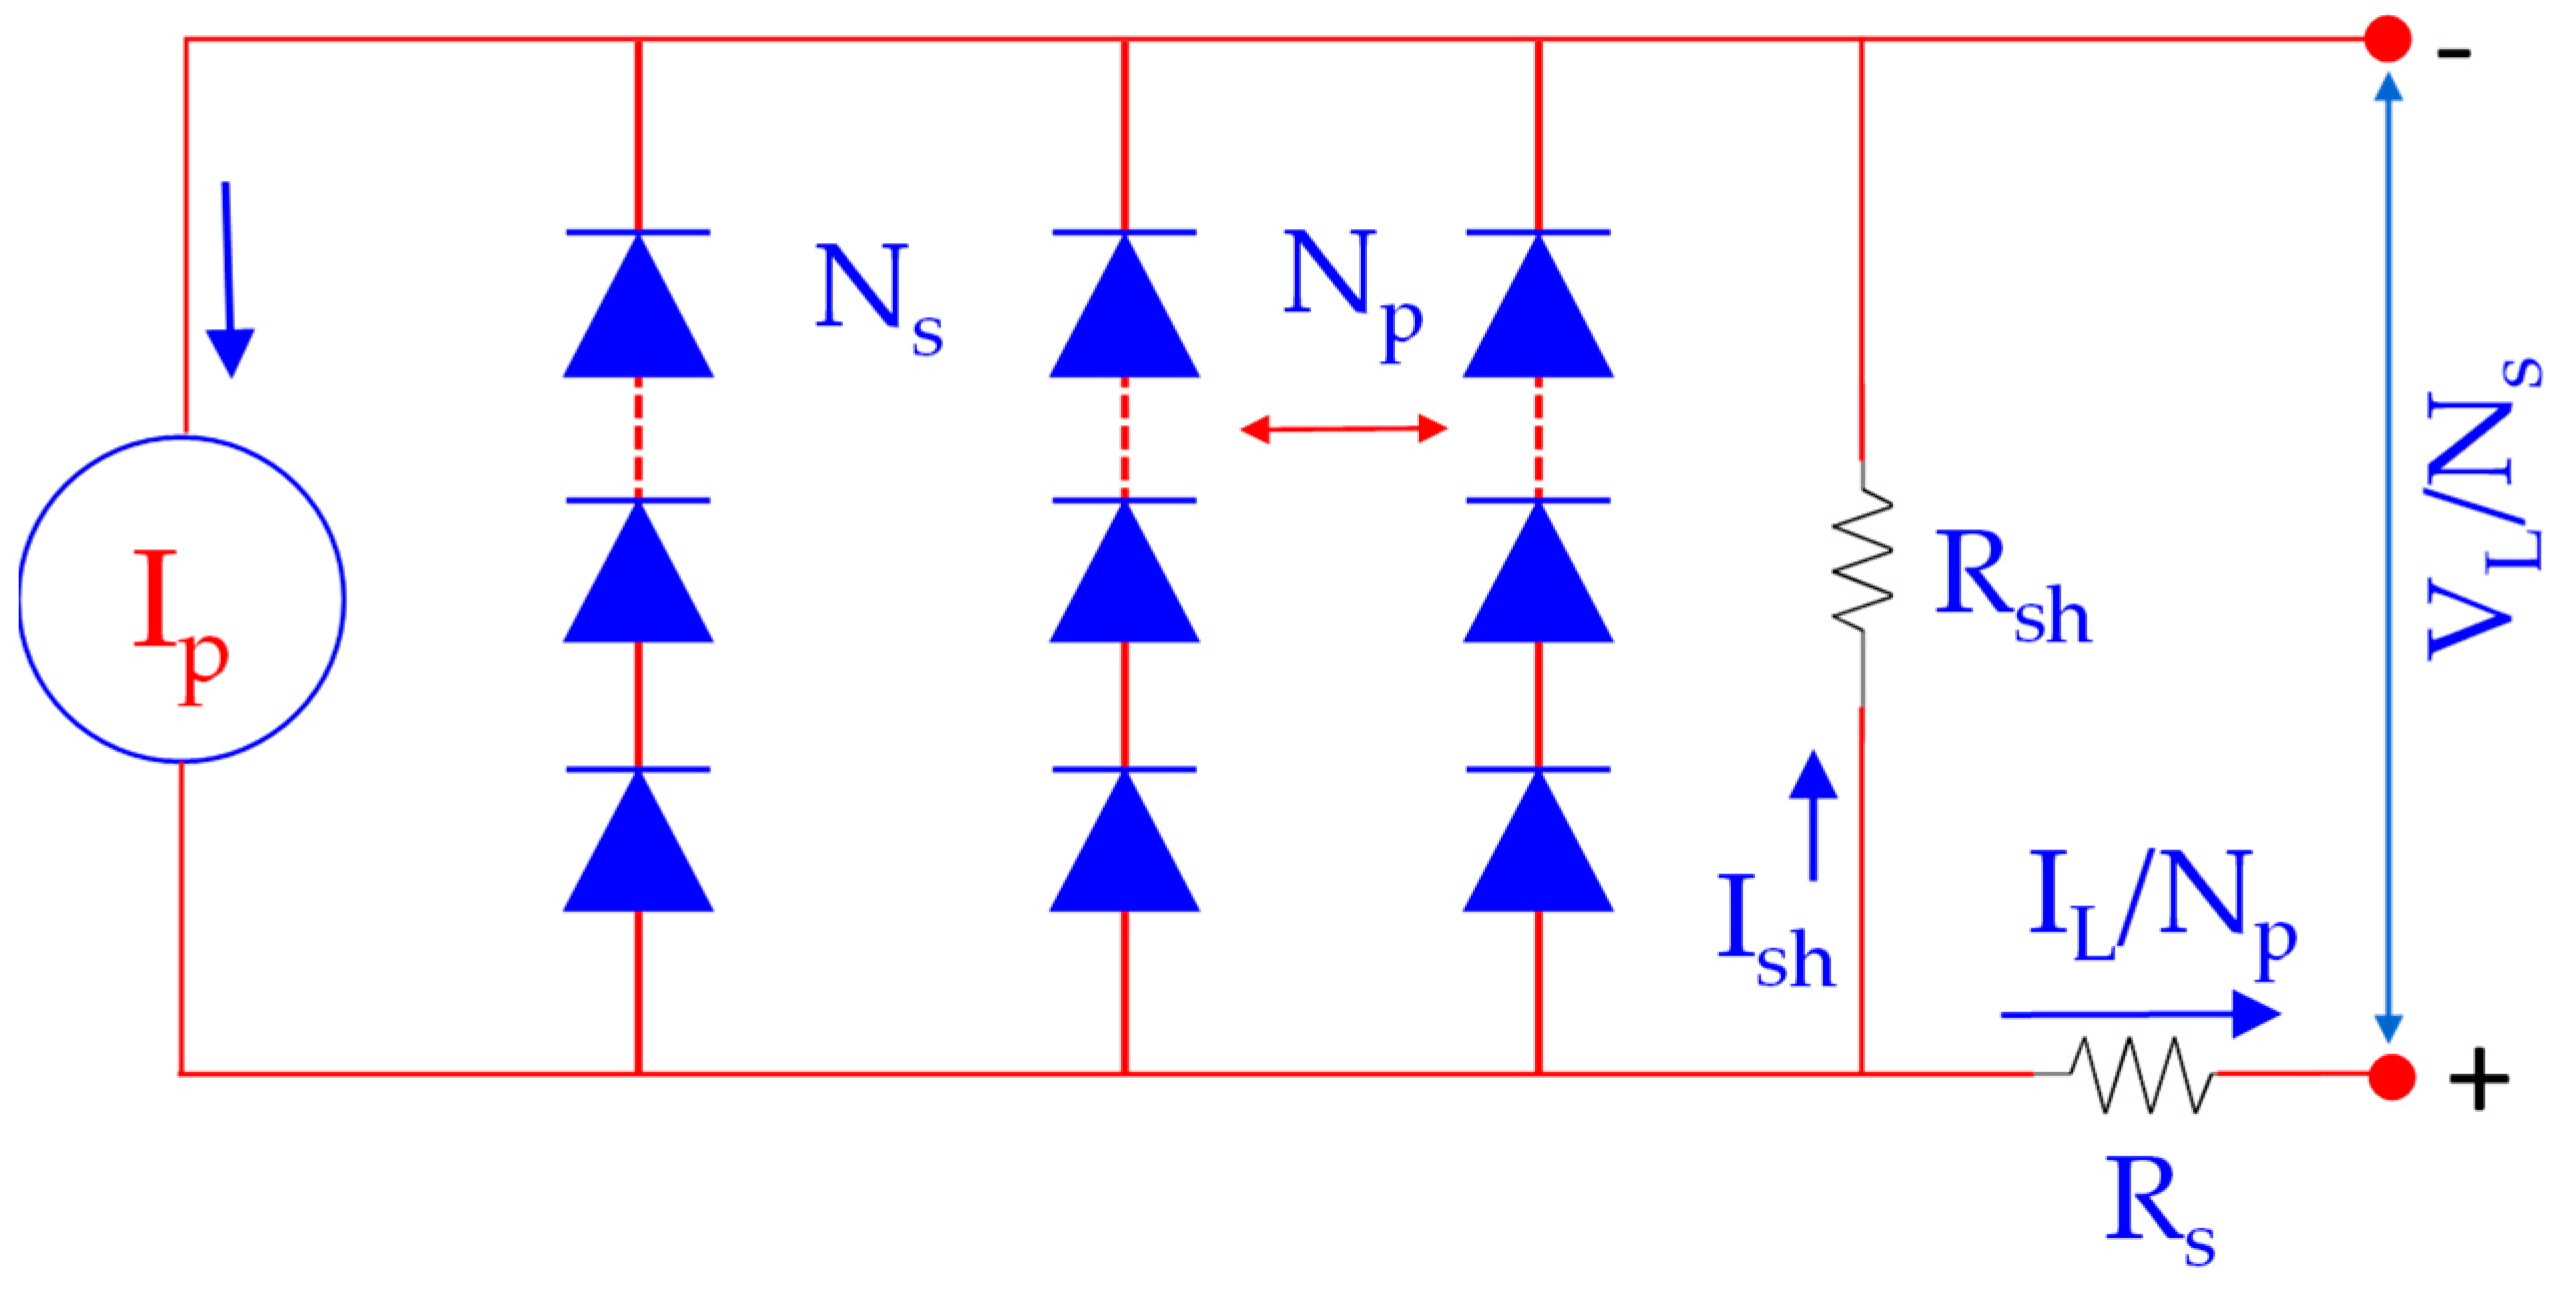
Figure 1 depicts the PV panel’s comparable circuit model. At the output terminal, the correlation between voltage () and current () is expressed as:
where and denote the count of solar cells interconnected in parallel and series combinations. The is the Boltzmann constant (1.3806 × 10⁻²³ m2kgK−1s−2), is the cell/module temperature, is elementary charge, is photovoltaic current, is diode saturation current, series resistance, shunt resistance, and is the module quality factor. Only five parameters (, , , , ) are required to calculate the minimum value of root mean square error (RMSE).
2.2. Objective Function
The main objective of the presented study is to lessen the variance among experimental and estimated data by optimizing unknown parameters for the single-diode model. Unknown parameters (, , , , ) are employed as decision variables during the optimization process. The accumulative squared variation between calculated and observed data is applied as an objective function. The error objective function is denoted as follows [37,38]:
where and denote the observed value of voltage and current of the PV module. The range of experimental datasets is specified by the parameter ‘’ and the algorithm’s best answer is indicated by a vector . In the case of the PV panel module:
3. Sooty Tern Optimization
The sooty tern optimization (STO) algorithm was proposed in 2019 [39,40]. The algorithm is inspired by the attacking behavior of sooty tern birds. Generally, sooty terns live in groups. They employ their intelligence to locate and attack a target. The most notable characteristics of sooty terns are their migrating and assaulting behaviors. The following provide insights into sooty tern birds:
- Sooty terns travel in groups during migration. To avoid collisions, the initial positions of sooty terns are different.
- In a group, sooty terns with low fitness levels can nevertheless travel the same distance that the fittest among them can.
- Sooty terns with low fitness can upgrade their preliminary locations on the basis of the fittest sooty tern.
3.1. Migration Behavior
A sooty tern must meet three requirements during a migration:
Collision avoidance: SA is used to compute a new search agent location to avoid collisions with its neighborhood search agents (i.e., sooty terns).
where denotes the position of a sooty tern that does not collide with other terns. represents the current location of the sooty tern. signifies the current iteration, and denotes the migration of a sooty tern in the solution space.
Converge in the direction of best neighbor: Following collision evasion, the search agents converge in the path of the finest neighbor.
where denotes a different position of a search agent (i.e., sooty tern). shows the best location of a search agent, and signifies the random variable and can be computed as follows:
where represents any arbitrary number in the range of 0 and 1.
Updating corresponding to best search agent: Finally, the sooty tern can revise its location in relation to the best search agent.
where signifies the difference between the search agent and the best fittest search agent.
3.2. Attacking Behavior
Sooty terns can modify their speed and attack angle during migration. They gain altitude by flapping their wings. They produce spherical behavior in the air while attacking prey, which is explained below.
where, denotes the radius of each spiral turn, signifies the value in the range of [0 ≤ ≤ 2π], and the and are the constant values.
3.3. Execution Steps of STO for Parameter Estimation
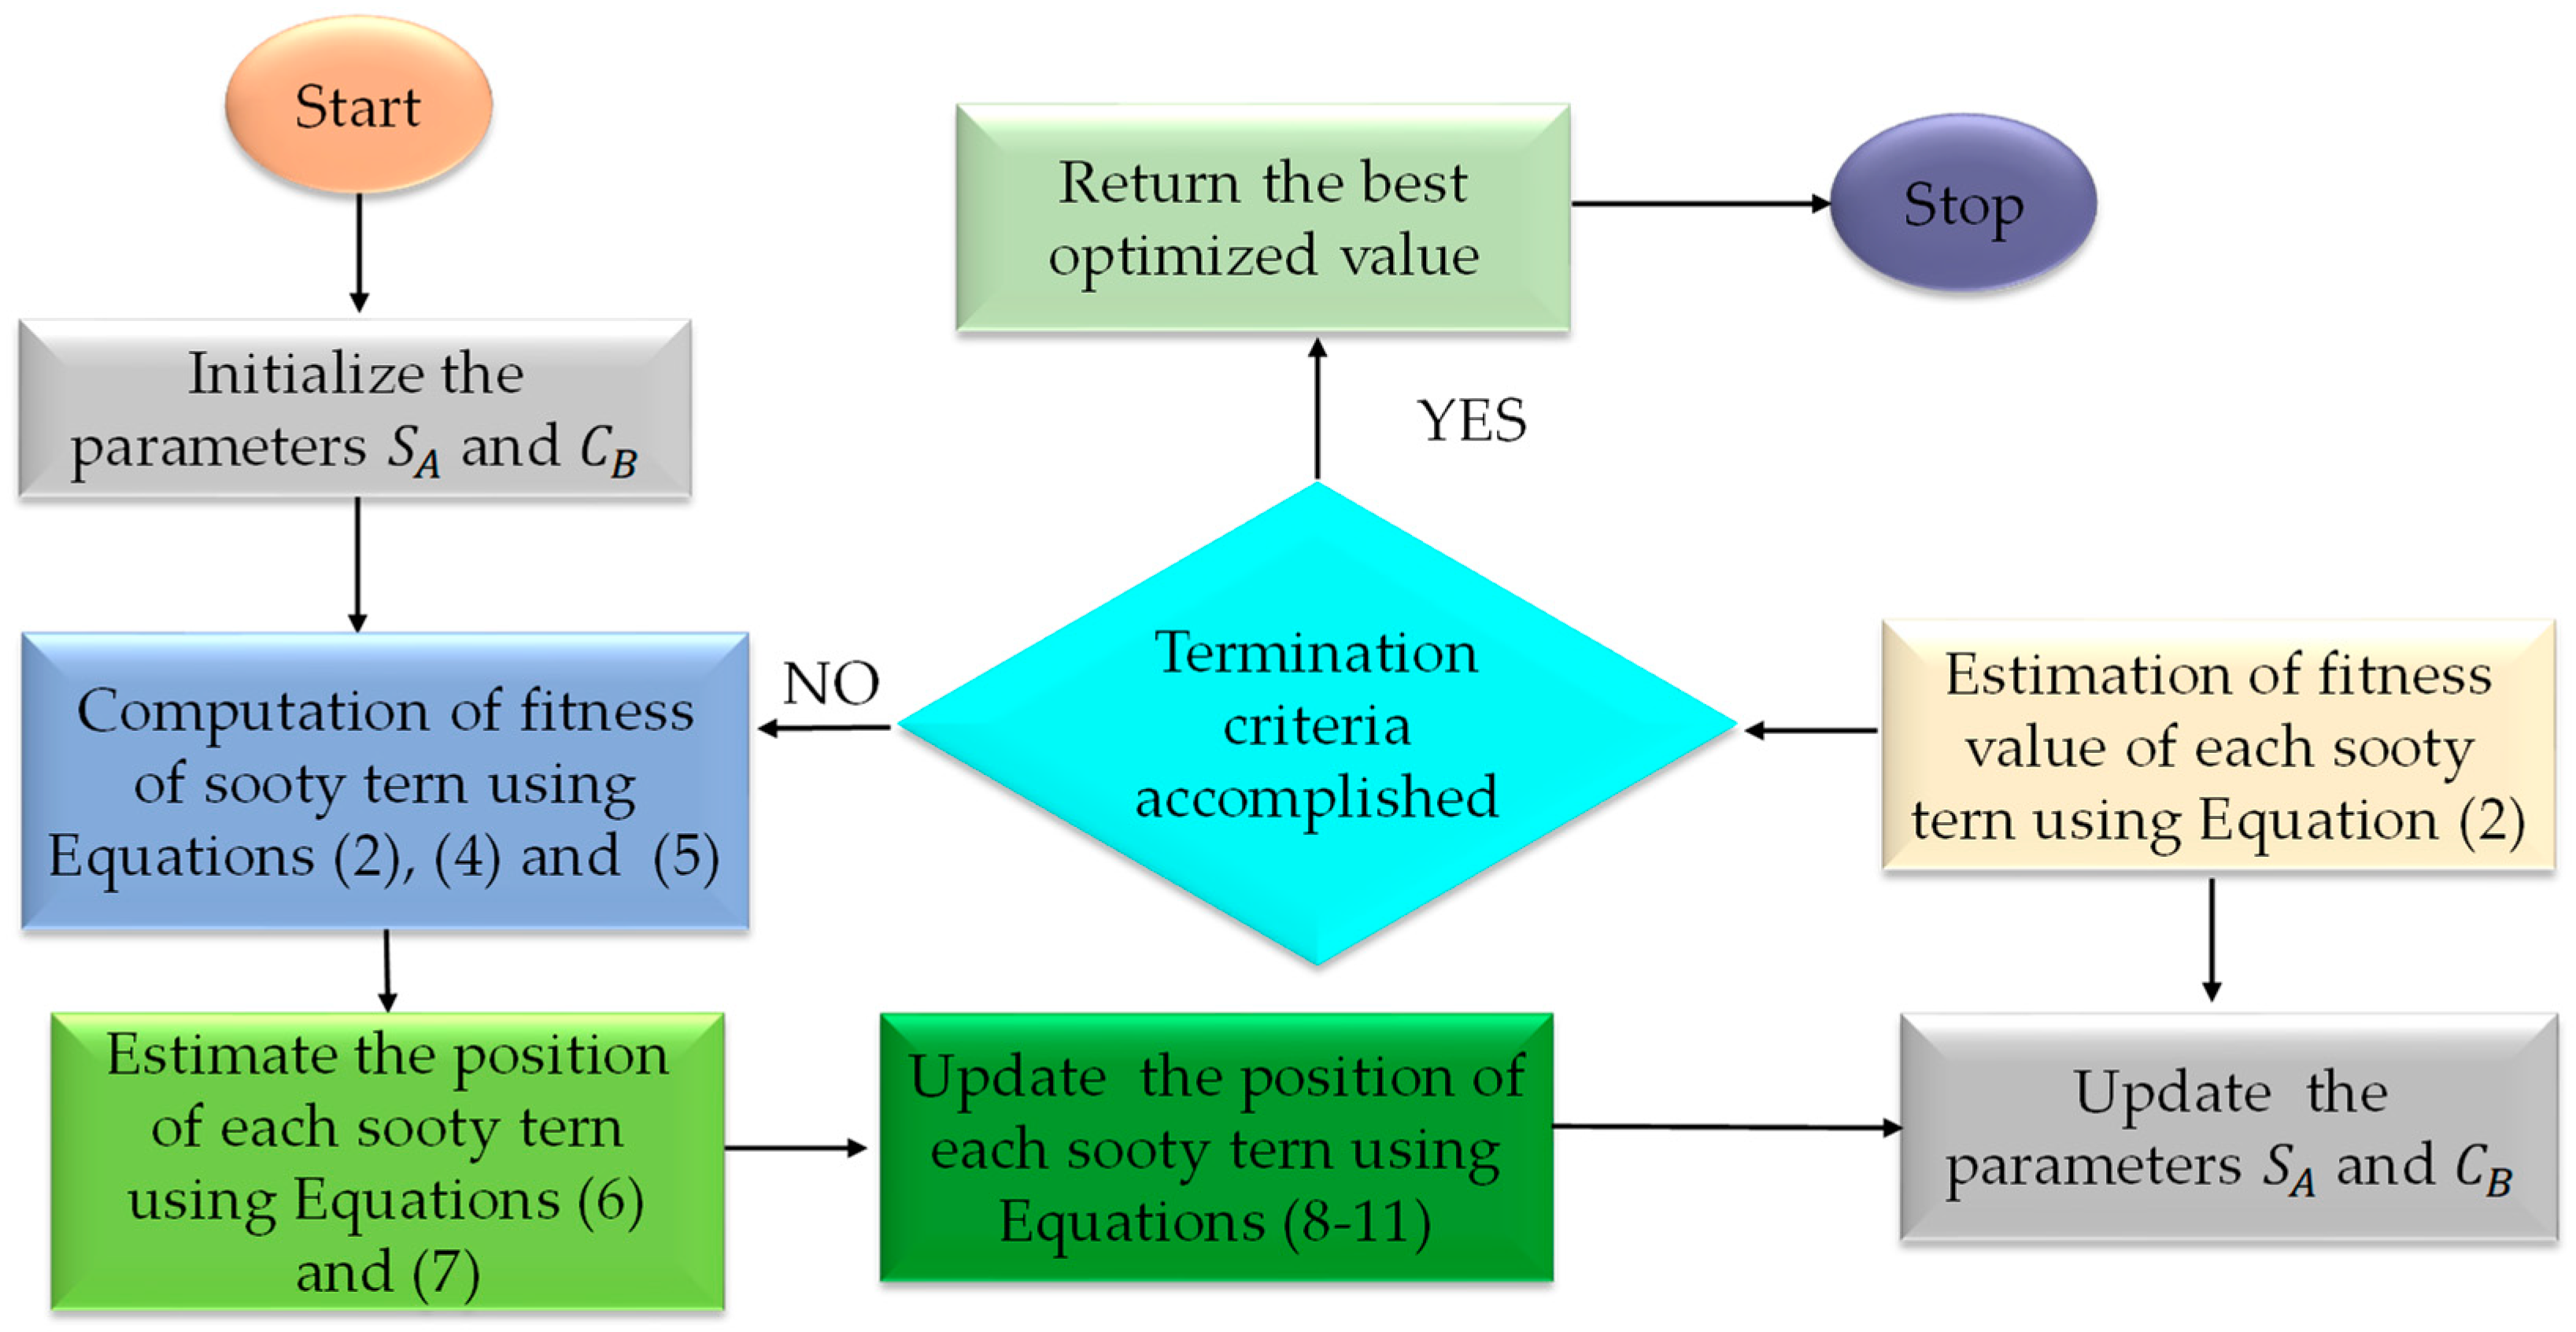
Figure 2 illustrates the flowchart of the STO algorithm for optimized parameter estimation of a solar cell/module. The algorithm works as follows:
- Step 1. In the search space, begin the population of search agents of the fifth order dimension. The photovoltaic current (), diode saturation current (), series resistance (), shunt resistance (), and diode ideality factor are all represented by the fifth order dimension ().
- Step 2. In the search space, control the fitness of all agents using Equation (2).
- Step 3. At each iteration, the STO is employed to adjust the position of the agents. Because the algorithm is intended to function in the minimization mode, the location of the particles with the least cost suggests the best SDM parameters with the minimum RMSE.
4. Results and Discussion
In this section, we examine the validity of the STO algorithm and describe how we tested it under standard temperature conditions (1000 W/m2 at 25 °C) utilizing primarily one R.T.C France solar cell and polycrystalline PV module (SS2018P). The extracted PV module characteristics were tracked and employed to generate simulated I-V and P-V data sets. The dependability of the STO algorithm was examined and compared to four metaheuristic algorithms: GSA [41], SCA [42], GWO [43], and WOA [44]. The size of the sample and the objective function evaluations for the experiment were fixed to 30 and 50,000, respectively. In addition, at least 30 independent runs were performed to avoid duplication.
The effectiveness of the proposed method was evaluated using several empirical constraints, e.g., internal absolute error (IAE), correctness of the curve-fitting, and global minimum convergence rates. The current and voltage data for the R.T.C France solar cell [45] and the SS2018P polycrystalline PV module [38] were collected experimentally. In the SS2018P PV module, 36 polycrystalline cells were connected serially [38]. Table 1 tabulates the exploration ranges for every parameter (i.e., upper and lower bounds). These ranges were utilized by investigators in this study. The STO algorithm [46] was simulated on a MATLAB 2018a (MathWorks, Mexico, DF, Mexico) platform with an Intel ® core TM i5-HQ CPU running at turbo frequency of 4.8 GHz and 8 GB of RAM.
4.1. Parameter Extraction of the R.T.C France Solar Cell
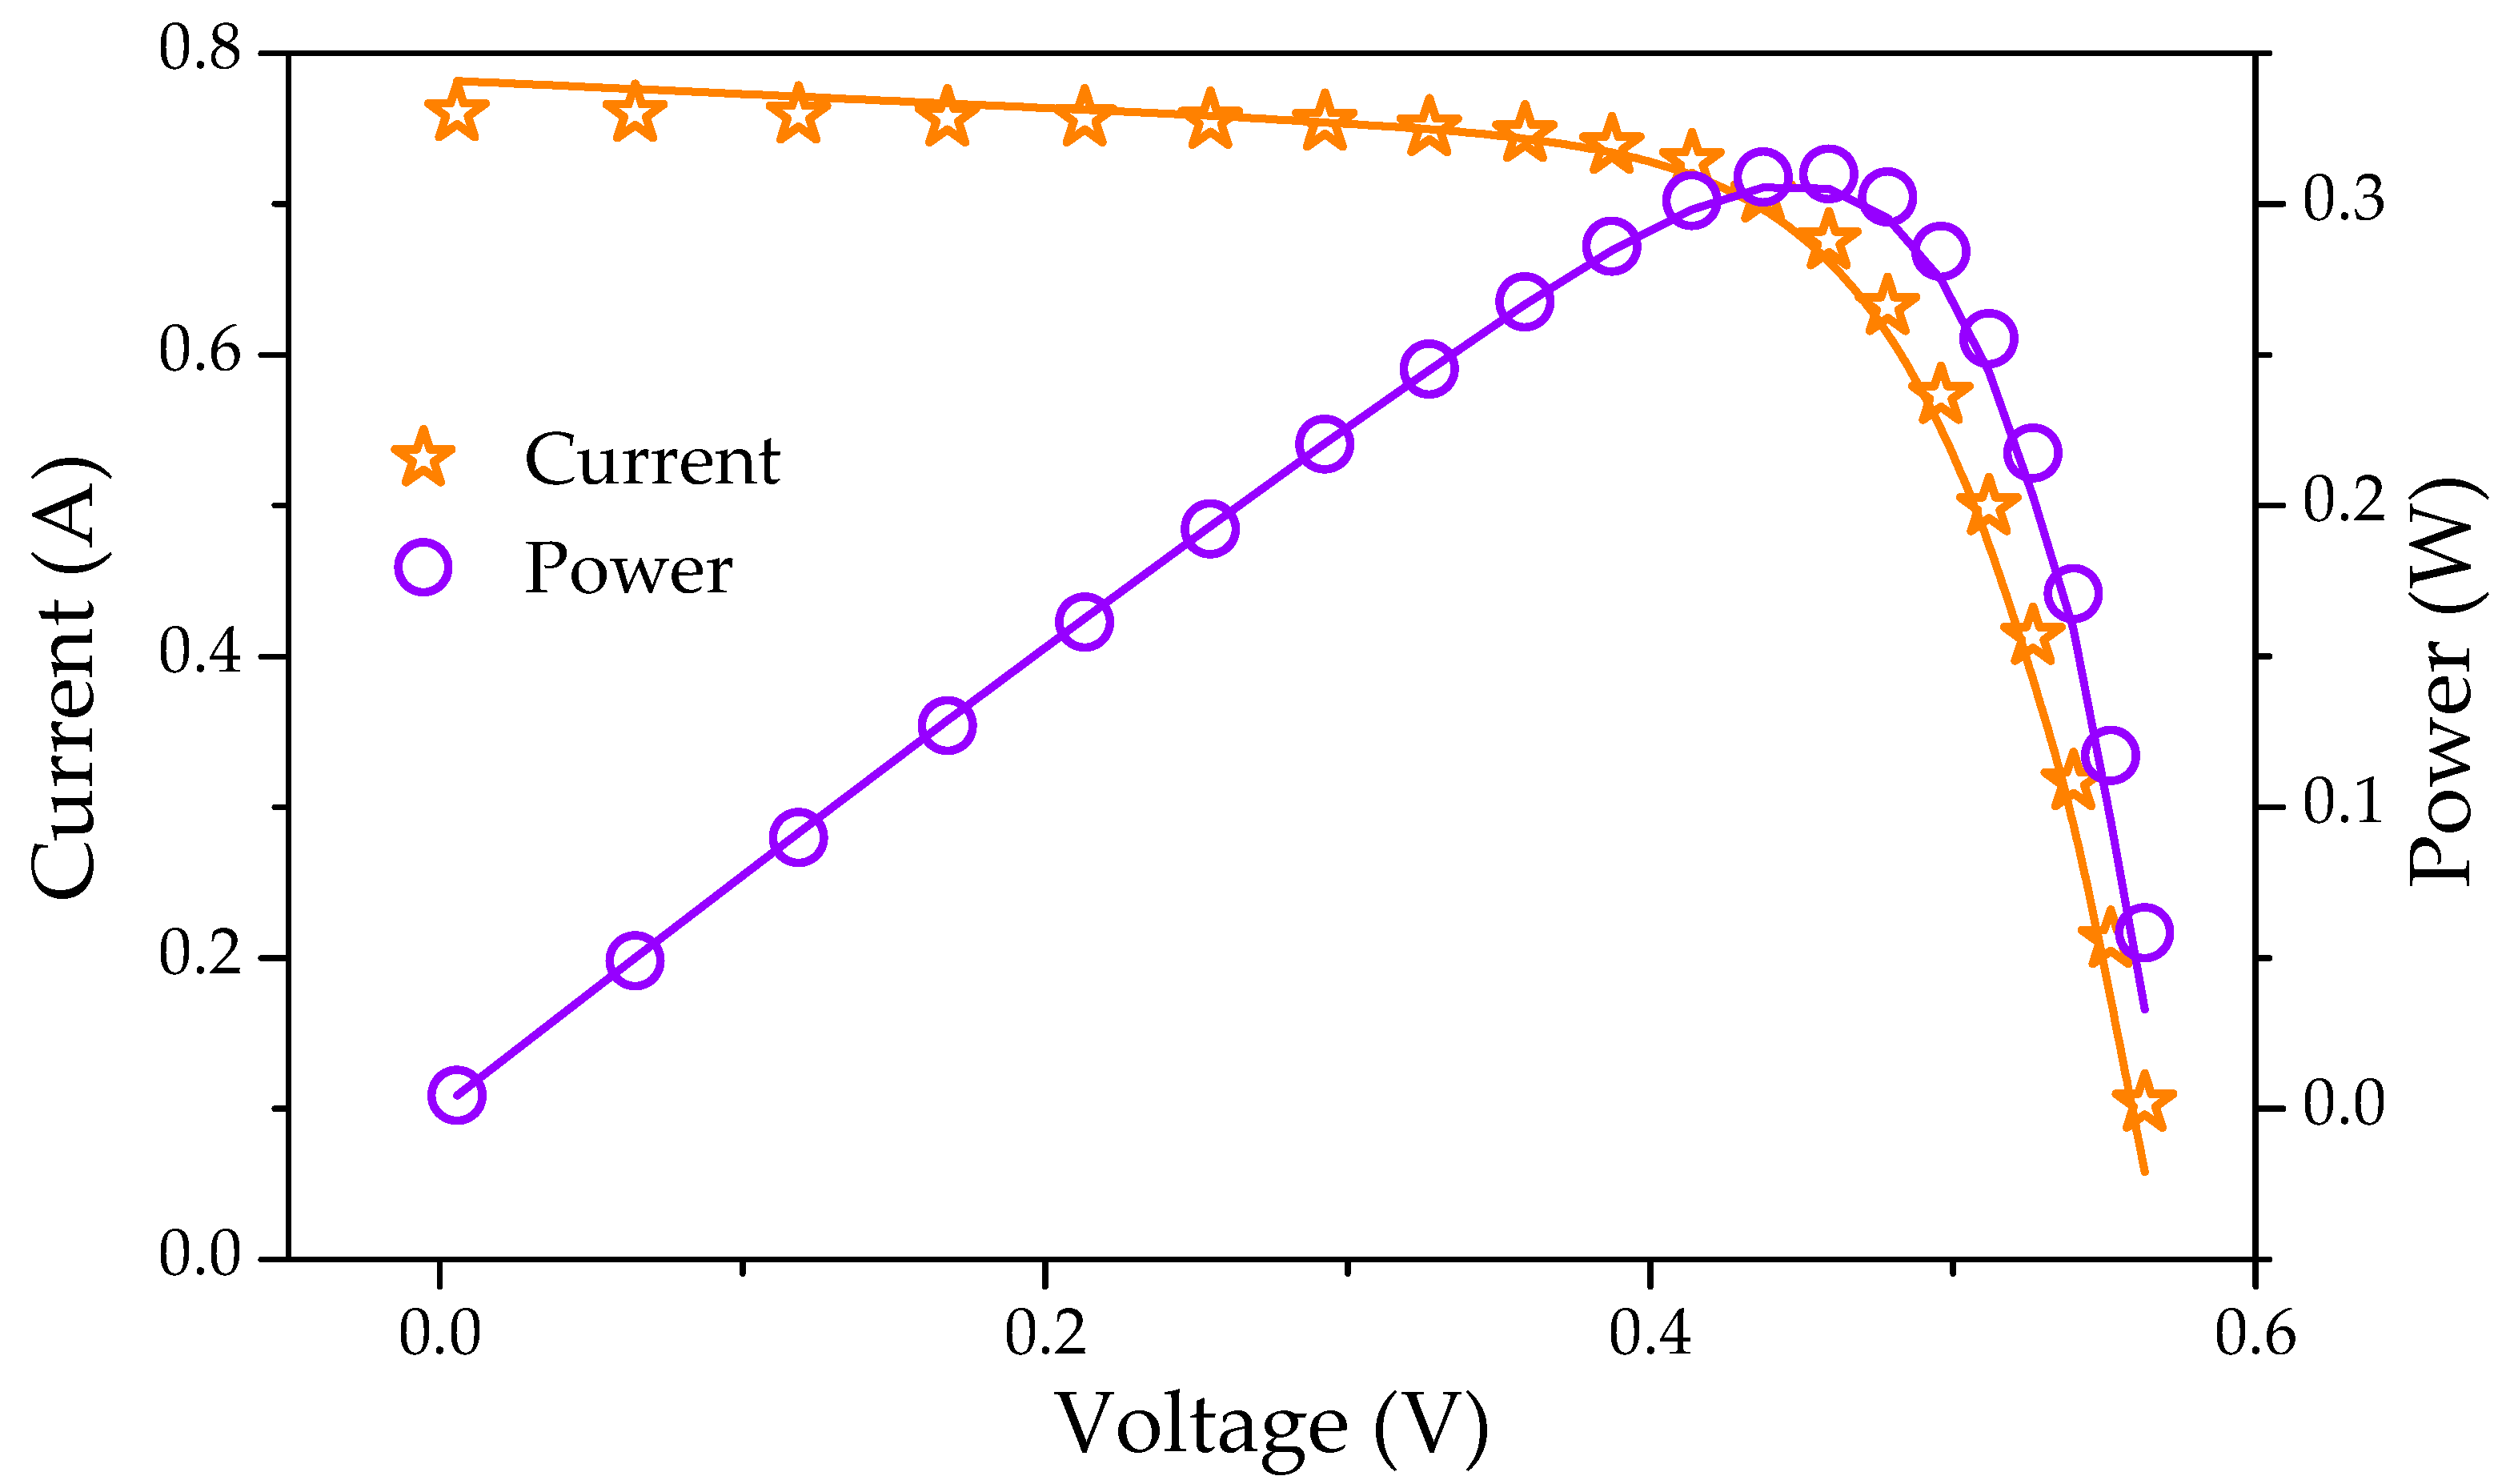
For a single-diode model, five parameters (, , , , ) must be estimated. The values of simulated current and power with their IAE are charted in Table 2. Table 3 shows the values of the STO-optimized parameters and RMSE for comparison. The STO algorithm has the lowest RMSE of 8.6106 × 10⁻⁴ when compared to other algorithms. In this case, RMSE values are obtained as an index for evaluating results with previously constructed techniques by the researchers. Figure 3 depicts a redrawn current-voltage (I-V) and power-voltage (P-V) characteristics curve for a single-diode model based on the optimum optimized parameters achieved by executing the STO method. The computed data generated by the STO was found to be very close to the experimental data set across the whole voltage range.
4.2. Parameter Extraction of the SS2018P PV Module
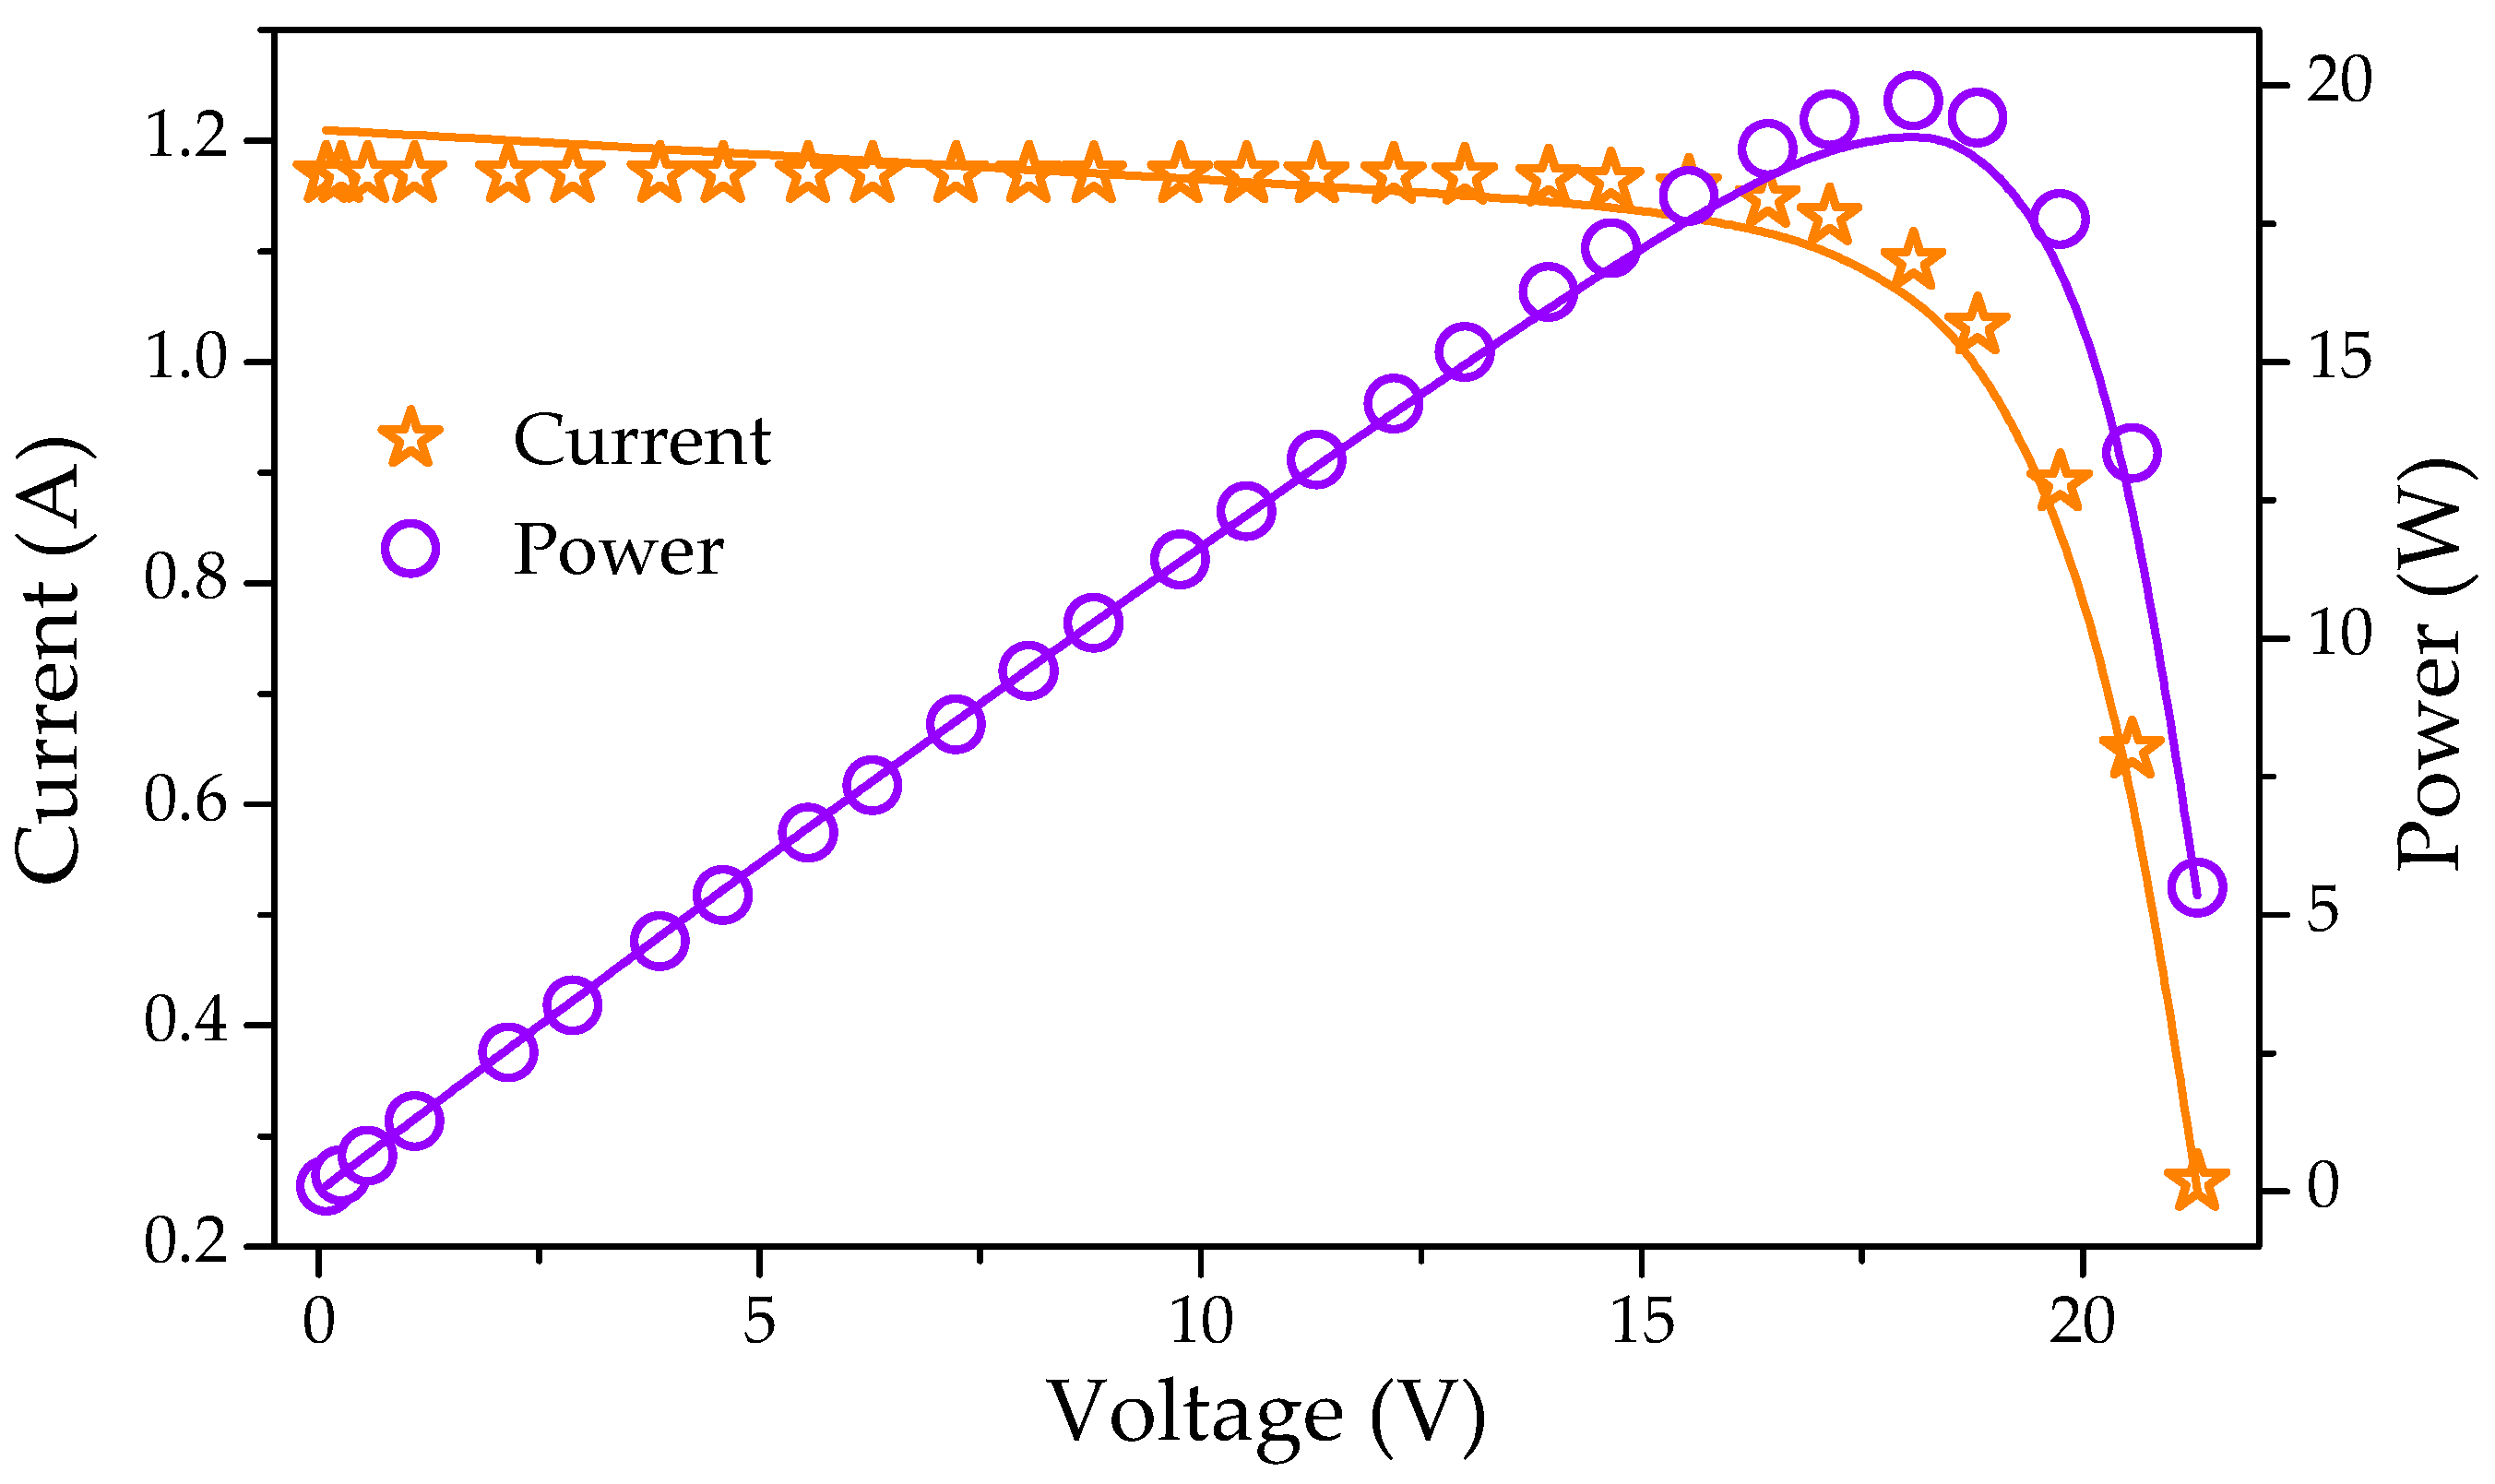
To properly assess the efficacy of the STO algorithm, parameters for the SS2018P PV module were computed at 1000 W/m2 and 25 ℃, using the SDM model. The values of simulated current and power with their IAE are tabulated in Table 4. Table 5 shows the optimized value of all five parameters (, , , , ) for SDM of the PV module at standard temperature condition. Figure 4 depicts a redrawn I-V and P-V characteristics curve for a single-diode model based on the optimum optimized parameters achieved by executing the STO method. It was observed that the simulated data provided by the STO was extremely closely related to the experimental data set.
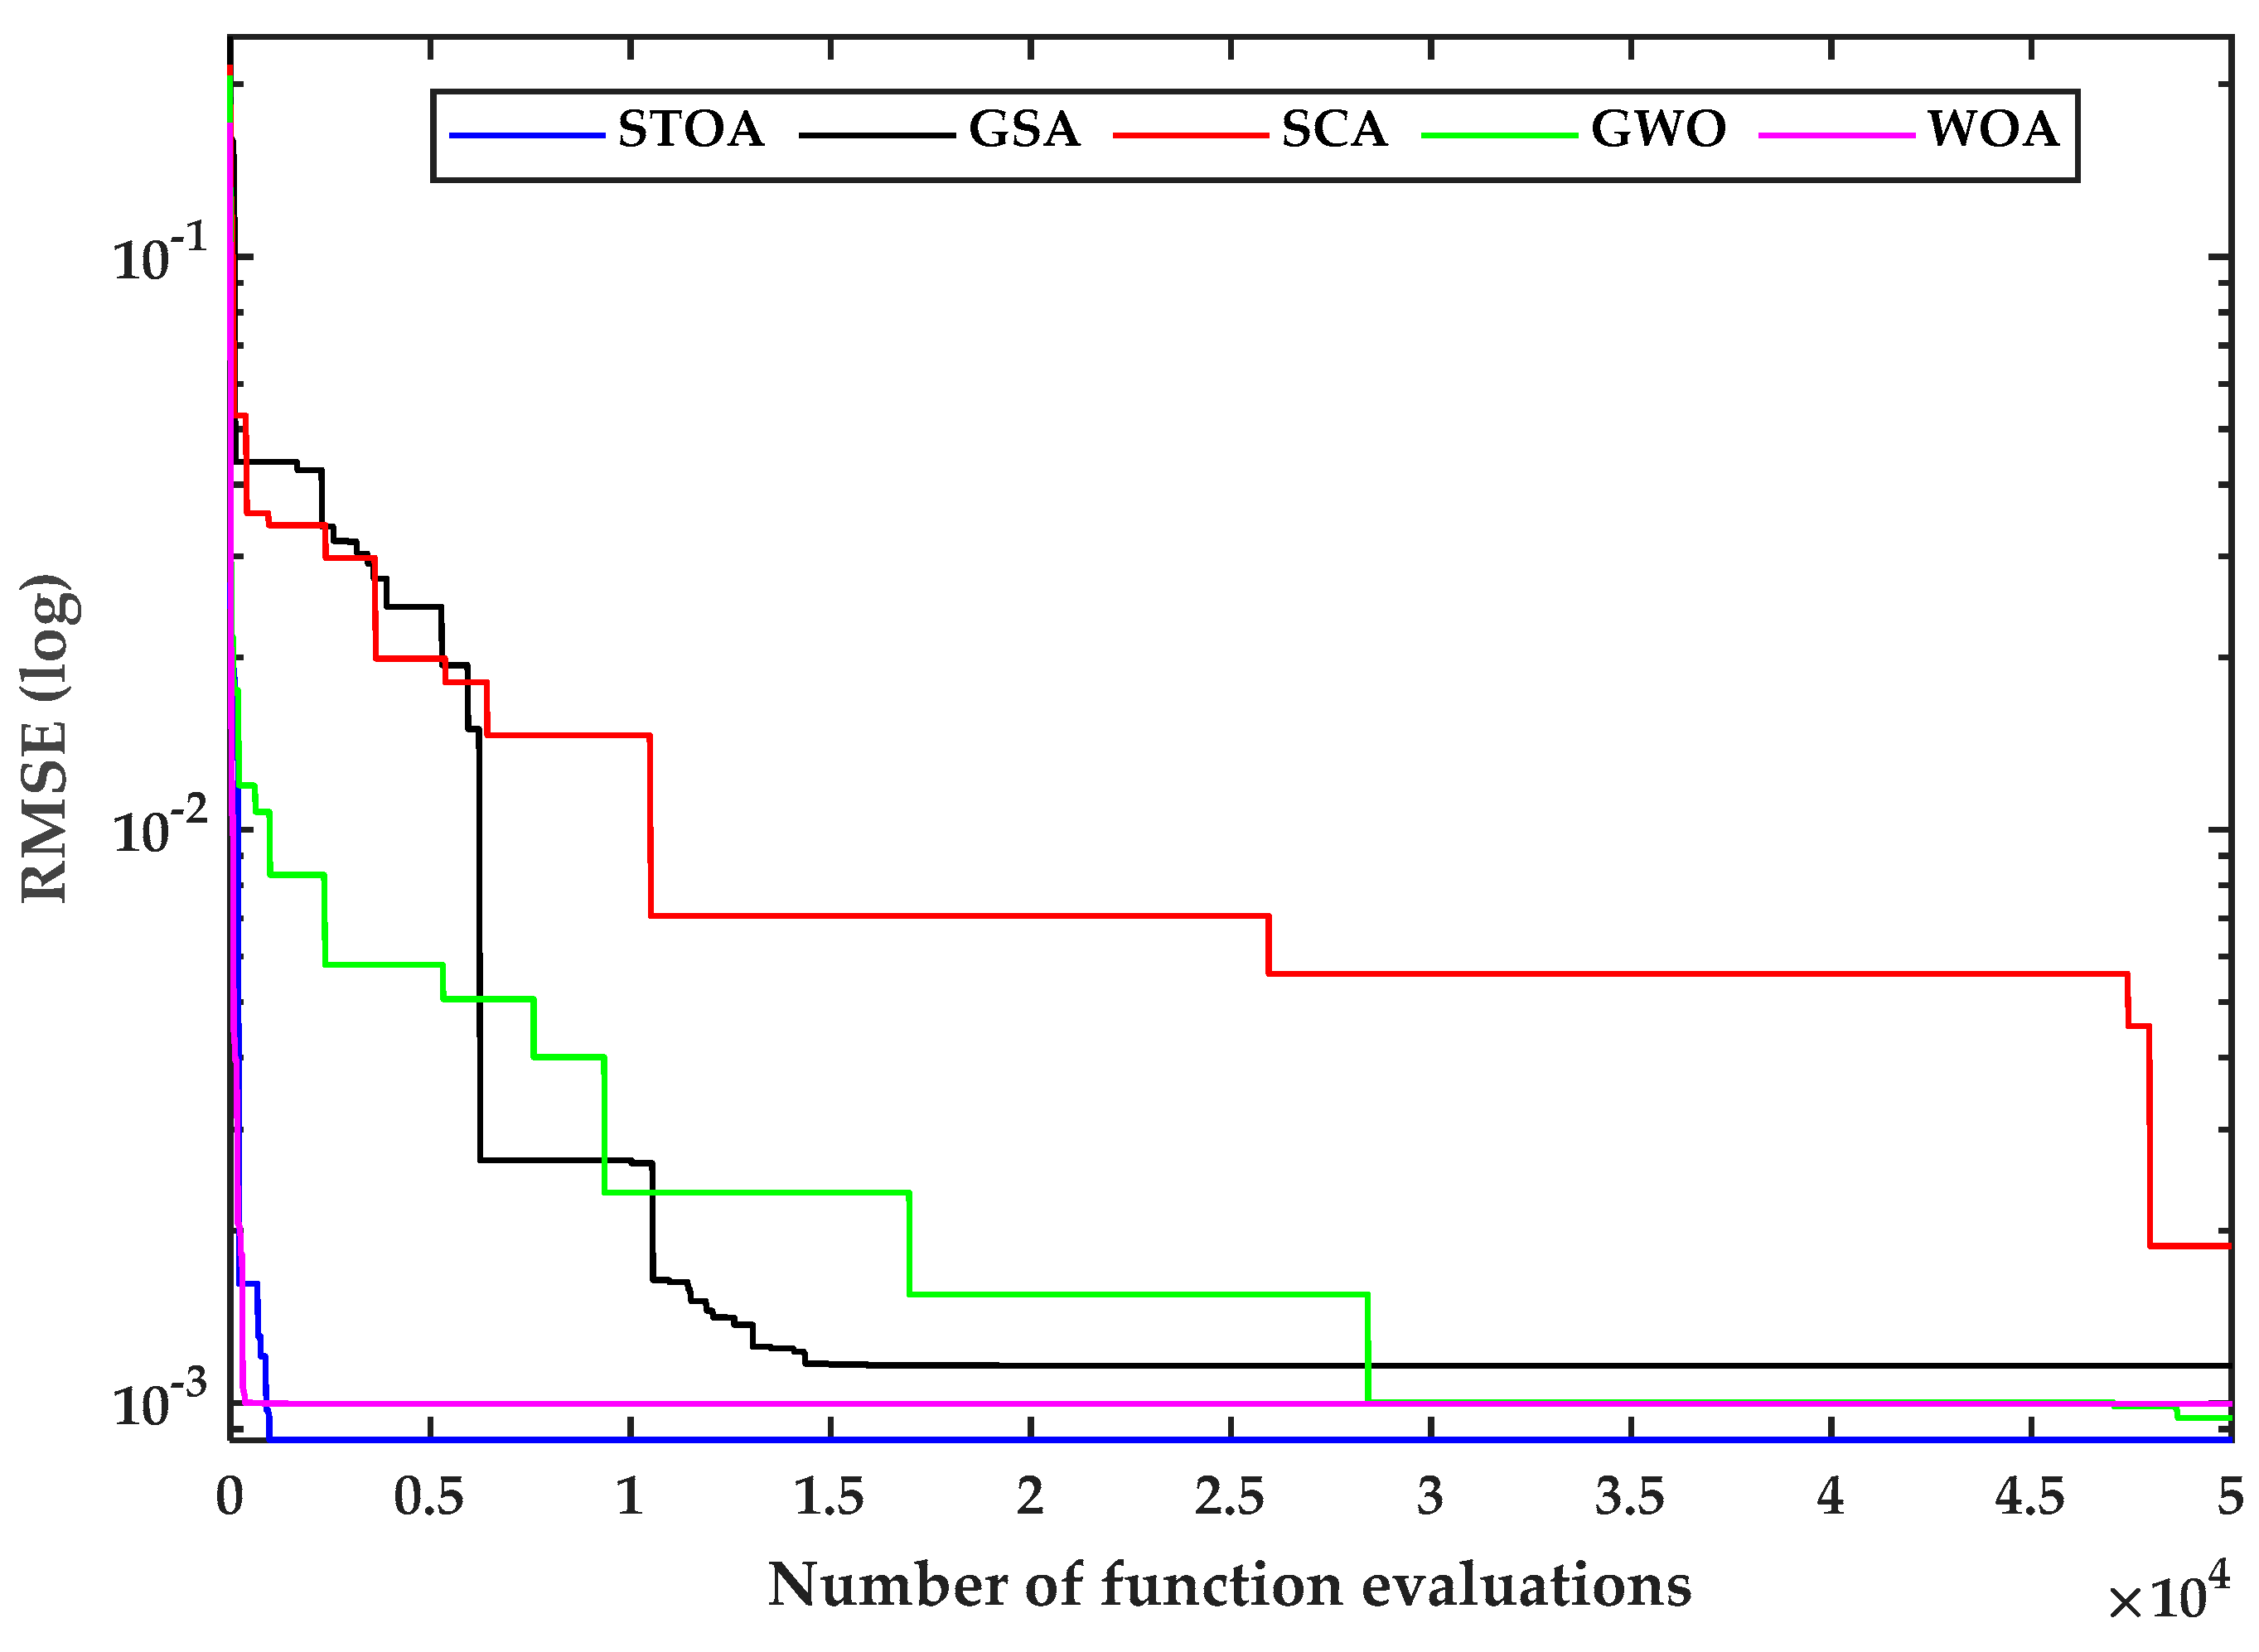
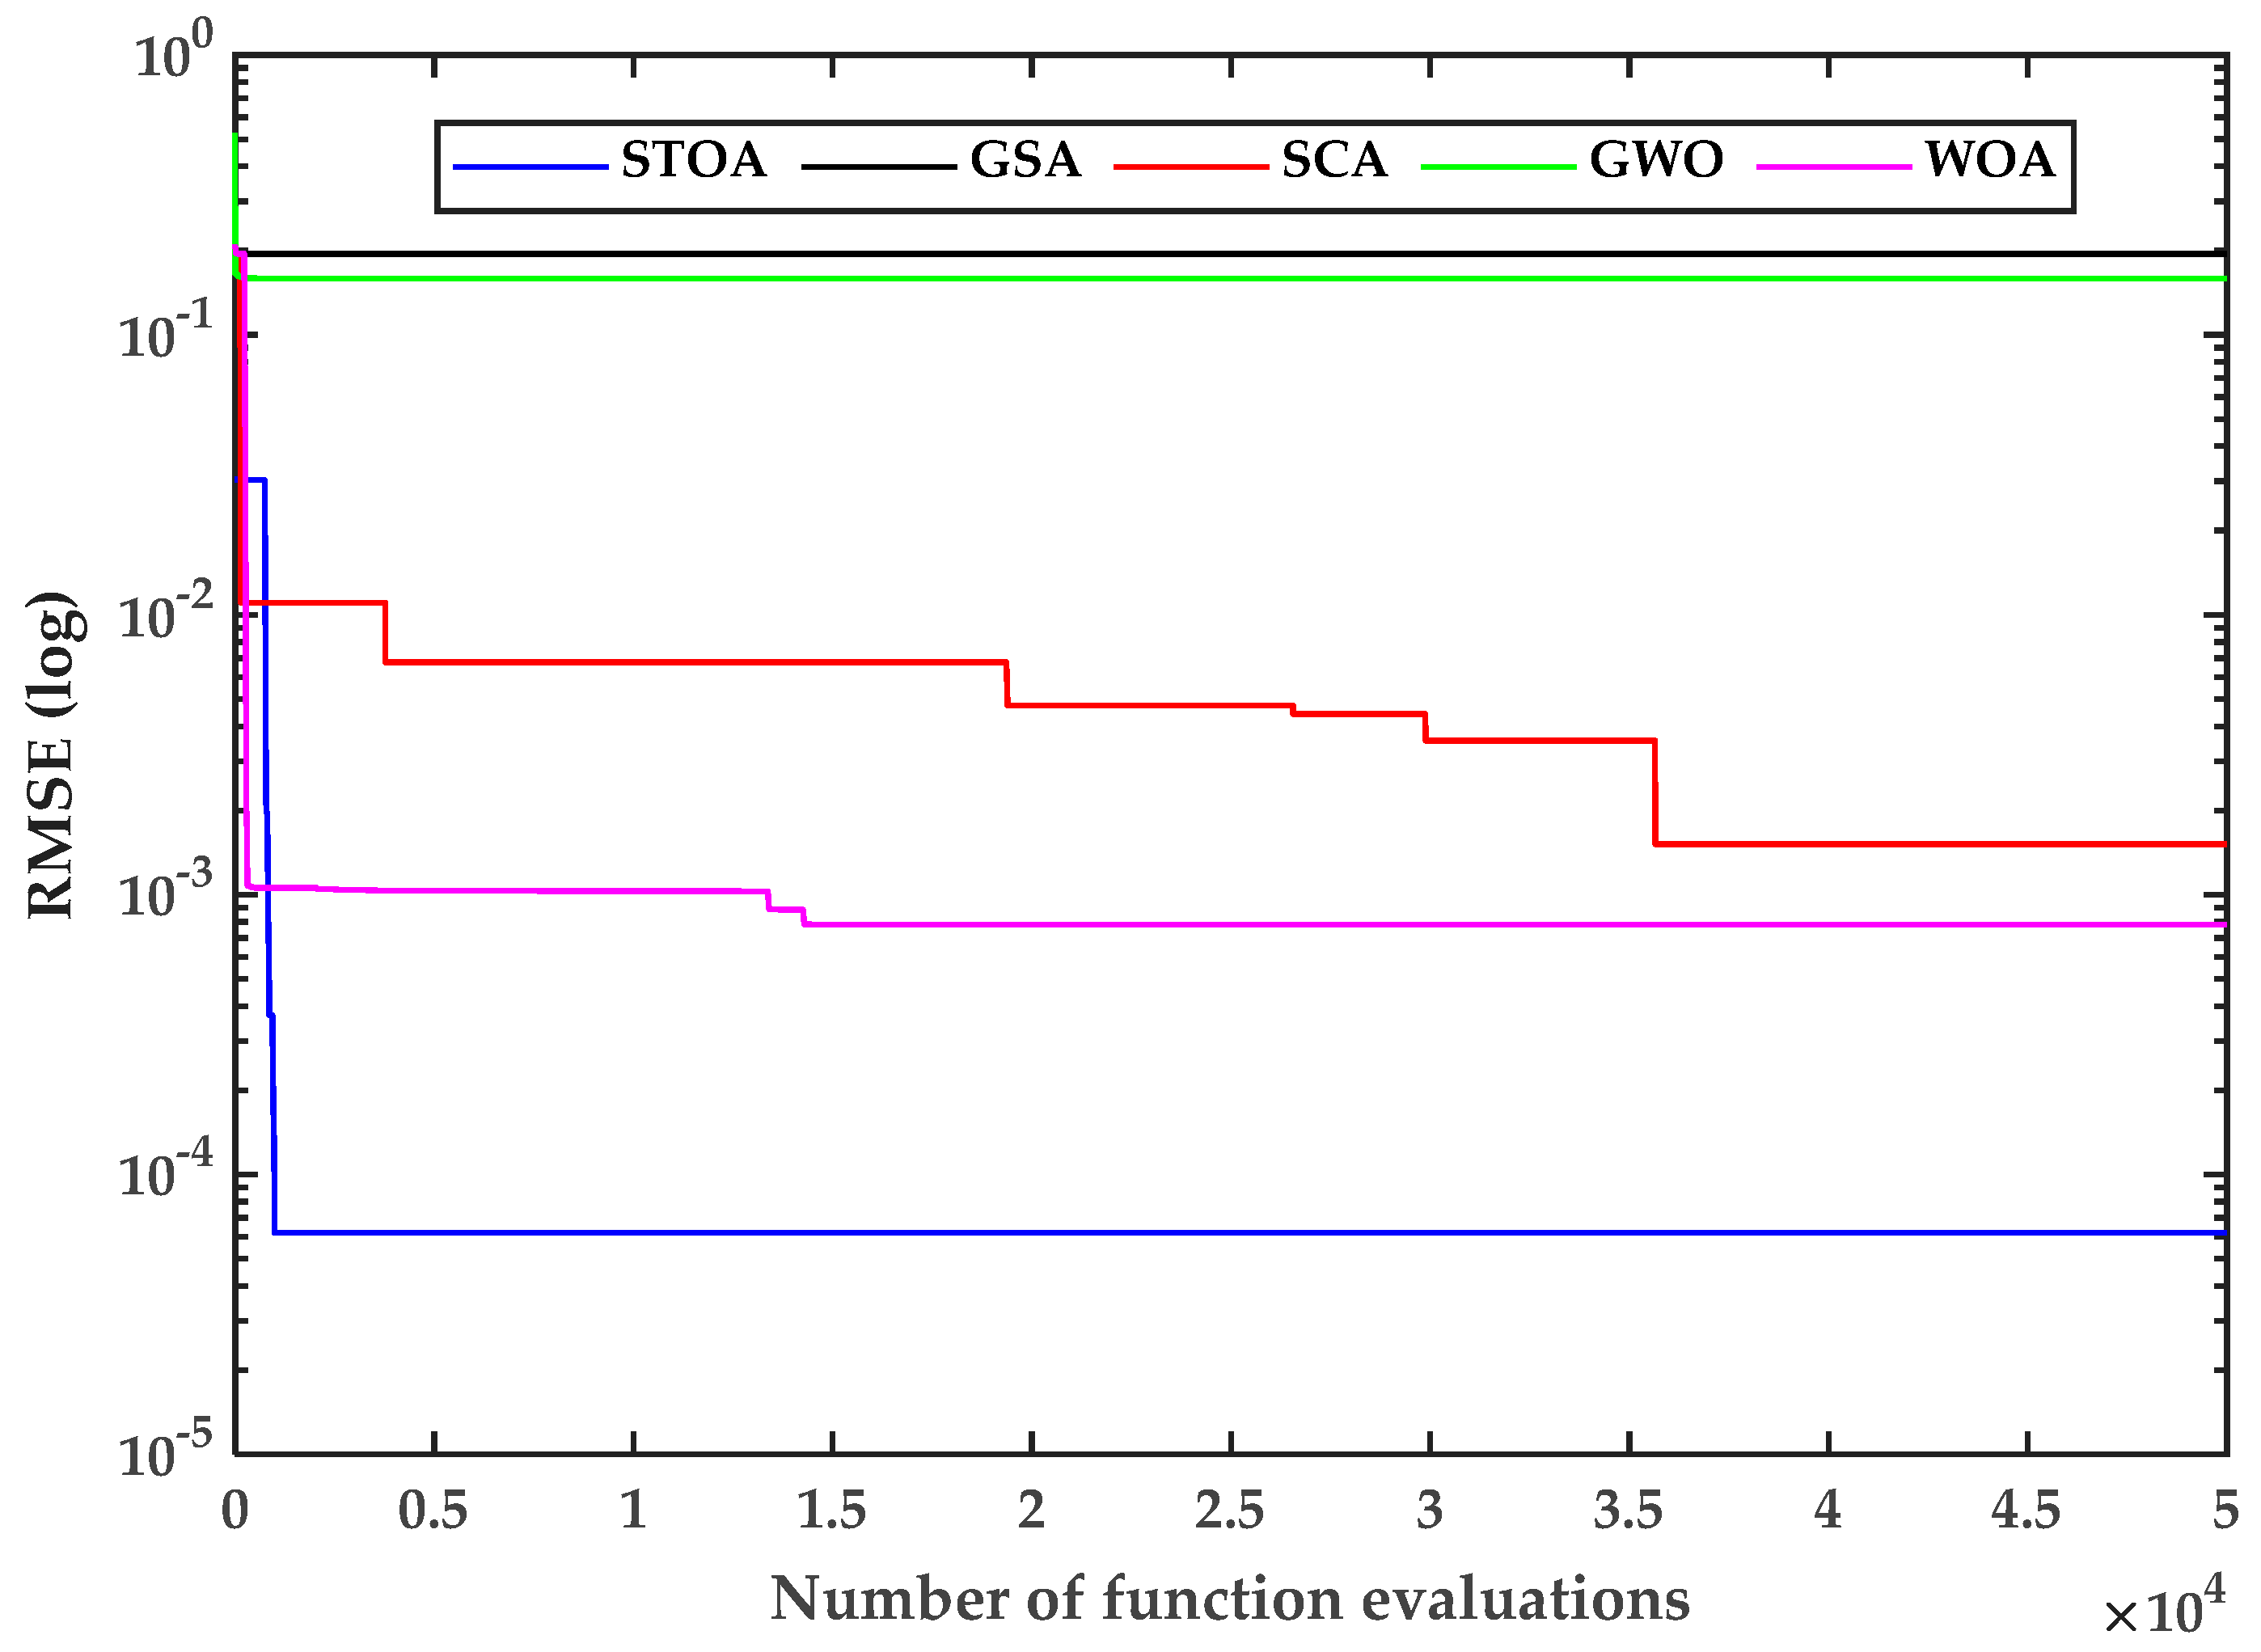
4.3. Convergence Analysis
Figure 5 and Figure 6 depict the convergence curves of the R.T.C France solar cell and the SSS2018 polycrystalline PV cell for examining the computational competency of the STO. The convergence rate analysis shows that the STO algorithm is more accurate than the GSA, SCA, GWO, and WOA algorithms. Thus, the STO algorithm produces a realistic answer for the same amount of evaluation functions (i.e., 50,000).
4.4. Statistical and Robustness Analysis
This subsection offers statistical assessments of the mean, minimum, maximum, and standard deviation (SD) of RMSE for all recently created strategies. The accuracy and reliability comparison of the various algorithms in 30 runs is summarized in Table 6. The RMSE mean and standard deviation were calculated to investigate the durability of the parameter estimation algorithms. According to the statistical data presented in Table 6, the STO is found to be the most precise and trustworthy parameter optimization technique.
In addition to the conventional statistical analysis, we also applied the Friedman rank test [47] to determine the relevance of the presented study. It is a nonparametric test which is employed to decide the rank of algorithms for the analysis of PV modules; lower the rank, better the algorithm. Table 7 illustrates the Friedman ranking test results of different algorithms. The Friedman ranking test results show that the STO has the highest ranking compared to WOA, SCA, GWO and GSA. In the Friedman test, the null hypothesis (p-value > 5%) suggests that there are no noteworthy alterations among the compared algorithms. For all 30 runs, the contrary hypothesis indicates a significant difference between the compared methods. Each algorithm is ranked in this test depending on its efficiency.
5. Conclusions
In this study, the STO algorithm was employed to assess the parameters of the R.T.C France solar panel and the SS2018 polycrystalline PV module at typical temperature conditions. The single-diode model theory was considered for parameter estimation. We also want to point out that the STO method was being used for the parameter estimation of PV models for the first time. The main observations of this study are as follows:
- The RMSE values confirm that the STO is generally more accurate and trustworthy to generate the best optimized parameters than GSA, SCA, GWO, and WOA.
- The IV and PV characteristic curves as well as IAE results show that the STO can successfully optimize the parameters for different types of PV cells.
- The statistical study illustrates the robustness of the implemented STO technique on the parameter estimation problem in standard operational conditions.
- The convergence curve confirms that the STO obtains the best values of estimated parameters in terms of RMSE of 8.6106 × 10⁻⁴ and 6.19 × 10⁻⁵ for solar cells and PV modules respectively.
According to the preceding discussion, the STO is an efficient and reliable technique for estimating the unknown optimum parameters of a solar PV module model under typical operating conditions.
Author Contributions
Conceptualization: A.S. (Abhishek Sharma), A.S. (Abha Singh), and M.R.; methodology and formal analysis: A.S. (Abhishek Sharma), A.K.M., and A.B.; investigation, A.S. (Abha Singh), A.S. (Abhishek Sharma), and A.B.; writing—original draft preparation, A.S. (Abha Singh), A.S. (Abhishek Sharma), A.K.M., and A.B.; writing—review and editing, A.S. (Abhishek Sharma), and S.R.; supervision, fund acquisition M.R., A.B. and S.R. All authors have read and agreed to the published version of the manuscript.
Funding
This research received no external funding.
Data Availability Statement
The data presented in this study are available on request from the corresponding author.
Acknowledgments
Authors are thankful to anonymous reviewers and editors for their suggestions.
Conflicts of Interest
The authors declare no conflict of interest.
References
- Guzowska, M.K.; Kryk, B.; Michalak, D.; Szyja, P. R&D Spending in the Energy Sector and Achieving the Goal of Climate Neutrality. Energies 2021, 14, 7875. [Google Scholar]
- Rajput, S.; Averbukh, M.; Yahalom, A. Electric power generation using a parallel-plate capacitor. Int. J. Energy Res. 2019, 43, 3905–3913. [Google Scholar] [CrossRef]
- Goldemberg, J. The promise of clean energy. Energy Policy 2006, 34, 2185–2190. [Google Scholar] [CrossRef]
- Sharma, A.; Khan, R.A.; Sharma, A.; Kashyap, D.; Rajput, S. A Novel Opposition-Based Arithmetic Optimization Algorithm for Parameter Extraction of PEM Fuel Cell. Electronics 2021, 10, 2834. [Google Scholar] [CrossRef]
- Buchmayr, A.; Van Ootegem, L.; Dewulf, J.; Verhofstadt, E. Understanding Attitudes towards Renewable Energy Technologies and the Effect of Local Experiences. Energies 2021, 14, 7596. [Google Scholar] [CrossRef]
- Abdul-Ganiyu, S.; Quansah, D.A.; Ramde, E.W.; Seidu, R.; Adaramola, M.S. Techno-economic analysis of solar photovoltaic (PV) and solar photovoltaic thermal (PVT) systems using exergy analysis. Sustain. Energy Technol. Assess. 2021, 47, 101520. [Google Scholar] [CrossRef]
- REN21. Renewables 2020 Global Status Report—REN21; REN21: Paris, France, 2020. [Google Scholar]
- Doshi, Y. Solar Photovoltaic (PV) Panels Market Overview. Available online: https://www.alliedmarketresearch.com/solar-photovoltaic-panel-market (accessed on 21 October 2021).
- Rajput, S.; Averbukh, M.; Yahalom, A.; Minav, T. An Approval of MPPT Based on PV Cell’s Simplified Equivalent Circuit During Fast-Shading Conditions. Electronics 2019, 8, 1060. [Google Scholar] [CrossRef] [Green Version]
- Rajput, S.; Amiel, I.; Sitbon, M.; Aharon, I.; Averbukh, M. Control the Voltage Instabilities of Distribution Lines using Capacitive Reactive Power. Energies 2020, 13, 875. [Google Scholar] [CrossRef] [Green Version]
- Liu, Y.; Chen, Y.; Wang, D.; Liu, J.; Luo, X.; Wang, Y.; Liu, H.; Liu, J. Experimental and numerical analyses of parameter optimization of photovoltaic cooling system. Energy 2021, 215, 119159. [Google Scholar] [CrossRef]
- Zhang, X.; Zhao, X.; Smith, S.; Xu, J.; Yu, X. Review of R&D progress and practical application of the solar photovoltaic/thermal (PV/T) technologies. Renew. Sustain. Energy Rev. 2012, 16, 599–617. [Google Scholar]
- Su, D.; Jia, Y.; Lin, Y.; Fang, G. Maximizing the energy output of a photovoltaic–thermal solar collector incorporating phase change materials. Energy Build. 2017, 153, 382–391. [Google Scholar] [CrossRef]
- Bayoumi, A.S.; El-Sehiemy, R.A.; Mahmoud, K.; Lehtonen, M.; Darwish, M.M.F. Assessment of an Improved Three-Diode against Modified Two-Diode Patterns of MCS Solar Cells Associated with Soft Parameter Estimation Paradigms. Appl. Sci. 2021, 11, 1055. [Google Scholar] [CrossRef]
- Mughal, M.A.; Ma, Q.; Xiao, C. Photovoltaic Cell Parameter Estimation Using Hybrid Particle Swarm Optimization and Simulated Annealing. Energies 2017, 10, 1213. [Google Scholar] [CrossRef] [Green Version]
- Elazab, O.S.; Hasanien, H.M.; Alsaidan, I.; Abdelaziz, A.Y.; Muyeen, S.M. Parameter Estimation of Three Diode Photovoltaic Model Using Grasshopper Optimization Algorithm. Energies 2020, 13, 497. [Google Scholar] [CrossRef] [Green Version]
- Jordehi, A.R. Parameter estimation of solar photovoltaic (PV) cells: A review. Renew. Sustain. Energy Rev. 2016, 61, 354–371. [Google Scholar] [CrossRef]
- Mittal, A.; Pattnaik, A.; Tomar, A. Different Variants of Particle Swarm Optimization Algorithms and Its Application: A Review; Metaheuristic and Evolutionary Computation: Algorithms and Applications; Springer: Singapore, 2021; Volume 916, pp. 131–163. [Google Scholar]
- Mareli, M.; Twala, B. An adaptive Cuckoo search algorithm for optimisation. Appl. Comput. Inform. 2018, 14, 107–115. [Google Scholar] [CrossRef]
- Derick, M.; Rani, C.; Rajesh, M.; Farrag, M.; Wang, Y.; Busawon, K. An improved optimization technique for estimation of solar photovoltaic parameters. Sol. Energy 2017, 157, 116–124. [Google Scholar] [CrossRef]
- Guo, L.; Meng, Z.; Sun, Y.; Wang, L. Parameter identification and sen-sitivity analysis of solar cell models with cat swarm optimization algorithm. Energy Convers. Manage. 2016, 108, 520–528. [Google Scholar] [CrossRef]
- Li, S.; Gong, W.; Yan, X.; Hu, C.; Bai, D.; Wang, L. Parameter estimation of photovoltaic models with memetic adaptive differential evolution. Sol. Energy 2019, 190, 465–474. [Google Scholar] [CrossRef]
- Kabalci, Y.; Kockanat, S.; Kabalci, E. A modified ABC algorithm approach for power system harmonic estimation problems. Electr. Power Syst. Res. 2018, 154, 160–173. [Google Scholar] [CrossRef]
- Kiani, A.T.; Nadeem, M.F.; Ahmed, A.; Sajjad, I.A.; Raza, A.; Khan, I.A. Chaotic inertia weight particle swarm optimization (CIWPSO): An efficient technique for solar cell parameter estimation. In Proceedings of the 3rd International Conference on Computing, Mathematics and Engineering Technologies (iCoMET), Sukkur, Pakistan, 29–30 January 2000; pp. 1–6. [Google Scholar]
- El-Naggar, K.M.; AlRashidi, M.; AlHajri, M.; Al-Othman, A. Simulated annealing algorithm for photovoltaic parameters identification. Sol. Energy 2012, 86, 266–274. [Google Scholar] [CrossRef]
- Niu, Q.; Zhang, L.; Li, K. A biogeography-based optimization algo-rithm with mutation strategies for model parameter estimation of solar and fuel cells. Energy Convers. Manage. 2014, 86, 1173–1185. [Google Scholar] [CrossRef]
- Jervase, J.A.; Bourdoucen, H.; Al-Lawati, A. Solar cell parameter ex-traction using genetic algorithms. Meas. Sci. Technol. 2001, 12, 1922. [Google Scholar] [CrossRef] [Green Version]
- Gao, X.; Cui, Y.; Hu, J.; Xu, G.; Wang, Z.; Qu, J.; Wang, H. Parameter extraction of solar cell models using improved shuffled complex evolution algorithm. Energy Convers. Manage. 2018, 157, 460–479. [Google Scholar] [CrossRef]
- AlHajri, M.; El-Naggar, K.; AlRashidi, M.; Al-Othman, A. Optimal ex-traction of solar cell parameters using pattern search. Renew. Energy 2012, 44, 238–245. [Google Scholar] [CrossRef]
- Chen, X.; Yu, K.; Du, W.; Zhao, W.; Liu, G. Parameters identification of solar cell models using generalized oppositional teaching learning based optimization. Energy 2016, 99, 170–180. [Google Scholar] [CrossRef]
- Chen, Z.; Wu, L.; Lin, P.; Wu, Y.; Cheng, S. Parameters identification of photovoltaic models using hybrid adaptive Nelder-Mead simplex algorithm based on eagle strategy. Appl. Energy 2016, 182, 47–57. [Google Scholar] [CrossRef]
- Gao, X.; Cui, Y.; Hu, J.; Xu, G.; Yu, Y. Lambert W-function based exact representation for double diode model of solar cells: Comparison on fitness and parameter extraction. Energy Convers. Manag. 2016, 127, 443–460. [Google Scholar] [CrossRef]
- Maouhoub, N. Photovoltaic module parameter estimation using an analytical approach and least squares method. J. Comput. Electron. 2018, 17, 784–790. [Google Scholar] [CrossRef]
- Villalva, M.G.; Gazoli, J.R.; Ruppert Filho, E. Comprehensive approach to modeling and simulation of photovoltaic arrays. IEEE Trans. Power Electron. 2009, 24, 1198–1208. [Google Scholar] [CrossRef]
- Chegaar, M.; Ouennoughi, Z.; Hoffmann, A. A new method for evaluating illumi-nated solar cell parameters. Solid-State Electron. 2001, 45, 293–296. [Google Scholar] [CrossRef]
- Abdallah, R.; Natsheh, E.; Juaidi, A.; Samara, S.; Manzano-Agugliaro, F. A Mul-ti-Level World Comprehensive Neural Network Model for Maximum Annual Solar Irradiation on a Flat Surface. Energies 2020, 13, 6422. [Google Scholar] [CrossRef]
- Sharma, A.; Sharma, A.; Averbukh, M.; Jately, V.; Azzopardi, B. An Effective Method for Parameter Estimation of a Solar Cell. Electronics 2021, 10, 312. [Google Scholar] [CrossRef]
- Sharma, A.; Sharma, A.; Dasgotra, A.; Jately, V.; Ram, M.; Rajput, S.; Averbukh, M.; Azzopardi, B. Opposition-Based Tunicate Swarm Algorithm for Parameter Optimization of Solar Cells. IEEE Access 2021, 9, 125590–125602. [Google Scholar] [CrossRef]
- Dhiman, G.; Kaur, A. STOA: A bio-inspired based optimization algorithm for industrial engineering problems. Eng. Appl. Artif. Intell. 2019, 82, 148–174. [Google Scholar] [CrossRef]
- Ali, H.H.; Fathy, A.; Kassem, A.M. Optimal model predictive control for LFC of multi-interconnected plants comprising renewable energy sources based on recent sooty terns approach. Sustain. Energy Technol. Assess. 2020, 42, 100844. [Google Scholar] [CrossRef]
- Rashedi, E.; Nezamabadi-Pour, H.; Saryazdi, S. GSA: A gravitational search algorithm. Inf. Sci. 2009, 179, 2232–2248. [Google Scholar] [CrossRef]
- Mirjalili, S. SCA: A sine cosine algorithm for solving optimization problems. Knowl. Based Syst. 2016, 96, 120–133. [Google Scholar] [CrossRef]
- Mirjalili, S.; Mirjalili, S.M.; Lewis, A. Grey wolf optimizer. Adv. Eng. Softw. 2014, 69, 46–61. [Google Scholar] [CrossRef] [Green Version]
- Mirjalili, S.; Lewis, A. The whale optimization algorithm. Adv. Eng. Softw. 2016, 95, 51–67. [Google Scholar] [CrossRef]
- Lin, X.; Wu, Y. Parameters identification of photovoltaic models using niche-based particle swarm optimization in parallel computing architecture. Energy 2020, 196, 117054. [Google Scholar] [CrossRef]
- Gaurav, D. Sooty Tern Optimization Algorithm (STOA). 2022. Available online: https://in.mathworks.com/matlabcentral/fileexchange/76667-sooty-tern-optimization-algorithm-stoa (accessed on 19 November 2021).
- Digalakis, J.G.; Margaritis, K.G. An experimental study of benchmarking functions for genetic algorithms. Int. J. Comput. Math. 2002, 79, 403–416. [Google Scholar] [CrossRef]
Figure 1.
PV panel module equivalent circuit.

Figure 2.
Process flowchart of STO algorithm for parameter estimation of PV cell/module.

Figure 3.
The simulated and experimental I-V and P-V characteristics curves for the single-diode model of the R.T.C France solar cell. Symbols indicate measured data, while solid lines indicate optimized data.
Figure 3.
The simulated and experimental I-V and P-V characteristics curves for the single-diode model of the R.T.C France solar cell. Symbols indicate measured data, while solid lines indicate optimized data.

Figure 4.
I-V and P-V characteristics curves for anticipated and experimental values for the SS2018 PV module. Symbols indicate measured data, while solid lines indicate optimized data.
Figure 4.
I-V and P-V characteristics curves for anticipated and experimental values for the SS2018 PV module. Symbols indicate measured data, while solid lines indicate optimized data.

Figure 5.
Convergence plot for the RTC France solar cell.

Figure 6.
Convergence plot for the SS2018 PV module.


Table 1.
The parameter range for SDM of a solar cell and a PV module.
| Parameters | R.T.C France Solar Cell | SS2018P PV Module | ||
|---|---|---|---|---|
| Lower Bound | Upper Bound | Lower Bound | Upper Bound | |
| (A) | 0 | 1 | 0 | 10 |
| (Ω) | 0.01 | 0.5 | 0.01 | 2 |
| (Ω) | 0.001 | 100 | 0.001 | 2000 |
| (µA) | 0 | 0.5 | 0 | 50 |
| 1 | 2 | 1 | 100 | |
Table 2.
The calculated current and absolute error results of the STO for SDM of the R.T.C France solar cell.
Table 2.
The calculated current and absolute error results of the STO for SDM of the R.T.C France solar cell.
| Observations | Il (A) | Isimulated (A) | IAE (A) | Pmeasured (W) | Psimulated (W) | IAE (W) | |
|---|---|---|---|---|---|---|---|
| 1 | 0.0057 | 0.7605 | 0.7817 | 0.0212 | 0.0043 | 0.0044 | 0.0001 |
| 2 | 0.0646 | 0.7600 | 0.7764 | 0.0164 | 0.0490 | 0.0501 | 0.0010 |
| 3 | 0.1185 | 0.7590 | 0.7714 | 0.0124 | 0.0899 | 0.0914 | 0.0014 |
| 4 | 0.1678 | 0.7570 | 0.7669 | 0.0099 | 0.1270 | 0.1287 | 0.0016 |
| 5 | 0.2132 | 0.7570 | 0.7627 | 0.0057 | 0.1613 | 0.1626 | 0.0012 |
| 6 | 0.2545 | 0.7555 | 0.7588 | 0.0033 | 0.1922 | 0.1931 | 0.0008 |
| 7 | 0.2924 | 0.7540 | 0.754 | 0.0007 | 0.2204 | 0.2206 | 0.0002 |
| 8 | 0.3269 | 0.7505 | 0.7501 | 0.0003 | 0.2453 | 0.245 | 0.0001 |
| 9 | 0.3585 | 0.7465 | 0.7441 | 0.0023 | 0.2676 | 0.2667 | 0.0008 |
| 10 | 0.3873 | 0.7385 | 0.7351 | 0.0033 | 0.2860 | 0.2847 | 0.0012 |
| 11 | 0.4137 | 0.7280 | 0.7208 | 0.0071 | 0.3011 | 0.2982 | 0.0029 |
| 12 | 0.4373 | 0.7065 | 0.6987 | 0.0077 | 0.3089 | 0.3055 | 0.0034 |
| 13 | 0.459 | 0.6755 | 0.6648 | 0.0106 | 0.3100 | 0.3051 | 0.0049 |
| 14 | 0.4784 | 0.6320 | 0.6173 | 0.0146 | 0.3023 | 0.2953 | 0.0070 |
| 15 | 0.496 | 0.5730 | 0.5544 | 0.0185 | 0.2842 | 0.2750 | 0.0091 |
| 16 | 0.5119 | 0.4990 | 0.4772 | 0.0217 | 0.2554 | 0.2443 | 0.0111 |
| 17 | 0.5265 | 0.4130 | 0.3857 | 0.0272 | 0.2174 | 0.2030 | 0.0143 |
| 18 | 0.5398 | 0.3165 | 0.2945 | 0.0219 | 0.1708 | 0.1590 | 0.0118 |
| 19 | 0.5521 | 0.2120 | 0.1728 | 0.0391 | 0.1170 | 0.0954 | 0.0215 |
| 20 | 0.5633 | 0.1035 | 0.0582 | 0.0452 | 0.0583 | 0.0328 | 0.0254 |
| Sum of IAE | 0.2891 | ||||||
Table 3.
Comparison between the STO and other algorithms for parameter estimation techniques for R.T.C France solar cell.
Table 3.
Comparison between the STO and other algorithms for parameter estimation techniques for R.T.C France solar cell.
| Algorithms | RMSE | |||||
|---|---|---|---|---|---|---|
| STO | 0.7850 | 0.0394 | 10.9985 | 0.1770 | 1.4474 | 8.6106 × 10⁻⁴ |
| GSA [41] | 0.7607 | 0.0339 | 63.7784 | 0.0500 | 1.5486 | 1.2012 × 10⁻³ |
| SCA [42] | 0.7595 | 0.0519 | 90.0685 | 0.002 | 1.2641 | 1.9123 × 10⁻³ |
| GWO [43] | 0.7695 | 0.0269 | 47.9136 | 1 | 1.6232 | 9.4095 × 10⁻⁴ |
| WOA [44] | 0.7573 | 0.053 | 58.5839 | 0.016 | 1.2476 | 9.9529 × 10⁻⁴ |
Table 4.
The simulated current and absolute error results of the STO for SDM of the SS2018 PV module.
Table 4.
The simulated current and absolute error results of the STO for SDM of the SS2018 PV module.
| Observations | Isimulated (A) | IAE (A) | Pmeasured (W) | Psimulated (W) | IAE (W) | ||
|---|---|---|---|---|---|---|---|
| 1 | 0.0844 | 1.1698 | 1.2096 | 0.0397 | 0.0988 | 0.1021 | 0.00336 |
| 2 | 0.2558 | 1.1697 | 1.2088 | 0.0390 | 0.2993 | 0.3093 | 0.0100 |
| 3 | 0.5550 | 1.1697 | 1.2075 | 0.0377 | 0.6492 | 0.6702 | 0.0210 |
| 4 | 1.0896 | 1.1697 | 1.2051 | 0.0353 | 1.2745 | 1.3131 | 0.0386 |
| 5 | 2.1529 | 1.1697 | 1.2003 | 0.0306 | 2.5183 | 2.5843 | 0.0659 |
| 6 | 2.8780 | 1.1697 | 1.1971 | 0.0273 | 3.3666 | 3.4454 | 0.0788 |
| 7 | 3.8696 | 1.1697 | 1.1926 | 0.0229 | 4.5265 | 4.6153 | 0.0888 |
| 8 | 4.5833 | 1.1697 | 1.1895 | 0.0197 | 5.3613 | 5.4518 | 0.0906 |
| 9 | 5.5482 | 1.1697 | 1.1851 | 0.0154 | 6.4901 | 6.5757 | 0.0856 |
| 10 | 6.2780 | 1.1697 | 1.1819 | 0.0121 | 7.3436 | 7.4201 | 0.0765 |
| 11 | 7.2243 | 1.1697 | 1.1776 | 0.0079 | 8.4505 | 8.5079 | 0.0574 |
| 12 | 8.0501 | 1.1697 | 1.1739 | 0.0042 | 9.4164 | 9.4506 | 0.0342 |
| 13 | 8.7878 | 1.1696 | 1.1706 | 0.0009 | 10.2789 | 10.2874 | 0.00852 |
| 14 | 9.7689 | 1.1696 | 1.1662 | 0.0034 | 11.4259 | 11.3926 | 0.0333 |
| 15 | 10.5181 | 1.1695 | 1.1627 | 0.0067 | 12.3009 | 12.2302 | 0.0707 |
| 16 | 11.3167 | 1.1692 | 1.1590 | 0.0102 | 13.2324 | 13.1166 | 0.11160 |
| 17 | 12.1901 | 1.1688 | 1.1548 | 0.0140 | 14.2485 | 14.0774 | 0.1710 |
| 18 | 12.9947 | 1.1680 | 1.1506 | 0.0174 | 15.1790 | 14.9522 | 0.227 |
| 19 | 13.9457 | 1.1663 | 1.1449 | 0.0213 | 16.2656 | 15.9678 | 0.2980 |
| 20 | 14.6556 | 1.1638 | 1.1398 | 0.0240 | 17.0574 | 16.7051 | 0.3520 |
| 21 | 15.5347 | 1.1583 | 1.1312 | 0.0270 | 17.9941 | 17.5742 | 0.4200 |
| 22 | 16.4330 | 1.1471 | 1.1177 | 0.0294 | 18.8509 | 18.3673 | 0.4840 |
| 23 | 17.1324 | 1.1312 | 1.1007 | 0.0305 | 19.3812 | 18.8578 | 0.5230 |
| 24 | 18.0801 | 1.0907 | 1.0600 | 0.0306 | 19.7206 | 19.1662 | 0.5540 |
| 25 | 18.8065 | 1.0325 | 1.0033 | 0.0291 | 19.4190 | 18.8700 | 0.5490 |
| 26 | 19.7423 | 0.8906 | 0.8658 | 0.0248 | 17.5832 | 17.0933 | 0.4900 |
| 27 | 20.5628 | 0.6493 | 0.6315 | 0.0178 | 13.3533 | 12.9868 | 0.3660 |
| 28 | 21.3013 | 0.2582 | 0.2516 | 0.0065 | 5.5007 | 5.3614 | 0.1390 |
| Sum of IAE | 0.5840 | ||||||
Table 5.
Comparison of the STO with other parameter estimation methods for the SS2018 PV module.
| Algorithms | RMSE | |||||
|---|---|---|---|---|---|---|
| STO | 1.1276 | 2 | 2000 | 0.5000 | 89.85 | 6.19 × 10⁻⁵ |
| GSA [41] | 1.0959 | 0.001 | 455.528 | 0.0010 | 53.59 | 1.68 × 10⁻¹ |
| SCA [42] | 1.1742 | 0.0011 | 139.676 | 0.0092 | 1.415 | 1.51 × 10⁻³ |
| GWO [43] | 1 | 0.001 | 100 | 0.0010 | 1.263 | 1.59 × 10⁻¹ |
| WOA [44] | 1.1810 | 0.0024 | 18.166 | 0.0190 | 1.289 | 7.82 × 10⁻⁴ |
Table 6.
Statistical RMSE results for various techniques for the R.T.C France solar cell and the SS2018 PV module.
Table 6.
Statistical RMSE results for various techniques for the R.T.C France solar cell and the SS2018 PV module.
| Algorithm | RMSE | ||||
|---|---|---|---|---|---|
| Minimum | Mean | Maximum | SD | ||
| R.T.C France Solar Cell | STO | 8.6106 × 10⁻⁴ | 9.4761 × 10⁻⁴ | 2.6964 × 10⁻² | 1.0836 × 10⁻⁵ |
| GSA [41] | 1.2012 × 10⁻³ | 5.4701 × 10⁻³ | 2.4211 × 10⁻¹ | 1.3129 × 10⁻³ | |
| SCA [42] | 1.9123 × 10⁻³ | 9.6515 × 10⁻³ | 2.1642 × 10⁻¹ | 9.4066 × 10⁻³ | |
| GWO [43] | 9.4095 × 10⁻⁴ | 1.0441 × 10⁻³ | 1.3506 × 10⁻³ | 1.4050 × 10⁻⁵ | |
| WOA [44] | 9.9529 × 10⁻⁴ | 9.2032 × 10⁻⁴ | 7.1240 × 10⁻³ | 9.0250 × 10⁻³ | |
| SS2018 PV Module | STO | 6.1900 × 10⁻⁵ | 5.2500 × 10⁻⁴ | 3.0407 × 10⁻² | 2.3643 × 10⁻⁵ |
| GSA [41] | 1.6800 × 10⁻¹ | 1.9462 × 10⁻¹ | 2.0011 × 10⁻¹ | 4.4500 × 10⁻³ | |
| SCA [42] | 1.5100 × 10⁻³ | 5.2657 × 10⁻³ | 2.0345 × 10⁻¹ | 1.0058 × 10⁻² | |
| GWO [43] | 1.5900 × 10⁻¹ | 1.5940 × 10⁻¹ | 5.2494 × 10⁻¹ | 1.6793 × 10⁻² | |
| WOA [44] | 7.8200 × 10⁻⁴ | 1.8268 × 10⁻³ | 2.1078 × 10⁻² | 1.3639 × 10⁻³ | |
Publisher’s Note: MDPI stays neutral with regard to jurisdictional claims in published maps and institutional affiliations. |
© 2022 by the authors. Licensee MDPI, Basel, Switzerland. This article is an open access article distributed under the terms and conditions of the Creative Commons Attribution (CC BY) license (https://creativecommons.org/licenses/by/4.0/).
Share and Cite
MDPI and ACS Style
Singh, A.; Sharma, A.; Rajput, S.; Mondal, A.K.; Bose, A.; Ram, M. Parameter Extraction of Solar Module Using the Sooty Tern Optimization Algorithm. Electronics 2022, 11, 564. https://doi.org/10.3390/electronics11040564
AMA Style
Singh A, Sharma A, Rajput S, Mondal AK, Bose A, Ram M. Parameter Extraction of Solar Module Using the Sooty Tern Optimization Algorithm. Electronics. 2022; 11(4):564. https://doi.org/10.3390/electronics11040564
Chicago/Turabian StyleSingh, Abha, Abhishek Sharma, Shailendra Rajput, Amit Kumar Mondal, Amarnath Bose, and Mangey Ram. 2022. "Parameter Extraction of Solar Module Using the Sooty Tern Optimization Algorithm" Electronics 11, no. 4: 564. https://doi.org/10.3390/electronics11040564
Note that from the first issue of 2016, this journal uses article numbers instead of page numbers. See further details here.