Photovoltaic Cell Parameter Estimation Using Hybrid Particle Swarm Optimization and Simulated Annealing


School of Automation Science and Electrical Engineering, Beihang University, Beijing 100191, China
*
Author to whom correspondence should be addressed.
Energies 2017, 10(8), 1213; https://doi.org/10.3390/en10081213
Submission received: 29 June 2017
/
Revised: 3 August 2017
/
Accepted: 10 August 2017
/
Published: 15 August 2017
Abstract
:Accurate parameter estimation of solar cells is vital to assess and predict the performance of photovoltaic energy systems. For the estimation model to accurately track the experimentally measured current-voltage (I-V) data, the parameter estimation problem is converted into an optimization problem and a metaheuristic optimization algorithm is used to solve it. Metaheuristics present a fairly acceptable solution to the parameter estimation but the problem of premature convergence still endures. The paper puts forward a new optimization approach using hybrid particle swarm optimization and simulated annealing (HPSOSA) to estimate solar cell parameters in single and double diode models using experimentally measured I-V data. The HPSOSA was capable of achieving a global minimum in all test runs and was significant in alleviating the premature convergence problem. The performance of the algorithm was evaluated by comparing it with five different optimization algorithms and performing a statistical analysis. The analysis results clearly indicated that the method was capable of estimating all the model parameters with high precision indicated by low root mean square error and mean absolute error . The parameter estimation was accurately performed for a commercial (RTC France) solar cell.
1. Introduction
Increasing power demands due to continuous population growth and industrial needs, and depleting fossil fuel reserves and environmental concerns have led to the use of renewable energy sources, particularly to solar energy. Solar energy, being pollution free, renewable and freely available, has attracted great attention all around the world.
Photovoltaic (PV) solar cells are used to harvest energy from solar radiation and convert it into electric energy. These cells are made up of semiconductor materials, traditionally silicon. The low efficiency, high cost and physical barriers of silicon limit the use of traditional solar cells. Extensive research has been carried out to improve the conversion efficiency of a solar cell; special attention has been paid to the materials used in the manufacture of solar cells. A new generation of solar cells, known as the 3rd generation solar cells, has evolved, which make use of sustainable materials and flexible architectures like dye-sensitized solar cells (DSSCs). DSSCs operate as an artificial photosynthetic system to convert solar light into electricity, and are reported to provide efficiencies of up to 14% [1]. More insights on the materials and coatings employed for efficient DSSCs can be found in [2,3,4].
These cells are connected in series and parallel combinations to construct a solar module. Accurate modeling of solar cells is necessary to evaluate and forecast the performance of the PV systems. Many circuit models have been proposed. Among them, single diode models (SDM) and double diode models (DDM) are prominent and widely used for PV system modeling. For a simulation model to perform characteristics like the real one, precise model parameter estimation is required. An optimized parameter estimation strategy should be adopted to achieve the PV model I-V characteristics to closely track the experimentally measured I-V characteristics. Many methods have been used for parameter estimation of solar cells including classical methods such as the Newton-Raphson method [5], and Lambert function [6]-based method; but these methods are highly prone to being trapped into a local minimum [7].
Metaheuristics have been widely applied in solving nonlinear multimodal optimization problems in recent years. The literature describes many similar methods applied successfully for solar PV cell parameter estimation. The applied methods include genetic algorithm (GA) [8], differential evolution (DE) [9], particle swarm optimization (PSO) [10], simulated annealing (SA) [11], harmony search (HS) [12], artificial bee colony (ABC) [13], cuckoo search (CS) [14], pattern search (PS) [15], etc.
Ishaque et al. [9] proposed a penalty-based differential evolution method to estimate the parameters of multi-crystalline, mono-crystalline, and thin-film PV modules. I-V test data were obtained synthetically using DDM. The results confirmed the outperformance of the method over GA, SA and PSO.
Ye et al. [10] applied PSO to parameter estimation of SDM and DDM PV models. To check the ability of the PSO, synthesized and experimental I-V data were used. The results indicated that the PSO outperformed GA in terms of parameter precision and computational efficiency.
Alrashidi et al. [11] applied SA for parameter estimation of solar PV cells. Summation of individual absolute errors (IAE) was used as the objective function to be minimized. A 57 mm diameter commercial (RTC France) silicon solar cell under 1 sun (1000 W/m2) at 33 °C was used for parameter estimation of SDM and DDM. The results showed the superiority of the SA over PS and gradient based methods.
Askarzadeh et al. [12] investigated three different variants of HS algorithm for parameter estimation of SDM and DDM employing experimental data for a commercial solar cell (RTC France). The HS variants outperformed GA, chaos particle swarm optimization (CPSO) and PS in terms of precision.
Wang et al. [13] provided improved ABC (IABC) for parameter identification of SDM and DDM. IABC outperformed artificial bee colony algorithm, DE, PSO and ABSO algorithms in terms of error residuals.
Ma et al. [14] applied CS to estimate the parameters of the solar cell and solar module. A commercial 57 mm diameter solar cell (RTC France) was employed for SDM parameter estimation. The results showed that the CS performed better than CPSO, GA and PS.
Metaheuristics present a fairly acceptable solution to optimization problems; but the problem of premature convergence still endures. Premature convergence makes a metaheuristic easily become trapped in a local optimum which leads to a local solution. In order to alleviate the problem of premature convergence, recently, a trend is seen in hybridizing a swarm-based algorithm with a point to point based algorithm [11,12,13,14]. SA is a point to point based metaheuristic which requires less computation time, easy implementation and strong local search ability [16]. These make it suitable for hybridization with swarm based optimization algorithms. In reference [17], the authors hybridized PSO with SA and applied the concept to commonly used benchmark functions to evaluate the performance of the hybrid algorithms; the hybrid strategy presented promising results when compared with conventional PSO. Junghans et al. [18] proposed a hybrid optimization approach using GA and modified SA for building optimization; idea behind the approach was that the best solution from GA has been improved by SA. Fang et al. [19] described a hybrid algorithm of particle swarm optimization (PSO) and tabu search (TS) for distribution network reconfiguration problem; the algorithm demonstrated fast computation speed and ability to avoid premature convergence. Carapellucci et al. [20] described a hybrid parameter estimation strategy for estimation of energy generation island using GA and SA.
This paper attempts to mitigate the problem of premature convergence. Each global best solution from PSO undergoes SA to further improve the solution in terms of better objective values. This approach sufficiently eliminated the premature convergence problem and achieved a better solution in less iteration. This paper is organized as follows: Section 2 discusses the solar cell modeling and formulation of the parameter estimation problem. Section 3 provides details of the HPSOSA algorithm. Simulation results are discussed in Section 4 along with analysis on the results. Section 5 provides concluding remarks on the research work.
2. Photovoltaic Cell Modeling and Parameter Estimation Problem Formulation
This section discusses modeling and mathematical formulation of parameter estimation for SDM and DDM of PV cell.
2.1. PV Cell Modeling
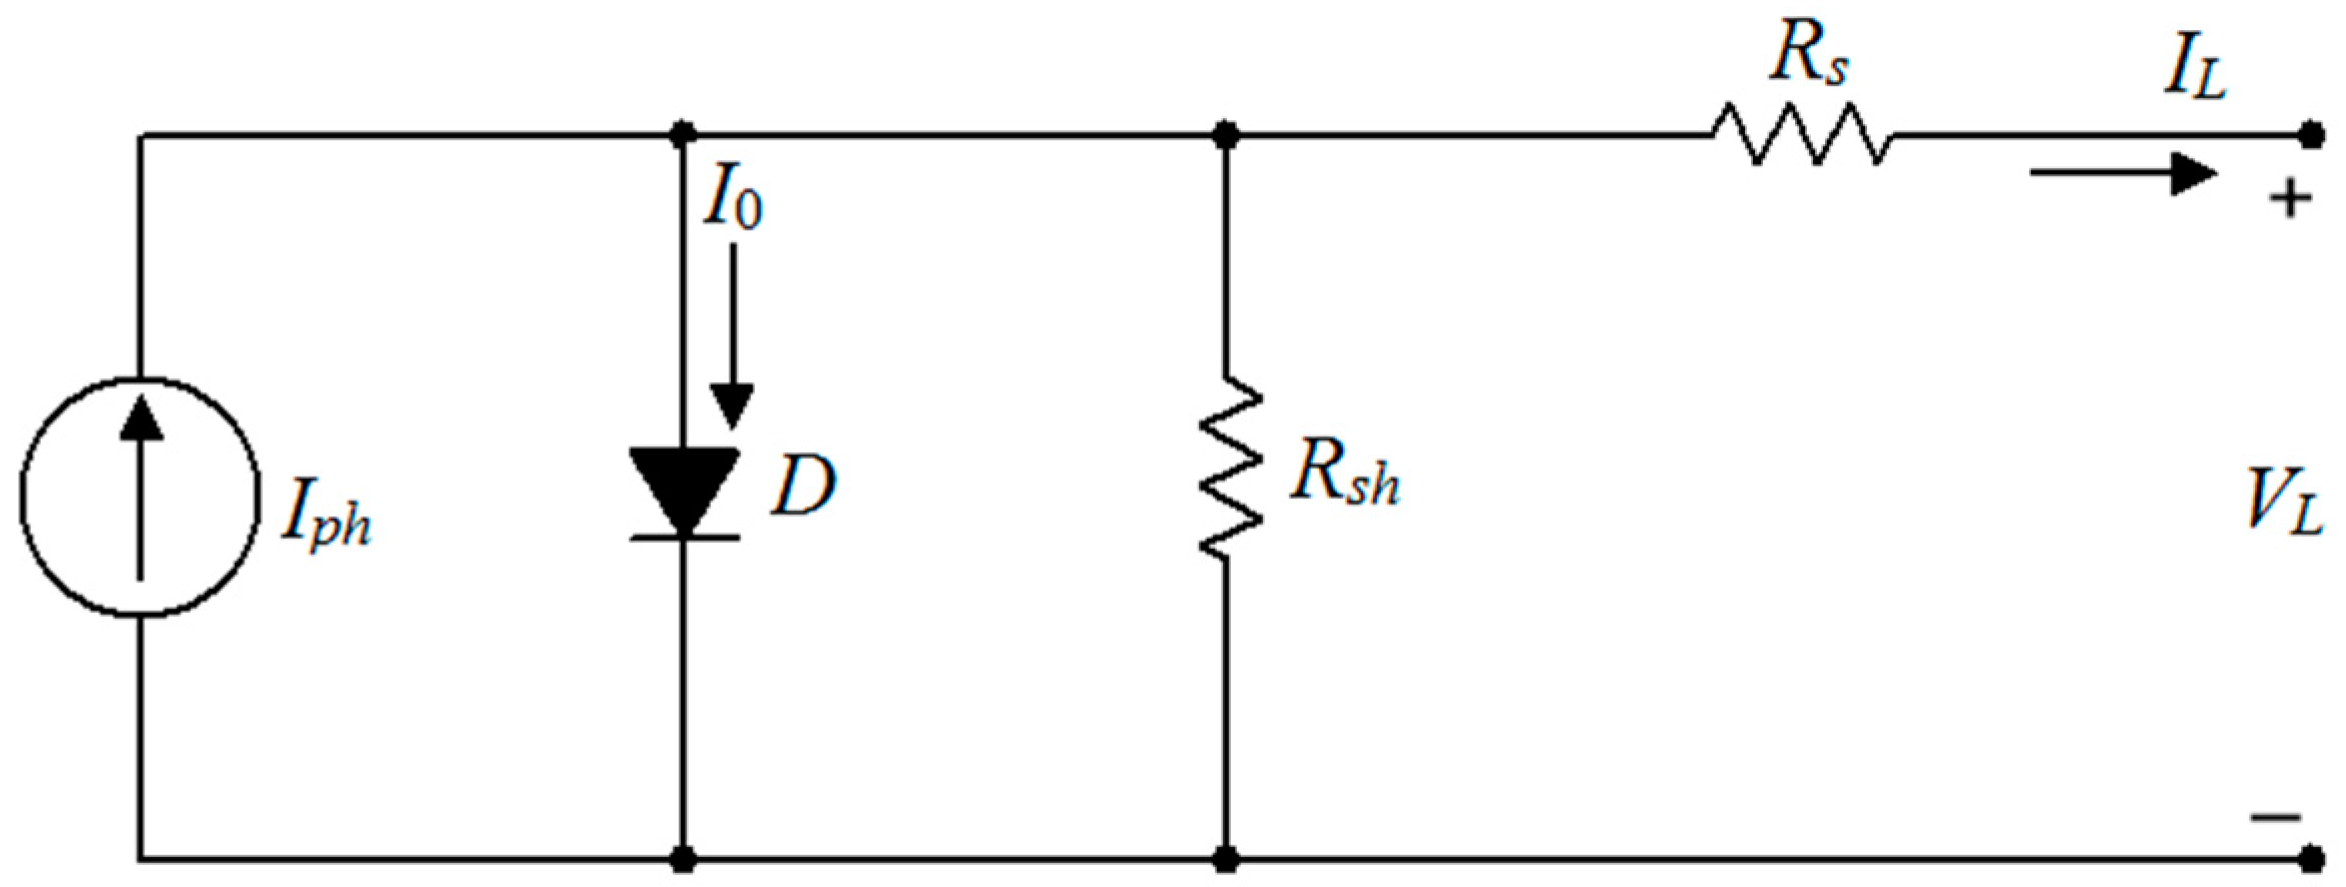
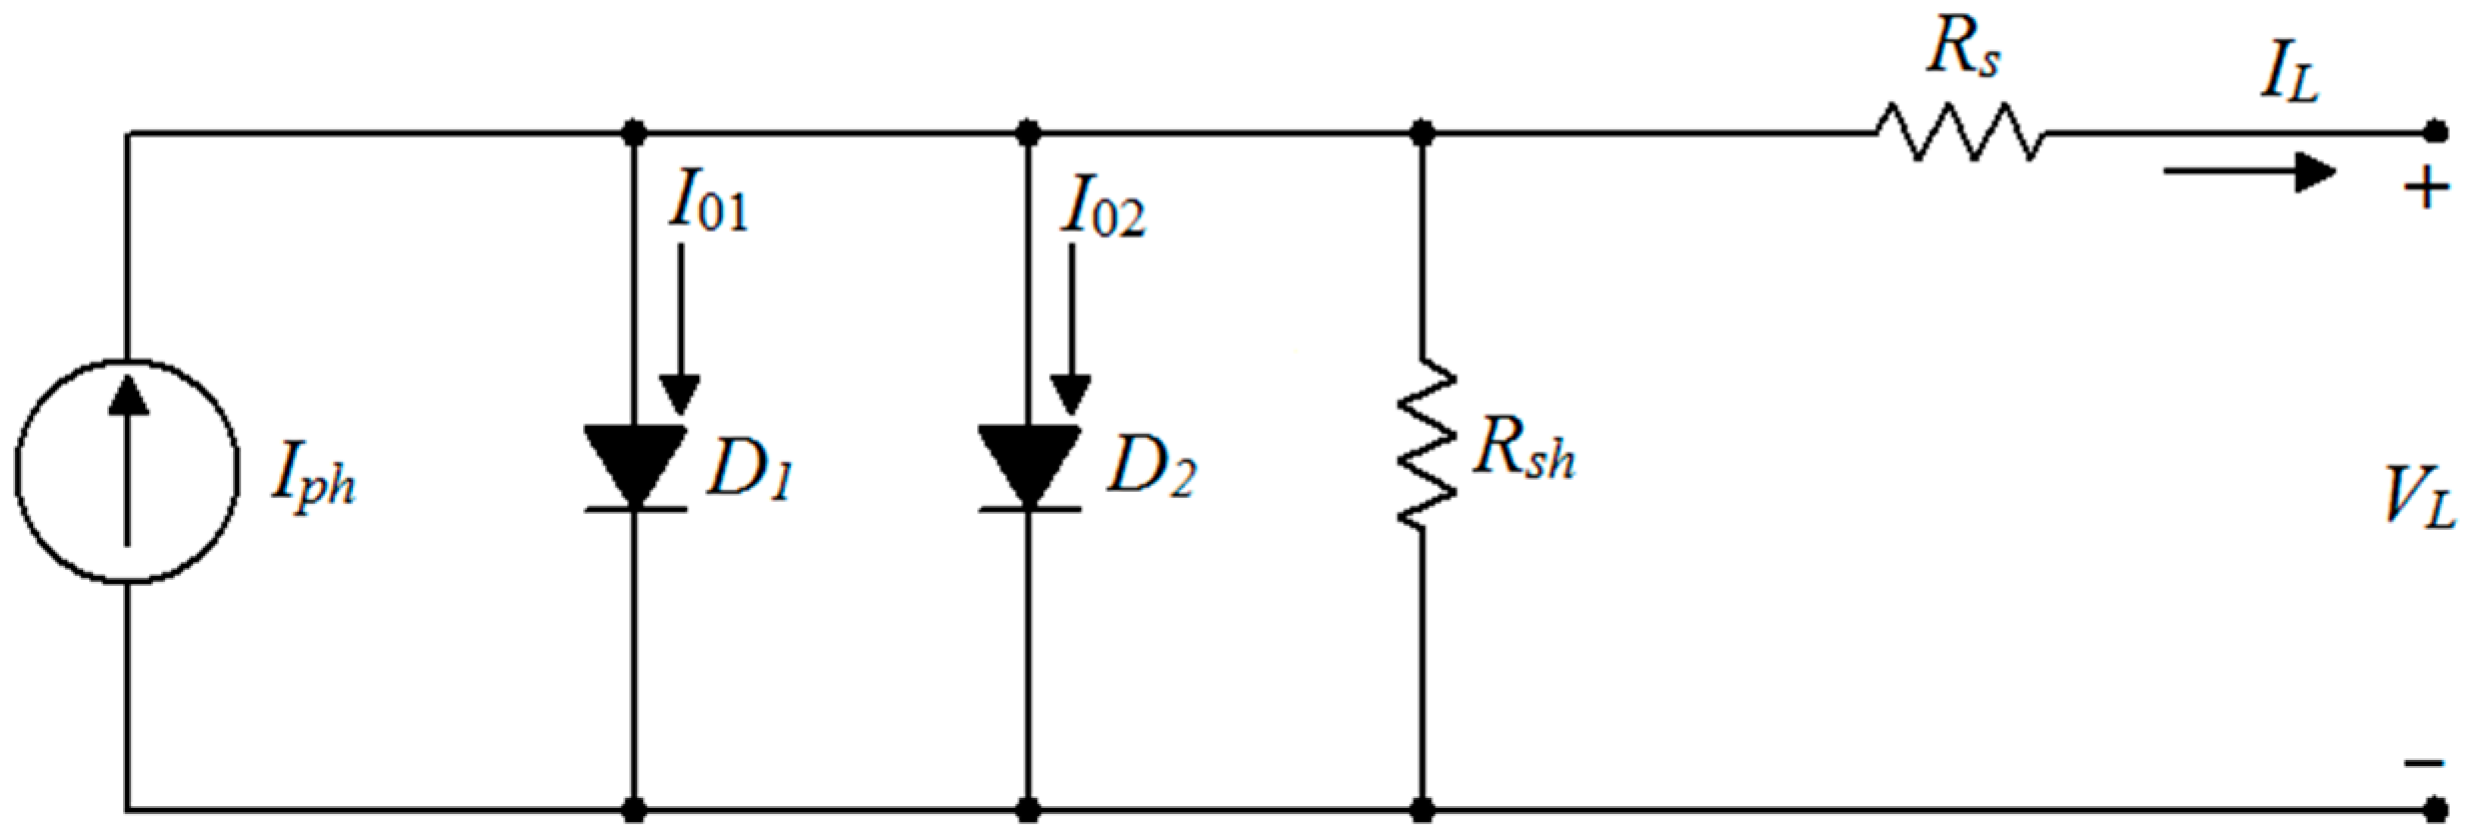
A mathematical model that precisely represents the characteristics of the PV cell is indispensable. Among the various proposed PV models, two models are prominent, i.e., SDM and DDM. The PV cell is modeled as a current source with a diode, ideally. In practice, the model is also equipped with a shunt resistance and a series resistance to accumulate partial short circuit current path near the cell’s edges due to the semiconductor impurities and non-idealities, solar cell metal contacts and the semiconductor bulk resistance, respectively, whereas DDM of PV cell employs another diode shunted across existing diode to accumulate space charge recombination current [21].
SDM is a most widely used PV model and has been shown in Figure 1. I-V characteristics of SDM are expressed as:
From Equation (1), SDM is characterized by five parameters: Iph (photocurrent), I0 (diode saturation current), Rs (series resistance), Rsh (shunt resistance), and n (diode ideality factor). Estimation of these five parameters is essential for modeling of PV cell.
From Equation (2), DDM is characterized by seven parameters: Iph (photocurrent), I01 (diode saturation current for diode D1), I02 (diode saturation current for diode D2), Rs (series resistance), Rsh (shunt resistance), (diode ideality factor for diode D1), and (diode ideality factor for diode D2). Similarly, estimation of these seven parameters is essential for modeling of PV cell.
2.2. Parameter Estimation Problem Formulation
The parameter estimation problem is transformed into an optimization problem to minimize the difference between measured current and calculated current. A performance criterion or objective function is defined for the minimization; RMSE is used as objective function and is given by:
where, is the measured current, is the calculated current and N is the number of measured data points. θ is the parameter vector (to be estimated) which has five elements in the case of SDM i.e., and seven parameters in the case of DDM i.e., . is the function of Vm, and θ.
A programming model computed and thus RMSE using the , and ; thus the parameters are estimated. The estimated parameters should strictly follow the actual I-V characteristics, ideally. However, there is a difference between the experimental current and the estimated current due to the measurement noise errors. Parameter bounds [22] used in this study have been tabulated in Table 1 for SDM and DDM.
3. HPSOSA Algorithm for PV Parameter Estimation
This section presents a new algorithm of HPSOSA based on the analysis of PSO and SA.
3.1. Particle Swarm Optimization
Particle swarm optimization is a swarm-based metaheuristic optimization algorithm. A swarm of particles (potential solutions) is used in the entire search space to find the solution with optimized (minimized) objective value. The particles are randomly initialized in the search space. The initial position and associated objective values are stored as their personal best solutions. The particle or position with the minimum objective function value is stored as global best. The position and velocity of each particle is updated according to following relations:
In Equations (4) and (5) is the velocity of the i-th particle, is the personal best solution, is the global best solution, is the position of current solution, and are the personal acceleration coefficient and social acceleration coefficient, respectively, ω is the inertia weight, and are random numbers .
After changing velocity and position of each particle, objective associated with new position is evaluated and their and are updated using simple relations shown in Equations (6) and (7):
where J is the objective function to be minimized. In this way is computed iteratively until a stopping criterion is satisfied. The stopping criterion may be a certain number of iterations or a predefined error tolerance.
3.2. Simulated Annealing
Simulated annealing (SA) is another metaheuristic, proposed by Kirkpatrick et al. in 1983 [23]. Since then SA, a point to point based algorithm, has found diverse applications. In SA, a new solution is generated in the vicinity of the previous solution. For a minimization problem, all new solutions are evaluated for an objective function. Solutions that contribute to a minimized objective are accepted; solutions are also accepted which do not minimize the objective but with a certain probability based on the following inequality:
In Equation (8) is a random number . is the new solution and is the previous solution, and is the temperature. Before starting SA an initial temperature and minimum temperature is defined. Accepting solutions based on Equation (8) enables SA to escape local minimum in early iterations and reach the global minimum. The temperature is lowered using a cooling schedule; commonly used one is geometric cooling schedule written as:
where is the temperature control factor.
3.3. Hybrid Particle Swarm Optimization and Simulated Annealing
The purpose of hybridizing PSO with SA is to alleviate the premature convergence problem. The obtained by PSO, at each iteration, is further processed and evaluated by SA. The obtained result thus presents an improved solution by virtue of optimal objective. Following is a description of step-wise procedure for HPSOSA.
- Step 1:
- Set all parameters: , , , problem dimension n, maximum number of iterations, , , .
- Step 1.1:
- Initialize particles using a random generation system within parameter bounds.
- Step 1.2:
- Evaluate the objective value of all the particles using Equation (3), assign Pb and Gb of the particles.
- Step 2:
- Start the iteration cycle.
- Step 2.1:
- Update particle velocity according to Equation (4).
- Step 2.2:
- Apply velocity limits.
- Step 2.3:
- Update particle position according to Equation (5).
- Step 2.4:
- Update Pb and Gb according to Equations (6) and (7).
- Step 2.5:
- Assign Gb as current solution to SA.
- Step 2.6:
- Start SA iterations.
- Step 2.7:
- Generate random solution in the proximity of the current solution as a new solution.
- Step 2.8:
- Evaluate the new solution for the objective function.
- Step 2.9:
- Accept new solution if it satisfies Equation (8).
- Step 2.10:
- Update temperature according to Equation (9).
- Step 2.11:
- Repeat Step 2 until the stopping criterion is met.
- Step 3:
- Output the Gb and associated objective value.
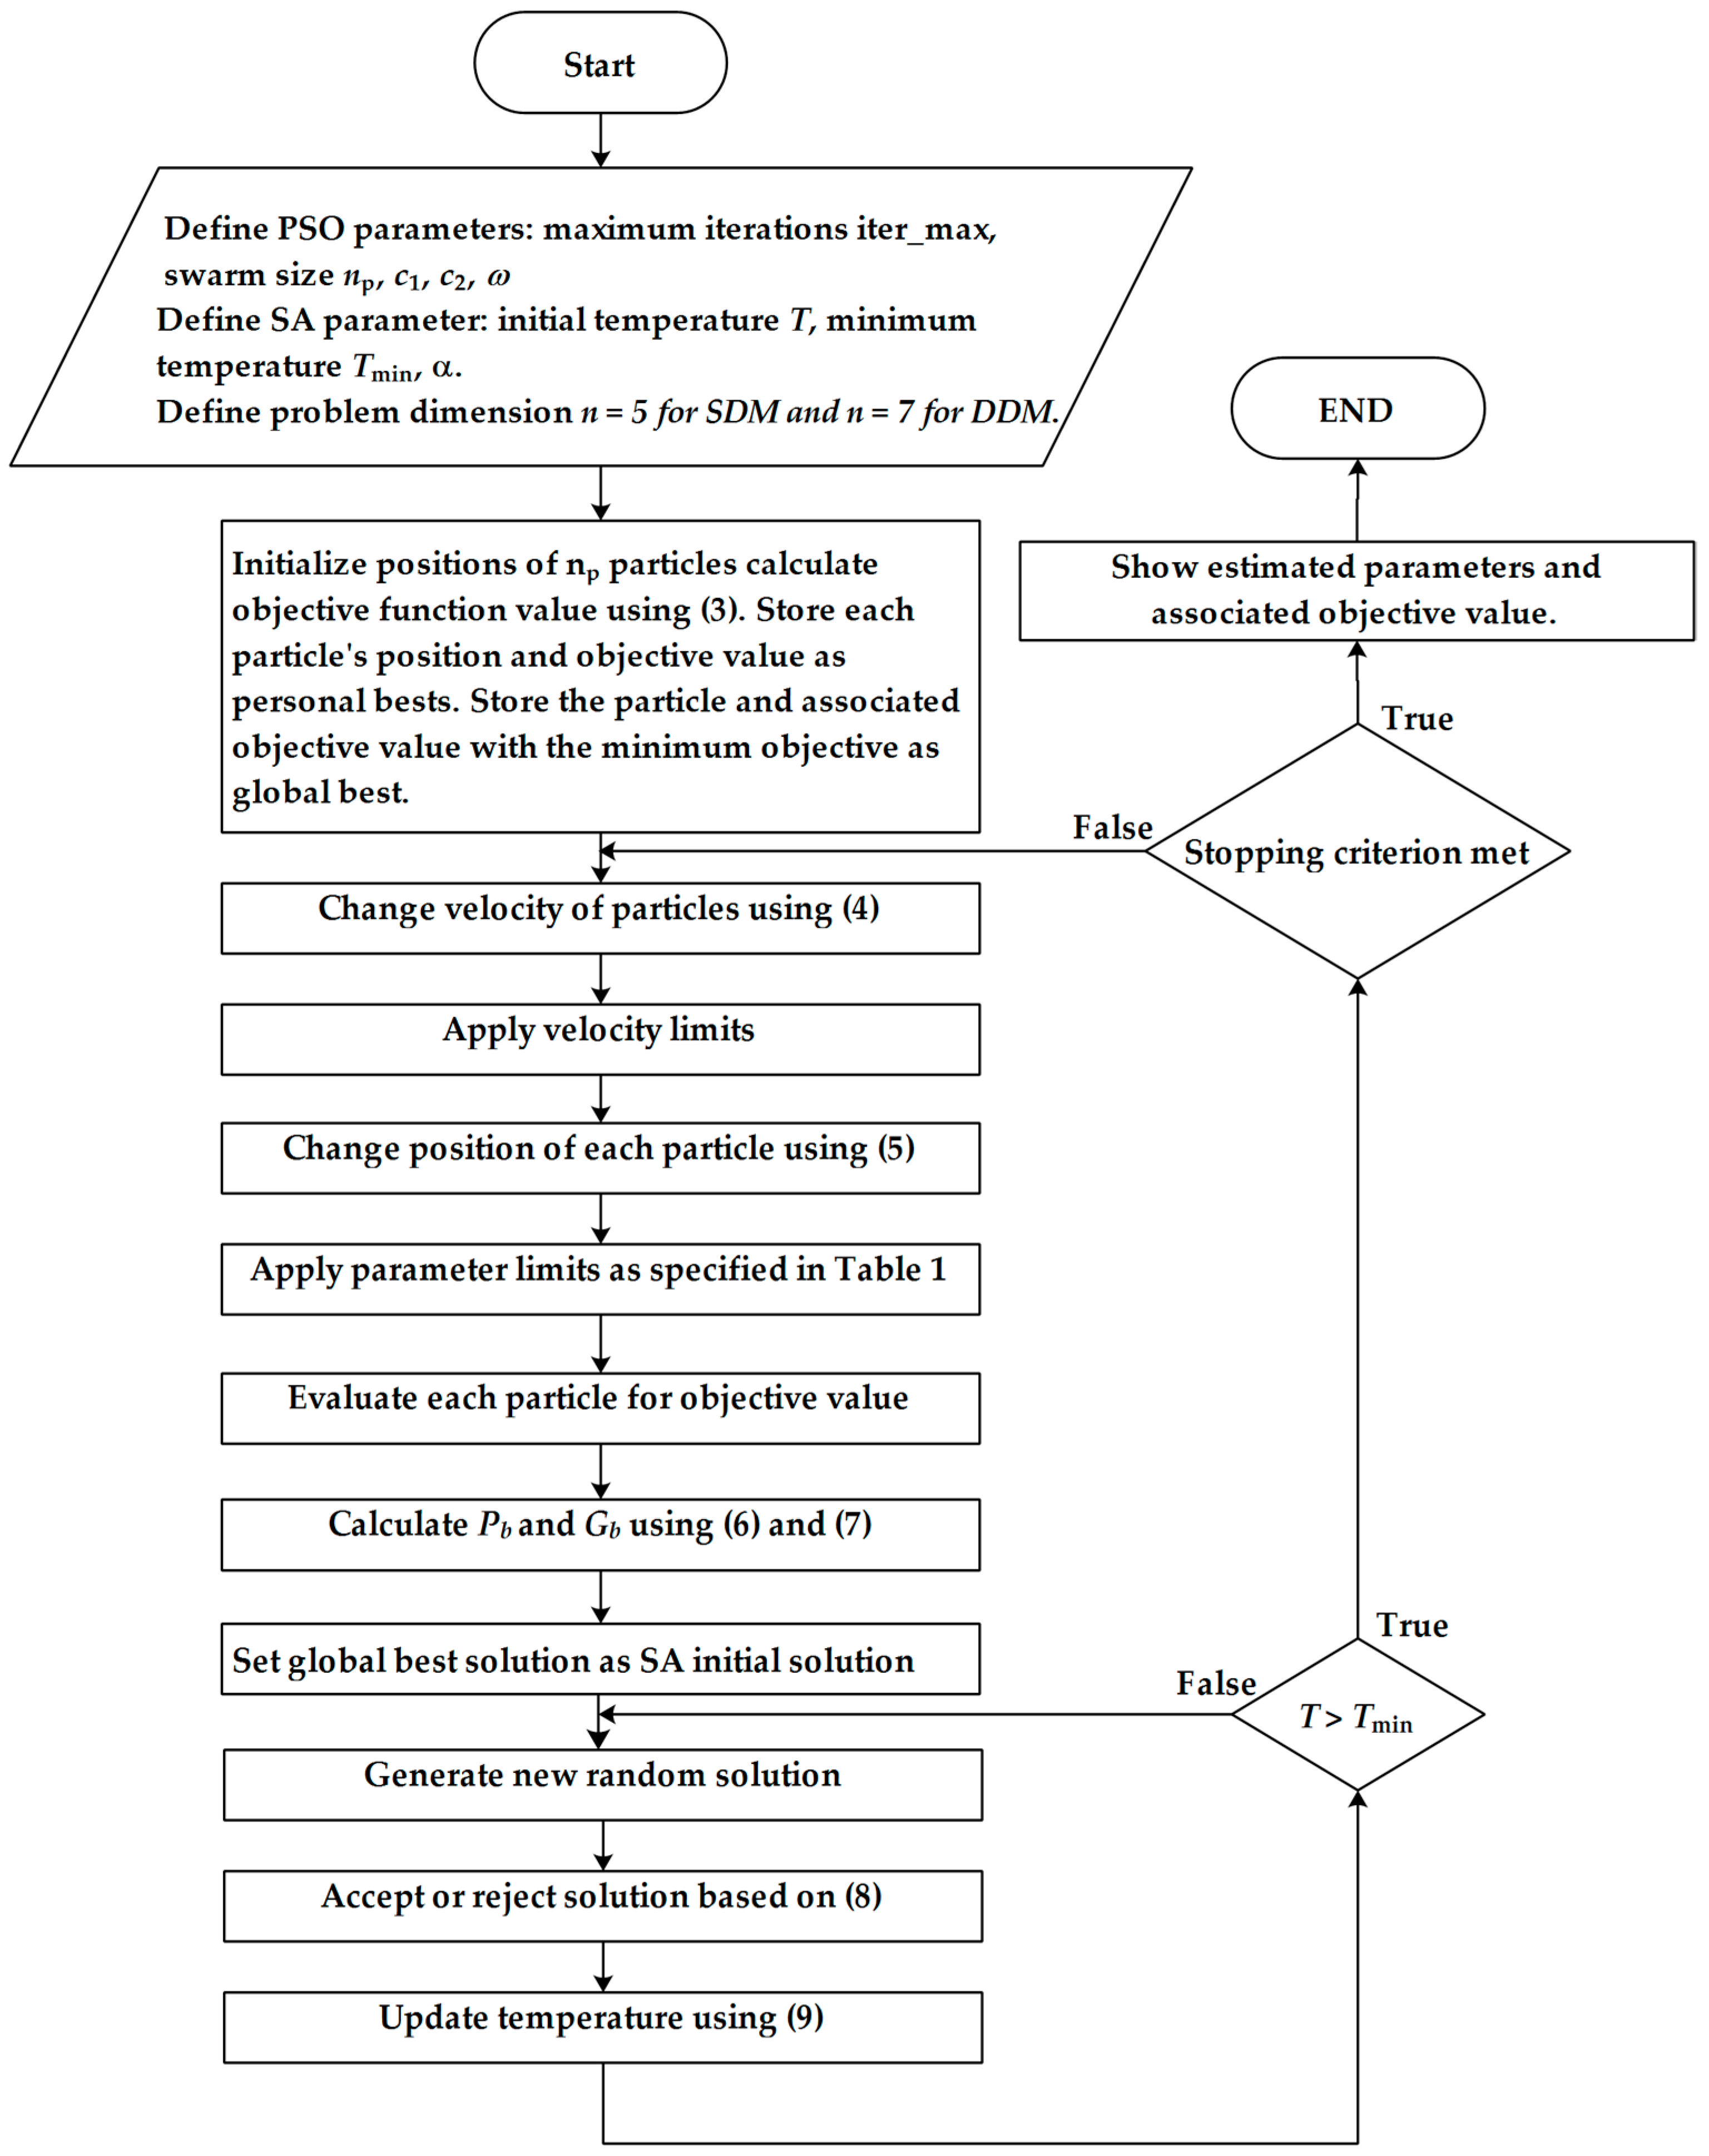
A flowchart of the algorithm is shown in Figure 3.
4. Experimental Results and Discussions
The HPSOSA algorithm described above is used to estimate the parameters of a commercial silicon solar cell (RTC France, city, country); the experimental data were obtained at an irradiance of 1000 W/m2 and temperature of 33 °C [24]. For HPSOSA, initially, is set as 0.9 and decreased monotonically with a factor of 0.9, at each iteration. Both and are set as 2. The number of particles is set as 500 for SDM as well as for DDM. for SA is set as 100 and is set as 0.99. Termination criterion is set by maximum number of iterations; algorithm stops when it reaches 100 iterations. The HPSOSA is compared with conventional particle swarm optimization (CPSO) as described in [25], HS, IABC, SA and PS algorithms to authenticate its performance. In an attempt to evaluate the quality of the estimated model, two basic measures of accuracy namely root mean square error and mean absolute error are calculated based on Equations (10) and (11):
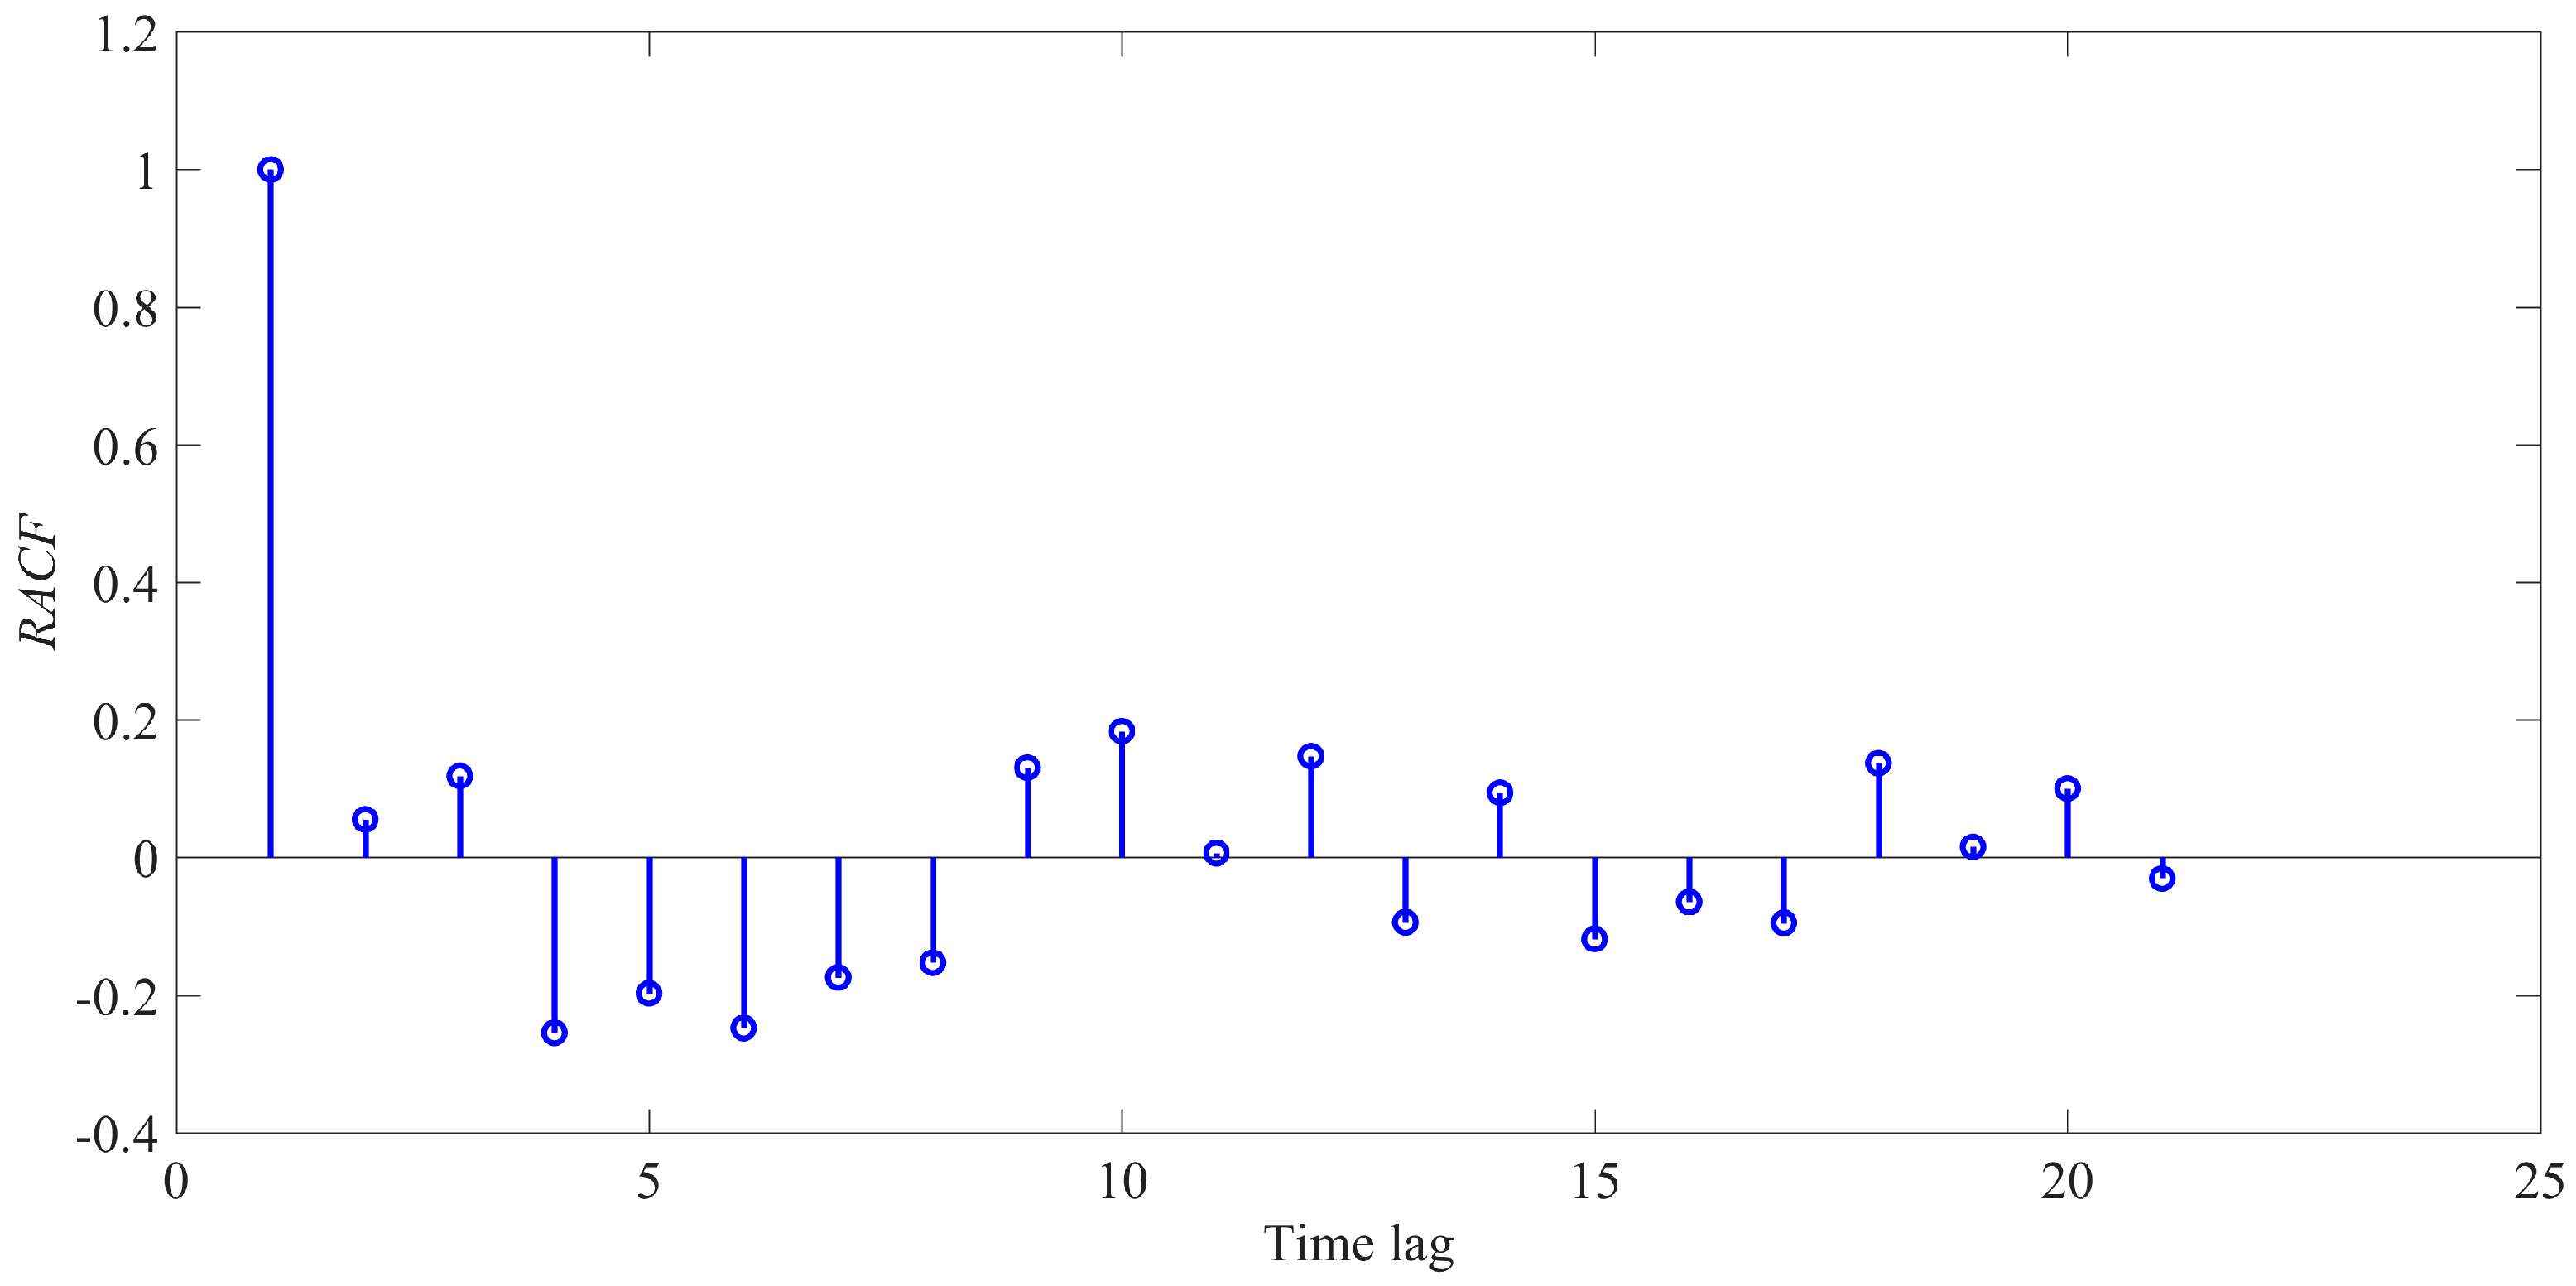
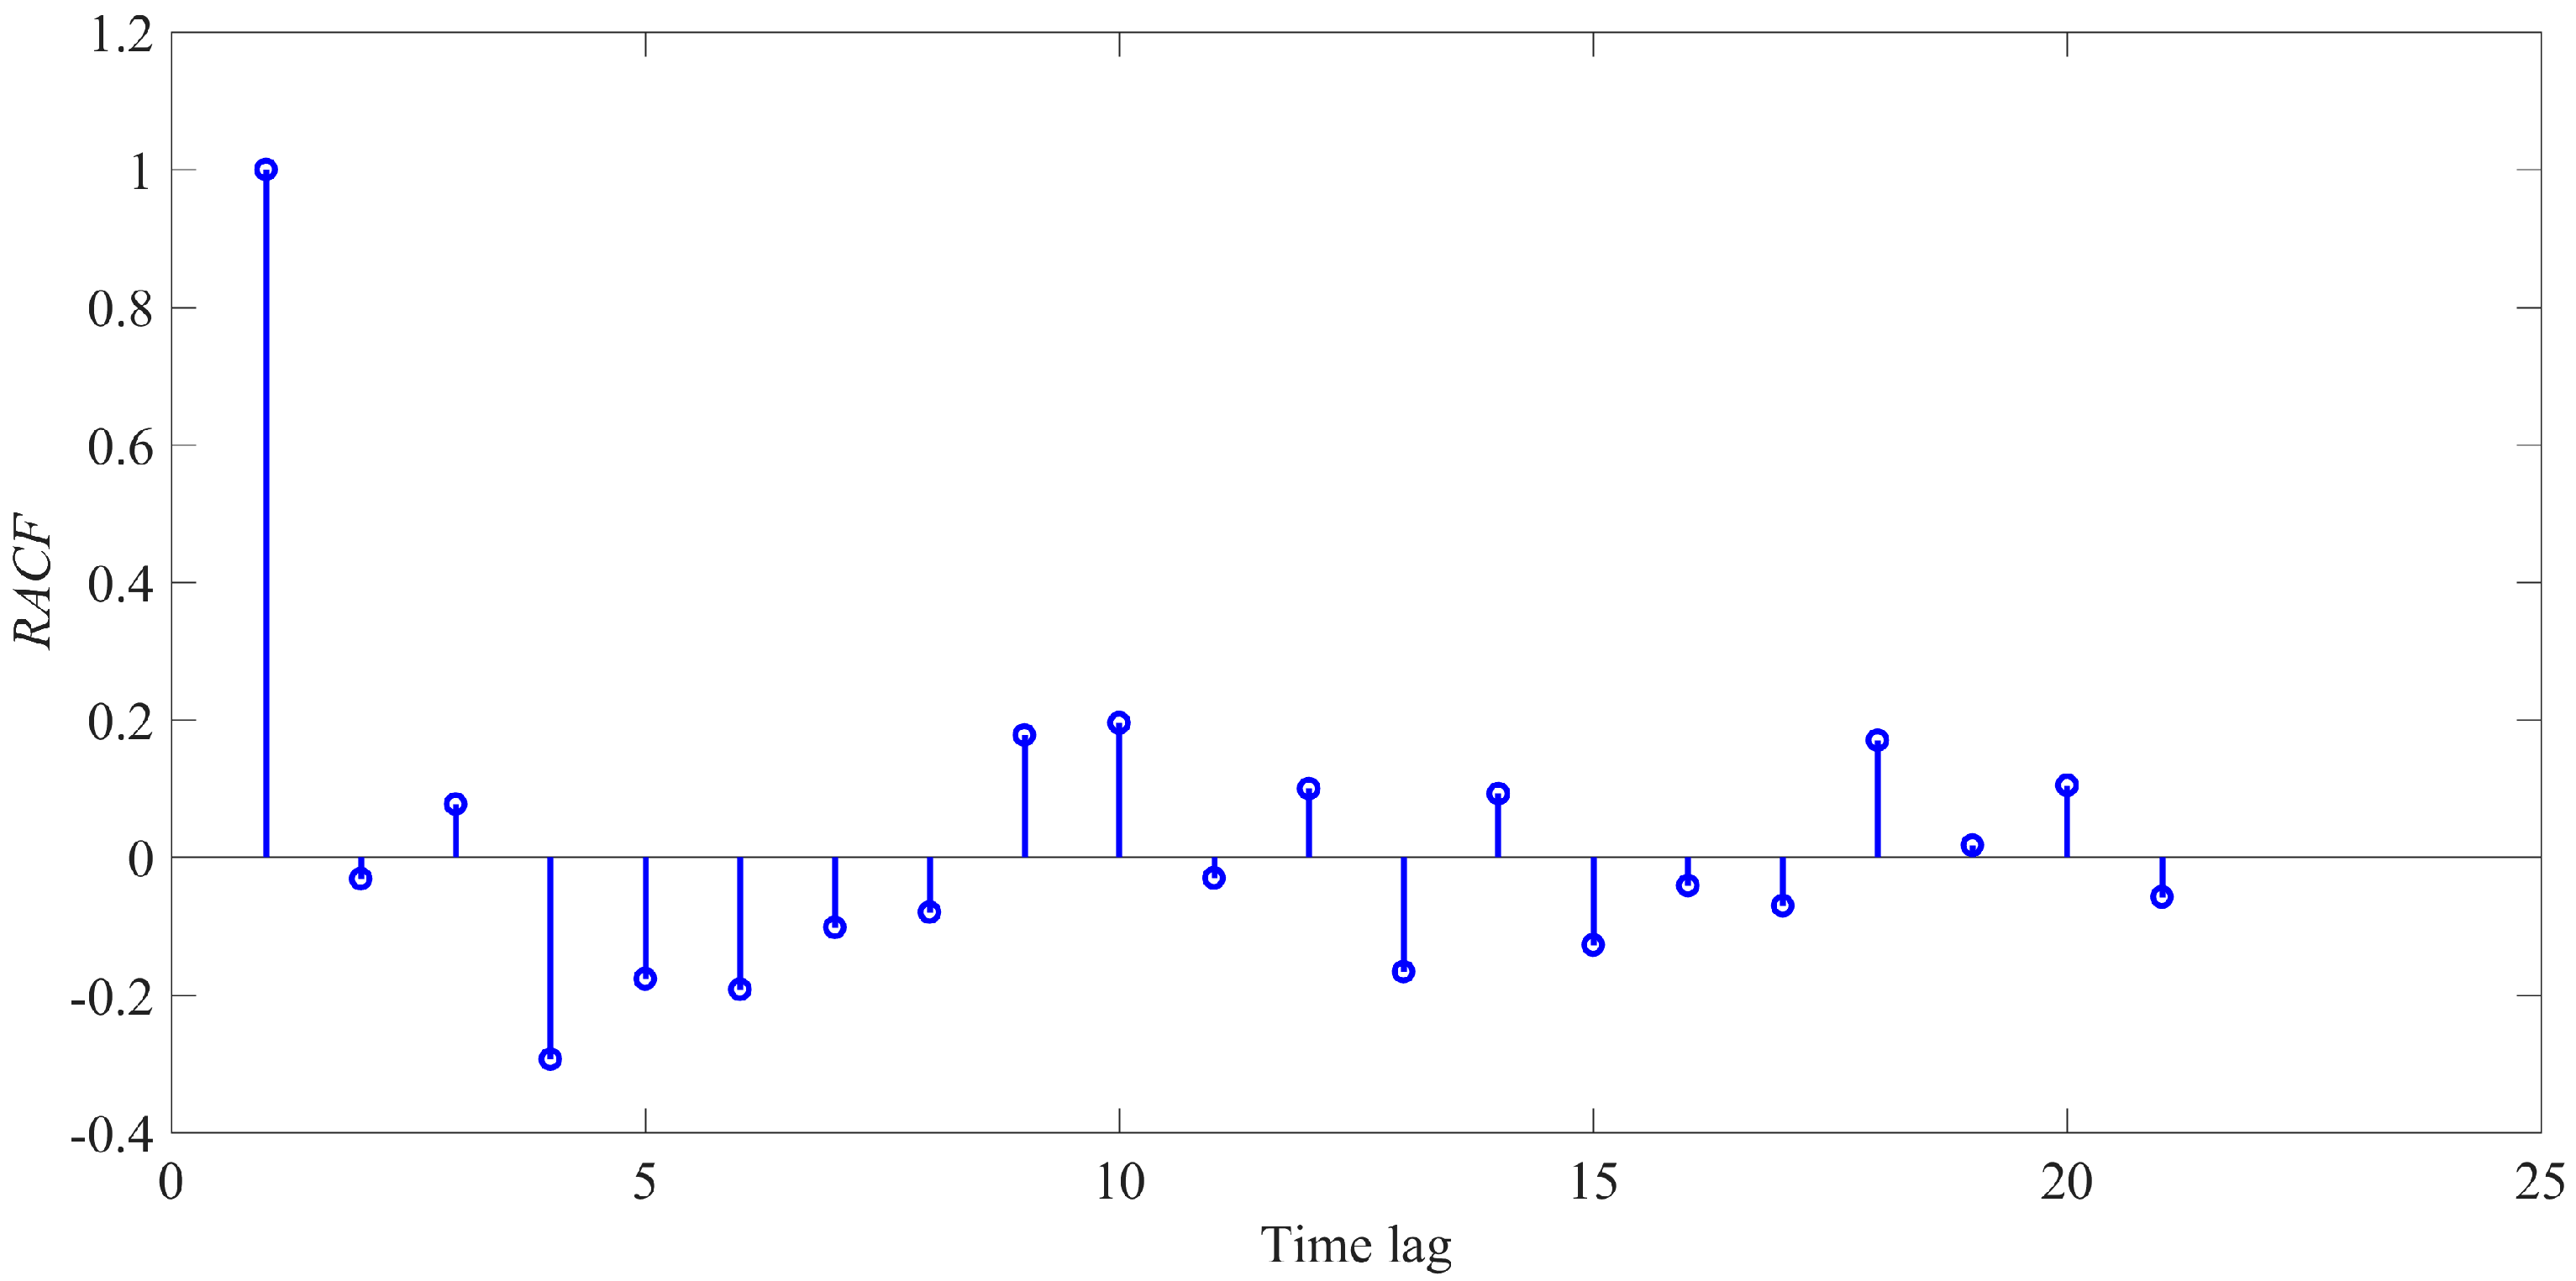
Another test of quality of the estimated model is to calculate residual autocorrelation function that describes that the estimated model satisfactorily defines a given set of data. The test is implemented in two steps: (1) Examination of the estimated residuals described by . (2) Calculation of RACF at different time lags using the following expression:
where k is the time lag, and t is the time index. The value ranges from −1 to +1. If a given value is significantly different from zero, it will fall outside a confidence level.
4.1. Results for Single Diode PV Model
The algorithm has been run for 20 times to curtail the effect of randomness implicit in the results. Statistics of 20 runs for SDM have been computed and tabulated in Table 2.
It is evident from Table 2 that HPSOSA performs better than CPSO in terms of the average, best, worst, standard deviation, and median of the objective values in all 20 runs. The HPSOSA achieved the average, minimum, maximum and median of objective values as low as 7.7301 × 10⁻⁴. HPSOSA achieved a standard deviation of 4.0768 × 10⁻¹⁷; obviously it is far better than the standard deviation calculated for CPSO. The best values of the estimated parameters of SDM have been tabulated in Table 3 along with and values. It can be seen that HPSOSA stands out as superior among all the algorithms with and values as low as 7.7301 × 10⁻⁴ and 6.7818 × 10⁻⁴, respectively.
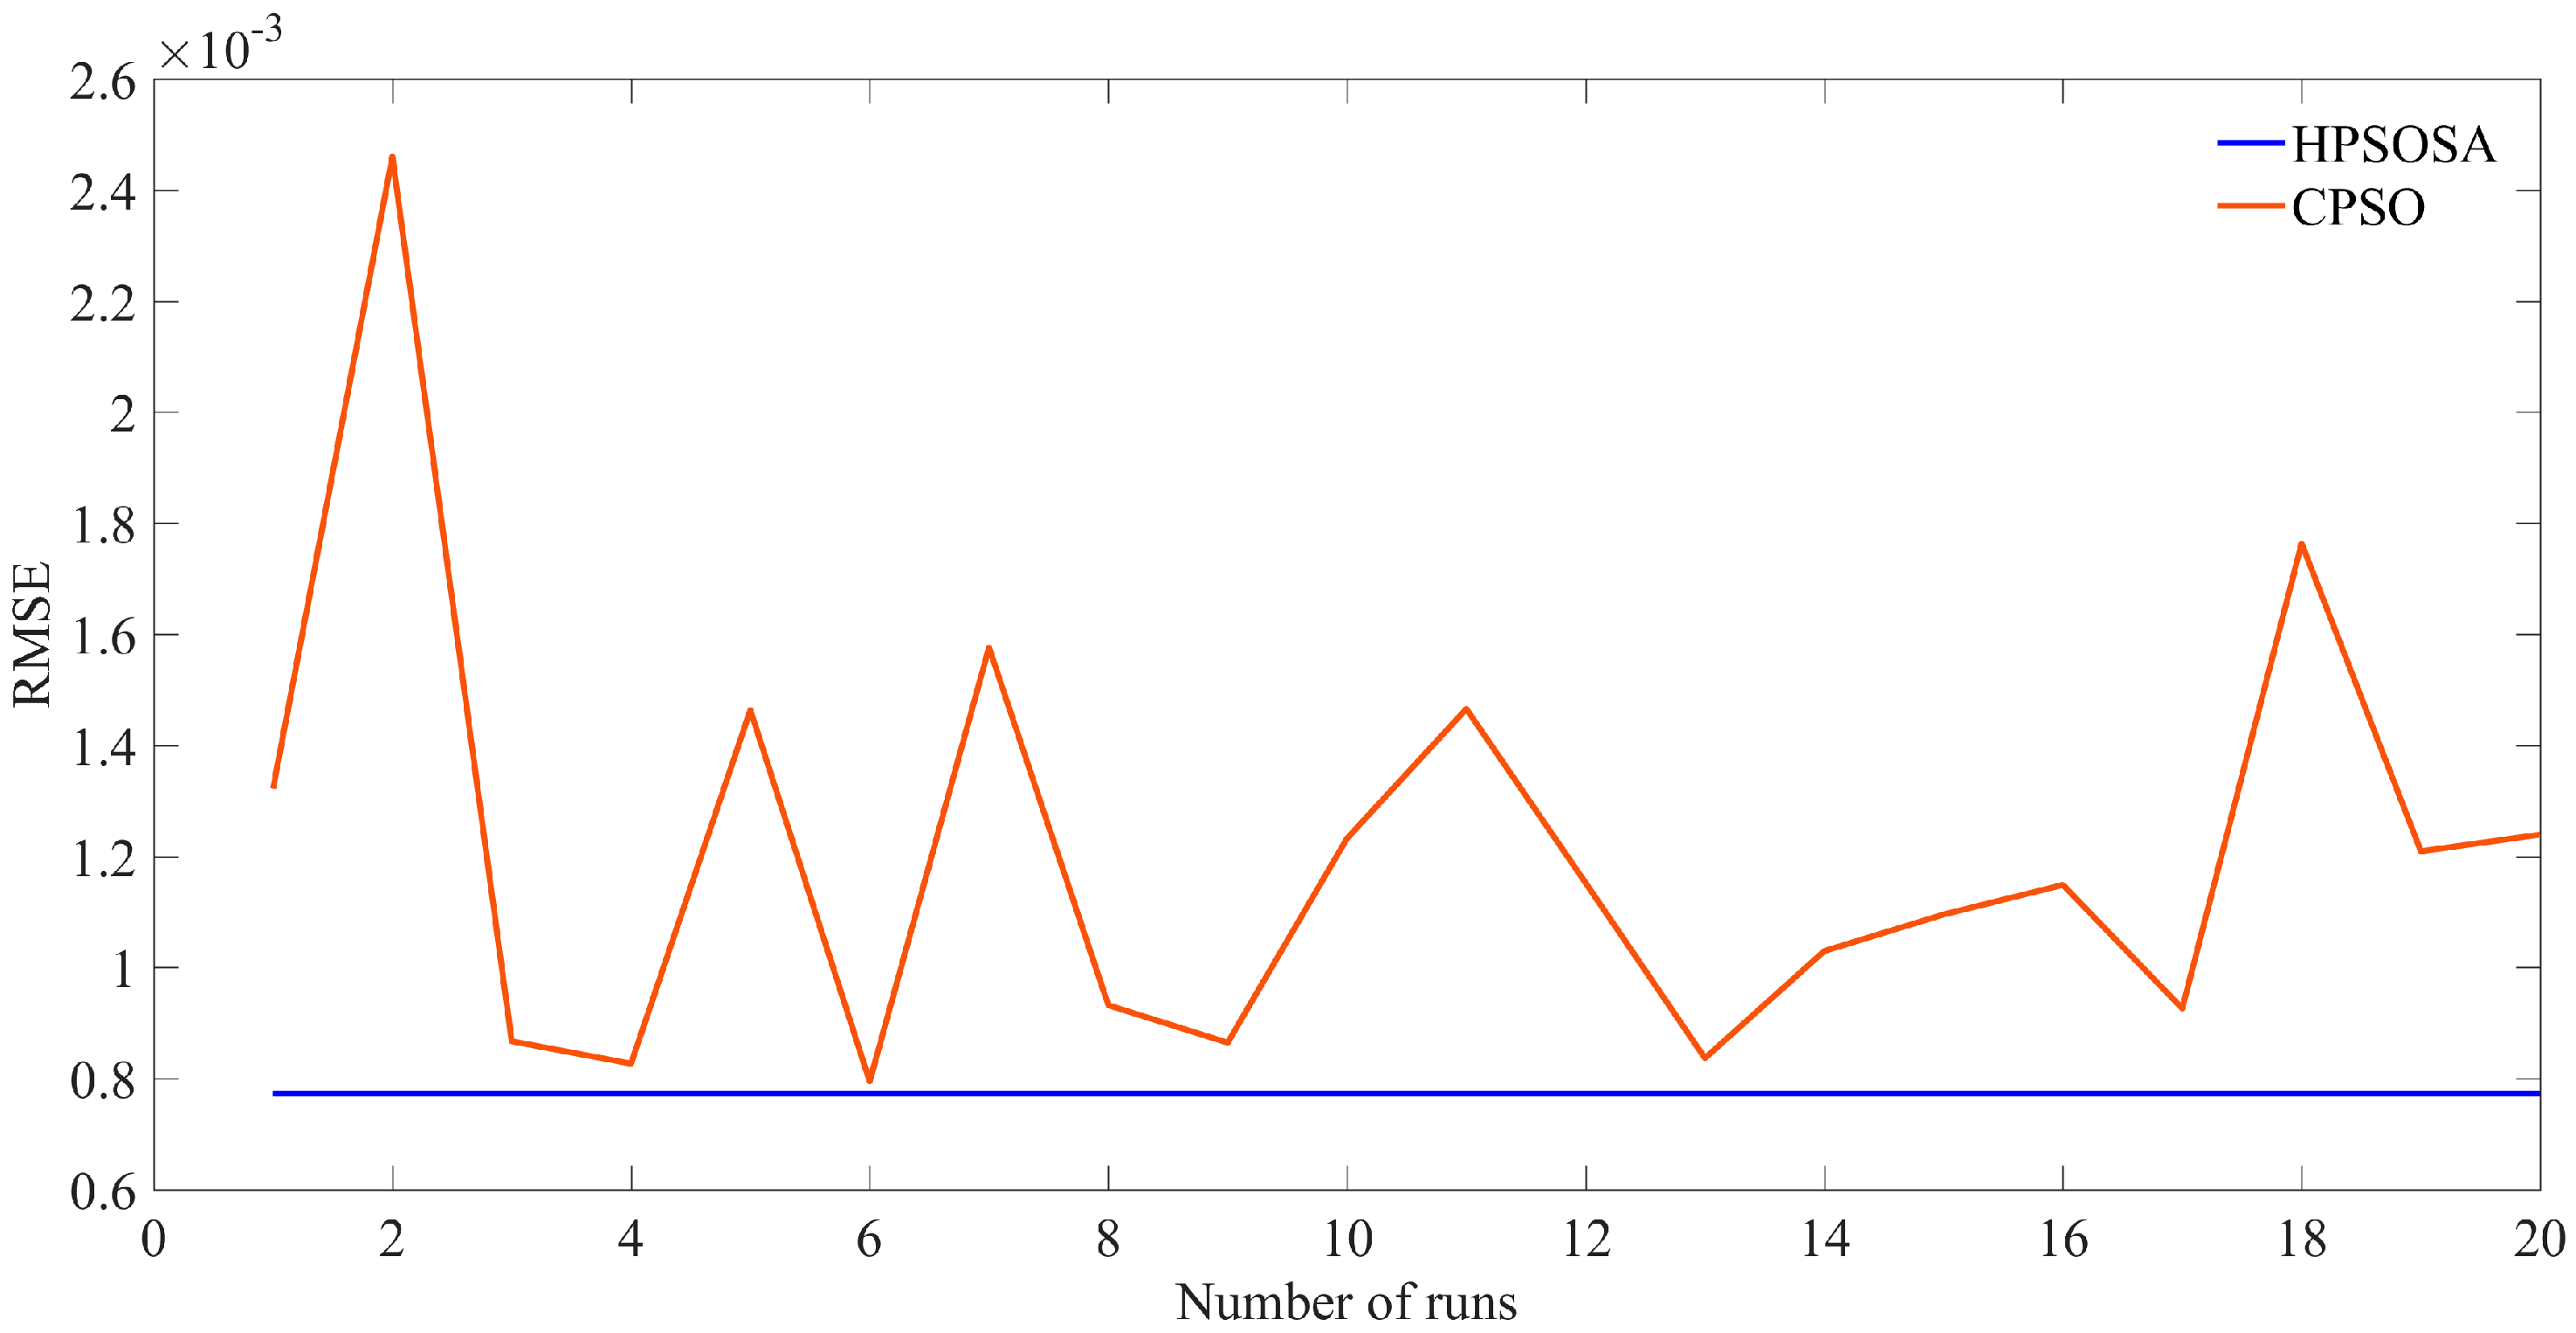
A measure of robustness of the HPSOSA and CPSO for 20 runs is shown in Figure 4. It is apparent from Figure 4 that the HPSOSA is able to achieve a minimum RMSE value in all 20 iterations and presents a robust solution for the parameter estimation problem. Whereas CPSO reached only once in the proximity of the minimum RMSE, achieved by HPSOSA.
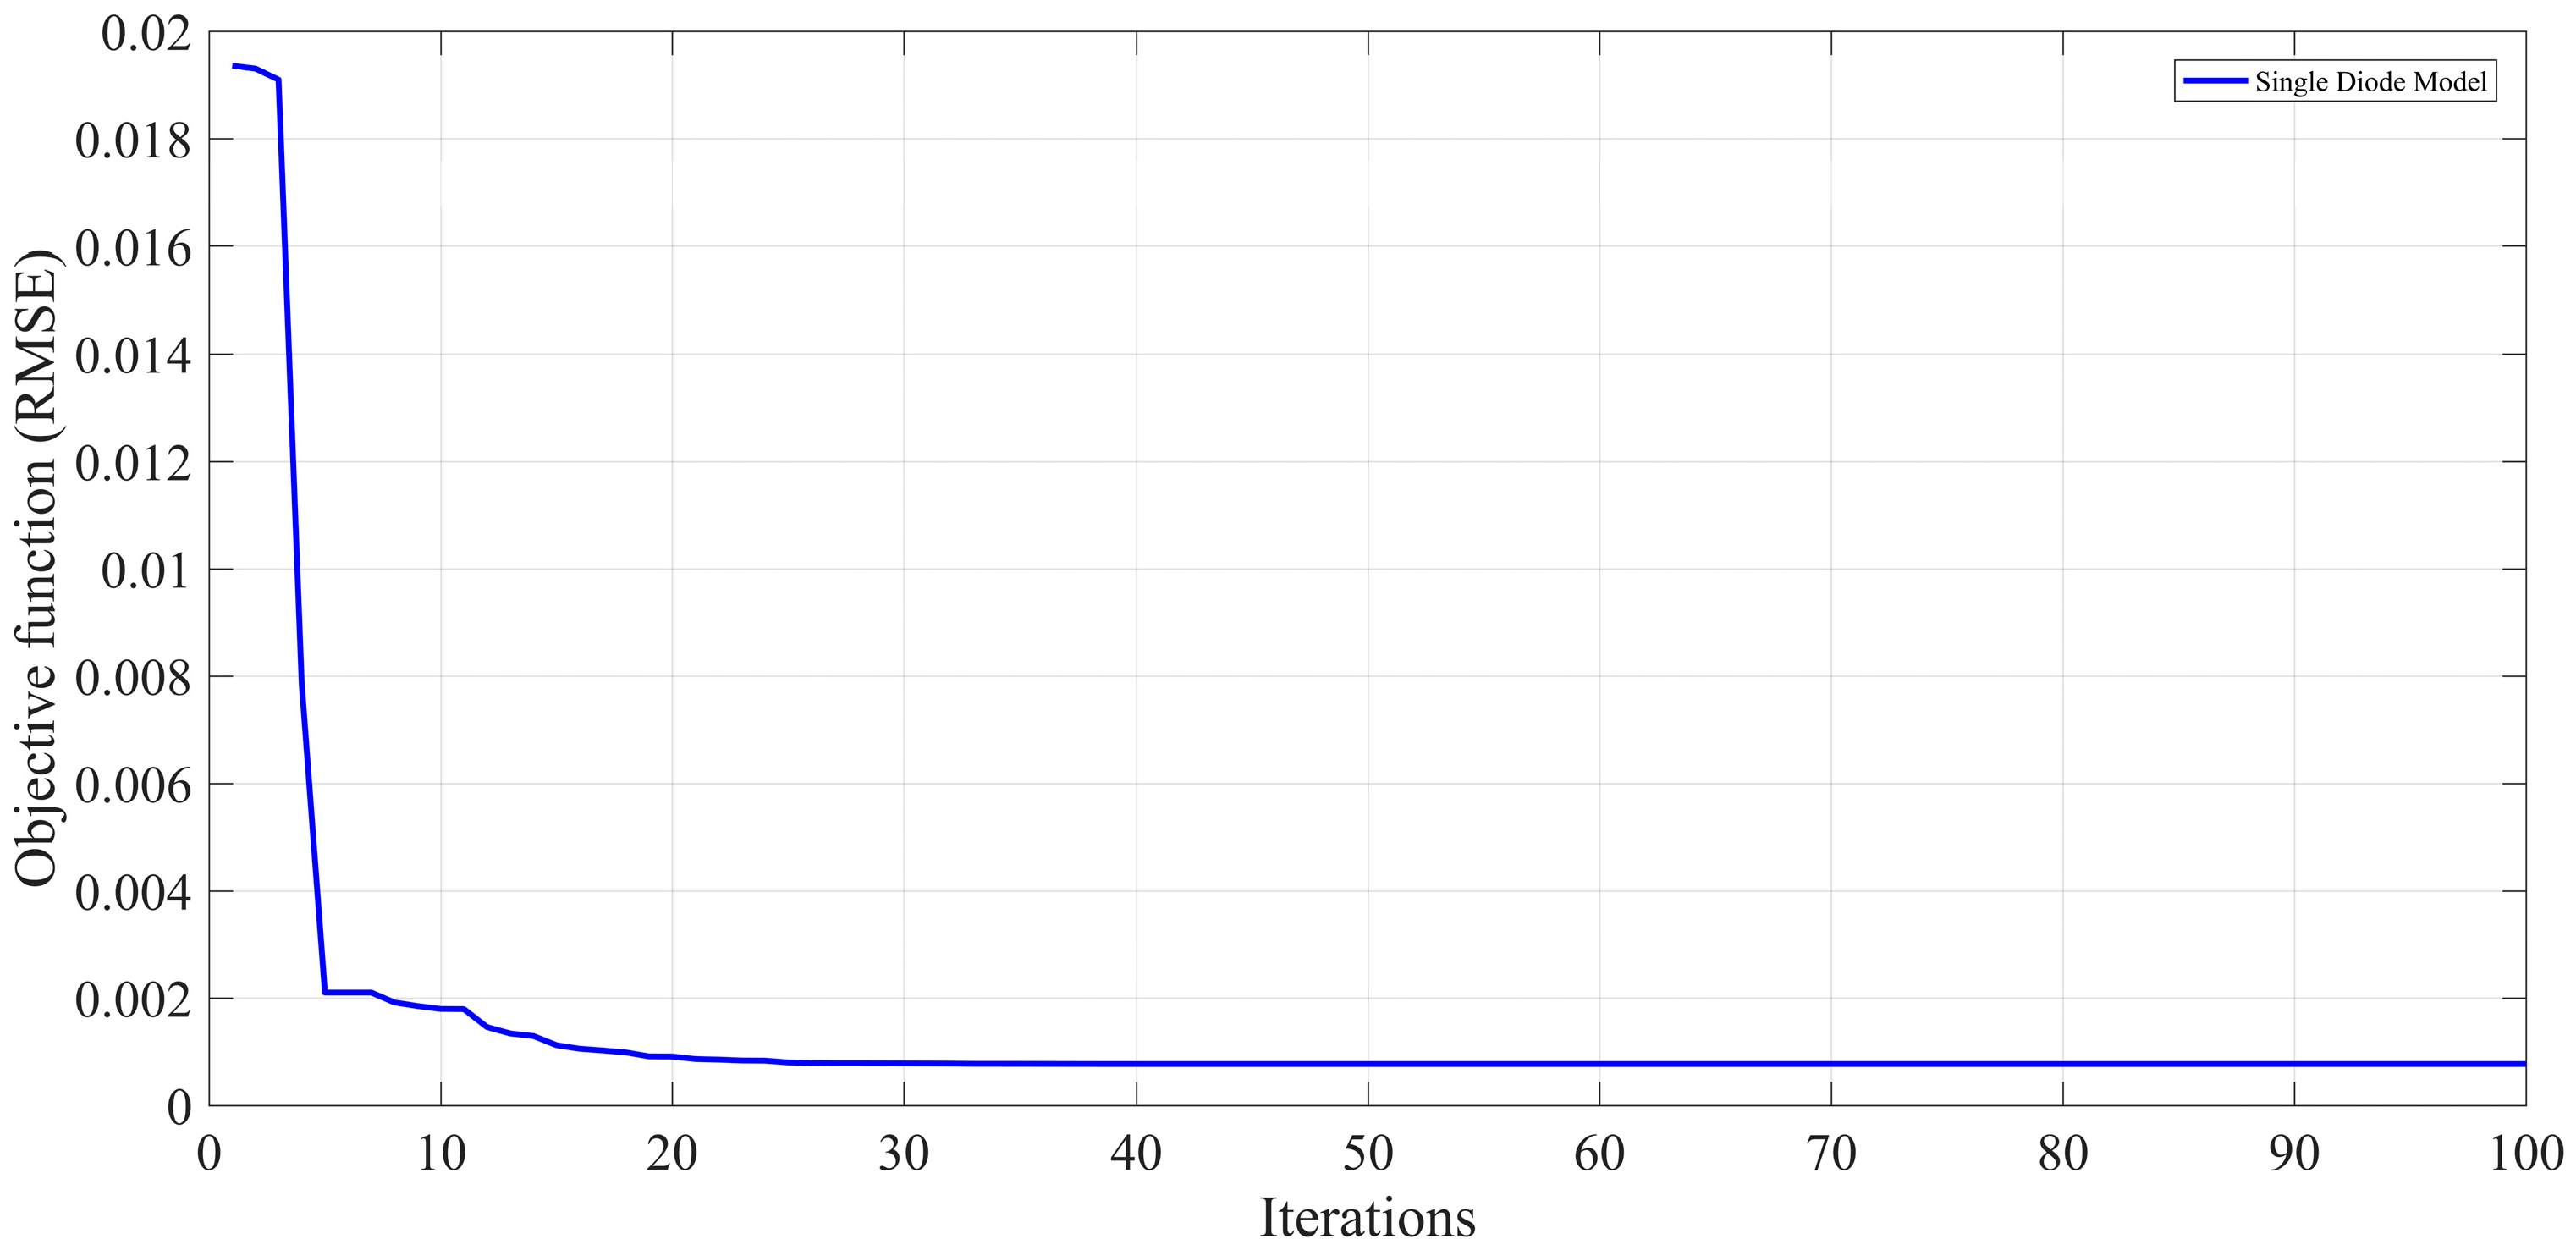
Objective function convergence curve for the best run of HPSOSA has been shown in Figure 5. It is evident from the figure that the HPSOSA is able to attain a stable minimum objective value in less than 20 iterations.
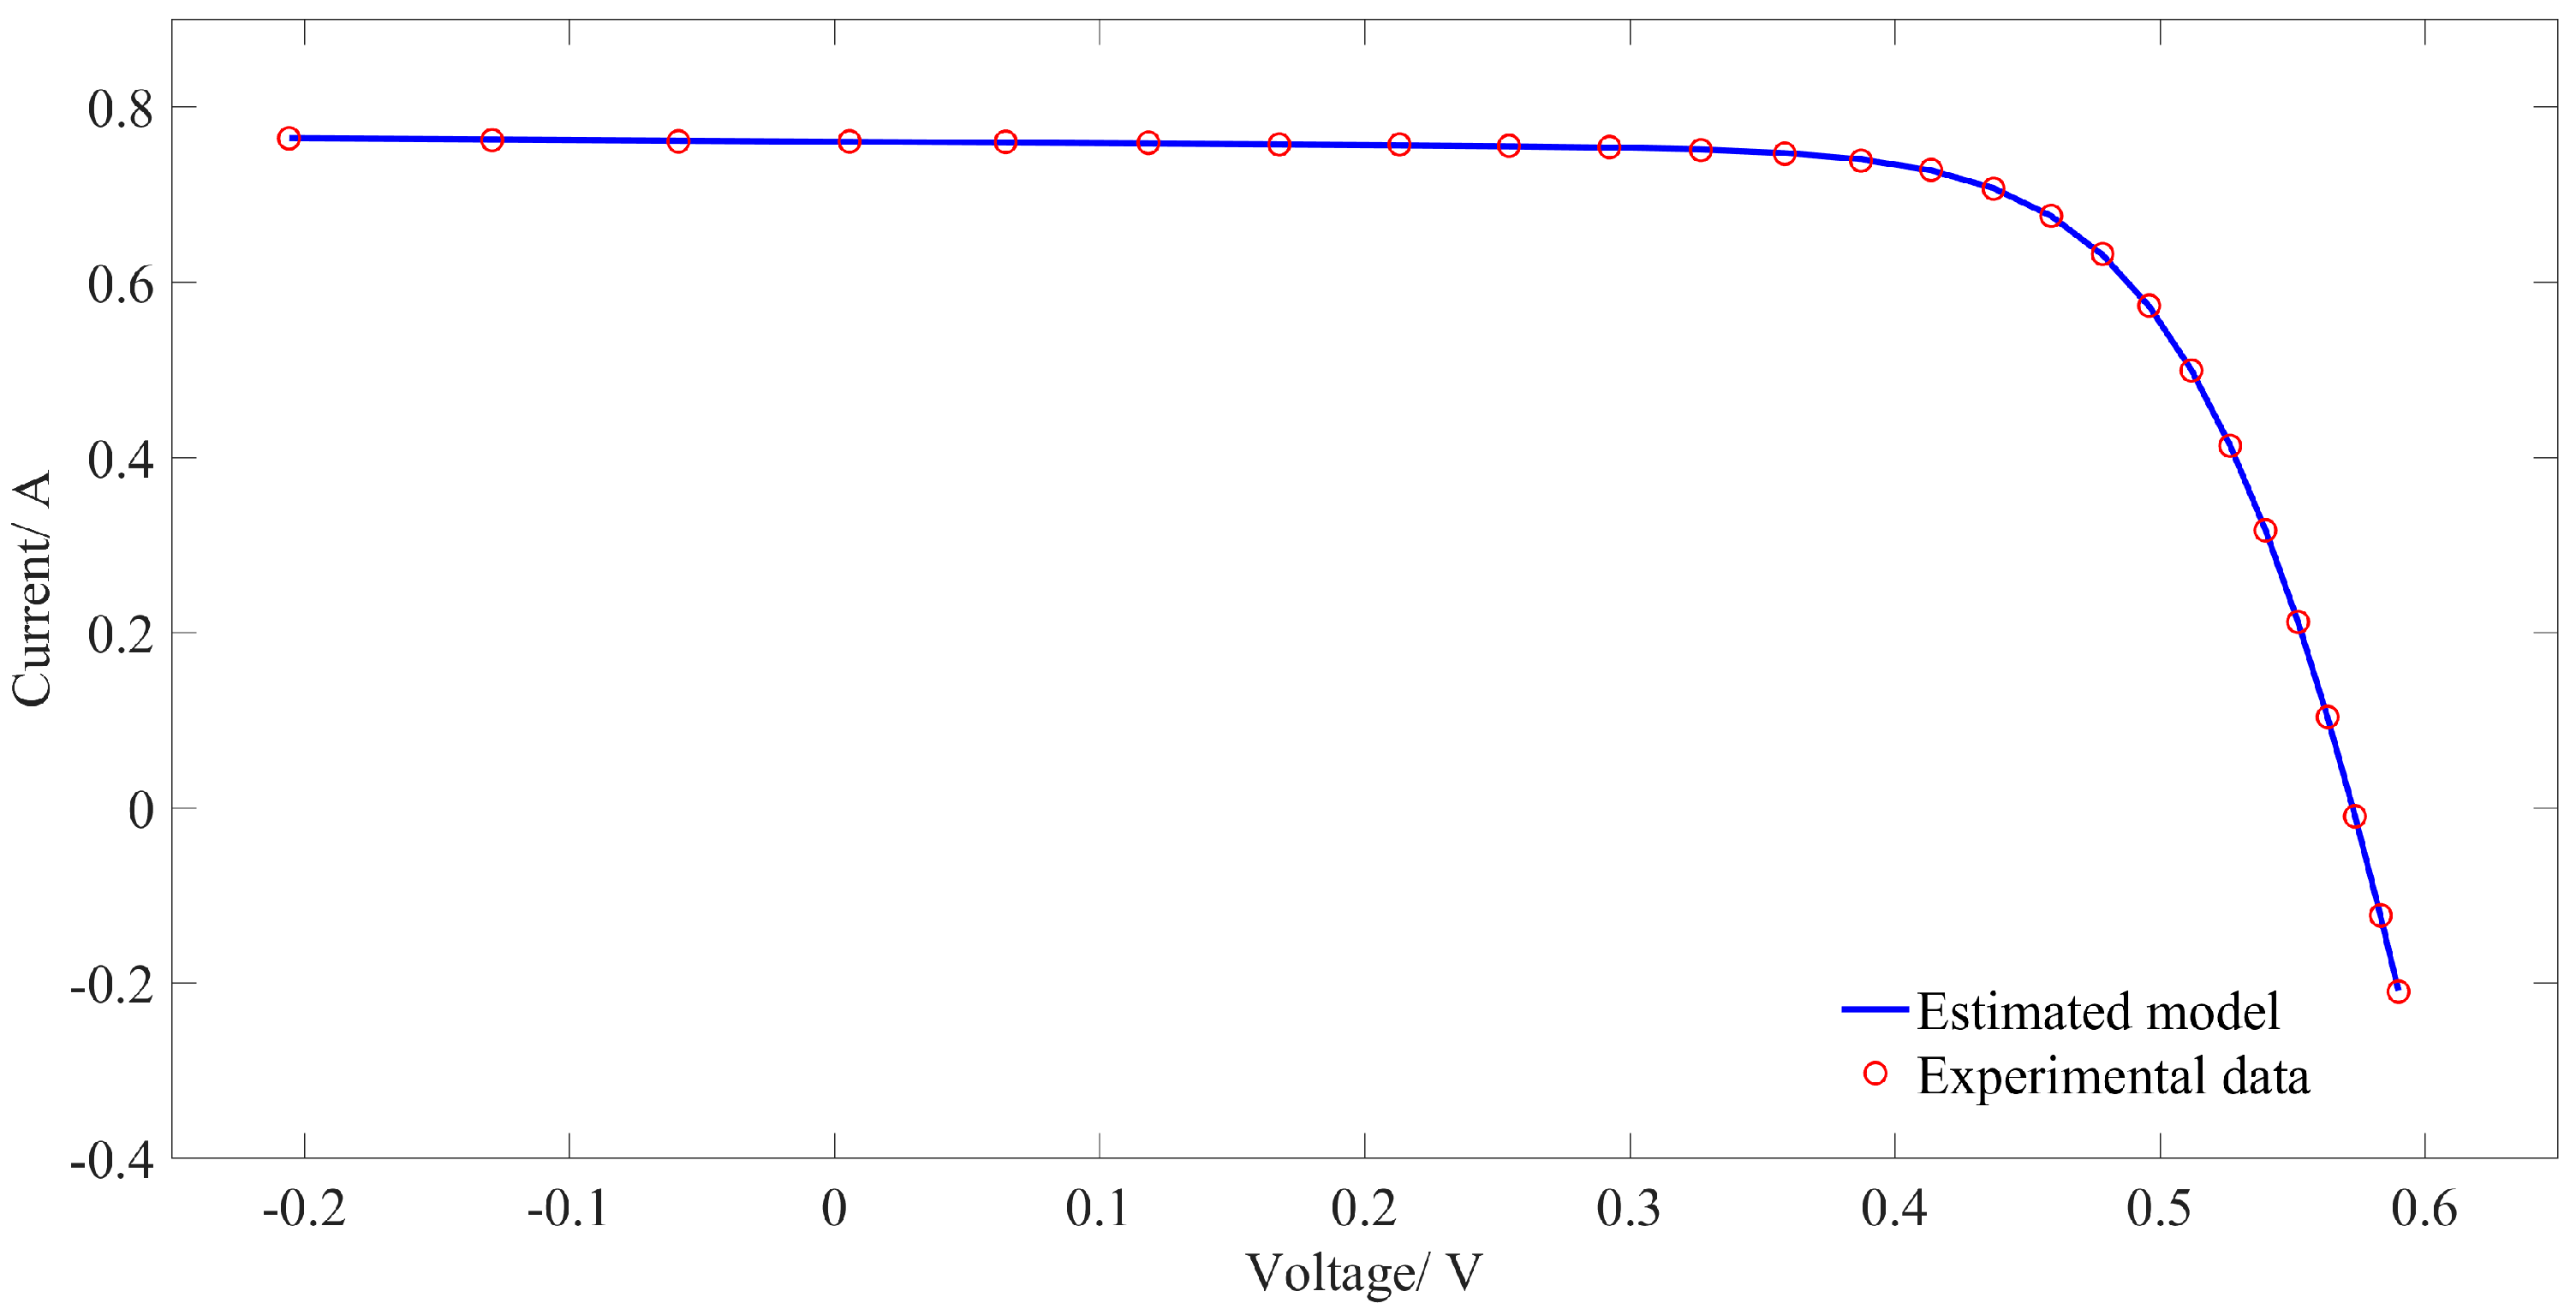
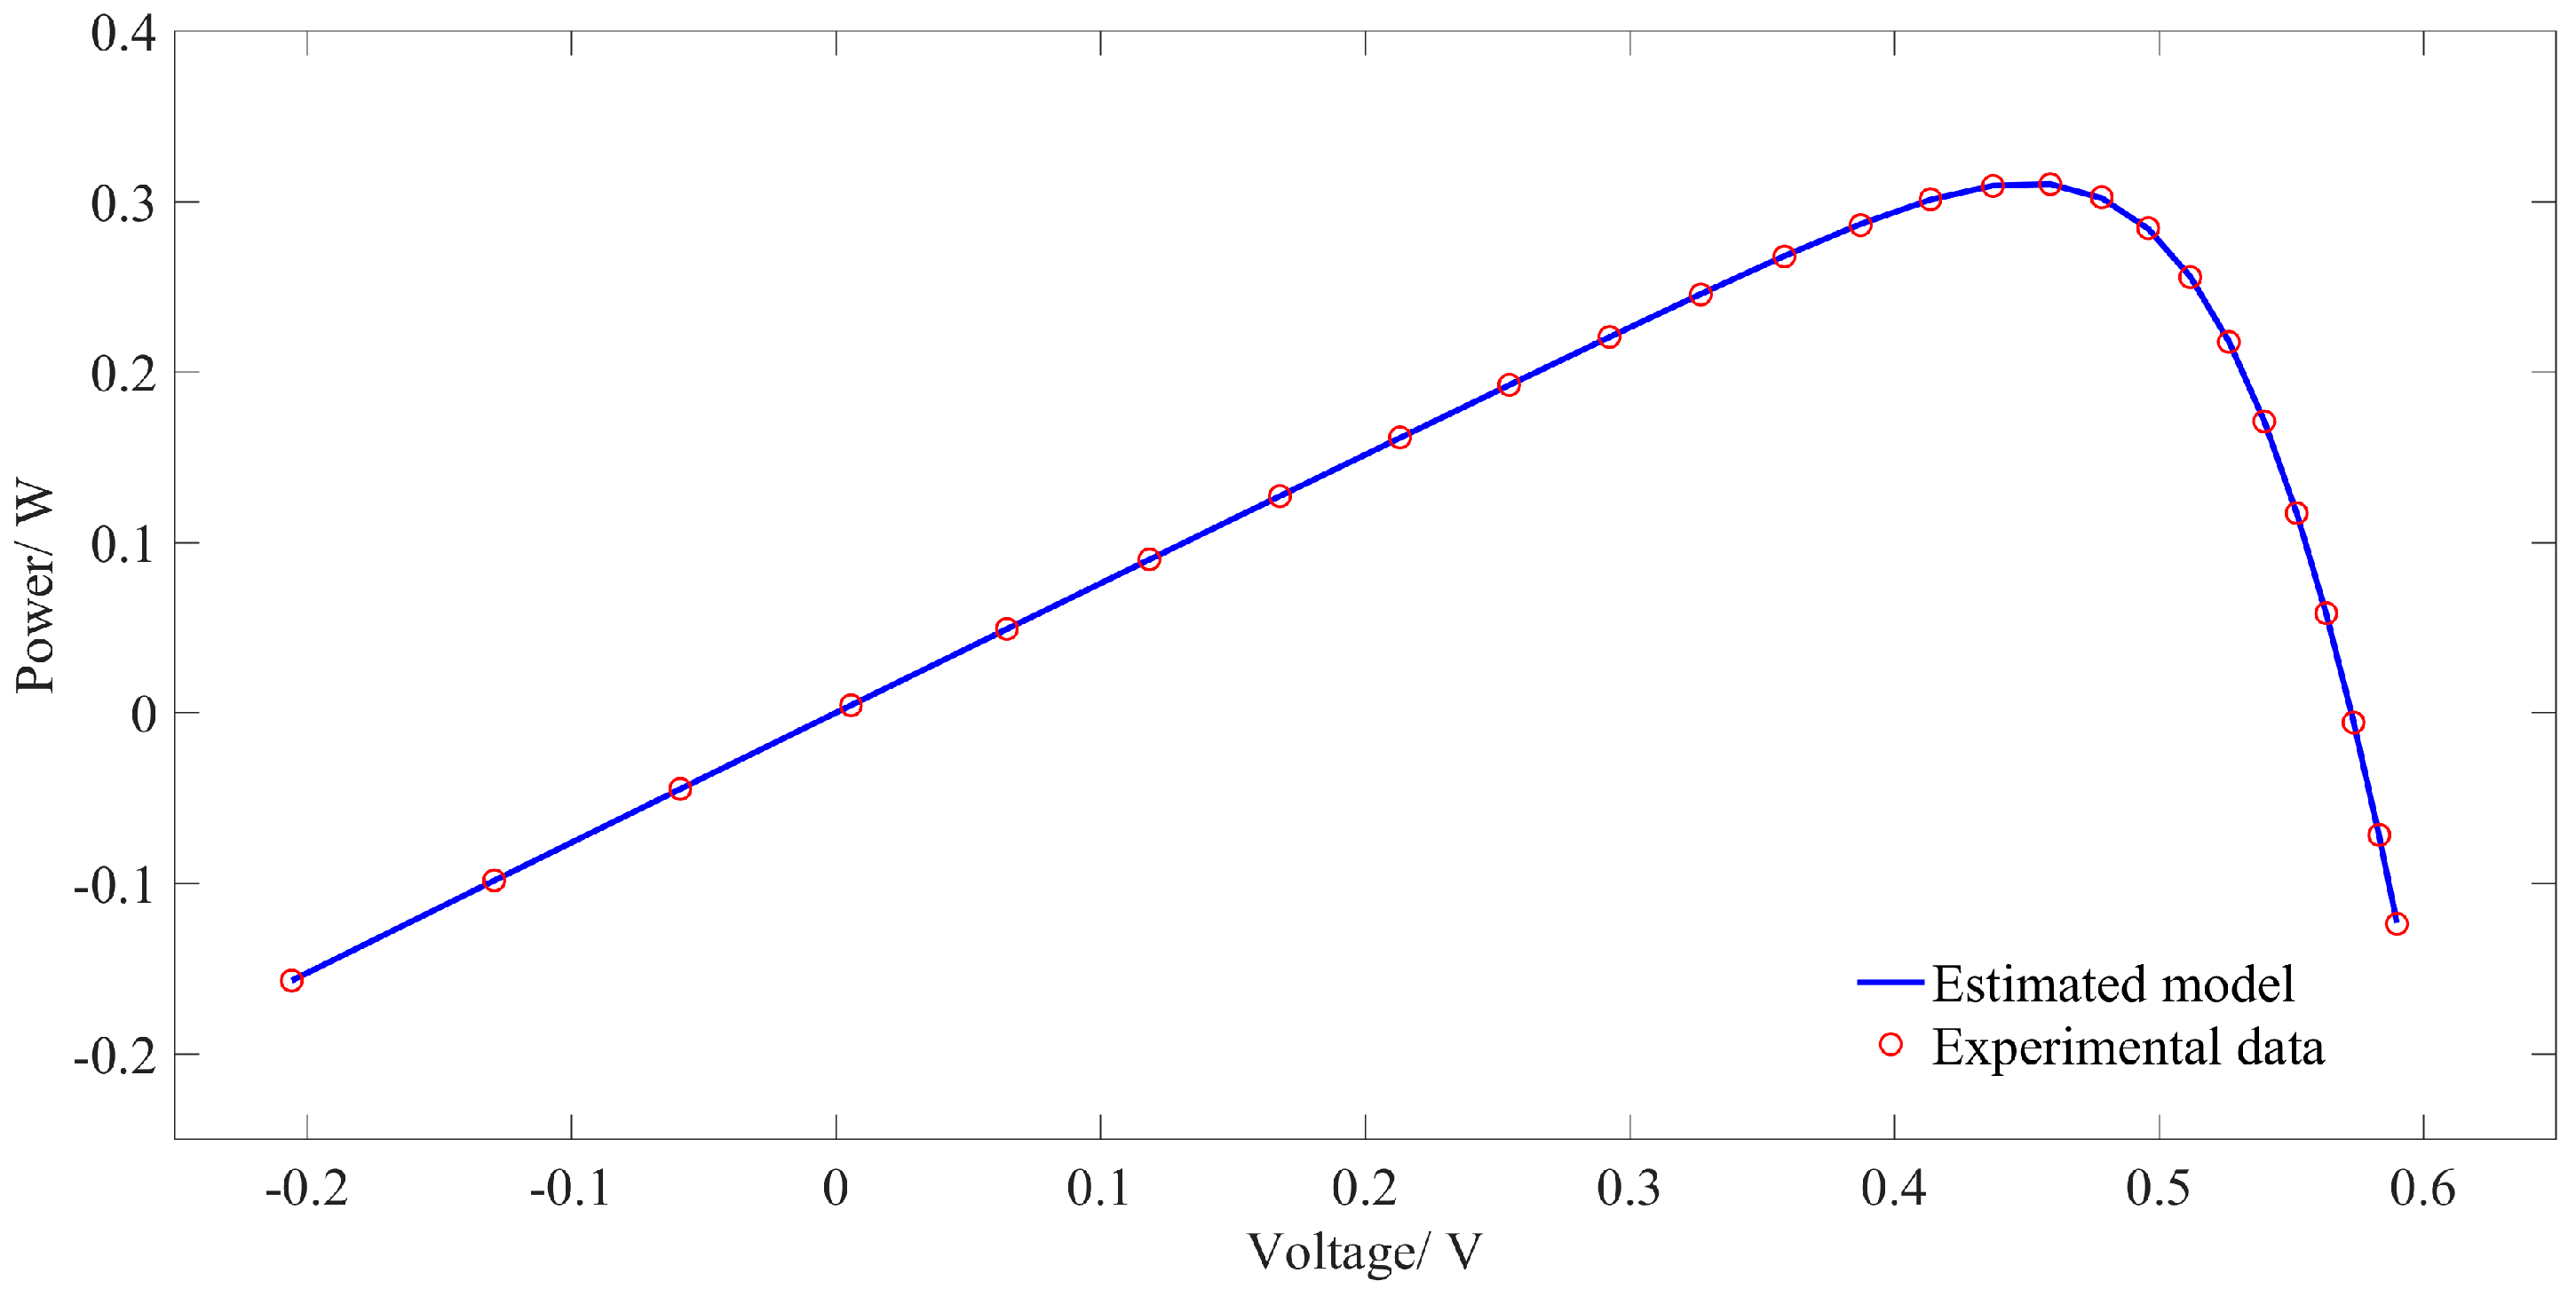
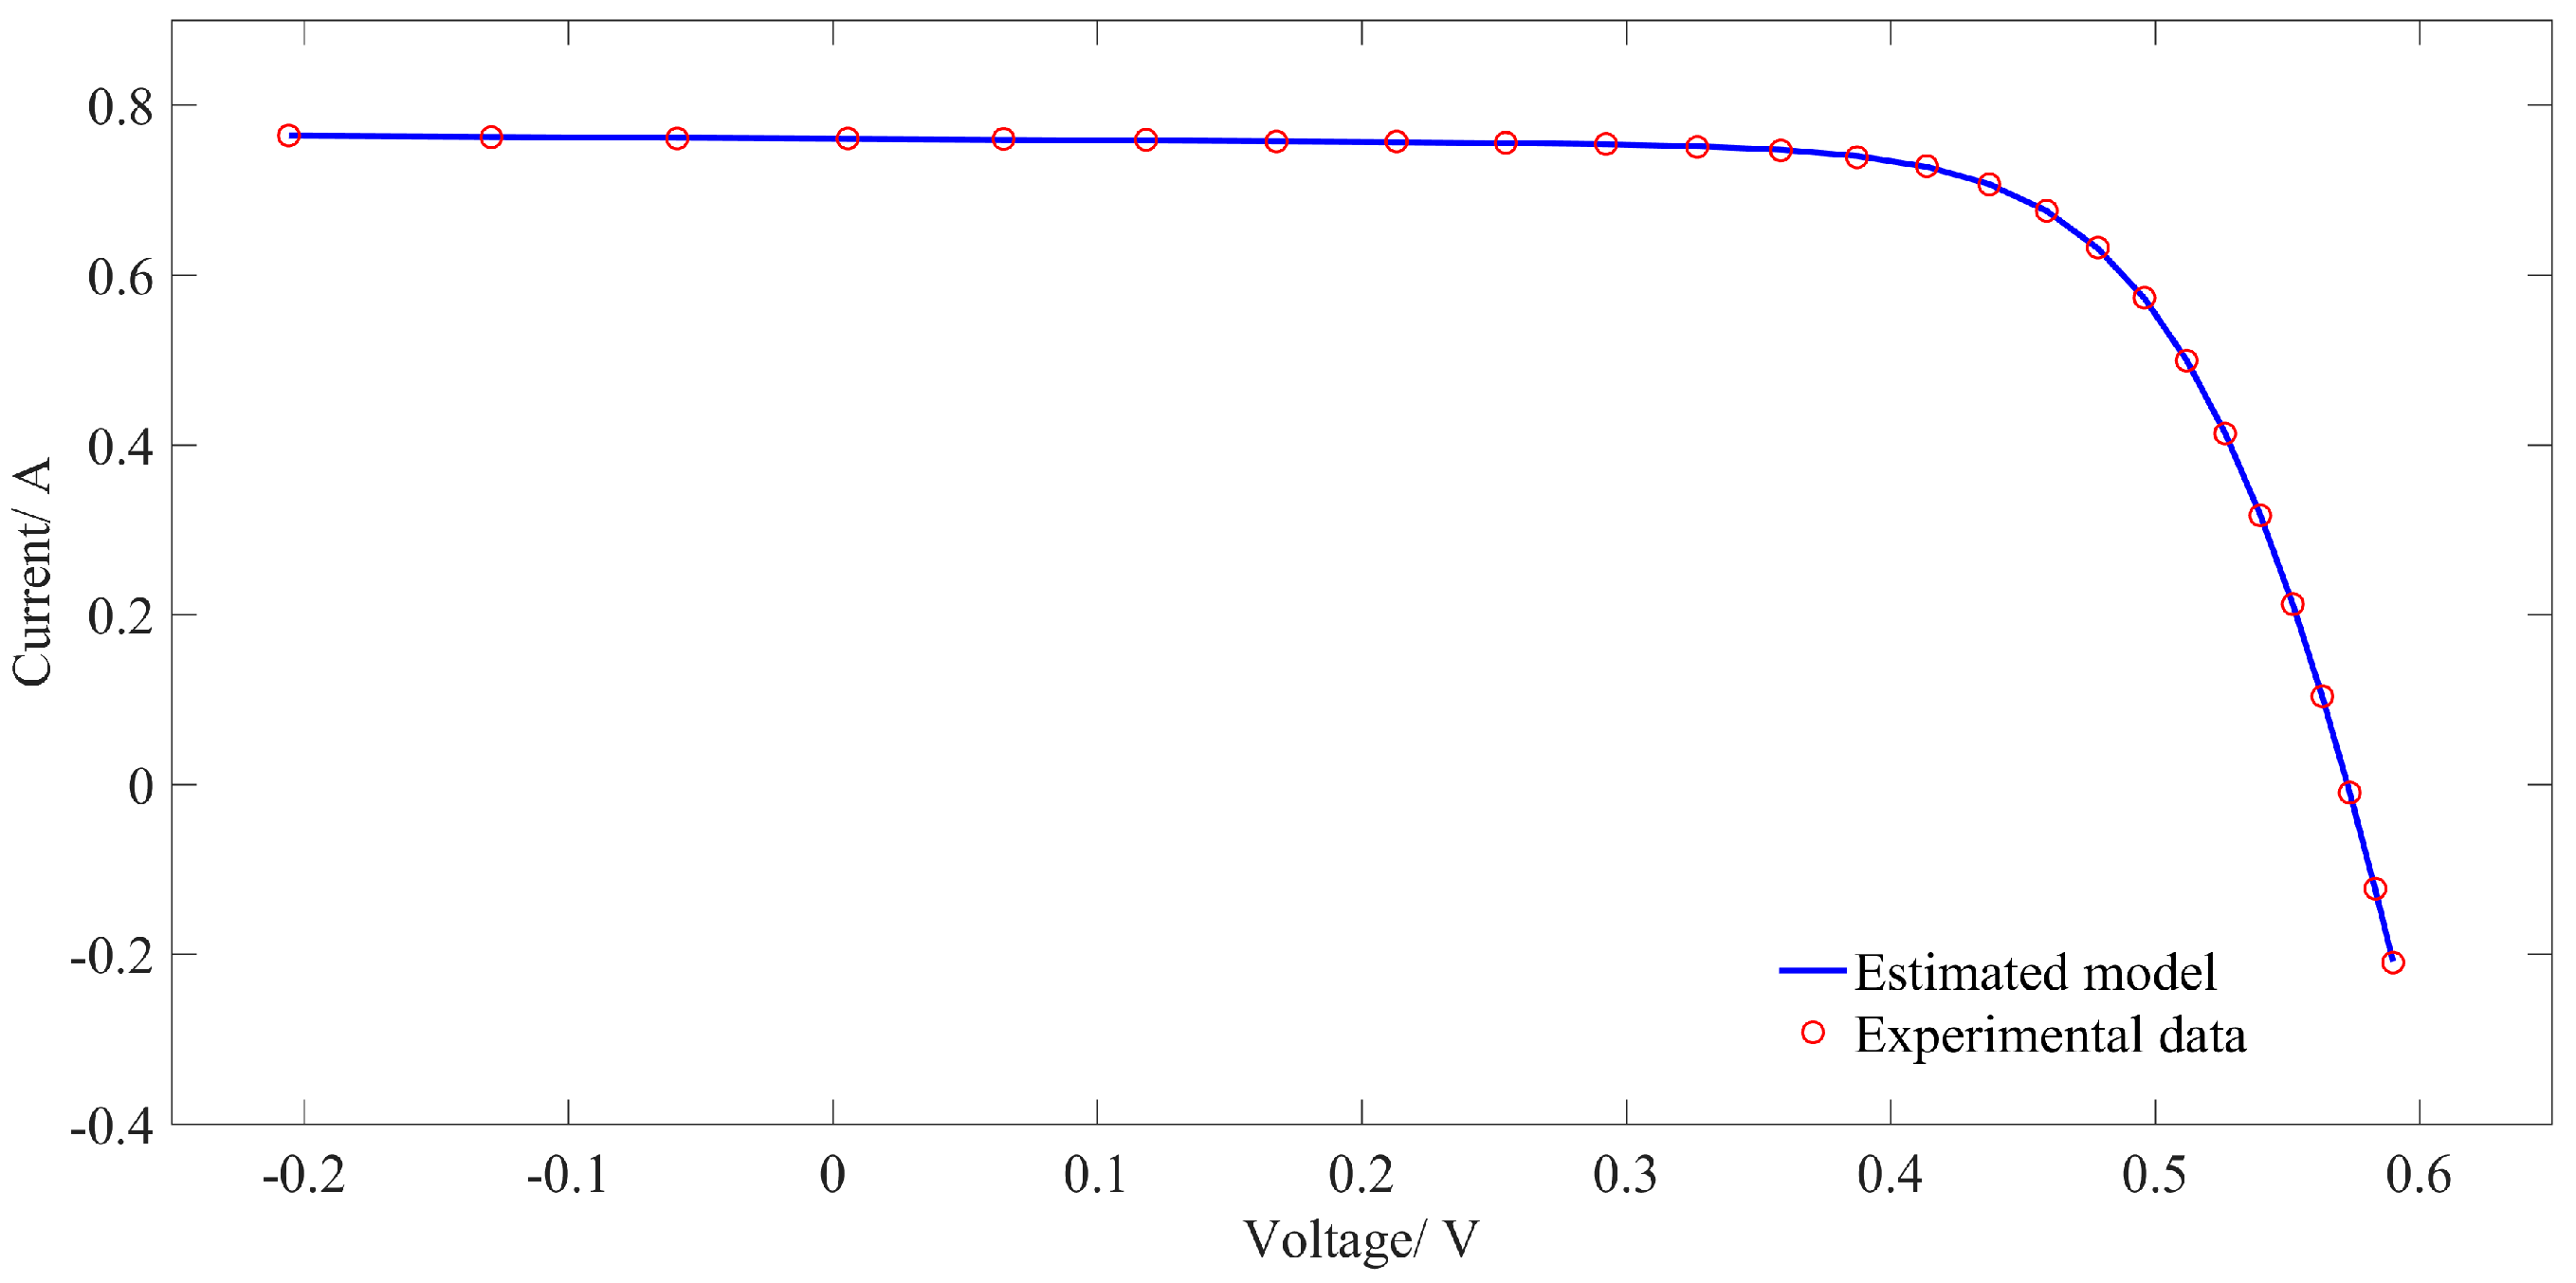
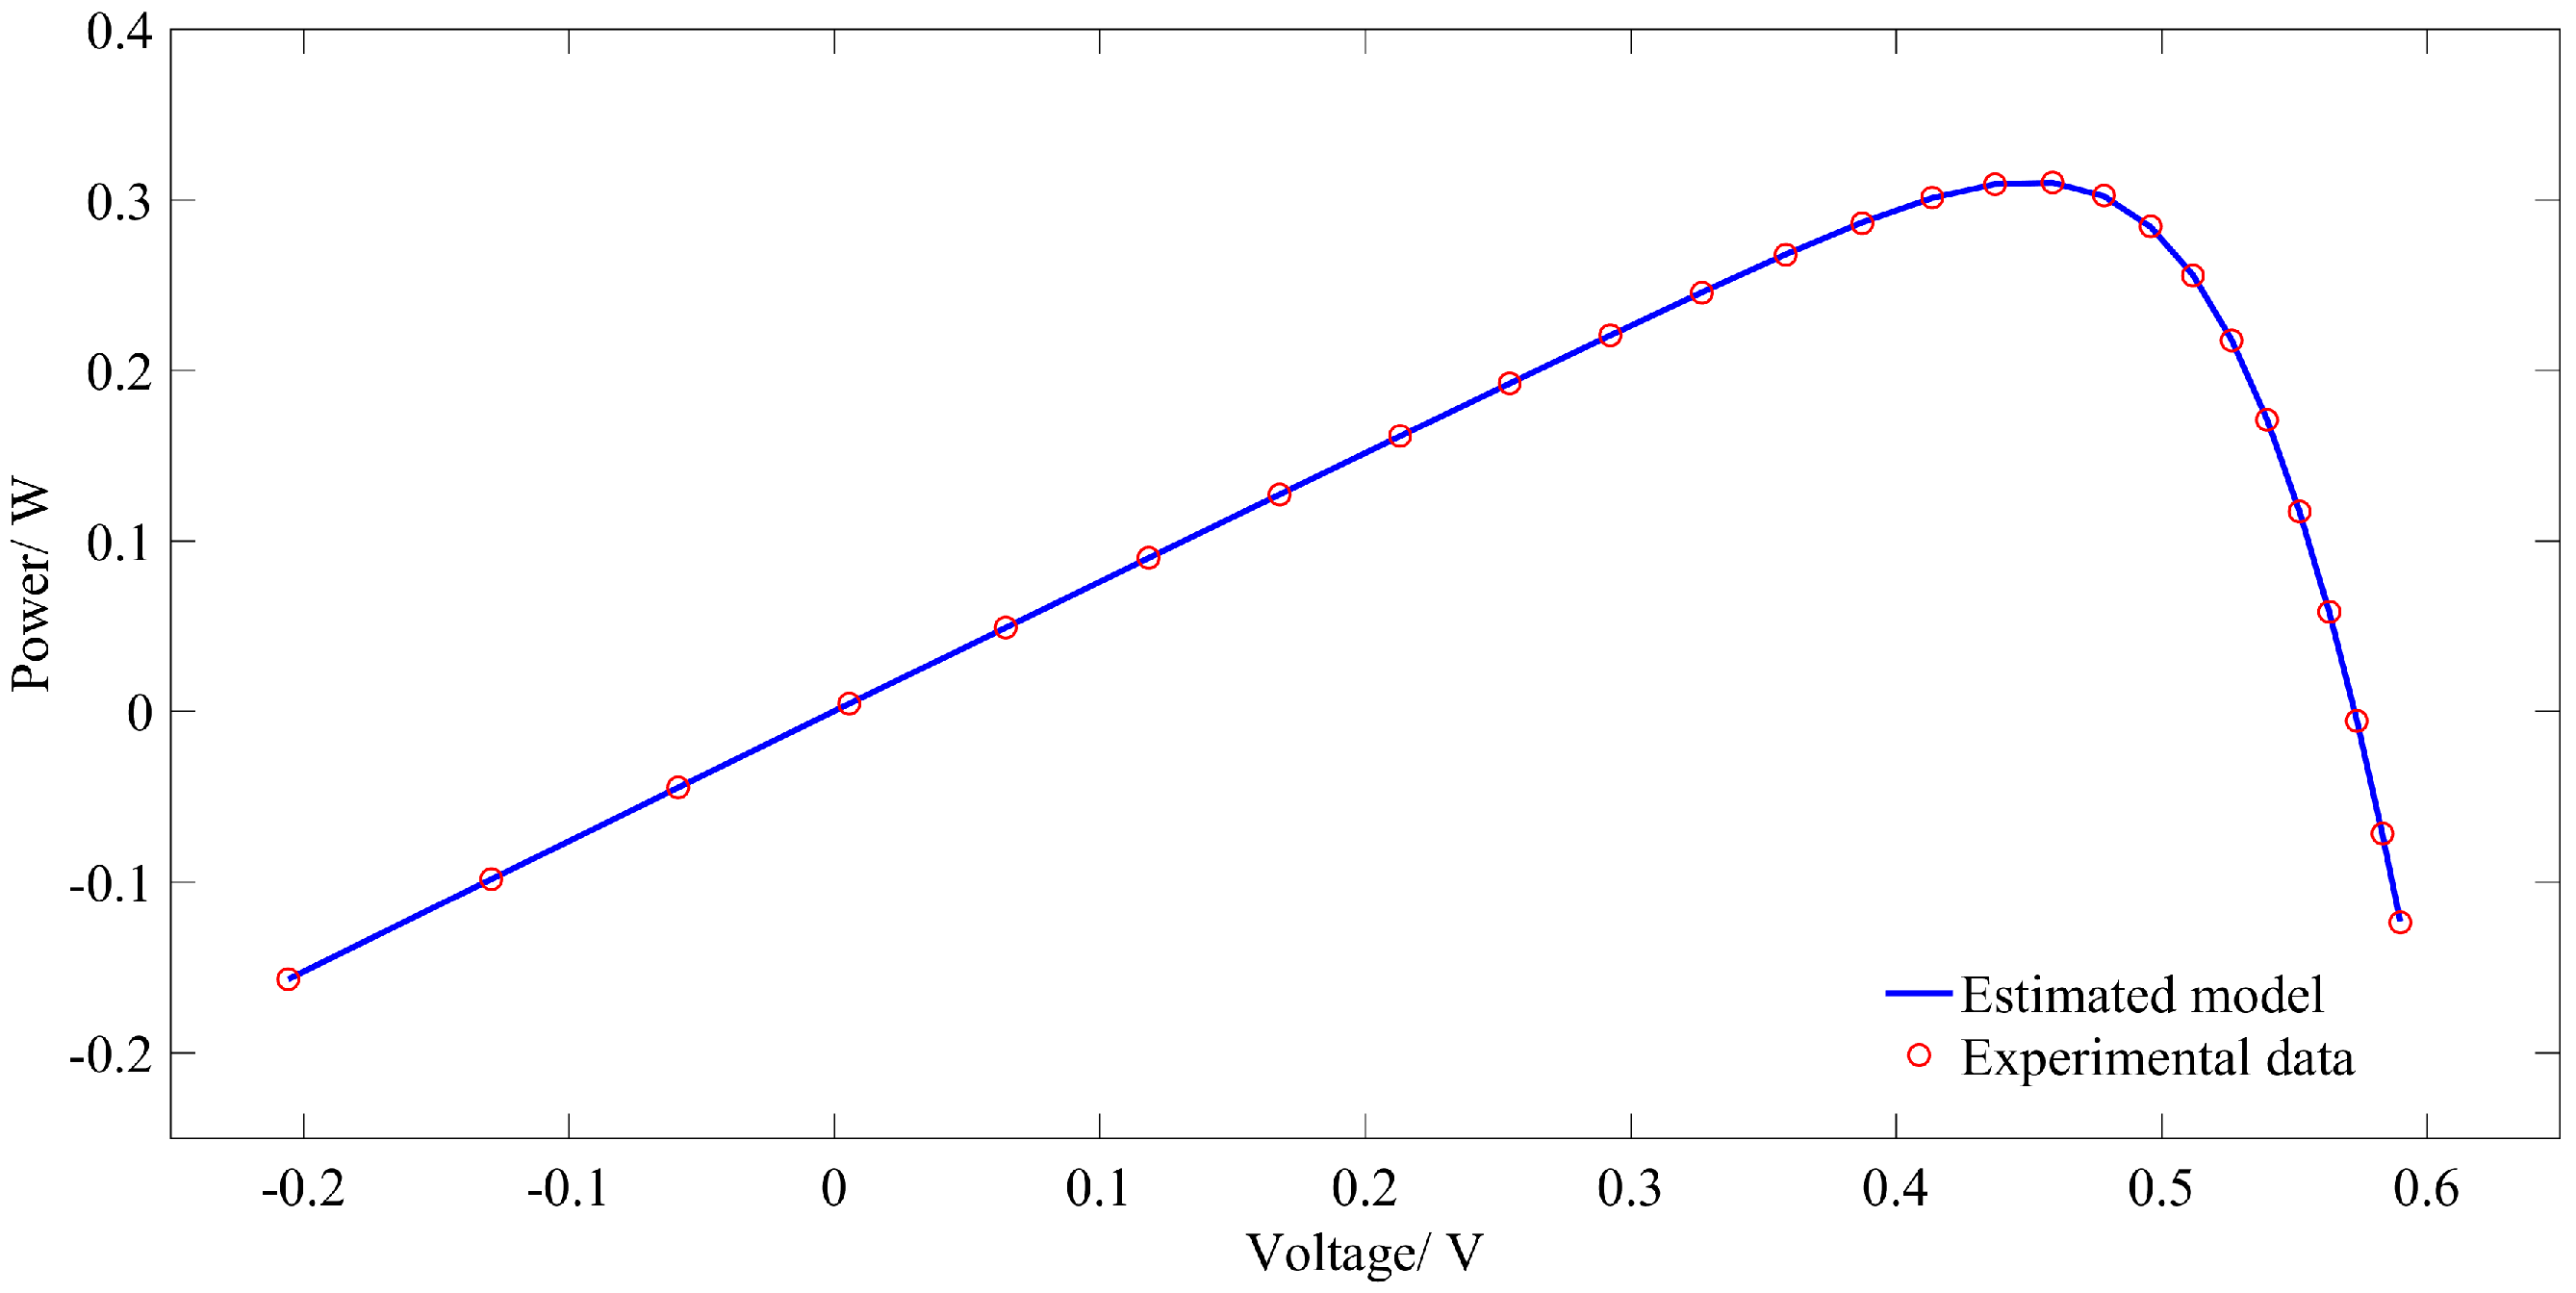
A further insight of how close the estimated values are with the experimental values has been given in Table 4, Figure 6 and Figure 7. Experimentally measured voltage, current and the error between measured current and estimated current, calculated by , have been tabulated in Table 4. Table 4 shows that very low error values portray high precision of the estimated parameters. Figure 6 plots experimentally measured I-V data points and I-V data obtained by estimated parameters. Figure 7 plots experimentally measured P-V (power-voltage) data points and P-V data obtained by estimated parameters. Figure 6 and Figure 7 clearly portray that the estimated data is in close agreement with the experimentally measured data.
The result for SDM using the HPSOSA is shown in Figure 8. The estimated SDM qualifies the test as the values are in the range of –1 and +1.
4.2 Results for Double Diode PV Model
For the double diode model of the PV cell, statistics of 20 runs are tabulated in Table 5. It is obvious from Table 5 that the HPSOSA presented better statistics when compared with CPSO. The HPSOSA attains a best RMSE value of 7.4532 × 10⁻⁴, which is far better than the best RMSE value attained by CPSO. The HPSOSA outperforms CPSO in all means of average, best, maximum, standard deviation and median. The HPSOSA achieved a good standard deviation of 5.8569 × 10⁻⁵ while CPSO achieved a standard deviation of 5.0461 × 10⁻⁴.
Table 6 lists the best values of parameters estimated by HPSOSA and other five optimization algorithms along with and . Table 6 is evident of the superiority of the HPSOSA compared with other algorithms. It is obvious that the HPSOSA achieved significantly low values of and , 7.453163 × 10⁻⁴ and 6.5556 × 10⁻⁴ respectively.
To further examine that how close the currents are calculated by the HPSOSA with the experimentally measured currents, Figure 9 and Figure 10 have been shown. Figure 9 plotted the I-V characteristics of the estimated model and the experimental data while Figure 10 plotted the P-V characteristics of the estimated model and the experimental data. It is clear from Figure 9 and Figure 10 that the current and power estimated by the HPSOSA closely trace the experimentally measured data.
Table 7 shows another measure of how close are the estimated model and the experimentally measured data by virtue of error between them. Experimentally measured voltage, current and the error between the experimental current and the calculated current have been listed in Table 7. The very low error is an indication of the accuracy of the HPSOSA.
The result for DDM using the HPSOSA has been shown in Figure 11. The estimated DDM qualifies the test as the values are in the range of –1 and +1.
5. Conclusions
This paper has presented a hybrid optimization approach using particle swarm optimization and simulated annealing for parameter estimation of photovoltaic solar cell single diode and double diode models. Experimentally measured data of a silicone solar cell (RTC France), measured at an irradiance of 1000 W/m2 and a temperature of 33 °C, were used to estimate the models. The approach significantly improves the problem of premature convergence. The applied approach is compared with different metaheuristic algorithms, namely CPSO, IABC, HS, SA and PS. The HPSOSA outperformed all the compared algorithms by all means of statistical analysis used in this paper, i.e., average, best, maximum, standard deviation and median. The HPSOSA achieved very low values of RMSE and MAE comparatively. The HPSOSA successfully passed the RACF test and the test values lie within the confidence interval.
Author Contributions
All authors have contributed equally to this paper. The manuscript is submitted with approval of all the authors.
Conflicts of Interest
The authors declare no conflict of interest.
References
- Galliano, S.; Bella, F.; Gerbaldi, C.; Falco, M.; Viscardi, G.; Grätzel, M.; Barolo, C. Photoanode/Electrolyte interface stability in aqueous dye-sensitized solar cells. Energy Technol. 2017, 5, 300–311. [Google Scholar] [CrossRef]
- Shanti, R.; Bella, F.; Salim, Y.S.; Chee, S.Y.; Ramesh, S.; Ramesh, K. Poly(methyl methacrylate-co-butyl acrylate-co-acrylic acid): Physico-chemical characterization and targeted dye sensitized solar cell application. Mater. Des. 2016, 108, 560–569. [Google Scholar] [CrossRef]
- Bella, A.F.; Pugliese, D.; Zolin, L.; Gerbaldi, C. Paper-based quasi-solid dye-sensitized solar cells. Electrochim. Acta 2017. [Google Scholar] [CrossRef]
- Pintossi, D.; Iannaccone, G.; Colombo, A.; Bella, F.; Välimäki, M.; Väisänen, K.L.; Hast, J.; Levi, M.; Gerbaldi, C.; Dragonetti, C.; et al. Luminescent downshifting by photo-induced sol-gel hybrid coatings: Accessing multifunctionality on flexible organic photovoltaics via ambient temperature material processing. Adv. Electron. Mater. 2016, 2. [Google Scholar] [CrossRef]
- Raj, S.; Kumar Sinha, A.; Panchal, A.K. Solar cell parameters estimation from illuminated I-V characteristic using linear slope equations and Newton-Raphson technique. J. Renew. Sustain. Energy 2013, 5, 255–265. [Google Scholar] [CrossRef]
- Ortiz-Conde, A.; García Sánchez, F.J.; Muci, J. New method to extract the model parameters of solar cells from the explicit analytic solutions of their illuminated I-V characteristics. Sol. Energy Mater. Sol. Cells 2006, 90, 352–361. [Google Scholar] [CrossRef]
- Ma, J. Optimization Approaches for Parameter Estimation and Maximum Power Point Tracking (MPPT) of Photovoltaic Systems. Ph.D. Thesis, University of Liverpool, Liverpool, UK, 2014. [Google Scholar]
- Ulaganathan, M.; Devaraj, D. Real coded genetic algorithm for optimal parameter estimation of solar photovoltaic model. In Proceedings of the International Conference on Emerging Trends in Engineering, Technology and Science (ICETETS), Pudukkottai, India, 24–26 February 2016. [Google Scholar]
- Ishaque, K.; Salam, Z.; Mekhilef, S.; Shamsudin, A. Parameter extraction of solar photovoltaic modules using penalty-based differential evolution. Appl. Energy 2012, 99, 297–308. [Google Scholar] [CrossRef]
- Ye, M.; Wang, X.; Xu, Y. Parameter extraction of solar cells using particle swarm optimization. J. Appl. Phys. 2009, 105, 094502. [Google Scholar] [CrossRef]
- Alrashidi, M.R.; Alhajri, M.F. Simulated annealing algorithm for photovoltaic parameters identification. Sol. Energy 2012, 86, 266–274. [Google Scholar]
- Askarzadeh, A.; Rezazadeh, A. Parameter identification for solar cell models using harmony search-based algorithms. Sol. Energy 2012, 86, 3241–3249. [Google Scholar] [CrossRef]
- Wang, R.; Zhan, Y.; Zhou, H. Application of artificial bee colony in model parameter identification of solar cells. Energies 2015, 8, 7563–7581. [Google Scholar] [CrossRef]
- Ma, J.; Ting, T.O.; Man, K.L.; Zhang, N.; Guan, S.; Wong, P.W.H. Parameter estimation of photovoltaic models via cuckoo search. J. Appl. Math. 2013, 2013, 10–12. [Google Scholar] [CrossRef]
- AlHajri, M.F.; El-Naggar, K.M.; AlRashidi, M.R.; Al-Othman, A.K. Optimal extraction of solar cell parameters using pattern search. Renew. Energy 2012, 44, 238–245. [Google Scholar] [CrossRef]
- Idoumghar, L.; Melkemi, M.; Schott, R.; Aouad, M.I. Hybrid PSO-SA type algorithms for multimodal function optimization and reducing energy consumption in embedded systems. Appl. Comput. Intell. Soft Comput. 2011, 2011, 138078. [Google Scholar] [CrossRef]
- Sadati, N.; Zamani, M.; Mahdavian, H.R.F. Hybrid particle swarm-based-simulated annealing optimization techniques. In Proceedings of the IECON 2006—32nd Annual Conference on IEEE Industrial Electronics, Paris, France, 6–10 November 2006. [Google Scholar]
- Junghans, L.; Darde, N. Hybrid single objective genetic algorithm coupled with the simulated annealing optimization method for building optimization. Energy Build. 2015, 86, 651–662. [Google Scholar] [CrossRef]
- Fang, S.; Zhang, X. A Hybrid Algorithm of Particle swarm optimization and tabu search for distribution network reconfiguration. Math. Probl. Eng. 2016, 2016, 16–20. [Google Scholar] [CrossRef]
- Carapellucci, R.; Giordano, L. Modeling and optimization of an energy generation island based on renewable technologies and hydrogen storage systems. Int. J. Hydrogen Energy 2012, 37, 2081–2093. [Google Scholar] [CrossRef]
- Wolf, M.; Noel, G.T.; Stirn, R.J. Investigation of the double exponential in the current and Voltage characteristics of silicon solar cells. IEEE Trans. Electron Devices 1977, 24, 419–428. [Google Scholar] [CrossRef]
- Jordehi, A.R. Time varying acceleration coefficients particle swarm optimisation (TVACPSO): A new optimisation algorithm for estimating parameters of PV cells and modules. Energy Convers. Manag. 2016, 129, 262–274. [Google Scholar] [CrossRef]
- Kirkpatrick, S.; Gellat, C.D.; Vecchi, M.P. Optimization by Simulated Annealing. Science 1983, 220, 671–680. [Google Scholar] [CrossRef] [PubMed]
- Easwarakhanthan, T.; Bottin, J.; Bouhouch, I.; Boutrit, C. Nonlinear minimization algorithm for determining the solar cell parameters with microcomputers. Int. J. Sol. Energy 1986, 4, 1–12. [Google Scholar] [CrossRef]
- Shi, Y.; Eberhart, R. A modified particle swarm optimizer. In Proceedings of the IEEE International Conference on Evolutionary Computation, Anchorage, AK, USA, 4–9 May 1998. [Google Scholar]
Figure 1.
Single diode photovoltaic circuit model.

Figure 2.
Double diode photovoltaic circuit model.

Figure 3.
Flowchart of the HPSOSA.

Figure 4.
Comparison of the HPSOSA and the CPSO for 20 runs.

Figure 5.
Convergence of HPSOSA for parameter estimation of single diode PV cell circuit.

Figure 6.
Comparison of estimated model and experimental data I-V characteristics of single diode model by the HPSOSA.
Figure 6.
Comparison of estimated model and experimental data I-V characteristics of single diode model by the HPSOSA.

Figure 7.
Comparison of estimated model and experimental data PV characteristics of single diode model by HPSOSA.
Figure 7.
Comparison of estimated model and experimental data PV characteristics of single diode model by HPSOSA.

Figure 8.
RACF result for SDM.

Figure 9.
Comparison of estimated model and experimental data I-V characteristics of double diode model by HPSOSA.
Figure 9.
Comparison of estimated model and experimental data I-V characteristics of double diode model by HPSOSA.

Figure 10.
Comparison of estimated model and experimental data P-V characteristics of double diode model by HPSOSA.
Figure 10.
Comparison of estimated model and experimental data P-V characteristics of double diode model by HPSOSA.

Figure 11.
RACF results for DDM.


Table 1.
Parameter bounds for single diode and double diode PV cell circuit.
| Parameter | Single Diode Model | Double Diode Model |
|---|---|---|
| Rs/Ω | [0, 0.5] | [0, 0.5] |
| Rsh/Ω | [0, 100] | [0, 100] |
| Iph/A | [0, 1] | [0, 1] |
| I01/A | [10−12, 10−6] | [10−12, 10−6] |
| n1 | [1, 2] | [1, 2] |
| I02/A | - | [10−12, 10−6] |
| n2 | - | [1, 2] |
Table 2.
Statistics of objective values (RMSE) for single diode PV model using HPSOSA.
| Objective Value | HPSOSA | CPSO |
|---|---|---|
| Average | 7.7301 × 10⁻⁴ | 1.4991 × 10⁻³ |
| Best | 7.7301 × 10⁻⁴ | 8.3400 × 10⁻⁴ |
| Worst | 7.7301 × 10⁻⁴ | 2.4436 × 10⁻³ |
| Standard deviation | 4.0768 × 10⁻¹⁷ | 4.3154 × 10⁻⁴ |
| Median | 7.7301 × 10⁻⁴ | 1.5240 × 10⁻³ |
Table 3.
Estimated parameters of single diode PV model obtained by HPSOSA and other five algorithms with RMSE and MAE values.
Table 3.
Estimated parameters of single diode PV model obtained by HPSOSA and other five algorithms with RMSE and MAE values.
| Parameter | HPSOSA | CPSO | HS [12] | IABC [13] | SA [9] | PS [15] |
|---|---|---|---|---|---|---|
| Rs | 0.0365 | 0.0357 | 0.0366 | 0.0363 | 0.0345 | 0.0313 |
| Rsh | 52.8898 | 57.6914 | 53.5946 | 54.4610 | 43.1034 | 64.1026 |
| Iph | 0.7608 | 0.7606 | 0.7607 | 0.7599 | 0.7620 | 0.7617 |
| I0 | 0.3107 | 0.3758 | 0.3050 | 0.3324 | 0.4798 | 0.9980 |
| n | 1.4753 | 1.4946 | 1.4754 | 1.4842 | 1.5172 | 1.6 |
| 7.7301 | 8.3400 | 9.9510 | 10.000 | 190.00 | 149.36 | |
| 6.7818 | 7.1058 | 28.514 | 27.848 | 51.106 | 42.146 |
Table 4.
Error respective to each measurement for single diode PV model.
| No. | Error () | No. | Error () | ||||
|---|---|---|---|---|---|---|---|
| 1 | −0.2057 | 0.7640 | −0.0001 | 14 | 0.4137 | 0.7280 | 0.0006 |
| 2 | −0.1291 | 0.7620 | −0.0007 | 15 | 0.4373 | 0.7065 | −0.0005 |
| 3 | −0.0588 | 0.7605 | −0.0009 | 16 | 0.4590 | 0.6755 | 0.0001 |
| 3 | 0.0057 | 0.7605 | 0.0003 | 17 | 0.4784 | 0.6320 | 0.0010 |
| 5 | 0.0646 | 0.7600 | 0.0010 | 18 | 0.4960 | 0.5730 | 0.0008 |
| 6 | 0.1185 | 0.7590 | 0.0010 | 19 | 0.5119 | 0.4990 | −0.0005 |
| 7 | 0.1678 | 0.7570 | −0.0000 | 20 | 0.5265 | 0.4130 | −0.0005 |
| 8 | 0.2132 | 0.7570 | 0.0009 | 21 | 0.5398 | 0.3165 | −0.0007 |
| 9 | 0.2545 | 0.7555 | 0.0005 | 22 | 0.5521 | 0.2120 | −0.0000 |
| 10 | 0.2924 | 0.7540 | 0.0004 | 23 | 0.5633 | 0.1035 | 0.0009 |
| 11 | 04.3269 | 0.7505 | −0.0008 | 24 | 0.5736 | −0.0100 | −0.0007 |
| 12 | 0.3585 | 0.7465 | −0.0008 | 25 | 0.5833 | −0.1230 | 0.0014 |
| 13 | 0.3873 | 0.7385 | −0.0016 | 26 | 0.5900 | −0.21 | −0.0009 |
Table 5.
Statistics of objective values (RMSE) for double diode PV model using HPSOSA.
| Objective Value | HPSOSA | CPSO |
|---|---|---|
| Average | 7.7583 × 10⁻⁴ | 2.1069 × 10⁻³ |
| Best | 7.4532 × 10⁻⁴ | 1.3057 × 10⁻³ |
| Worst | 9.6169 × 10⁻⁴ | 2.9591 × 10⁻³ |
| Std | 5.8569 × 10⁻⁵ | 5.0461 × 10⁻⁴ |
| Median | 7.5511 × 10⁻⁴ | 2.1283 × 10⁻³ |
Table 6.
Estimated parameters of single diode PV model obtained by HPSOSA and other five algorithms with RMSE and MAE values.
Table 6.
Estimated parameters of single diode PV model obtained by HPSOSA and other five algorithms with RMSE and MAE values.
| Parameter | HPSOSA | CPSO | HS [12] | IABC [13] | SA [11] | PS [15] |
|---|---|---|---|---|---|---|
| Rs | 0.037408 | 0.035601 | 0.03545 | 0.0364 | 0.0345 | 0.0320 |
| Rsh | 55.539281 | 45.547533 | 46.82696 | 55.2307 | 43.1034 | 81.3008 |
| Iph | 0.760805 | 0.762321 | 0.76176 | 0.7609 | 0.7623 | 0.7602 |
| I01 | 0.111986 | 0.297108 | 0.12545 | 0.26900 | 0.4767 | 0.9889 |
| n1 | 1.395932 | 1.476035 | 1.49439 | 1.4670 | 1.5172 | 1.6000 |
| I02 | 0.855939 | 0.710454 | 0.25470 | 0.28189 | 0.0100 | 0.0001 |
| n2 | 1.820143 | 1.998103 | 1.49989 | 1.8722 | 2.000 | 1.1920 |
| 7.453163 | 13.05652 | 12.60 | 10.00 | 16.64 | 15.18 | |
| 6.5556 | 10.3900 | 29.1820 | 134.3200 | 42.2640 | 43.1430 |
Table 7.
Relative error respective to each measurement for single diode PV model.
| No. | Error () | No. | Error () | ||||
|---|---|---|---|---|---|---|---|
| 1 | −0.2057 | 0.7640 | 0.0000 | 14 | 0.4137 | 0.7280 | 0.0008 |
| 2 | −0.1291 | 0.7620 | −0.0006 | 15 | 0.4373 | 0.7065 | −0.0004 |
| 3 | −0.0588 | 0.7605 | −0.0009 | 16 | 0.4590 | 0.6755 | 0.0002 |
| 3 | 0.0057 | 0.7605 | 0.0003 | 17 | 0.4784 | 0.6320 | 0.0009 |
| 5 | 0.0646 | 0.7600 | 0.0009 | 18 | 0.4960 | 0.5730 | 0.0007 |
| 6 | 0.1185 | 0.7590 | 0.0009 | 19 | 0.5119 | 0.4990 | −0.0007 |
| 7 | 0.1678 | 0.7570 | −0.0002 | 20 | 0.5265 | 0.4130 | −0.0006 |
| 8 | 0.2132 | 0.7570 | 0.0008 | 21 | 0.5398 | 0.3165 | −0.0007 |
| 9 | 0.2545 | 0.7555 | 0.0003 | 22 | 0.5521 | 0.2120 | 0.0001 |
| 10 | 0.2924 | 0.7540 | 0.0003 | 23 | 0.5633 | 0.1035 | 0.0010 |
| 11 | 0.3269 | 0.7505 | −0.0008 | 24 | 0.5736 | −0.0100 | −0.0006 |
| 12 | 0.3585 | 0.7465 | −0.0007 | 25 | 0.5833 | −0.1230 | 0.0014 |
| 13 | 0.3873 | 0.7385 | −0.0014 | 26 | 0.5900 | −0.21 | −0.0011 |
© 2017 by the authors. Licensee MDPI, Basel, Switzerland. This article is an open access article distributed under the terms and conditions of the Creative Commons Attribution (CC BY) license (http://creativecommons.org/licenses/by/4.0/).
Share and Cite
MDPI and ACS Style
Mughal, M.A.; Ma, Q.; Xiao, C. Photovoltaic Cell Parameter Estimation Using Hybrid Particle Swarm Optimization and Simulated Annealing. Energies 2017, 10, 1213. https://doi.org/10.3390/en10081213
AMA Style
Mughal MA, Ma Q, Xiao C. Photovoltaic Cell Parameter Estimation Using Hybrid Particle Swarm Optimization and Simulated Annealing. Energies. 2017; 10(8):1213. https://doi.org/10.3390/en10081213
Chicago/Turabian StyleMughal, Muhammad Ali, Qishuang Ma, and Chunyan Xiao. 2017. "Photovoltaic Cell Parameter Estimation Using Hybrid Particle Swarm Optimization and Simulated Annealing" Energies 10, no. 8: 1213. https://doi.org/10.3390/en10081213
Note that from the first issue of 2016, this journal uses article numbers instead of page numbers. See further details here.