

Browsing Damage on Scots Pine: Direct and Indirect Effects of Landscape Characteristics, Moose and Deer Populations

 , ,
, ,
Abstract
:1. Introduction
1.1. Swedish Forest and Ungulate Management
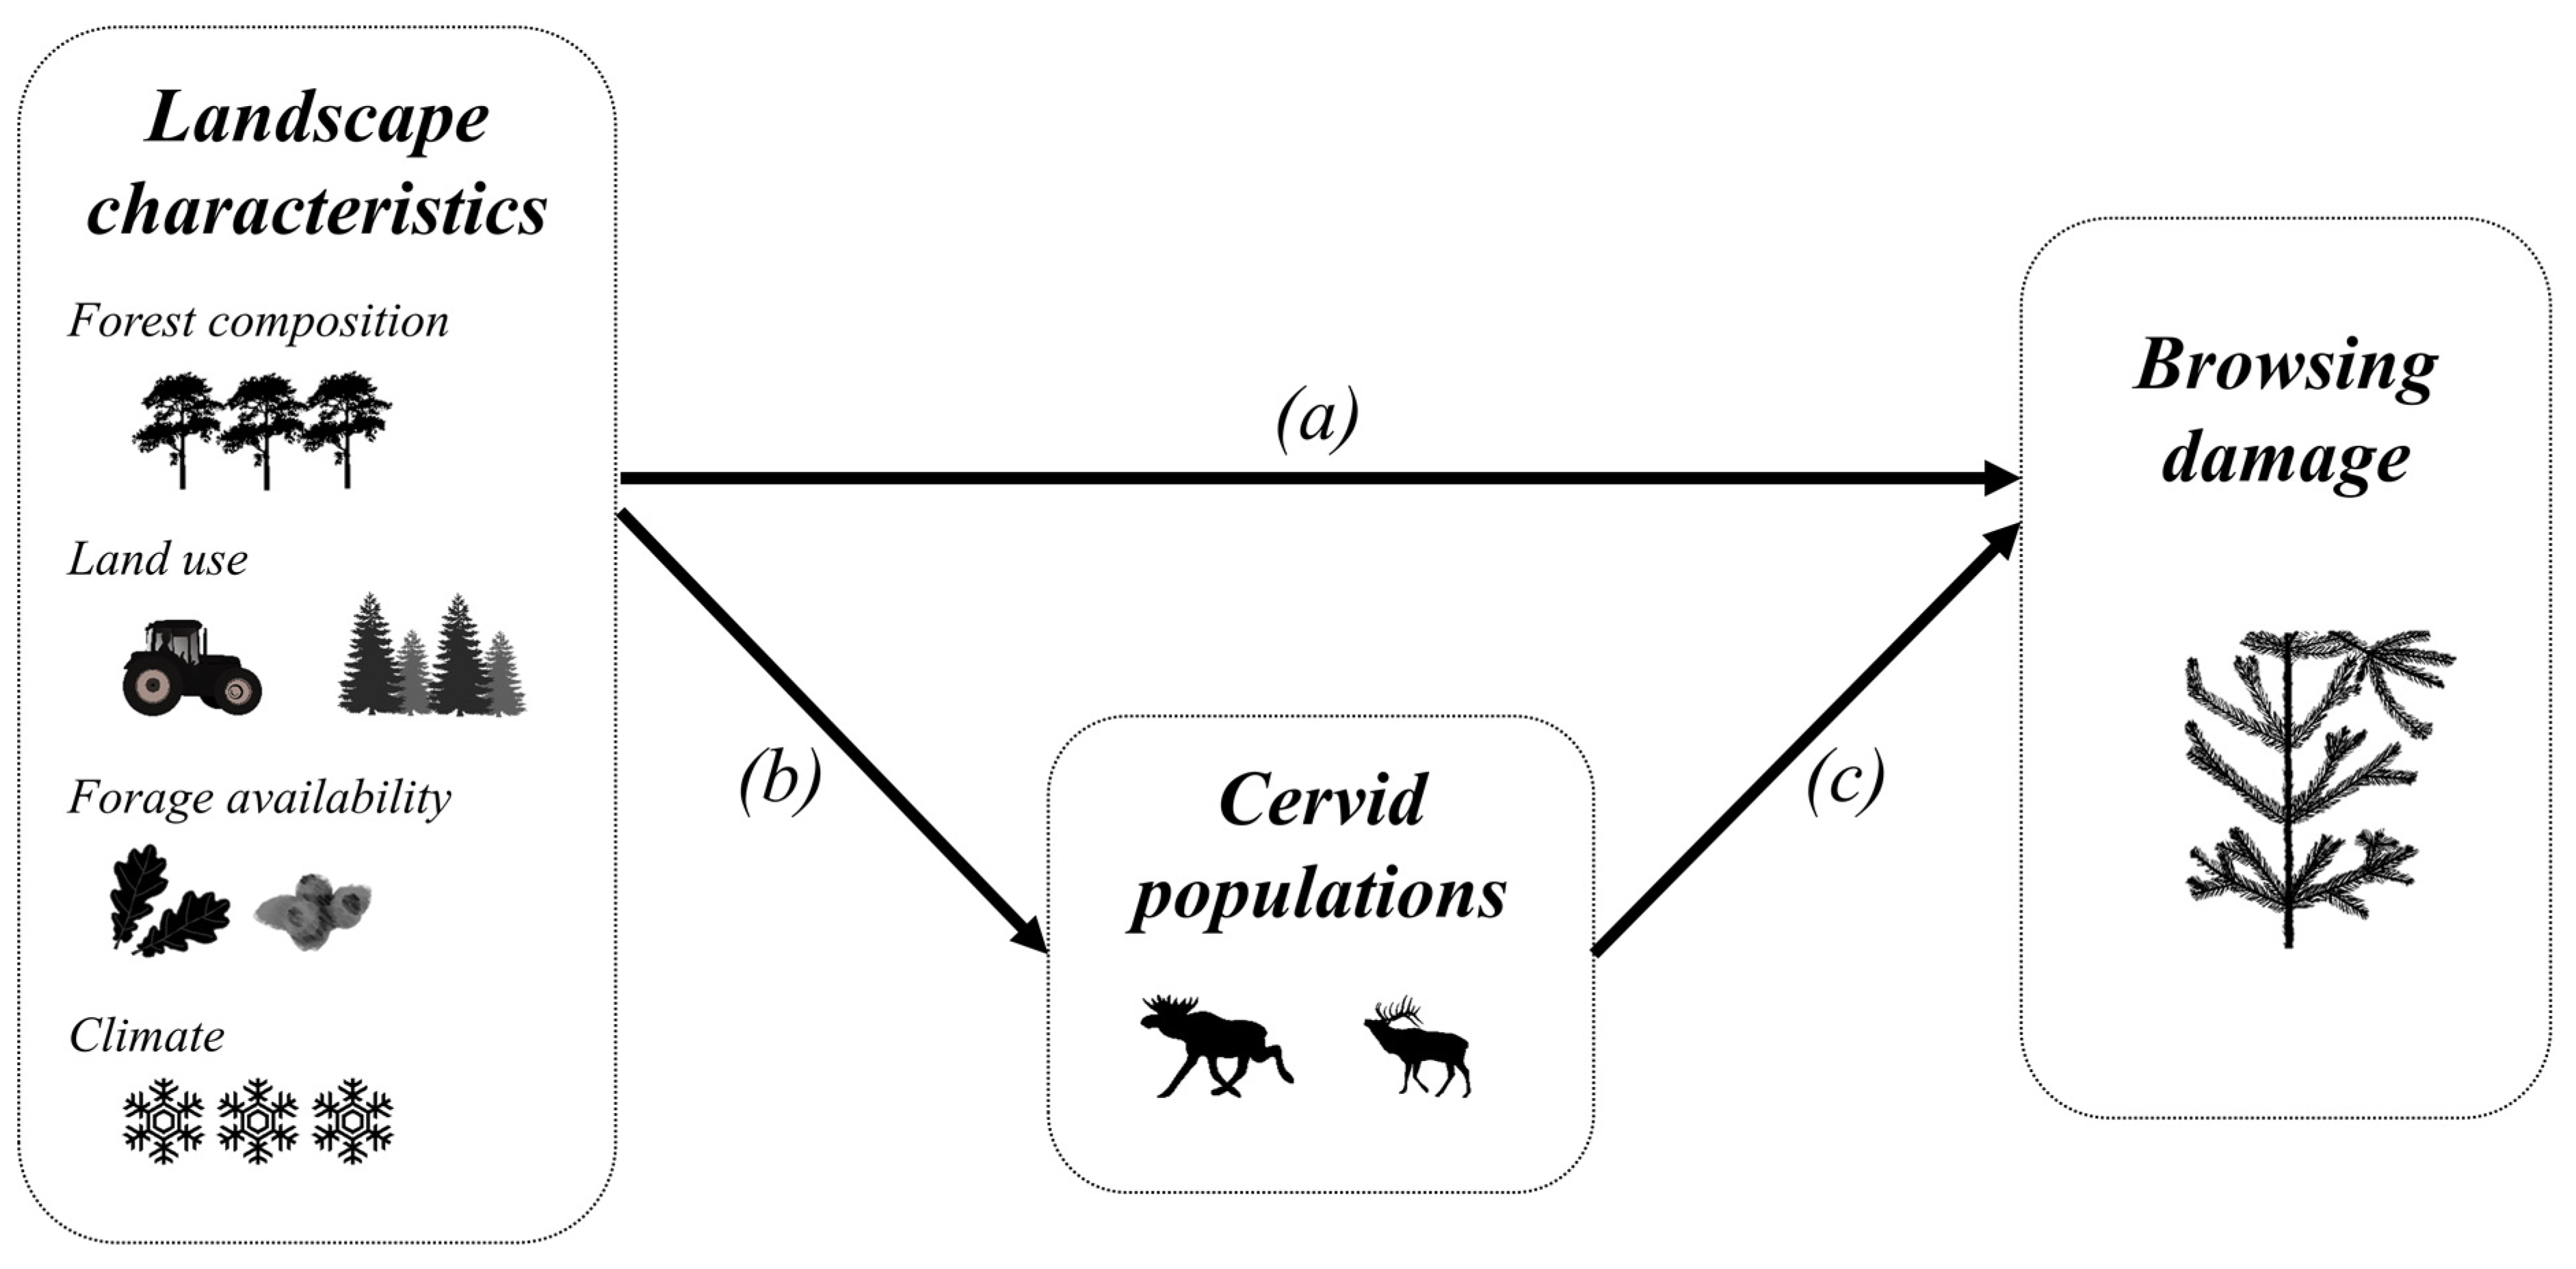
1.2. Drivers of Browsing Damage—Theoretical Framework
2. Materials and Methods
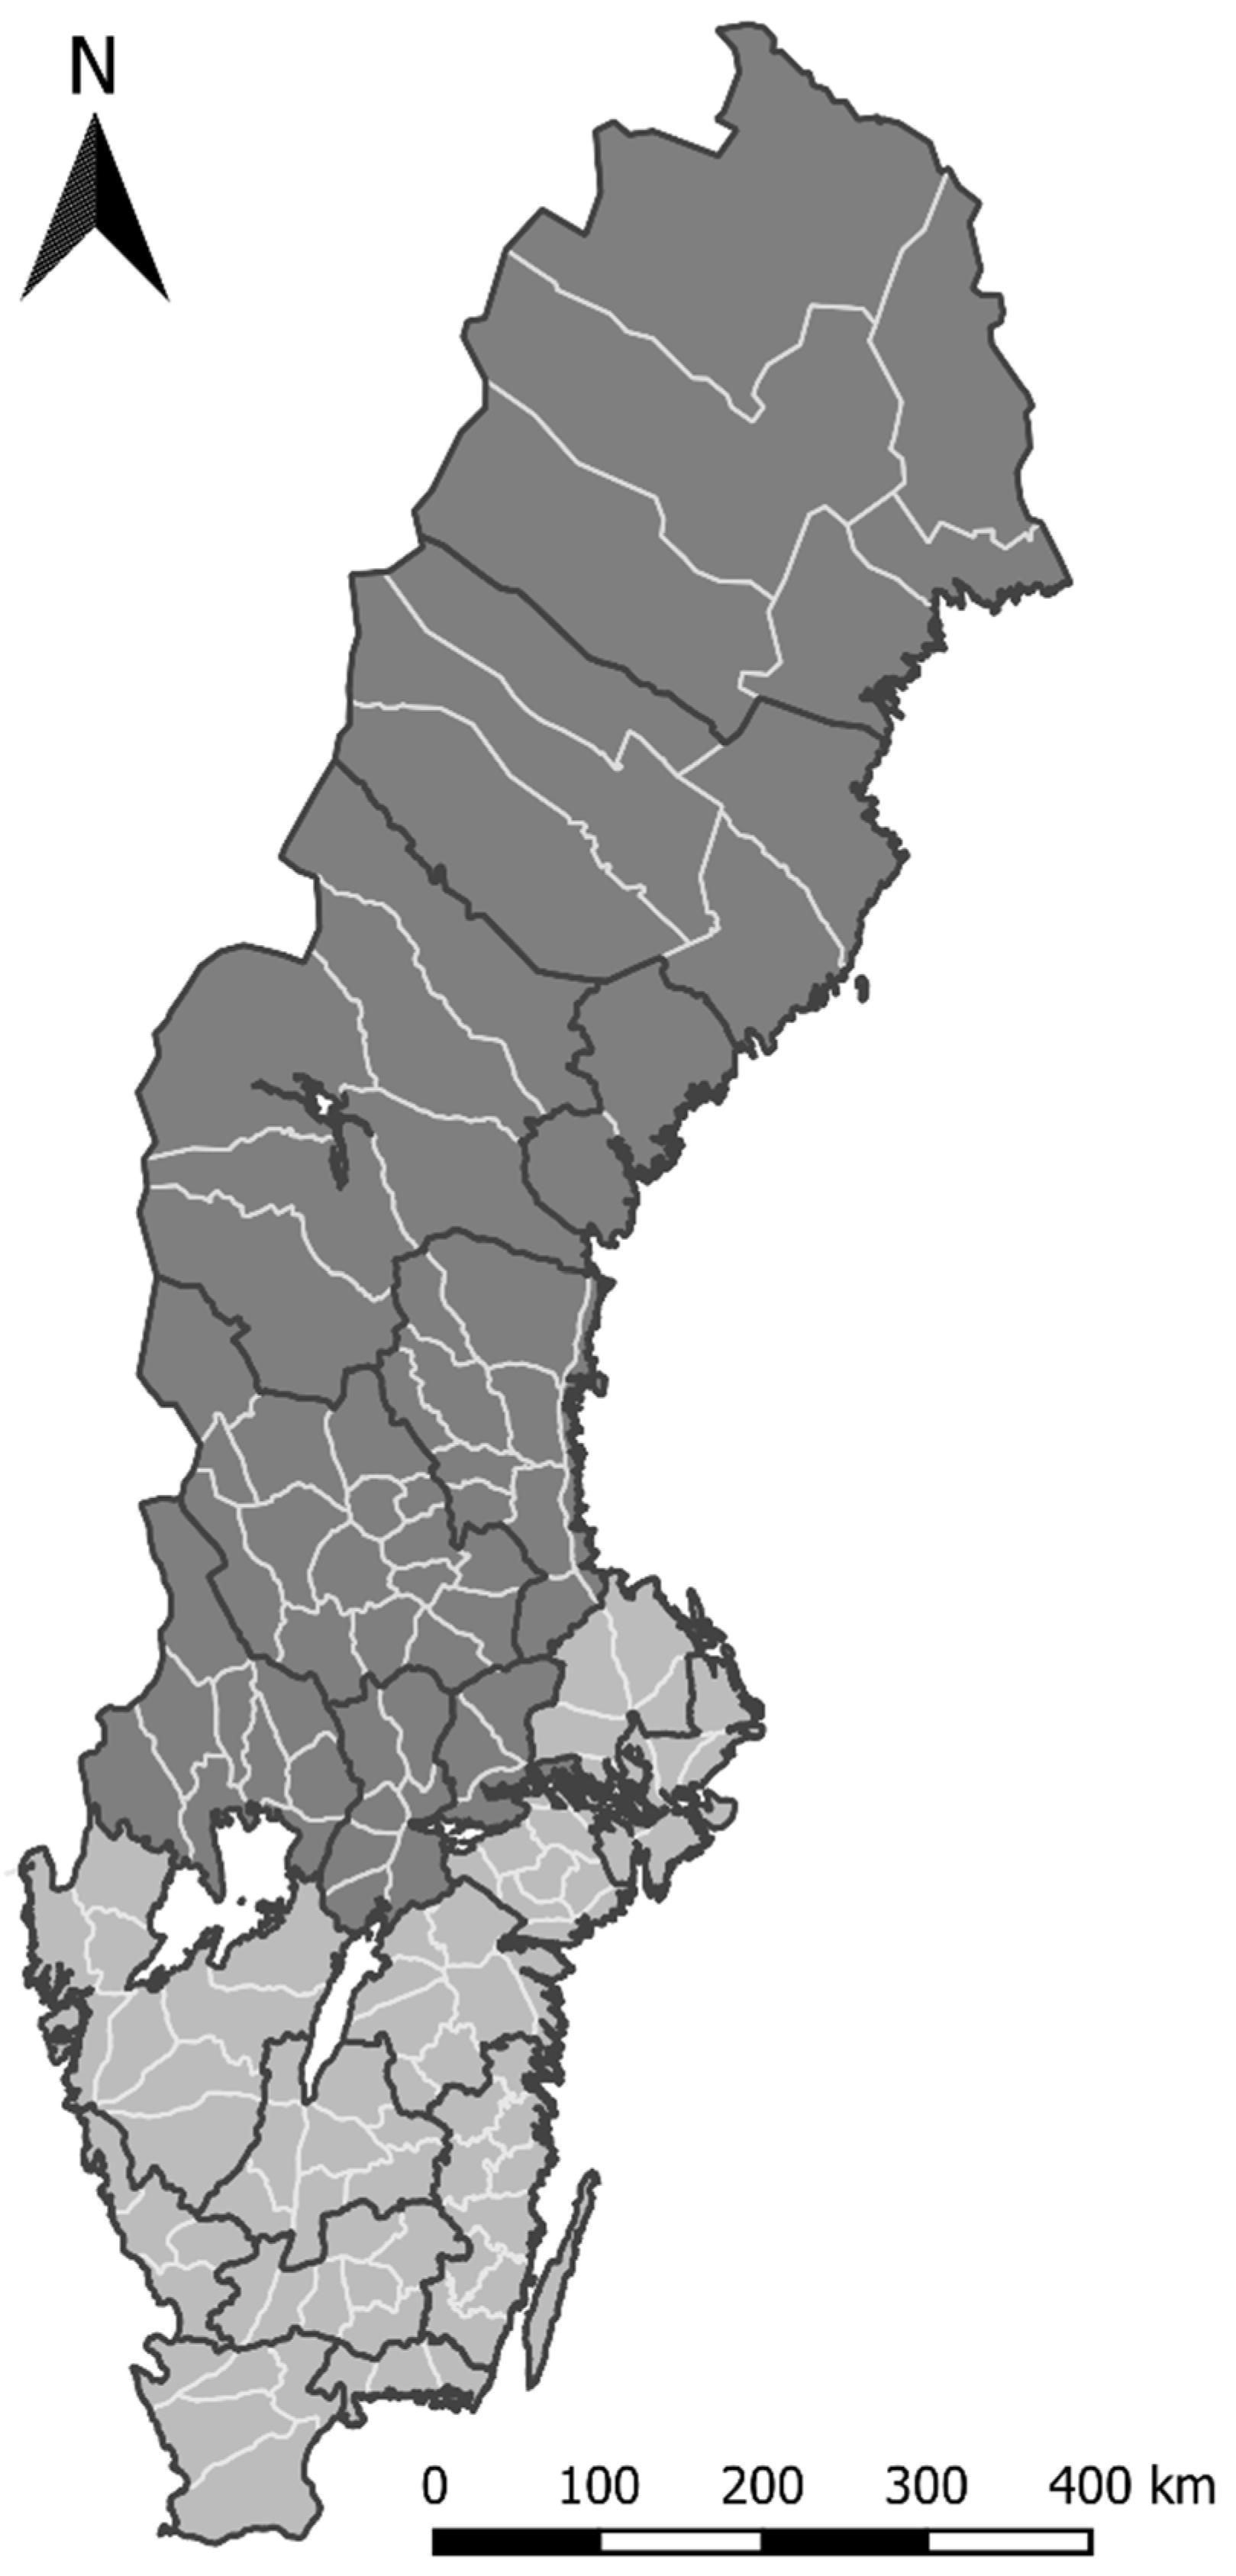
2.1. Study System
2.2. Dataset
2.2.1. Browsing Damage
2.2.2. Forest Composition
2.2.3. Cervid Populations
2.2.4. Land Use
2.2.5. Forage Availability
2.2.6. Climate
2.3. Statistical Analysis
3. Results
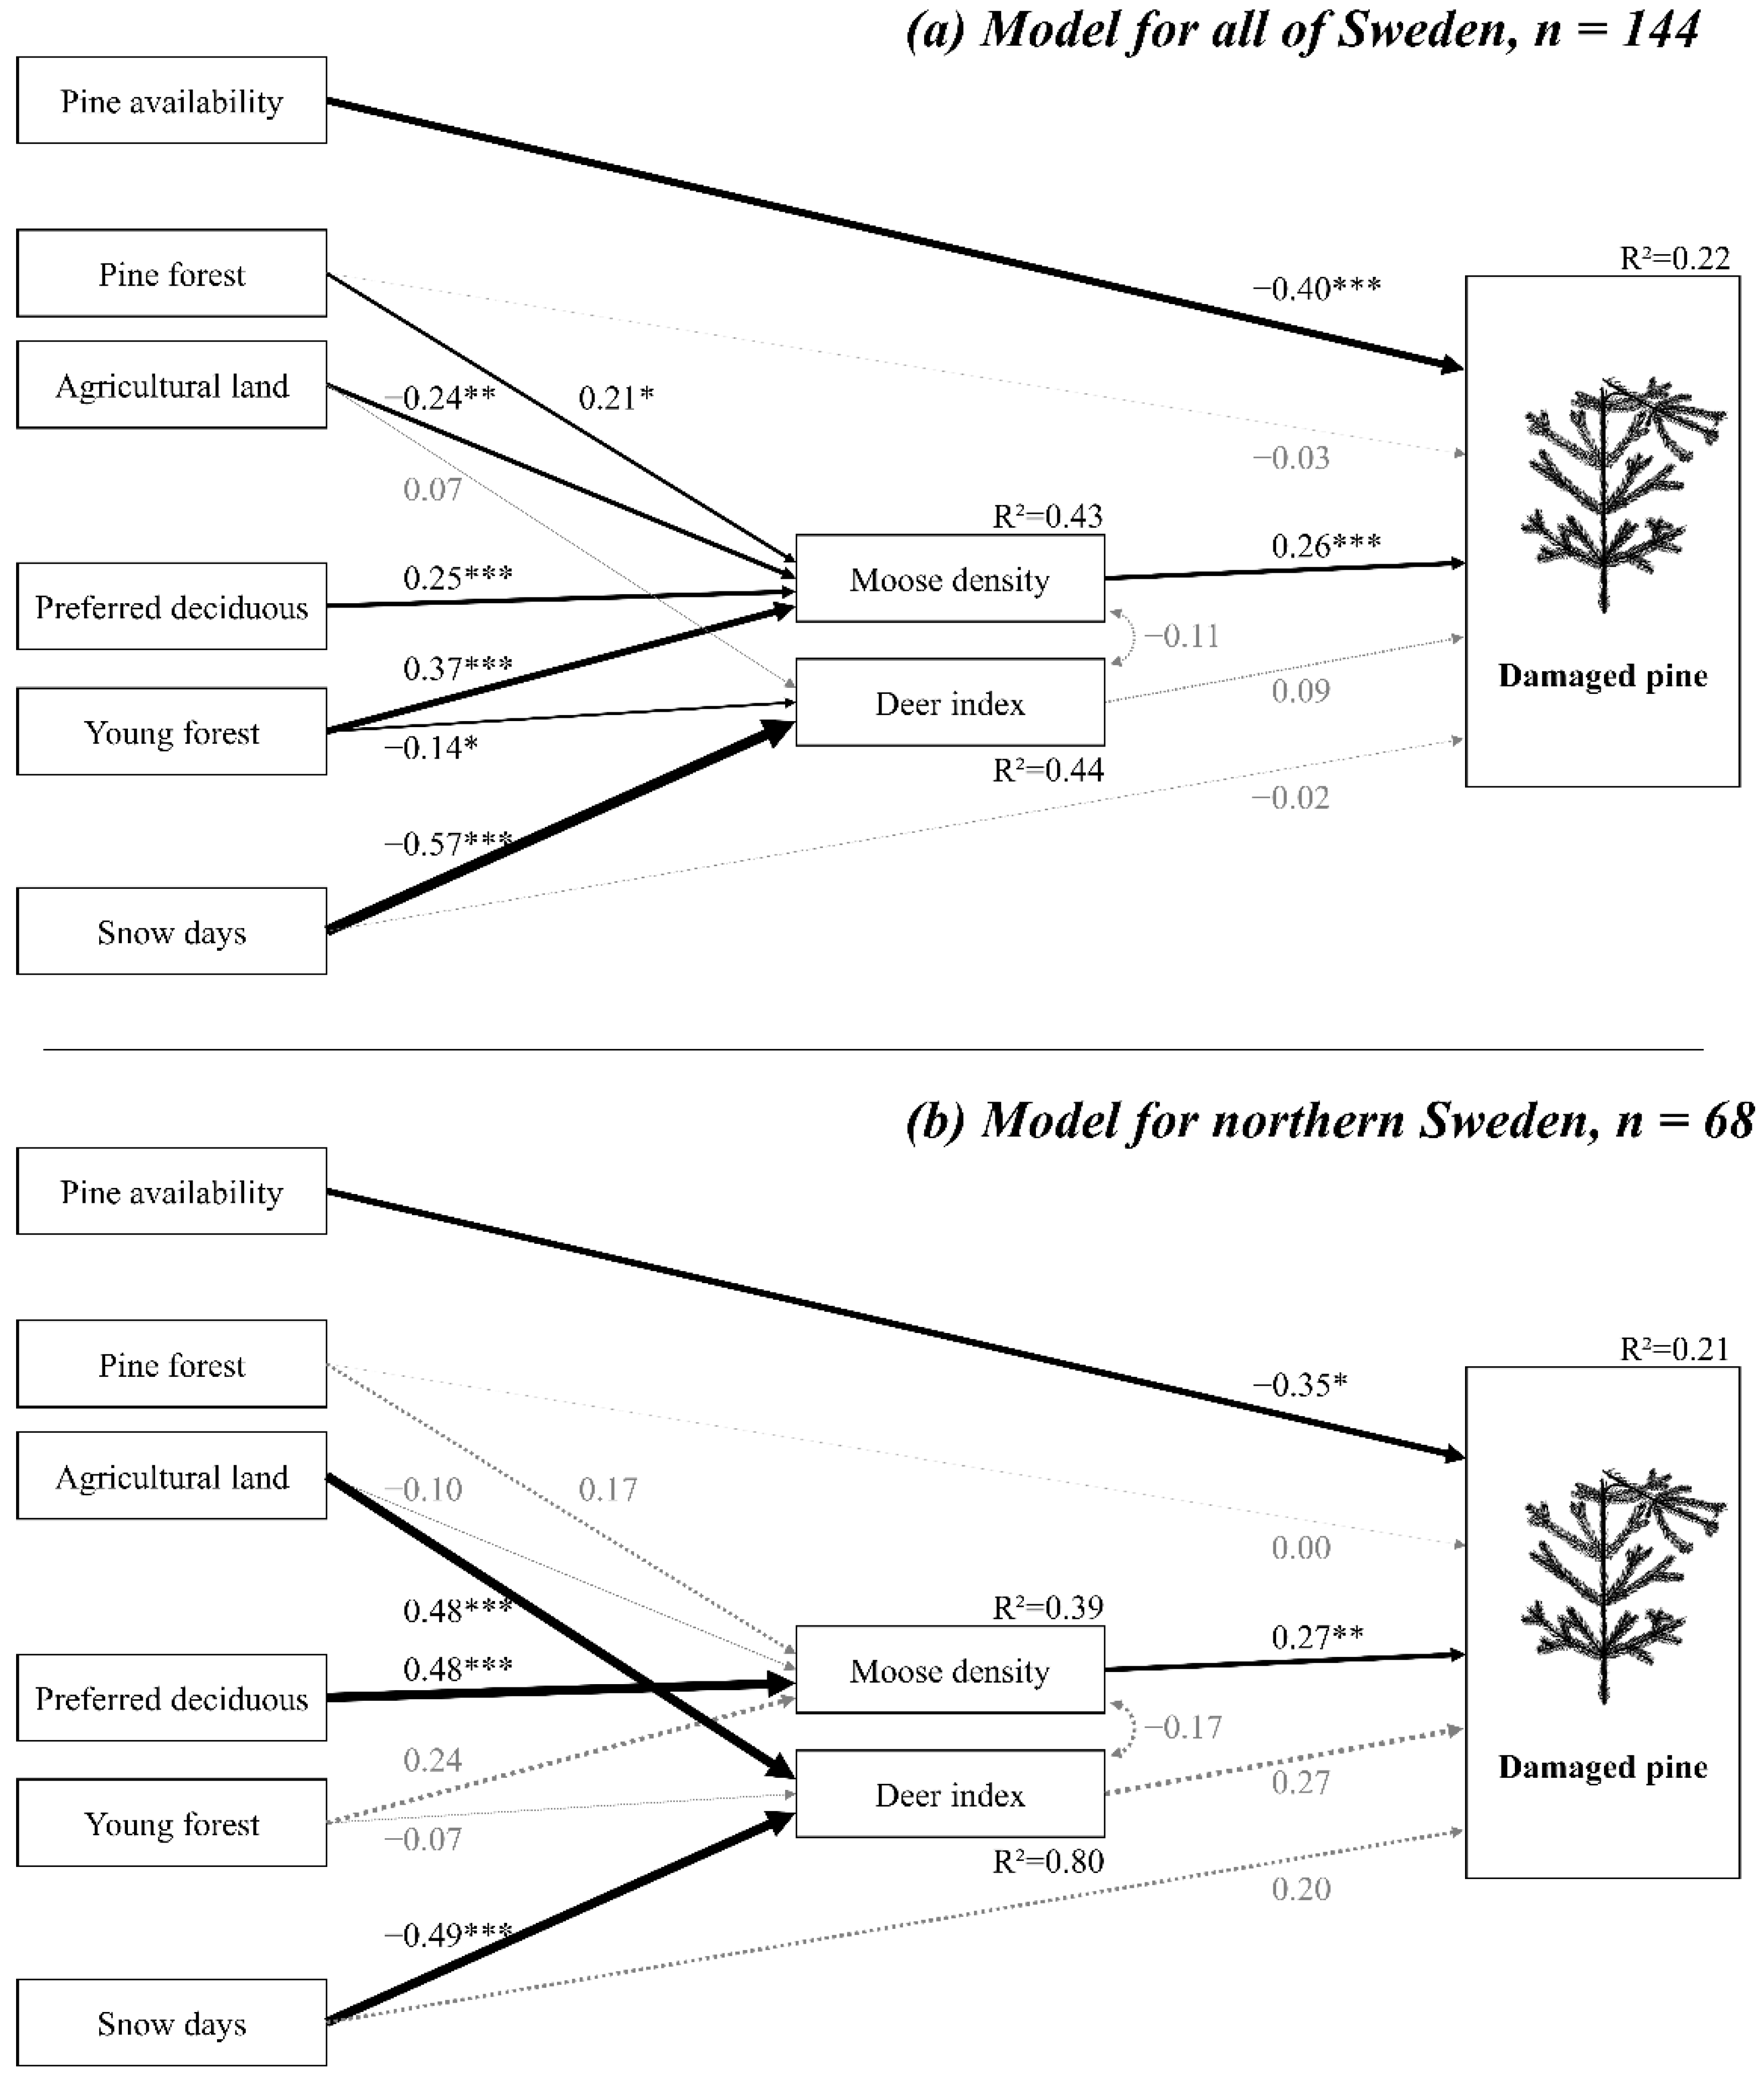
3.1. National Model
3.2. Models for Northern and Southern Sweden
4. Discussion
4.1. General Discussion
4.2. Comparison of National and Regional Models
4.3. Management Implications
4.4. Limitations of the Study and Future Research Needs
5. Conclusions
Supplementary Materials
Author Contributions
Funding
Institutional Review Board Statement
Data Availability Statement
Acknowledgments
Conflicts of Interest
References
- Wootton, J.T. Indirect Effects in Complex Ecosystems: Recent Progress and Future Challenges. J. Sea Res. 2002, 48, 157–172. [Google Scholar] [CrossRef]
- Lam, T.Y.; Maguire, D.A. Structural Equation Modeling: Theory and Applications in Forest Management. Int. J. For. Res. 2012, 2012, 263953. [Google Scholar] [CrossRef]
- Sugihara, G.; May, R.; Ye, H.; Hsieh, C.; Deyle, E.; Fogarty, M.; Munch, S. Detecting Causality in Complex Ecosystems. Science 2012, 338, 496. [Google Scholar] [CrossRef] [PubMed]
- Edenius, L.; Danell, K.; Nyquist, H. Effects of Simulated Moose Browsing on Growth, Mortality, and Fecundity in Scots Pine: Relations to Plant Productivity. Can. J. For. Res. 1995, 254, 529–535. [Google Scholar] [CrossRef]
- Gill, R.M.A. A Review of Damage by Mammals in North Temperate Forests: 3. Impact on Trees and Forests. For. Int. J. For. Res. 1992, 65, 363–388. [Google Scholar] [CrossRef]
- Ramos, J.A.; Bugalho, M.N.; Cortez, P.; Iason, G.R. Selection of Trees for Rubbing by Red and Roe Deer in Forest Plantations. For. Ecol. Manag. 2006, 222, 39–45. [Google Scholar] [CrossRef]
- Welch, D.; Staines, B.W.; Scott, D.; French, D.D. Leader Browsing by Red and Roe Deer on Young Sitka Spruce Trees in Western Scotland. II. Effects on Growth and Tree Form. For. Int. J. For. Res. 1992, 65, 309–330. [Google Scholar] [CrossRef]
- Andrén, H.; Angelstam, P. Moose Browsing on Scots Pine in Relation to Stand Size and Distance to Forest Edge. J. Appl. Ecol. 1993, 30, 133–142. [Google Scholar] [CrossRef]
- Månsson, J. Environmental Variation and Moose Alces Alces Density as Determinants of Spatio-Temporal Heterogeneity in Browsing. Ecography 2009, 32, 601–612. [Google Scholar] [CrossRef]
- Herfindal, I.; Tremblay, J.-P.; Hester, A.J.; Lande, U.S.; Wam, H.K. Associational Relationships at Multiple Spatial Scales Affect Forest Damage by Moose. For. Ecol. Manag. 2015, 348, 97–107. [Google Scholar] [CrossRef] [Green Version]
- Bergqvist, G.; Wallgren, M.; Jernelid, H.; Bergström, R. Forage Availability and Moose Winter Browsing in Forest Landscapes. For. Ecol. Manag. 2018, 419–420, 170–178. [Google Scholar] [CrossRef]
- Pfeffer, S.E.; Singh, N.J.; Cromsigt, J.P.G.M.; Kalén, C.; Widemo, F. Predictors of Browsing Damage on Commercial Forests—A Study Linking Nationwide Management Data. For. Ecol. Manag. 2021, 479, 118597. [Google Scholar] [CrossRef]
- Hothorn, T.; Müller, J. Large-Scale Reduction of Ungulate Browsing by Managed Sport Hunting. For. Ecol. Manag. 2010, 260, 1416–1423. [Google Scholar] [CrossRef]
- Borkowski, J.; Ukalski, K. Bark Stripping by Red Deer in a Post-Disturbance Area: The Importance of Security Cover. For. Ecol. Manag. 2012, 263, 17–23. [Google Scholar] [CrossRef]
- Champagne, E.; Perroud, L.; Dumont, A.; Tremblay, J.-P.; Côté, S.D. Neighbouring Plants and Perception of Predation Risk Modulate Winter Browsing by White-Tailed Deer (Odocoileus virginianus). Can. J. Zool. 2017, 96, 117–125. [Google Scholar] [CrossRef]
- Rao, S.J. Effect of Reducing Red Deer Cervus elaphus Density on Browsing Impact and Growth of Scots Pine Pinus sylvestris Seedlings in Semi-Natural Woodland in the Cairngorms, UK. Conserv. Evid. 2017, 14, 22–26. [Google Scholar]
- D’Aprile, D.; Vacchiano, G.; Meloni, F.; Garbarino, M.; Motta, R.; Ducoli, V.; Partel, P. Effects of Twenty Years of Ungulate Browsing on Forest Regeneration at Paneveggio Reserve, Italy. Forests 2020, 11, 612. [Google Scholar] [CrossRef]
- Kupferschmid, A.D.; Bütikofer, L.; Hothorn, T.; Schwyzer, A.; Brang, P. Ungulate Species and Abundance as Well as Environmental Factors Determine the Probability of Terminal Shoot Browsing on Temperate Forest Trees. Forests 2020, 11, 764. [Google Scholar] [CrossRef]
- Shipley, B. Cause and Correlation in Biology: A User’s Guide to Path Analysis, Structural Equations and Causal Inference with R; Cambridge University Press: Cambridge, UK, 2000; ISBN 0-521-79153-7. [Google Scholar]
- Hair, J.F., Jr.; Black, W.C.; Babin, B.J.; Anderson, R.E. Multivariate Data Analysis, 7th ed.; Pearson New International Edition; Pearson Education Limited: Essex, UK, 2014; ISBN 978-1-292-02190-4. [Google Scholar]
- Ahn, J. Beyond Single Equation Regression Analysis: Path Analysis and Multi-Stage Regression Analysis. Am. J. Pharm. Educ. 2002, 66, 37–42. [Google Scholar]
- Bergqvist, G.; Bergström, R.; Wallgren, M. Recent Browsing Damage by Moose on Scots Pine, Birch and Aspen in Young Commercial Forests—Effects of Forage Availability, Moose Population Density and Site Productivity. Silva Fenn. 2014, 48, 1077. [Google Scholar] [CrossRef]
- Felton, A.M.; Hedwall, P.-O.; Felton, A.; Widemo, F.; Wallgren, M.; Holmström, E.; Löfmarck, E.; Malmsten, J.; Karine Wam, H. Forage Availability, Supplementary Feed and Ungulate Density: Associations with Ungulate Damage in Pine Production Forests. For. Ecol. Manag. 2022, 513, 120187. [Google Scholar] [CrossRef]
- Jakt, S. Debatt: “Det är Inte Antalet Mular Som är Problemet”. Available online: https://svenskjakt.se/opinion/debatt/det-ar-inte-antalet-mular-som-ar-problemet/ (accessed on 23 August 2022).
- Jägareförbundet, S. Använd Fakta På Rätt Sätt. Available online: https://jagareforbundet.se/aktuellt/forbundsnyheter/2019/08/anvand-fakta-pa-ratt-satt/ (accessed on 23 August 2022).
- Widemo, F.; Leonardsson, K.; Ericsson, G. Co-Management of the Swedish Moose Population and Swedish Forests—Analyses at the Level of Moose Management Areas during 2012–2021 (in Swedish); Rapport 7044; Swedish Environmental Protection Agency: Stockholm, Sweden, 2022.
- SFA Skogsstatistisk Årsbok 2014—Swedish Statistical Yearbook of Forestry; Swedish Forest Agency: Jönköping, Sweden, 2014.
- Lindahl, K.B.; Sténs, A.; Sandström, C.; Johansson, J.; Lidskog, R.; Ranius, T.; Roberge, J.-M. The Swedish Forestry Model: More of Everything? For. Policy Econ. 2017, 77, 44–55. [Google Scholar] [CrossRef] [Green Version]
- Cederlund, G.; Ljungqvist, H.; Markgren, G.; Stålfelt, F. Foods of Moose and Roe Deer at Grimsö in Central Sweden—Results of Rumen Content Analyses. Swed. Wildl. Res. Grimsö Res. Stn. 1980, 11, 169–247. [Google Scholar]
- Shipley, L.A.; Blomquist, S.; Danell, K. Diet Choices Made by Free-Ranging Moose in Northern Sweden in Relation to Plant Distribution, Chemistry, and Morphology. Can. J. Zool. 1998, 76, 1722–1733. [Google Scholar] [CrossRef]
- Spitzer, R. Trophic Resource Use and Partitioning in Multispecies Ungulate Communities. Doctoral Thesis, Swedish University of Agricultural Sciences, Department of Wildlife, Fish and Environmental Studies, Umeå, Sweden, 2019. [Google Scholar]
- Bergqvist, J.; Kalén, C.; Karlsson, S. Skogsbrukets Kostnader För Viltskador—Återrapportering till Regeringen; Swedish Forest Agency: Jönköping, Sweden, 2019. [Google Scholar]
- Jensen, W.F.; Rea, R.V.; Penner, C.E.; Smith, J.R.; Bragina, E.V.; Razenkova, E.; Balciauskas, L.; Bao, H.; Bystiansky, S.; Csányi, S.; et al. A Review of Circumpolar Moose Populations with Emphasis on Eurasian Moose Distributions and Densities. Alces 2020, 56, 63–78. [Google Scholar]
- Wallgren, M. Sverige Har Världens Tätaste Älgstam. Available online: https://www.skogforsk.se/kunskap/kunskapsbanken/2016/varldens-tataste-algstam/ (accessed on 31 October 2019).
- Danell, K.; Bergström, R. Vilt, Människa, Samhälle; Liber AB: Stockholm, Sweden, 2010; ISBN 91-47-09418-4. [Google Scholar]
- Spitzer, R.; Coissac, E.; Felton, A.; Fohringer, C.; Juvany, L.; Landman, M.; Singh, N.J.; Taberlet, P.; Widemo, F.; Cromsigt, J.P.G.M. Small Shrubs with Large Importance? Smaller Deer May Increase the Moose-Forestry Conflict through Feeding Competition over Vaccinium Shrubs in the Field Layer. For. Ecol. Manag. 2021, 480, 118768. [Google Scholar] [CrossRef]
- Linnell, J.D.C.; Cretois, B.; Nilsen, E.B.; Rolandsen, C.M.; Solberg, E.J.; Veiberg, V.; Kaczensky, P.; Van Moorter, B.; Panzacchi, M.; Rauset, G.R.; et al. The Challenges and Opportunities of Coexisting with Wild Ungulates in the Human-Dominated Landscapes of Europe’s Anthropocene. Biol. Conserv. 2020, 244, 108500. [Google Scholar] [CrossRef]
- Edenius, L.; Månsson, J.; Hjortstråle, T.; Roberge, J.-M.; Ericsson, G. Browsing and Damage Inflicted by Moose in Young Scots Pine Stands Subjected to High-Stump Precommercial Thinning. Scand. J. For. Res. 2015, 30, 382–387. [Google Scholar] [CrossRef]
- Kuijper, D.P.J.; Cromsigt, J.P.G.M.; Churski, M.; Adam, B.; Jędrzejewska, B.; Jędrzejewski, W. Do Ungulates Preferentially Feed in Forest Gaps in European Temperate Forest? For. Ecol. Manag. 2009, 258, 1528–1535. [Google Scholar] [CrossRef]
- Kindberg, J.; Swenson, J.E.; Ericsson, G.; Bellemain, E.; Miquel, C.; Taberlet, P. Estimating Population Size and Trends of the Swedish Brown Bear Ursus Arctos Population. Wildl. Biol. 2011, 17, 114–123. [Google Scholar] [CrossRef]
- Svensson, L.; Åkesson, M.; Wabakken, P.; Maartmann, E.; Flagstad, Ö. Inventering Av Varg Vintern 2014–2015; Beståndsstatus för Stora Rovdjur i Skandinavien; Swedish University of Agricultural Sciences, Department of Ecology: Riddarhyttan, Sweden, 2015. [Google Scholar]
- Solberg, E.J.; Loison, A.; Sæther, B.-E.; Strand, O. Age-Specific Harvest Mortality in a Norwegian Moose Alces Alces Population. Wildl. Biol. 2000, 6, 41–52. [Google Scholar] [CrossRef]
- Dressel, S.; Ericsson, G.; Sandström, C. Mapping Social-Ecological Systems to Understand the Challenges Underlying Wildlife Management. Environ. Sci. Policy 2018, 84, 105–112. [Google Scholar] [CrossRef]
- Naturvårdsverket. Naturvårdsverkets Författningssamling 2011:7—Naturvårdsverkets Föreskrifter Och Allmänna Råd Om Jakt Efter Älg Och Kronhjort; Swedish Environmental Protection Agency: Stockholm, Sweden, 2011.
- Naturvårdsverket. Uppföljning Av Mål Inom Älgförvaltningen—Redovisning Av Regeringsuppdrag; Swedish Environmental Protection Agency: Stockholm, Sweden, 2018.
- SFA Skoglig Betesinventering. Available online: https://skobi.skogsstyrelsen.se/AbinRapport/#/valj-rapport (accessed on 17 November 2021).
- Nichols, R.V.; Cromsigt, J.P.; Spong, G. DNA Left on Browsed Twigs Uncovers Bite-Scale Resource Use Patterns in European Ungulates. Oecologia 2015, 178, 275–284. [Google Scholar] [CrossRef]
- Allen, A.M.; Dorey, A.; Malmsten, J.; Edenius, L.; Ericsson, G.; Singh, N.J. Habitat-Performance Relationships of a Large Mammal on a Predator-Free Island Dominated by Humans. Ecol. Evol. 2017, 7, 305–319. [Google Scholar] [CrossRef] [PubMed]
- Stephens, D.W.; Krebs, J.R. Foraging Theory; Monographs in Behavior and Ecology; Princeton University Press: Princeton, NJ, USA, 1986; Volume 1, ISBN 0-691-08441-6. [Google Scholar]
- Senft, R.; Coughenour, M.; Bailey, D.; Rittenhouse, L.; Sala, O.; Swift, D. Large Herbivore Foraging and Ecological Hierarchies—Landscape Ecology Can Enhance Traditional Foraging Theory. BioScience 1987, 37, 789–799. [Google Scholar] [CrossRef]
- Bergström, R.; Hjeljord, O. Moose and Vegetation Interactions in Northwestern Europe and Poland. Swed. Wildl. Res. 1987, 1, 213–228. [Google Scholar]
- Bjørneraas, K.; Solberg, E.J.; Herfindal, I.; Moorter, B.V.; Rolandsen, C.M.; Tremblay, J.-P.; Skarpe, C.; Sæther, B.-E.; Eriksen, R.; Astrup, R. Moose Alces Alces Habitat Use at Multiple Temporal Scales in a Human-Altered Landscape. Wildl. Biol. 2011, 17, 44–54. [Google Scholar] [CrossRef]
- Godvik, I.M.R.; Loe, L.E.; Vik, J.O.; Veiberg, V.; Langvatn, R.; Mysterud, A. Temporal Scales, Trade-offs, and Functional Responses in Red Deer Habitat Selection. Ecology 2009, 90, 699–710. [Google Scholar] [CrossRef]
- Tinoco Torres, R.; Carvalho, J.C.; Panzacchi, M.; Linnell, J.D.C.; Fonseca, C. Comparative Use of Forest Habitats by Roe Deer and Moose in a Human-Modified Landscape in Southeastern Norway during Winter. Ecol. Res. 2011, 26, 781–789. [Google Scholar] [CrossRef]
- Greenwood, J.J.D.; Elton, R.A. Analysing Experiments on Frequency-Dependent Selection by Predators. J. Anim. Ecol. 1979, 48, 721–737. [Google Scholar] [CrossRef]
- Díaz-Yáñez, O.; Mola-Yudego, B.; González-Olabarria, J.R. What Variables Make a Forest Stand Vulnerable to Browsing Damage Occurrence? Silva Fenn. 2017, 51, 1693. [Google Scholar] [CrossRef]
- Rivrud, I.M.; Loe, L.E.; Mysterud, A. How Does Local Weather Predict Red Deer Home Range Size at Different Temporal Scales? J. Anim. Ecol. 2010, 79, 1280–1295. [Google Scholar] [CrossRef] [PubMed]
- van Beest, F.M.; Rivrud, I.M.; Loe, L.E.; Milner, J.M.; Mysterud, A. What Determines Variation in Home Range Size across Spatiotemporal Scales in a Large Browsing Herbivore? J. Anim. Ecol. 2011, 80, 771–785. [Google Scholar] [CrossRef] [PubMed]
- Histøl, T.; Hjeljord, O. Winter Feeding Strategies of Migrating and Nonmigrating Moose. Can. J. Zool. 1993, 71, 1421–1428. [Google Scholar] [CrossRef]
- Visscher, D.R.; Merrill, E.H.; Fortin, D.; Frair, J.L. Estimating Woody Browse Availability for Ungulates at Increasing Snow Depths. For. Ecol. Manag. 2006, 222, 348–354. [Google Scholar] [CrossRef]
- Ahti, T.; Hamet-Ahti, L.; Jalas, J. Vegetation Zones and Their Sections in Northwestern Europe. Ann. Bot. Fenn. 1968, 5, 168–211. [Google Scholar]
- Statistics Sweden. Agricultural Statistics 2020; Agriculture and Energy Statistics Unit: Örebro, Sweden, 2020. [Google Scholar]
- Jarnemo, A.; Neumann, W.; Ericsson, G.; Kjellander, P.; Andrén, H. Hjortvilt i Sverige: En Kunskapssammanställning; Naturvårdsverket: Bromma, Sweden, 2018.
- SMHI Snödjup. Available online: https://www.smhi.se/vader/observationer/snodjup/1819 (accessed on 28 April 2021).
- SEPA Nationella Marktäckedata. Available online: https://www.naturvardsverket.se/Sa-mar-miljon/Kartor/Nationella-Marktackedata-NMD/Ladda-ned/ (accessed on 28 April 2021).
- SMHI Normalt Antal Dygn Med Snötäcke per År. Available online: https://www.smhi.se/data/meteorologi/sno/normalt-antal-dygn-med-snotacke-per-ar-1.7937 (accessed on 15 April 2021).
- SCAB Statistik Älgdata. Available online: https://algdata-apps.lansstyrelsen.se/algdata-apps-stat (accessed on 14 April 2020).
- Simthinc Projekt Helge. Available online: https://simthinc.com/ (accessed on 10 May 2021).
- SAHWM Viltdata. Available online: https://rapport.viltdata.se/statistik/ (accessed on 12 April 2021).
- SFA Varierande Äbin-Resultat. Available online: https://www.skogsstyrelsen.se/statistik/statistik-efter-amne/abin-och-andra-skogliga-betesinventeringar/varierande-abin-resultat/ (accessed on 27 April 2021).
- Singh, N.; Danell, K.; Edenius, L.; Ericsson, G. Tackling the Motivation to Monitor: Success and Sustainability of a Participatory Monitoring Program. Ecol. Soc. 2014, 19, 7. [Google Scholar] [CrossRef]
- Kalén, C.; Andrén, H.; Månsson, J.; Sand, H. Using Citizen Data in a Population Model to Estimate Population Size of Moose (Alces Alces). Ecol. Model. 2022, 471, 110066. [Google Scholar] [CrossRef]
- Petersson, L.; Nilsson, S.; Holmström, E.; Lindbladh, M.; Felton, A. Forest Floor Bryophyte and Lichen Diversity in Scots Pine and Norway Spruce Production Forests. For. Ecol. Manag. 2021, 493, 119210. [Google Scholar] [CrossRef]
- Petersson, L.; Holmström, E.; Lindbladh, M.; Felton, A. Tree Species Impact on Understory Vegetation: Vascular Plant Communities of Scots Pine and Norway Spruce Managed Stands in Northern Europe. For. Ecol. Manag. 2019, 448, 330–345. [Google Scholar] [CrossRef]
- Nikula, A.; Heikkinen, S.; Helle, E. Habitat Selection of Adult Moose Alces alces at Two Spatial Scales in Central Finland. Wildl. Biol. 2004, 10, 121–135. [Google Scholar] [CrossRef]
- Månsson, J.; Kalén, C.; Kjellander, P.; Andrén, H.; Smith, H. Quantitative Estimates of Tree Species Selectivity by Moose (Alces alces) in a Forest Landscape. Scand. J. For. Res. 2007, 22, 407–414. [Google Scholar] [CrossRef]
- Rosseel, Y. Lavaan: An R Package for Structural Equation Modeling and More. Version 0.5-12 (BETA). J. Stat. Softw. 2012, 48, 1–36. [Google Scholar] [CrossRef]
- Maydeu-Olivares, A. Maximum Likelihood Estimation of Structural Equation Models for Continuous Data: Standard Errors and Goodness of Fit. Struct. Equ. Model. Multidiscip. J. 2017, 24, 383–394. [Google Scholar] [CrossRef]
- R Core Team. R: A Language and Environment for Statistical Computing; R Core Team: Vienna, Austria, 2019. [Google Scholar]
- Månsson, J.; Andrén, H.; Pehrson, Å.; Bergström, R. Moose Browsing and Forage Availability: A Scale-Dependent Relationship? Can. J. Zool. 2007, 85, 372–380. [Google Scholar] [CrossRef]
- Felton, A.M.; Holmström, E.; Malmsten, J.; Felton, A.; Cromsigt, J.P.G.M.; Edenius, L.; Ericsson, G.; Widemo, F.; Wam, H.K. Varied Diets, Including Broadleaved Forage, Are Important for a Large Herbivore Species Inhabiting Highly Modified Landscapes. Sci. Rep. 2020, 10, 1904. [Google Scholar] [CrossRef] [Green Version]
- Courtois, R.; Dussault, C.; Potvin, F.; Daigle, G. Habitat Selection by Moose (Alces alces) in Clear-Cut Landscapes. Alces 2002, 38, 16. [Google Scholar]
- Danell, K.; Niemelä, P.; Varvikko, T.; Vuorisalo, T. Moose Browsing on Scots Pine along a Gradient of Plant Productivity. Ecology 1991, 72, 1624–1633. [Google Scholar] [CrossRef]
- Danell, K.; Edenius, L.; Lundberg, P. Herbivory and Tree Stand Composition: Moose Patch Use in Winter. Ecology 1991, 72, 1350–1357. [Google Scholar] [CrossRef]
- Allen, A.M.; Månsson, J.; Sand, H.; Malmsten, J.; Ericsson, G.; Singh, N.J. Scaling up Movements: From Individual Space Use to Population Patterns. Ecosphere 2016, 7, e01524. [Google Scholar] [CrossRef]
- Ball, J.P.; Nordengren, C.; Wallin, K. Partial Migration by Large Ungulates: Characteristics of Seasonal Moose Alces alces Ranges in Northern Sweden. Wildl. Biol. 2001, 7, 39–47. [Google Scholar] [CrossRef]
- Felton, A.; Petersson, L.; Nilsson, O.; Witzell, J.; Cleary, M.; Felton, A.M.; Björkman, C.; Sang, Å.O.; Jonsell, M.; Holmström, E. The Tree Species Matters: Biodiversity and Ecosystem Service Implications of Replacing Scots Pine Production Stands with Norway Spruce. Ambio 2020, 49, 1035–1049. [Google Scholar] [CrossRef] [PubMed]
- Reimoser, F.; Gossow, H. Impact of Ungulates on Forest Vegetation and Its Dependence on the Silvicultural System. For. Ecol. Manag. 1996, 88, 107–119. [Google Scholar] [CrossRef]
- Reimoser, F. Steering the Impacts of Ungulates on Temperate Forests. J. Nat. Conserv. 2003, 10, 243–252. [Google Scholar] [CrossRef]
- Nevalainen, S.; Matala, J.; Korhonen, K.; Ihalainen, A. Moose Damage in National Forest Inventories (1986–2008) in Finland. Silva Fenn. 2016, 50, 1410. [Google Scholar] [CrossRef] [Green Version]


| Category | Variable | Description | Year | Source |
|---|---|---|---|---|
| Browsing damage (=dependent variable) | Damaged pine 2 | Proportion of annually damaged Scots pine stems | 2016–2019 (mean value; see Section 2.2.1) | Moose browsing inventory [46] |
| Forest composition 1 | Pine availability 2 | Total number of available Scots pine stems per hectare land area | 2016–2019 (mean value; see Section 2.2.2) | Moose browsing inventory [46] |
| Land use 1 | Pine forest | Proportion of pine forest | Raster from 2019 | National vegetation cover [65] |
| Agricultural land | Proportion of agricultural land | Raster from 2019 | National vegetation cover [65] | |
| Forage availability 1 | Preferred deciduous 2 | Proportion of sampling plots in young forests where rowan, aspen, willow or oak is present | 2016–2019 (mean value, see Section 2.2.5) | Moose browsing inventory [46] |
| Young forest 2 | Proportion of forage producing young forest derived from satellite images | 2016–2019 (mean value; see Section 2.2.5) | Forage prognosis [46] | |
| Climate | Snow days | Number of days with snow | Mean annual value for climatic normal period 1961–1990 | Climatic raster [66] |
| Cervid populations | Moose density 2 | Simulated number of moose per 1000 ha land area | Hunting seasons 2015/16–2017/18 (mean value; see Section 2.2.3) | Harvest data [67] were simulated in Helge [68] |
| Deer index | Sum of shot roe deer, red deer, and fallow deer per 1000 ha land area | Hunting seasons 2015/16–2017/18 (mean value; see Section 2.2.3) | Harvest data [69] |
| Category | Variable | Unit | All of Sweden (n = 144) | Northern Sweden (n = 68) | Southern Sweden (n = 76) | |||||||||
|---|---|---|---|---|---|---|---|---|---|---|---|---|---|---|
| M | SD | Min | Max | M | SD | Min | Max | M | SD | Min | Max | |||
| Browsing damage | Damaged pine | proportion | 0.15 | 0.07 | 0.05 | 0.38 | 0.13 | 0.07 | 0.05 | 0.38 | 0.17 | 0.07 | 0.05 | 0.34 |
| Forest composition | Pine availability | 1 ha−1 | 28.60 | 25.72 | 0.31 | 109.02 | 45.76 | 26.82 | 1.80 | 109.02 | 13.25 | 10.65 | 0.31 | 54.12 |
| Land use | Pine forest | proportion | 0.22 | 0.10 | 0.02 | 0.41 | 0.26 | 0.09 | 0.03 | 0.41 | 0.18 | 0.09 | 0.02 | 0.39 |
| Agricultural land | proportion | 0.11 | 0.12 | 0.00 | 0.62 | 0.05 | 0.07 | 0.00 | 0.33 | 0.16 | 0.12 | 0.02 | 0.62 | |
| Forage availability | Preferred deciduous | proportion | 0.49 | 0.16 | 0.02 | 0.83 | 0.41 | 0.17 | 0.02 | 0.81 | 0.55 | 0.13 | 0.23 | 0.83 |
| Young forest | proportion | 0.06 | 0.02 | 0.00 | 0.14 | 0.06 | 0.02 | 0.00 | 0.10 | 0.05 | 0.03 | 0.00 | 0.14 | |
| Climate | Snow days | count | 115.88 | 41.48 | 40.00 | 215.00 | 150.87 | 32.17 | 87.00 | 215.00 | 84.57 | 15.79 | 40.00 | 121.00 |
| Cervid populations | Moose density | 1000 ha−1 | 7.21 | 2.61 | 0.10 | 17.15 | 7.90 | 2.64 | 1.61 | 17.15 | 6.60 | 2.45 | 0.10 | 12.17 |
| Deer index | 1000 ha−1 | 7.55 | 7.75 | 0.00 | 53.60 | 2.00 | 1.97 | 0.00 | 8.51 | 12.52 | 7.63 | 3.98 | 53.60 | |
| Variable | est | SE | Z-Value | p-Value | Std. Est | |
|---|---|---|---|---|---|---|
| Moose density | ||||||
| Pine forest | 5.762 | 2.391 | 2.410 | 0.016 | 0.213 | |
| Agricultural land | −5.375 | 1.964 | −2.737 | 0.006 | −0.239 | |
| Preferred deciduous | 3.906 | 1.130 | 3.457 | 0.001 | 0.246 | |
| Young forest | 39.764 | 8.753 | 4.543 | 0.000 | 0.369 | |
| Deer index | ||||||
| Agricultural land | 4.867 | 5.118 | 0.951 | 0.342 | 0.073 | |
| Young forest | −45.598 | 18.579 | −2.454 | 0.014 | −0.142 | |
| Snow days | −0.107 | 0.011 | −9.489 | 0.000 | −0.574 | |
| Damaged pine | ||||||
| Pine availability | −0.001 | 0.000 | −3.831 | 0.000 | −0.404 | |
| Pine forest | −0.019 | 0.078 | −0.246 | 0.806 | −0.026 | |
| Moose density | 0.007 | 0.002 | 3.367 | 0.001 | 0.257 | |
| Deer index | 0.001 | 0.001 | 1.513 | 0.130 | 0.094 | |
| Snow days | 0.000 | 0.000 | −0.210 | 0.834 | −0.021 | |
| Covariance | ||||||
| Moose density—deer index | −1.296 | 0.897 | −1.444 | 0.149 | −0.113 | |
| Variance | ||||||
| Moose density—moose density | 3.874 | 0.668 | 5.798 | 0.000 | 0.574 | |
| Deer index—deer index | 33.689 | 13.393 | 2.515 | 0.012 | 0.565 | |
| Damaged pine—damaged pine | 0.004 | 0.001 | 7.367 | 0.000 | 0.780 | |
| Indirect effects | ||||||
| Pine forest via moose density | 0.041 | 0.021 | 1.945 | 0.052 | 0.055 | |
| Agricultural land via moose density | −0.038 | 0.017 | −2.265 | 0.023 | −0.061 | |
| Preferred deciduous via moose density | 0.028 | 0.010 | 2.733 | 0.006 | 0.063 | |
| Young forest via moose density | 0.282 | 0.112 | 2.517 | 0.012 | 0.095 | |
| Agricultural land via deer index | 0.004 | 0.005 | 0.790 | 0.429 | 0.007 | |
| Young forest via deer index | −0.040 | 0.028 | −1.442 | 0.149 | −0.013 | |
| Snow days via deer index | 0.000 | 0.000 | −1.542 | 0.123 | −0.054 | |
| Total effects | ||||||
| Pine forest | 0.022 | 0.077 | 0.282 | 0.778 | 0.029 | |
| Snow days | 0.000 | 0.000 | −0.803 | 0.422 | −0.075 | |
Publisher’s Note: MDPI stays neutral with regard to jurisdictional claims in published maps and institutional affiliations. |
© 2022 by the authors. Licensee MDPI, Basel, Switzerland. This article is an open access article distributed under the terms and conditions of the Creative Commons Attribution (CC BY) license (https://creativecommons.org/licenses/by/4.0/).
Share and Cite
Pfeffer, S.E.; Dressel, S.; Wallgren, M.; Bergquist, J.; Kalén, C. Browsing Damage on Scots Pine: Direct and Indirect Effects of Landscape Characteristics, Moose and Deer Populations. Diversity 2022, 14, 734. https://doi.org/10.3390/d14090734
Pfeffer SE, Dressel S, Wallgren M, Bergquist J, Kalén C. Browsing Damage on Scots Pine: Direct and Indirect Effects of Landscape Characteristics, Moose and Deer Populations. Diversity. 2022; 14(9):734. https://doi.org/10.3390/d14090734
Chicago/Turabian StylePfeffer, Sabine E., Sabrina Dressel, Märtha Wallgren, Jonas Bergquist, and Christer Kalén. 2022. "Browsing Damage on Scots Pine: Direct and Indirect Effects of Landscape Characteristics, Moose and Deer Populations" Diversity 14, no. 9: 734. https://doi.org/10.3390/d14090734