Article

Effects of Twenty Years of Ungulate Browsing on Forest Regeneration at Paneveggio Reserve, Italy

1
Department of Agricultural, Forest and Food Sciences, University of Turin, Via Largo Paolo Braccini 2, 10095 Grugliasco (TO), Italy
2
Department of Agricultural and Environmental Sciences, University of Milan, Via Celoria 2, 20133, Milano (MI), Italy
3
Paneveggio, Pale di San Martino Nature Park, località Castelpietra 2, 38054, Primiero San Martino di Castrozza (TN), Italy
*
Author to whom correspondence should be addressed.
Forests 2020, 11(6), 612; https://doi.org/10.3390/f11060612
Submission received: 23 April 2020 / Revised: 24 May 2020 / Accepted: 26 May 2020 / Published: 1 June 2020
(This article belongs to the Special Issue Impacts of Herbivory on Plant Communities)

Abstract

:
Forest ecosystems are threatened by different natural disturbances. Among them, the irruption of large herbivores represents one of the most alarming issues. Several local-scale studies have been carried out to clarify the mechanisms governing ungulate–forest interactions, to understand the effect of wild ungulates overabundance, and to apply conservation plans. However, information at large scales, over long periods of observation and from unmanipulated conditions is still scarce. This study aims to improve our knowledge in this field by using repeated inventories to investigate: the types of damage produced by ungulate populations on young trees, the drivers that stimulate browsing activity and its consequences on the specific composition of seedlings and saplings. To reach these goals, we used data collected during a twenty-year monitoring program (1994–2014) in the forests of Paneveggio-Pale di San Martino Nature Park (Italy). We applied descriptive statistics to summarize the data, GLMs to identify the drivers of browsing activity and Non-Metric Multidimensional Scaling (nMDS) ordinations to investigate the changes in specific composition of young trees across 20 years. We detected increasing browsing activity from 1994 to 2008 and a decline in 2014. Ungulates browsed preferentially in mature stands, and fed mostly on seedlings and saplings under 150 cm of height. The analysis of the environmental drivers of browsing pressure on the smallest size classes of plants suggests that foraging behavior is influenced by snowpack conditions, ungulate density and seasonality. Moreover, results underline the fact that ungulates feed mostly on palatable species, especially European rowan, but can also use unpalatable plants as emergency food under high competition levels. nMDS results suggest that rowan seed dispersion might be promoted by deer movements, however, saplings of this species were not able to exceed 30 cm of height because of heavy browsing. This bottleneck effect led to the dominance of unpalatable species, mostly Norway spruce, reducing diversity during forest regeneration. If prolonged, this effect could lead to a reduction of tree species richness, with cascading effects on many parts of the ecosystem, and threatening the resilience of the forest to future disturbances.

1. Introduction

Among herbivores, wild ungulates are among the most troubling species for forest dynamics and forest management, due to their worldwide irruption, the occupation of new ranges by natural expansion or direct introduction, and the consequent increased pressure on the vegetation [1,2,3,4,5,6,7]. Ungulates can impact forest ecosystems by feeding on several different plant species, in particular by browsing terminal shoots of shrubs and young trees while they are in the regeneration phase [8,9]. The consequences of browsing are manifold: death of seedlings of browsed species, reduction of seedling growth and, thus, inhibition of the regeneration process [10,11], or the creation of an apparent competitive advantage for plant species that are tolerant or resistant to browsing, or simply unpalatable [2,12]. In the long-term, the effects of herbivores on young trees at the regeneration stage will be reflected in the forest canopy cover composition [13].
Since the intensity of browsing is causally associated with ungulate abundance [14], high ungulate densities affect the survival and growth of seedlings, influence community composition, and modify the development trajectory of forest ecosystems [15]. For these reasons, the abundance of large herbivores is considered as one of the major drivers of ecosystem structure and function, with potential consequences for the conservation of numerous plants and animal species [1].
Therefore, there has been a large recent effort towards evaluating the impacts of intense browsing activity on different forest types. Among them, mountain forests are the most vulnerable [8,16] because regeneration, for many species, occurs only every few years due to irregularities in climate and seed output [17]. As a consequence, natural regeneration usually establishes according to definite age cohorts, years apart from each other. Moreover, at the upper-mountain and sub-alpine levels, the early growth of trees is very slow, and young trees need, on average, 20–60 years (depending on sites and species characteristics) to reach 150 cm of height [8]. This means that they are inevitably exposed to ungulate browsing for a long period of time. Therefore, even a few years of ungulate overpopulation, or a few severe winters when animal populations are concentrated in a limited area, are enough to endanger tree recruitment for decades [14].
Because forest succession is an inherently slow process, studying the long-term effects of browsing at large scales requires inventories to be carried out and repeated over a long period of time. Fencing is a frequently used approach to study local-scale effects in ungulate–forest interactions, however, landscape-level information, such as that obtained by repeated large-scale surveys, is still rather scarce [18].
One of the global hotspots of ungulate irruptions is the European mountains. Here, during the last decades of the twentieth century, most of the large herbivores increased in number as a direct result of reintroductions, or by natural changes in the size and dynamics of populations, due to the lack of predators [19]. The process has been particularly intense in the Alps, where concerns have been raised about the impacts of wild ungulates on forest biodiversity and ecosystem services [8]. For this reason, long-term monitoring of ungulate damage on young trees was recently started in several alpine protected areas, such as in the eastern Italian Alps [14,20]. However, a spatially- and temporally-explicit analysis of the causes and effects of browsing damage based on long-term surveys has not been performed to date.

2. Materials and Methods

2.1. Site Characteristics

The forests analyzed in this research are located in Paneveggio-Pale di San Martino Nature Park. This protected area is located in northeastern Italy (see Figure S1A, Supplementary Materials), in the Trento autonomous province and it covers 19726 ha, ranging from 1100 m a.s.l. to 3200 m a.s.l. In the Travignolo valley at low elevation (1456 m a.s.l.), there are the following annual mean values: minimum temperature of 0.1 °C, maximum temperature of 11.4 °C, precipitation of 1425 mm, and snow at ground level of 272 cm. At high elevation (Passo Rolle, 2002 m a.s.l.) the same parameters change as follow: minimum temperature of −1.3 °C, maximum temperature of 7.0 °C, precipitation of 1308 mm, and accumulated snow at ground level of 461 cm.
The study area is dominated by coniferous forests, while broad-leaved forests cover less than 1%. Referring to Natura 2000 classification, the most abundant forest habitats are: Acidophilous Picea forests of the montane to alpine levels (Vaccinio-Piceetea) (habitat code 9410, cover 4771 ha); Alpine Larix decidua and/or Pinus cembra forests (habitat code 9420, cover 2525 ha); Illyrian Fagus sylvatica forests (Aremonio-Fagion) (habitat code: 91K0, cover 712 ha). The most abundant tree species are Norway spruce (Picea abies (L.) H.Karst.), European larch (Larix decidua Mill.), stone pine (Pinus cembra L.), dwarf pine (Pinus mugo Turra), silver fir (Abies alba Mill.), European beech (Fagus sylvatica L.) and European rowan (Sorbus aucuparia L.). Other tree species are rarely present, such as Scots pine (Pinus sylvestris L.), mountain maple (Acer pseudoplatanus L.), green alder (Alnus viridis Chaix), common whitebeam (Sorbus aria (L.) Crantz), European aspen (Populus tremula L.), European ash (Fraxinus excelsior L.), silver birch (Betula pendula Roth) and goat willow (Salix caprea L.). In the next sections we will refer to these species collectively as “ssp.”.
The ungulate species present in the area are red deer (Cervus elaphus L., 1758), roe deer (Capreolus capreolus L., 1758) and chamois (Rupicapra rupicapra L., 1758). Red deer was reintroduced into the Paneveggio forest in the early 1960s, and their population increased sharply in last few decades [21]. Count surveys conducted inside the Park and the buffer area (see Figure 1A, Supplementary Materials) show that red deer population grew from 897 individuals in 2001 to 2617 in 2019 [22]. Chamois and roe deer have always been present in the study area, but their populations decreased, due to sarcoptic mange [23] and competition with red deer [24,25], respectively. Currently red deer is the most abundant and widespread ungulate species in the area (see Figure S2, Supplementary Materials).

2.2. Experimental Design and Data Collection

Four surveys of forest regeneration phase were conducted in the Park during the summers of 1994, 2003, 2008 and 2014. This sampling frequency was chosen to properly measure the browsing activity and avoid double detections. By spacing sampling seasons by at least five years, we assume that the browsing marks we detected in each survey were caused mostly after the previous survey. The sampling design was based on 101 permanent sampling plots randomly placed along fixed contour lines of 1400, 1600, 1800, 2000 m a.s.l. (see Figure S1B, Supplementary Materials). During the first survey, each plot was permanently marked and site parameters (elevation, aspect, slope) were recorded. Each plot covered an area of 400 m2. During each survey, diameter at breast height (DBH) was measured for all trees in each plot with DBH greater than 17.5 cm; common forest structure parameters (tree density, mean diameter, basal area per hectare) were then calculated in the lab. To collect data from young trees, a variable radius sampling was carried out in each plot. Trees smaller than 17.5 cm in DBH were counted within a 12-m radius from the center of each plot, starting from a 0-degree azimuth and moving clockwise until 40 trees were counted. If this number was reached before completing a full 360° survey, the total area covered by the measurement was recorded by calculating the area of the circular sector corresponding to the azimuth of the last individual tallied. When less than 40 trees had been counted, the measurement was repeated within a 30 m radius from the plot center. The minimum of 40 juvenile trees sampled in each plot ensured that we could rely on an adequate sample size for individual-level analysis. Plot-level summaries were built based on per-hectare density of juvenile trees, which is invariant relative to plot size. We assumed a homogenous spatial distribution of juvenile trees in each plot.
Trees into the regeneration phase were subdivided in four dimensional classes: class A, from 10 to 30 cm in height; class B, from 30 to 150 cm; class C, taller than 150 cm with DBH smaller than 4 cm; class D, taller than 150 cm with DBH between 4 and 17.5 cm. Seedlings under 10 cm of height were not recorded. Each plant was identified, classified, and all possible different types of ungulate damage (bark stripping, fraying, browsing) were recorded on a binary scale.

2.3. Statistical Analyses

To investigate the drivers of browsing activity at an individual level, we performed logistic regression (response variable: Damage/undamaged), using as predictors plant species, elevation, slope, aspect, distance from open areas (determined from existing land cover maps), density of adult trees, basal area and percentage of broadleaf trees (DBH > 17.5 cm) in the plot. Data collected during different sampling seasons were used together to perform this analysis. Aspect values (0°–360°) were transformed using the cosine function to correspond with north (1) and south (−1). The most commonly browsed size classes were A and B, so we built a separate model for each of these size classes, and we excluded C and D classes from this analysis.
To investigate temporal variations in species composition of trees at the regeneration stage, we performed a Non-Metric Multidimensional Scaling (nMDS) using the function metaMDS within the VEGAN package for R. To calculate distances between groups, the Zero Adjusted Bray Curtis index was chosen as the dissimilarity metric. Finally, we used the Analysis of Similarities test (ANOSIM) to check whether we could reject the null hypothesis that the similarity in species composition of young trees between years was greater than or equal to the similarity within the years. All analyses were performed using the R statistical framework (R Core Team, 2020).

3. Results

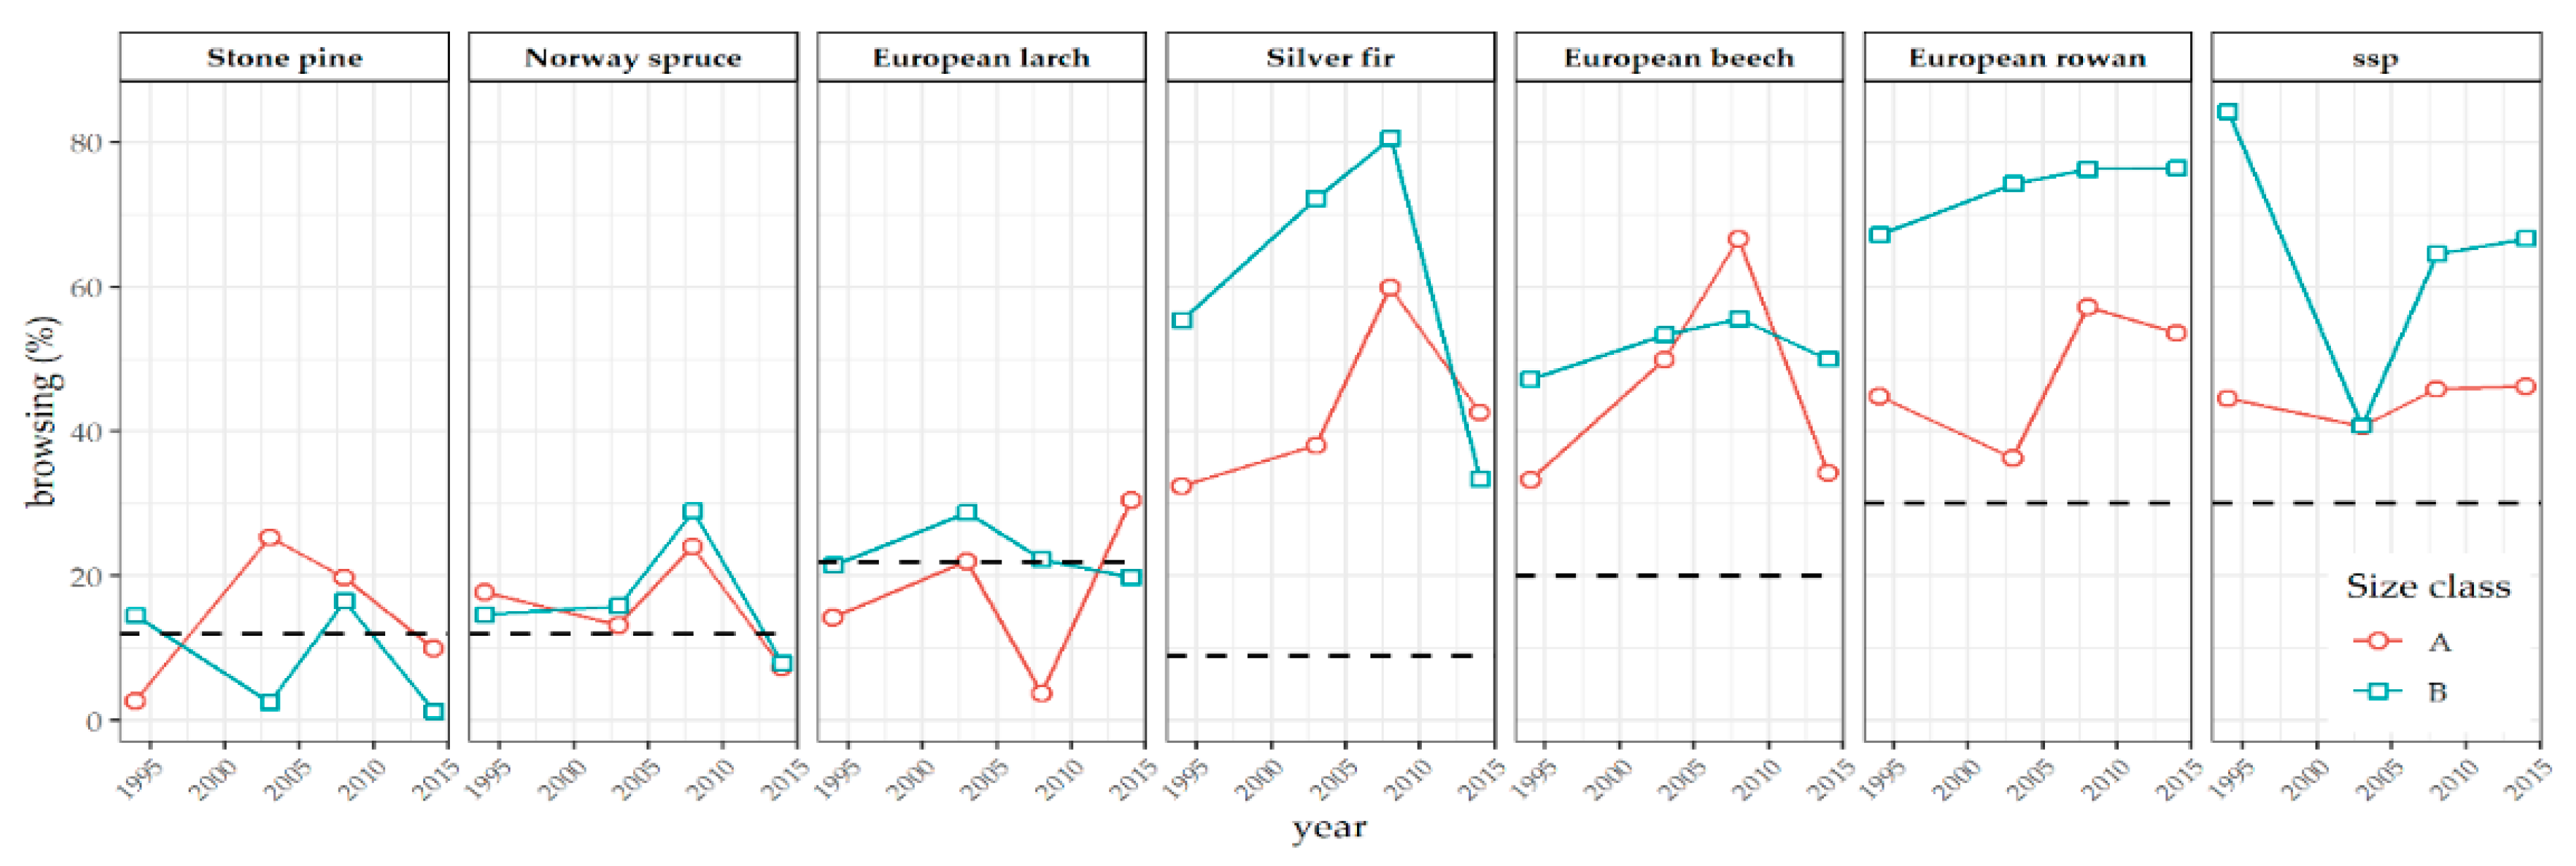
3.1. Browsing Damage

Among the three types of damage, the most abundant was browsing of apices for all the surveys. Since fraying and bark stripping were rare, we decided to not consider them as a threat for regeneration, and excluded them from all other analyses. Browsing pressure on young trees increased between 1994 and 2008 and decreased in 2014. The most browsed classes were A and B, while C was lightly browsed and D was rarely browsed (Table 1).
There was a clear difference among the species in terms of browsing damage. Species that showed the highest browsing percentage were silver fir, European beech and European rowan. For both size classes A and B, browsing pressure on these species were constantly above their respective bearable limit, suggested by Eiberle and Nigg (1987) [16], which indicates the maximum percentage of saplings that can be browsed per year without long-term regeneration failure. The coniferous species stone pine and European larch were lightly browsed and their percentages were around their respective tolerance limits. Norway spruce was also lightly browsed, however the pressure on this species was constantly above its tolerable limit of 12% [16], except for in 2014 (Figure 1).
The percent of browsed trees in size class B was generally higher than size class A. For most species, both size classes showed increasing browsing from 1994 to 2008. This trend stopped in 2014, when the percentage of browsing decreased to levels comparable to those registered in 1994. Some exceptions were European larch, whose increasing trend stopped in 2008, and stone pine and other rare species, whose browsing percentage did not decrease in 2014.

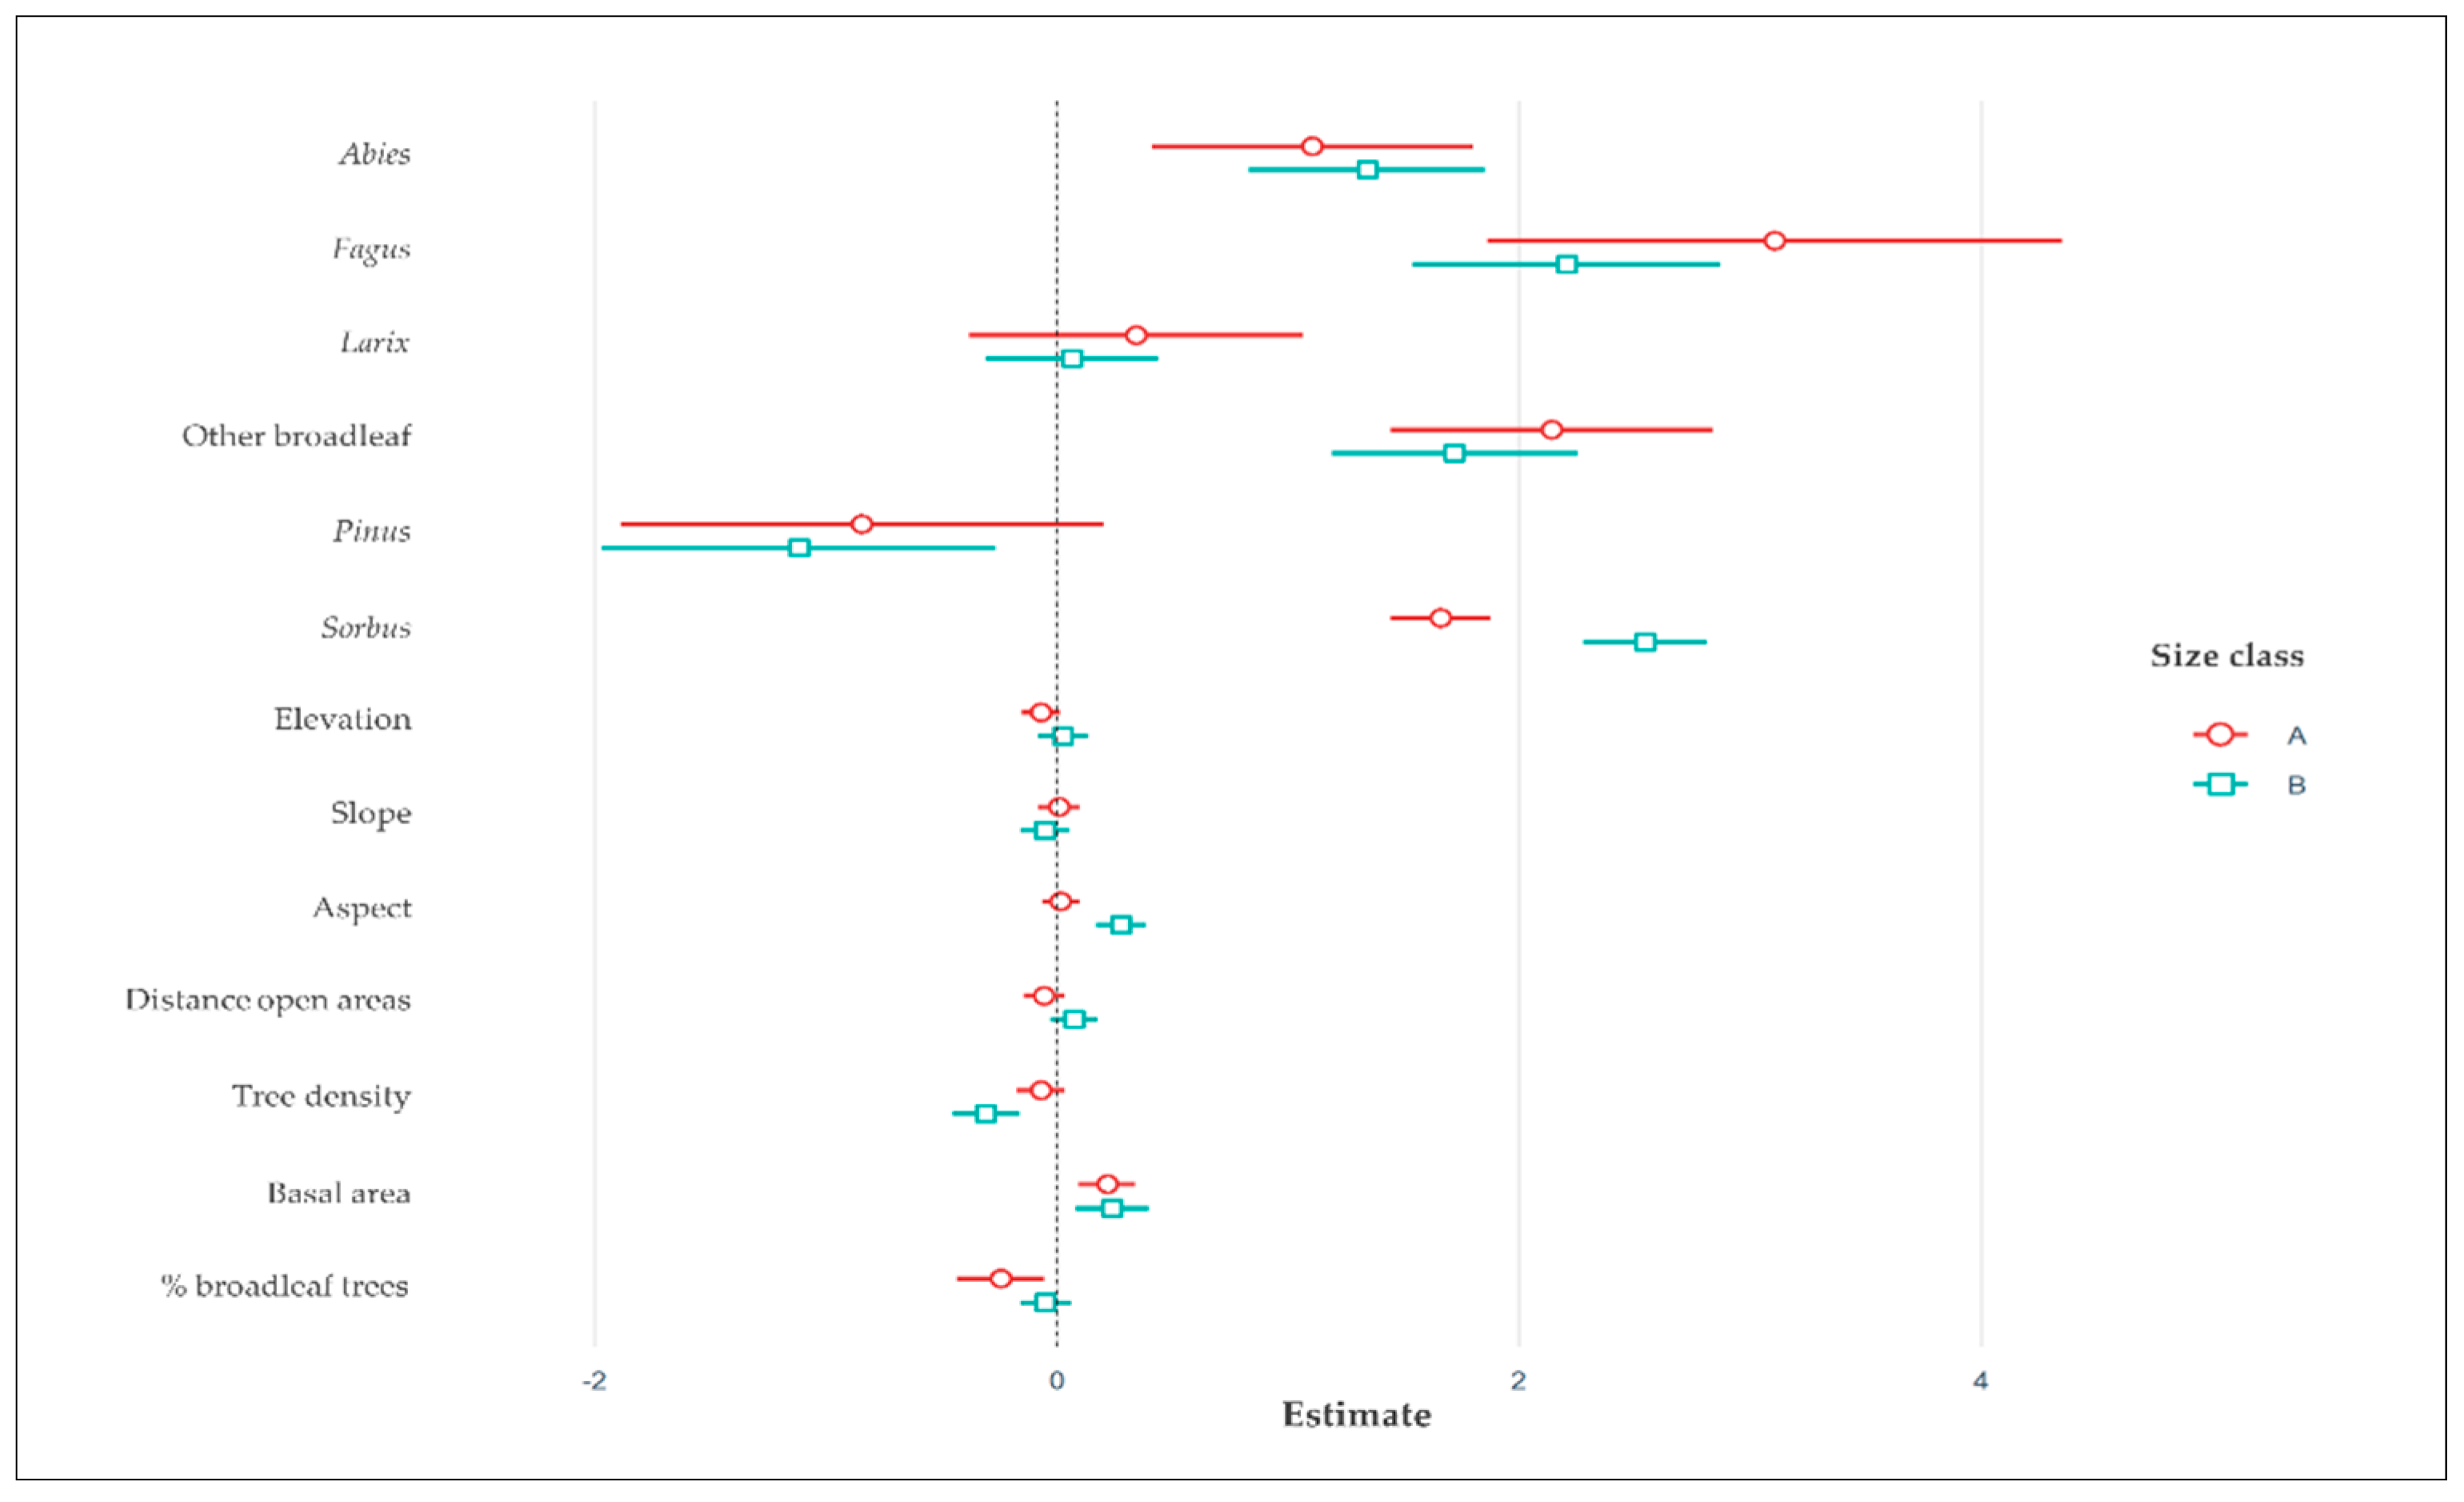
3.2. Drivers of Browsing Activity

Among the environmental drivers of browsing probability of trees in size class A, basal area (positive effect) and the percentage of broadleaf trees in the plot (negative effect) showed significant effects (p < 0.01, p = 0.01). For seedlings and saplings in size class B, browsing was negatively influenced by basal area (p < 0.01), tree density (p < 0.01) and aspect (p < 0.01) (Figure 2).
Elevation, slope and distance from open areas did not have any significant effect on the probability of browsing for either size class (see Table S1, Supplementary Materials).
GLMs also confirmed that relative to Picea, which served as reference category, the probability of browsing was significantly higher for Abies, Fagus, Sorbus and other broadleaf trees species, and lower for Pinus trees in class B (Figure 2). Larix and class A Pinus trees were not significantly different. The explained variance of browsing in model for size class A and in model for size class B was 0.09 and 0.18 respectively.

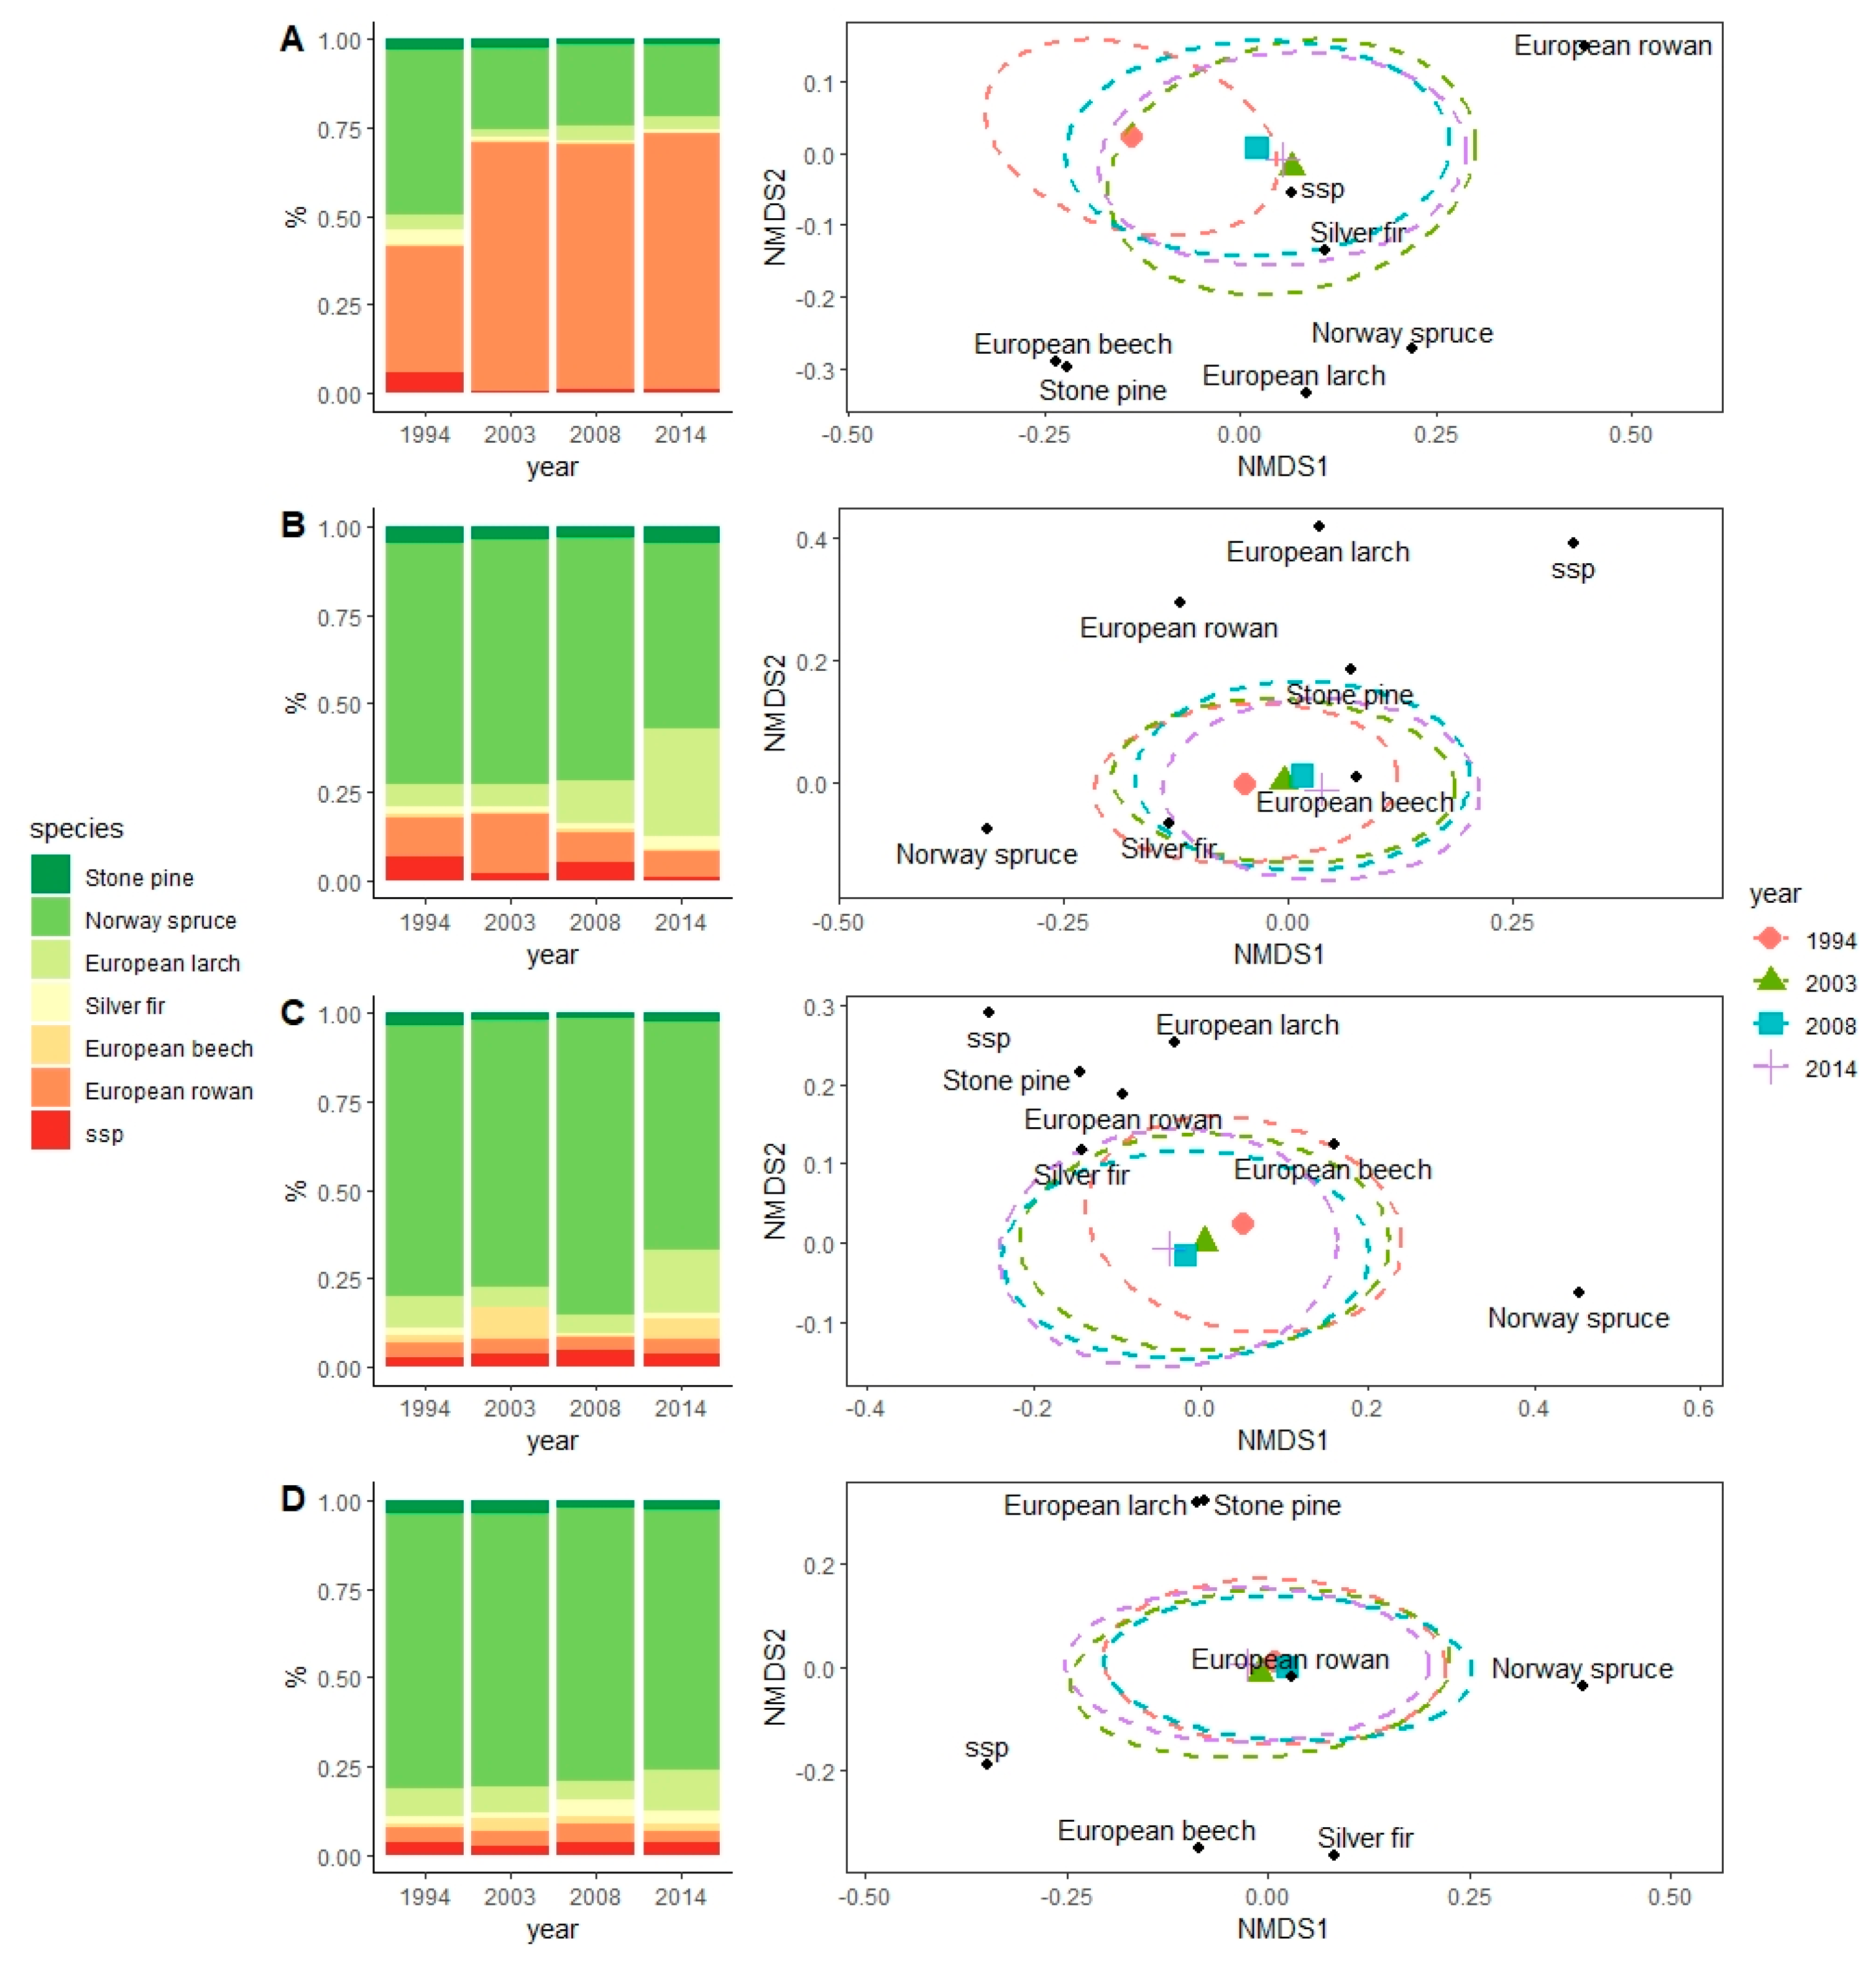
3.3. Effects on Specific Composition

The stress values in the two-dimensional nMDS for all size classes were respectively 0.14, 0.18, 0.16, and 0.16. According to the rule of thumb in Hair et al. (1998) [26], these values indicate that two dimensions were adequate to represent the variation in measured data. Based on the stress plots, the overall configuration fit well with the data in all the analyses performed (see Figure S3, Supplementary Materials).
For size class A, centroids of the year groups shifted mostly from left to right, along the nMDS1 axis (Figure 3), suggesting that the most important variation in composition across time was the increase in density of European rowan (see Table S2, Supplementary Materials). This variation in species composition between the four years was indeed significant (ANOSIM: R = 0.072, p = 0.001). The nMDS performed on size classes B and C provided similar results. In class B, the shift of the centroids along the nMDS1 axis (Norway spruce = 0.31) suggests that the most important variation in species composition was the decrease of Norway spruce density across the years (ANOSIM: R = 0.01, p = 0.02). Similar changes in specific composition occurred also in class C (ANOSIM: R = 0.015, p = 0.01). In class D, all centroids were located around zero values of both axes and they were close to each other. This suggests that no important shifts occurred in the community during the study (ANOSIM: R = -0.0006, p = 0.49).

4. Discussion

4.1. Damage Analysis

Browsing activity increased from 1994 to 2008 then slowed down in 2014; the overall ungulate abundance shows almost the same tendency [21] (see Figure S2, Supplementary Materials). However, using the overall abundance of ungulates as the main metric could partially mask the spread of a single species, leading to biased interpretations of the results. The negative trend of chamois population registered between 2003 and 2008 partially compensated for the high increment of red deer. After 2008, the strong depletion of chamois led the overall ungulate population to decrease despite the sustained red deer abundance. These population trends may lead to underestimate the impacts of red deer which has higher nutritional needs compared to the other ungulate species [24,25], and it can use a wider territory under high ungulate density conditions [27]. These inferences, in addition to the partial spatial segregation among chamois and red deer [28], lead us to reasonably assume that most of the browsing marks detected in this study were made by red deer. As a consequence, the reduction of browsing pressure in 2014 may be not linked to lower ungulate abundance, but it could have been caused by other factors, such as extreme meteorological events. The short-lived and thin snowpack registered in winter 2011–2012 (see Figure S4, Supplementary Materials) may have allowed deer to find other food resources, and to reduce the browsing pressure on trees in the regeneration stage [29]. Furthermore, we also hypothesize that the snowfalls that occurred in winter 2013–2014 may have affected deer browsing activity. In that winter, the snow cover at ground level persisted for almost seven months, from November until the end of May. The prolonged snow cover protected the ground vegetation from browsing pressure and, at the same time, it could have reduced the local deer density by leading animals to spend more time outside the reserve or at lower elevations. These hypotheses are both supported by the data collected by weather stations inside the reserve [30]. Due to the lack of empirical evidence concerning the species-specific interaction between a plant and its consumer, we prefer to discuss the results in the following sections referring to ungulates as a guild.
The most browsed size classes were A and B, suggesting the most threatened trees are those between 10 and 150 cm height, as reported in other studies [31]. Taller plants of classes C and D presented lower browsing percentages, indicating that they can be considered mostly out of the ungulate feeding zone and, hence, have more opportunities to reach the canopy.
The clear difference among the species in terms of browsing damage underlines the ability of ungulates to apply different selective behavior on their feeding habits. Apex removal indeed occurred more often on broadleaf species and silver fir compared to Norway spruce, European larch and stone pine. Browsing pressure on selected species was constantly higher than their bearable limits, indicating that many trees would not be able to grow enough to be competitive. Even though Norway spruce was among the least browsed species, it experienced periods of increased browsing pressure. This suggests that this species may act as a resource during food shortage periods [32], or when high population densities force ungulates to feed on lower quality food [33].

4.2. Drivers of Browsing Activity

Our investigation about the forces that drive ungulates in feeding on young trees underlined some differences between size class A and size class B plants. Results from the GLM of size class A show that the percentage of adult broadleaf trees in the plot negatively affected the browsing probability. Broadleaf trees in the canopy can decrease browsing pressure on seedlings by reducing the richness of food resources in the ground layer. In contrast, coniferous species in the Pinus and Larix genera promote a diverse understory, then the relative proportion of broadleaved species in mixed deciduous-coniferous stands negatively affects understory species richness [34]. This effect could have led ungulates to spend more time in conifer-rich stands relative to broadleaf-rich stands, especially in summer, when ground vegetation is exposed to herbivory. As a result of this preference, understory vegetation under broadleaf-rich stands is less exposed to browsing pressure. This hypothesis is also confirmed by the results of the size class B GLM, which showed that broadleaf trees did not affect browsing activity, likely because saplings between 30–150 cm of height are browsed in winter, when ground vegetation is covered by the snow [35] and does not attract ungulates. The negative effect of broadleaf trees on browsing pressure of size class A plants may be enhanced by the leaves that drop from deciduous tree sand cover low vegetation, hiding seedlings from ungulates.
The effect of aspect suggests that browsing pressure on size class B trees was more intense on northern exposures than on southern exposures. This can be due to the sensitivity of ungulates to snowpack, and to the high ungulate density that may have forced some individuals to forage in areas that are normally avoided. Usually, ungulates prefer to spend wintertime on south-facing slopes, because the climate conditions are milder there, and the thinner snow cover allows them to easily dig and access understory vegetation. The higher availability of food resources may have slightly decreased the browsing pressure on class B trees of these slopes. On the other hand, north-facing slopes are avoided, because the deeper and harder snowpack conditions [36,37] make movement more energy consuming and fewer food resources are available. In these conditions, ungulates like red deer can survive by switching their feeding habits entirely on to class B trees [38], the only food resources available. Moreover, the browsing pressure on north-facing slopes affects class B trees longer than south-facing slopes, because the snowpack is deeper and lasts for more time [39]. We hypothesize that, under high ungulate density conditions, this difference of browsing pressure among different slope orientations may be affected by higher intraspecific competition in preferred areas, which forces some ungulates to frequent northern sites [40].
Both GLMs revealed that browsing pressure was higher in mature forest stands. Browsing probability of size class B plants was positively related to basal area, and negatively associated with tree density, suggesting that ungulates spent more time in mature stands with few large trees than in stands with many smaller trees. These preferences may be due to the difficulties large herbivores face in moving across dense stands, and to greater richness in food resources in the understory layer of mature forests. Indeed, in mature stands, more light reaches the ground, leading to higher seedling and sapling density and higher shrub abundance [41]. This hypothesis is also partially confirmed by the results from GLM for size class A plants, which show that basal area had the same positive effect shown by class B plants, even though tree density did not influence browsing probability.
Lastly, our analysis confirmed that the most powerful driver of browsing pressure was palatability. Species known to be highly palatable such as rowan, beech, silver fir and other broadleaf trees had the highest probability of being browsed. The tender shoots of broadleaf trees and the needles of silver fir are extremely important in the winter diet of ungulates, because they provide energy and nutrients when other food resources are scarce, making them fundamental for survival [42]. On the other hand, species like Norway spruce, stone Pine and European larch have lower digestibility and lower metabolizable energy content, which make them a lower quality food resource [32].
Other factors we did not consider in this study could have played a role in ungulate–forest interactions, such as weather, human disturbance or landscape heterogeneity at larger scales. Fine-scale weather variability (e.g., temperature, moisture, wind chill or snow cover) can strongly affect herbivore movement [43] in ways that are not captured by topographical proxies. Additionally, these effects vary between seasons, i.e., the movement rate of deer is negatively related to cold temperatures during winter, and negatively related to high temperature in summer [44]. Unmeasured human disturbances (e.g., variable hunting pressure, recreation access to forests, or silvicultural activities in logged areas and forest roads) can trigger avoidance responses and force ungulates to change their feeding habits or move to less-disturbed areas [45]. Finally, our sampling design may have failed to capture larger-scale influences of land cover and its heterogeneity, and may be responsible for part of the unexplained variability in our models. An increased interspersion of resources would reduce the distance traveled to gain a particular resource, and, thus, result in smaller levels of movement by deer, especially in winter, when we expect tree browsing to be most intense [46].

4.3. Effects on Specific Composition

Since forest regeneration is a long process, the twenty years covered by this study represent a relatively short period of time in which to observe changes. As a consequence of this limitation, we did not expect to observe large differences in terms of changes in species composition. Nevertheless, we were able to detect small variations in the abundance of each species within our plots. Because we did not mark and measure every plant, we cannot determine whether browsing decreases young tree density by directly killing them or by slowing their growth. We suppose that browsing acted in both ways. We hypothesize that seedlings in size class A may die after a single bite, while saplings of size class B are more resistant, but may die later, mainly due to the loss of competitiveness after prolonged exposure to browsing.
The increase in European rowan density in size class A could be caused by the improvement of seed dispersion and the germination processes facilitated by wild ungulates. Indeed, they are known to act as seed dispersal agents by eating fruits, which pass through their guts, and are released on the ground elsewhere (endozoochory) [47]. This dispersal mechanism is operational, particularly in autumn, when many species, such as European rowan, are fruiting. Furthermore, wild ungulates can disperse seeds in other ways, such as by carrying them on their coats or between their hooves (fur-epizoochory and hoof-epizoochory) [48]. On the other hand, in spite of the increasing density of rowan seedlings, we did not find any increase in the frequency of trees belonging to the upper size classes for this species. This suggests that rowan seedlings are not able to grow and establish, due to high browsing pressure. This bottleneck effect causes the failure of recruitment of larger trees, consistent with what has been observed in other studies [13,49].
The dominance of rowan plants in size class A was replaced by the unpalatable Norway spruce in larger size classes. Such dominance of spruce was well maintained over the study period. However, classes B and C showed a small setback in Norway spruce abundance, likely due to the increased browsing pressure registered on classes A and B that constantly exceeded the tolerable limit for this species [16]. The high ungulate population densities during the period of our study probably increased competition for food and forced some animals to become less selective, leading to a higher consumption of unpalatable plant species [50]. No other significant shifts occurred in species composition, suggesting that palatable species had no chance to recover.

5. Conclusions

This research confirms that overpopulation by ungulates and the resulting heavy browsing pressure on vegetation are powerful forces that shape forest structure and composition. Our results indicate that ungulates browse mostly on trees between 10 and 150 cm of height in mature stands, and that the browsing pressure was consistently higher than the bearable limit for many tree species in our study. We also theorize that browsing on plants in the range of 10–30 cm and browsing on plants between 30–150 cm are seasonally separated events. This study evidences some features of high ungulate density in the study area, such as high amounts of browsing on palatable species, increasing browsing pressure on unpalatable plants, high browsing pressure on less nutritious food resources in unsuitable environments and increasing rowan seeds dispersion. Our results reveal that ungulate overpopulation is indeed currently hampering the regeneration process of European rowan and leading to the dominance of Norway spruce. Moreover, we detected a slight decline in Norway spruce saplings, due to the increased browsing activity of abundant ungulates.
If these impacts continue over the time, they could lead to severe biodiversity losses in the adult tree populations, generating cascading effects on other plant and animal species. Additionally, the reduction of species richness may reduce the resilience of the forest to natural threats, such as fire and windthrows. Further investigations should consider other factors involved in the ungulate–forest interaction. For example, it may be useful to evaluate how the ongoing spread of wolf (Canis lupus L., 1758) will affect the dynamics of browsing, and how it will impact the forest regeneration processes.

Supplementary Materials

The following are available online at https://www.mdpi.com/1999-4907/11/6/612/s1.

Author Contributions

Conceptualization and methodology: R.M. and F.M.; software, validation and formal analysis: M.G., G.V., D.D.; investigation and data curation: D.D., F.M.; writing—original draft preparation, writing—review and editing, and visualization: R.M., D.D., G.V., M.G., F.M., P.P., V.D.; supervision: R.M.; project administration: V.D., P.P.; funding acquisition: V.D., P.P. All authors have read and agreed to the published version of the manuscript.

Funding

This research was funded by Paneveggio, Pale di San Martino Nature Park, grant number 01379620220.

Acknowledgments

The authors thank “Paneveggio” and “San Martino di Castrozza” state forestry stations and Paneveggio, Pale di San Martino Nature Park employees for the logistical and technical support. The authors also thank all the students and colleagues who gave their support during the field activities and made this research possible.

Conflicts of Interest

The authors declare no conflicts of interest.

References

  1. Côté, S.D.; Rooney, T.P.; Tremblay, J.P.; Dussault, C.; Waller, D.M. Ecological Impacts of Deer Overabundance. Annu. Rev. Ecol. Evol. Syst. 2004, 35, 113–147. [Google Scholar] [CrossRef] [Green Version]
  2. Horsley Stephen, B.; Stout Susan, L.; De Calesta, D.S. White-tailed deer impact on the vegetation dynamics of a Northern Hardwood forest. Ecol. Appl. 2003, 13, 98–118. [Google Scholar] [CrossRef]
  3. Ripple, W.J.; Beschta, R.L. Trophic cascades involving cougar, mule deer, and black oaks in Yosemite National Park. Biol. Conserv. 2008, 141, 1249–1256. [Google Scholar] [CrossRef]
  4. Hansen, B.B.; Henriksen, S.; Aanes, R.; Sæther, B.E. Ungulate impact on vegetation in a two-level trophic system. Polar Biol. 2007, 30, 549–558. [Google Scholar] [CrossRef]
  5. Takatsuki, S. Effects of sika deer on vegetation in Japan: A review. Biol Conserv. 2009, 142, 1922–1929. [Google Scholar] [CrossRef]
  6. Husheer, S.W.; Coomes, D.A.; Robertson, A.W. Long-term influences of introduced deer on the composition and structure of New Zealand Nothofagus forests. For. Ecol. Manag. 2003, 181, 99–117. [Google Scholar] [CrossRef]
  7. Vacek, Z. Structure and dynamics of spruce-beech-fir forests in Nature Reserves of the Orlické hory Mts. in relation to ungulate game. Cent. Eur. For. J. 2017, 63, 22–34. [Google Scholar] [CrossRef] [Green Version]
  8. Motta, R. Impact of wild ungulates on forest regeneration and tree composition of mountain forests in the Western Italian Alps. For. Ecol. Manag. 1996, 88, 93–98. [Google Scholar] [CrossRef]
  9. Witt, J.C.; Webster, C.R. Regeneration dynamics in remnant Tsuga canadensis stands in the northern Lake States: Potential direct and indirect effects of herbivory. For. Ecol. Manag. 2010, 260, 519–525. [Google Scholar] [CrossRef]
  10. Hidding, B.; Tremblay, J.P.; Côté, S.D. Survival and growth of balsam fir seedlings and saplings under multiple controlled ungulate densities. For. Ecol. Manag. 2012, 276, 96–103. [Google Scholar] [CrossRef]
  11. Rooney, T.P.; Waller, D.M. Direct and indirect effects of white-tailed deer in forest ecosystems. For. Ecol. Manag. 2003, 181, 165–176. [Google Scholar] [CrossRef]
  12. Bernard, M.; Boulanger, V.; Dupouey, J.L.; Laurent, L.; Montpied, P.; Morin, X.; Picard, J.F.; Saïd, S. Deer browsing promotes Norway spruce at the expense of silver fir in the forest regeneration phase. For. Ecol. Manag. 2017, 400, 269–277. [Google Scholar] [CrossRef]
  13. Churski, M.; Bubnicki, J.W.; Jędrzejewska, B.; Kuijper, D.P.J.; Cromsigt, J.P.G.M. Brown world forests: Increased ungulate browsing keeps temperate trees in recruitment bottlenecks in resource hotspots. New Phytol. 2017, 214, 158–168. [Google Scholar] [CrossRef] [Green Version]
  14. Motta, R. Ungulate impact on rowan (Sorbus aucuparia L.) and Norway spruce (Picea abies (L.) Karst.) height structure in mountain forests in the eastern Italian Alps. For. Ecol. Manag. 2003, 181, 139–150. [Google Scholar] [CrossRef]
  15. Didion, M.; Kupferschmid, A.D.; Bugmann, H. Long-term effects of ungulate browsing on forest composition and structure. For. Ecol. Manag. 2009, 258, 44–55. [Google Scholar] [CrossRef]
  16. Eiberle, K.; Nigg, H. Grundlagen zur Beurteilung des Wildverbisses im Gebirgswald. Schweiz. Z. Forstwes. 1987, 138, 747–785. [Google Scholar]
  17. Mencuccini, M.; Piussi, P.; Zanzi Sulli, A. Thirty years of seed production in a subalpine Norway spruce forest: Patterns of temporal and spatial variation. For. Ecol. Manag. 1995, 76, 109–125. [Google Scholar] [CrossRef]
  18. Brüllhardt, M.; Risch, A.C.; Filli, F.; Haller, R.M.; Schütz, M. Spatiotemporal dynamics of natural tree regeneration in unmanaged subalpine conifer forests with high wild ungulate densities. Can. J. For. Res. 2015, 45, 607–614. [Google Scholar] [CrossRef]
  19. Loison, A.; Toïgo, C.; Gaillard, J.M. Large Herbivores in European Alpine Ecosystems: Current Status and Challenges for the Future. In Alpine Biodiversity in Europe. Ecological Studies (Analysis and Synthesis); Nagy, L., Grabherr, G., Körner, C., Thompson, D.B.A., Eds.; Springer: Berlin, Germany, 2003; Volume 167. [Google Scholar]
  20. Motta, R.; Franzoi, M. Foreste di montagna ed ungulati selvatici nel Parco naturale di Paneveggio–Pale di S. Martino (TN). Dendronatura 1997, 18, 15–32. [Google Scholar]
  21. Apollonio, M.; Chirichella, R.; De Marinis, A.M.; Bazzanella, G.; Brugnoli, A.; Ferraro, E.; Giovannini, R.; Luchesa, L.; Rocca, M.; Zambotti, S. Camoscio, cervo e capriolo in Trentino. Rapporto su status e gestione. Quad. Assoc. Cacciatori Trentini 2019, 1, 248. [Google Scholar]
  22. Associazione Cacciatori Trentini. Relazioni Annuali Cervo (Cervus Elaphus Hippelaphus, L. 1758), Distretti Faunistici di Fassa, Fiemme e Primiero; Relazioni interne delle Consulte di Fassa: Fiemme e Primiero, Italy, 2019. [Google Scholar]
  23. Turchetto, S.; Obber, F.; Permunian, R.; Vendrami, S.; Lorenzetto, M.; Ferré, N.; Stancampiano, L.; Rossi, L.; Citterio, C.V. Spatial and temporal explorative analysis of sarcoptic mange in Alpine chamois (Rupicapra rupicapra). Hystrix, It. J. Mamm 2014, 25. [Google Scholar] [CrossRef]
  24. Lovari, S.; Ferretti, F.; Corazza, M.; Minder, I.; Troiani, N.; Ferrari, C.; Saddi, A. Unexpected consequences of reintroductions: Competition between reintroduced red deer and Apennine chamois. Anim. Conserv. 2014, 17, 359–370. [Google Scholar] [CrossRef]
  25. Richard, E.; Gaillard, J.M.; Saïd, S.; Hamann, J.L.; Klein, F. High red deer density depresses body mass of roe deer fawns. Oecologia 2010, 163, 91–97. [Google Scholar] [CrossRef]
  26. Hair Jr, J.F.; Anderson, R.E.; Tatham, R.L.; Black, W.C. Multivariate Data Analysis, 5th ed.; Prentice-Hall: Upper Saddle River, NJ, USA, 1998. [Google Scholar]
  27. Coulombe, M.L.; Huot, J.; Massé, A.; Côté, S.D. Influence of forage biomass and cover on deer space use at a fine scale: A controlled-density experiment. Ecoscience 2011, 18, 262–272. [Google Scholar] [CrossRef]
  28. Anderwald, P.; Haller, R.M.; Filli, F. Heterogeneity in primary productivity influences competitive interactions between Red deer and Alpine chamois. PLoS ONE 2016, 11, e0146458. [Google Scholar] [CrossRef] [Green Version]
  29. Giroux, M.-A.; Dussault, C.; Tremblay, J.P.; Côté, S.D. Winter severity modulates the benefits of using a habitat temporally uncoupled from browsing. Ecosphere 2016, 7, e01432. [Google Scholar] [CrossRef]
  30. Provincia Autonoma di Trento. Quaderno di Nivologia n°29, Stagione Invernale 2011-’12; Pubblicazione interna a cura dell’Ufficio Previsioni e Pianificazione, Servizio Prevenzione Rischi; Dipartimento Protezione Civile: Trento (TN), Italy, 2015.
  31. Renaud, P.; Verheyden-Tixier, H.; Dumont, B. Damage to saplings by red deer (Cervus elaphus): Effect of foliage height and structure. For. Ecol. Manag. 2003, 181, 31–37. [Google Scholar] [CrossRef]
  32. Kamler, J.; Homolka, M. Needles in faeces: An index of quality of wild ungulate winter diet. Folia Zool. 2011, 60, 63–69. [Google Scholar] [CrossRef]
  33. Stewart, K.M.; Bowyer, R.T.; Dick, B.L.; Kie, J.G. Effects of density dependence on diet composition of North American elk Cervus elaphus and mule deer Odocoileus hemionus: An experimental manipulation. Wildlife Biol. 2011, 17, 417–430. [Google Scholar] [CrossRef] [Green Version]
  34. Barbier, S.; Gosselin, F.; Belandier, P. Influence of tree species on understory vegetation diversity and mechanisms involved—A critical review for temperate and boreal forests. For. Ecol. Manag. 2008, 254, 1–15. [Google Scholar] [CrossRef]
  35. Herfindal, I.; Tremblay, J.-P.; Hester, A.J.; Lande, U.S.; Wam, H.K. Associational relationships at multiple spatial scales affect forest damage by moose. For. Ecol. Manag. 2015, 348, 97–107. [Google Scholar] [CrossRef] [Green Version]
  36. Dumont, A.; Ouellet, J.P.; Crête, M.; Huot, J. Winter foraging strategy of white-tailed deer at the northern limit of its range. Écoscience 2005, 12, 476–484. [Google Scholar] [CrossRef]
  37. Anderson, B.T.; McNamara, J.P.; Marshall, H.; Flores, A.N. Insights into the physical processes controlling correlations between snow distribution and terrain properties. Water Resour. Res. 2014, 50, 4545–4563. [Google Scholar] [CrossRef]
  38. Gilbert, S.L.; Hundertmark, K.J.; Person, D.K.; Lindberg, M.S.; Boyce, M.S. Behavioral plasticity in a variable environment: Snow depth and habitat interactions drive deer movement in winter. J. Mammal. 2017, 98, 246–259. [Google Scholar] [CrossRef] [Green Version]
  39. Parker, K.L.; Robbins, C.T.; Hanley, T.A. Energy expenditures for locomotion by mule deer and elk. J. Wildl. Manage. 1984, 48, 474–488. [Google Scholar] [CrossRef]
  40. Ceacero, F.; Garcia, A.J.; Landete-Castillejos, T.; Bartošová, J.; Bartoš, L.; Gallego, L. Benefits for Dominant Red Deer Hinds under a Competitive Feeding System: Food Access Behavior, Diet and Nutrient Selection. PLoS ONE 2012, 7, e32780. [Google Scholar] [CrossRef] [Green Version]
  41. Lochhead, K.D.; Comeau, P.G. Relationships between forest structure, understorey light and regeneration in complex Douglas-fir dominated stands in south-eastern British Columbia. For. Ecol. Manag. 2012, 284, 12–22. [Google Scholar] [CrossRef]
  42. Häsler, H.; Senn, J. Ungulate browsing on European silver fir Abies alba: The role of occasions, food shortage and diet preferences. Wildlife Biol. 2012, 18, 67–74. [Google Scholar] [CrossRef] [Green Version]
  43. Beier, P.; McCullough, D.R. Factors influencing white-tailed deer activity patterns and habitat use. Wildl. Monogr. 1990, 109, 5–51. [Google Scholar]
  44. Webb, S.L.; Gee, K.L.; Strickland, B.K.; Demarais, S.; De Young, R.W. Measuring fine-scale white-tailed deer movements and environmental influences using GPS collars. Int. J. Ecol. 2010, 2010, 459610. [Google Scholar] [CrossRef] [Green Version]
  45. Bonnot, N.; Morellet, N.; Verheyden, H.; Cargnelutti, B.; Lourtet, B.; Klein, F.; Hewison, A.M. Habitat use under predation risk: Hunting, roads and human dwellings influence the spatial behaviour of roe deer. Eur. J. Wildl. Res. 2013, 59, 185–193. [Google Scholar] [CrossRef]
  46. Williams, D.M.; Quinn, A.C.D.; Porter, W.F. Landscape effects on scales of movement by white-tailed deer in an agricultural–forest matrix. Landsc. Ecol. 2012, 27, 45–57. [Google Scholar] [CrossRef]
  47. Jara-Guerrero, A.; Escribano-Avila, G.; Espinosa, C.I.; De la Cruz, M.; Méndez, M. White-tailed deer as the last megafauna dispersing seeds in Neotropical dry forests: The role of fruit and seed traits. Biotropica 2018, 50, 169–177. [Google Scholar] [CrossRef]
  48. Albert, A.; Auffret, A.G.; Cosyns, E.; Cousins, S.A.O.; D’hondt, B.; Eichberg, C.; Eycott, A.E.; Heinken, T.; Hoffmann, M.; Jaroszewicz, B.; et al. Seed dispersal by ungulates as an ecological filter: A trait-based meta-analysis. Oikos 2015, 124, 1109–1120. [Google Scholar] [CrossRef]
  49. Simončič, T.; Bončina, A.; Jarni, K.; Klopčič, M. Assessment of the long-term impact of deer on understory vegetation in mixed temperate forests. J. Veg. Sci. 2019, 30, 108–120. [Google Scholar] [CrossRef] [Green Version]
  50. Lecomte, X.; Fedriani, J.M.; Caldeira, M.C.; Clemente, A.S.; Olmi, A.; Bugalho, M.N. Too Many Is Too Bad: Long-Term Net Negative Effects of High Density Ungulate Populations on a Dominant Mediterranean Shrub. PLoS One 2016, 11, e0158139. [Google Scholar] [CrossRef] [PubMed]
Figure 1. Mean values of percentage of browsed trees in size classes A and B (red line and blue line respectively). The dotted lines represent the browsing thresholds suggested by Eiberle and Nigg, 1987 [16].
Forests 11 00612 g001
Figure 2. Effect size with standard errors resulting from GLMs for size class A (red circles) and B (blue squares).
Forests 11 00612 g002
Figure 3. Barplots of species composition and Non-Metric Multidimensional Scaling (nMDS) plots with 95% confidence interval ellipses for each year, within each size class (from top to bottom AD).
Forests 11 00612 g003
Table 1. Mean values of percentage of damaged trees per damage type within the plots and mean values of percentage of browsed trees for size classes (A–D). Standard deviation is reported in parentheses as a measure of statistical dispersion.
VariableClassification1994200320082014
% Damaged Treesbrowsing11 (20)16 (27)24 (31)16 (26)
fraying4 (10)2 (9)3 (10)4 (12)
bark stripping01 (4)1 (5)3 (11)
% Browsed TreesA22 (28)27 (28)42 (33)36 (29)
B22 (23)28 (33)36 (34)21 (28)
C3 (9)6 (17)13 (27)4 (14)
D0 (0)1 (4)2 (3)2 (11)

