
Exploration of Key Process Parameters and Properties of 40Cr Steel in Ultrasonic Surface Rolling Process
 , , ,
, , ,
Abstract
:1. Introduction
2. Theoretical Model
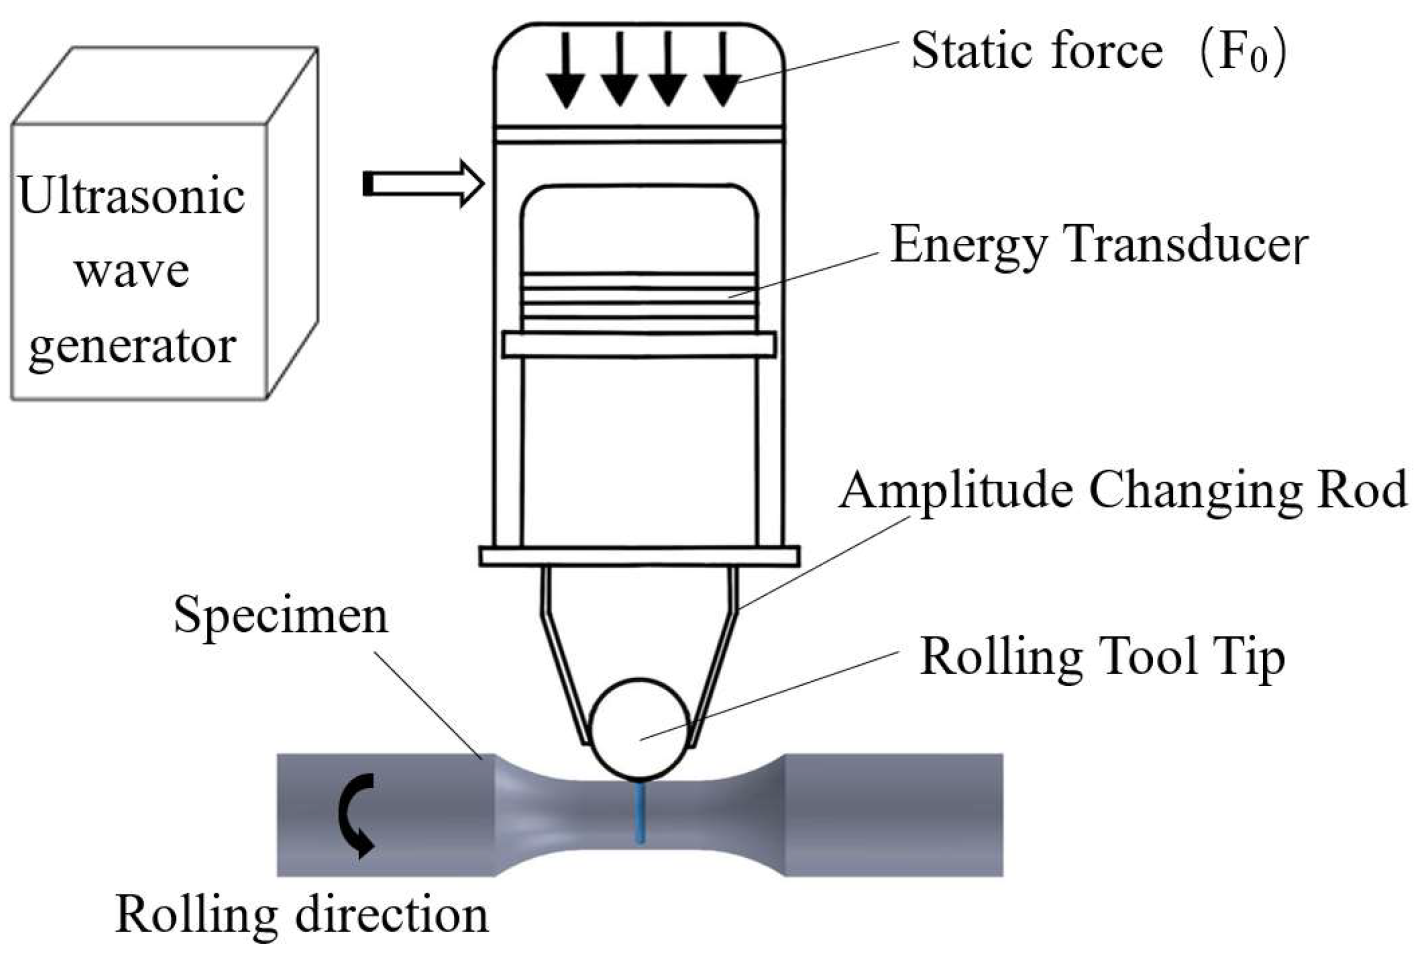
2.1. Description of Ultrasonic Surface Rolling Process
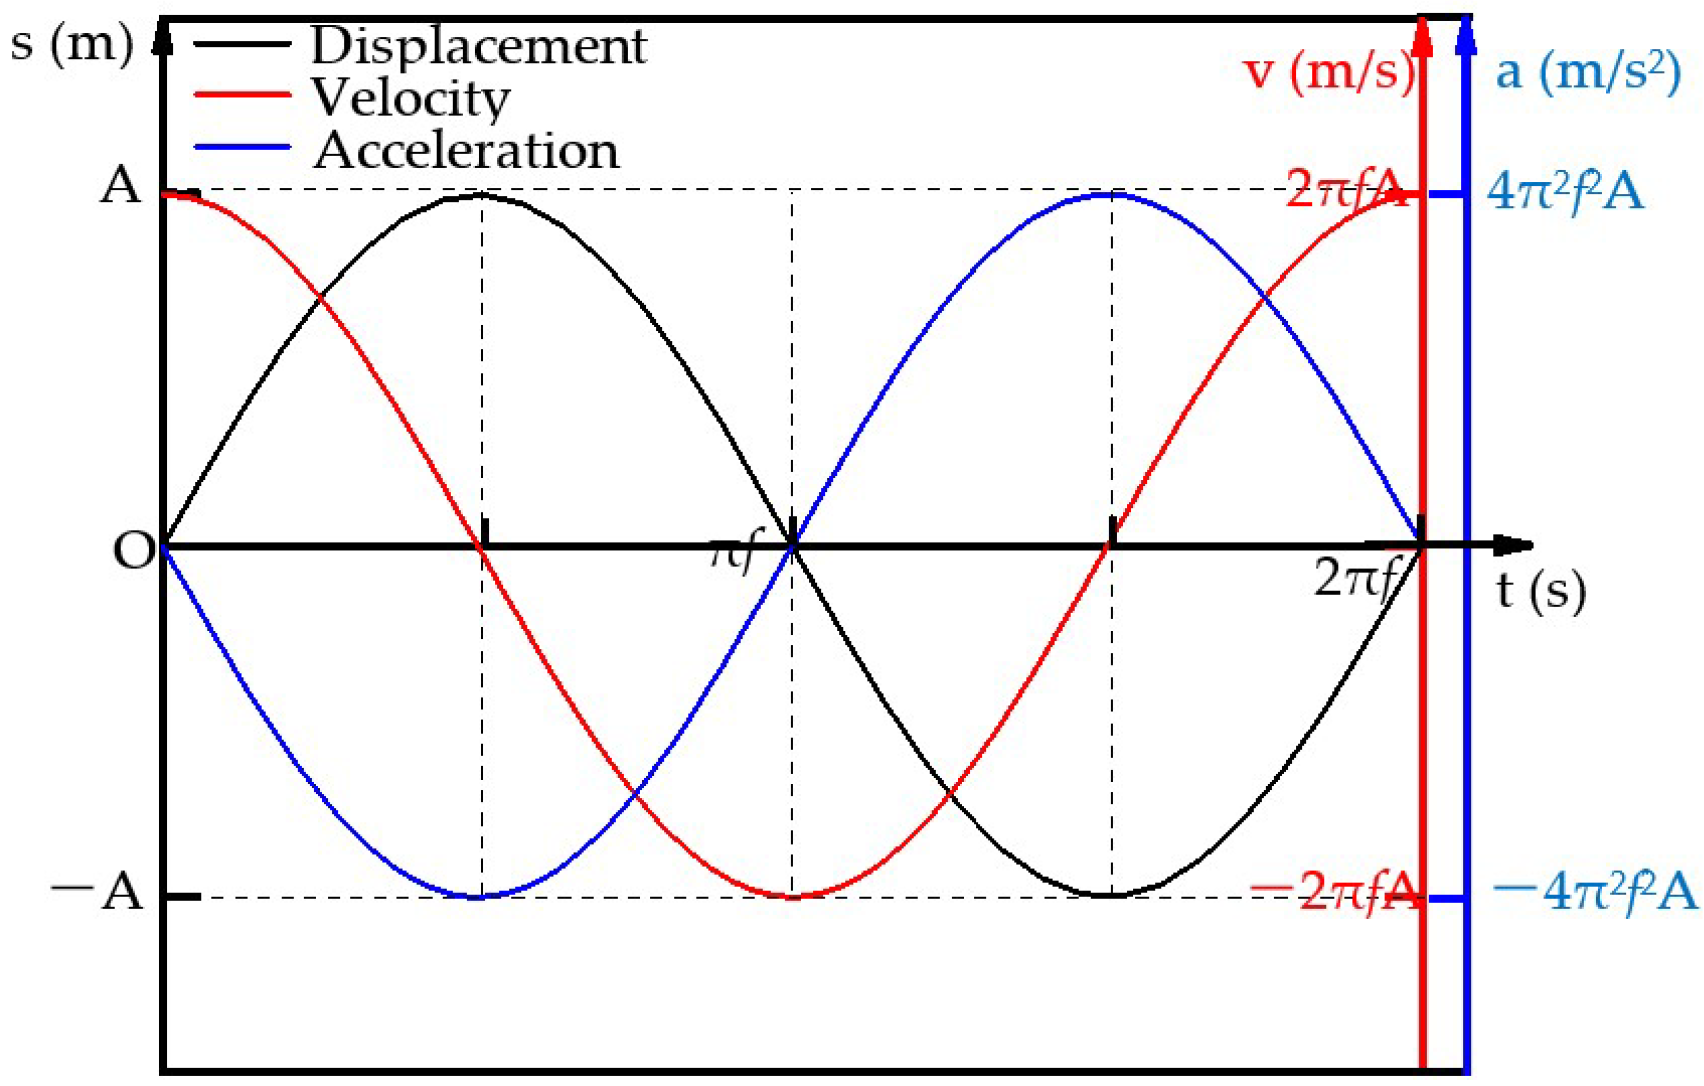
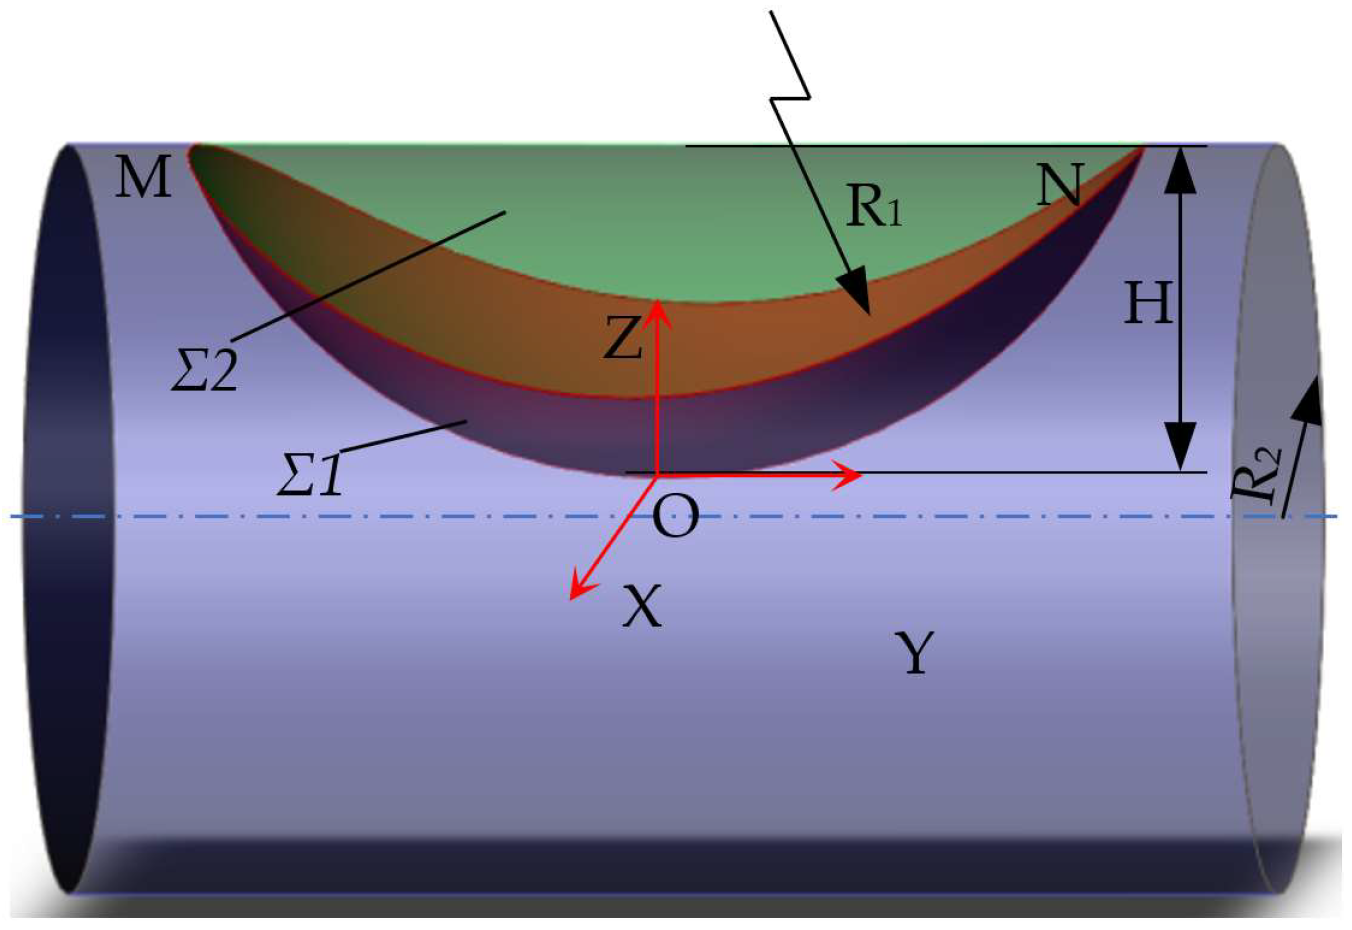
2.2. Theoretical Model of Ultrasonic Rolling Static Force
3. Ultrasonic Rolling Finite Element Simulation
3.1. Material Model
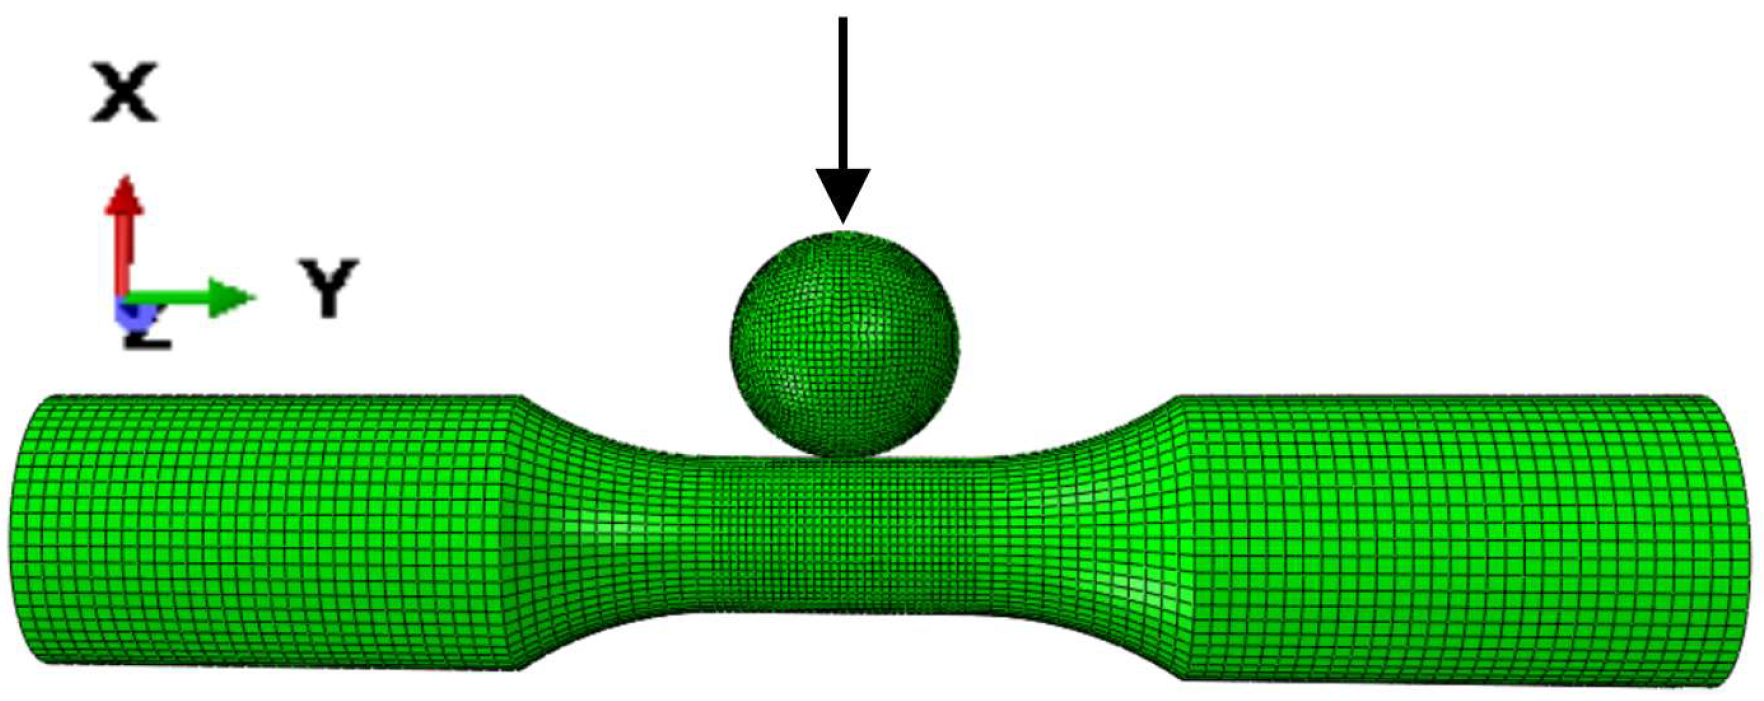
3.2. Parameter Settings and Boundary Conditions
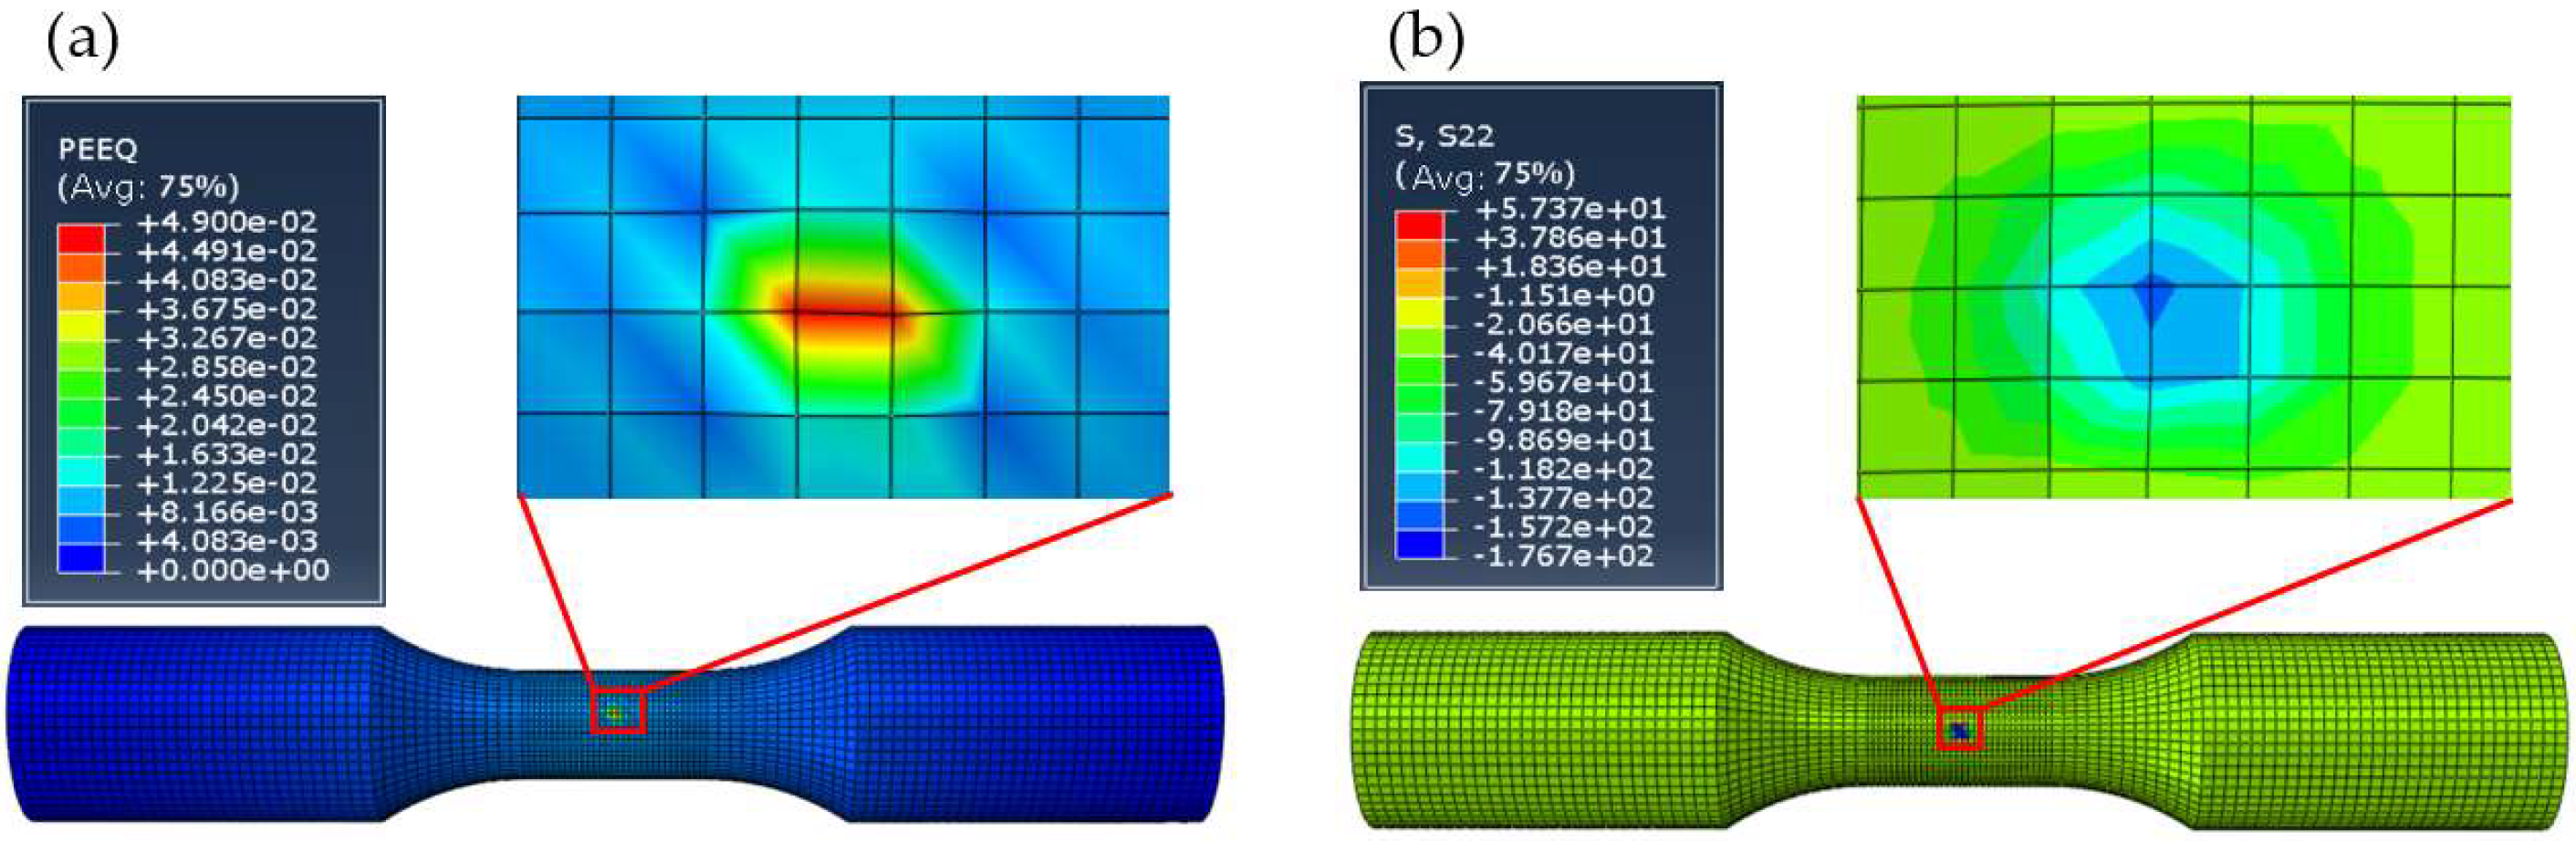
3.3. Simulation Results and Analysis
4. Ultrasonic Rolling Experiment
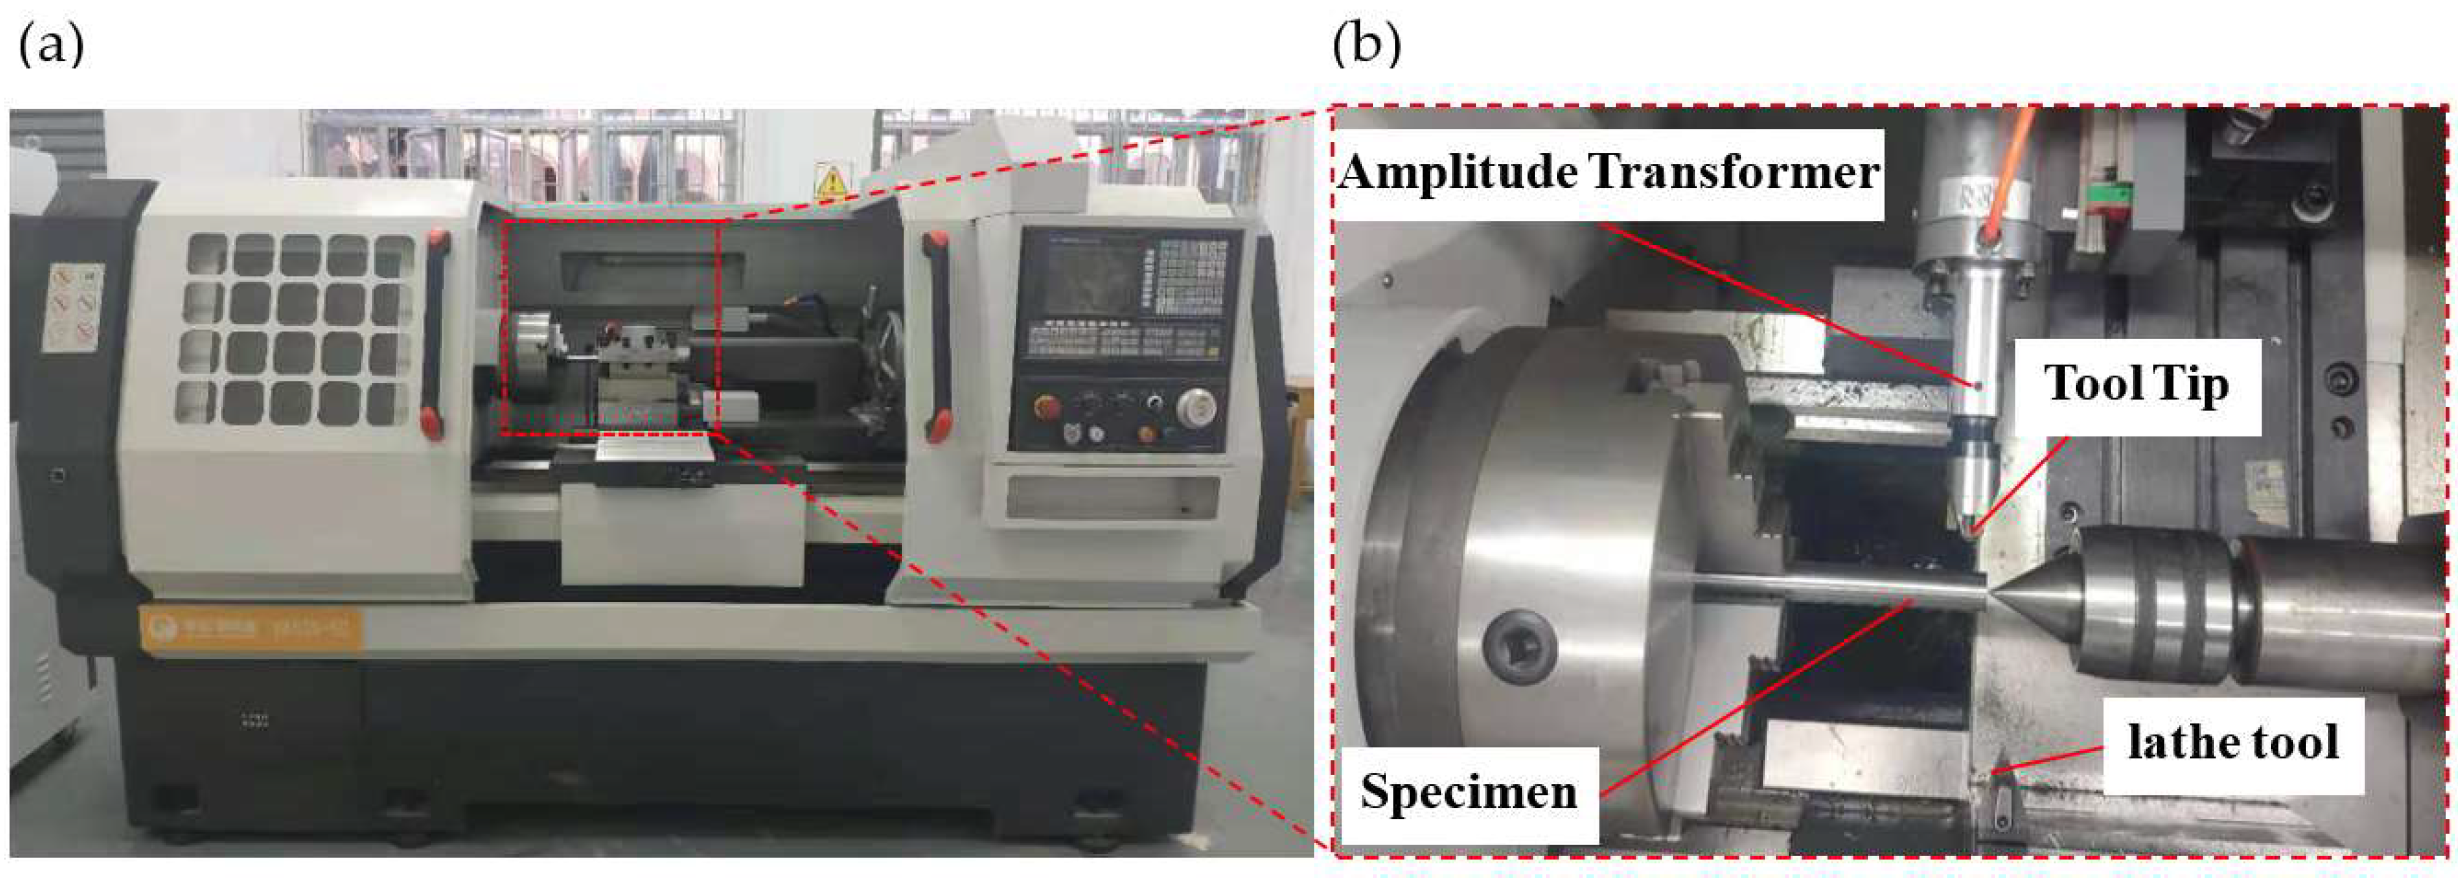
4.1. Experimental Equipment and Scheme
4.2. Experimental Results and Analysis
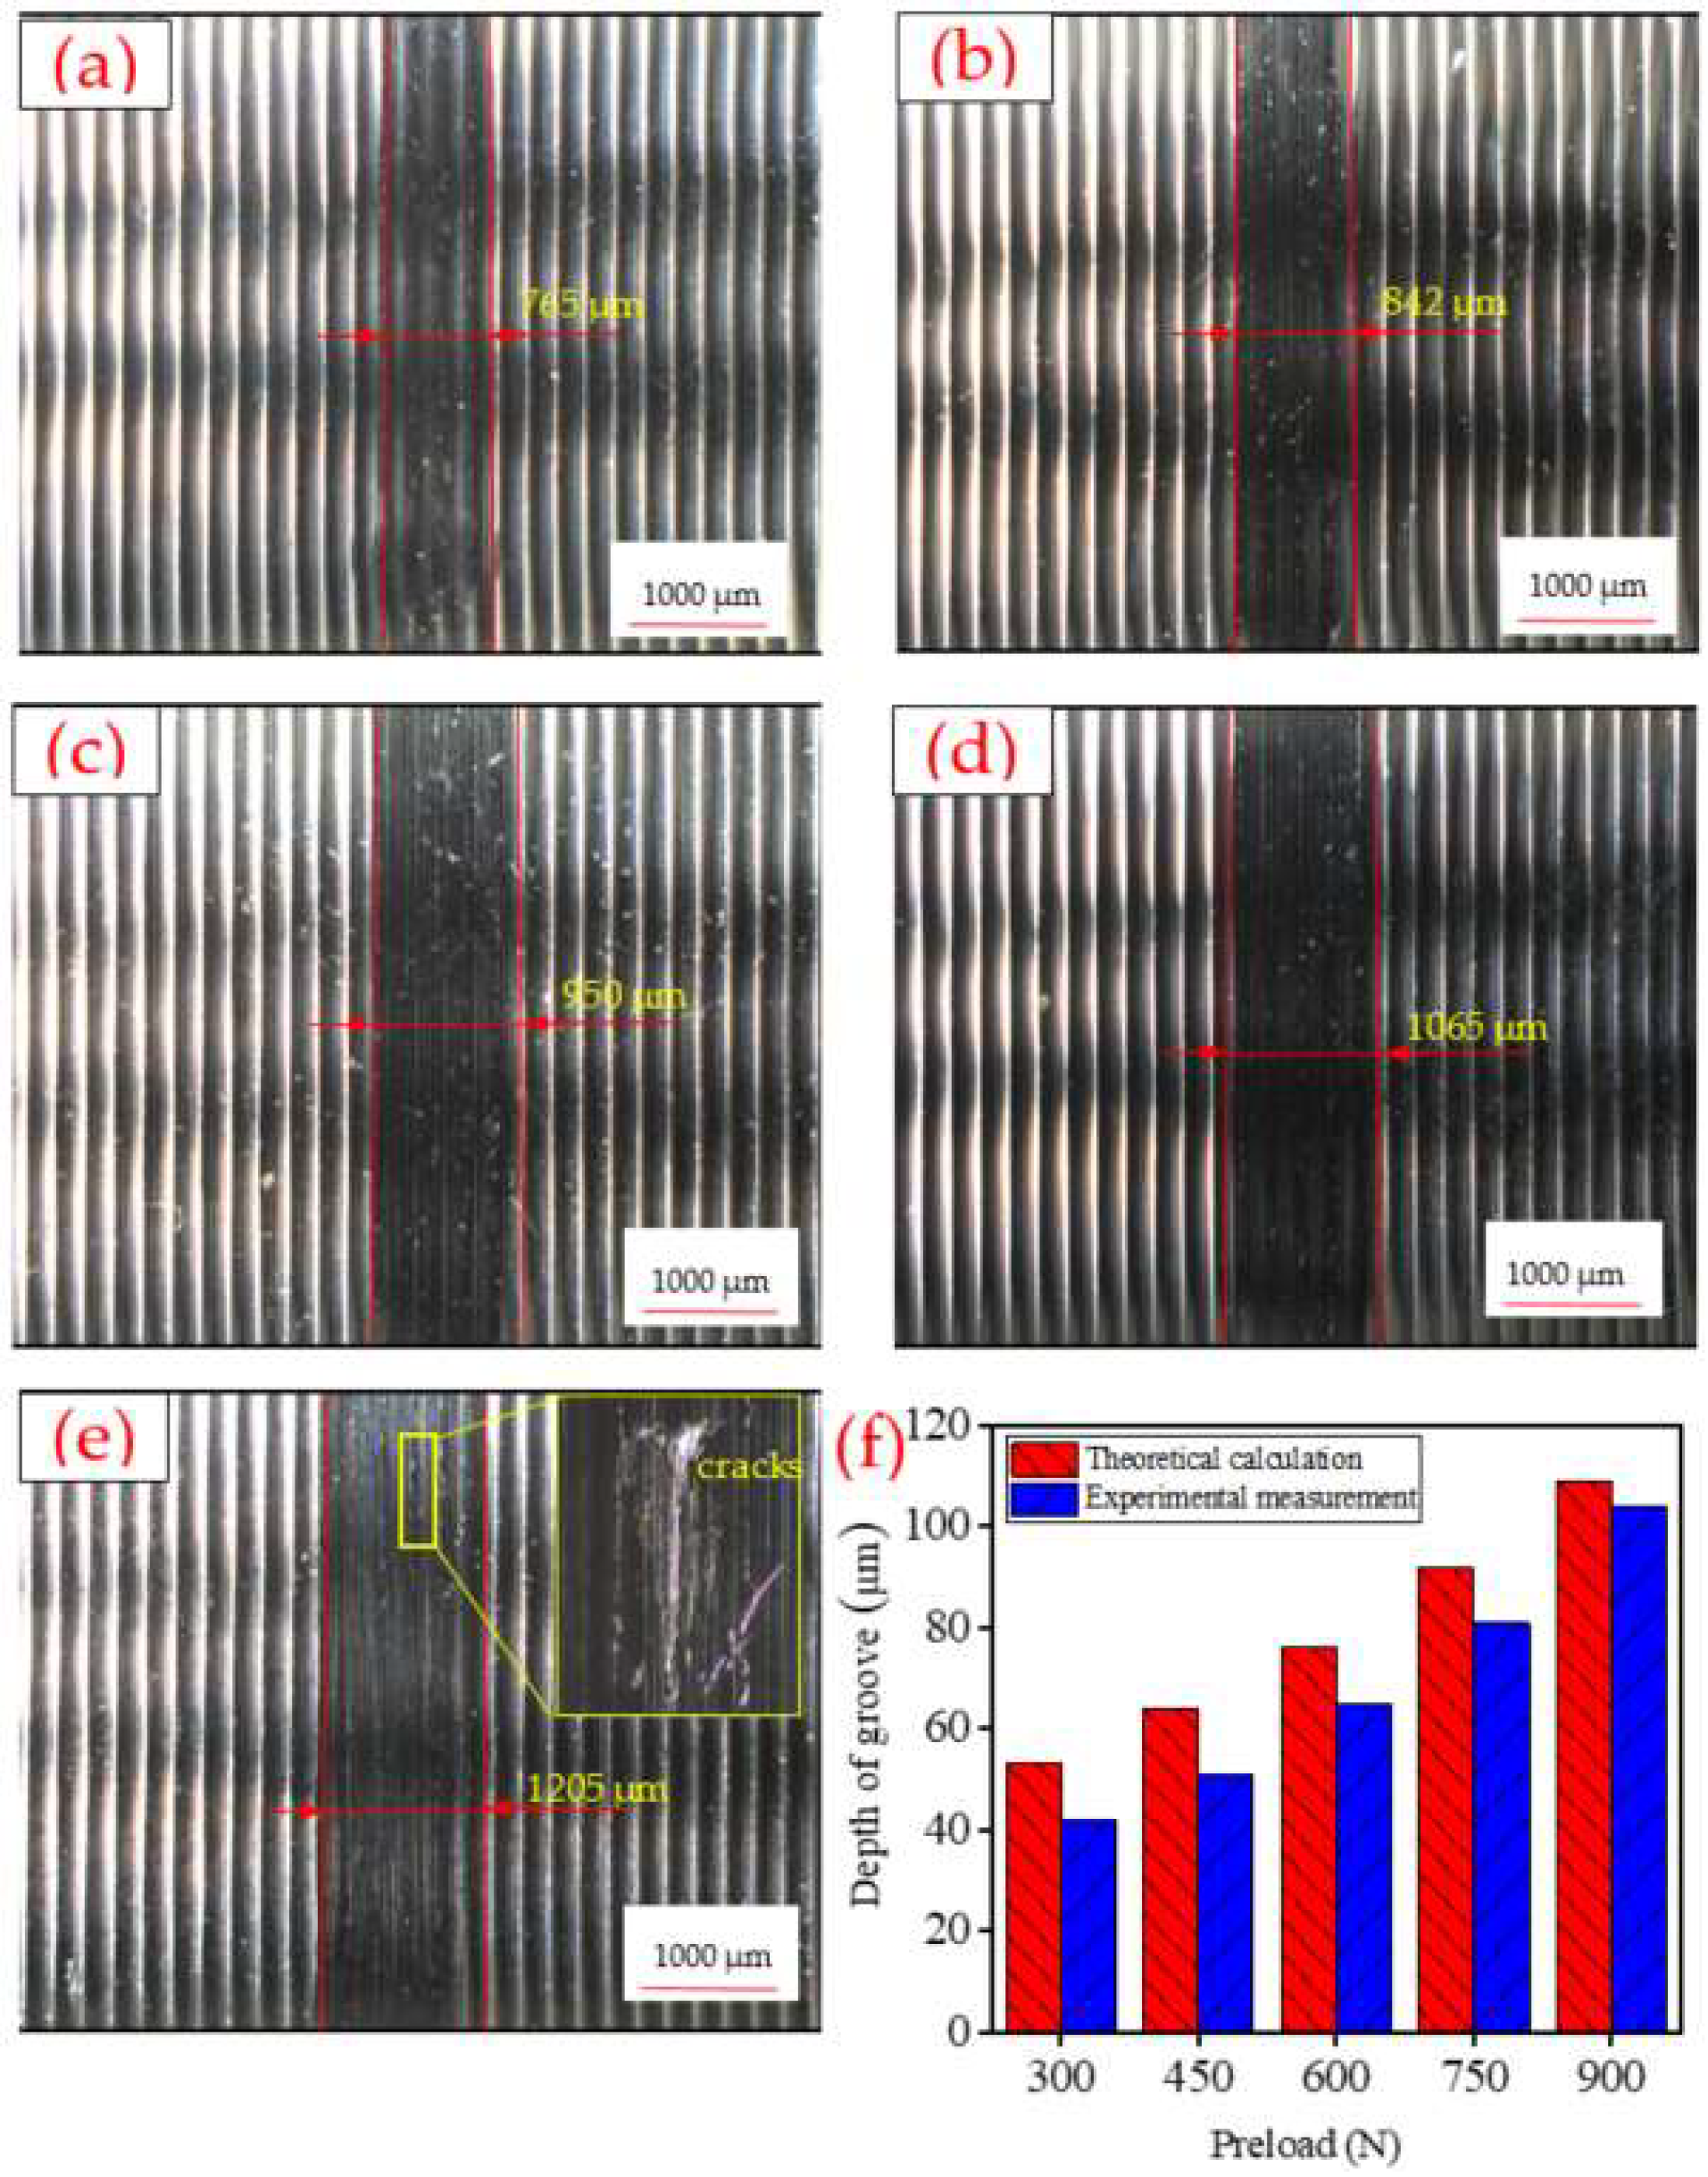
4.2.1. Ultrasonic Rolling Groove Morphologies
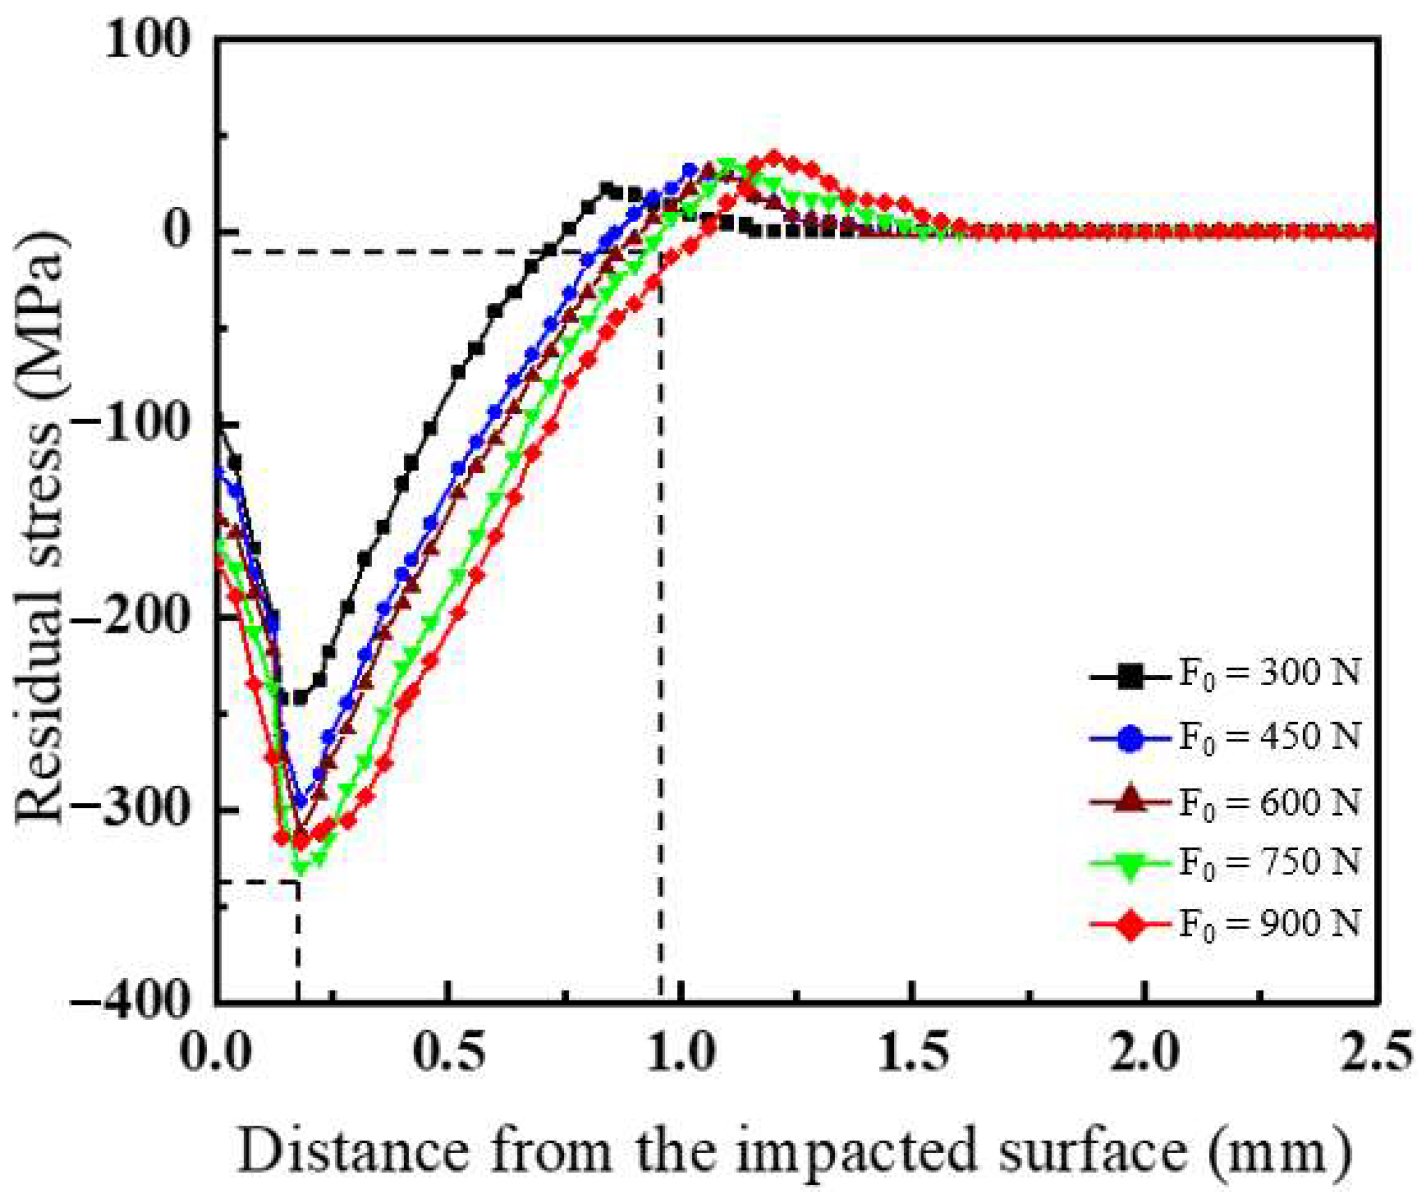
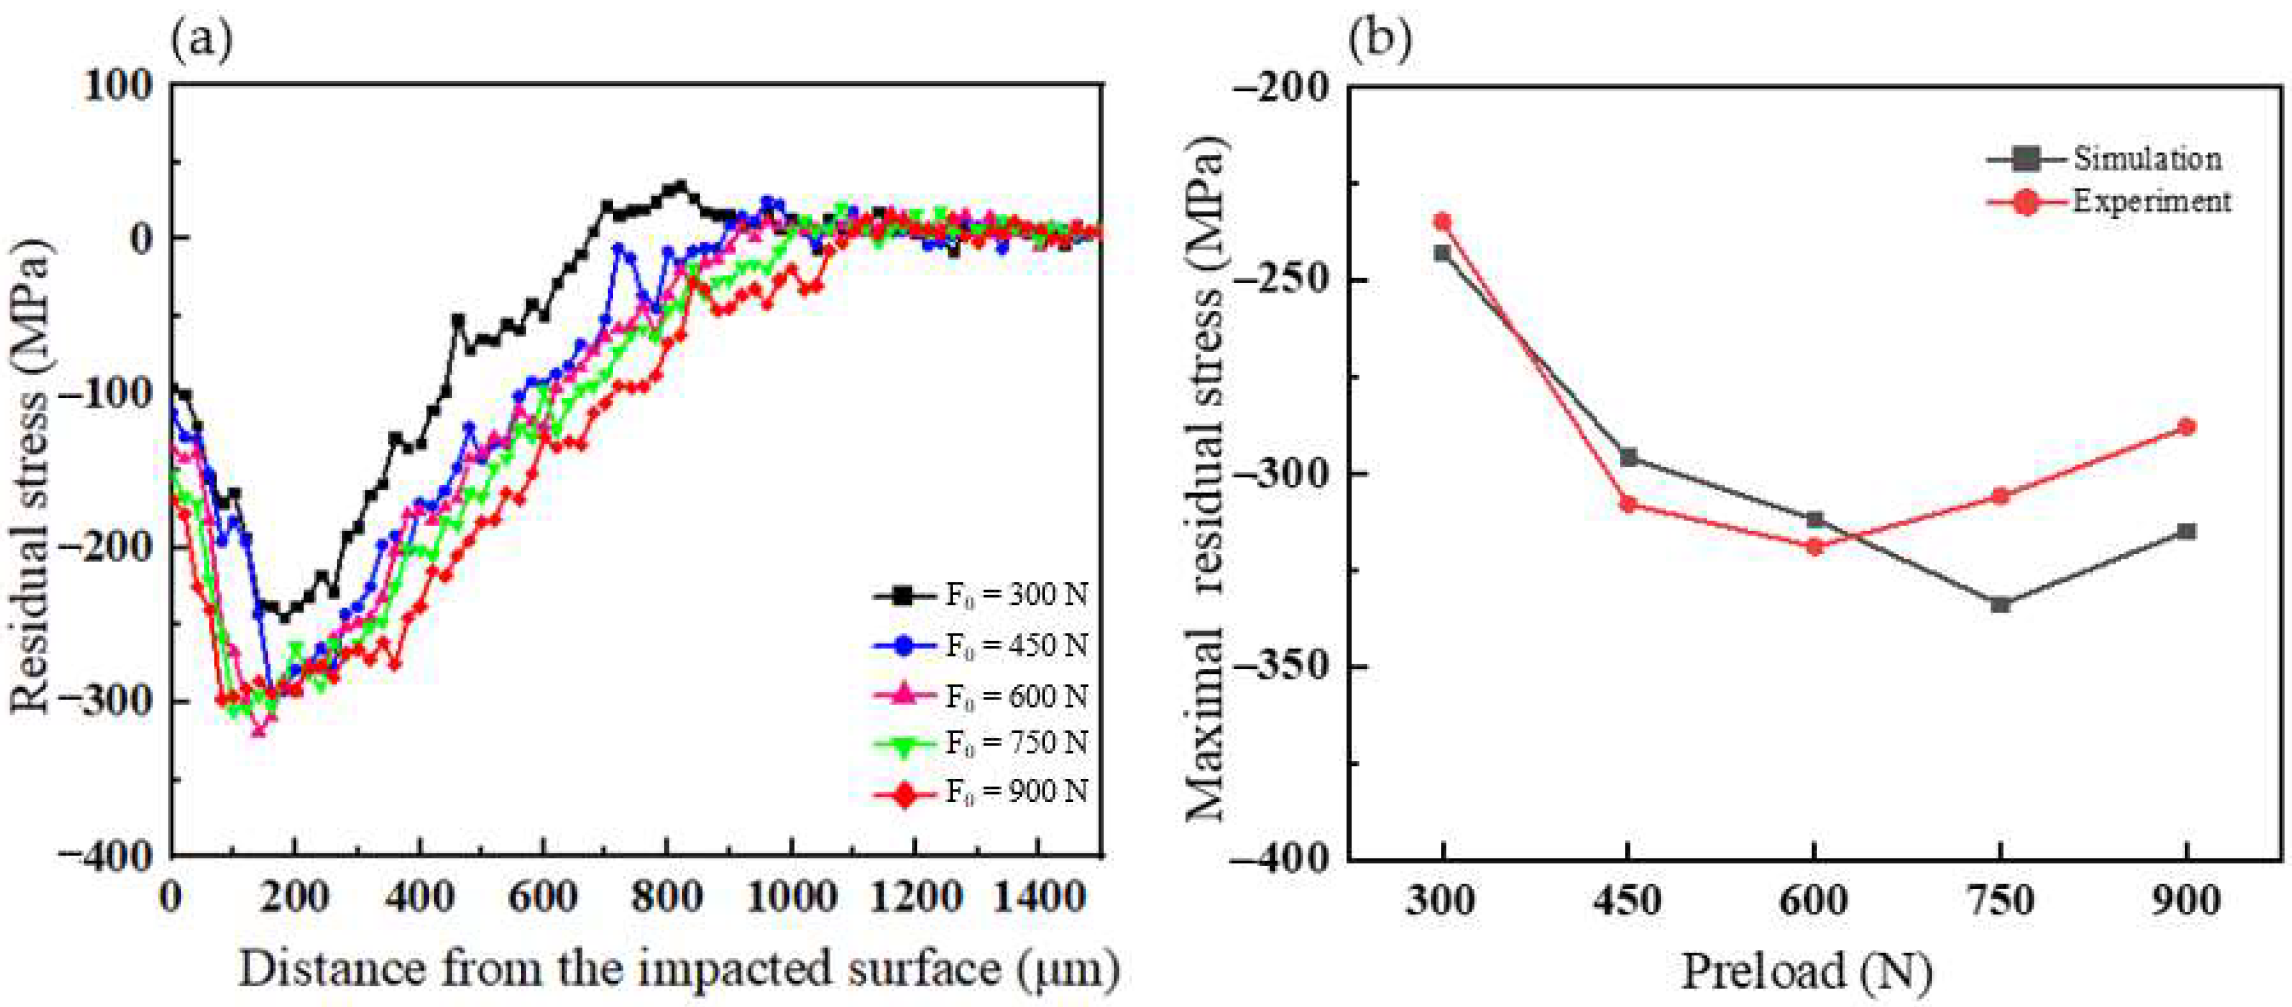
4.2.2. Residual Stress Distribution
5. Conclusions
Author Contributions
Funding
Institutional Review Board Statement
Informed Consent Statement
Data Availability Statement
Conflicts of Interest
References
- Gao, Y.; Zhao, Z. Surface integrity of gears and the development trend of fatigue-resistant manufacturing technology. Met. Heat Treat. 2014, 39, 1–6. (In Chinese) [Google Scholar] [CrossRef]
- Zerbst, U.; Madia, M.; Klinger, C.; Bettge, D.; Murakami, Y. Defects as a root cause of fatigue failure of metallic components. III: Cavities, dents, corrosion pits, scratches. Eng. Fail. Anal. 2019, 97, 759–776. [Google Scholar] [CrossRef]
- Soyama, H.; Korsunsky, A.M. A critical comparative review of cavitation peening and other surface peening methods. J. Mater. Process. Technol. 2022, 305, 117586. [Google Scholar] [CrossRef]
- Lin, Q.; Liu, H.; Zhu, C.; Parker, R.G. Investigation on the effect of shot peening coverage on the surface integrity. Appl. Surf. Sci. 2019, 489, 66–72. [Google Scholar] [CrossRef]
- Lee, S.; Yu, K.; Huh, H.; Kolman, R.; Arnoult, X. Dynamic Hardening of AISI 304 Steel at a Wide Range of Strain Rates and Its Application to Shot Peening Simulation. Metals 2022, 12, 403. [Google Scholar] [CrossRef]
- Wang, T.; Yang, L.; Tang, Z.; Wu, L.; Yan, H.; Liu, C.; Ma, Y.; Liu, W.; Yu, Z. Microstructure, mechanical properties and deformation mechanism of powder metallurgy AZ31 magnesium alloy during rolling. Mater. Sci. Eng. A 2022, 844, 143042. [Google Scholar] [CrossRef]
- Liu, R.; Yuan, S.; Lin, N.; Zeng, Q.; Wang, Z.; Wu, Y. Application of ultrasonic nanocrystal surface modification (UNSM) technique for surface strengthening of titanium and titanium alloys: A mini review. J. Mater. Res. Technol. 2021, 11, 351–377. [Google Scholar] [CrossRef]
- Ye, C.; Telang, A.; Gill, A.S.; Suslov, S.; Idell, Y.; Zweiacker, K.; Wiezorek, J.M.K.; Zhou, Z.; Qian, D.; Mannava, S.R.; et al. Gradient nanostructure and residual stresses induced by Ultrasonic Nano-crystal Surface Modification in 304 austenitic stainless steel for high strength and high ductility. Mater. Sci. Eng. A 2014, 613, 274–288. [Google Scholar] [CrossRef]
- Dou, Z.; Jiang, H.; Ao, R.; Luo, T.; Zhang, D. Improving the Surface Friction and Corrosion Resistance of Magnesium Alloy AZ31 by Ion Implantation and Ultrasonic Rolling. Coatings 2022, 12, 899. [Google Scholar] [CrossRef]
- Darisuren, S.; Park, J.; Pyun, Y.; Amanov, A. A Study on the Improvement of the Fatigue Life of Bearings by Ultrasonic Nanocrystal Surface Modification Technology. Metals 2019, 9, 1114. [Google Scholar] [CrossRef] [Green Version]
- Safyari, M.; Moshtaghi, M. Role of Ultrasonic Shot Peening in Environmental Hydrogen Embrittlement Behavior of 7075-T6 Alloy. Hydrogen 2021, 2, 377–385. [Google Scholar] [CrossRef]
- Wang, Z.; Xiao, Z.; Huang, C.; Wen, L.; Zhang, W. Influence of Ultrasonic Surface Rolling on Microstructure and Wear Behavior of Selective Laser Melted Ti-6Al-4V Alloy. Materials 2017, 10, 1203. [Google Scholar] [CrossRef] [PubMed]
- Wang, C.; Han, J.; Zhao, J.; Song, Y.; Man, J.; Zhu, H.; Sun, J.; Fang, L. Enhanced Wear Resistance of 316 L Stainless Steel with a Nanostructured Surface Layer Prepared by Ultrasonic Surface Rolling. Coatings 2019, 9, 276. [Google Scholar] [CrossRef]
- Li, G.; Qu, S.; Xie, M.; Ren, Z.; Li, X. Effect of Multi-Pass Ultrasonic Surface Rolling on the Mechanical and Fatigue Properties of HIP Ti-6Al-4V Alloy. Materials 2017, 10, 133. [Google Scholar] [CrossRef] [PubMed]
- Chang, S.; Pyun, Y.; Amanov, A. Wear Enhancement of Wheel-Rail Interaction by Ultrasonic Nanocrystalline Surface Modification Technique. Materials 2017, 10, 188. [Google Scholar] [CrossRef]
- Qu, S.; Hu, X.; Lu, F.; Lai, F.; Liu, H.; Zhang, Y.; Li, X. Rolling contact fatigue properties of ultrasonic surface rolling treated 25CrNi2MoV steel under different lubricant viscosities. Int. J. Fatigue 2021, 142, 105970. [Google Scholar] [CrossRef]
- Yang, J.; Liu, D.; Zhang, X.; Liu, M.; Zhao, W.; Liu, C. The effect of ultrasonic surface rolling process on the fretting fatigue property of GH4169 superalloy. Int. J. Fatigue 2020, 133, 105373. [Google Scholar] [CrossRef]
- Li, F.; Zhao, B. Effect of ultrasonic machining rolling pressure on the surface layer properties of titanium alloy. Surf. Technol. 2019, 48, 34–40. (In Chinese) [Google Scholar] [CrossRef]
- Wang, F.; Men, X.; Liu, Y.; Fu, X. Experiment and simulation study on influence of ultrasonic rolling parameters on residual stress of Ti-6Al-4V alloy. Simul. Model. Pr. Theory 2020, 104, 102121. [Google Scholar] [CrossRef]
- Cheng, M.; Zhang, D.; Chen, H.; Qin, W.; Li, J. Surface nanocrystallization and its effect on fatigue performance of high-strength materials treated by ultrasonic rolling process. Int. J. Adv. Manuf. Technol. 2016, 83, 123–131. [Google Scholar] [CrossRef]
- Li, F.; Zhao, B.; Lan, S.; Feng, Z. Experiment and simulation of the effect of ultrasonic rolling on the surface properties of Ti-6Al-4V. Int. J. Adv. Manuf. Technol. 2019, 106, 1893–1900. [Google Scholar] [CrossRef]
- Liu, Z.; Dai, Q.; Deng, J.; Zhang, Y.; Ji, V. Analytical modeling and experimental verification of surface roughness in the ultrasonic-assisted ball burnishing of shaft targets. Int. J. Adv. Manuf. Technol. 2020, 107, 3593–3613. [Google Scholar] [CrossRef]
- Liu, Y.; Wang, L.; Wang, D. Finite element modeling of ultrasonic surface rolling process. J. Mater. Process. Technol. 2011, 211, 2106–2113. [Google Scholar] [CrossRef]
- Jiao, F.; Lan, S.; Zhao, B.; Wang, Y. Theoretical calculation and experiment of the surface residual stress in the plane ultrasonic rolling. J. Manuf. Process. 2020, 50, 573–580. [Google Scholar] [CrossRef]
- Teimouri, R.; Amini, S. Analytical modeling of ultrasonic surface burnishing process: Evaluation of through depth localized strain. Int. J. Mech. Sci. 2019, 151, 118–132. [Google Scholar] [CrossRef]
- Liu, Y. Research on the Theory and Surface Mechanical Properties of Ultrasonic Rolling Processing on Metal Surfaces. Ph.D. Thesis, Tianjin University, Tianjin, China, 2012. (In Chinese). [Google Scholar]
- Geng, J.; Yan, Z.; Zhang, H.; Dong, P. Effect of ultrasonic surface rolling treatment on the organization and properties of AZ31B magnesium alloy. Surf. Technol. 2022, 51, 368–375. (In Chinese) [Google Scholar] [CrossRef]
- Luo, Q.; Zhao, Z.; He, Z.; Li, Z. Contact fatigue failure mechanism of Surface overhardened M50NiL steel. J. Aeronaut. Mater. 2017, 37, 34–40. (In Chinese) [Google Scholar]


| θ | 0 | 10 | 20 | 30 | 35 | 40 | 45 | 50 |
|---|---|---|---|---|---|---|---|---|
| λ | - | 0.851 | 1.220 | 1.435 | 1.550 | 1.637 | 1.709 | 1.772 |
| θ | 55 | 60 | 65 | 70 | 75 | 80 | 85 | 90 |
| λ | 1.828 | 1.875 | 1.912 | 1.944 | 1.967 | 1.985 | 1.996 | 2.00 |
| Material | Density (kg·m−3) | Young Modulus (MPa) | Poisson Ratio | Tangent Modulus (MPa) | Yield Stress (MPa) |
|---|---|---|---|---|---|
| 40Cr | 7.85 × 10³ | 2.06 × 10⁵ | 0.21 | 230 | 785 |
| WC | 1.45 × 10⁴ | 7.10 × 10⁵ | 0.3 | - | - |
| Material | A (MPa) | (MPa) | C | n | m |
|---|---|---|---|---|---|
| 40Cr | 905 | 226 | 0.03 | 0.26 | 0.83 |
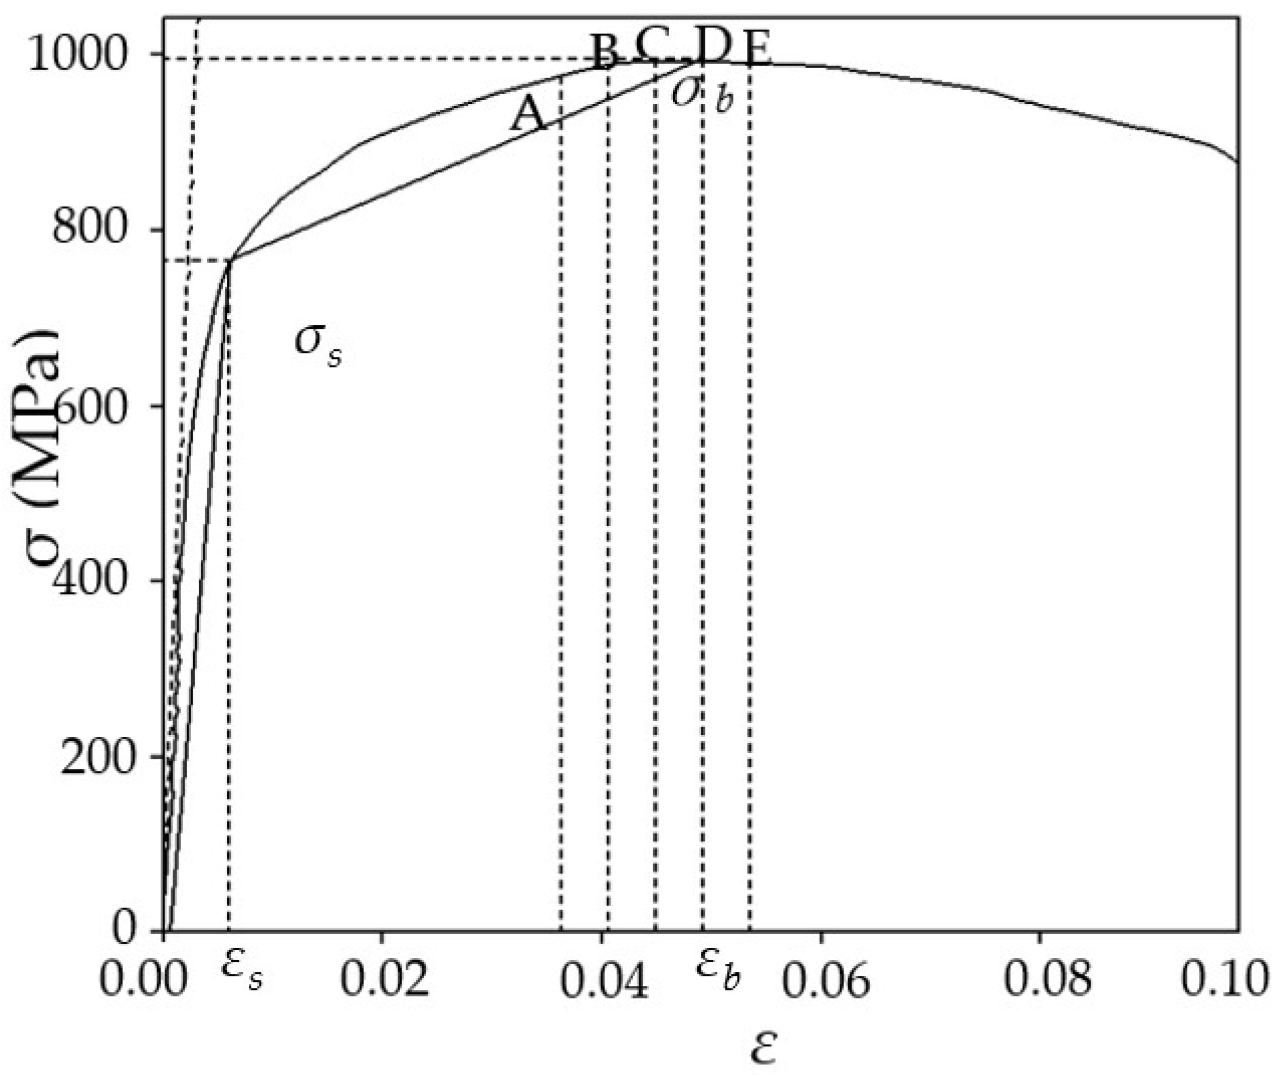
| Point | A | B | C | D | E |
|---|---|---|---|---|---|
| Strain | 0.0355 | 0.0406 | 0.0454 | 0.0495 | 0.0536 |
| F0 (N) | 304 | 450 | 600 | 751 | 900 |
Publisher’s Note: MDPI stays neutral with regard to jurisdictional claims in published maps and institutional affiliations. |
© 2022 by the authors. Licensee MDPI, Basel, Switzerland. This article is an open access article distributed under the terms and conditions of the Creative Commons Attribution (CC BY) license (https://creativecommons.org/licenses/by/4.0/).
Share and Cite
Wu, X.; Cheng, J.; Xu, Z.; Dai, L.; Jiang, Q.; Su, B.; Zhu, L.; Zhao, Z. Exploration of Key Process Parameters and Properties of 40Cr Steel in Ultrasonic Surface Rolling Process. Coatings 2022, 12, 1353. https://doi.org/10.3390/coatings12091353
Wu X, Cheng J, Xu Z, Dai L, Jiang Q, Su B, Zhu L, Zhao Z. Exploration of Key Process Parameters and Properties of 40Cr Steel in Ultrasonic Surface Rolling Process. Coatings. 2022; 12(9):1353. https://doi.org/10.3390/coatings12091353
Chicago/Turabian StyleWu, Xiaobin, Jun Cheng, Zhilong Xu, Leyang Dai, Qingshan Jiang, Bosheng Su, Li Zhu, and Zhenye Zhao. 2022. "Exploration of Key Process Parameters and Properties of 40Cr Steel in Ultrasonic Surface Rolling Process" Coatings 12, no. 9: 1353. https://doi.org/10.3390/coatings12091353