Article

Role of Stearic Acid as the Crystal Habit Modifier in Candelilla Wax-Groundnut Oil Oleogels

1
Department of Biotechnology and Medical Engineering, National Institute of Technology, Rourkela 769008, India
2
Department of Pharmaceutics, Institute of Pharmacy and Technology, Cuttack 754202, India
3
Department of International Agricultural Technology & Institute of Green BioScience and Technology, Seoul National University, Seoul 151742, Republic of Korea
4
Department of Physics and Biophysics, Faculty of Food Science and Nutrition, Poznań University of Life Sciences, Wojska Polskiego 38/42, 60-637 Poznań, Poland
5
Department of Chemical Engineering, SABIC Polymer Research Center (SPRC), King Saud University, Riyadh 11421, Saudi Arabia
6
Agro-Nanotechnology and Advanced Materials Center, Institute of Postharvest and Food Sciences, Agricultural Research Organization, Rishon LeZion 7505101, Israel
*
Authors to whom correspondence should be addressed.
ChemEngineering 2023, 7(5), 96; https://doi.org/10.3390/chemengineering7050096
Submission received: 4 September 2023 / Revised: 1 October 2023 / Accepted: 8 October 2023 / Published: 12 October 2023

Abstract

:
This study investigated the effects of incorporating stearic acid (SAC) in candelilla wax (CW) and groundnut oil (GO) oleogel with potential health benefits as an alternative to saturated fats in processed foods. Results showed that SAC possesses crystal habit-modifying properties on the oleogels, causing its average crystallite size to increase, as observed through polarized light microscopy and XRD analysis. Additionally, SAC caused an increase in ordering within the crystallite network as a result of the decrease in d-spacing. Interestingly, the firmness of the oleogels remained unaffected, even at a higher fraction of SAC. It is believed to be due to the interference caused by the crystallization of high-melting SAC within the fine crystal network of CW-GO oleogel. However, adding 3 mg of SAC significantly increased the work of the shear of the oleogel (SAC3), which decreased the spreadability. As observed through colorimetric analysis, SAC3 showed a dense and uniform distribution of prominent bright crystals with minimal amorphous regions, leading to a high whiteness index. SAC3 also demonstrated the highest compactness and dislocation density among the oleogels, likely due to the formation of prominent crystals. However, SAC did not affect the overall oleogel crystallization rate. SAC3 had delayed secondary crystallization and thermal equilibrium by having a prolonged crystallization time of CW crystals. In the case of controlled delivery studies, the addition of SAC improved CPCR. On the other hand, CPCR decreased with the increase in SAC amount, where SAC3 showed a moderate curcumin release ability among the oleogels.

1. Introduction

Oleogel is a semi-solid lipophilic formulation produced by the entrapment of liquid oil by the three-dimensional (3D) network of a gelator or a combination of gelators [1]. Such a mechanism of oil structuring can be achieved through various routes, such as self-assembled networks [2], crystallization [3], and polymeric networks [4]. These networks are further stabilized by weak interactions such as hydrogen bonding, π-π stacking, Van der Waals, and electrostatic interactions [5]. The oil gelator compounds, called oleogelators, can be either of low molecular weight (e.g., simple sugars, sugar alcohols, waxes, lecithins, esters, and inorganic compounds) or higher molecular weight (such as proteins, polysaccharides, and polymers) [6]. Among the aforesaid category of oleogelators, waxes are the primary choice because of their capacity to structure oil and offer desired qualities to oleogels at relatively low concentrations [7,8,9]. Waxes are mainly composed of long-chain non-polar hydrocarbons and are either animal (e.g., beeswax), plant (e.g., candelilla wax, sunflower wax, carnauba wax), or synthetic origin (e.g., paraffin wax). Depending on their origin, the chemical composition varies, which in turn affects the oleogel properties, such as melting and crystallization behavior. Among the various natural waxes, candelilla wax (CW) has been widely used in the food industry and has been approved by the United States Food and Drug Administration (FDA) as a food additive [10]. The physicochemical and functional properties of CW make it suitable for a wide range of food applications (emulsions, edible films, oleogels, etc.). It consists of a high proportion of hentriacontane, followed by other n-alkanes, high molecular weight esters, alcohols, sterols, and resins [11]. Due to the shape of the crystals, their capacity to form networks, and the overall quantity of crystalline phase, CW is regarded as an excellent oleogelator in creating strong gels [10,12]. This property mainly arises from the hentriacontane, which makes CW capable of self-assembly in various non-polar solvents, including vegetable oils. CW has been used as an oleogelator for structuring soybean oil [13], canola oil [14], rice bran oil [15], and flaxseed oil [16].
In this study, we are poised to prepare CW-based oleogels using groundnut oil. Groundnut oil (GO) has also been used as the liquid phase in developing oleogels. GO is comprised of a high amount of poly- and monounsaturated fatty acids (PUFA and MUFA), a low amount of SFAs, and no trans-fatty acids [17]. Thus, it also controls cholesterol levels and supports heart health. GO is rich in vitamin E (tocopherol), too, thus facilitating anti-aging functions [18]. In addition to the useful fatty acid composition and other nutrients, the rationality to choose GO is because of its abundance. India is the second largest producer of groundnuts in the world [19,20,21]. Groundnuts, also commonly known as peanuts, are popularly consumed as seed oil in India [22]. This oil has been the major source of fats in the majority of foods [23,24], making it a prevalent ingredient in Indian cuisine. The fatty acid composition of GO also provides stability during storage [25]. In recent years, several researchers have reported the effect of emulsifiers on enhancing the different physio-chemical properties of the oleogels and modulating the fat crystal structure. Even at low concentrations, emulsifiers can alter the nucleation step of fat crystallization depending on their concentration and fatty acid compositions [26]. Stearic acid (SAC), also called 1-octadecanoic acid, is a waxy long-chain SFA and a non-polar compound. It is a widely used fatty acid in food applications for its oil-structuring capability. Soft oleogels are produced when SAC is present in the oleogels, which is ideal in food products since it facilitates the desired melt-in-mouth sensation [27]. This investigation is concerned with synthesizing and characterizing oleogels using CW and GO in the presence of SAC as an emulsifier. Different characterizations were used to examine the impact of varying the emulsifier content in the oleogels. Centrifugation was used to measure the oil-binding capacity of oleogels, microstructure within the oleogels was analyzed with polarized light microscopy, and color profiles were studied through colorimetric analysis. FTIR spectroscopy was used to assess chemical interactions within the oleogels, while X-ray diffraction (XRD) determined crystallite size. Mechanical properties were evaluated through a spreadability test, and thermal characteristics were determined using crystallization kinetics. Additionally, the release of curcumin from the oleogels was investigated to understand how emulsifiers influence its release.

2. Materials and Methods

2.1. Materials

The commercially available GO (Engine brand, Shree Hari Oil Mills, Bharatpur, Rajasthan) was bought from a local supermarket. The CW was purchased from Nature’s Tattva, New Delhi, India, and SAC was bought from Loba Chemie Pvt. Ltd. (Maharashtra, India). Curcumin (MW 368.39) was procured from Himedia Laboratories Pvt. Ltd., Mumbai, India.

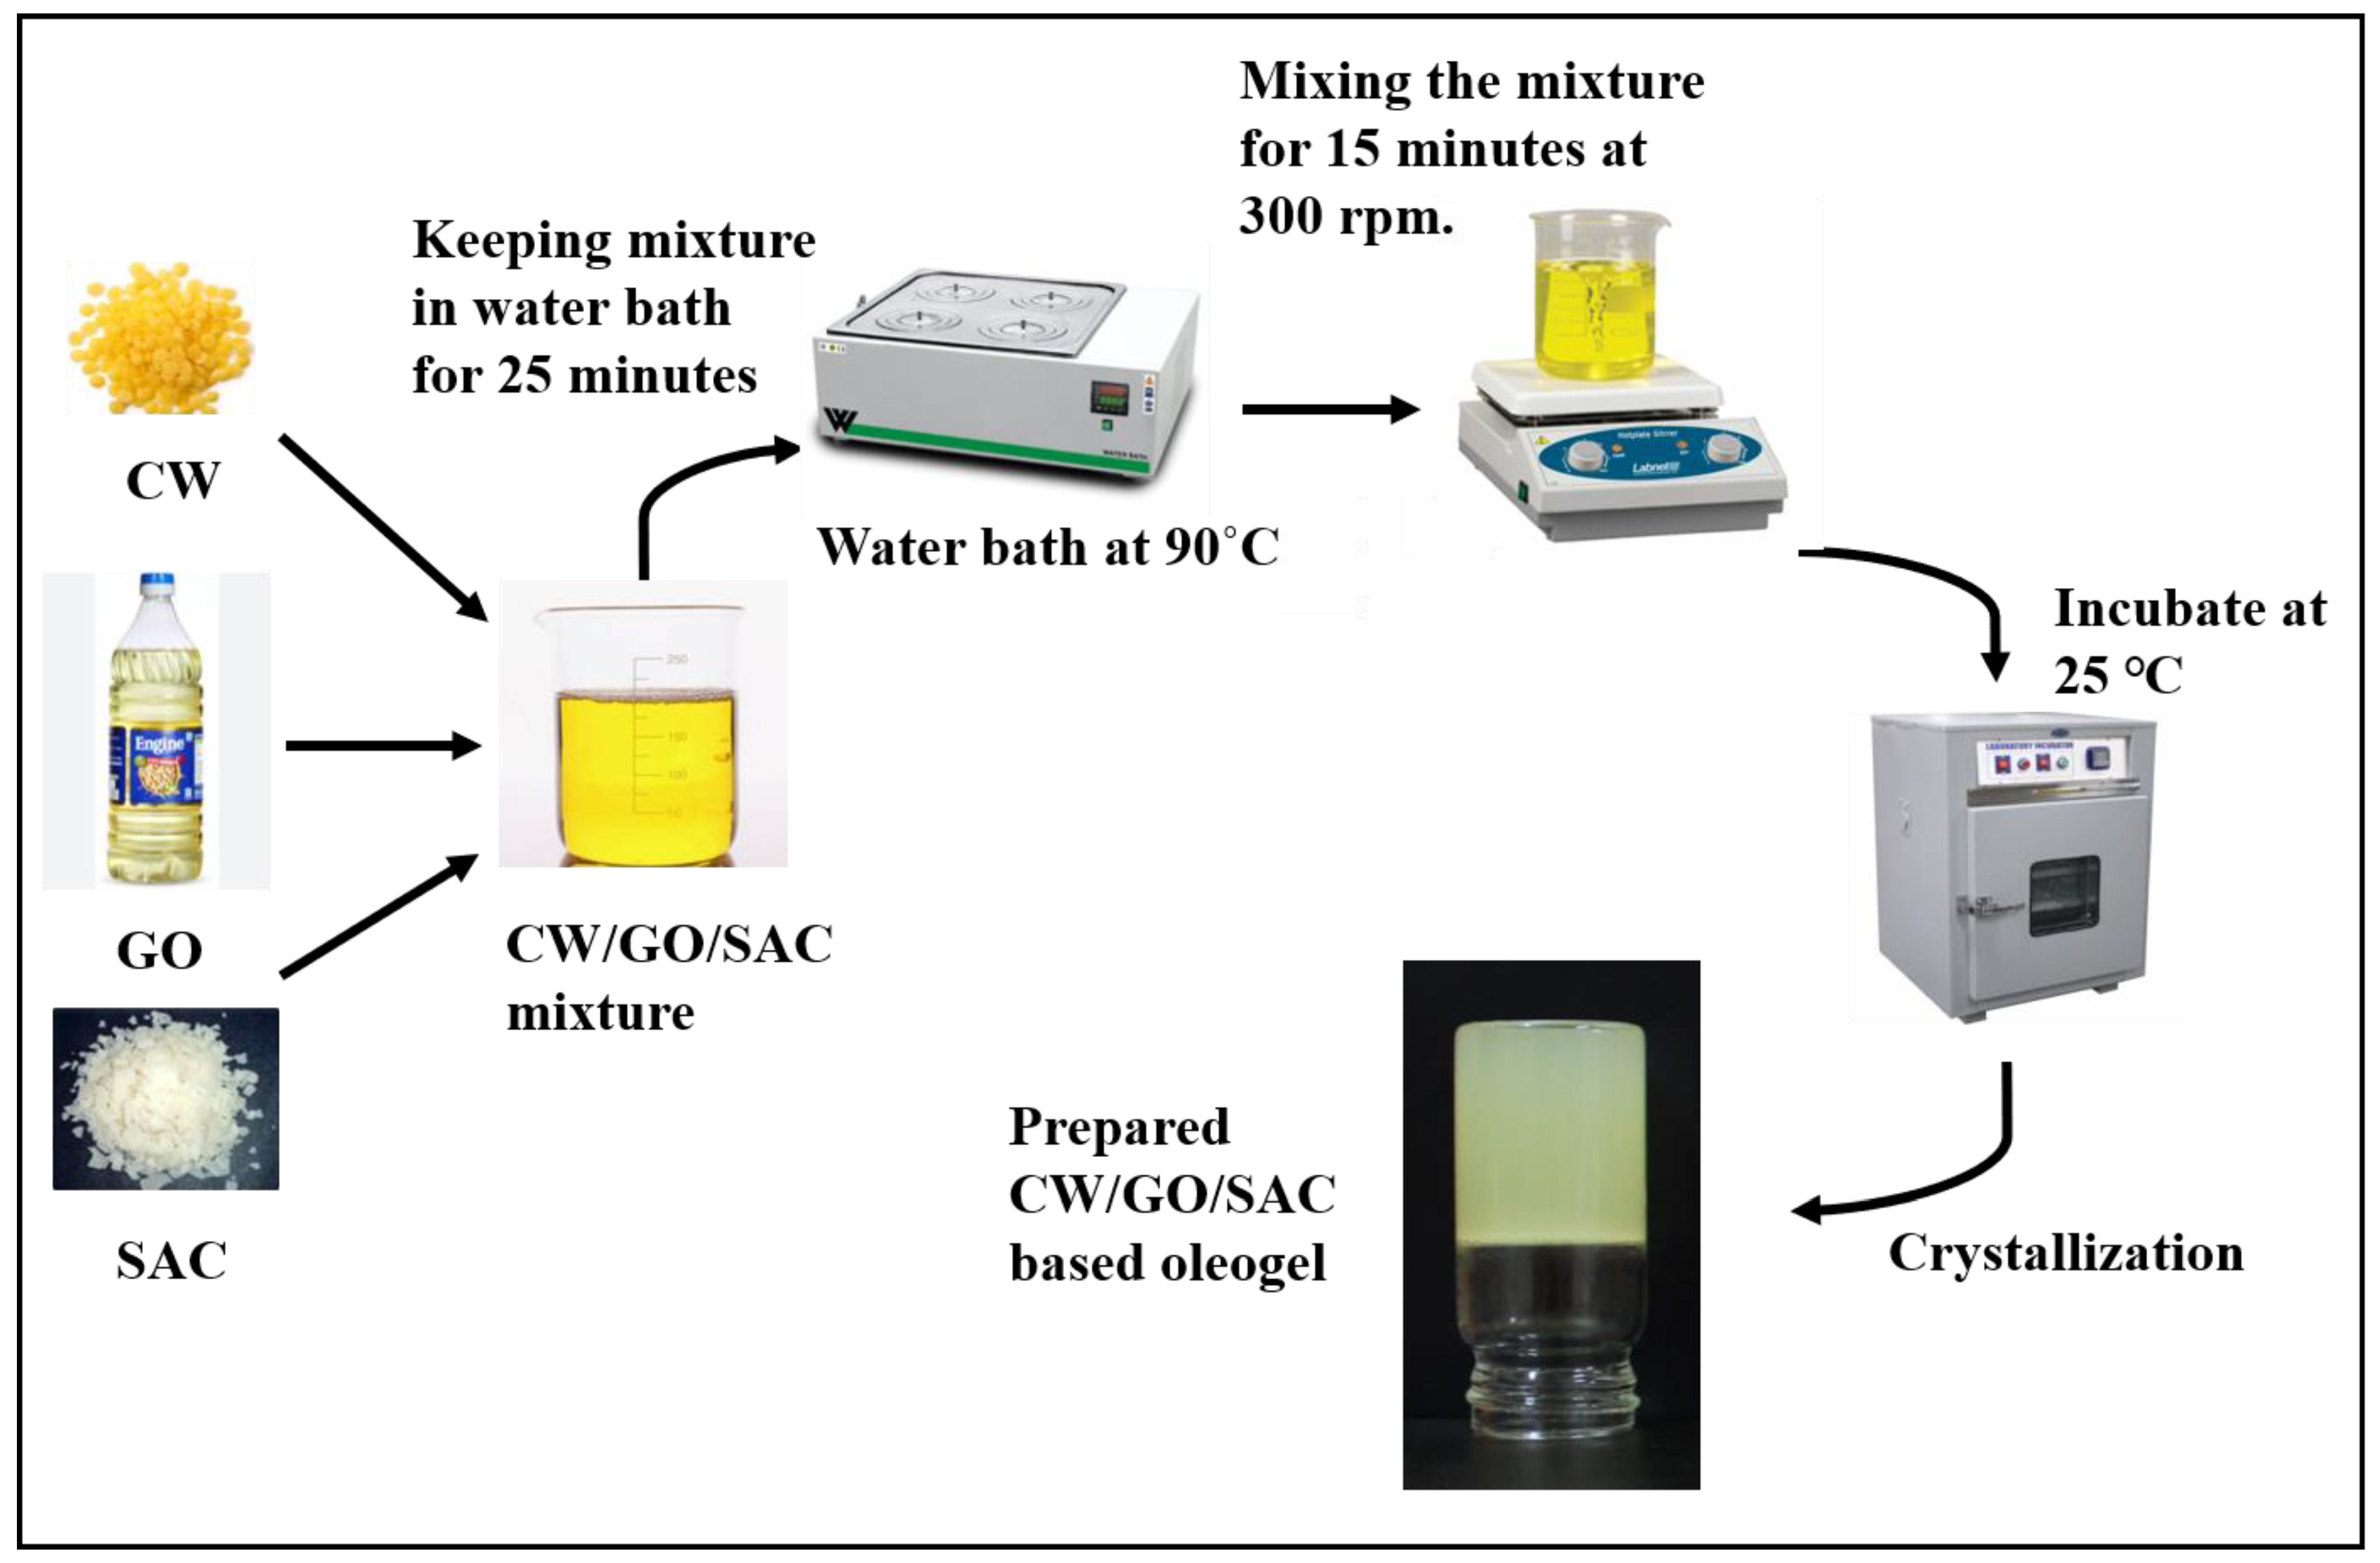
2.2. Oleogel Preparation

To start with, the critical gelation concentration (CGC) of CW was figured out by varying its concentration from 1% to 5% w/w in GO. Subsequently, GO was heated at 90 °C, while stirring constantly at 300 rpm until the complete dissolution of CW. The mixture was then incubated for 3 h at 25 °C using a thermal cabinet (Figure 1). After incubation, the inverting tube technique, which involves studying the materials’ flow under gravity, was used to test the gelation in the samples. Visual observation confirmed that 5% (w/w) CW in GO resulted in a stable gel, which was utilized as the control sample in subsequent research. Additionally, oleogel samples containing SAC were prepared. A stock solution of 0.1% (w/w) SAC in GO was prepared and then added to the CW-GO mixture to obtain 1 mg, 3 mg, 5 mg, and 10 mg of SAC in 20 g of the oleogel samples. Then, using the same heating-cooling technique as described above., the SAC-containing oleogels were developed. Table 1 presents the composition of the prepared oleogel samples.

2.3. Oil Binding Capacity

The capability of oleogels to bind to oil was evaluated by measuring their oil-binding capacity (OBC). This was accomplished by adding 1 mL of the molten oleogel samples to 2 mL empty, previously weighed (A) Eppendorf tubes. Following the solidification of the samples, the Eppendorf tubes were weighed (B) again. After incubation for 24 h at 4 °C, the Eppendorf tubes underwent centrifugation at 10,000 rpm (18 °C) for a duration of 15 min in a Remi C-24 BL cooling centrifuge [28]. Subsequently, the Eppendorf tubes were inverted to facilitate the drainage of oil, following which their weights (C) were measured. A filter paper was used to remove any remaining oil. Using Equations (1) and (2), respectively, the % oil released fraction and OBC were computed.
%   Oil   released   fraction = [ ( B A ) ( C A ) ] ( B A ) × 100
OBC = 100 − % Oil released

2.4. Colorimetry

An in-house developed colorimeter was utilized to analyze the oleogels. The samples were placed in 35 mm Petri plates and incubated at 25 °C for 3 h. During this time, black and white placards were used to calibrate the instrument. After taking pictures of the oleogel samples using the device’s camera, the color parameters were measured, which included L*, a*, and b*. With the help of color parameters, the whiteness index (WI) and the yellowness index (YI) were determined by using the Equations below.
W I = 100 100 L * 2 + a * 2 + b * 2
YI = 142.86   b * L *
where L c * ,   a c * ,   and   b c * denotes the values of the control sample, and those with subscript ‘x’ are the oleogel samples containing SAC.

2.5. Polarized Light Microscopy (PLM)

PLM was performed to visualize the gelator crystals in oleogels. After placing molten oleogel samples on microscopic glass slides, the samples for examination were prepared by carefully covering them with coverslips. Glass slides with molten oleogels were incubated in a thermal cabinet at 25 ℃ for 3 h. In order to examine the samples, a bright-field compound microscope manufactured by Leica Microsystems and located in Wetzlar, Germany, was used. This specific microscope has an extraocular lens camera installed in it. An in-house created polarizer was put on the device, and polarized micrographs of the samples were taken using that polarizer.

2.6. FTIR Spectroscopy

The FTIR spectrum analysis was conducted on the raw ingredients and prepared oleogel samples using an Alpha-E Fourier transform IR spectroscope (FTIR) manufactured by Bruker in Bremen, Germany. The analysis was performed under Attenuated Total Reflectance (ATR) mode with a ZnSe crystal. The spectral range that was scanned encompassed wavenumbers between 4000 and 500 cm−1, with a spectral resolution of 4 cm−1. Each sample underwent spectral analysis using a total of 25 scans.

2.7. Raman Spectroscopy

Raman spectra analysis was conducted for both the raw ingredients and prepared oleogel samples with the help of the Raman spectrometer (WITec, GmbH Model-XMB3000-3000, Ulm, Germany). The spectra acquisition was performed using Witec Alpha300 Confocal Raman Microscope equipped with a 532 nm laser with a laser intensity of 33 mW and a 600 g/mm grating. Two spectra were recorded for each sample, each with two accumulations with an integration time of 30 s, in the range of 500 to 3500 cm−1.

2.8. X-ray Diffraction (XRD)

X-ray diffraction (XRD) examination was performed on the oleogel samples using a Bruker D8 Advance X-ray diffractometer from Austin, Texas, which was outfitted with a Co-K radiation source that had a wavelength of 1.79 Å. A voltage of 35 kV and a current of 25 mA were used to power the diffractometer while it was in operation. The technique for angular scanning was carried out within a range of 2θ and a range of 5° to 50°, with a scan rate of 5°/min. The usage of Bragg’s rule (Equation (5)) allowed for the successful completion of the calculation of the XRD parameter known as ‘d-spacing’ (d). In the meanwhile, the Debye–Scherrer Equation (Equation (6)) was used in order to do the computation for determining the crystallite size (D). In the succeeding stage, Equations (7) and (8) were used in order to determine the lattice strain (represented by the symbol ε) and the dislocation density (represented by the symbol δ), respectively.
λn = 2 dsinθ
where λ represents the wavelength of the X-ray, i.e., 1.79 Å, n is any integer value, and θ denotes the diffraction angle.
D = λ k β c o s θ
where k denotes Scherrer constant, β measured in radians, and demonstrates the full width at half maximum (FWHM) at a scattering angle 2θ.
ε = β 4 t a n θ
δ = 1 D 2
Here, dislocation density (δ) is expressed in lines/ m 2 .

2.9. Crystallization Kinetics

The analysis of the crystallization kinetics of the oleogels was conducted using a temperature sensor device that was developed in the laboratory. In the present study, the oleogel samples were subjected to a process of melting and then placed into culture bottles with a volume of 15 mL. Subsequently, the specimens were subjected to a temperature of 90 °C by means of a water bath. Afterward, the temperature sensor probes were affixed to said bottles and subsequently submerged in a refrigerated water bath set (Equibath, Refrigerated Circulating, Equitron Medica Private Limited, Mumbai, India) to a temperature of 5 °C. Following the attainment of a temperature of 55 ℃ in the sample, the kinetics of gelation were monitored for a period of 90 min. The temperature variation of the specimens was meticulously observed and documented during the 90 min duration.

2.10. Texture Analysis

An HD plus texture analyzer (Stable Microsystems, Godalming, UK) was used to determine the spreadability of oleogels. Samples of molten oleogels were poured into the bottom perspex cone and incubated in the thermal cabinet at 25 °C for 3 h. Under the compression test mode of the texture analyzer, a force of 5 g was selected as the trigger force for the data recording. The samples in the perspex cone were successfully pierced by an upper perspex cone (45°), reaching a depth that resulted in a height gap of 2 mm from the base of the cone. Afterward, the upper cone returned to where it had been before. The test was performed at room temperature (25 °C) at 1.00 mm/s test and post-test speed.

2.11. Curcumin Release Study

The in vitro curcumin release study was conducted using a dissolution apparatus (DA8000, Labindia Instruments Pvt. Ltd., Mumbai, India) equipped with six stations. The current study employed the USP type I dissolution apparatus, which is of the basket type. The trituration method was utilized to prepare a 20 g formulation of each oleogel, which contained 5 mg/g (w/w) curcumin. Subsequently, the receptacle was occupied with an amount of 1.0 g of oleogel containing curcumin. A phosphate buffer (pH 6.8) (PBS) containing 0.25% w/v sodium lauryl sulfate was utilized as the release medium. The release medium was kept at a constant temperature of 37 ± 0.5 °C. The rotational speed of the basket was set at 100 rpm. A volume of 5 mL of the specimen was obtained and subsequently substituted with a fresh solution of phosphate-buffered saline (PBS) at predetermined time intervals. The curcumin concentration in the samples was determined by using a UV-visible spectrophotometer at 430 nm (Shimadzu 1900i, Kyoto City, Japan). The curcumin release study was conducted for a duration of 3 h. The curcumin release kinetics was calculated by plotting cumulative percentage curcumin release (CPCR) vs. time in min.

2.12. Statistical Analysis

Data were collected in triplicate in all the above analyses and presented as mean ± standard deviation. Further, for the confirmation of the significant differences (p < 0.05) among the samples, a t-test was performed.

3. Results and Discussion

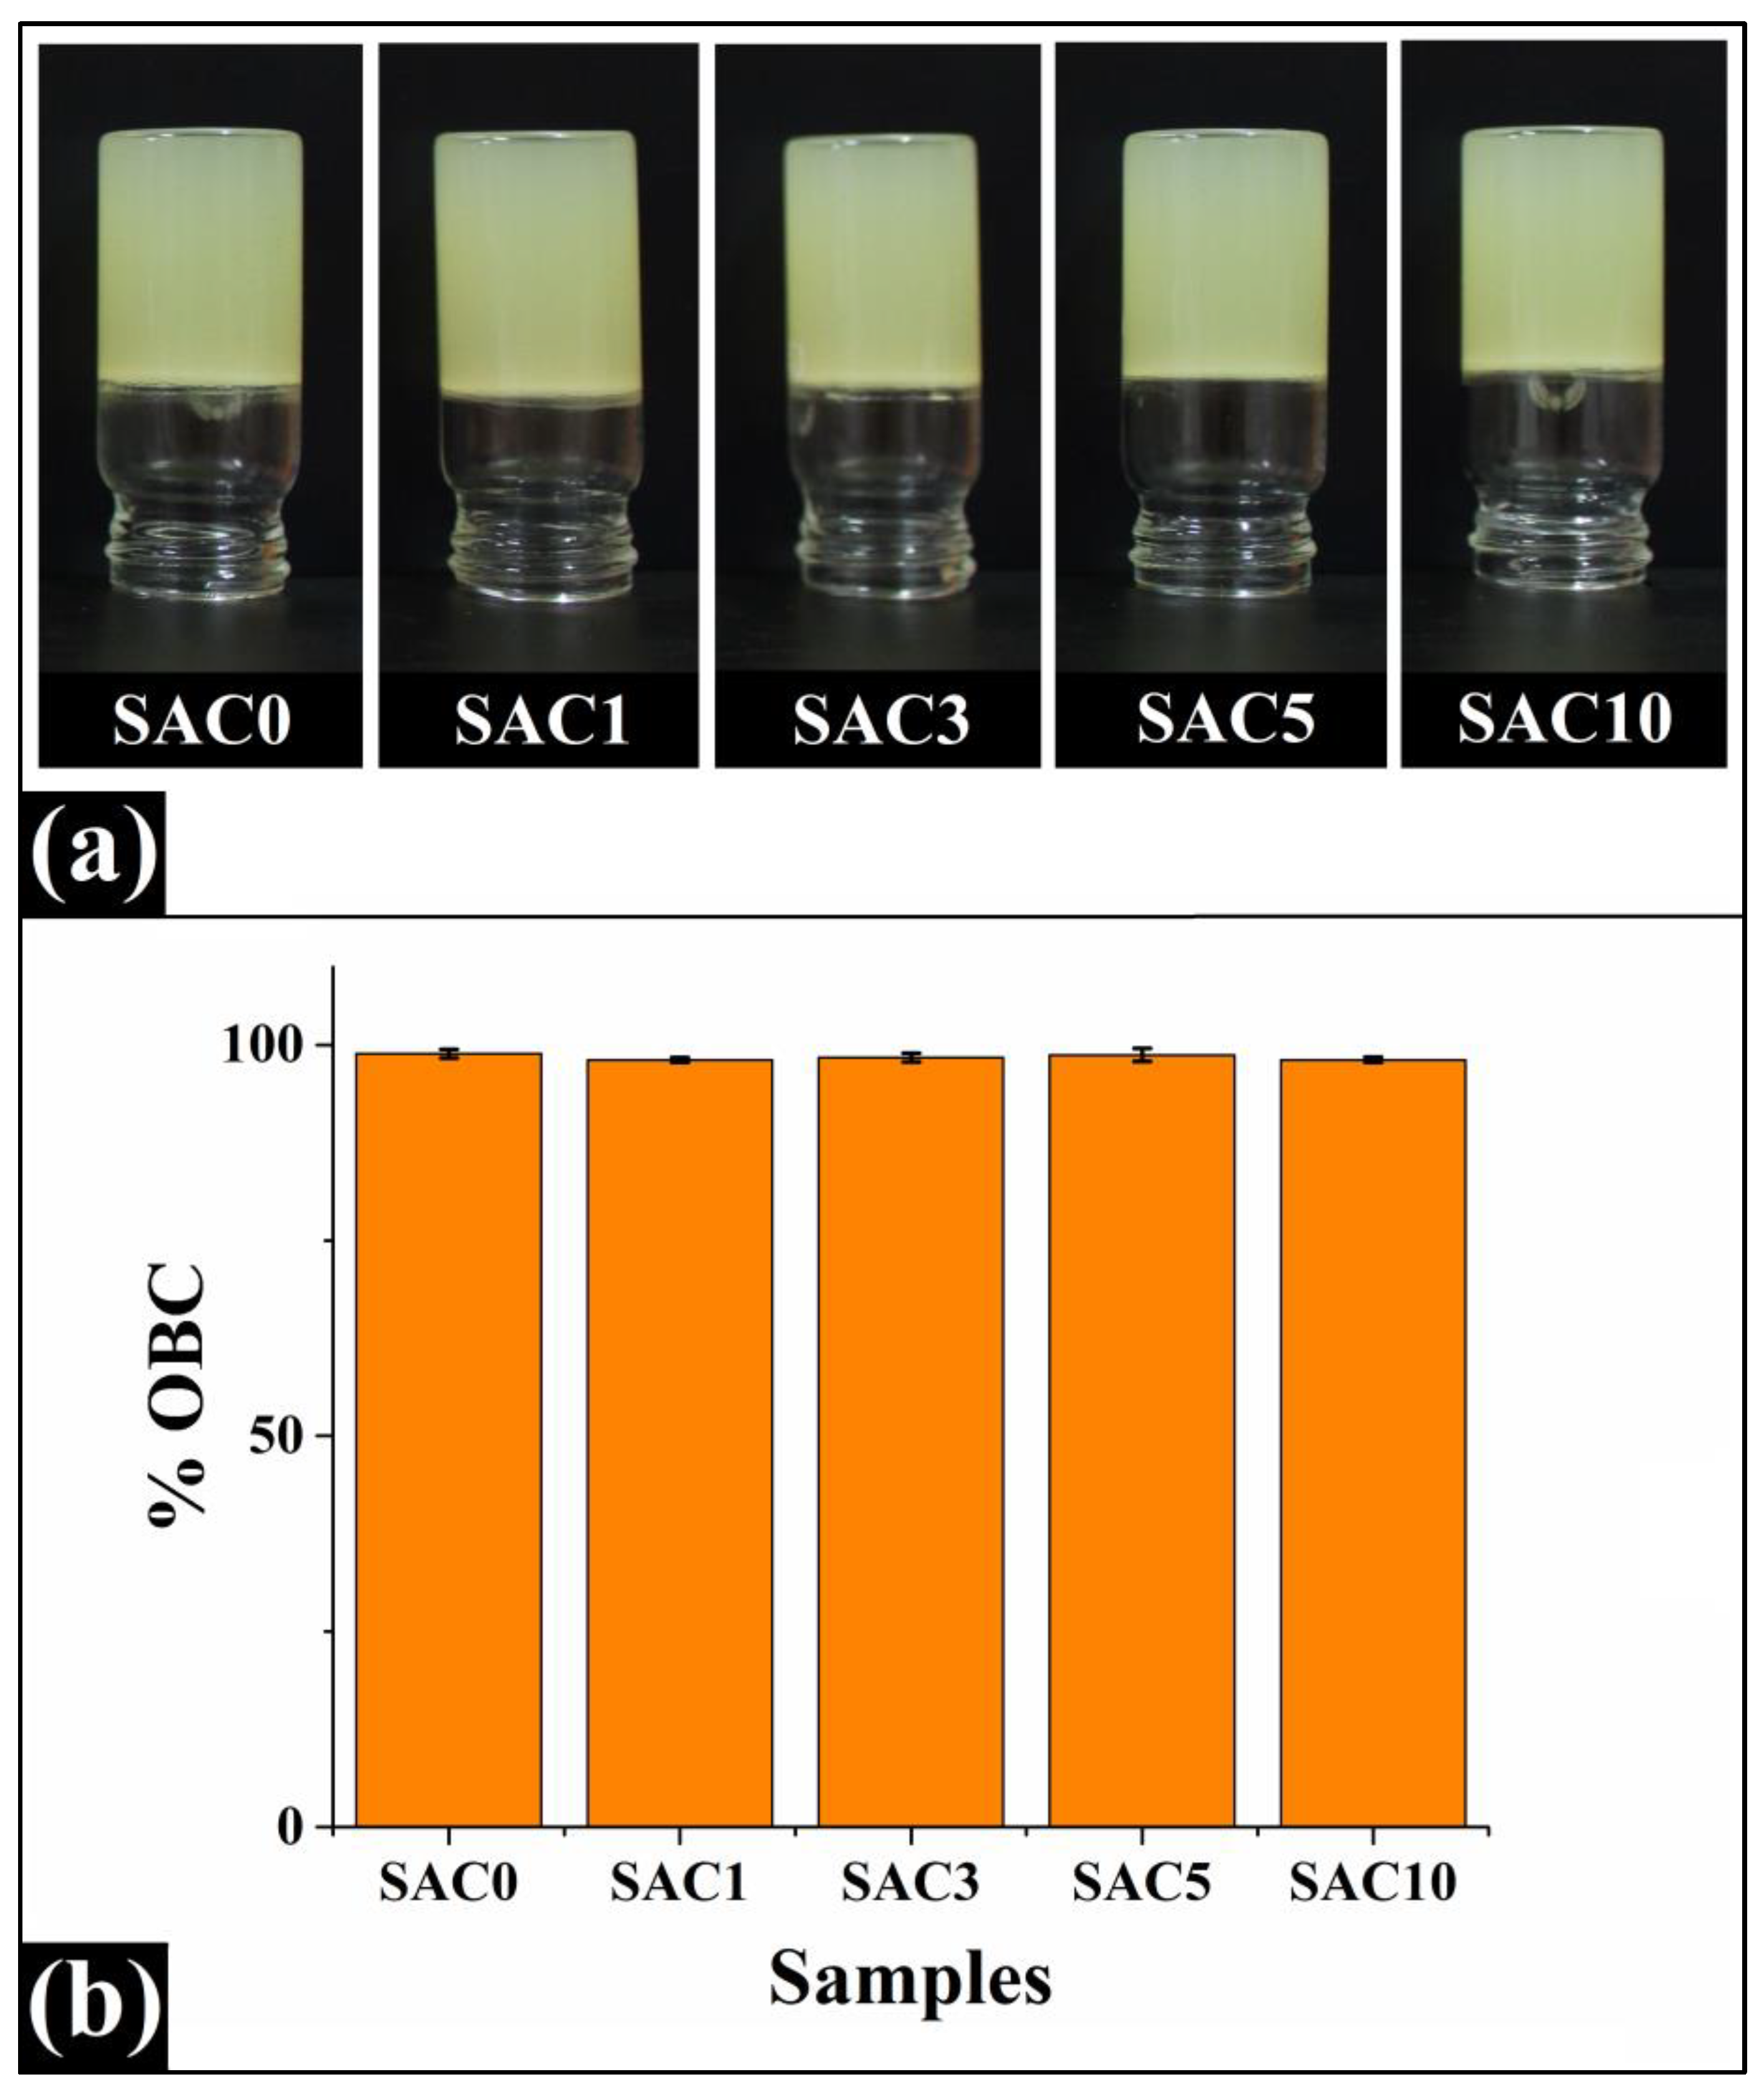
3.1. Visual Appearance and OBC of the Prepared Oleogels
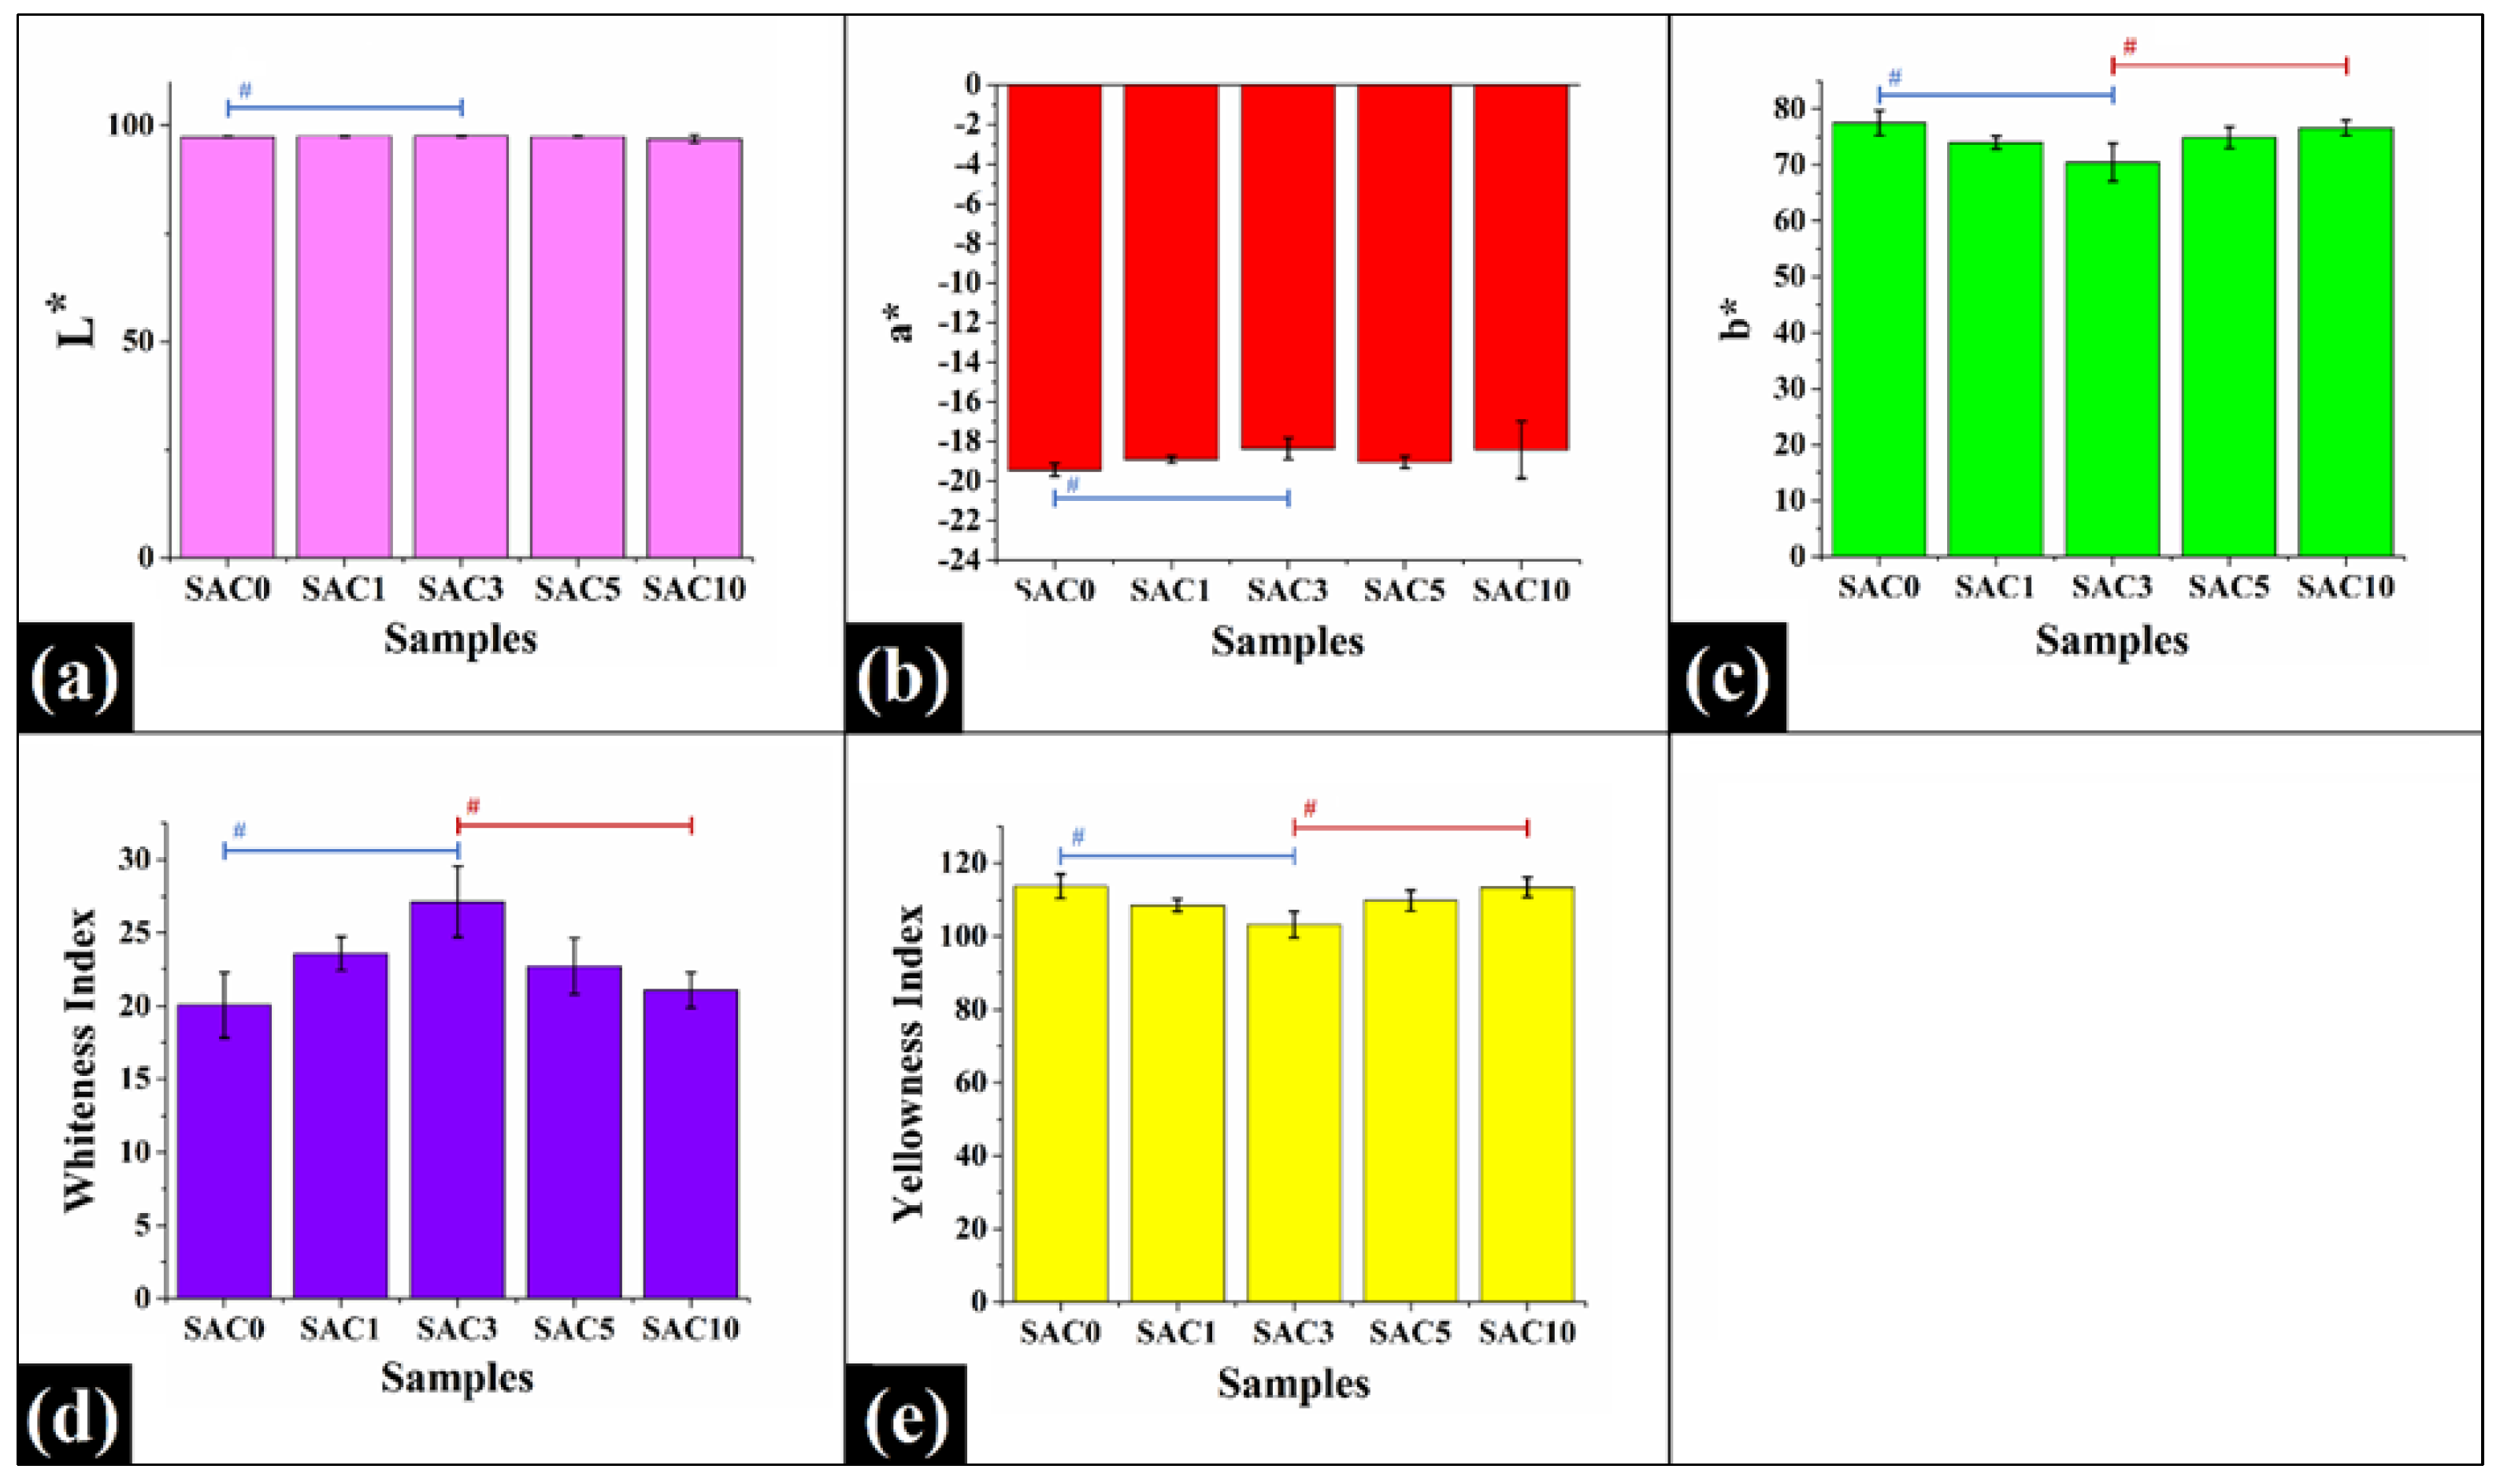
A visual inspection helps to analyze the oleogels in terms of color and stability. The prepared CW-GO oleogels were all similarly colored, i.e., pale yellow (Figure 2a). The light-yellow tint of GO and the yellow color of CW might be the contributing factor to the color of the oleogels [29]. Since SAC was added in a small quantity to the oleogels, it did not influence the color of the samples. The inverted tube test confirmed that all the oleogel samples were stable and self-standing (Figure 2a).
After establishing the stability of oleogels, their OBC was evaluated (Figure 2b). It is a crucial property of oleogels that also defines their quality [30,31]. All the samples exhibited a very high % OBC, which is more than 98%, demonstrating that CW has a descent OBC for GO. This observation suggests that CW could effectively entrap and bind to GO at a concentration as minimum as 5% (w/w). The gelation of rice bran oil with CW was recorded with a similar concentration of CW [15]. Several structural factors, such as crystal size and the extent of the crystalline network, may be associated with the OBC [10,32]. Therefore, the high % OBC of the CW for GO may be traced to the dense crystalline network generated by its relatively tiny crystals [33]. Samples with a high % OBC have also been related to high mechanical strength, equating to a more compact network structure [28]. Accordingly, it can be assumed that since CW has a very high % OBC, the prepared oleogels would have greater mechanical strength and a dense crystal network. This suggests that the emulsifier had no significant effect on modulating the OBC of the oleogel.

3.2. Colorimetry

Color is a fundamental aspect of food applications and could be correlated with the sample quality and chemical composition. Colorimetry is a method that provides information on various color characteristics of a test sample, such as lightness, saturation, hue, etc. [34]. Though there are various color spaces or models to describe color, CIELAB has been widely used for food applications. All the samples exhibited L* values between 96 and 100 (Figure 3a). Such high values of L* are indicative of the high luminance in the samples. Except for SAC3, the L* values were found to be very close to each other (p > 0.05). SAC3 showed a significant increase in L* compared to SAC0 (p < 0.05). The rise in the L* value of SAC3 suggests the presence of more lightness, possibly due to the presence of more bright crystals. Further, the a* values of the oleogel samples were negative (Figure 3b), reflecting the presence of a greenish tint. The sample’s greenness can be attributed to the chlorophyll present in the vegetable oils [35,36]. All oleogel samples showed similar a* values (p > 0.05), except for SAC3, which displayed a significant drop in its a* value compared to SAC0 (p < 0.05). A positive b* value accounts for the yellowish tint that was also observed visually in the oleogel samples (Figure 3c). The presence of carotenoid pigments gives GO its characteristic yellow color [35,37]. The inclusion of SAC significantly reduced the b* value of SAC3 compared to SAC0 (p < 0.05). Further, SAC3 had a significantly lower b* value than SAC10 (p < 0.05). The b* values of SAC0, SAC1, SAC5, and SAC10 did not differ significantly from one another (p > 0.05). From the observation of Figure 3b,c, it had been concluded that the effect of b* values was more pronounced on the samples than a* values. As a result, the oleogel samples appeared prominently yellowish and negligibly green in color.
The parameters WI and YI were subsequently derived from the L*, a*, and b* values. WI is a measure of the whiteness degree and was calculated using Equation (3). Figure 3d shows that the WI value of SAC3 is significantly higher than the WI values of others, especially SAC0 and SAC10 (p < 0.05). At the same time, the other oleogel samples showed an insignificant difference in WI values (p > 0.05). The YI, which serves as an indicator of the degree of yellowness, was calculated using Equation (4). The results depicted in Figure 3e indicated that SAC3 had a significantly lower YI value compared to SAC0 and SAC10 (p < 0.05), while the others showed an insignificant difference in YI values amongst each other. The distinctive outcomes observed in SAC3 in terms of high WI and low YI can be accounted for by the internal bulk micrographs of the oleogel and the X-ray diffraction (XRD) analysis of the oleogels, which have been discussed in subsequent sections.

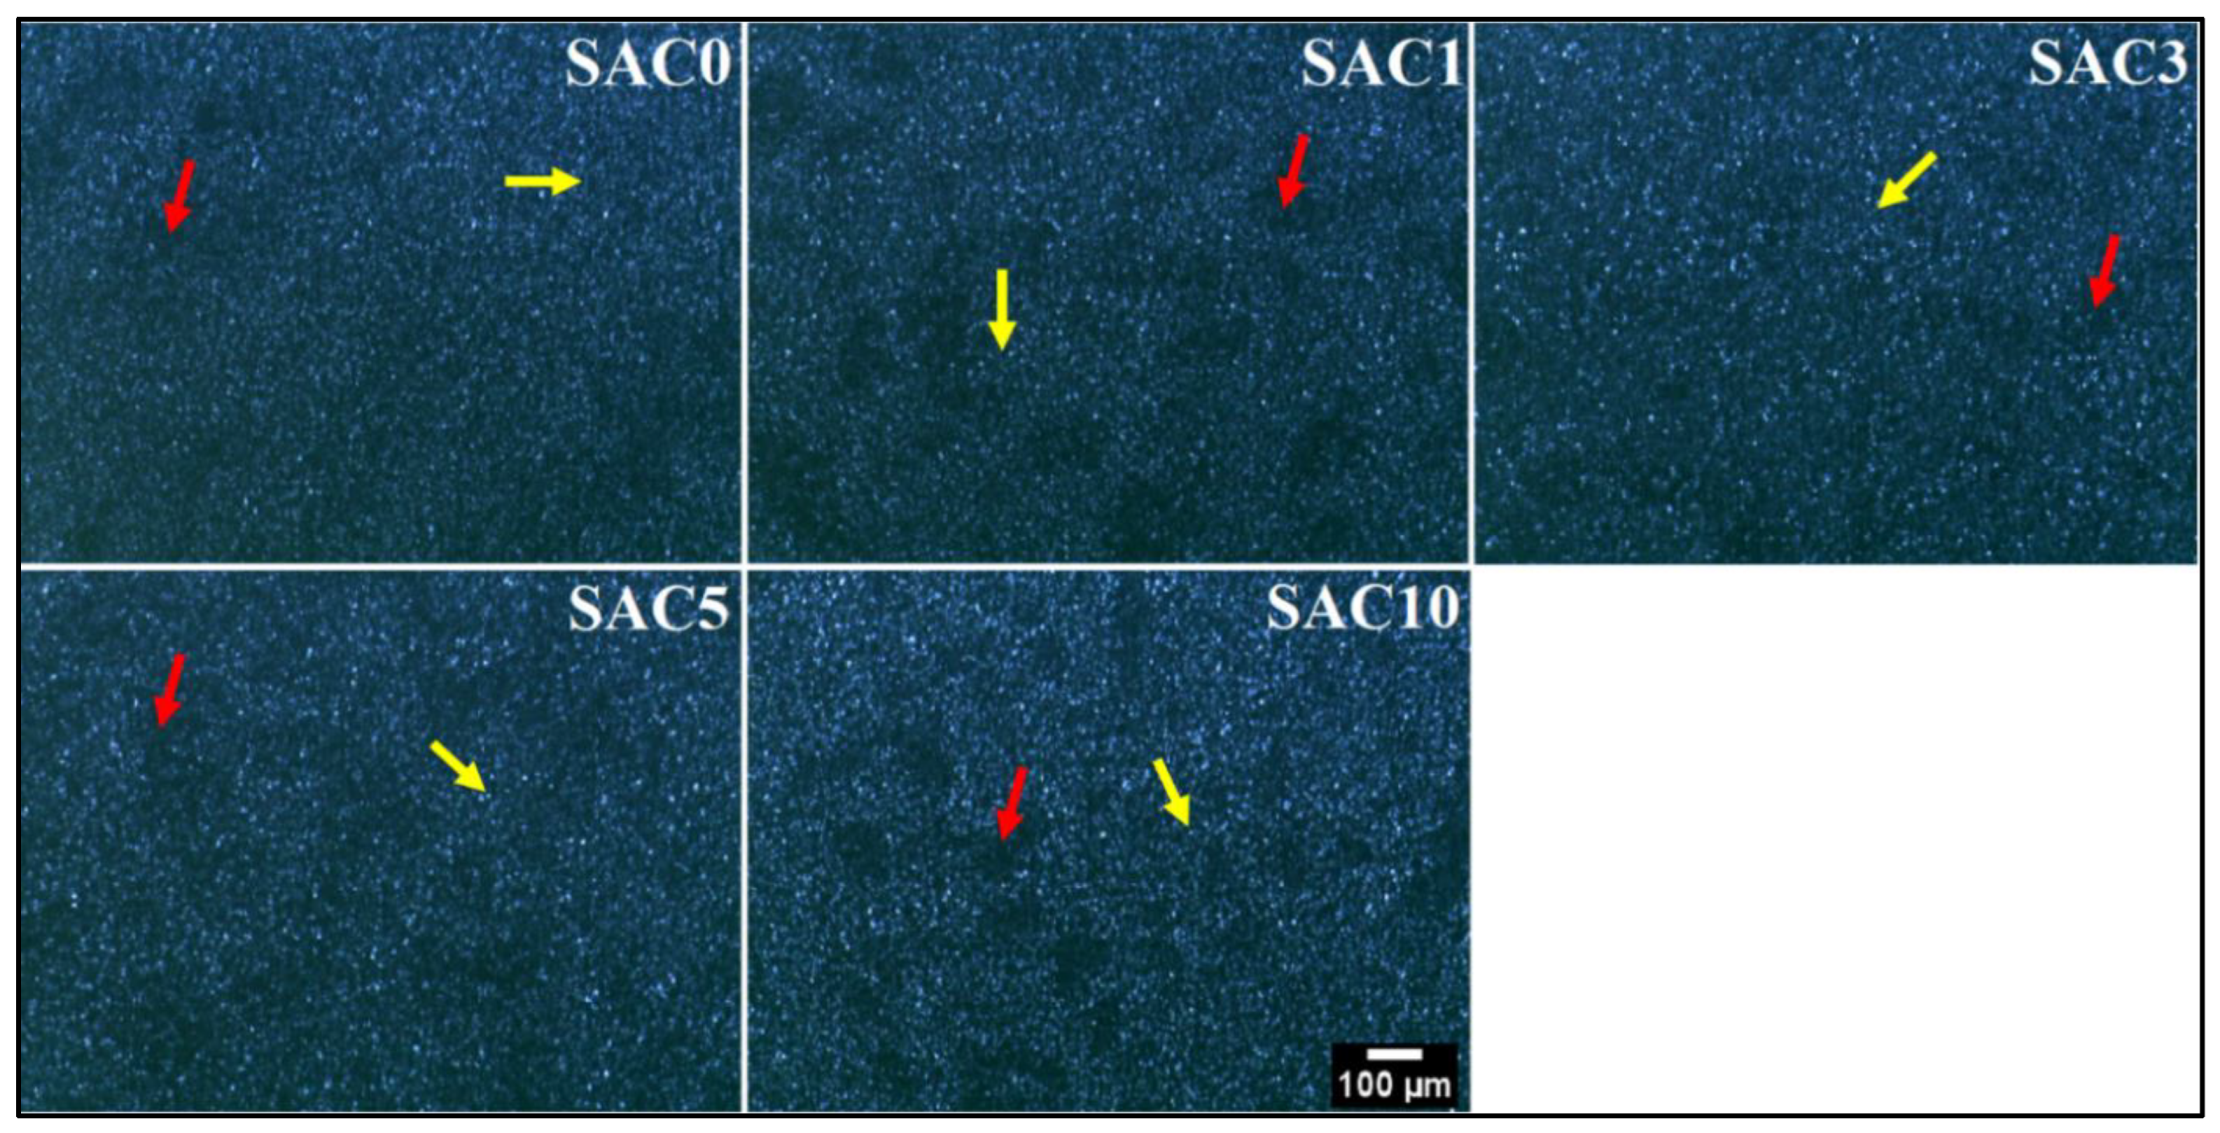
3.3. Polarized Light Microscopy
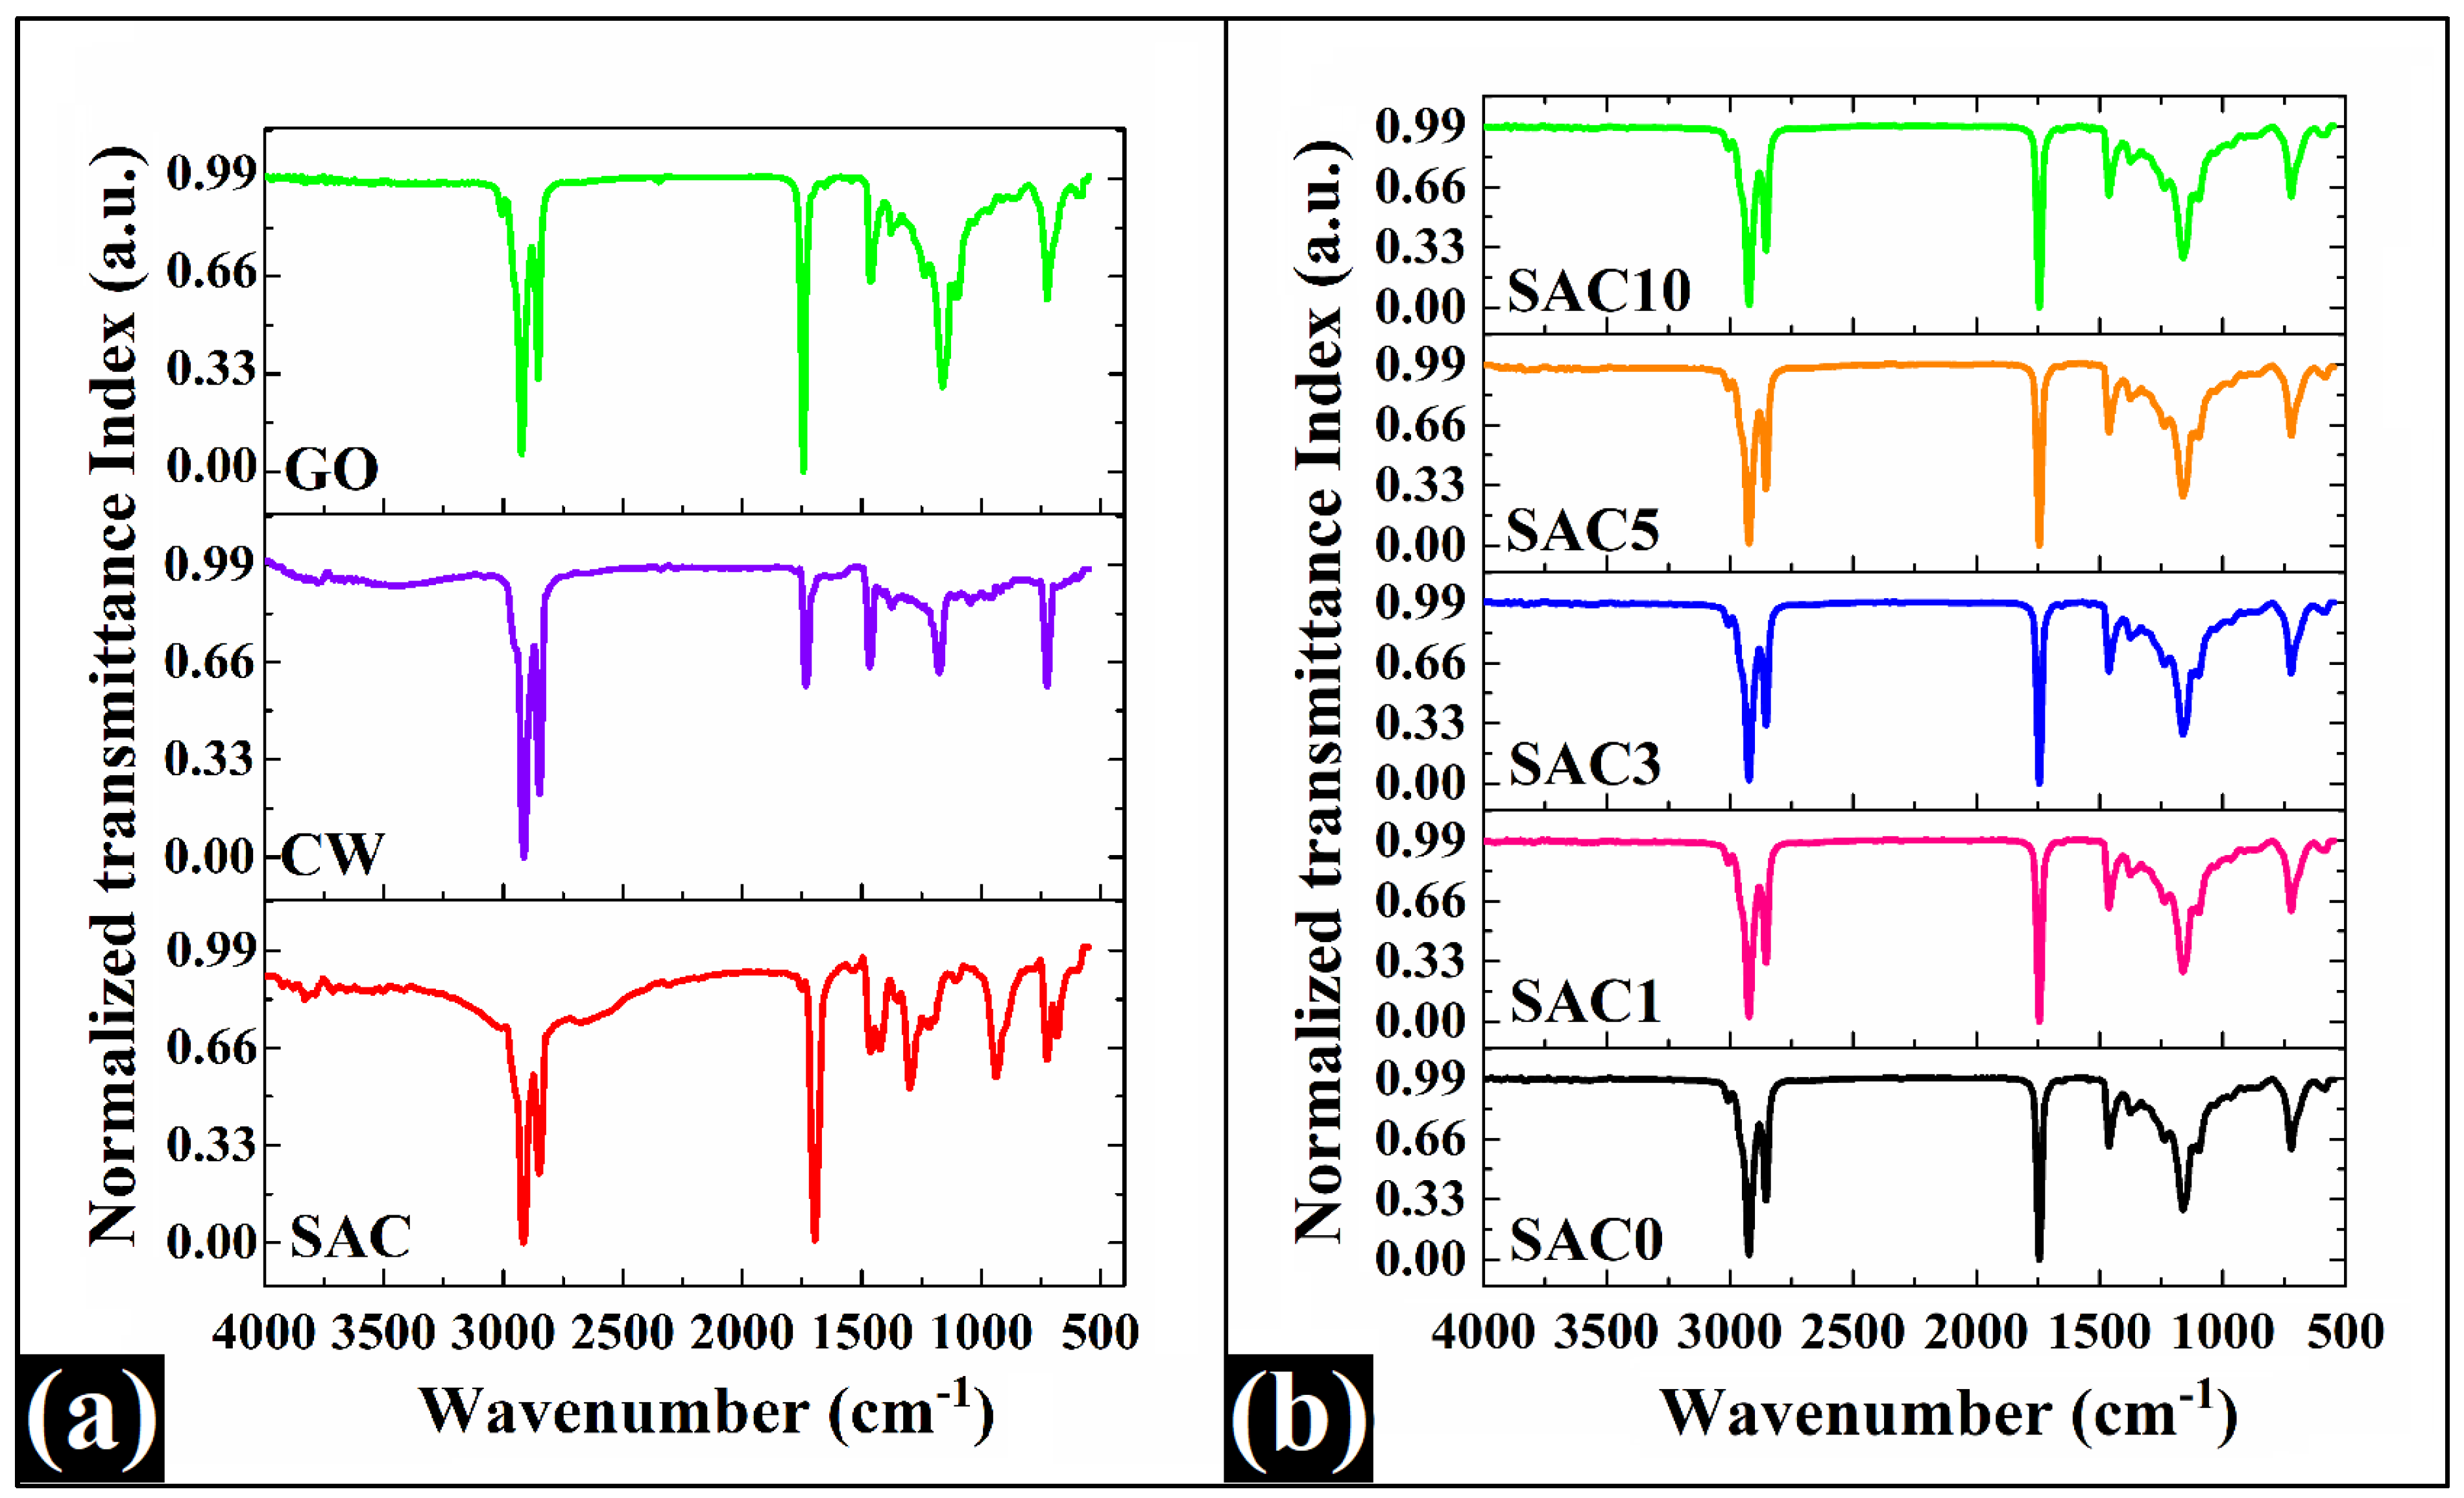
In oleogels, the arrangement of wax crystals creates a 3D network that retains the oil. This wax crystal network can be visualized using a polarized light microscope owing to the birefringence property of the wax crystals [38,39]. CW oleogels are structured by wax micro-platelets composed of parallel arrangements of n-alkanes and long-chain fatty acids (>23 carbons). During oleogelation, these platelets interweave to form a porous, three-dimensional network that physically confines the liquid oil phase [40]. The crystal network depends on various aspects such as oleogelator concentration, temperature, cooling time, etc. [41]. Figure 4 shows the crystal morphology of the prepared oleogel samples, as seen under the polarized light microscope. It was observed that there was an overall occurrence of grain-like or granular crystals in the oleogel samples. Previous reports have also mentioned the granular structure of CW crystals in the oleogels [33,42,43]. Furthermore, the examination of the micrographs facilitated the identification of the crystalline and amorphous regions. Crystalline regions were characterized by the presence of crystals and appeared as bright regions, as indicated by yellow arrows. On the other hand, the amorphous regions were characterized by the regions of free oil, which appeared as dark regions and were indicated by red arrows [44]. The proportion of amorphous areas was found to vary among the oleogels. Amorphous regions in SAC0 were difficult to distinguish from the crystalline sections due to the formation of a homogenous microarchitecture. Compared to SAC0, SAC1 has more amorphous areas (red arrow) and fewer crystalline areas (yellow arrow). There was a decreased proportion of amorphous areas in SAC3 compared to SAC1. The number of amorphous regions in SAC5 was slightly more than that observed in SAC3. Amorphous areas in SAC10 were comparable in number and size to those in SAC1. SAC3 possessed the most substantial crystalline region among all the analyzed oleogel samples. Based on these notes, it can be inferred that the addition of SAC altered the spatial distribution of amorphous and crystalline regions within the samples. Initially, the number of amorphous regions increased with the incorporation of SAC, as seen in SAC1. However, as the concentration of SAC increased, there was a decline in the number of amorphous regions, as observed in SAC3 and SAC5. At the highest concentration of SAC (SAC10), the number of amorphous regions again increased and returned to a level comparable to that observed in SAC1.
A uniformly distributed crystal network provides more surface area for adsorption, thus reducing oil loss by increasing the surface area available for the oil to bind firmly [45]. The polarized micrographs suggest that SAC3 exhibited the most uniform distribution of crystals among the various samples with the minimal presence of amorphous regions. In addition, SAC3 possesses smaller crystal sizes compared to SAC containing oleogels, as confirmed through X-ray analysis (Section 3.6). As the crystal size decreases, the total solid surface area increases, leading to a greater interfacial area available for oil adsorption. This results in an enhanced capacity to retain oil [46]. Hence, it can be expected that SAC3 would present a higher surface area for oil adsorption. However, the variation in the surface area did not yield any significant change in the oleogel OBC, as was observed in the preceding Section 3.1. Nevertheless, if the higher surface area has any effect on the overall firmness of the oleogel, it can be confirmed through textural analysis, which has been discussed in the subsequent section (Section 3.8). An increase in the content of SAC in oleogel samples resulted in a noticeable rise in the bright wax crystals. Specifically, SAC3 displayed a dense and uniform distribution of prominent bright crystals, while SAC10 also had a notable presence of numerous bright granular crystals, but they were dispersed in patches. The crystals within the oleogels containing SAC appeared to be brighter in comparison to those in SAC0, which could be attributed to their larger size. This increase in crystal size upon the addition of SAC has also been addressed in the XRD section (Section 3.6). The observed bright and prominent wax crystals in SAC3 are likely responsible for their higher WI value than the other oleogels, as observed in the colorimetric analysis (Figure 3d). Previous studies found that oleogel crystalline structure relies on interactions between long-chain fatty acids and n-alkanes, requiring more high melting fats for gel formation, with crystal morphology and size being vital for the gel structure and larger-sized crystal production [16]. Since SAC is a high melting point fat, this can explain the enhancement in the average size of the wax crystals of the SAC containing oleogels after the addition of SAC. The polarized microscopy confirmed that the addition of a small amount of SAC could change the morphology, growth, and nucleation process of CW crystals, confirming its role as a crystal habit modifier in CW oleogels [40].

3.4. FTIR Analysis

FTIR spectroscopy helps to identify and characterize the chemical interactions in a sample, which are represented by a typical pattern of transmittance peaks in the infrared (IR) spectrum. FTIR spectroscopy was utilized in this study to determine the functional groups and molecular interactions within the raw materials (i.e., CW, GO, and SAC) (Figure 5a) and oleogel samples (Figure 5b).
The IR spectrum of GO (Figure 5a) showed a shoulder peak at 3008 cm−1, representing the C-H stretching (or axial deformation) symmetric vibration of the cis-olefinic double bonds of alkenes [47,48]. GO is composed of 80% UFA and 20% SFA. The UFA component constitutes 42% MUFA (oleic acid) and 37% PUFA (linoleic acid). Palmitic acid (C16:0) is an SFA, a third major fatty acid, and constitutes roughly 10% of the total fatty acid content. The rest 10% is composed of minor fatty acids [49]. Such a large amount of UFAs within the GO caused the appearance of the aforementioned peak. Other peaks were also observed in the IR spectrum, such as the two sharp peaks at 2922 cm−1 and 2853 cm−1, representing asymmetric and symmetric C-H stretching vibrations of the -CH2 (methylene) group, respectively. The presence of -CH2 and -CH3 groups was further confirmed by the peaks at 1463 cm−1 and 1377 cm−1, where the former peak signifies the C-H scissor bending vibration of both of these groups, and the latter one is ascribed to the symmetrical bending of the methylene group (-CH2). A sharp and very intense peak was observed at 1745 cm−1, indicating the C=O stretching vibrations of the ester group of the UFA chain. The existence of a sharp peak located at 1161 cm−1, accompanied by two shoulder peaks at 1237 cm−1 and 1098 cm−1, indicates the vibrational stretching of C-O in ester groups or CH2 wagging [48,50]. Furthermore, a band at the wavenumber of 967 cm−1 represents the out-of-plane bending of the disubstituted trans alkene (-HC=CH-). Finally, a strong peak at 722 cm−1 signifies the rocking vibration of cis -(CH2)n- [51,52].
The IR spectral analysis of CW (Figure 5a) revealed a broad peak at 3441 cm−1, representing the -OH stretching of the alcohol and the sterol groups [53]. This also suggests the existence of intermolecular hydrogen bonding in CW. The peaks at wavenumbers 2916 cm−1 and 2849 cm−1 are ascribed to the C-H stretching vibrations of alkanes. In the lower frequency range, a strong peak at wavenumber 1735 cm−1 indicates the presence of the C=O group of esters. A small peak at 1649 cm−1 represents the C=C of the monosubstituted alkene. Additionally, the peaks at 1465 cm−1 and 1375 cm−1 correspond to the CH2 bending and CH3 bend, respectively. The peak at 1171 cm−1 is due to the -C-O-C- stretching, and the peak at 722 cm−1 represents the rocking vibration of the aliphatic -CH2 group [54].
The IR spectral analysis conducted on SAC (Figure 5a) revealed two prominent bands in the high-frequency region at wavenumbers 2916 cm−1 and 2849 cm−1, which correspond to the asymmetric and symmetric stretching vibrations of the -CH2 group, respectively. A strong peak observed at 1696 cm−1 indicates the -COOH group in SAC [55]. The -CH2 bending vibrations in alkanes were represented by a peak at 1461 cm−1, accompanied by a shoulder peak at 1422 cm−1. Additionally, another peak at 1322 cm−1 was also observed. The peaks at 1696 cm−1, 1461 cm−1, and 1322 cm−1 are regarded as the characteristic peaks of SAC [56]. Another peak at 937 cm−1 was attributed to the bending vibrations of hydrogen bonds (OH-H) of the carboxylic acid groups [57]. The peak at 722 cm−1 was assigned to the rocking vibration of -CH2 groups [58].
The FTIR spectra of the oleogel samples (Figure 5b) were studied to learn the interactions between the raw materials. All oleogel samples had the same peak location and intensity in their spectra compared to SAC0, the control sample. The cis =CH- stretching vibrations are represented by a small peak at 3008 cm−1. A sharp and intense peak at 2922 cm−1 and a shoulder peak at 2853 cm−1 correspond to the asymmetric and symmetric stretching vibrations of the -CH3 (methyl) group, respectively. Another strong peak was also observed at 1745 cm−1, representing the conjugated C=O stretching vibrations. The peak at 1461 cm−1 was attributed to the -CH2 bending vibrations, and a short peak at 1375 cm−1 can be assigned to the -CH3 bending vibrations. Very strong and sharp peaks at 1237 cm−1 and 1161 cm−1 correspond to the -C-OH stretching vibrations. The occurrence of a short but sharp peak at 1098 cm−1 was attributed to the -C-O stretching vibrations, and the peak at 967 cm−1 was assigned to the out-of-plane bending of the disubstituted trans alkene. Further, a strong and sharp peak at 722 cm−1 was attributed to the -CH2 rocking vibration [59]. However, the 3441 cm−1 peak in CW, which represents the O-H stretching in alcohol and denotes the presence of intermolecular H-bonding, was not observed in the oleogel samples. This could be due to either a negligible quantity or a complete absence of hydrogen bonding in the oleogels.

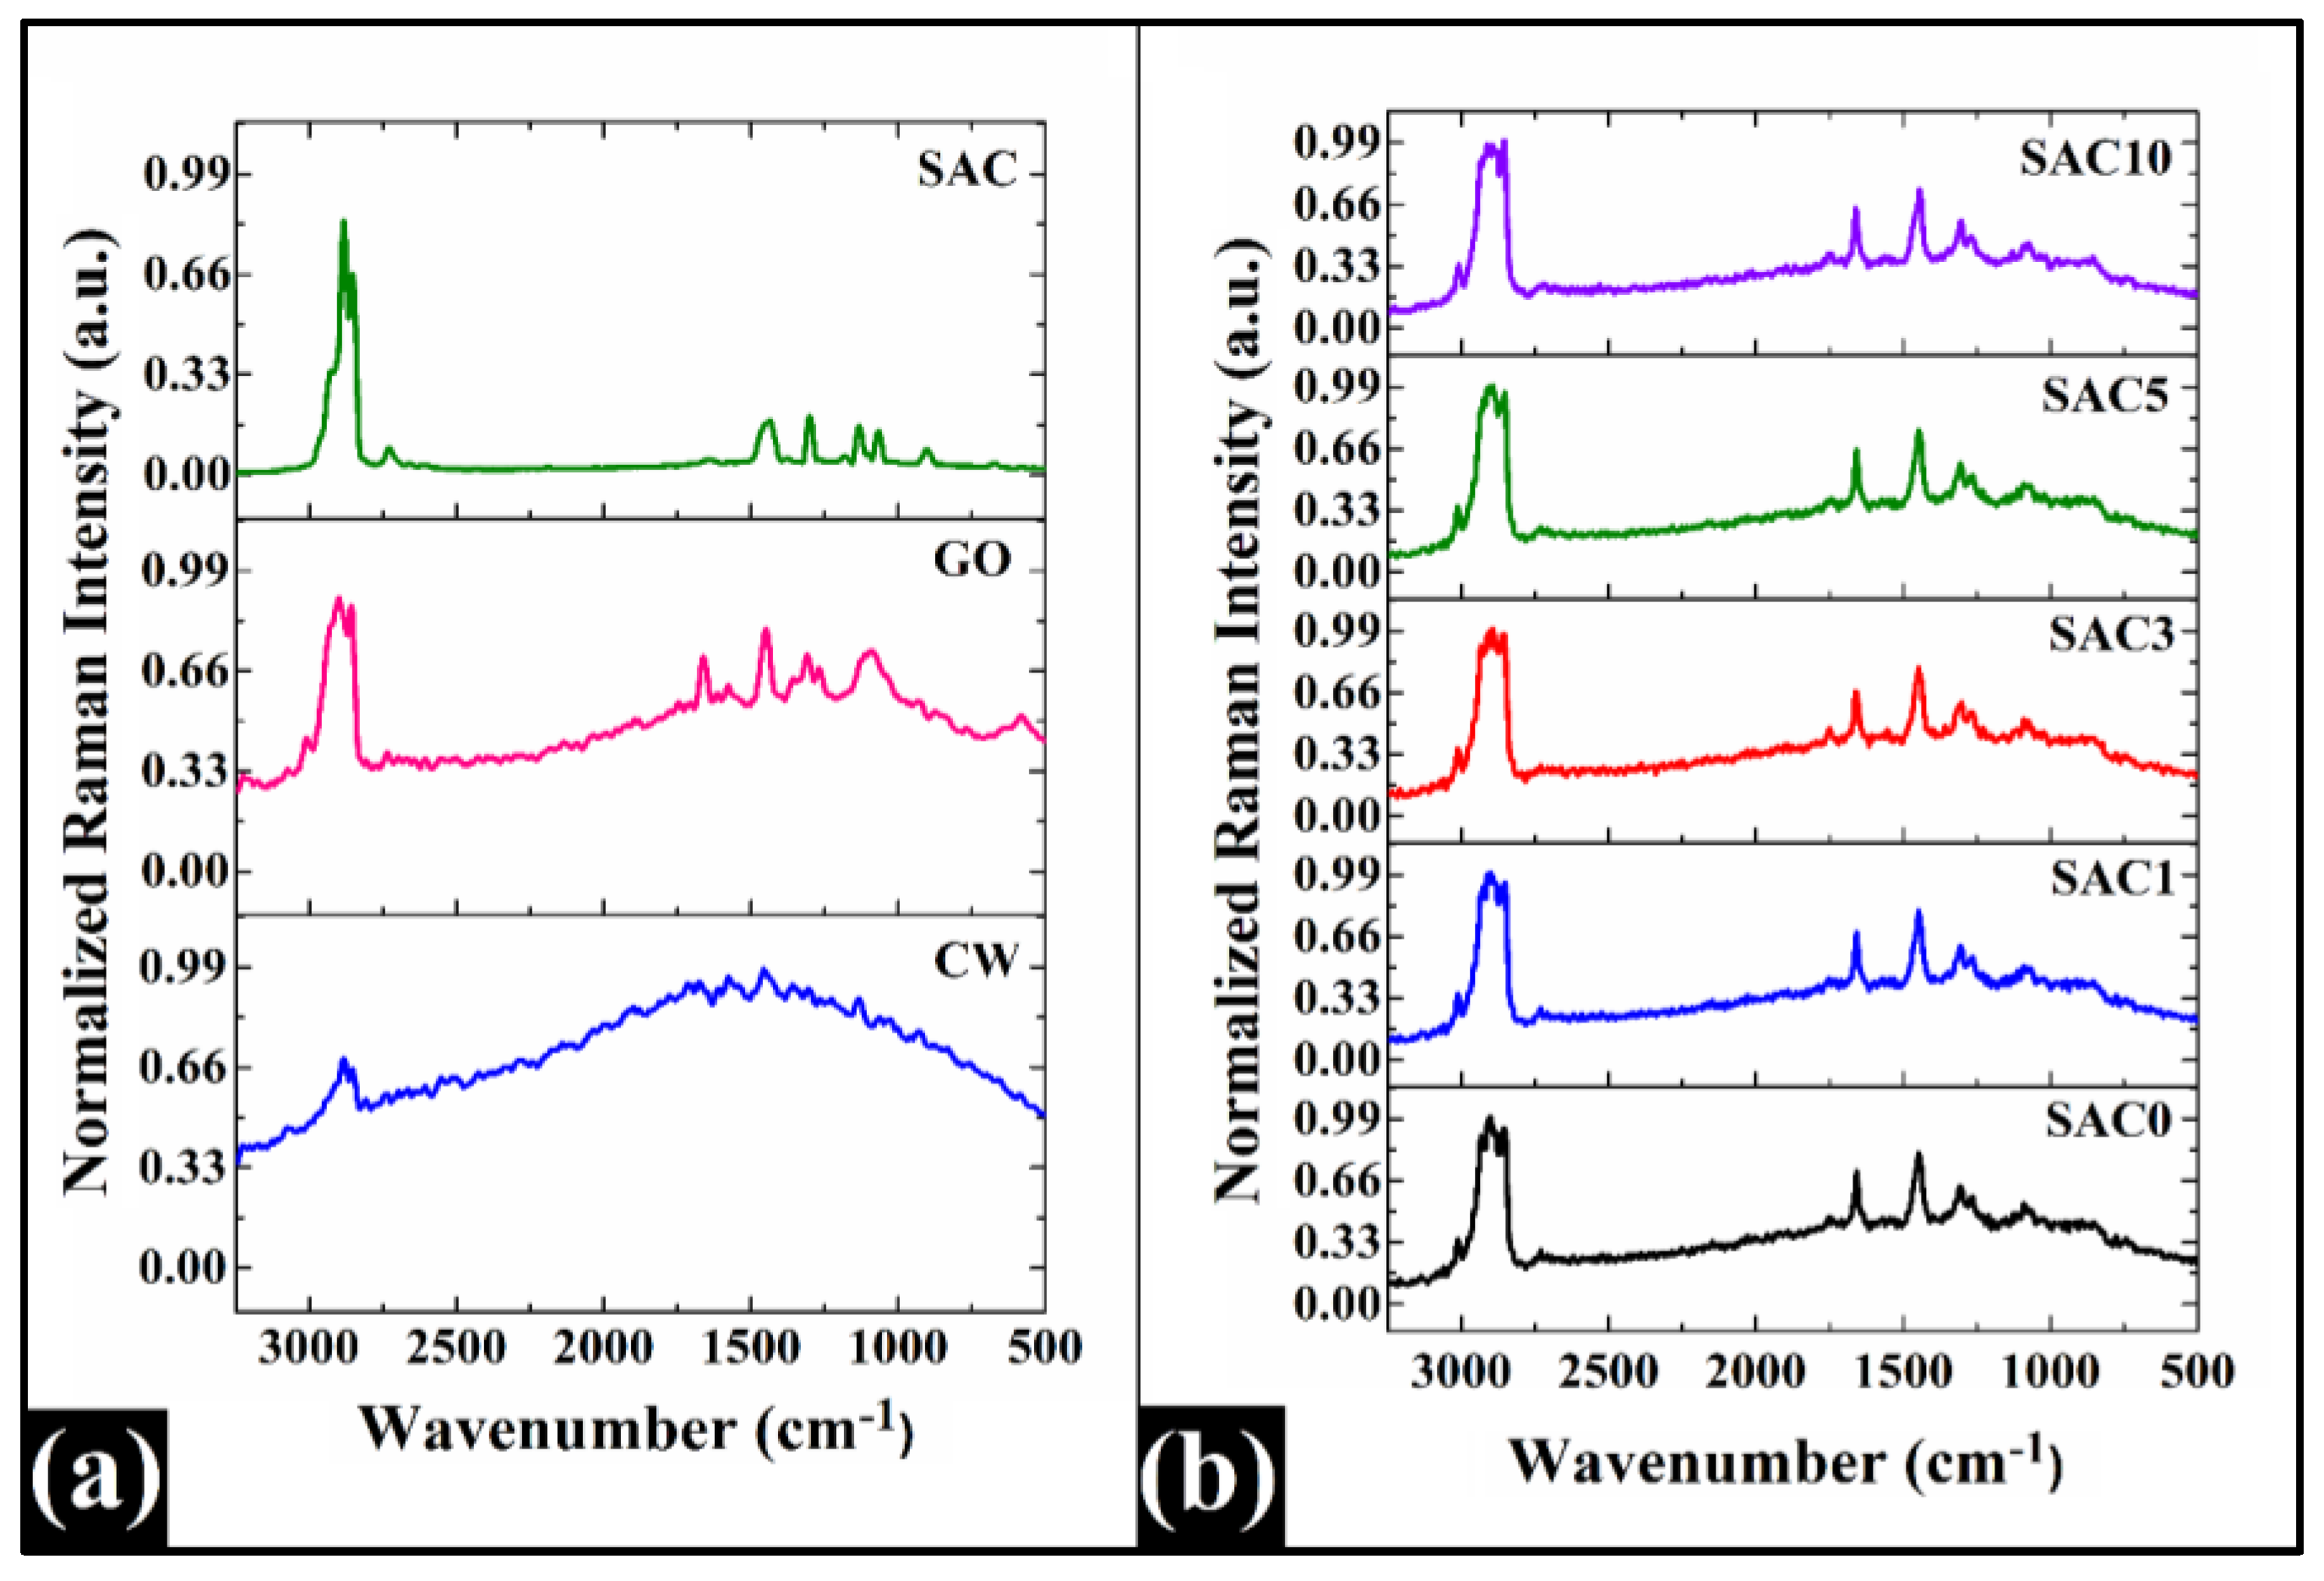
3.5. Raman Spectroscopy

Raman spectroscopy facilitates the identification of sample composition and chemical bonding. It also provides insight into the vibrational energy modes of molecules, crystal structure, and symmetry of materials. The Raman spectral data were generated for the raw materials (i.e., CW, GO, and SAC) (Figure 6a) and oleogel samples (Figure 6b) to further characterize them for their various chemical groups, bonding interactions, and crystallinity.
The Raman spectra obtained from the sample of CW (Figure 6a) exhibited two distinct peaks in the higher wavelength ranges, at 2844 and 2874 cm−1, which are indicative of the symmetric and asymmetric stretching of the methylene (-CH2) groups, respectively. A weak peak was observed at 1677 cm−1, indicating the presence of ester content in the sample. Further, in the lower wavelength region, two peaks were observed at 1456 and 1305 cm−1. These peaks can be attributed to the bending vibrations of the methylene groups (-CH2). Lastly, two peaks were located at 1131 and 1062 cm−1, suggesting the presence of the -C-C- group and -C=O group, respectively [54].
In the spectra of GO (Figure 6a), the presence of a minute peak at 3009 cm−1 signifies the existence of a cis -C=C- (alkene) structure. This is followed by two peaks at 2899 cm−1 and 2857 cm−1, denoting the -CH(CH2) asymmetric and symmetric structures, respectively. The spectra manifested a cluster of peaks within the range of 1700 and 1000 cm−1. The peak at 1661 cm−1 indicated a cis -C=C- stretching vibration, while a peak at 1448 cm−1 signifies an asymmetric CH3 deformation vibration [60]. Additionally, the presence of -CH3 and unconjugated cis =CH-H deformation vibrations was indicated by the two peaks observed at 1309 and 1269 cm−1, respectively [60]. Zhao et al. (2022) have reported that the ratio of peak intensities at 1309 and 1269 cm−1 also compares the fatty acid saturation between different oils [61]. At a lower wavelength of 1094 cm−1, a peak manifests the -C-O ester structure [62].
The Raman spectra of SAC (Figure 6a) exhibited prominent peaks corresponding to -C-C- stretching, -CH2, and -CH3 functional groups. The C-H stretching region, encompassing both symmetric and asymmetric vibrations that are attributed to CH, CH2, and CH3 groups, falls within the range of 2800 to 3100 cm−1. The -CH3 groups were represented by peaks at 2909 and 2967 cm−1, while the presence of the -CH2 group was indicated by peaks at 2832 and 2888 cm−1 [63]. Further, the peak at 1650 cm−1 can be attributed to the C=O stretching in the carboxyl group. Additionally, a peak at 1436 cm−1 reveals CH2 bending, whereas 1301 cm−1 indicates CH2 twisting and rocking vibrations. The presence of C-C stretching was indicated by a peak at 1131 cm−1, while a peak at 1066 cm−1 denotes C-C stretching vibration. Moreover, CH2 rocking vibration was evidenced by a peak at 903 cm−1 [63,64].
The oleogels, which were developed by combining the aforementioned components, exhibited spectra that closely resembled that of GO (Figure 6b). A peak at 3013 cm−1 represented the -C=C cis structure, while the peak at 2903 cm−1 indicated the -CH2 asymmetric structure. The peak at 2857 cm−1 represented the -CH2 symmetric structure [65,66]. A peak at 2731 cm−1 indicated the presence of -C=O Fermi resonance. A bulge in the spectra ranging from 2500 cm−1 to 500 cm−1 typically indicates fluorescence and suggests the presence of amorphous regions in oleogel samples [54]. Furthermore, a peak at 1749 cm−1 indicated the presence of the -C=O structure, while the peak at 1658 cm−1 represented the cis -C=C olefinic molecular vibrations. The occurrence of a peak at 1448 cm−1 could potentially represent a -C-H (-CH3) asymmetric structure in the case of oil. It may also signify the -CH2 vibrational bending of methylene groups due to the presence of candelilla wax. Additionally, two peaks at 1309 and 1269 cm−1 corresponded to the -CH3/=CH-H group, and a peak at 1156 cm−1 corresponded to the -C=O group (ester) [67]. A peak at 1082 cm−1 represented the -C-O ester structure, while the peak at 861 cm−1 represented =CH2 wagging. Lastly, the peak at 742 cm−1 represented -(CH2)n- rocking vibration [61].

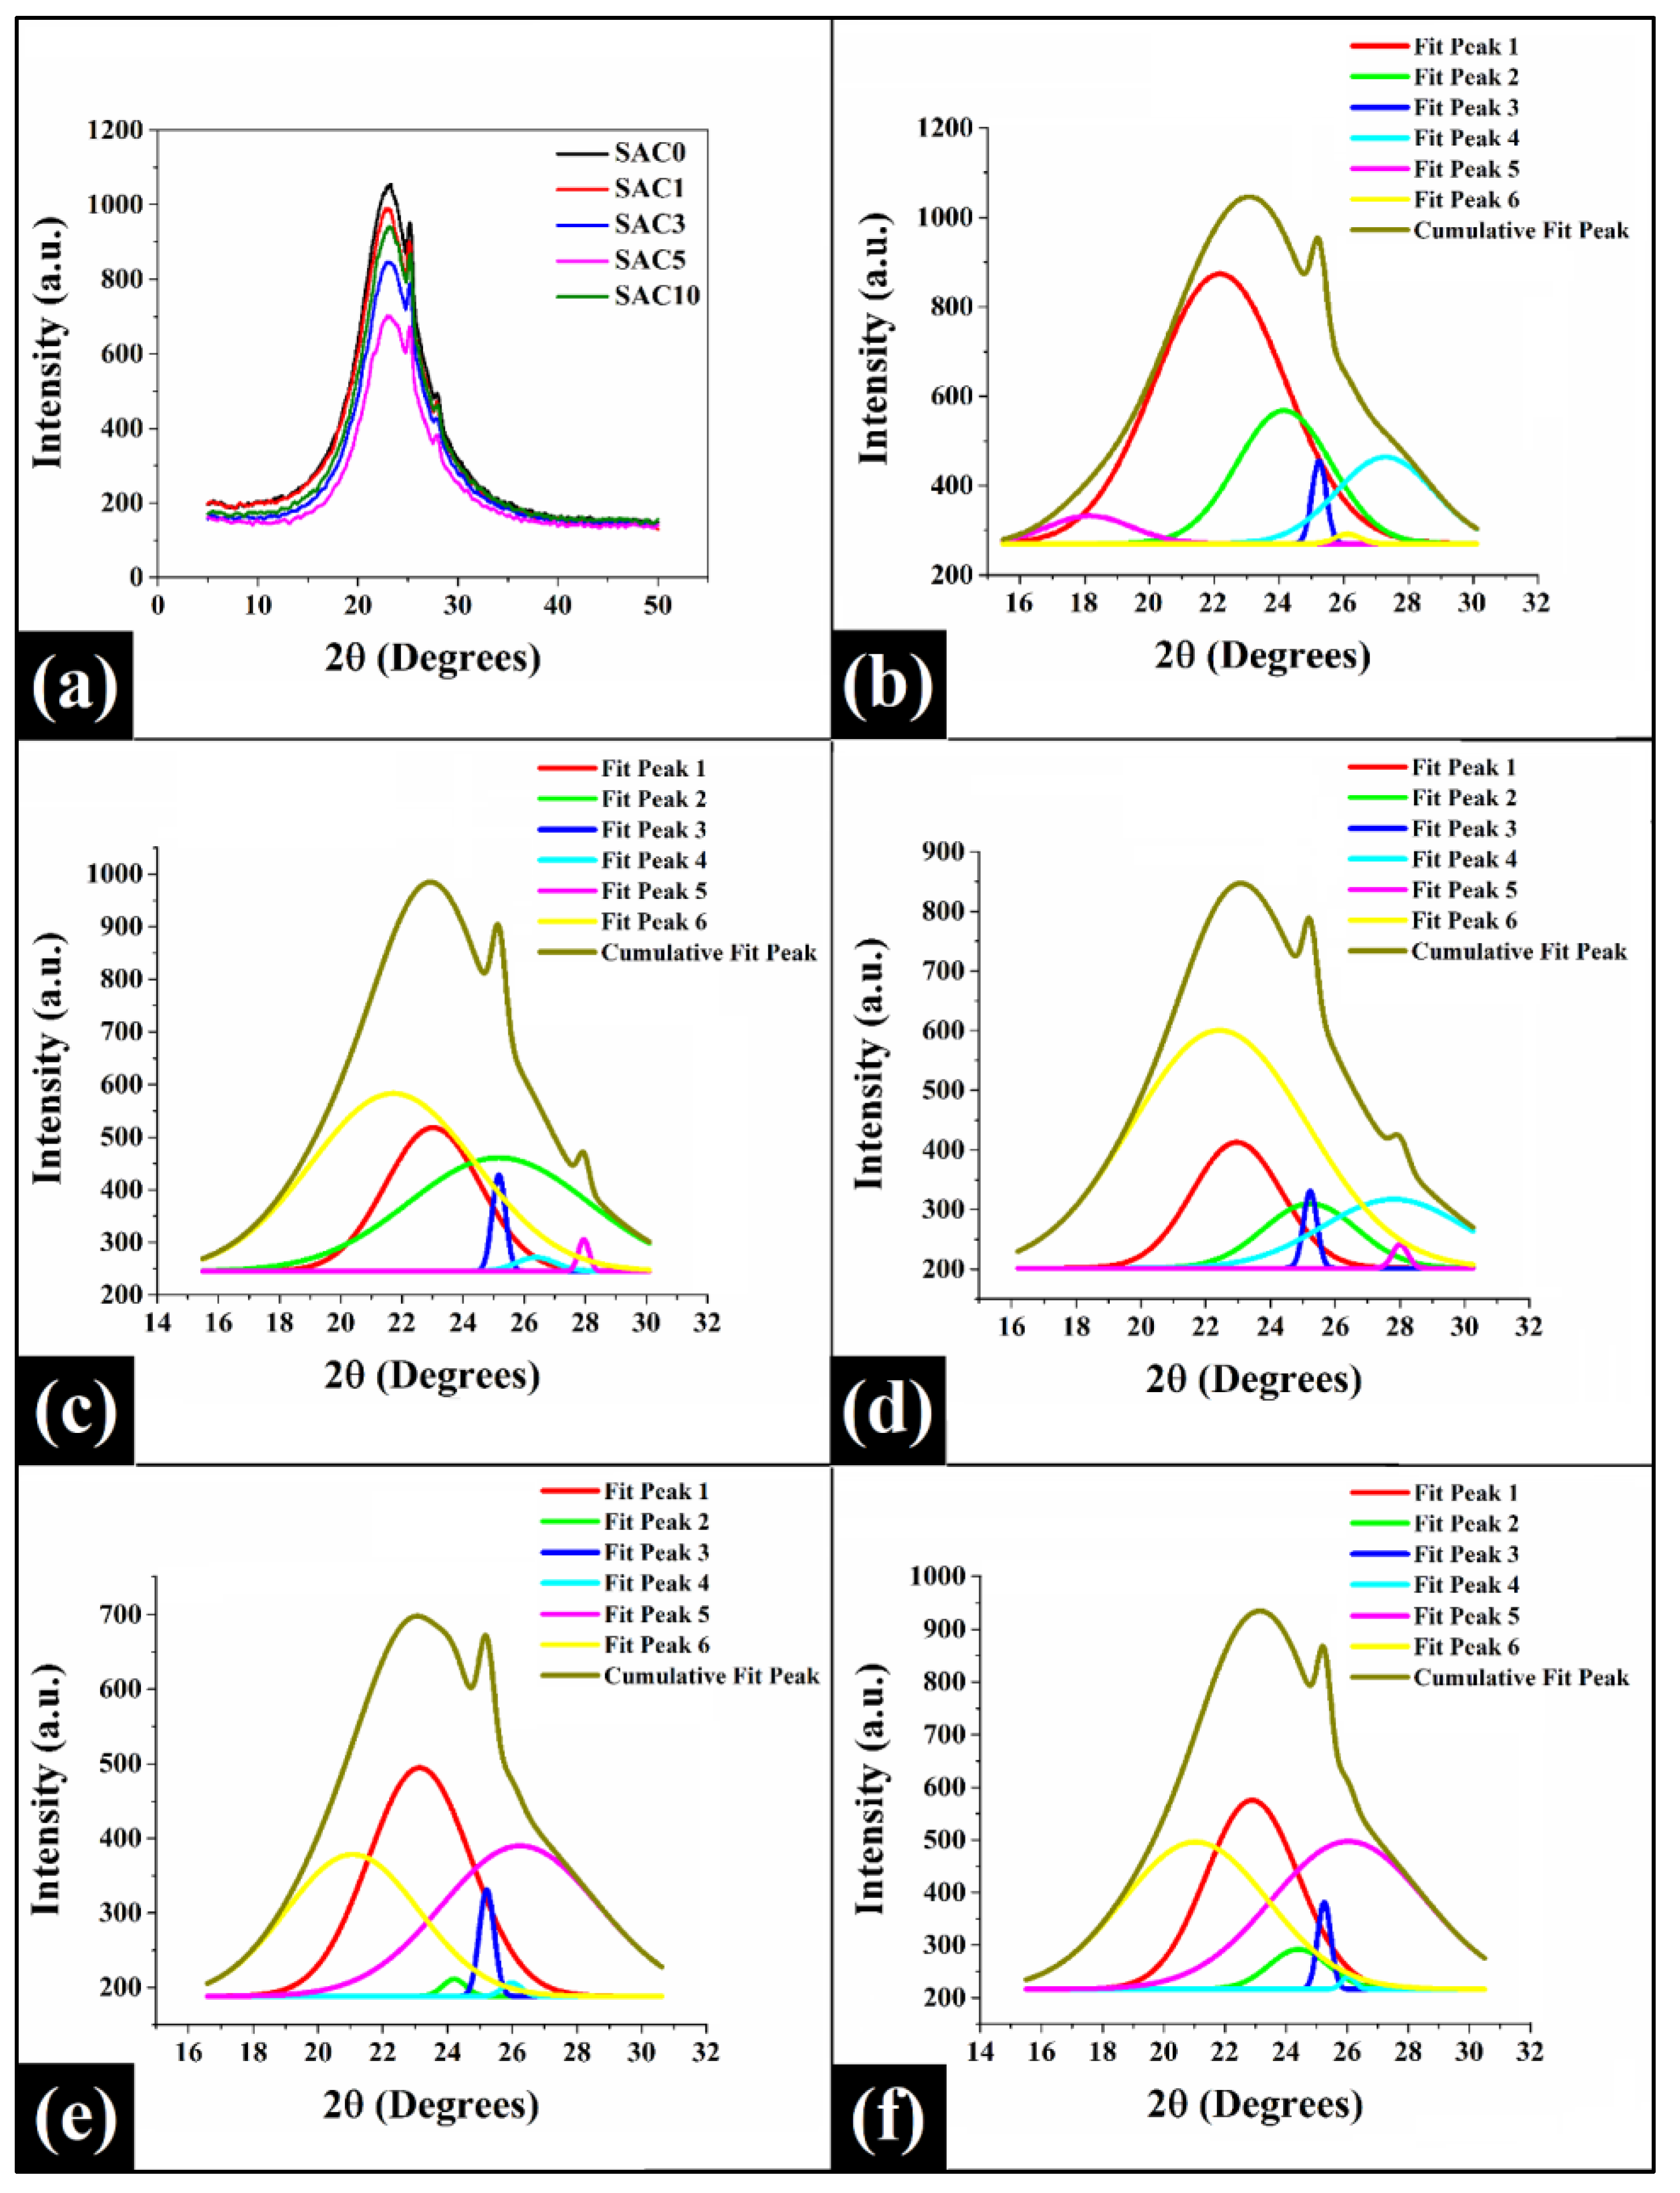
3.6. X-ray Diffraction

XRD is a valuable tool for determining the crystalline structure of a substance at a molecular level. It allows the characterization of atomic and molecular structures of materials by evaluating parameters such as crystallite size and lattice strain. In the food industry, XRD is extensively used to investigate the polymorphism of fats, which refers to the different crystal arrangements of the long hydrocarbon chains in fats [68,69,70]. The three most commonly observed polymorphic structures in fats are α, β′, and β, in increasing order of stability [71]. These polymorphs produce distinct peaks in the XRD pattern due to their characteristically close fatty acyl chain spacings [72]. Since wax-based oleogels also show similar chain spacings, they are believed to possess similar XRD patterns [16]. Figure 7 presented the X-ray diffractograms of the oleogel samples, which displayed the intensity as a function of 2θ (degrees). These diffractograms displayed three significant peaks, identified at 2θ values of around 23.2, 25.1, and 28 degrees. Among the three aforementioned peaks, there was an initial broader amorphous peak, accompanied by a sharp crystalline shoulder peak. This indicates the semi-crystalline nature of the oleogel [16], as was also evident in the polarized light micrographs showing both crystalline and amorphous regions in Figure 4. Further, there was an observed shift in the peak positions with the change in the SAC concentrations in oleogels, as can be observed in Table 2.
A comparison of the XRD curves of the prepared oleogels (Figure 7a) revealed differences in peak intensity and width. It is generally acknowledged that the width of a peak reflects the orientation of polymer chains in a specific plane, while the height or intensity of the peak represents the density of the crystallites [73,74]. The XRD analysis revealed the following order of increasing peak intensity and width: SAC0, SAC1, SAC10, SAC3, and SAC5. This suggests that SAC0 exhibited the most well-aligned and densely packed crystal arrangement, whereas SAC5 possessed the lowest degree of alignment and crystal density. Typically, peak width is also inversely proportional to crystallite size [75], and SAC0 exhibited the highest peak width, indicating the smallest crystallite size. However, as SAC is added, peak width reduces, indicating an increase in crystallite size. Therefore, it confirms that the addition of SAC in the oleogel caused an increase in wax crystal size.
The deconvolution of XRD graphs of all the oleogel samples using the Gaussian peak function led to the identification of six significant peaks (shown in different colors), each with its distinct intensity, position, and width, as depicted in Figure 7b–f. Deconvolution of the peaks offered values for various XRD parameters, such as peak position (xc), peak width (FWHM), height, etc. These values were then employed for the computation of additional XRD parameters, including d-spacing (Equation (5)), crystallite size (Equation (6)), lattice strain (Equation (7)), and dislocation density (δ) (Equation (8)). The results of these computations are presented in Table 2.
The d-spacing values of the oleogel samples indicate a common occurrence of two d-spacings, approximately 3.7 Å and 4.1 Å (Table 2). These d-spacings in the wide-angle region of XRD patterns are indicative of the metastable β’-polymorphic form characterized by an orthorhombic subcell packing [76]. This also aligns with the findings from XRD spectra of pure CW and the 3% CW/olive oil oleogel. It was reported that the β′ polymorphic form exhibits small fat crystal sizes that resemble fine grains, a characteristic that is evident in the polarized micrographs obtained from our study. This property facilitates the production of margarine and shortenings with a smooth texture and high spreadability [77,78]. Additionally, a d-spacing value of around 4.6 Å was observed in all the oleogel samples, which corresponds to the stable β-polymorphic form characterized by a triclinic subcell arrangement [71,79]. This study is consistent with that reported in RBX-based refined corn oil oleogels, where similar d-spacing values were identified [80]. The highest d-spacing value was observed in SAC0, indicating a loose arrangement of wax crystals [70]. As the SAC content increased, there was a corresponding decline in the d-spacing values, where SAC3 exhibited the lowest d-spacing value. A decrease in the d-spacing value results in a compact lattice structure of crystalline domains in the oleogel [81]. The samples SAC1, SAC5, and SAC10 exhibited similar d-spacing values, signifying their comparable level of packing and compactness. It can be inferred that the SAC increased the compactness of the crystal lattice by modifying the crystallization of the CW crystals [81]. A high concentration of SAC may interfere with the crystallization of other oleogelators, leading to a weaker network, as reported in a study [82]. This weaker network could also increase the interplanar distance (d-spacing). The high d-spacing value in other SAC-containing oleogels could be due to this reason. A total of 3 mg SAC concentration, i.e., an intermediate concentration in SAC3, promoted a strong network, resulting in a low d-spacing value and a compact crystalline network. It is likely that the increased compactness observed in the SAC3 sample, as indicated by its lower d-spacing values, was the reason for its higher WI and lower YI values. When wax crystals are ordered and compact, they scatter less light, resulting in a greater WI.
Table 2 showed that SAC0 had the smallest average crystallite size among the samples, followed by SAC3, SAC10, SAC5, and SAC1 in ascending order. The average crystallite size of SAC1 and SAC5 was nearly equal. SAC3 displayed the smallest average crystallite size among the SAC-containing oleogel samples. The reduction in crystal size could increase crystal compactness [83], as also evident from the d-spacing values of the oleogels, which may also affect firmness [84]. Additionally, the increase in wax crystal size with the addition of SAC suggests a modulation in the cooling rate and crystal growth kinetics [85], which has also been discussed in the following section (Section 3.7). The term ‘lattice strain’ is associated with the deformation or defect that occurs in the lattice. All oleogels exhibited a lattice strain value of 0.6, except for SAC1, which displays a value of 0.5. This indicates that the incorporation of SAC did not significantly alter the lattice strain of the wax crystals. Furthermore, the dislocation density, represented as δ, was calculated to evaluate any dislocations that may have occurred in the crystalline material during solidification. Contrary to lattice strain values, oleogel samples exhibited an increase in δ. The observed δ values ranged from 0.09 to 0.15, with the exception of SAC1, which had a lower value (δ = 0.09) compared to SAC0 (δ = 0.1). According to previous research [86], at a given strain value, dislocation density is inversely proportional to the crystal size. In the present study, SAC3 was found to have the highest δ value, which correlated with its smallest crystallite size among oleogel-containing samples. SAC3 is followed by SAC10, SAC5, and SAC0 in decreasing order. This suggests that the addition of SAC to the oleogel samples resulted in the introduction of dislocations, as evidenced by the increased δ values. Interestingly, this dislocation has had a beneficial effect on the SAC3 oleogel, which exhibited more prominent, brighter, and smaller crystals, as confirmed by the polarized micrographs and XRD analysis. Therefore, in general, XRD analysis has further confirmed the role of SAC as a crystal habit modifier.

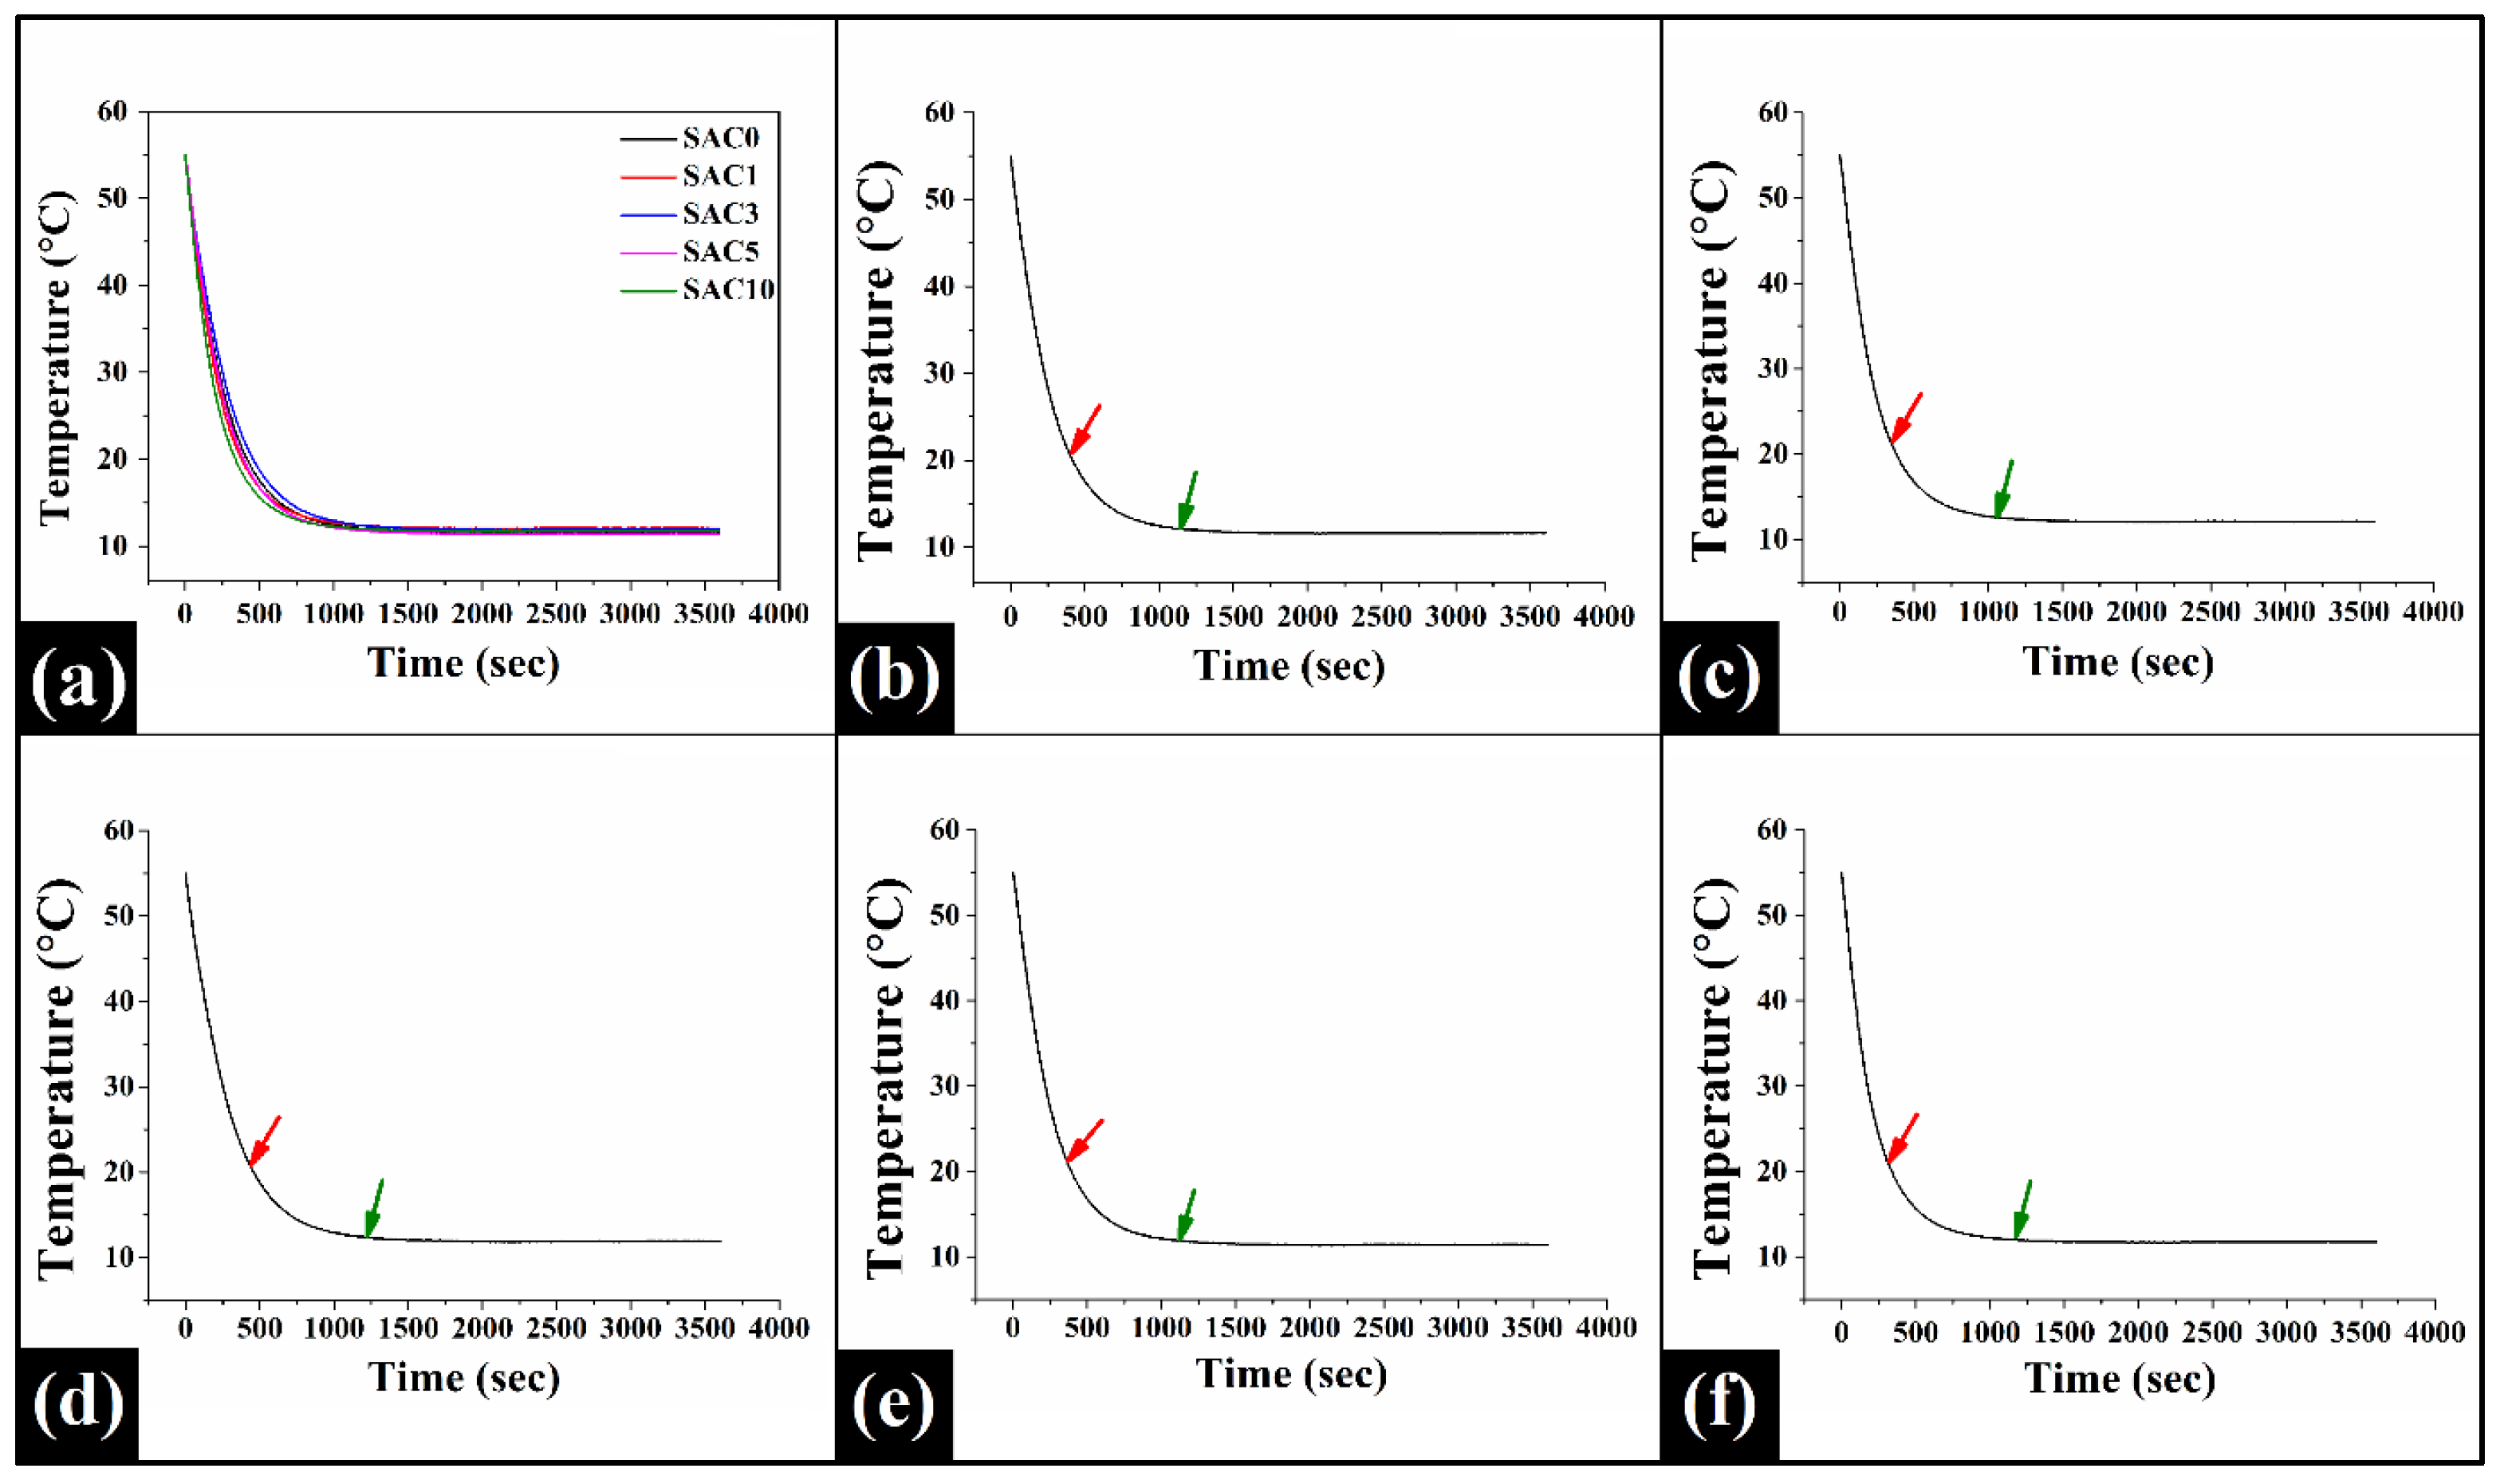
3.7. Crystallization Kinetics

In general, the crystallization of fats is a multi-step process that consists of three distinct phases. The first phase, known as nucleation, involves the aggregation of triacylglycerols (TAGs) to form a crystal nucleus. The second phase, referred to as growth, involves the extension of the crystal nucleus through the deposition of nearby TAGs onto its surface [87]. Finally, the network consolidation phase occurs as the system reaches thermal equilibrium, signaling the completion of the fat crystallization process. Figure 8a compares the crystallization kinetic profiles of all oleogel samples, whereas Figure 8b–f displays the crystallization kinetic graphs of each oleogel. CW has a melting point of 68–72 °C [88,89]. As it cools down, it starts to crystallize until it reaches a state of equilibrium, i.e., a state where the rate of crystallization is balanced by the rate of melting. In this context, to establish the crystallization kinetics of CW/GO/SAC oleogel, we recorded the change in temperature with time starting from 55 °C (Table 3). All the crystallization kinetic profiles consist of three different stages, representing the fat crystallization process. These three stages are represented as initial, intermediate, and saturation. The initial stage involves a sharp decline in temperature, marked by red arrows in the temperature vs. time graphs (Figure 8b–f). This stage represents the nucleation phase of the wax crystals and is termed the onset of secondary crystallization. This is followed by a slow change in temperature, indicating the growth phase, and then, a constant or saturated temperature is maintained (marked by green arrows), which shows thermal equilibrium in the crystallization process [90]. The onset of equilibrium in all oleogels was found to occur within the temperature range of 10–15 °C.
The graphs presented in Figure 8b-f reveal that all the oleogel samples showed a similar time of onset of secondary crystallization when compared to SAC0, with the exception of SAC3. Statistical analysis revealed that SAC3 had a significantly higher onset of secondary crystallization time (430 ± 20 s) compared to SAC1 and SAC10 (p < 0.05) (Table 3). The onset of secondary crystallization in all the oleogel samples was observed to occur between 310–430 ± 46 s (Table 3). Furthermore, all the oleogel samples were found to have a similar time to reach thermal equilibrium (or network consolidation phase) with SAC0, ranging from 1013 to 1220 s ± 137 s (Table 3). However, as observed in the onset of secondary crystallization, SAC3 also demonstrated a significantly higher thermal equilibrium onset time (1220 ± 79.37 s) than SAC1 and SAC10 (p < 0.05) (Table 3). The results indicate that adding SAC did not significantly affect the crystallization time of SAC1, SAC5, and SAC10. However, it was observed that the crystallization onset time of SAC3 was hindered. This may be attributed to the formation of a compact arrangement in the structure of SAC3, which impeded the crystallization process. Furthermore, it was noted that the presence of SAC caused a delay in the attainment of thermal equilibrium in SAC3, which led to the complete crystallization. This could be due to the extended time required for the formation of prominent wax crystals in SAC3 [15], as observed in polarized micrographs (Figure 6). This also proved the role of SAC as a crystal habit modifier.
To comprehensively analyze the crystallization kinetics curves, the initial portion of the crystallization curve (0–350 s) was thoroughly scrutinized and fitted to an exponential decay function. The function is mathematically denoted as follows:
y = a e k t
where ‘a’ stands for initial temperature (°C), ‘k’ for crystallization rate, and ‘t’ for time (s). An exponential function is generally used as a mathematical approximation to describe the kinetics of a process.
Based on the results obtained from the above curve fitting, the rate of crystallization has been successfully determined (Table 3). Upon analysis, it was observed that the rate of crystallization in the oleogel samples was consistent and comparable (p > 0.05) with the SAC0 (Table 3). This finding suggests that the presence of SAC did not significantly alter the crystallization rate in the oleogel samples.

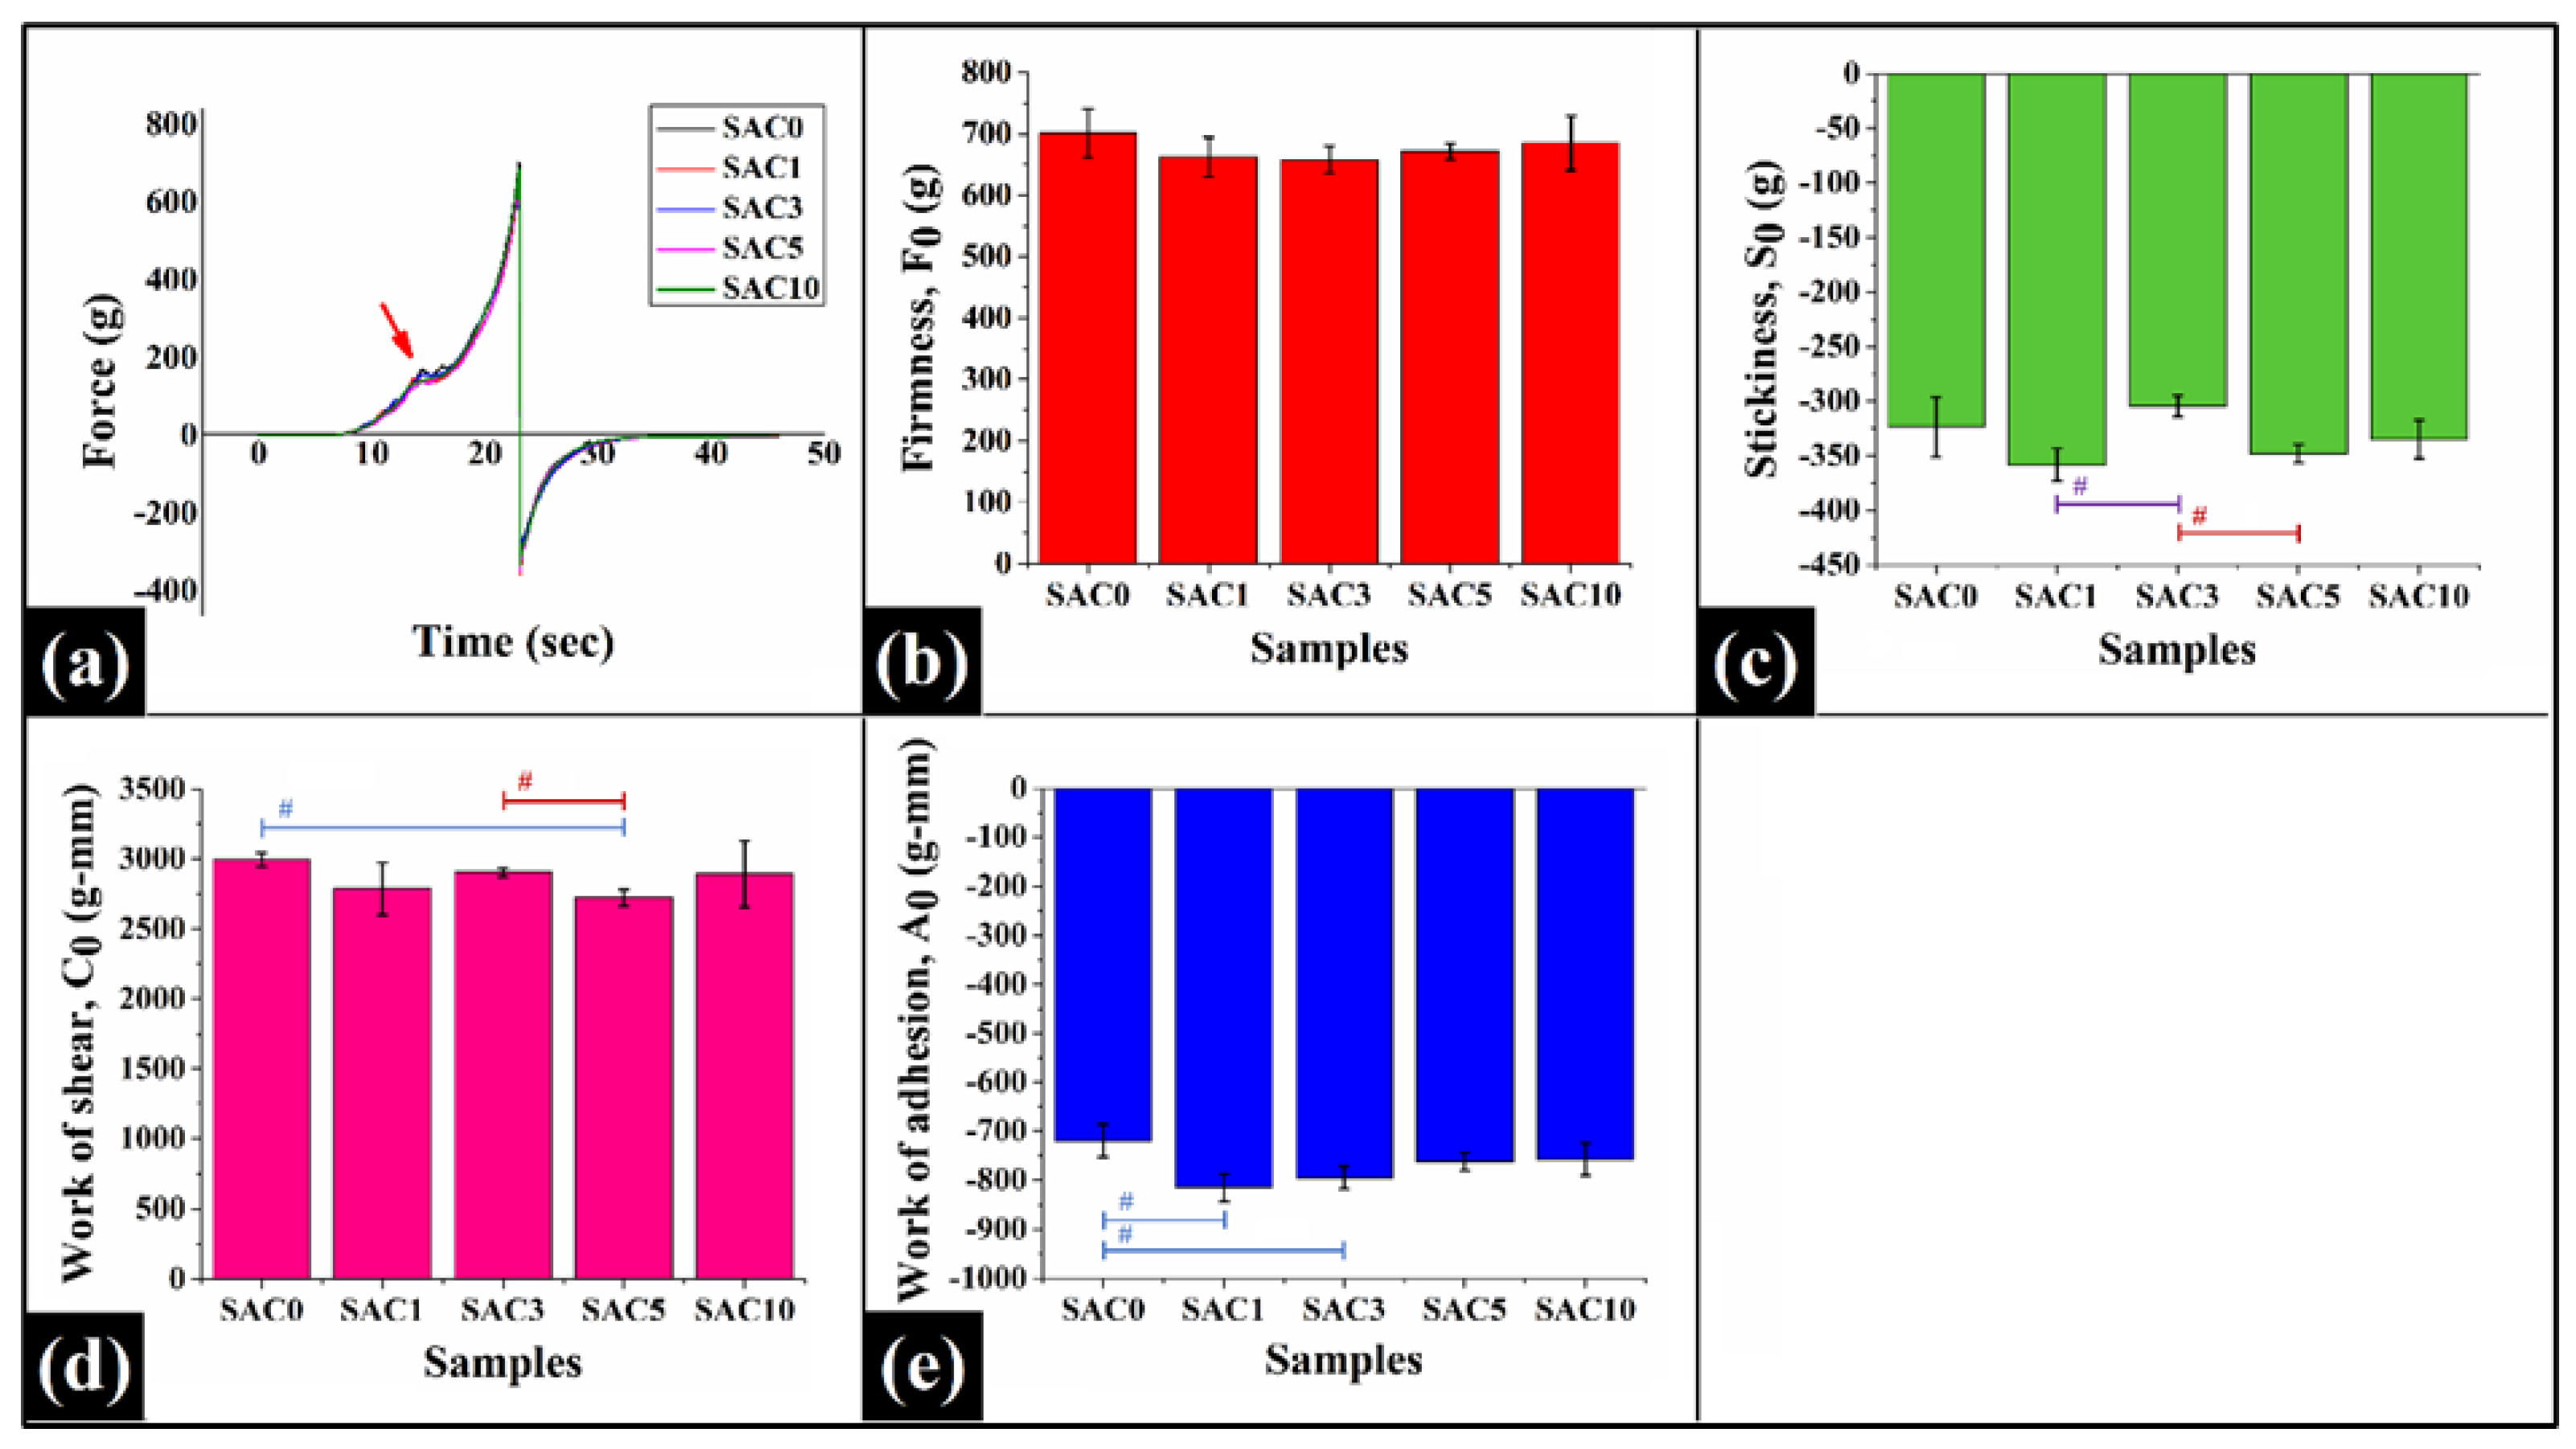
3.8. Texture Analysis

The textural attributes of a food product play a significant role in shaping the customers’ perception of its quality. These properties also have a significant impact on the organoleptic features of the food items. The present study evaluated the textural characteristics of oleogels through the spreadability test. This test is widely utilized to measure the material’s firmness (F0), stickiness (S0), shear work (C0), and adhesion work (A0). Apart from this, this test also gives insight into the brittleness of the material. These parameters are used to determine the suitability of oleogels for applications such as spreads and margarine.
As part of the study, the oleogels underwent penetration testing using an upper perspex male cone. The force experienced by the cone during the test gradually increased until it reached its maximum at the designated deepest point. The entire spreadability test was recorded and plotted as a force (g) versus time (s) graph (Figure 9a). This maximum force, represented by the absolute positive peak on the force versus time graph (Figure 9a), was used to calculate the F0 values (Figure 9b). The penetration process resulted in the oleogel samples spreading from the lower cone. Upon the return of the upper cone to its original position, the force values became negative. The maximum negative force, represented by the absolute negative peak on the graph in Figure 9a, was used to determine the S0 values (Figure 9c). The C0 values obtained from the positive area under the curve are shown in Figure 9d, while the A0 values were derived from the negative area under the curve (Figure 9e).
The spreadability profiles (Figure 9a) of the oleogels revealed the brittleness in the samples, as reflected by the inflections (marked by a red arrow) recorded in the initial 10–20 s [91]. Brittleness is associated with the formation of a gel network that is less cohesive and, therefore, weak and susceptible to break. It has been reported that wax-esters are responsible for the brittleness of the oleogels [92,93]. Since CW consists of 15 to 29% wax esters, this may account for the brittleness of the oleogels. In oleogels, firmness is defined as the force needed to deform the gel with a probe. The results, as seen in Figure 9b, indicate that the firmness of all oleogel samples was similar (p > 0.05), indicating that the presence of SAC had little impact on the firmness of the oleogels. These results can be corroborated with the findings of Hwang et al., (2018), who found that despite the high melting point of SAC, which provides more solid fats at a given temperature compared to unsaturated fats, a higher concentration of SAC, did not result in higher firmness when added to sunflower wax/soybean oil oleogel at room temperature. The authors concluded that SAC crystallization might have disrupted the fine crystal network of oleogel, leading to the decrease in firmness of high SAC-containing oleogel [82]. The observed similar firmness in our oleogels may be attributed to this conclusion. At low SAC concentrations, such as SAC1, the effect was not particularly noticeable; however, as more SAC was added, its crystallization likely disrupted the crystal network of the CW-GO oleogel, which possessed very fine wax crystals. Consequently, this resulted in an insignificant change in firmness from SAC0. Additionally, SAC produces larger crystals [94,95] compared to CW, which may have further disturbed the overall fine crystal network of the oleogel. The relative stickiness (S0) of the prepared oleogels (Figure 9c), demonstrates the force needed to overcome the forces of attraction between the sample and probe. The influence of increased SAC content on S0 values revealed that, with the exception of SAC3, there was no significant difference observed among the samples (p > 0.05). However, SAC3 exhibited a significantly lower S0 value in comparison to SAC1 and SAC5 (p < 0.05). The stickiness measurements varied from −304.54 g for SAC3 to −358.183 g for SAC1.
Work of shear (C0) (Figure 9d) refers to the total force needed to shear a material. It is a good measure of spreadability that can be tested in spreadable products, such as cream cheeses. As C0 decreases, the ease of spreading increases, and vice versa. The recorded C0 varies between 2721.41 g of SAC5 (lowest) and 2993.29 g of SAC0 (highest) (Figure 9d). Unlike F0, there were occurred some significant changes in the C0 value. The findings indicate that SAC5 exhibited the least C0 value, notably lower than SAC0 and SAC3 (p < 0.05). As a result, SAC5 was concluded to be the most spreadable oleogel. The work of shear is also indicative of the level of cohesiveness that exists within a sample [15]. Among the SAC-containing oleogel samples, SAC3 had the highest C0 value, indicating its high cohesiveness and low spreadability. This high cohesiveness is evidenced by its smaller crystal size than other SAC-containing oleogels and smallest d-spacing value, as confirmed by the XRD data (Table 2), which contribute to its compact structure and ability to retain more oil, as stated in Section 3.1. The SAC0 was found to have a notably elevated C0 value in comparison to that of SAC3 despite having a high d-spacing value. This phenomenon can be ascribed to the existence of a substantial interplanar spacing, which was countered by the strength of molecular interactions within the sample. Conversely, the samples that exhibited a high C0 value and a lower d-spacing value indicated the formation of increased bonding or network structures due to the addition of SAC. In this capacity, SAC served as a lubricant, enhancing the spreadability of the sample. The similarity between the C0 values of SAC1, SAC5, and SAC10 (p > 0.05) could be correlated with their similar d-spacing values.
The phenomenon of work of adhesion (A0) (Figure 9e) pertains to the pull-off force needed to separate surfaces. This force was applied on oleogels during the return of the probe to its original position after spreading. Our findings indicate that the addition of SAC led to a significant increase in A0 values in SAC1 and SAC3 when compared to SAC0 (p < 0.05) (Figure 9e). However, no significant change was observed between the A0 values of SAC1 and SAC3 (p > 0.05). Further increments in SAC concentration, as seen in SAC5 and SAC10, did not result in any changes to the A0 values. The negative area (work of adhesion) values ranged between −756.97 g of SAC10 and −815.264 g of SAC1.

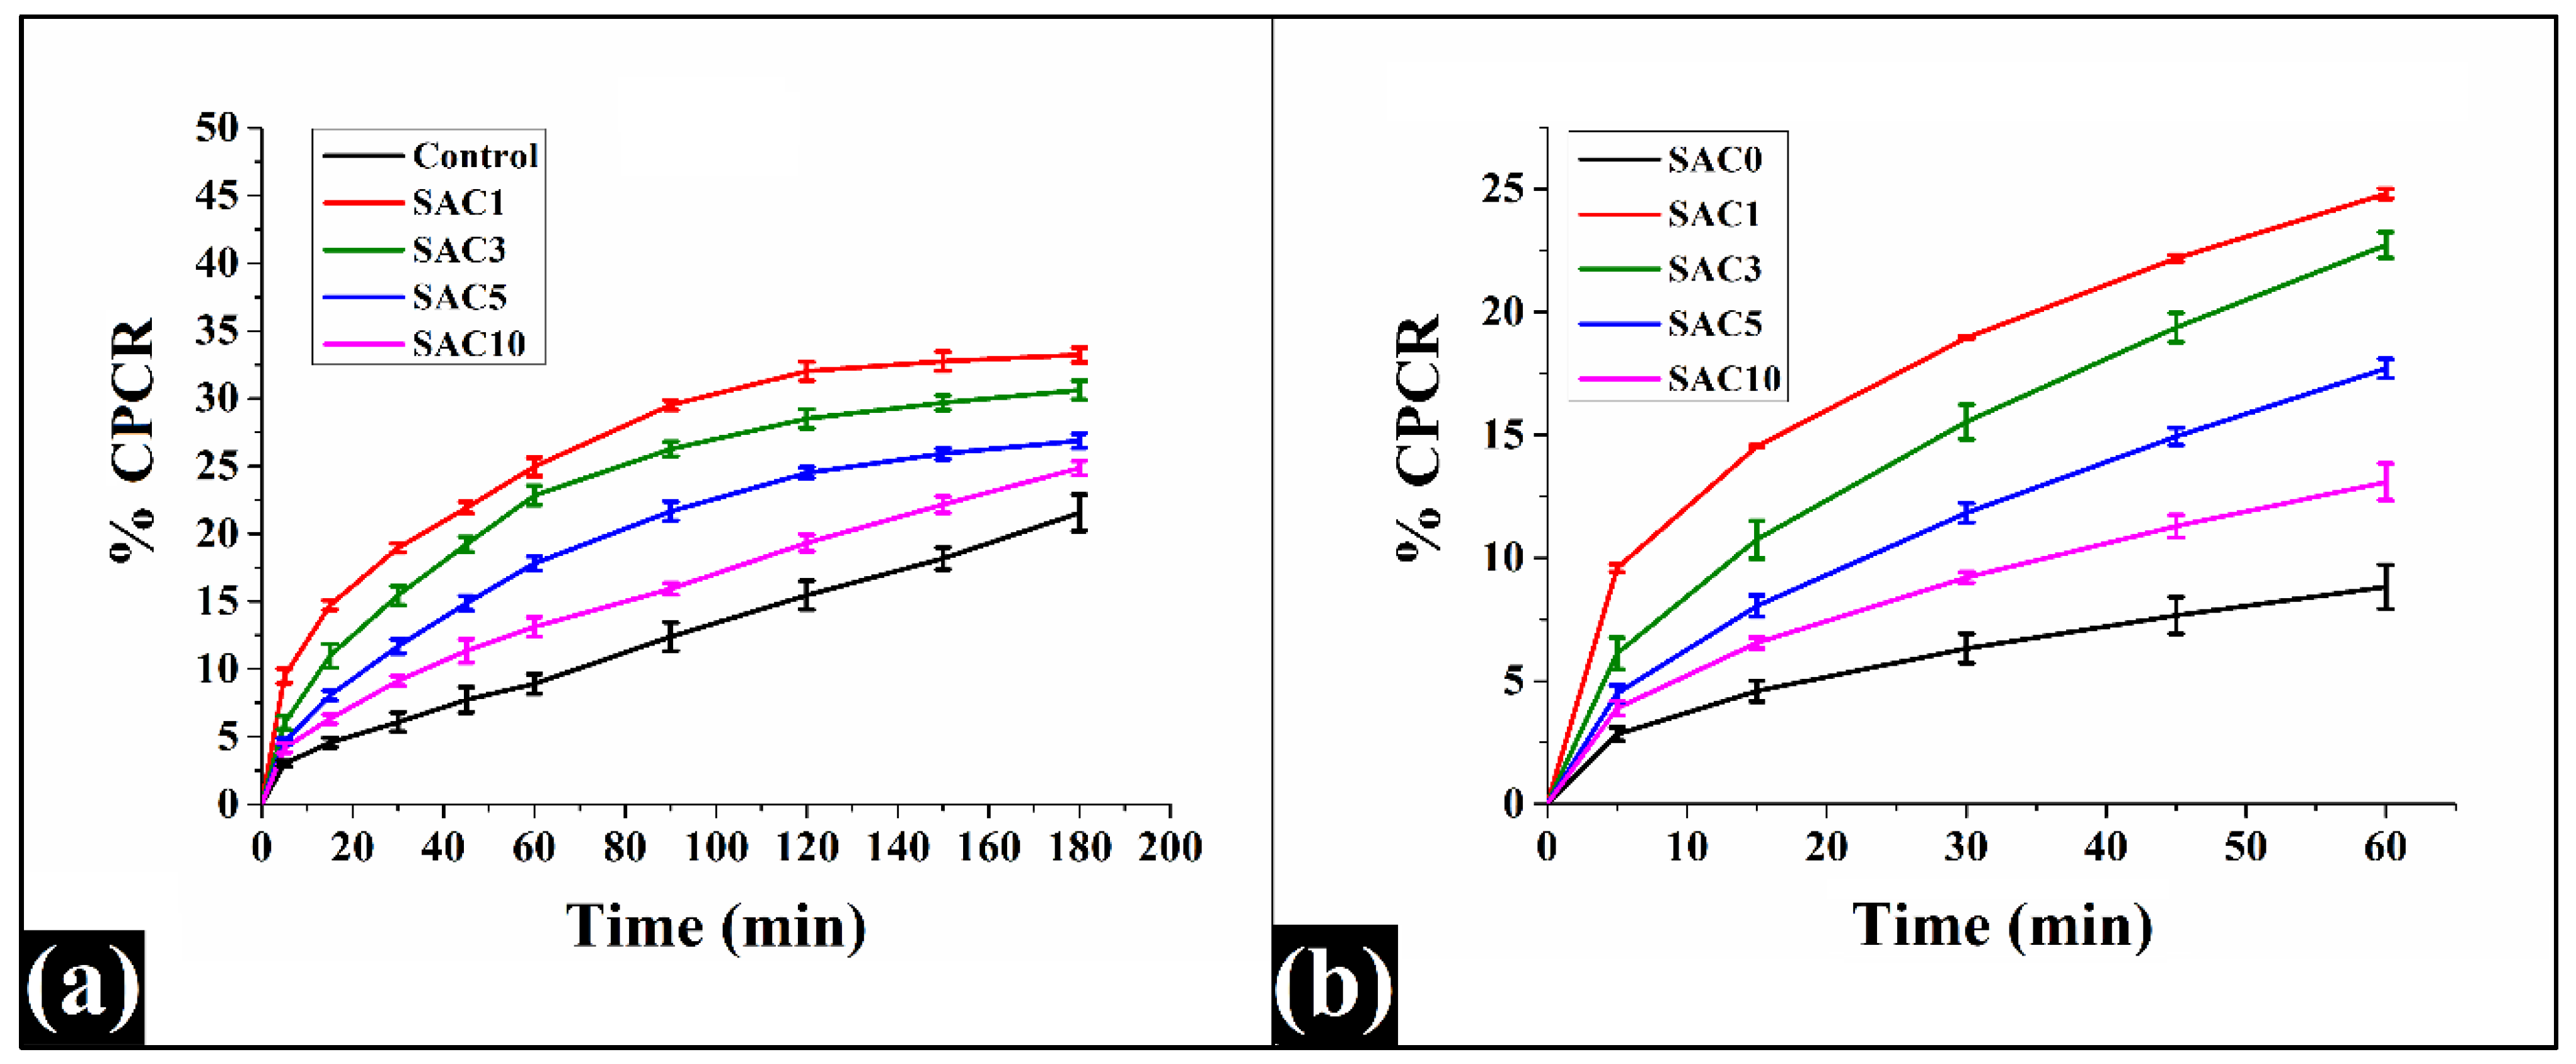
3.9. Curcumin Release Study

Curcumin, a naturally occurring polyphenolic hydrophobic bioactive compound, has exhibited a diverse range of therapeutic roles due to its anti-inflammatory, anti-cancer, and antioxidant properties [96]. Furthermore, curcumin has displayed potential in the treatment of conditions such as wound healing, arthritis, and Alzheimer’s disease. According to the FDA, curcuminoids that include curcumin are acknowledged as “GRAS” (Generally Recognized as Safe) [97]. Due to its widespread availability and cost-effectiveness, curcumin has been used as a model drug in numerous investigations assessing the efficacy of drug delivery systems. Clinical trials provided additional evidence of the excellent tolerability of high single oral doses of curcuminoids, reaching up to 12 g per day [97]. However, the effectiveness of curcumin as a nutraceutical agent is limited by its low water solubility and degradation in gastrointestinal and alkaline environments [98]. Oleogels have been used for a long time to deliver various hydrophobic bioactive compounds in food [99]. The present study aimed to assess the efficacy of the prepared oleogels as a delivery vehicle for curcumin. The oleogels, being fat-soluble in nature, have the potential to efficiently release curcumin in food, thereby enhancing its stability and facilitating controlled release in the body. The unique structure of oleogels also serves as a protective barrier and safeguards curcumin from degradation.
This carrier ability of oleogels was determined in terms of the cumulative percentage of curcumin release (CPCR), which is defined as the percentage of the amount of curcumin released per unit amount of loaded curcumin. The curcumin release profiles (Figure 10a) indicated that the addition of SAC enhanced the % CPCR from the oleogels. SAC1 showed the highest % CPCR value in the range of 30 to 35% after 180 min. This might be due to the presence of more amorphous regions (Figure 4) and large crystal sizes (Table 2) in SAC1. A subsequent increase in SAC in oleogels resulted in a decline in their CPCR percentages: SAC1 > SAC3 > SAC5 > SAC10 > SAC0. The lowest % CPCR value (~20%) was obtained from SAC0. It could be due to the smallest crystal size of SAC0 (Table 2) and its relatively compact crystalline network, which resulted in its reduced curcumin-release potential. It has been reported that the addition of SAC resulted in the formation of mesh structures with larger interstitial spaces [100]. This could be the reason for the increased % CPCR value of our oleogels on the addition of SAC. However, at higher concentrations of SAC, the % CPCR gradually decreased, which may be attributed to the creation of a non-homogeneous crystalline network due to the interference caused by the crystallization of SAC, which impacts the interstitial spaces, as already stated in previous sections.
In general, the release of any drug or bioactive compound from carrier matrices underlies various mechanisms that depend on the physical structure of the matrix polymer, drug solubility, interactions between the drug and the polymer, and diffusion of water. These mechanisms that control drug release can be learned via various mathematical models [101], e.g., Ritger–Peppas [102], Korsmeyer–Peppas [103], Peppas–Sahlin [104], etc. In this particular study, the Peppas-Sahlin (PS) model was utilized to evaluate the experimental data of curcumin release, as described by Equation (9).
F = K d t m + K r t 2 m
F represents the part of the solute released, and Kd and Kr are the Fickian and relaxation kinetics constants, respectively. m is the Fickian diffusional exponent, which inhibits controlled curcumin release, and t is the sampling time. A correlation coefficient of >0.99 obtained in all the oleogel samples suggested a good fitting of the experimental data with the modeled data (Table 4).
From the PS modeling (Figure 10b and Table 4), the calculated Kd values of the oleogel samples demonstrated a significant increase after the addition of SAC (p < 0.05). SAC1 reportedly showed the highest Kd value. With the subsequent addition of SAC, the Kd value gradually decreased. SAC3 showed a significant decrease in its Kd value compared to SAC1 (p < 0.05). However, it exhibited a significantly higher value than SAC0 (p < 0.05). Further addition of SAC did not provide a significant change in the Kd value of SAC5 from the SAC3 (p > 0.05) but showed a significantly higher value than SAC0 (p < 0.05). The Kd value of SAC10 was comparable to that of SAC5 (p > 0.05) but significantly lower than SAC3 and SAC1 and higher than SAC0 (p < 0.05). Higher Kd values in SAC-containing oleogel samples compared to SAC0 imply that SAC promoted the diffusion mechanism of curcumin release over the relaxation mechanism in the oleogel samples.
The Kr value of the oleogel, which reflects the contribution of gel relaxation to curcumin release, has also been determined. It was noted that the Kr value was considerably lower than the Kd value. However, it indicates that curcumin molecules are released through both Fickian diffusion and relaxation of the gelator network. All the oleogel samples demonstrated similar relaxation kinetic constants (Kr) to SAC0, with the exception of SAC1 and SAC5. SAC1 displayed a significantly higher Kr value (p << 0.05) compared to other samples, while SAC5 had a significantly lower Kr value (p < 0.05). The Kd/Kr value demonstrated the dominance of Fickian diffusion over relaxation in all the oleogel samples, which was also increased after the addition of SAC. The trend in both Kd and Kr values can also be correlated to the crystal network density observed in each sample. Since the Fickian diffusional exponent, also referred to as the ‘m’ value, is consistently less than 0.5 in all oleogels, they effectively facilitate quasi-Fickian diffusion of curcumin molecules throughout the curcumin release method [105].

4. Conclusions

In recent times, the prevalence of saturated fats in processed food products has become a cause of concern among health enthusiasts and experts. In light of this, researchers have been exploring alternative options, with one such option being the innovative oleogel formulation. This study aimed to investigate the capability of combining CW with GO to form a stable gel., and the effect of varying SAC concentrations on its properties was evaluated. A variety of analytical methods were employed, including microscopy, OBC measurements, colorimetry, FTIR, texture analysis, crystallization kinetics, XRD, and curcumin release assay. The current study revealed that at 5% CW, all the SAC-containing oleogels displayed a high OBC of >98% with a yellowish tint. Micrographs revealed that the CW crystals were tiny and granular in appearance. It was determined that among all the oleogel samples, SAC3 exhibited the most favorable characteristics. A comprehensive analysis revealed that SAC3 displayed the smallest d-spacing value and crystal size among all the SAC-containing samples, which indicated a highly compact crystal lattice structure. Furthermore, the polarized micrograph of SAC3 revealed the presence of prominent crystals, which contributed to the delayed crystal growth kinetics in comparison to other samples. The studies have found that SAC interferes with the crystallization of wax and confirms the role of SAC as a crystal habit modifier. In terms of textural properties, SAC3 demonstrated low stickiness, low spreadability, and a high work of adhesion. SAC3 showed an impressive ability to release curcumin, making it suitable for its drug delivery applications. For instance, the oleogel with high firmness may be utilized in confectionery products such as chocolate and candy. Based on these findings, SAC3 was deemed to be the most suitable sample for further exploration in food application studies. Investigations with higher concentrations (>5% (w/w) of CW will be performed in the future.

Author Contributions

Conceptualization, K.P., D.B. and S.S.S.; methodology, K.P. and B.M.; resources, K.P. and B.M.; data curation, D.C.; writing—original draft preparation, D.C.; writing—review and editing, D.C., D.B., S.S.S., S.D., D.S. and K.P.; visualization, D.C., S.S.S., H.B., M.S., D.K., M.J. and A.A.; supervision, K.P.; funding acquisition, K.P. All authors have read and agreed to the published version of the manuscript.

Funding

This research received no external funding.

Institutional Review Board Statement

Not applicable.

Informed Consent Statement

Not applicable.

Data Availability Statement

The data used in this article is available on request.

Conflicts of Interest

The authors declare no conflict of interest.

References

  1. Martins, A.J.; Vicente, A.A.; Cunha, R.L.; Cerqueira, M.A. Edible oleogels: An opportunity for fat replacement in foods. Food Funct. 2018, 9, 758–773. [Google Scholar] [CrossRef]
  2. Yadav, E.; Sebastian, S.; Gupta, M.K. Aminopyridinyl Tricosanamide Based Pseudoplastic and Thermoreversible Oleogels for pH-Dependant in vitro Release of Metronidazole. ChemistrySelect 2022, 7, e202203014. [Google Scholar] [CrossRef]
  3. Barroso, N.G.; Okuro, P.K.; Ribeiro, A.P.; Cunha, R.L. Tailoring properties of mixed-component oleogels: Wax and monoglyceride interactions towards flaxseed oil structuring. Gels 2020, 6, 5. [Google Scholar] [CrossRef] [PubMed]
  4. Ashkar, A.; Laufer, S.; Rosen-Kligvasser, J.; Lesmes, U.; Davidovich-Pinhas, M. Impact of different oil gelators and oleogelation mechanisms on digestive lipolysis of canola oil oleogels. Food Hydrocoll. 2019, 97, 105218. [Google Scholar] [CrossRef]
  5. Zeng, L.; Lin, X.; Li, P.; Liu, F.-Q.; Guo, H.; Li, W.-H. Recent advances of organogels: From fabrications and functions to applications. Prog. Org. Coat. 2021, 159, 106417. [Google Scholar] [CrossRef]
  6. Banaś, K.; Harasym, J. Natural gums as oleogelators. Int. J. Mol. Sci. 2021, 22, 12977. [Google Scholar] [CrossRef] [PubMed]
  7. Li, L.; Liu, G.; Bogojevic, O.; Pedersen, J.N.; Guo, Z.J.C.R.i.F.S.; Safety, F. Edible oleogels as solid fat alternatives: Composition and oleogelation mechanism implications. Compr. Rev. Food Sci. Food Saf. 2022, 21, 2077–2104. [Google Scholar] [CrossRef] [PubMed]
  8. Pehlivanoğlu, H.; Demirci, M.; Toker, O.S.; Konar, N.; Karasu, S.; Sagdic, O. Oleogels, a promising structured oil for decreasing saturated fatty acid concentrations: Production and food-based applications. Crit. Rev. Food Sci. Nutr. 2018, 58, 1330–1341. [Google Scholar] [CrossRef] [PubMed]
  9. Wang, N.; Chen, J.; Zhou, Q.; Jiang, L.; Wang, L.; Dai, Y.; Yu, D.; Elfalleh, W. Crude wax extracted from rice bran oil improves oleogel properties and oxidative stability. Eur. J. Lipid Sci. Technol. 2021, 123, 2000091. [Google Scholar] [CrossRef]
  10. da Silva, T.L.; Arellano, D.B.; Martini, S. Physical properties of candelilla wax, monoacylglycerols, and fully hydrogenated oil oleogels. J. Am. Oil Chem. Soc. 2018, 95, 797–811. [Google Scholar] [CrossRef]
  11. Aranda-Ledesma, N.E.; Bautista-Hernández, I.; Rojas, R.; Aguilar-Zárate, P.; del Pilar Medina-Herrera, N.; Castro-López, C.; Martínez-Ávila, G.C.G. Candelilla wax: Prospective suitable applications within the food field. LWT 2022, 113170. [Google Scholar] [CrossRef]
  12. Pérez-Martínez, J.; Sánchez-Becerril, M.; Marangoni, A.; Toro-Vazquez, J.; Ornelas-Paz, J.; Ibarra-Junquera, V. Structuration, elastic properties scaling, and mechanical reversibility of candelilla wax oleogels with and without emulsifiers. Food Res. Int. 2019, 122, 471–478. [Google Scholar] [CrossRef] [PubMed]
  13. Hwang, H.S.; Winkler-Moser, J.K. Properties of margarines prepared from soybean oil oleogels with mixtures of candelilla wax and beeswax. J. Food Sci. 2020, 85, 3293–3302. [Google Scholar] [CrossRef] [PubMed]
  14. Alvarez-Ramirez, J.; Vernon-Carter, E.; Carrera-Tarela, Y.; Garcia, A.; Roldan-Cruz, C. Effects of candelilla wax/canola oil oleogel on the rheology, texture, thermal properties and in vitro starch digestibility of wheat sponge cake bread. LWT 2020, 130, 109701. [Google Scholar] [CrossRef]
  15. Sahu, D.; Bharti, D.; Kim, D.; Sarkar, P.; Pal, K. Variations in microstructural and physicochemical properties of candelilla wax/rice bran oil–derived oleogels using sunflower lecithin and soya lecithin. Gels 2021, 7, 226. [Google Scholar] [CrossRef]
  16. Li, L.; Taha, A.; Geng, M.; Zhang, Z.; Su, H.; Xu, X.; Pan, S.; Hu, H. Ultrasound-assisted gelation of β-carotene enriched oleogels based on candelilla wax-nut oils: Physical properties and in-vitro digestion analysis. Ultrason. Sonochemistry 2021, 79, 105762. [Google Scholar] [CrossRef]
  17. Tan, S.S.; Tan, C.X.; Tan, S.T. Bioactive Phytochemicals from Peanut Oil-Processing By-Products; Springer: Berlin/Heidelberg, Germany, 2022; pp. 1–11. [Google Scholar]
  18. Dun, Q.; Yao, L.; Deng, Z.; Li, H.; Li, J.; Fan, Y.; Zhang, B.J.L. Effects of hot and cold-pressed processes on volatile compounds of peanut oil and corresponding analysis of characteristic flavor components. LWT 2019, 112, 107648. [Google Scholar] [CrossRef]
  19. Mridula, D.; Saha, D.; Gupta, R.; Bhadwal, S.; Arora, S.; Kumar, S.R. Oil Expelling from Dehulled De-Skinned Groundnut Kernel using Screw Press: Optimization of Process Parameters and Physico-chemical Characteristics. Int. J. Curr. Microbiol. App. Sci 2020, 9, 1101–1115. [Google Scholar] [CrossRef]
  20. Pramanik, A.; Tiwari, S.; Tripathi, M.; Mandloi, S.; Tomar, R. Identification of groundnut germplasm lines for foliar disease resistance and high oleic traits using SNP and gene-based markers and their morphological characterization. Legume Res.-Int. J. 2022, 45, 305–310. [Google Scholar] [CrossRef]
  21. Saha, D.; Nanda, S.K.; Yadav, D.N. Optimization of spray drying process parameters for production of groundnut milk powder. Powder Technol. 2019, 355, 417–424. [Google Scholar] [CrossRef]
  22. Vishnu, V.S. Scope of Entrepreneurship Developments in Groundnut Processing. In Entrepreneurship Development in Food Processing; CRC Press: Boca Raton, FL, USA, 2021; pp. 187–215. [Google Scholar]
  23. Dorni, C.; Sharma, P.; Saikia, G.; Longvah, T. Fatty acid profile of edible oils and fats consumed in India. Food Chem. 2018, 238, 9–15. [Google Scholar] [CrossRef] [PubMed]
  24. Bajželj, B.; Laguzzi, F.; Röös, E. The role of fats in the transition to sustainable diets. Lancet Planet. Health 2021, 5, e644–e653. [Google Scholar] [CrossRef]
  25. Adlak, T.; Tiwari, S.; Gupta, N.; Tripathi, M.; Sikarwar, R.; Sastya, R.; Gupta, V. Assessment for yield and nutritional profiling of groundnut with the help of allele specific markers for desirable fatty acids. Int. J. Curr. Microbiol. Appl. Sci. 2021, 10, 1625–1637. [Google Scholar]
  26. Liu, C.; Zheng, Z.; Zaaboul, F.; Cao, C.; Huang, X.; Liu, Y. Effects of wax concentration and carbon chain length on the structural modification of fat crystals. Food Funct. 2019, 10, 5413–5425. [Google Scholar] [CrossRef]
  27. Gravelle, A.J.; Marangoni, A.G. Vegetable Oil Oleogels Structured Using Mixtures of Stearyl Alcohol and Stearic Acid (SO: SA). In Edible Oleogels; Elsevier: Amsterdam, The Netherlands, 2018; pp. 193–217. [Google Scholar]
  28. Meng, Z.; Qi, K.; Guo, Y.; Wang, Y.; Liu, Y. Macro-micro structure characterization and molecular properties of emulsion-templated polysaccharide oleogels. Food Hydrocoll. 2018, 77, 17–29. [Google Scholar] [CrossRef]
  29. Redondas, C.E.; Baümler, E.R.; Carelli, A.A. Sunflower wax recovered from oil tank settlings: Revaluation of a waste product from the oilseed industry. J. Sci. Food Agric. 2020, 100, 201–211. [Google Scholar] [CrossRef] [PubMed]
  30. Flöter, E.; Wettlaufer, T.; Conty, V.; Scharfe, M. Oleogels—their applicability and methods of characterization. Molecules 2021, 26, 1673. [Google Scholar] [CrossRef]
  31. Pușcaș, A.; Mureșan, V.; Muste, S. Application of analytical methods for the comprehensive analysis of oleogels—A review. Polymers 2021, 13, 1934. [Google Scholar] [CrossRef] [PubMed]
  32. Winkler-Moser, J.K.; Anderson, J.; Byars, J.A.; Singh, M.; Hwang, H.S. Evaluation of beeswax, candelilla wax, rice bran wax, and sunflower wax as alternative stabilizers for peanut butter. J. Am. Oil Chem. Soc. 2019, 96, 1235–1248. [Google Scholar] [CrossRef]
  33. Mohanan, A.; Nickerson, M.T.; Ghosh, S. The effect of addition of high-melting monoacylglycerol and candelilla wax on pea and faba bean protein foam-templated oleogelation. J. Am. Oil Chem. Soc. 2020, 97, 1319–1333. [Google Scholar] [CrossRef]
  34. Monogarova, O.; Oskolok, K.; Apyari, V. Colorimetry in chemical analysis. J. Anal. Chem. 2018, 73, 1076–1084. [Google Scholar] [CrossRef]
  35. Lehnert, S.; Dubinina, A.; Deynichenko, H.; Khomenko, O.; Gapontseva, O.; Antoniuk, I.; Medvedeva, A.; Demichkovska, M.; Vasylieva, O. The study of influence of natural antioxidants on quality of peanut and linseed oil blends during their storage. East.-Eur. J. Enterp. Technol. 2018, 44–50. [Google Scholar] [CrossRef]
  36. Jedidi, B.; Mokbli, S.; Sbihi, H.M.; Nehdi, I.A.; Romdhani-Younes, M.; Al-Resayes, S.I. Effect of extraction solvents on fatty acid composition and physicochemical properties of Tecoma stans seed oils. J. King Saud Univ.-Sci. 2020, 32, 2468–2473. [Google Scholar] [CrossRef]
  37. Nurhasanah, S.; Setyadi, A.; Munarso, S.J.; Subroto, E.; Filianty, F. Shelf-life prediction of peanut oil (Arachis hypogaea L.) using an accelerated shelf-life testing (ASLT) method in the polypropylene packaging. In IOP Conference Series: Earth and Environmental Science; IOP Publishing: Bristol, UK, 2022. [Google Scholar]
  38. Shi, Z.; Xu, W.; Geng, M.; Chen, Z.; Meng, Z. Oil body-based one-step multiple phases and hybrid emulsion gels stabilized by sunflower wa and CMC: Application and optimization in 3D printing. Food Hydrocoll. 2023, 136, 108262. [Google Scholar] [CrossRef]
  39. Meng, Z.; Qi, K.; Guo, Y.; Wang, Y.; Liu, Y. Physical properties, microstructure, intermolecular forces, and oxidation stability of soybean oil oleogels structured by different cellulose ethers. Eur. J. Lipid Sci. Technol. 2018, 120, 1700287. [Google Scholar] [CrossRef]
  40. Sánchez-Becerril, M.; Marangoni, A.; Perea-Flores, M.; Cayetano-Castro, N.; Martínez-Gutiérrez, H.; Andraca-Adame, J.; Pérez-Martínez, J. Characterization of the micro and nanostructure of the candelilla wax organogels crystal networks. Food Struct. 2018, 16, 1–7. [Google Scholar] [CrossRef]
  41. Kupiec, M.; Zbikowska, A.; Marciniak-Lukasiak, K.; Kowalska, M. Rapeseed oil in new application: Assessment of structure of oleogels based on their physicochemical properties and microscopic observations. Agriculture 2020, 10, 211. [Google Scholar] [CrossRef]
  42. Chen, Y.; Gavaliatsis, T.; Kuster, S.; Städeli, C.; Fischer, P.; Windhab, E.J. Crust treatments to reduce bread staling. Curr. Res. Food Sci. 2021, 4, 182–190. [Google Scholar] [CrossRef] [PubMed]
  43. Rodríguez-Hernández, A.; Pérez-Martínez, J.; Gallegos-Infante, J.; Toro-Vazquez, J.; Ornelas-Paz, J.J.C.P. Rheological properties of ethyl cellulose-monoglyceride-candelilla wax oleogel vis-a-vis edible shortenings. Carbohydr. Polym. 2021, 252, 117171. [Google Scholar] [CrossRef] [PubMed]
  44. Andriotis, E.G.; Monou, P.-K.; Komis, G.; Bouropoulos, N.; Ritzoulis, C.; Delis, G.; Kiosis, E.; Arsenos, G.; Fatouros, D.G. Effect of Glyceryl Monoolein Addition on the Foaming Properties and Stability of Whipped Oleogels. Gels 2022, 8, 705. [Google Scholar] [CrossRef] [PubMed]
  45. Blake, A.I.; Marangoni, A.G. The use of cooling rate to engineer the microstructure and oil binding capacity of wax crystal networks. Food Biophys. 2015, 10, 456–465. [Google Scholar] [CrossRef]
  46. Borriello, A.; Masi, P.; Cavella, S. Novel pumpkin seed oil-based oleogels: Development and physical characterization. LWT 2021, 152, 112165. [Google Scholar] [CrossRef]
  47. Niu, S.; Zhou, Y.; Yu, H.; Lu, C.; Han, K. Investigation on thermal degradation properties of oleic acid and its methyl and ethyl esters through TG-FTIR. Energy Convers. Manag. 2017, 149, 495–504. [Google Scholar] [CrossRef]
  48. Suri, K.; Singh, B.; Kaur, A.; Singh, N. Impact of roasting and extraction methods on chemical properties, oxidative stability and Maillard reaction products of peanut oils. J. Food Sci. Technol. 2019, 56, 2436–2445. [Google Scholar] [CrossRef] [PubMed]
  49. Shasidhar, Y.; Vishwakarma, M.K.; Pandey, M.K.; Janila, P.; Variath, M.T.; Manohar, S.S.; Nigam, S.N.; Guo, B.; Varshney, R.K. Molecular mapping of oil content and fatty acids using dense genetic maps in groundnut (Arachis hypogaea L.). Front. Plant Sci. 2017, 8, 794. [Google Scholar] [CrossRef]
  50. Balamurugan, V.; Haritha, J.; ArunChendhuran, R.; Srivel, S.; AmalaJerrin, J.N.; Kishore, S.; Pachamuthu, M. Classification of Groundnut Oil Using Advanced ATR-MIR Spectroscopy and Chemometrics. Food Anal. Methods 2022, 15, 1778–1786. [Google Scholar] [CrossRef]
  51. Uncu, O.; Ozen, B.; Tokatli, F. Use of FTIR and UV–visible spectroscopy in determination of chemical characteristics of olive oils. Talanta 2019, 201, 65–73. [Google Scholar] [CrossRef] [PubMed]
  52. Jamwal, R.; Kumari, S.; Sharma, S.; Kelly, S.; Cannavan, A.; Singh, D.K. Recent trends in the use of FTIR spectroscopy integrated with chemometrics for the detection of edible oil adulteration. Vib. Spectrosc. 2021, 113, 103222. [Google Scholar] [CrossRef]
  53. Lionetto, F.; López-Muñoz, R.; Espinoza-González, C.; Mis-Fernández, R.; Rodríguez-Fernández, O.; Maffezzoli, A. A study on exfoliation of expanded graphite stacks in candelilla wax. Materials 2019, 12, 2530. [Google Scholar] [CrossRef] [PubMed]
  54. Núñez-García, I.C.; Rodríguez-Flores, L.G.; Guadiana-De-Dios, M.H.; González-Hernández, M.D.; Martínez-Ávila, G.C.; Gallegos-Infante, J.A.; González-Laredo, R.; Rosas-Flores, W.; Martínez-Gómez, V.J.; Rojas, R. Candelilla Wax Extracted by Traditional Method and an Ecofriendly Process: Assessment of Its Chemical, Structural and Thermal Properties. Molecules 2022, 27, 3735. [Google Scholar] [CrossRef] [PubMed]
  55. Zhu, J.; Liu, B.; Li, L.; Zeng, Z.; Zhao, W.; Wang, G.; Guan, X. Simple and green fabrication of a superhydrophobic surface by one-step immersion for continuous oil/water separation. J. Phys. Chem. A 2016, 120, 5617–5623. [Google Scholar] [CrossRef] [PubMed]
  56. Hernández, Y.; Lozano, T.; Morales-Cepeda, A.B.; Navarro-Pardo, F.; Angeles, M.E.; Morales-Zamudio, L.; Melo-Banda, J.A.; Sánchez-Valdes, S.; Martínez-Colunga, G.; Rodríguez, F. Stearic acid as interface modifier and lubricant agent of the system: Polypropylene/calcium carbonate nanoparticles. Polym. Eng. Sci. 2019, 59, E279–E285. [Google Scholar] [CrossRef]
  57. Sagiri, S.; Singh, V.K.; Pal, K.; Banerjee, I.; Basak, P. Stearic acid based oleogels: A study on the molecular, thermal and mechanical properties. Mater. Sci. Eng. C 2015, 48, 688–699. [Google Scholar] [CrossRef] [PubMed]
  58. Pazinato, J.C.; Garcia, I.T. Sub-stoichiometric tungsten oxide by the stearic acid method. Ceram. Int. 2022, 48, 11971–11980. [Google Scholar] [CrossRef]
  59. Hasda, A.M.; Vuppaladadium, S.S.R.; Qureshi, D.; Prasad, G.; Mohanty, B.; Banerjee, I.; Shaikh, H.; Anis, A.; Sarkar, P.; Pal, K. Graphene oxide reinforced nanocomposite oleogels improves corneal permeation of drugs. J. Drug Deliv. Sci. Technol. 2020, 60, 102024. [Google Scholar] [CrossRef]
  60. Covaciu, F.-D.; Berghian-Grosan, C.; Feher, I.; Magdas, D.A. Edible oils differentiation based on the determination of fatty acids profile and Raman spectroscopy—A case study. Appl. Sci. 2020, 10, 8347. [Google Scholar] [CrossRef]
  61. Zhao, H.; Zhan, Y.; Xu, Z.; Nduwamungu, J.J.; Zhou, Y.; Powers, R.; Xu, C. The application of machine-learning and Raman spectroscopy for the rapid detection of edible oils type and adulteration. Food Chem. 2022, 373, 131471. [Google Scholar] [CrossRef]
  62. Esmonde-White, K.; Lewis, M.; Perilli, T.; Della Vedova, T.; Lewis, I. Raman Spectroscopy in Analyzing Fats and Oils in Foods. Raman Technol. Today’s Spectrosc. 2022, 37, 34–45. [Google Scholar] [CrossRef]
  63. Eshelman, E.; Daly, M.; Slater, G.; Dietrich, P.; Gravel, J.-F. An ultraviolet Raman wavelength for the in-situ analysis of organic compounds relevant to astrobiology. Planet. Space Sci. 2014, 93, 65–70. [Google Scholar] [CrossRef]
  64. Otero, V.; Sanches, D.; Montagner, C.; Vilarigues, M.; Carlyle, L.; Lopes, J.A.; Melo, M.J. Characterisation of metal carboxylates by Raman and infrared spectroscopy in works of art. J. Raman Spectrosc. 2014, 45, 1197–1206. [Google Scholar] [CrossRef]
  65. Gómez-Mascaraque, L.G.; Tran, C.; O’Callaghan, T.; Hogan, S.A. Use of confocal Raman imaging to understand the microstructure of anhydrous milk fat-based oleogels. Food Struct. 2021, 30, 100228. [Google Scholar] [CrossRef]
  66. Okuro, P.K.; Tavernier, I.; Sintang, M.D.B.; Skirtach, A.G.; Vicente, A.A.; Dewettinck, K.; Cunha, R.L. Synergistic interactions between lecithin and fruit wax in oleogel formation. Food Funct. 2018, 9, 1755–1767. [Google Scholar] [CrossRef] [PubMed]
  67. Martins, A.J.; Cerqueira, F.; Vicente, A.A.; Cunha, R.L.; Pastrana, L.M.; Cerqueira, M.A. Gelation Behavior and Stability of Multicomponent Sterol-Based Oleogels. Gels 2022, 8, 37. [Google Scholar] [CrossRef] [PubMed]
  68. Li, L.; Liu, G. Corn oil-based oleogels with different gelation mechanisms as novel cocoa butter alternatives in dark chocolate. J. Food Eng. 2019, 263, 114–122. [Google Scholar] [CrossRef]
  69. Declerck, A.; Nelis, V.; Danthine, S.; Dewettinck, K.; Van der Meeren, P. Characterisation of fat crystal polymorphism in cocoa butter by time-domain NMR and DSC deconvolution. Foods 2021, 10, 520. [Google Scholar] [CrossRef] [PubMed]
  70. Rosen-Kligvasser, J.; Davidovich-Pinhas, M. The role of hydrogen bonds in TAG derivative-based oleogel structure and properties. Food Chem. 2021, 334, 127585. [Google Scholar] [CrossRef]
  71. Chai, X.-h.; Meng, Z.; Cao, P.-r.; Liang, X.-y.; Piatko, M.; Campbell, S.; Lo, S.K.; Liu, Y.-f. Influence of indigenous minor components on fat crystal network of fully hydrogenated palm kernel oil and fully hydrogenated coconut oil. Food Chem. 2018, 255, 49–57. [Google Scholar] [CrossRef]
  72. Arita-Merino, N.; van Valenberg, H.; Gilbert, E.P.; Scholten, E. Quantitative Phase Analysis of Complex Fats during Crystallization. Cryst. Growth Des. 2020, 20, 5193–5202. [Google Scholar] [CrossRef]
  73. Kumar, M.; Velaga, S.; Singh, A. A study of thickness dependent microstructure of poly (3-hexylthiophene) thin films using grazing incidence x-ray diffraction. Soft Mater. 2022, 20, 24–34. [Google Scholar] [CrossRef]
  74. Bhadra, S.; Khastgir, D. Determination of crystal structure of polyaniline and substituted polyanilines through powder X-ray diffraction analysis. Polym. Test. 2008, 27, 851–857. [Google Scholar] [CrossRef]
  75. Speakman, S.A. Estimating crystallite size using XRD. MIT Cent. Mater. Sci. Eng. 2014, 2, 14. [Google Scholar]
  76. Su, C.; Li, Y.; Zhu, J.; Gao, Y.; Li, Q.; Du, S.; Yu, X. Effect of flaxseed gum on the brittleness of oleogels based on candelilla wax. RSC Adv. 2022, 12, 30734–30741. [Google Scholar] [CrossRef] [PubMed]
  77. Ghazani, S.M.; Dobson, S.; Marangoni, A.G. Hardness, plasticity, and oil binding capacity of binary mixtures of natural waxes in olive oil. Curr. Res. Food Sci. 2022, 5, 998–1008. [Google Scholar] [CrossRef] [PubMed]
  78. Liu, L.; Ramirez, I.S.A.; Yang, J.; Ciftci, O.N. Evaluation of oil-gelling properties and crystallization behavior of sorghum wax in fish oil. Food Chem. 2020, 309, 125567. [Google Scholar] [CrossRef]
  79. Ghazani, S.M.; Marangoni, A.G. The ternary solid state phase behavior of triclinic POP, POS, and SOS and its relationship to CB and CBE properties. Cryst. Growth Des. 2018, 19, 704–713. [Google Scholar] [CrossRef]
  80. Zhao, M.; Lan, Y.; Cui, L.; Monono, E.; Rao, J.; Chen, B. Formation, characterization, and potential food application of rice bran wax oleogels: Expeller-pressed corn germ oil versus refined corn oil. Food Chem. 2020, 309, 125704. [Google Scholar] [CrossRef] [PubMed]
  81. Qureshi, D.; Choudhary, B.; Mohanty, B.; Sarkar, P.; Anis, A.; Cerqueira, M.A.; Banerjee, I.; Maji, S.; Pal, K. Graphene Oxide Increases Corneal Permeation of Ciprofloxacin Hydrochloride from Oleogels: A Study with Cocoa Butter-Based Oleogels. Gels 2020, 6, 43. [Google Scholar] [CrossRef] [PubMed]
  82. Hwang, H.S.; Gillman, J.D.; Winkler-Moser, J.K.; Kim, S.; Singh, M.; Byars, J.A.; Evangelista, R.L. Properties of oleogels formed with high-stearic soybean oils and sunflower wax. J. Am. Oil Chem. Soc. 2018, 95, 557–569. [Google Scholar] [CrossRef]
  83. Yu, Y.; Wang, T.; Gong, Y.; Wang, W.; Wang, X.; Yu, D.; Wu, F.; Wang, L. Effect of ultrasound on the structural characteristics and oxidative stability of walnut oil oleogel coated with soy protein isolate-phosphatidylserine. Ultrason. Sonochemistry 2022, 83, 105945. [Google Scholar] [CrossRef] [PubMed]
  84. Sivakanthan, S.; Fawzia, S.; Madhujith, T.; Karim, A.J.C.R.i.F.S.; Safety, F. Synergistic effects of oleogelators in tailoring the properties of oleogels: A review. Compr. Rev. Food Sci. Food Saf. 2022, 21, 3507–3539. [Google Scholar] [CrossRef] [PubMed]
  85. Haj-Shafiei, S.; Workman, B.; Trifkovic, M.; Mehrotra, A.K. In-situ monitoring of paraffin wax crystal formation and growth. Cryst. Growth Des. 2019, 19, 2830–2837. [Google Scholar] [CrossRef]
  86. Mustapha, S.; Ndamitso, M.; Abdulkareem, A.; Tijani, J.; Shuaib, D.; Mohammed, A.; Sumaila, A. Comparative study of crystallite size using Williamson-Hall and Debye-Scherrer plots for ZnO nanoparticles. Adv. Nat. Sci. Nanosci. Nanotechnol. 2019, 10, 045013. [Google Scholar] [CrossRef]
  87. Zhong, Q.; Zhang, L. Nanoparticles fabricated from bulk solid lipids: Preparation, properties, and potential food applications. Adv. Colloid Interface Sci. 2019, 273, 102033. [Google Scholar] [CrossRef] [PubMed]
  88. Szymańska, I.; Żbikowska, A.; Onacik-Gür, S. Candelilla wax-based oleogels versus palm oil: Evaluation of physical properties of innovative and conventional lipids using optical techniques. J. Sci. Food Agric. 2022, 102, 2309–2320. [Google Scholar] [CrossRef] [PubMed]
  89. Sislioglu, K.; Gumus, C.E.; Koo, C.K.; Karabulut, I.; McClements, D.J. In vitro digestion of edible nanostructured lipid carriers: Impact of a Candelilla wax gelator on performance. Food Res. Int. 2021, 140, 110060. [Google Scholar] [CrossRef]
  90. Bharti, D.; Kim, D.; Cerqueira, M.A.; Mohanty, B.; Habibullah, S.; Banerjee, I.; Pal, K. Effect of biodegradable hydrophilic and hydrophobic emulsifiers on the oleogels containing sunflower wax and sunflower oil. Gels 2021, 7, 133. [Google Scholar] [CrossRef] [PubMed]
  91. Sagiri, S.S.; Kasiviswanathan, U.; Shaw, G.S.; Singh, M.; Anis, A.; Pal, K. Effect of sorbitan monostearate concentration on the thermal, mechanical and drug release properties of oleogels. Korean J. Chem. Eng. 2016, 33, 1720–1727. [Google Scholar] [CrossRef]
  92. Sarkisyan, V.; Sobolev, R.; Frolova, Y.; Malinkin, A.; Makarenko, M.; Kochetkova, A. Beeswax fractions used as potential oil gelling agents. J. Am. Oil Chem. Soc. 2021, 98, 281–296. [Google Scholar] [CrossRef]
  93. Doan, C.D.; To, C.M.; De Vrieze, M.; Lynen, F.; Danthine, S.; Brown, A.; Dewettinck, K.; Patel, A.R. Chemical profiling of the major components in natural waxes to elucidate their role in liquid oil structuring. Food Chem. 2017, 214, 717–725. [Google Scholar] [CrossRef] [PubMed]
  94. Uvanesh, K.; Sagiri, S.; Senthilguru, K.; Pramanik, K.; Banerjee, I.; Anis, A.; Al-Zahrani, S.; Pal, K. Effect of span 60 on the microstructure, crystallization kinetics, and mechanical properties of stearic acid oleogels: An in-depth analysis. J. Food Sci. 2016, 81, E380–E387. [Google Scholar] [CrossRef]
  95. Wei, F.; Miao, J.; Tan, H.; Feng, R.; Zheng, Q.; Cao, Y.; Lan, Y. Oleogel-structured emulsion for enhanced oxidative stability of perilla oil: Influence of crystal morphology and cooling temperature. LWT 2021, 139, 110560. [Google Scholar] [CrossRef]
  96. Kharat, M.; McClements, D.J. Recent advances in colloidal delivery systems for nutraceuticals: A case study–delivery by design of curcumin. J. Colloid Interface Sci. 2019, 557, 506–518. [Google Scholar] [CrossRef]
  97. Kotha, R.R.; Luthria, D.L. Curcumin: Biological, pharmaceutical, nutraceutical, and analytical aspects. Molecules 2019, 24, 2930. [Google Scholar] [CrossRef] [PubMed]
  98. Zheng, B.; McClements, D.J. Formulation of more efficacious curcumin delivery systems using colloid science: Enhanced solubility, stability, and bioavailability. Molecules 2020, 25, 2791. [Google Scholar] [CrossRef]
  99. Pinto, T.C.; Martins, A.J.; Pastrana, L.; Pereira, M.C.; Cerqueira, M.A. Oleogel-based systems for the delivery of bioactive compounds in foods. Gels 2021, 7, 86. [Google Scholar] [CrossRef] [PubMed]
  100. Yadav, I.; Kasiviswanathan, U.; Soni, C.; Paul, S.R.; Nayak, S.K.; Sagiri, S.S.; Anis, A.; Pal, K. Stearic acid modified stearyl alcohol oleogel: Analysis of the thermal, mechanical and drug release properties. J. Surfactants Deterg. 2017, 20, 851–861. [Google Scholar] [CrossRef]
  101. Moydeen, A.M.; Padusha, M.; Thamer, B.M.; Ahamed, N.A.; Al-Enizi, A.M.; El-Hamshary, H.; El-Newehy, M.H. Single-nozzle core-shell electrospun nanofibers of pvp/dextran as drug delivery system. Fibers Polym. 2019, 20, 2078–2089. [Google Scholar] [CrossRef]
  102. Unagolla, J.M.; Jayasuriya, A.C. Drug transport mechanisms and in vitro release kinetics of vancomycin encapsulated chitosan-alginate polyelectrolyte microparticles as a controlled drug delivery system. Eur. J. Pharm. Sci. 2018, 114, 199–209. [Google Scholar] [CrossRef]
  103. Wu, I.Y.; Bala, S.; Škalko-Basnet, N.; Di Cagno, M.P. Interpreting non-linear drug diffusion data: Utilizing Korsmeyer-Peppas model to study drug release from liposomes. Eur. J. Pharm. Sci. 2019, 138, 105026. [Google Scholar] [CrossRef]
  104. Abbasnezhad, N.; Zirak, N.; Shirinbayan, M.; Kouidri, S.; Salahinejad, E.; Tcharkhtchi, A.; Bakir, F. Controlled release from polyurethane films: Drug release mechanisms. J. Appl. Polym. Sci. 2021, 138, 50083. [Google Scholar] [CrossRef]
  105. Shaikh, H.M.; Anis, A.; Poulose, A.M.; Madhar, N.A.; Al-Zahrani, S.M. Development of Bigels Based on Date Palm-Derived Cellulose Nanocrystal-Reinforced Guar Gum Hydrogel and Sesame Oil/Candelilla Wax Oleogel as Delivery Vehicles for Moxifloxacin. Gels 2022, 8, 330. [Google Scholar] [CrossRef] [PubMed]
Figure 1. Steps involved in the preparation of CW/GO/SAC oleogel.
Chemengineering 07 00096 g001
Figure 2. Illustration of the appearance of oleogels and their oil binding capacities. (a) The visual appearance of the oleogels with different SAC concentrations. (b) The graphical representation compares the oil binding capacities of various oleogel samples.
Chemengineering 07 00096 g002
Figure 3. Various color components of the oleogel samples were measured using colorimetry. (a) L* (lightness), (b) a* (red/green), (c) b* (yellow/blue), (d) Whiteness Index, and (e) Yellowness Index. The ‘#’ represents the significantly different values of the color components (t-test, p < 0.05).
Chemengineering 07 00096 g003
Figure 4. Polarized light micrographs of the oleogel samples showing the crystal network of CW. In these micrographs, red arrows indicate the amorphous regions, whilst yellow arrows indicate the crystalline regions.
Chemengineering 07 00096 g004
Figure 5. The FTIR spectra of (a) the raw components i.e., SAC, GO, and CW, and (b) oleogels.
Chemengineering 07 00096 g005
Figure 6. The Raman spectra of (a) the raw components, i.e., SAC, GO, and CW, and (b) oleogels.
Chemengineering 07 00096 g006
Figure 7. (a) Comparison of XRD diffractograms (Intensity vs. 2θ) of CW-GO oleogel samples. (bf) Deconvoluted peaks of the respective CW-GO oleogel samples: SAC0 (b), SAC1 (c), SAC3 (d), SAC5 (e), and SAC10 (f).
Chemengineering 07 00096 g007
Figure 8. Crystallization kinetic profile of the oleogel samples. (a) A Comparative Analysis of the average crystallization kinetic profiles of the oleogel samples. (b) Average crystallization kinetic profile of SAC0, (c) Average crystallization kinetic profile of SAC1, (d) Average crystallization kinetic profile of SAC3, (e) Average crystallization kinetic profile of SAC5, and (f) Average crystallization kinetic profile of SAC10. The red and green arrows represents a sharp decline in temperature (or nucleation phase) and a constant or saturated temperature (or thermal equilibrium), respectively, in the crystallization process.
Chemengineering 07 00096 g008
Figure 9. Texture analysis of the oleogel samples. (a) Average spreadability test profile parameters of the oleogel samples, where the red arrow marks the inflections in the curve. Texture analysis parameters of the oleogel samples involving (b) Firmness, F0 (c) Stickiness, S0 (d) Work of shear, C0, (e) Work of adhesion, A0. The ‘#’ represents the significantly different values of the different spreadability parameters (t-test, p < 0.05).
Chemengineering 07 00096 g009
Figure 10. (a) Curcumin release profiles of the oleogel samples. (b) PS model fitting of the curcumin release profiles.
Chemengineering 07 00096 g010
Table 1. Composition of the oleogels. The number in the sample acronym denotes the concentration of SAC in oleogel, which is 0 mg, 1 mg, 3 mg, 5 mg, and 10 mg.
SamplesCW (g)GO (g)SAC Stock (g)Final Weight (g)SAC (mg)Percentage of SAC (%)
SAC011902000
SAC111812015
SAC3116320315
SAC5114520525
SAC101910201050
Table 2. XRD parameters of the oleogel samples.
SamplesPeaksPeak Position
(xc)
Peak Width (FWHM)Heightd-Spacing (Å)Crystallite Size (nm)Lattice StrainDislocation Density
(δ) × 1017 Lines/m2
SAC0122.184.74603.444.652.070.110.23
224.153.43297.964.282.880.070.12
325.240.52185.164.1018.830.010.00
427.293.55193.853.792.800.060.13
518.153.0662.535.683.190.080.10
626.120.9421.523.9610.490.020.01
Average 2.71 4.416.710.060.10
SAC1123.134.30670.364.462.290.090.19
224.390.5822.624.2416.870.010.00
325.170.55205.694.1117.880.010.00
426.041.2045.063.978.250.020.01
527.313.52162.563.792.820.060.13
619.954.43190.385.172.210.110.20
Average 2.43 4.298.390.050.09
SAC3122.963.26211.034.503.020.070.11
225.233.43108.264.102.890.070.12
325.230.49129.384.1020.150.010.00
427.815.19115.453.721.920.090.27
528.010.5739.923.7017.520.010.00
622.436.38398.814.601.540.140.42
Average 3.22 4.127.840.060.15
SAC5123.143.71306.604.462.650.080.14
224.210.8423.054.2711.740.020.01
325.210.55142.924.1018.000.010.00
425.990.7118.233.9813.880.010.01
526.255.71201.883.941.740.110.33
621.074.83190.374.892.030.110.24
Average 2.73 4.278.340.060.12
SAC10122.903.54359.254.512.780.080.13
224.422.2875.774.234.330.050.05
325.250.51165.654.0919.390.010.00
426.040.5224.003.9719.140.010.00
526.055.93280.913.971.670.110.36
621.045.57279.804.901.760.130.32
Average 3.06 4.288.180.060.14
Table 3. Crystallization kinetic parameters of the oleogel samples.
Temp vs. TimeExponential Decay Model
SamplesOnset of Secondary Crystallization (s)Time to Reach Thermal Equilibrium (s)Initial Rate of Crystallization (k) (°C/ms)
SAC0393.33 ± 41.63 ab1143.33 ± 136.50 ab2.62 ± 0.42 a
SAC1343.33 ± 30.55 a1053.33 ± 37.86 a2.93 ± 0.30 a
SAC3430 ± 20 b1220 ± 79.37 b2.41 ± 0.19 a
SAC5370 ± 45.83 ab1106.67 ± 87.37 ab2.75 ± 0.38 a
SAC10310 ± 34.64 a1013.33 ± 37.86 a3.31 ± 0.65 a
Superscripts in the same column with different alphabets indicate statistically significant (p < 0.05) values.
Table 4. The PS model parameters as derived from the curcumin release experimental data.
SampleKdKrKd/KrmR2
SAC01.23 a0.25 b5.02 a0.34 a0.99
SAC14.74 d0.79 c6.17 a0.30 a0.99
SAC32.64 c0.26 b10.18 b0.42 b0.99
SAC51.89 bc0.09 a22.41 c0.48 c0.99
SAC101.66 b0.30 b5.52 a0.36 ab0.99
Superscripts in the same column with different alphabets indicate statistically significant (p < 0.05) values.
Disclaimer/Publisher’s Note: The statements, opinions and data contained in all publications are solely those of the individual author(s) and contributor(s) and not of MDPI and/or the editor(s). MDPI and/or the editor(s) disclaim responsibility for any injury to people or property resulting from any ideas, methods, instructions or products referred to in the content.

