Article

Edible Oils Differentiation Based on the Determination of Fatty Acids Profile and Raman Spectroscopy—A Case Study

by
Florina-Dorina Covaciu
,
Camelia Berghian-Grosan
,
Ioana Feher
and
Dana Alina Magdas
*
National Institute for Research and Development of Isotopic and Molecular Technologies, Donat 67-103, 400293 Cluj-Napoca, Romania
*
Author to whom correspondence should be addressed.
Appl. Sci. 2020, 10(23), 8347; https://doi.org/10.3390/app10238347
Submission received: 30 October 2020 / Revised: 20 November 2020 / Accepted: 23 November 2020 / Published: 24 November 2020
(This article belongs to the Special Issue Emerging Technologies in Food and Beverages Authentication)

Abstract

:
This study proposes a comparison between two analytical techniques for edible oil classification, namely gas-chromatography equipped with a flame ionization detector (GC-FID), which is an acknowledged technique for fatty acid analysis, and Raman spectroscopy, as a real time noninvasive technique. Due to the complexity of the investigated matrix, we used both methods in connection with chemometrics processing for a quick and valuable evaluation of oils. In addition to this, the possible adulteration of investigated oil varieties (sesame, hemp, walnut, linseed, sea buckthorn) with sunflower oil was also tested. In order to extract the meaningful information from the experimental data set, a supervised chemometric technique, namely linear discriminant analysis (LDA), was applied. Moreover, for possible adulteration detection, an artificial neural network (ANN) was also employed. Based on the results provided by ANN, it was possible to detect the mixture between sea buckthorn and sunflower oil.

1. Introduction

Vegetable oils are complex mixtures containing a wide range of compounds. They are principally composed of diacylglycerols, triglycerides, and phospholipids (95–98%) and complex mixtures of minor compounds (2–5%) of a wide range of chemical components [1]. Triglycerides are a combination of glycerol and free fatty acids [2]. The composition and abundance of fatty acids and minor constituents present in vegetable oils depend on the plant species from which they were obtained. Moreover, within the same species, their composition may vary depending on the agronomic and climatic conditions, fruit or seed quality, the oil extraction process, and refining procedures [3]. Chromatographic techniques are the most common choice in the analysis of the edible oil samples. The differentiation of oil samples is based mostly on fatty acid profiles and volatile and semi-volatile compounds (organic acids, sugars, terpenoids). The information obtained from the analytical data can be difficult to interpret if a large number of edible oil samples of different origins, raw or refined, are analyzed. The use of multivariate statistical methods or chemometric techniques offers an opportunity to critically observe both the quantity and quality of data [4].
Most of the analytical techniques used in the analysis of vegetable oils require a laborious special sample preparation step. This step is especially important, since individual operations related to the preparation of samples cannot lead to changes in their composition (oxidation process, decomposition, introduction of contaminants, proportional changes in individual components). They should also provide the best recovery of the analyzed components from the sample matrix and cannot introduce interfering substances. These techniques should also enable the obtainment of a representative sample for further analyses.
Chromatographic methods, such as gas chromatography equipped with a flame-ionization detector (GC-FID), have been shown to be effective in the detection of fatty acids in oil samples. However, the requirement of standards, the need for the fatty acid methylation step, in order to be separated and analyzed, and the high input of time and labor make this analysis technique difficult.
Different spectroscopic techniques have been developed for the quality evaluation and authentication of oils; due to large consumer interest in olive oils, these methods are clearly presented in regard to the olive oil analysis [5,6]. Compared with the chromatographic procedures, they allow simple, nondestructive, time-saving investigations. Infrared spectroscopy is an excellent method for the investigation of vegetable oils and their parameters determinations (the variation of the infrared spectra can be correlated with the changes achieved in the oil parameters) [7]. At the same time, Raman spectroscopy is a successful technique for edible oil evaluation [8]. Due to the complexity of the matrix, both methods are employed in connection with the chemometrics for a rapid and valuable evaluation of the oils. Taking into consideration the development of new, easily operated portable Raman devices, and the development of new approaches based on a combination of Raman spectroscopy and Machine Learning algorithms for edible oil investigation [9], this technique is very promising for the control of different matrices (including vegetable oils).
This study aims to compare the classification power of two analytical techniques for edible oil evaluation.

2. Materials and Methods

2.1. Sample Description

Six types of oils—sunflower (SF 1 to SF 4), sesame (SES 5 to SES 8), hemp (HEM 9 to HEM 12), walnut (WAL 13 to WAL 16), linseed (LIN 17 to LIN 20), and sea buckthorn (SB 21 to SB 23)—were chosen for investigation by Raman spectroscopy and Gas Chromatography. Most of the investigated samples are cold pressed, unrefined, and fresh oils, except for a sample of sunflower oil (SF1) which is a sample of refined oil. All samples were purchased from local manufactures in Transylvania, Romania.

2.2. Fatty Acids Profile Using Gas Chromatographic Techniques

Fatty acids from vegetable oils were converted to methyl esters of the corresponding fatty acids for analysis by GC. The fatty acid methyl esters (FAMEs) solutions were diluted with n-hexane prior to injection into the GC column. The prepared samples containing fatty acid methyl ester were analyzed by GC using a TRACE GC Ultra chromatograph with a flame-ionization detector (GC-FID) equipped with a fused silica capillary column. A Fatwax, 30 m, 0.25 mm, 0.25 μm silica capillary column (Hewlett-Packard, Palo Alto, CA, USA) was used. Helium was used as the carrier gas. The FAME peaks were identified by comparing their retention time with certified reference standards of FAME. The standard mixture of 37 fatty acids methyl esters (Supelco™ 37 Component FAME Mix) used for the gas-chromatographic analyses was purchased from Sigma-Aldrich Co. LLC (St. Louis, MO, USA). Relative percentage of fatty acid was calculated based on the peak area of a fatty acid species to the total peak area of all the fatty acids in the oil samples.

2.3. Raman Measurements

Raman investigations were performed on a JASCO NRS-3300 equipped with a CCD (Charge Coupled Device) detector (−69 °C). The experiment was based on a diode laser at wavelength of 785 nm, 600 lines/mm grating, and an objective lens UMPLFL 20×; the spectra were recorded with an exposure time of 120 s and 3 accumulations per spectrum. The Si 521 cm−1 peak was used for calibration, and for each sample, 3 mL of oil was placed in a glass vessel and the measurement results are based on the analysis in two different points. The spectra were recorded in the 337–2012 cm−1 spectral range, but due to the specific fingerprint of this matrix, the 600–1800 cm−1 domain was selected for the chemometric investigations of the Raman spectra. After the mean spectrum calculation, all spectra were background corrected (in order to subtract the fluorescence background) and normalized to [10].

2.4. Multivariate Data Analysis

All chemometric processing was made using SPSS Statistics version 24 (IBM, New York, NY, USA). The statistical data processing was performed first on the Raman spectra of investigated oils and then on the FAMEs data. The Raman spectra were statistically processed in the range 600 and 1780 cm−1. Because of the large dimension of this matrix, which would have been very difficult to process, this interval was split into two matrices, namely from 600 to 1200 cm−1 and 1200 to 1780 cm−1. Each matrix was processed in the same manner. Regarding the FAMEs results, the matrix used for chemometric processing was formed by 21 compounds, measured in 23 oil samples. For a rigorous interpretation and comparison, the same number and types of samples were used in each case. The supervised chemometric technique, namely linear discriminant analysis (LDA), was applied for classification purposes regarding the type of oils (six varieties) or the characteristics of each type of oil. The principle of this analysis is that it tries to minimize the distance between samples from the same group while maximizing the distance between samples from different groups [10]. The result of this analysis is a classification model, which is a linear combination of the best variables (predictors). The obtained model was tested by the “leave-one out procedure”, which implies the testing of each sample as an unknown one. The successful model is expressed in percentages of correctly classified samples [11].
Similarly, with LDA, artificial neural network (ANN) is a supervised learning technique, which mimics the human brain activity, and the most well-known type is multilayer perceptron (MLP-ANN). This type of network is a feed forward network, which means that information moves only in one direction. The simplest type of ANN consists of at least three layers of neurons (input, hidden, and output layer) with connections among neurons from input through hidden layer and output [12]. The number of neurons from the input layer corresponds to the number of variables from the initial dataset. The output from this layer represents the inputs of the hidden layer. Before reaching the hidden layer, weighted inputs are calculated, and a bias node is added to the hidden layer. The hidden neurons send the output signal to other hidden layer or to output layer, which will finally produce the predicted values/response [13].
For teaching or training the network, three datasets are needed: first for training the network, second for validation procedures, and last for testing the model performances. The MLP-ANN learns using the back-propagation mechanism, which means that at each step the error is minimized. The weights from the hidden layer are adjusted in such a way that errors are minimized at each step [14]. MLP-ANN were applied on the FAMEs profile of investigated samples with the aim of detection of the adulterated oils, by addition of another cheaper oil, such as sunflower oil. For this purpose, the experimental data set was split into training (70%) and testing subsets (30%). The input layer had 21 units, corresponding to each analyzed fatty acid. For the hidden layer, only 9 units were involved, having as activation function the hyperbolic tangent. Finally, the output layer consisted in two units, corresponding to each category from the dependent variable (sunflower vs. the rest of the samples). The activation function used in this layer was Softmax function. The cross-entropy error for testing set was 3.85% and represents the difference between actual and predicted values of the output variables of the ANN.

3. Results

3.1. Distribution of Fatty Acids in Oils by GC-FID

Usually the detection and separation of fatty acids from oils is determined by GC-FID, but lately other techniques have been used. The separation, identification, and quantification of the levels of fatty acids in the oils of sunflower, sesame, hemp, walnut, linseed, and sea buckthorn were performed through GC-FID analyses. These results were obtained based on the previous analysis of the FAME 37 mixture that was injected and used to obtain the retention time of the fatty acids of interest presented in the oil samples.
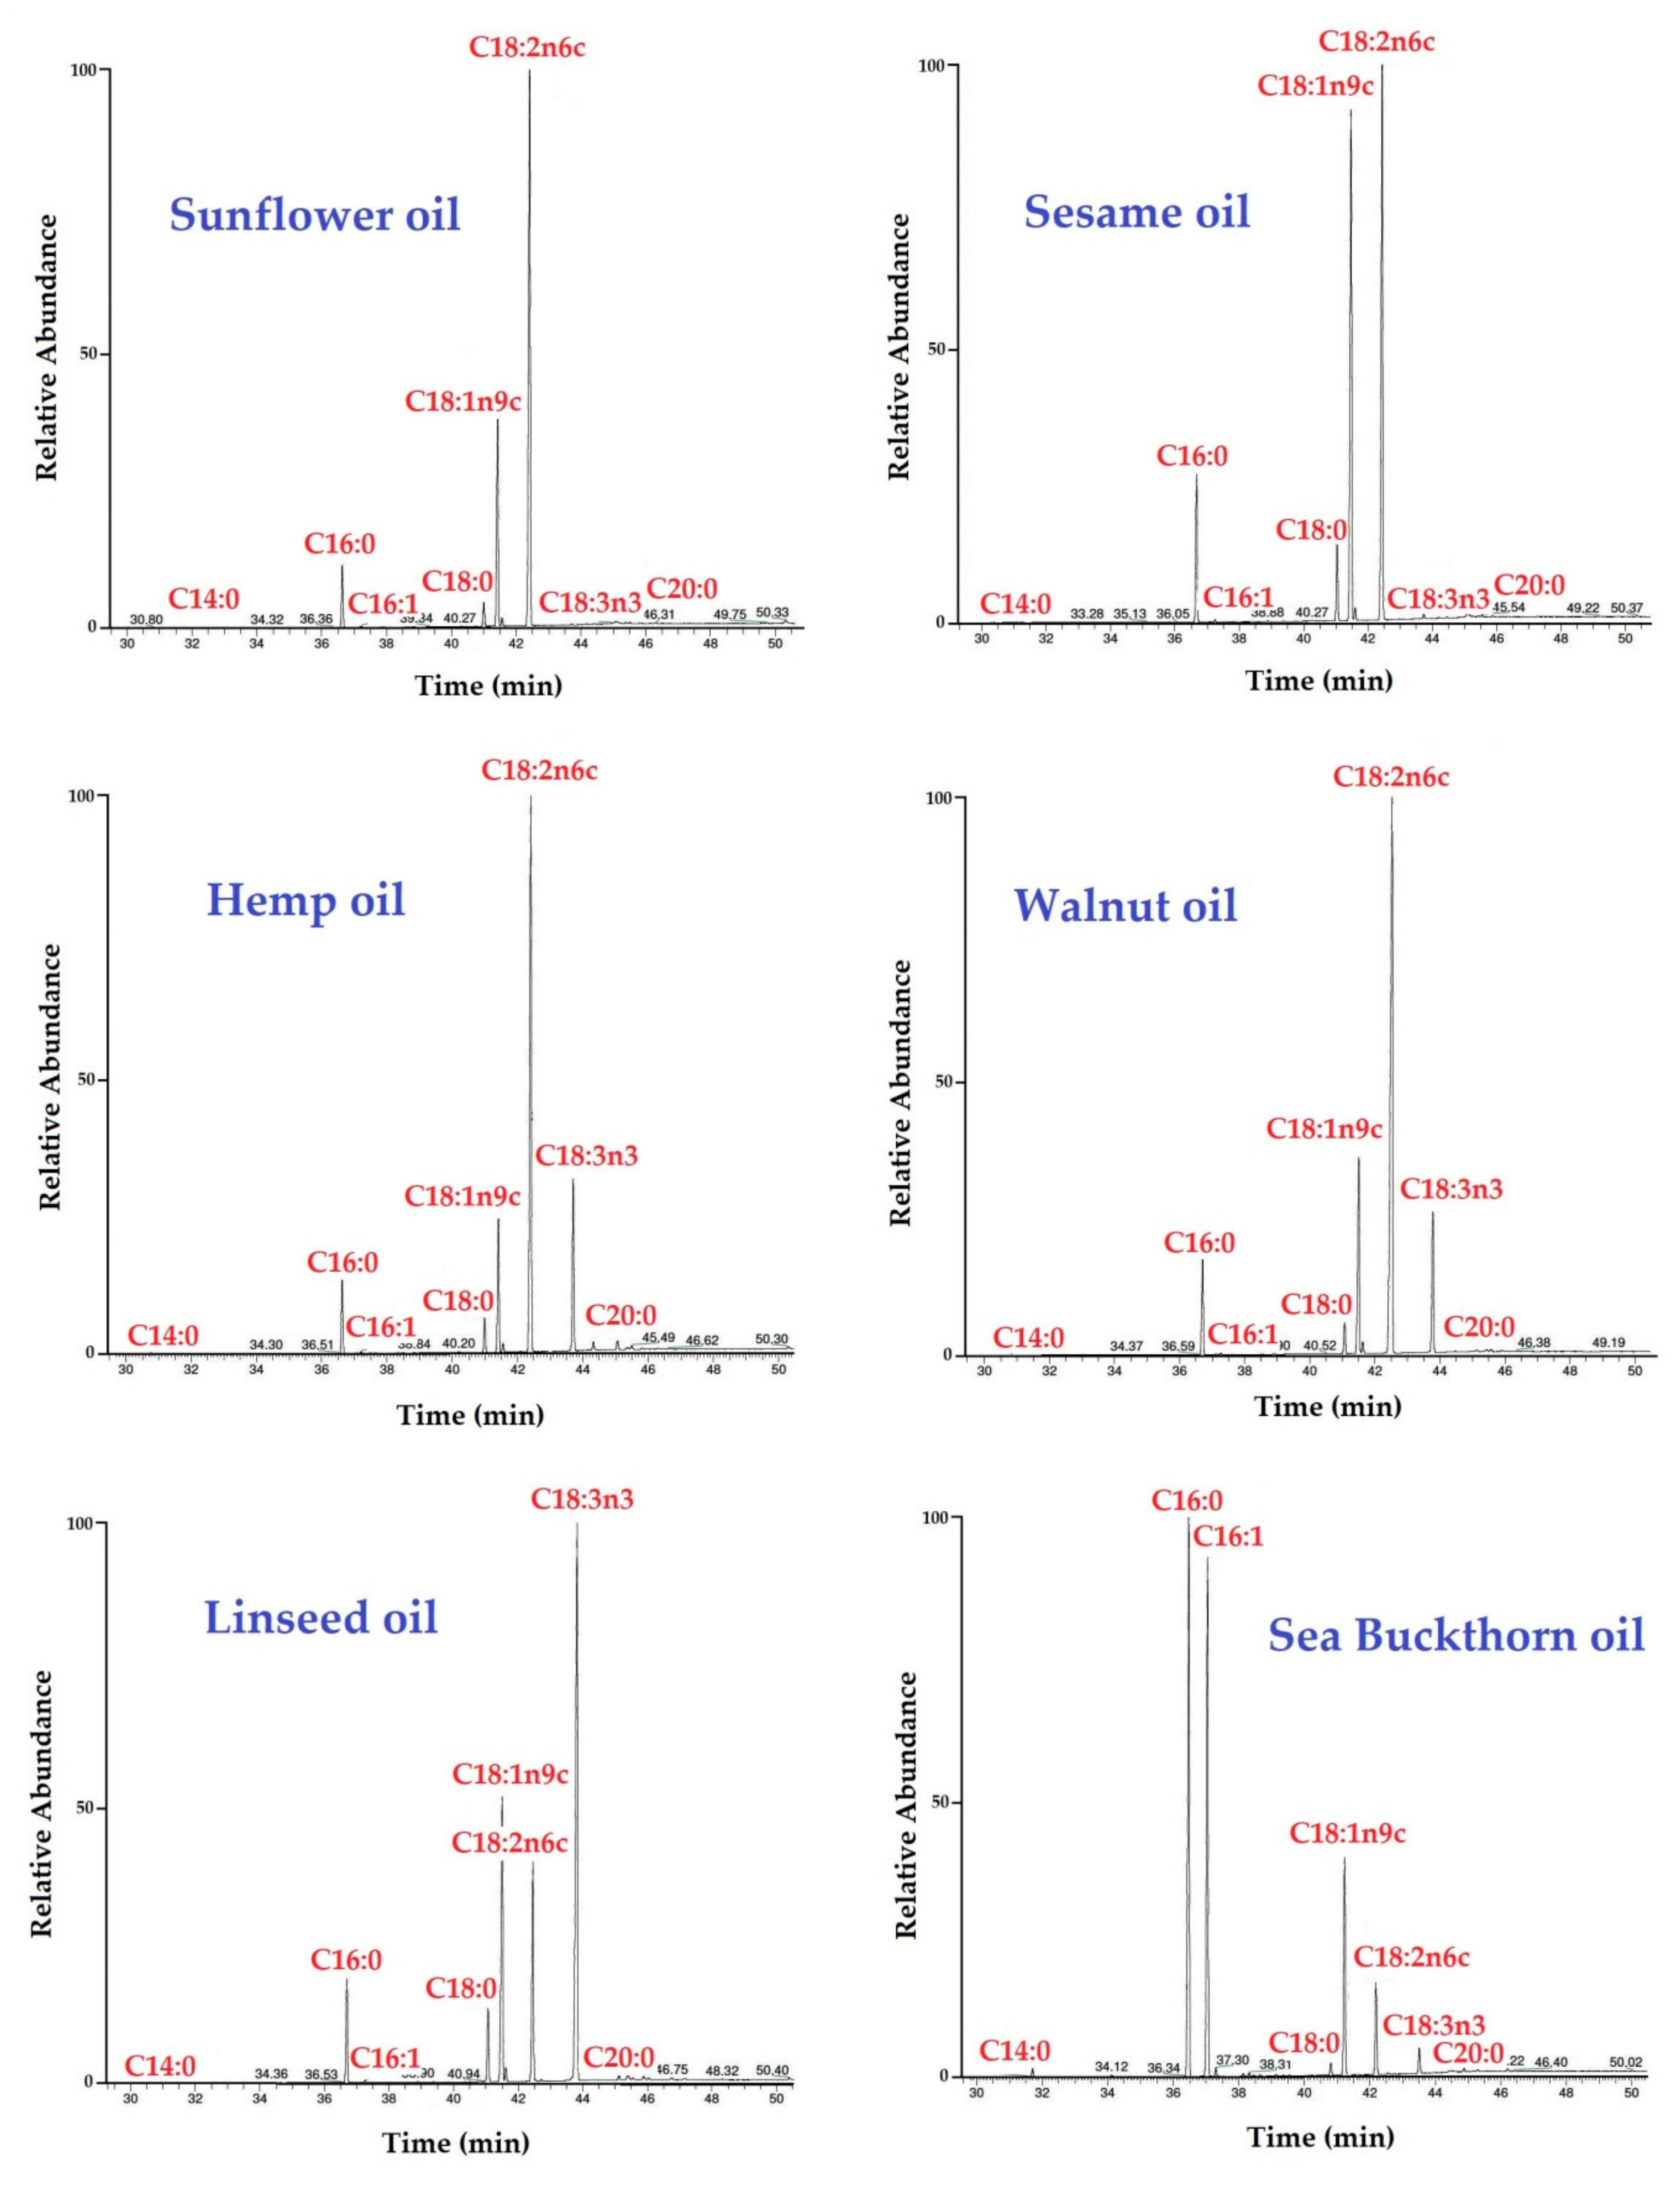
Figure 1 shows the chromatograms of sunflower, sesame, hemp, walnut, linseed, and sea buckthorn oils with peak label. Chromatograms indicate that all the representative peaks of all components were well resolved with a good separation between the peaks in less than 50 min, and this result indicates that the peak overlap was not affected by the peaks of the main constituents.
As can be noticed, the major compound in the samples of sunflower, sesame, hemp, and walnut oil is linoleic acid (peak label C18: 2n6c). Sesame oil can be differentiated from other oils by its high content of oleic acid (C18: 1n9c), a monounsaturated acid.
Sea buckthorn oil in comparison to the types of oil discussed above comprises two major compounds: palmitic acid (peak label C16: 0) and palmitoleic acid (peak label C16: 1).
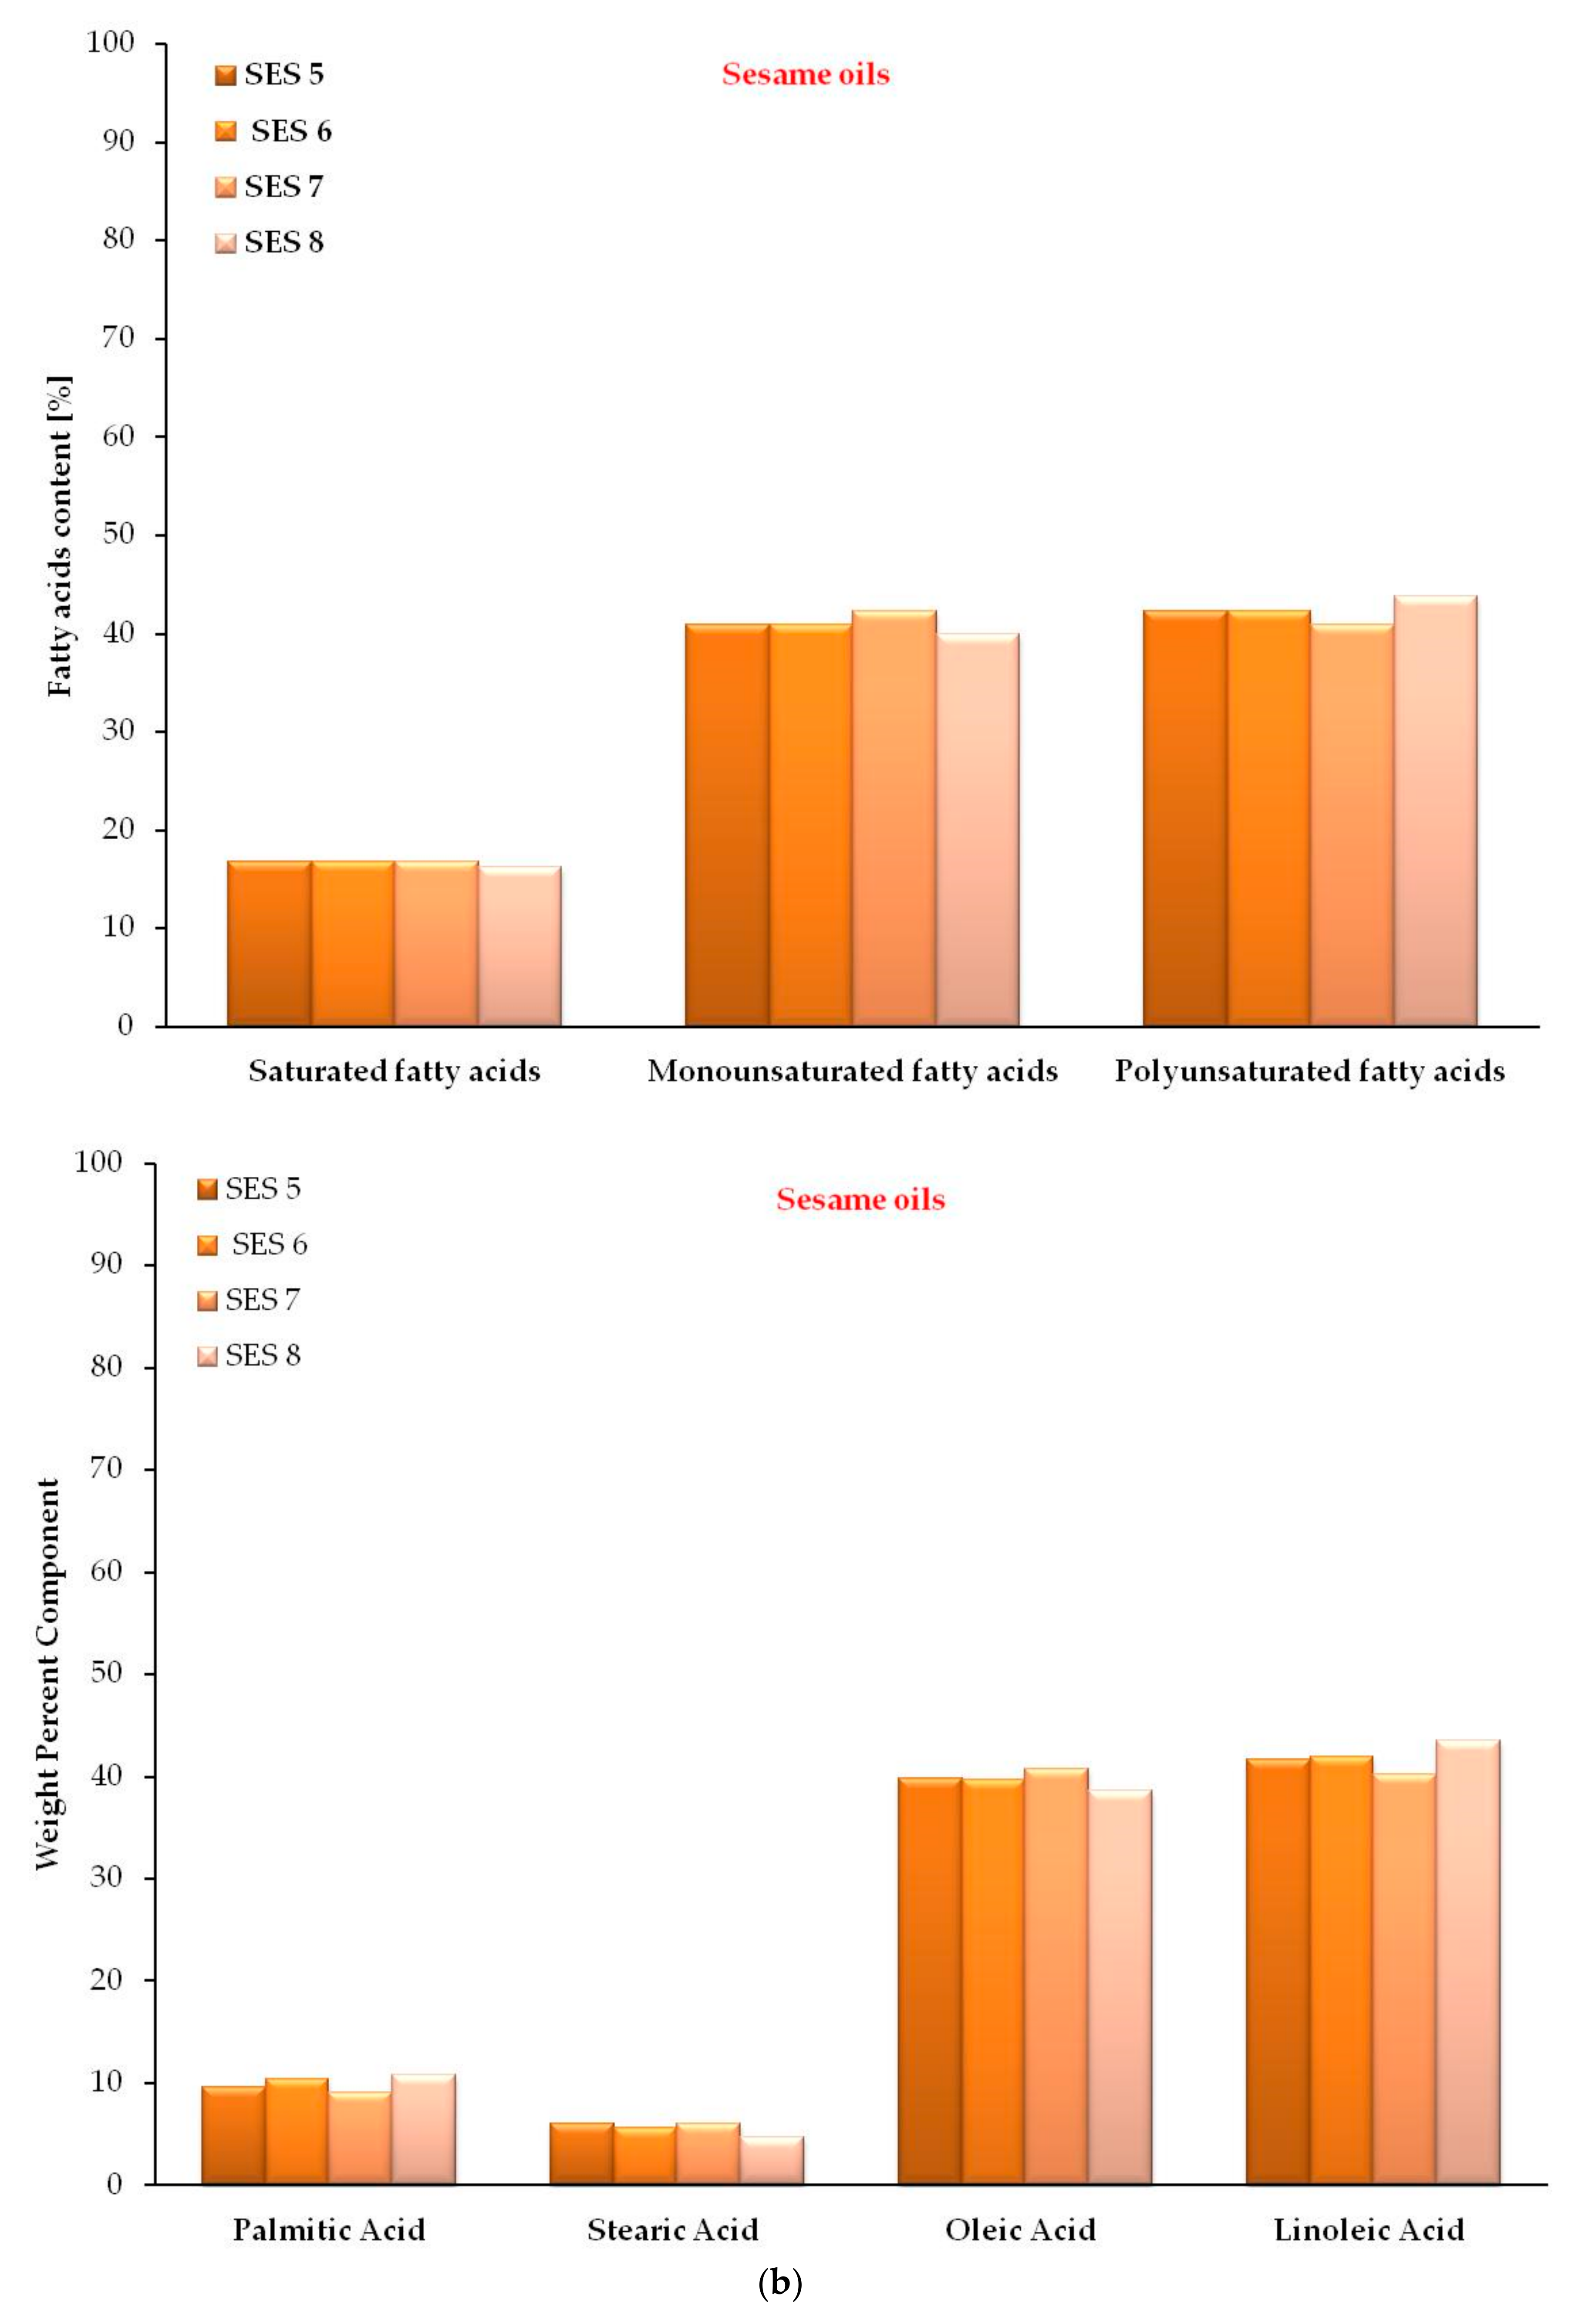
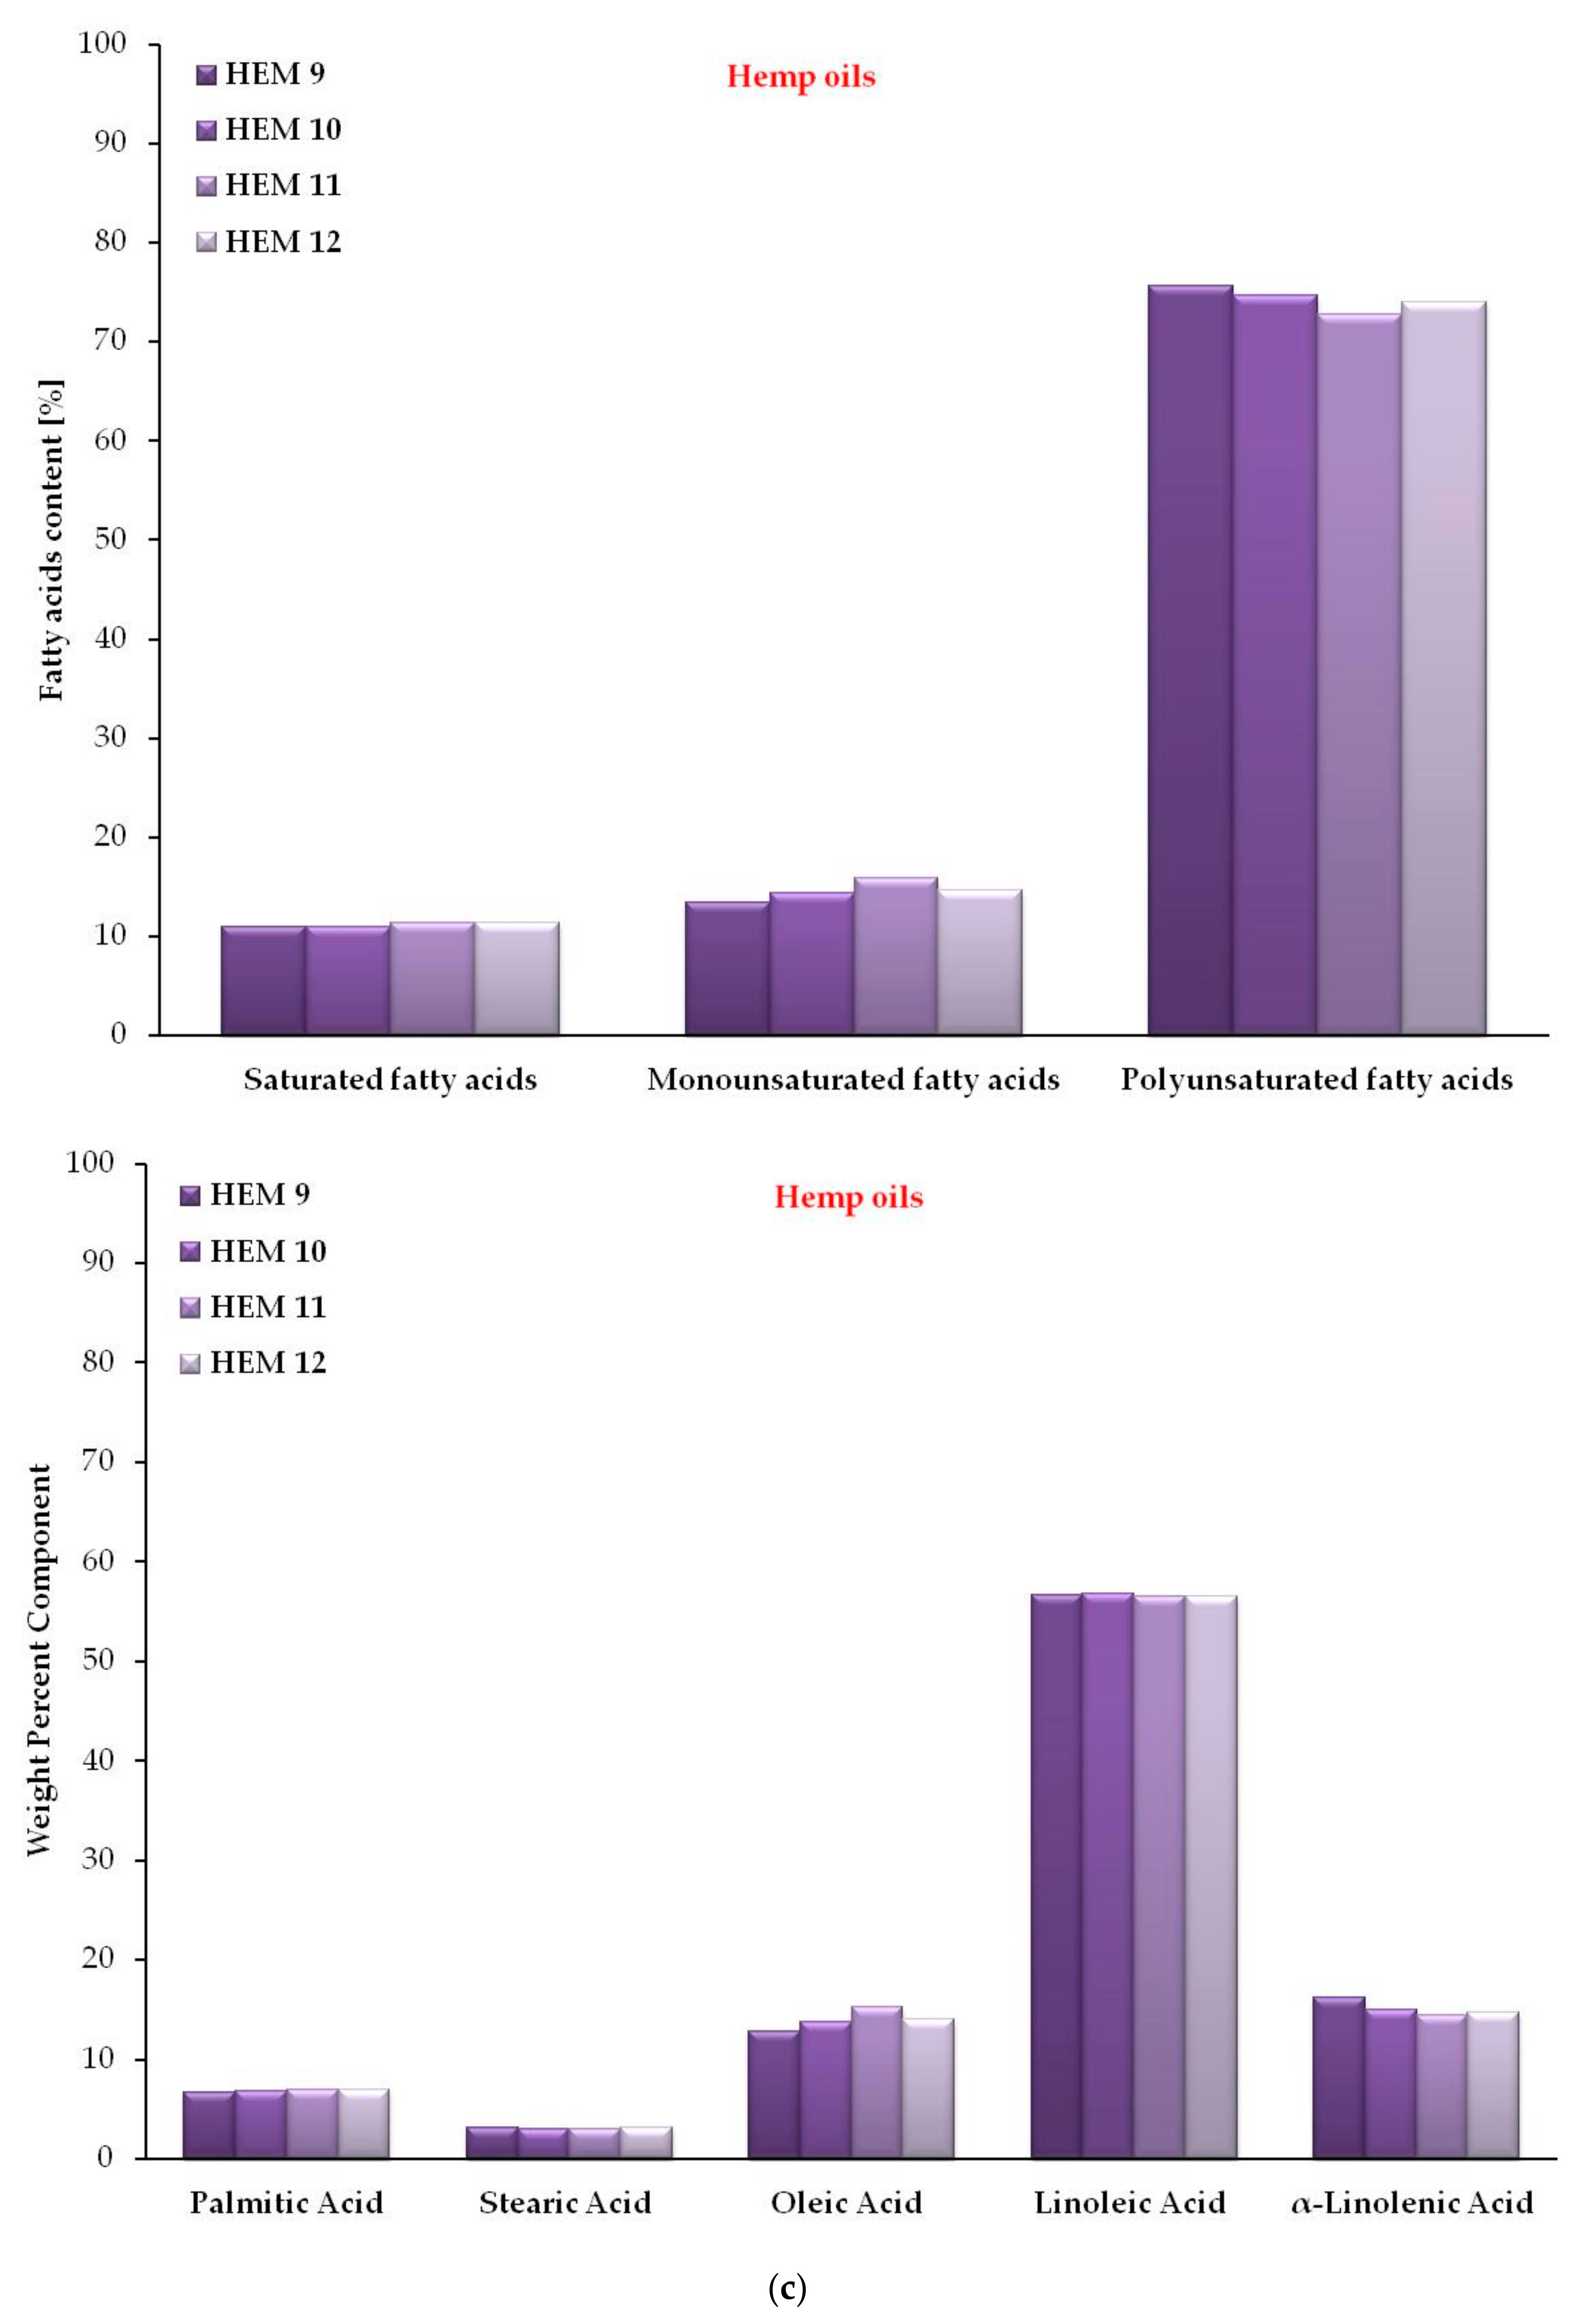
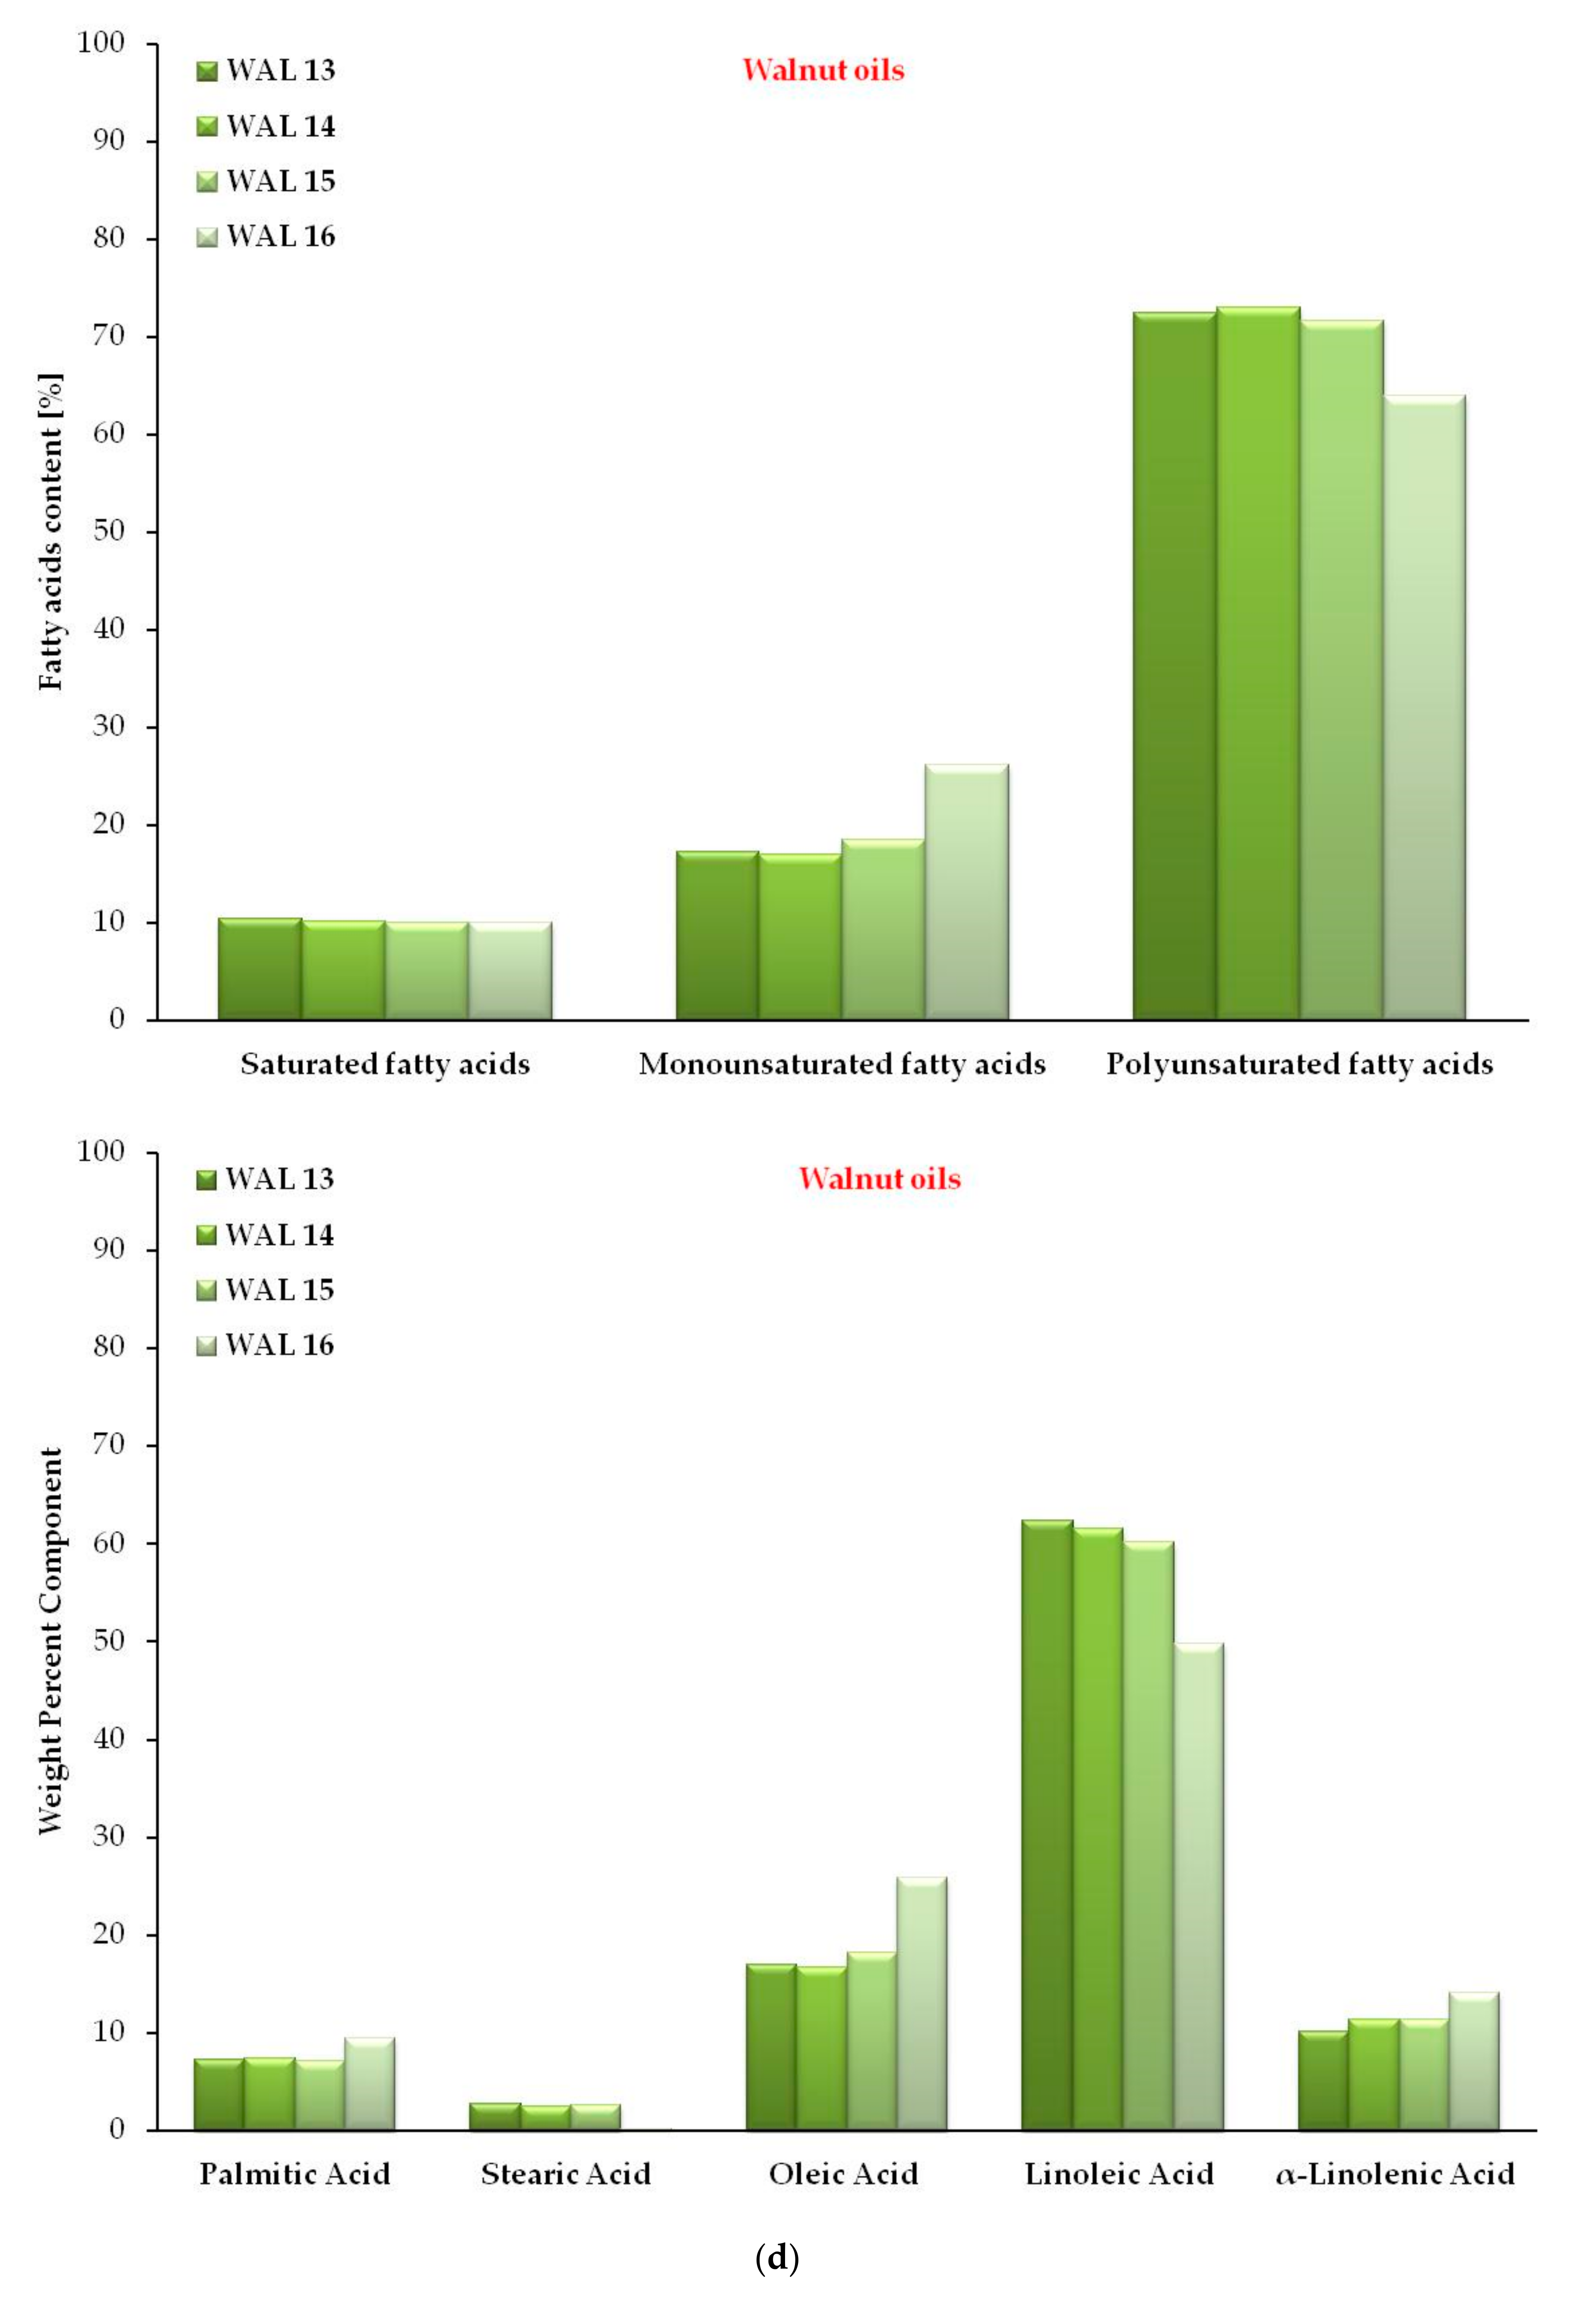
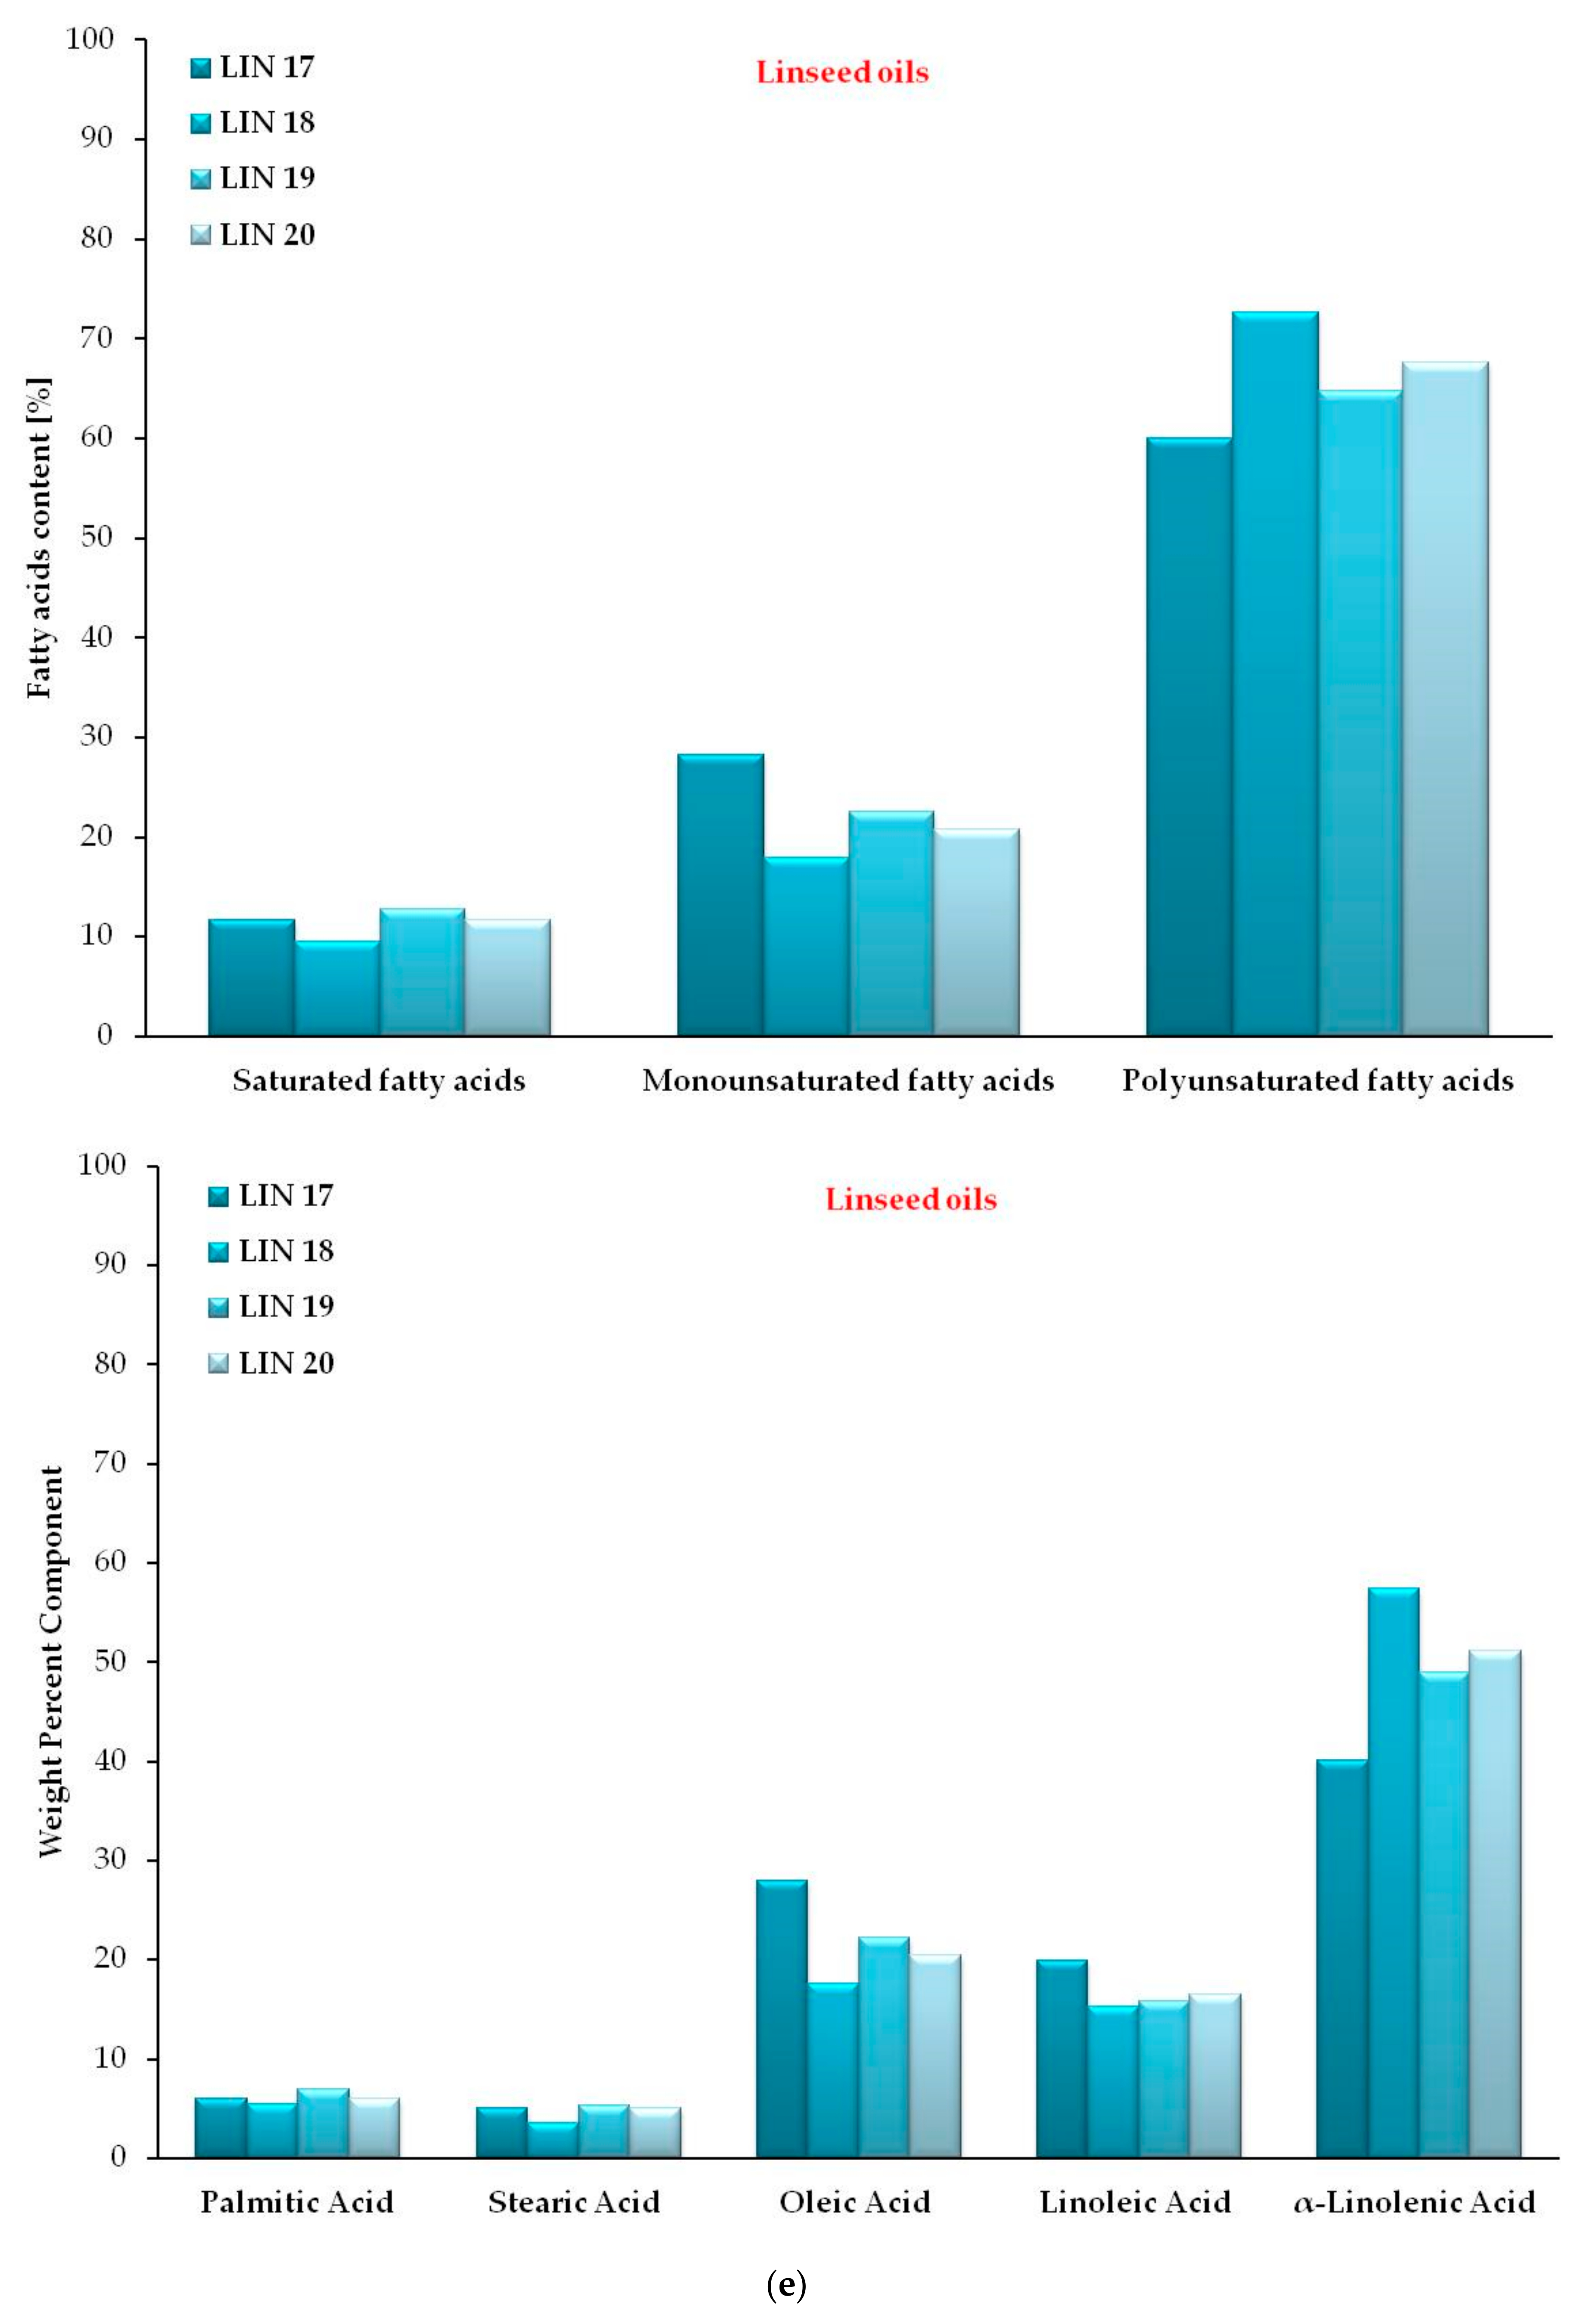
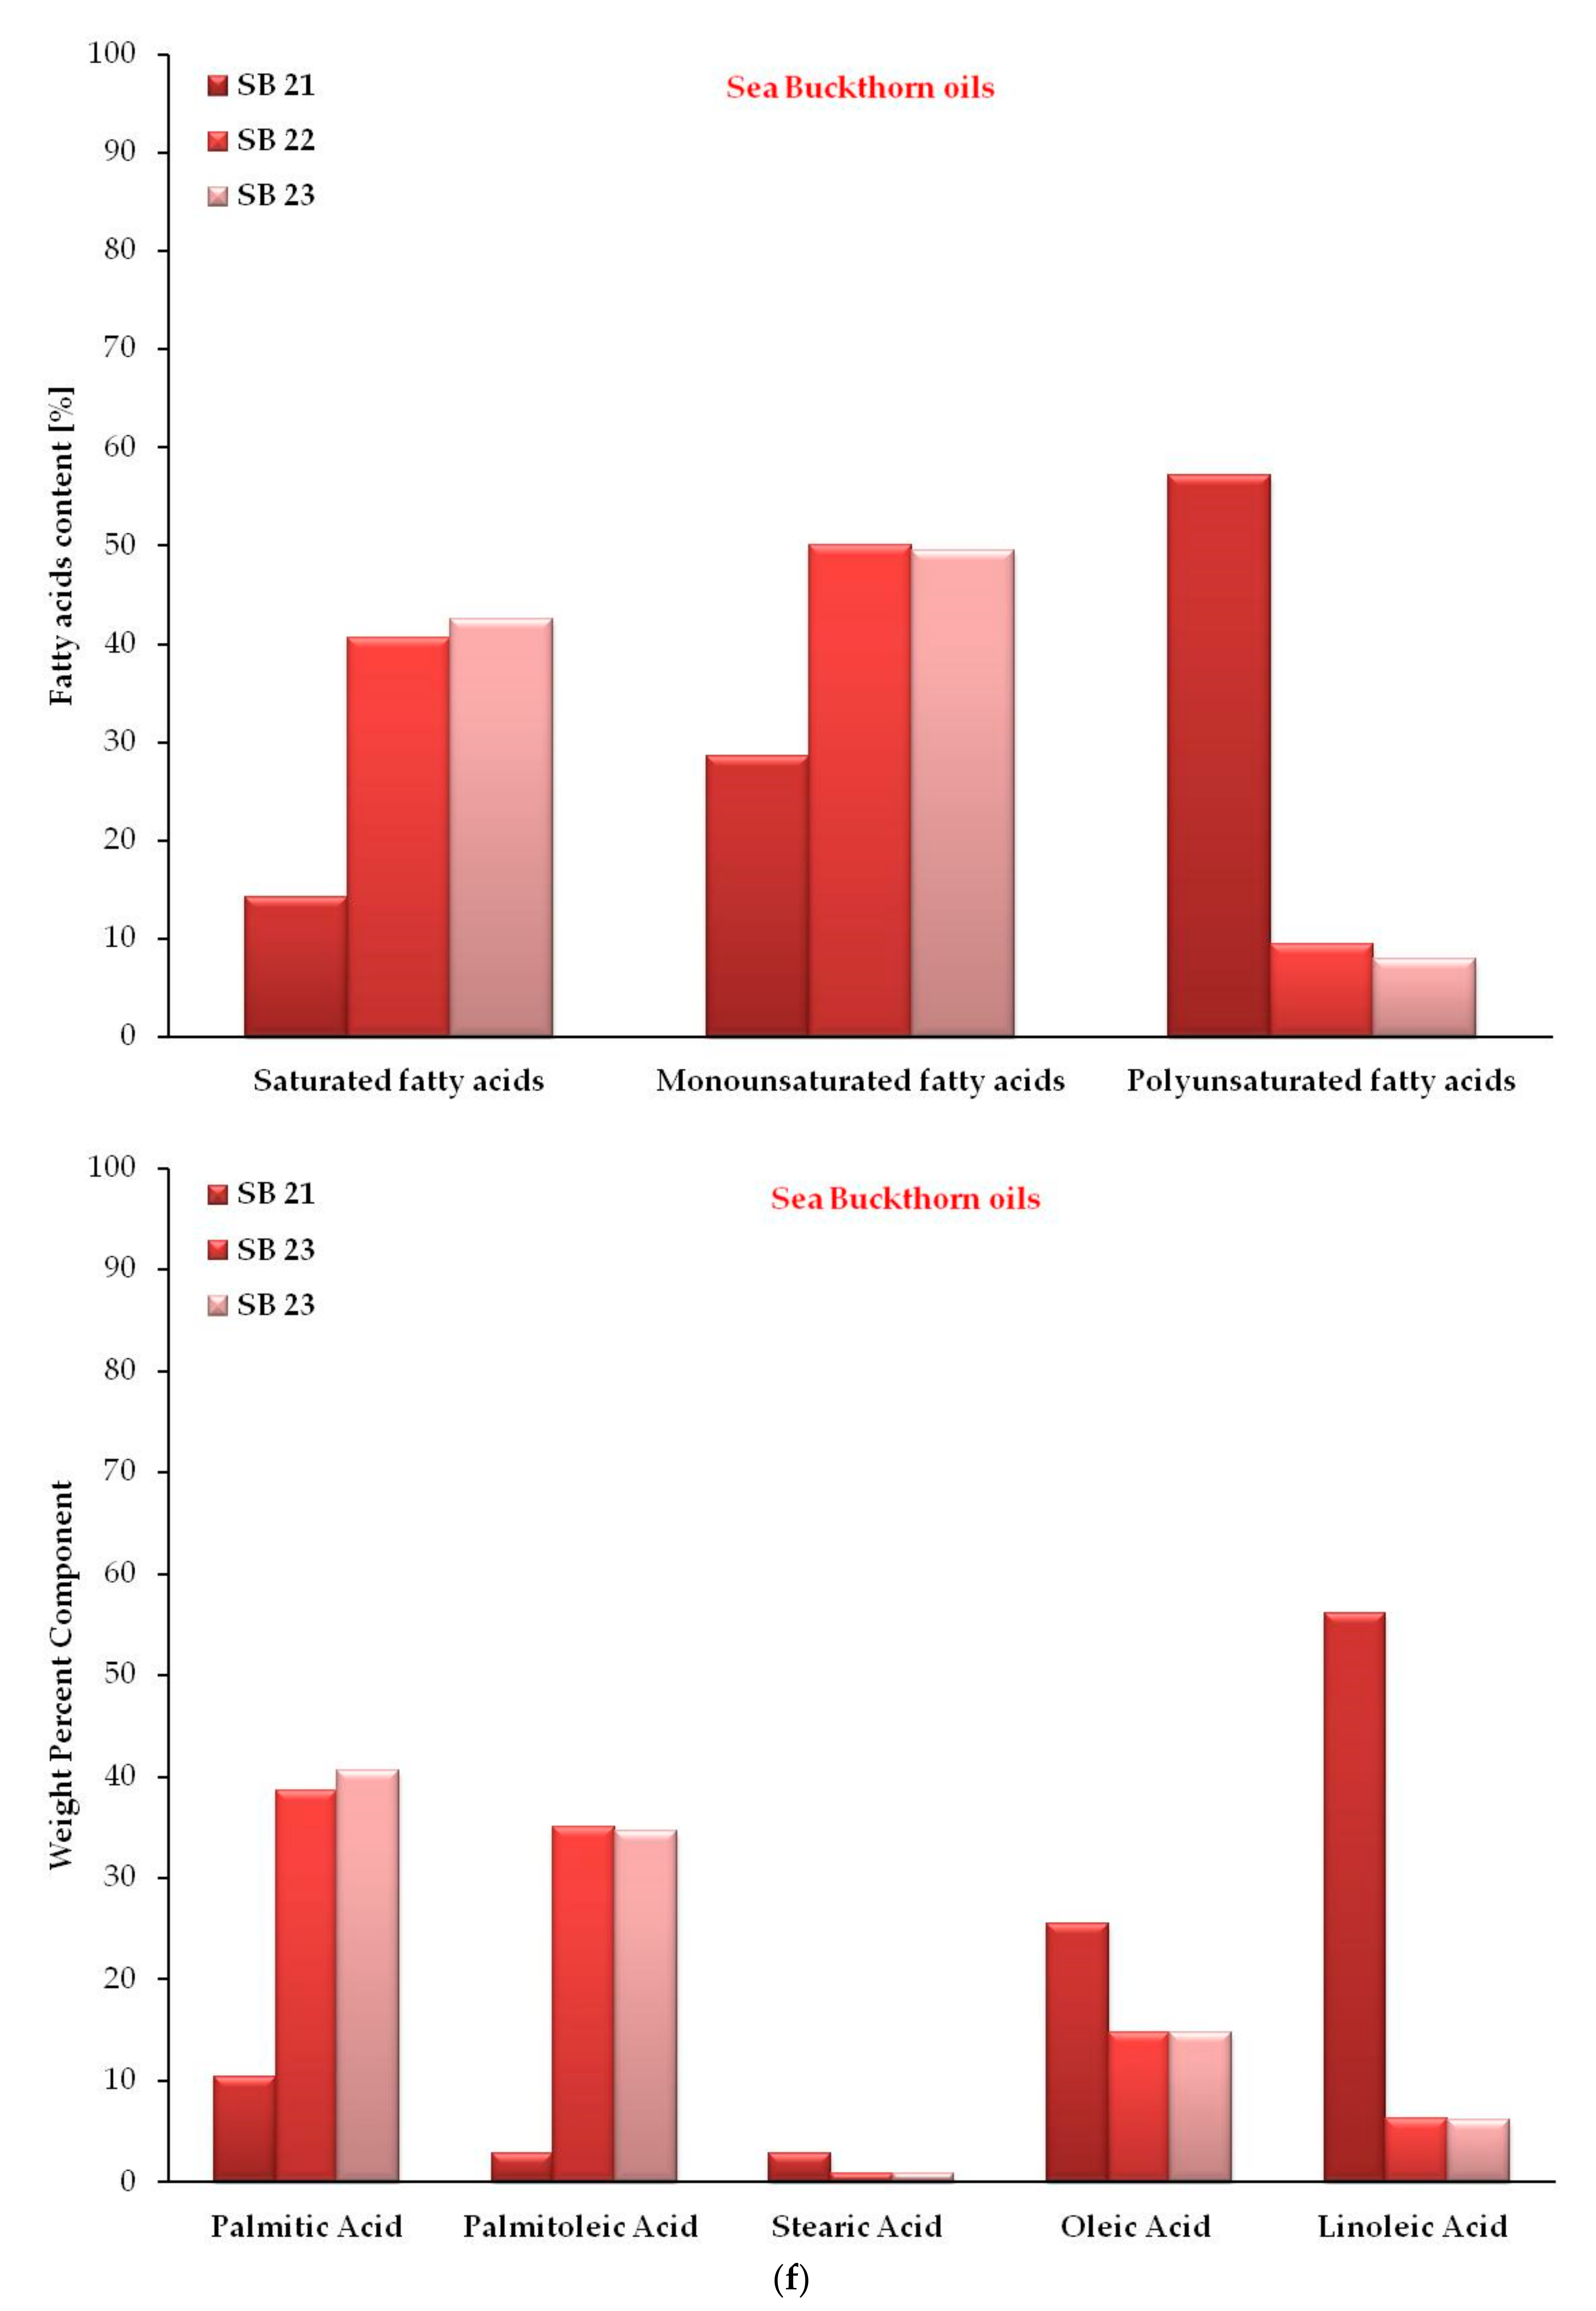
Figure 2a–f show the percentage distribution of fatty acids depending on the degree of saturation and the percentage distribution of fatty acids present in the 6 types of oil samples.
Final concentrations of fatty acids were grouped depending on their degree of saturation (saturated, monounsaturated, and polyunsaturated fatty acids) for each oil sample and expressed as minimum, maximum, and average are presented in Table 1.
Comparing the fatty acid composition of the studied samples, it can be seen that hemp oil had the highest content of polyunsaturated acids (74.29%) and the lowest content of monounsaturated acids (14.55%).
Sunflower, sesame, hemp, walnut, and linseed oils contained a high percent of monounsaturated and polyunsaturated fatty acids, summing approximately 90% of fatty acid composition.
Regarding the fatty acid composition of sea buckthorn oil, from Table 1, it can be noticed that this oil had the highest content of saturated fatty acids (41.55%) and a low content of polyunsaturated fatty acids (8.65%), except the sea buckthorn oil sample SB 21, whose concentration was 57.2% in polyunsaturated acids similar to the concentration found in sunflower oil samples.
In the case of saturated fatty acids, it was observed that the concentration was similar in the samples of sunflower, hemp, walnut, and linseed oil, the average concentrations being around 10.08–12.71% in each type of oil. A slight increase in concentration was observed in sesame oil samples where the average concentration was 16.64%.
Regarding monounsaturated fatty acids, there were significant differences, varying between the types of oil. The lowest concentration of monounsaturated fatty acids was observed in the case of hemp and walnut oil samples (14.55%, respectively 19.70%) increasing in the case of linseed and sunflower oil samples. In the samples of sesame oil, the average concentration was 41.08%, and in the case of sea buckthorn oil samples, the average concentration was 49.79%. The compound by which sea buckthorn oil could be identified compared to the other oil samples investigated was palmitoleic acid, which in the case of sea buckthorn oil samples was 35%, and in the rest of the oil samples, it was below 3%.
In the case of polyunsaturated fatty acids, the average concentration was closer among the types of oil. In the sesame and hemp oil samples, the concentration varied between 42.28 and 74.29%, and in the case of the sunflower, walnut, and linseed oil samples, the average was between 62.71 and 70.22%.
From the results obtained, it can be seen that linseed oil differed from other oil samples in terms of alpha-linolenic acid, compound which in the case of sunflower, sesame, and sea buckthorn oils, was found in a concentration below 2%; in the samples of walnut, 11%; hemp, 15%; and the highest concentration (50%) in linseed oil. Oleic acid concentrations ranged from 12 to 19% for hemp, walnut, and sea buckthorn oil samples, and from 20 to 40% for sunflower, sesame, and linseed oil samples. Stearic acid had close concentrations in all investigated oil samples. Linoleic acid was in almost all samples between 40 and 65%, except for the samples of linseed oil about 15% and sea buckthorn oil 6%. From the results obtained, the profile of fatty acids in oils varied with the type of oil sample studied.

3.2. Edible Oils Classification Based on Raman Spectroscopy

The chemometric treatment was separately performed on two spectral ranges: 600–1200 cm−1 and 1200–1780 cm−1, because of the high size of experimental data set. The statistical data processing of the first spectral area 600–1200 cm−1 indicated a lower discrimination potential as compared with that from 1200 to 1780 cm−1 for the investigated oil sample classification. Therefore, the subsequent data analysis was performed on the 600–1200 cm−1 spectral area. The simultaneous classification of all six oil species (1—sunflower, 2—sesame, 3—hemp, 4—walnut, 5—linseed, and 6—sea buckthorn), performed by applying stepwise LDA, allowed a separation of 100 and 91.3% in initial and cross-validation classification, respectively. The lower percentage which was obtained in cross-validation procedure as compared with the maximum achieved for initial classification is due to the wrong attribution of some samples to other categories as follows: samples LIN 17 (linseed) and SB 21 (sea buckthorn) that were assigned to the walnut oils group.
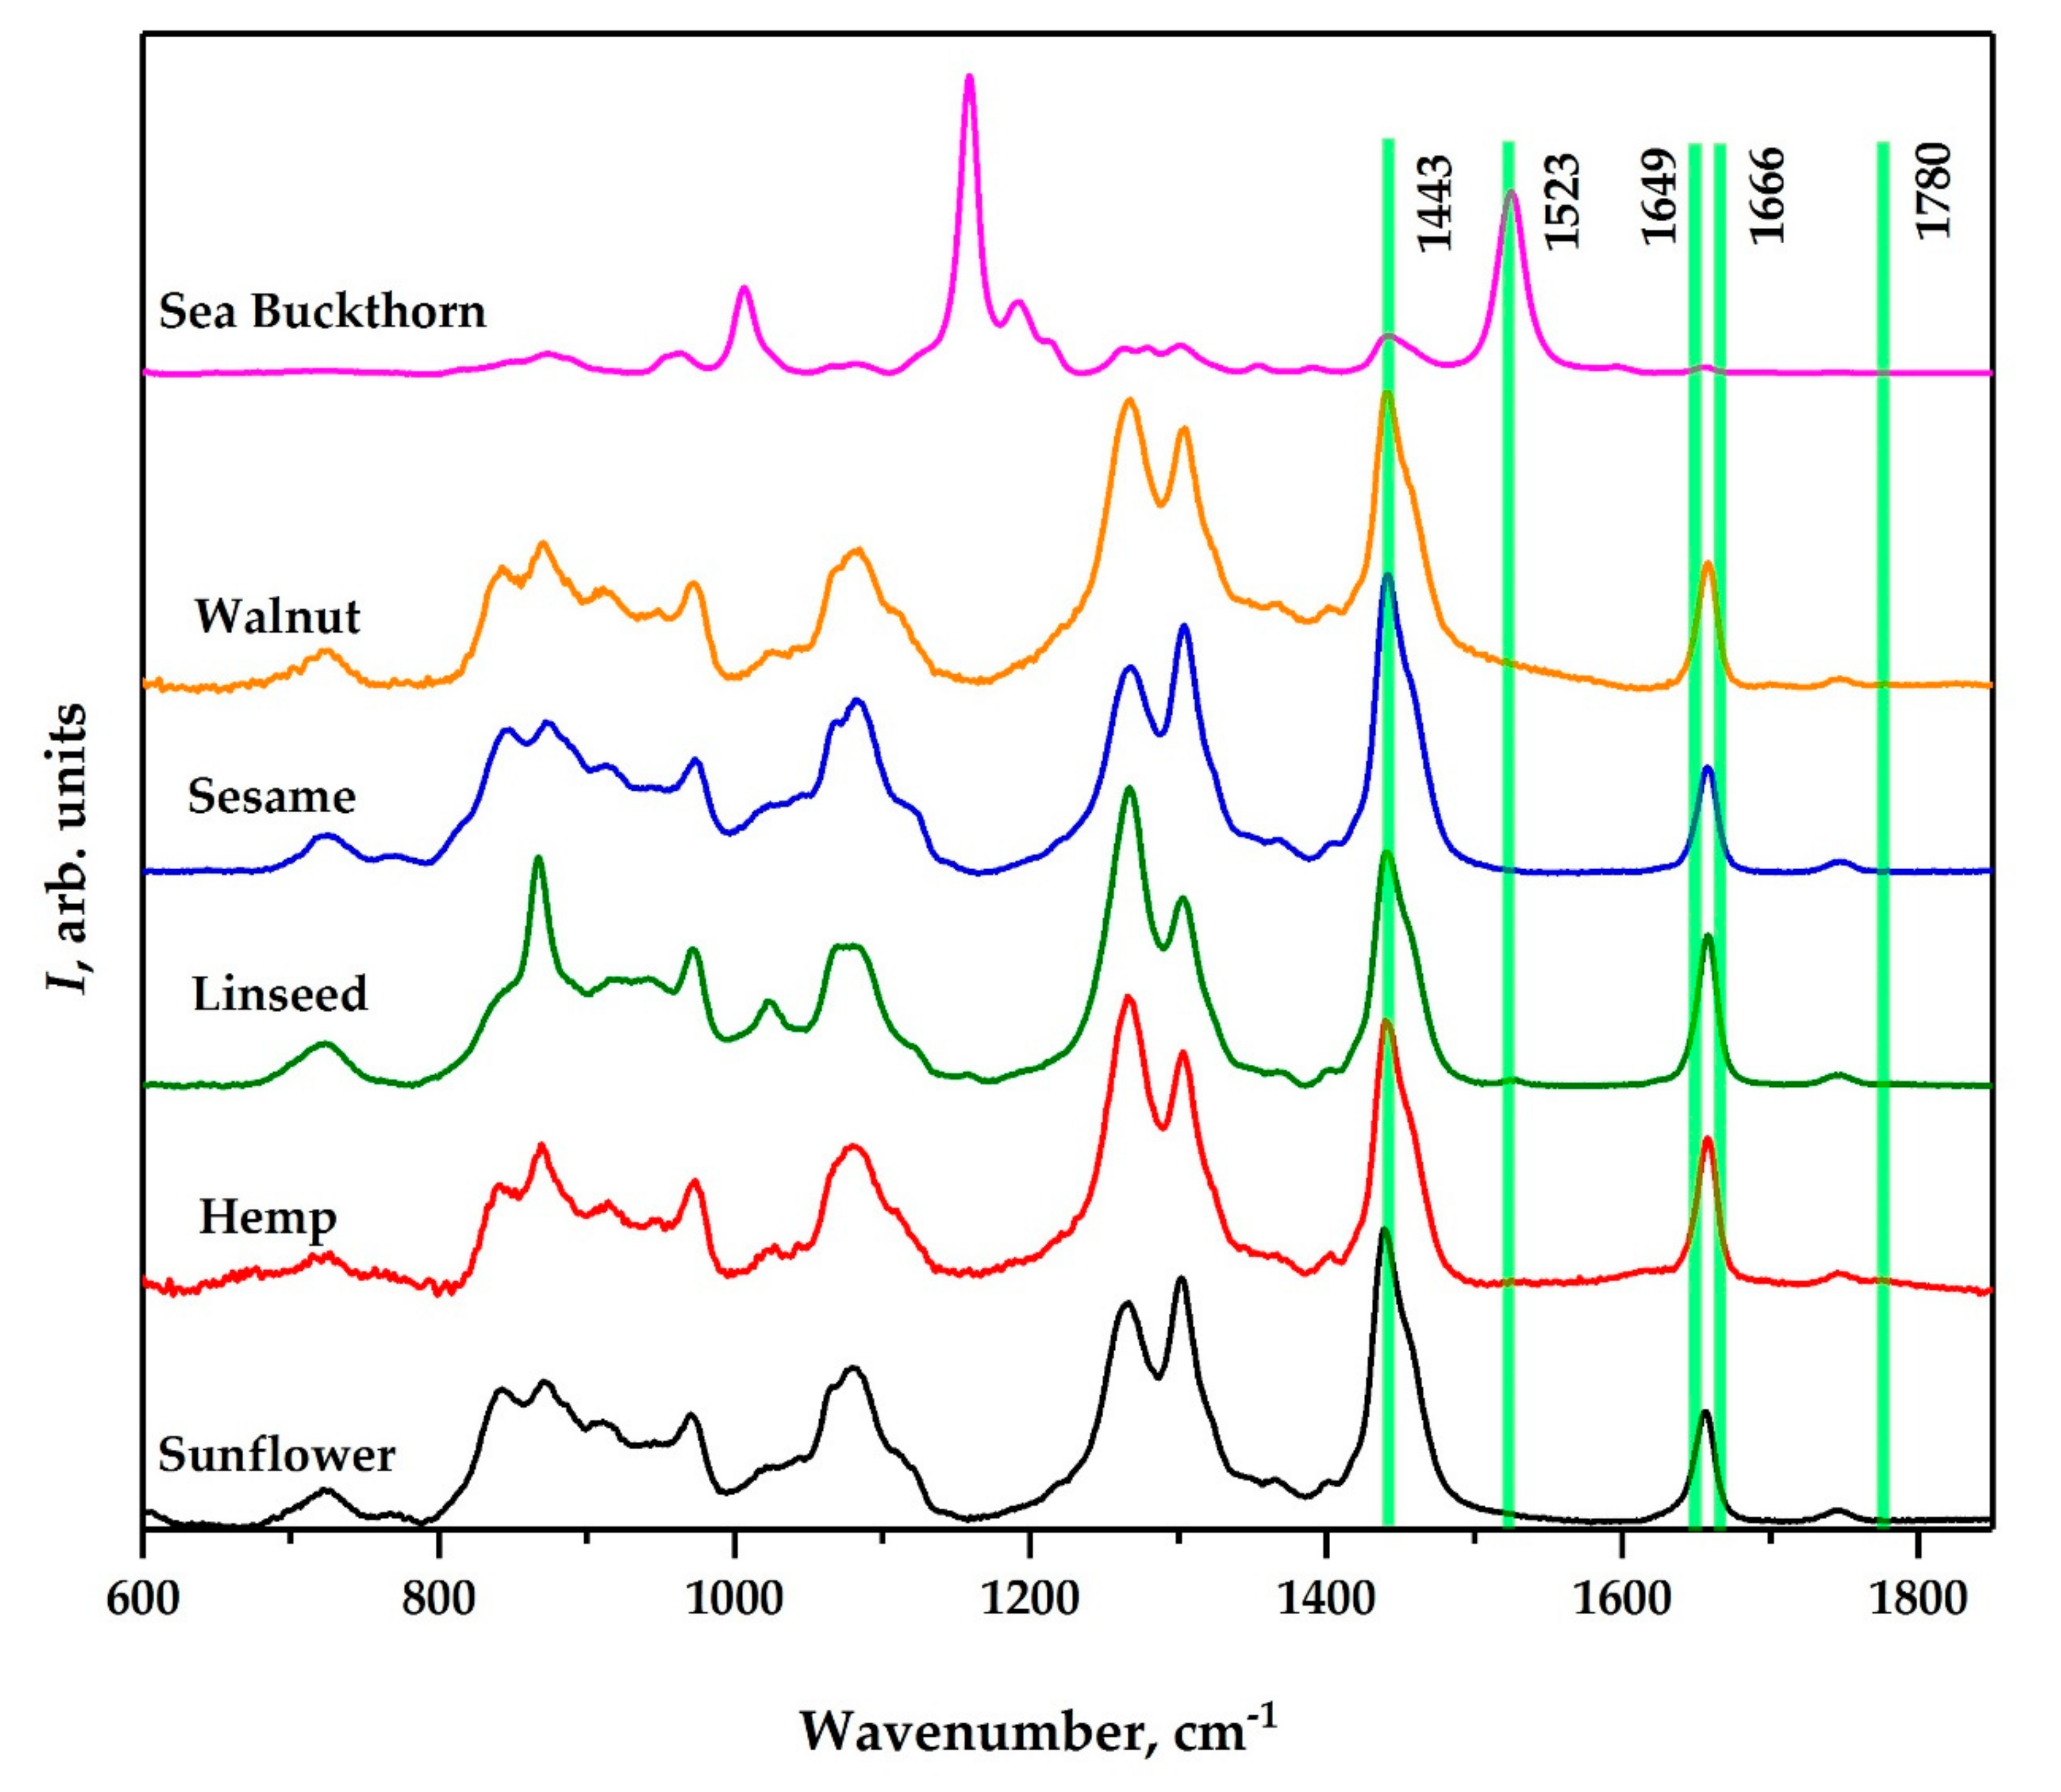
Figure 3 presents the representative Raman spectra for the six types of the investigated oils and the markers which allowed their classification; these signals are: 1443, 1523, 1649, 1666, and 1780 cm−1.
The bands observed for the simultaneous classification can be tentatively assigned as follows: 1443 cm−1 to the CH deformation (CH2 group) from the saturated part of oils [15], 1523 cm−1 to the C=C stretching vibration from carotenoids [16], 1649 and 1666 cm−1 to the C=C stretching vibration from cis conjugated systems and trans-CH=CH- groups [17,18], while 1780 cm−1 could be assigned to the C=O stretching vibration from some minor constituents—e.g., aspartic/glutamic acid residue [19] that exist in significant amounts in the appropriate seeds (e.g., hempseeds) [20]. Considering these data, we observed that the oils discrimination is mainly based on the peaks associated to the saturated part, to cis or trans configurations, to a characteristic band from carotenoids, or to a specific band (C=O) from different minor ingredients found in some oils.
In order to emphasize the characteristic features of each oil type, a separate differentiation between every specific oil variety as compared to the remaining samples was made. In this regard, the first performed differentiation was made between the sunflower oil and the rest. The separation that was achieved was 100% in both initial and cross-validation procedures based on the following discriminator signals: 1267, 1434, and 1458 cm−1. According to literature, these bands are assigned to the CH deformation vibration from cis-CH=CH- [18,21], to CH2 deformation vibrations adjacent to double bond, and asymmetric CH3 deformation vibration, respectively [17]. It is clear that for the sunflower oils, the differentiation is based on the deformation vibrations from cis and saturated fragments of the oils.
The same percentage was achieved for the separation of hemp oil from the rest of the samples; this time the discrimination signals are 1775 and 1780 cm−1, which could be attributed to the C=O vibrations from the amino acid residue found in the hempseeds and, also as minor constituents, in oil [19,20].
A good separation was obtained for the sea buckthorn oil type (95.7%) in both initial and cross-validation procedures, based on the signals from 1463 and 1525 cm−1, specific to the CH2/CH3 group deformations [22] and C=C stretching vibrations from carotenoids [16]. This separation percentage resulted because one sea buckthorn sample was wrongly attributed, being overlapped with the group formed by the rest of the samples. It should be noted here that this sample was also misclassified in the simultaneous classification of all samples. The explanation for this wrong assignment is that according to this sample label, this oil is a mixture between sea buckthorn and sunflower oils in the ratio 80% sea buckthorn oil and 20% sunflower oil.
The linseed oil was separated in a percentage of 100% in initial and 95.7% in cross-validation procedures based on the predictors from 1260, 1268, and 1662 cm−1, attributed on a literature basis to cis double-bond rocking (=C-H) [15,21] vibration, CH deformation vibrations from unconjugated cis -CH=CH- [11], and C=C stretching from cis -CH=CH- [15,16], respectively.
For the other two oil types, sesame and walnut, no clear separation was obtained. In these cases, the classification percentages were between 65 and 70%, and the discrimination was based on almost the same bands—1201, 1202, and 1500 cm−1 (walnut) or 1201, 1202, and 1502 cm−1 (sesame). These regions, 1200 and 1500 cm−1, can be associated to C-H deformation vibrations of cis -CH=CH- group or -CH2-COOH and to the aromatic C=C stretching vibrations, respectively [17]. This situation shows a great similitude between the Raman spectra of the major components of these two oils and the other investigated oils and, on the other hand, almost an identical Raman molecular specificity/fingerprint of them. Thus, from the Raman spectra intensities of the discrimination bands, it is clear that the differentiation is made by using the minor components from these oils—either a monosaturated acid or the final part from a common saturated acid and, due to the presence of bands from the aromatic region, a minor constituent generally found in these oils (e.g., vitamin K).

3.3. Statistical Approach Using FAMEs Profile

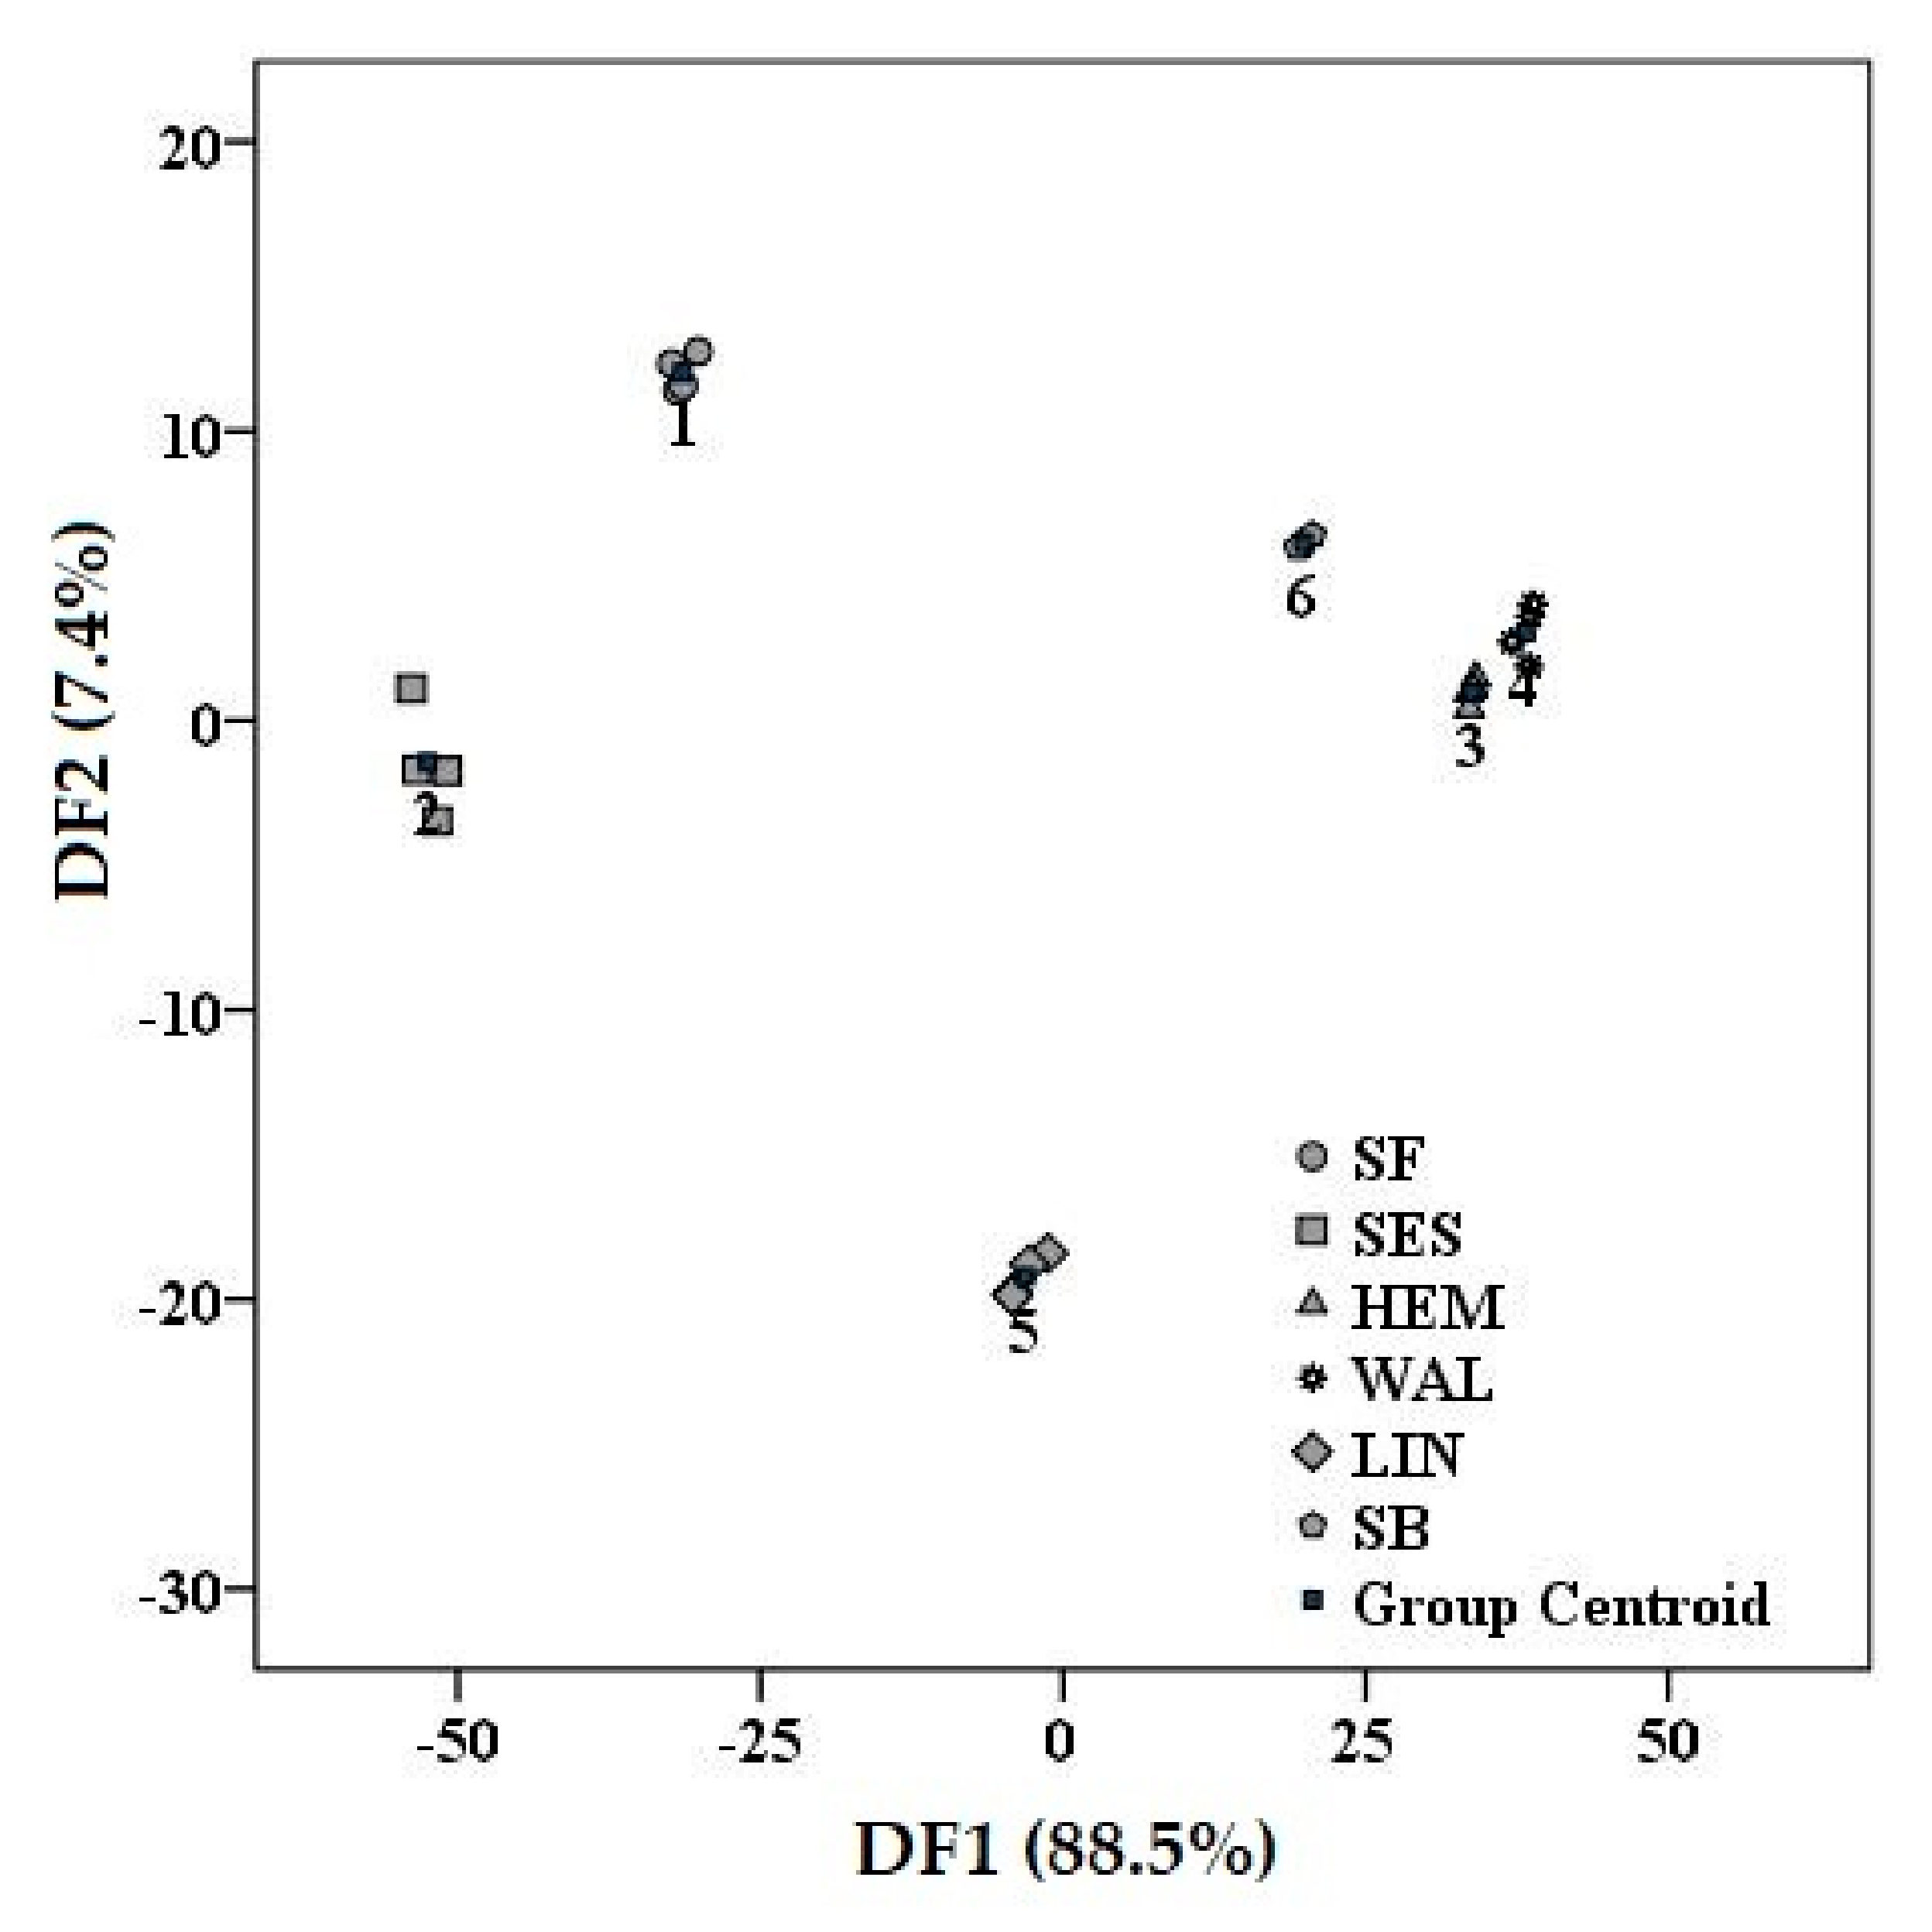
As in the case of Raman spectra chemometric processing, the same statistical approach was applied in the case of FAME profiles. By applying LDA using the matrix given by the concentrations measured in each oil sample, for the simultaneous differentiation of the six varieties, 100% in initial and 95.7% in cross-validation procedure were obtained (Figure 4). This discrimination was based on the following predictors: elaidic acid, γ-linolenic acid, cis-10-heptadecenoic acid, stearic acid, linoleic acid, pentadecanoic acid, behenic acid, and palmitic acid. In the cross-validation procedure, one sea buckthorn sample was assigned to the walnut group. This result is in good agreement with the classification obtained using Raman spectra, where, among other samples, the same oil sample was also assigned to the walnut group.
Among the organic compounds that were found as discriminant markers, the maximum mean values were measured in sunflower oils (linoleic and behenic acid), sea buckthorn (pentadecanoic and palmitic acid), and sesame (elaidic and stearic acids), while γ-linolenic acid presented maximum mean values in hemp samples, and cis-10-heptadecenoic acid had maximum mean values in linseed samples.
As in the case of Raman spectra, for a better highlighting of each oil’s features, a comparison between each type of oil and the rest of the samples was performed. In the case of sunflower oil, the percent for initial classification was 95.7%, while for cross-validation a percentage of 87% was reached. The fact that the value for initial classification was different from 100% might be explained by the fact that sunflower oil samples which were analyzed in this study were obtained through different procedures (cold pressed and refined), which might have conducted to different FAMEs profile. Moreover, this GC-FID method offers highly accurate results in terms of FAME quantification, compared to Raman spectroscopy. The obtained classification model is based only on two acids, behenic and cis-11,14-eicosadenoic acid.
In the case of walnut classification, the percent obtained for initial classification was 100%, while in the cross-validation step 95.7% was reached, due to one sunflower sample, which was overlapped on the walnut group. The most representative compounds for this classification are the following acids: arachidic, linoleic, behenic, erucic, and oleic.
In the case of sea buckthorn, the same percent for initial and cross-validation was obtained, namely 95.7%, the same sample which was misclassified in Raman classification being misclassified here too. Palmitoleic acid is the only significant marker obtained in this case.
For the other three varieties (sesame, linseed, and hemp) very clear discriminations were obtained (100% for both classifications-initial and cross-validation). The most representative markers used in every model were as follows: for sesame, palmitic acid, pentadecanoic acid, stearic acid, behenic acid, lauric acid, and erucic acid; for linseed, heneicosanoic acid, γ-linolenic acid, and caproic acid; while for hemp, γ-linolenic acid.
The obtained classification using MLP-ANN is summarized in Table 2 presented below. It can be observed that the percent obtained for the training set was 100%, while the percent obtained for the testing set was 75%, due to one misclassified sample from the sunflower group. These values suggest that the estimated model will be able to accurately classify the oil samples between the two predefined categories.
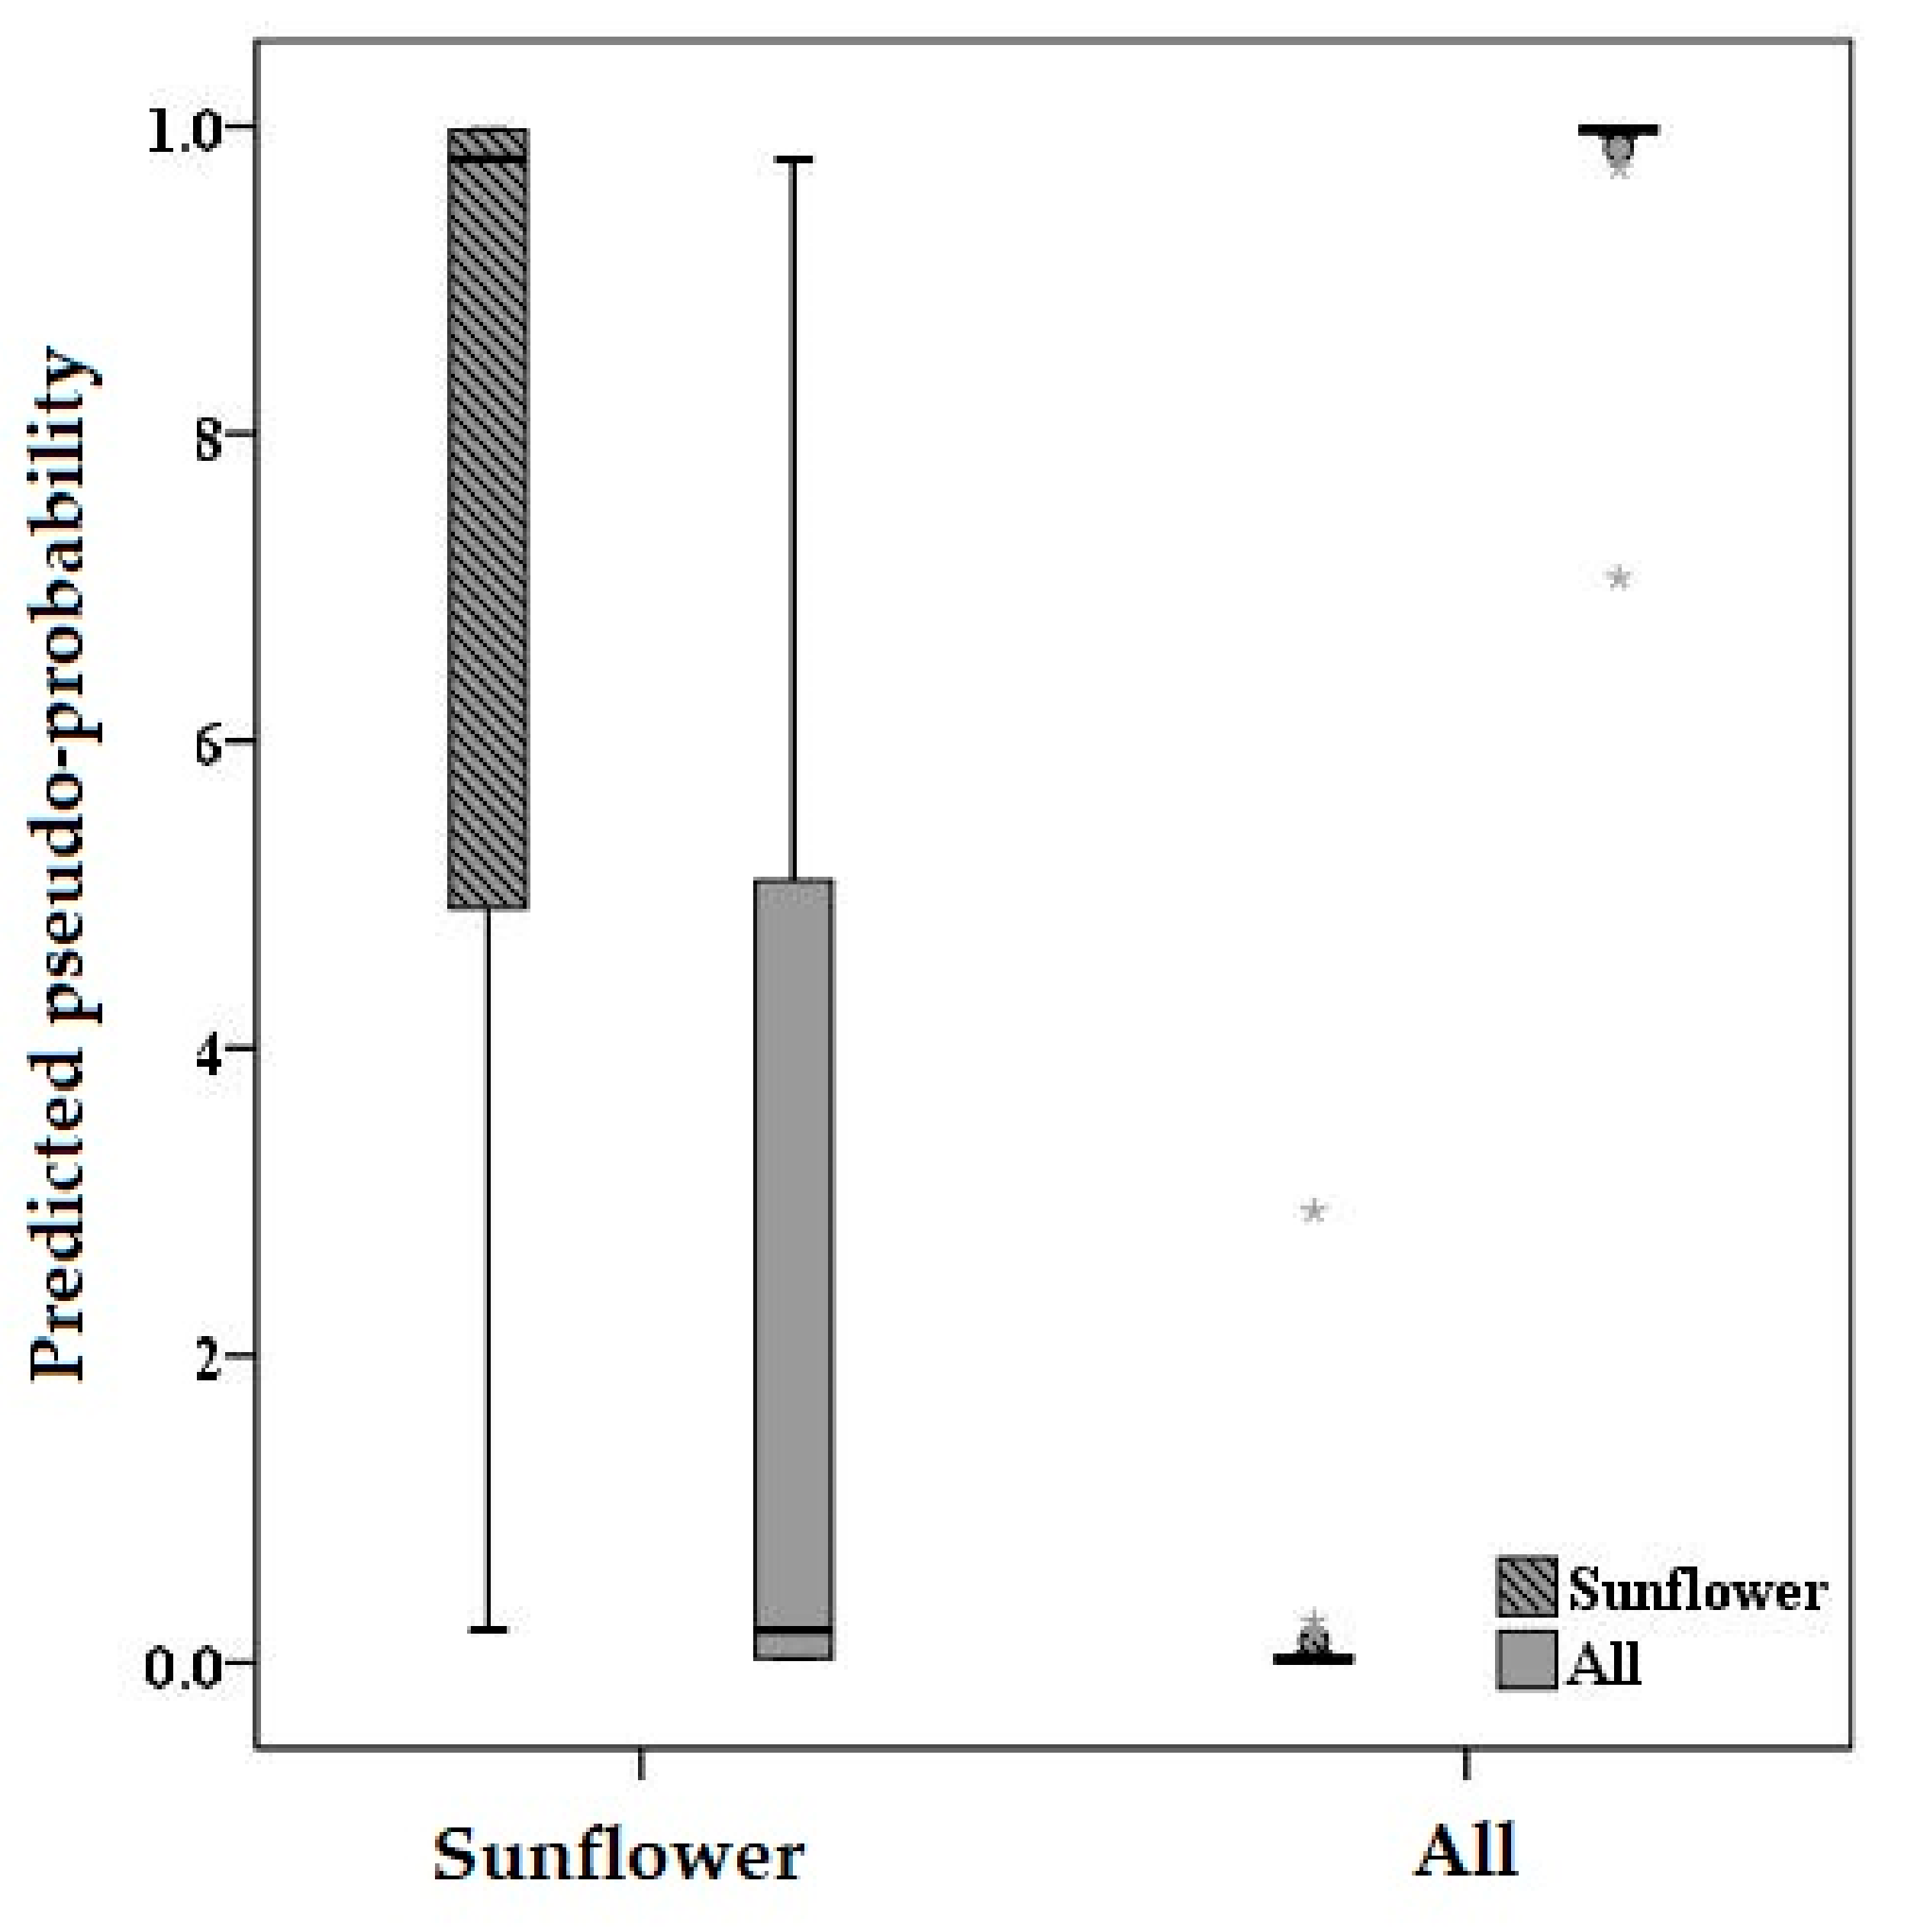
In Figure 5, the box-plot of pseudo-probabilities is presented. For the dependent variable (1-sunflower, 2-all), the chart displays box-plots that classify the predicted pseudo-probabilities taken into consideration in the whole dataset. The correct predictions are those above 0.5 for each box plot. For the sunflower group, all values are above 0.5, which means that the predicted pseudo probability is very high for this category.
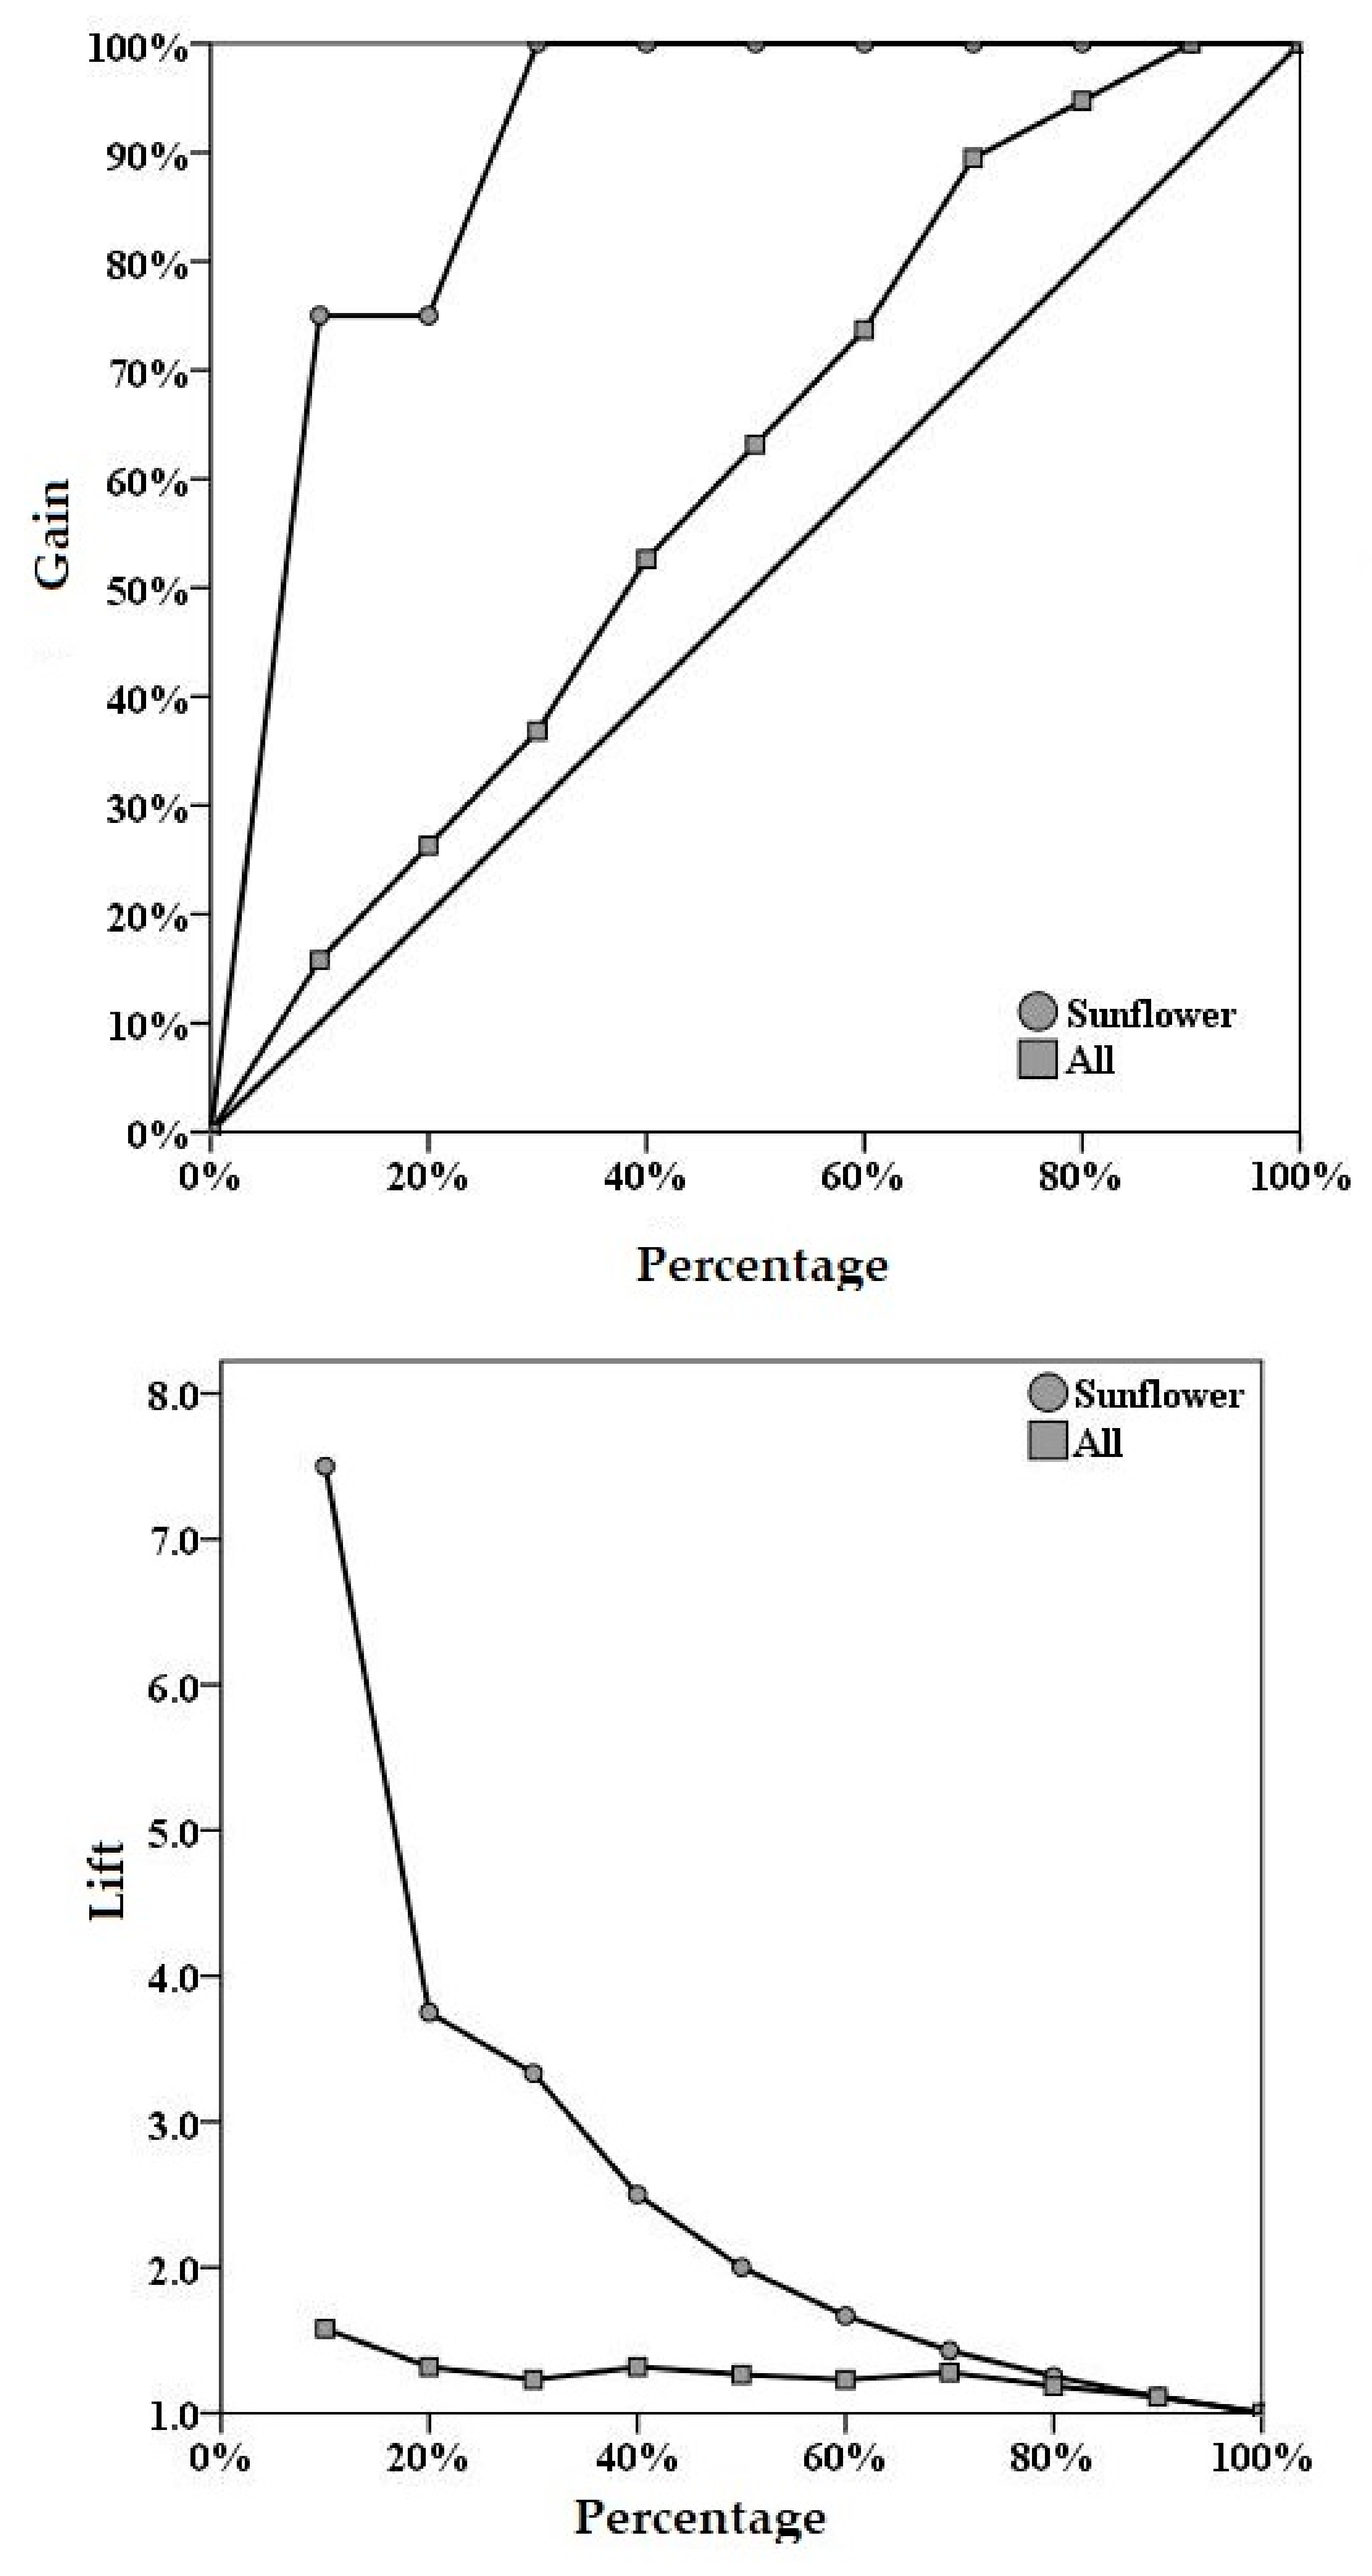
The gain chart (Figure 6) is a measure of the efficiency of the classification model, expressed as the percentage values between the correct classification obtained with the model and the correct prediction obtained by chance (without model). The diagonal line represents the randomly assigned cases (oil samples). Each line represents a category for the predefined group of dependent variables. The further from the diagonal line the group line is, the more powerful the developed model is and also the greater the performance is.
The lift chart is “obtained” from the gain chart, the values from the gain chart being used for calculation of lift factors. For example, the second point of sunflower line from gain chart corresponding to 75% gain, corresponds to a lift point of 3.75 and for another point corresponding to 100% gain a lift point is represented by 3.33 and so on.
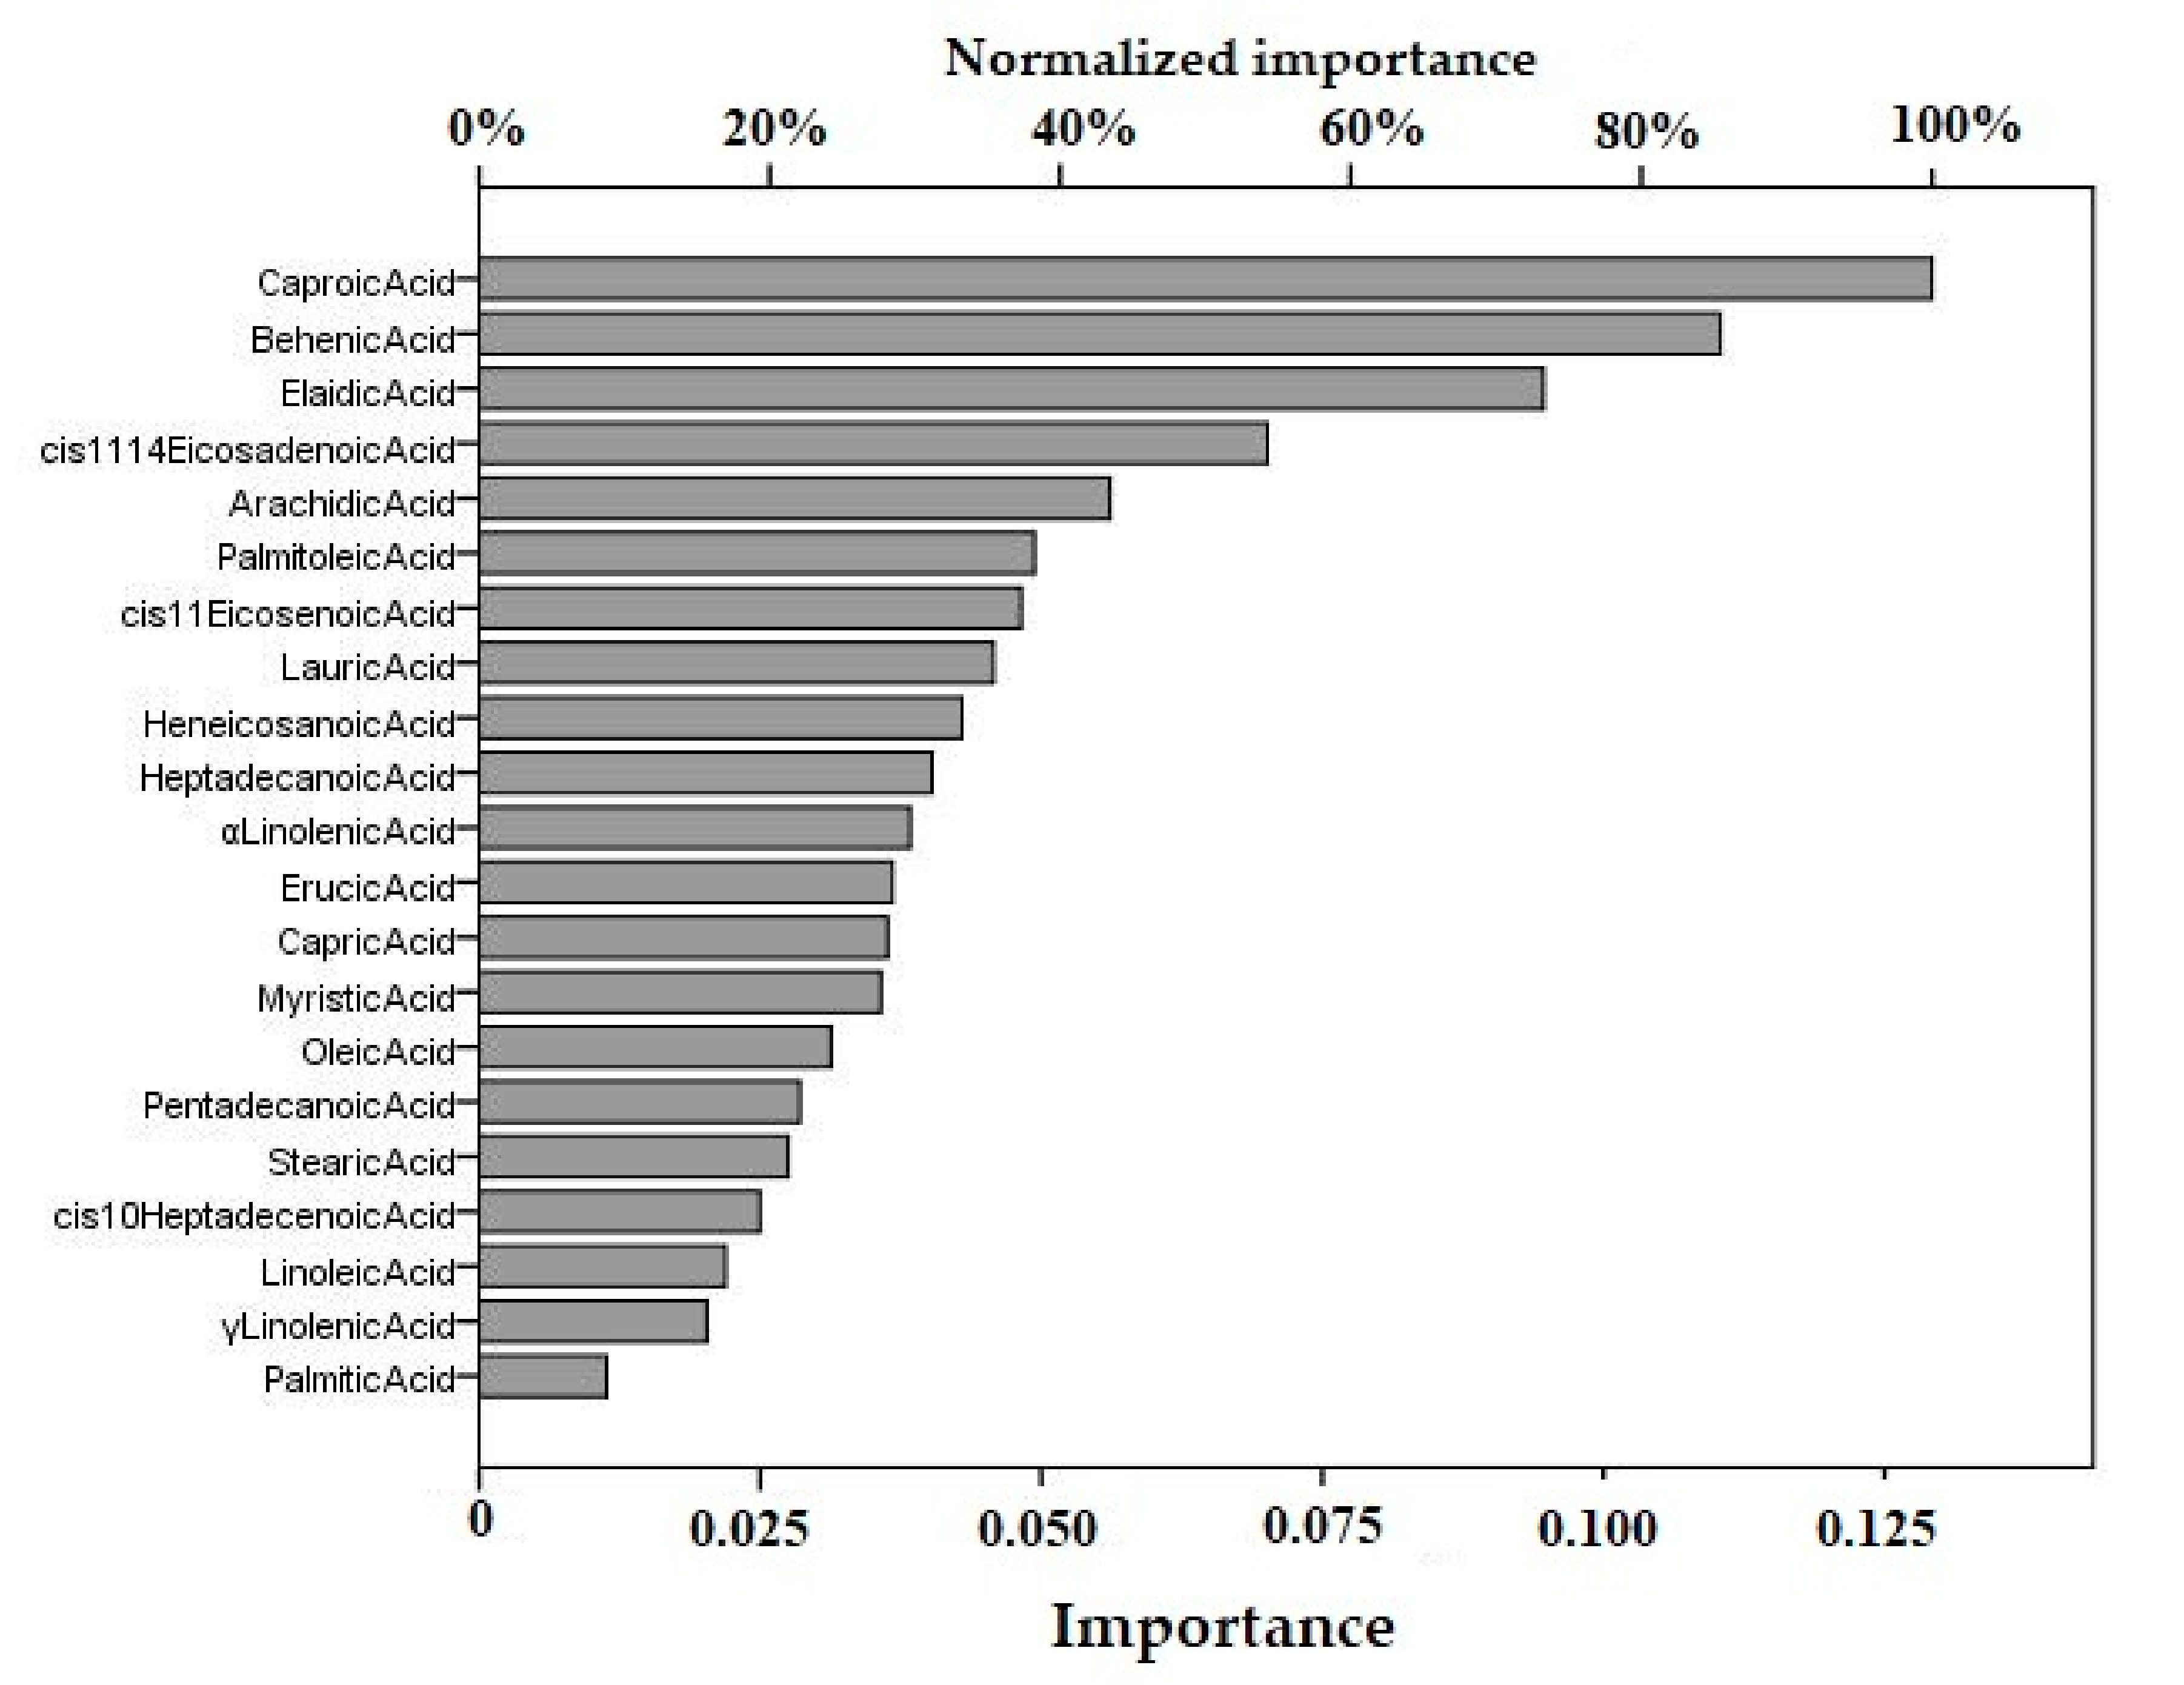
The most representative chart obtained from MLP-ANN is the independent variable importance chart (Figure 7). It seems that the most important contribution to the model is given by caproic acid (100%), followed by behenic acid (85.5%).
The GC-FID fatty acid profile determination, followed by MLP-ANN data processing, offered a model with very high prediction rate. Additionally, the most significant fatty acid, which contributed the most to this model, was highlighted.

4. Conclusions

This work presented a comparative study concerning the potential of two analytical techniques—Raman spectroscopy and gas chromatography—for oil differentiation.
Finally, we note the analogy between the two statistical investigations for the simultaneous classification; thus, on the one hand, in Raman, we have as discriminate markers the characteristic bands of cis or trans double bond, saturated fragments, while, on the other hand, in the FAME measurements, the cis or trans double bond from linoleic or elaidic acids, the saturated fragments from behenic, or stearic acids are observed. A significant difference was perceived for the sea buckthorn oils where, in Raman, the marker was linked to the double bond from carotenoids, while in FAME, to the saturated acid from these oils.
Regarding the comparison between each oil type and the rest of the samples, the results are more or less similar. Hence, for sunflower oils, it is clear that both the saturated and cis double bonds fragments are involved (the Raman characteristic bands or a saturated acid and a cis-double unsaturated acid, respectively).
For linseed oils, if in FAME, there is a mixture of saturated and unsaturated acids as markers, in Raman, only the cis double bonds Raman bands appear as markers; however, there is an analogy between the two investigations related to the presence of unconjugated cis double bonds as markers in both of them.
For the other oils (sea buckthorn, sesame, walnut, and hemp), the results are different, and they are preponderantly linked to their specific composition (carotenoids, traces of vitamin K, or amino acids) and the specificity of the employed investigations.
LDA applied for simultaneous classification of investigated oil samples, using both Raman spectra and fatty acids profile, offered very good results, being able to differentiate the varieties with very high precision. Moreover, a very strong and accurate model for oil classification was obtained using MLP-ANN. This approach, between Raman and GC-FID analytical techniques, combined with the supervised chemometric technique proved to be a suitable tool for identification of possible adulteration of oils.

Author Contributions

Conceptualization, F.-D.C. and D.A.M.; methodology, F.-D.C. and C.B.-G.; software, I.F.; investigation, F.-D.C. and C.B.-G.; resources, D.A.M.; data curation, I.F.; writing—original draft preparation, D.A.M.; writing—review and editing, F.D.C and I.F.; visualization, D.A.M.; supervision, F.-D.C., D.A.M., C.B.-G. and I.F.; project administration, F.-D.C.; funding acquisition, F.-D.C., D.A.M., C.B.-G. and I.F. All authors have read and agreed to the published version of the manuscript.

Funding

This research was funded by Executive Agency for Higher Education, Research, Development and Innovation Funding (UEFISCDI), Programmes: PNCDI III-Programme 2-2.1 PED 2019. Project number 354PED/23.10.2020 (Assessment of content and distribution of trans fatty acids in food products from Romanian market).and the APC was funded by the same project.

Conflicts of Interest

The authors declare no conflict of interest.

References

  1. Dahimi, O.; Sukri Hassan, M.; Abdul Rahim, A.; Abdulkarim, S.M.; Mashitoh, S. Differentiation of Lard from Other Edible Fats by Gas Chromatography-Flame Ionisation Detector (GC-FID) and Chemometrics. J. Food Pharm. Sci. 2014, 2, 27–31. [Google Scholar] [CrossRef]
  2. Cert, A.; Moreda, W.; Pérez Caminos, M.C. Chromatographic Analysis of Minor Constituents in Vegetable Oils. J. Chromatogr. A 2000, 881, 131–148. [Google Scholar] [CrossRef]
  3. O’Brien, R.D. Fats and Oils; Technomic: Lancaster, PA, USA, 1998; pp. 212–215. [Google Scholar]
  4. Giacomelli, L.M.; Mattea, M.; Ceballos, C.D. Analysis and Characterization of Edible Oils by Chemometric Methods. JAOCS 2006, 83, 303–308. [Google Scholar] [CrossRef]
  5. Nenadis, N.; Tsimidou, M.Z. Perspective of vibrational spectroscopy analytical methods in on-field/official control of olives and virgin olive oil. Eur. J. Lipid Sci. Technol. 2017, 119, 1600148. [Google Scholar] [CrossRef]
  6. Wang, P.; Sun, J.; Zhang, T.; Liu, W. Vibrational spectroscopic approaches for the quality evaluation and authentication of virgin olive oil. Appl. Spectrosc. Rev. 2016, 51, 763–790. [Google Scholar] [CrossRef]
  7. Rohman, A. Infrared spectroscopy for quantitative analysis and oil parameters of olive oil and virgin coconut oil: A review. Int. J. Food Prop. 2017, 20, 1447–1456. [Google Scholar] [CrossRef]
  8. Kwofie, F.; Lavine, B.K.; Ottaway, J.; Booksh, K. Differentiation of Edible Oils by Type Using Raman Spectroscopy and Pattern Recognition Methods. Appl. Spectrosc. 2019, 74, 645–654. [Google Scholar] [CrossRef] [PubMed]
  9. Berghian-Grosan, C.; Magdas, D.A. Raman spectroscopy and machine-learning for edible oils evaluation. Talanta 2020, 218, 121176. [Google Scholar] [CrossRef] [PubMed]
  10. Miller, J.N.; Miller, J.C. Statistics and Chemometrics for Analytical Chemistry, 6th ed.; Pearson Education Limited: Edinburgh, UK, 2010; pp. 221–251. [Google Scholar]
  11. Lewicki, P.; Hill, T. Statistics: Methods and Applications, a Comprehensive Reference for Science, Industry, and Data Mining, 1st ed.; StatSoft Inc.: Tulsa, OK, USA, 2006; pp. 349–365. [Google Scholar]
  12. Mateo, F.; Gadea, R.; Mateo, E.M.; Jiménez, M. Multilayer perceptron neural network and radial basis function accumulation of deoxynivalenol in barley seeds contaminated with Fusarium culmorun. Food Control 2011, 22, 88–95. [Google Scholar] [CrossRef]
  13. Muñiz-Valencia, R.; Jurado, J.M.; Ceballos-Magaña, S.G.; Alcázar, A. Characterization of Mexican coffee according to mineral contents by means of multilayer perceptron artificial networks. J. Food Compos. Anal. 2014, 34, 7–11. [Google Scholar] [CrossRef]
  14. Rodríguez-Bermudez, R.; López-Alonso, M.; Miranda, M.; Fouz, R.; Orjalez, I. Chemometric authentication of the organic status of milk on the basis of trace element. Food Chem. 2018, 240, 686–693. [Google Scholar] [CrossRef] [PubMed]
  15. Baeten, V.; Hourant, P.; Morales, M.T.; Aparicio, R. Oil and Fat Classification by FT-Raman Spectroscopy. J. Agric. Food Chem. 1998, 46, 2638–2646. [Google Scholar] [CrossRef]
  16. Merlin, J.C. Resonance Raman spectroscopy of carotenoids and carotenoid-containing systems. Pure Appl. Chem. 1985, 57, 785–792. [Google Scholar] [CrossRef]
  17. Socrates, G. Infrared and Raman Characteristic Group Frequencies. Tables and Charts, 3rd ed.; John Wiley & Sons, Ltd.: Chichester, UK, 2001. [Google Scholar]
  18. Jimenez-Sanchidrian, C.; Ruiz, J.R. Use of Raman spectroscopy for analyzing edible vegetable oils. Appl. Spectrosc. Rev. 2016, 51, 417–430. [Google Scholar] [CrossRef]
  19. Choi, S.-M.; Yuen, S.-N.; Phillips, D.L.; Ma, C.-Y. Applications of Vibrational Spectroscopy to the Analysis of Polysaccharide and Hydrocolloid Ingredients. In Handbook of Vibrational Spectroscopy—Applications in Life, Pharmaceutical and Natural Sciences Food Science; Griffiths, P., Chalmers, J.M., Eds.; John Wiley & Sons, Ltd.: Chichester, UK, 2010. [Google Scholar] [CrossRef]
  20. Callaway, J.C. Hempseed as a nutritional resource: An overview. Euphytica Neth. J. Plant. Breed. 2004, 140, 65–72. [Google Scholar] [CrossRef]
  21. Baranska, M.; Schulz, H.; Strehle, M.; Popp, J. Applications of Vibrational Spectroscopy to Oilseeds Analysis. In Handbook of Vibrational Spectroscopy—Applications in Life, Pharmaceutical and Natural Sciences Food Science; Griffiths, P., Chalmers, J.M., Eds.; John Wiley & Sons, Ltd.: Chichester, UK, 2010. [Google Scholar] [CrossRef]
  22. Czamara, K.; Majzner, K.; Pacia, M.Z.; Kochan, K.; Kaczora, A.; Baranska, M. Raman spectroscopy of lipids: A review. J. Raman Spectrosc. 2015, 46, 4–20. [Google Scholar] [CrossRef]
  23. Foster, R.; Williamson, C.S.; Lunn, J. Culinary oils and their health effects. Nutr. Bull. 2009, 34, 4–47. [Google Scholar] [CrossRef]
Figure 1. GC-FID chromatogram of oil samples with peak label. Peak label: C14:0—myristic acid; C16:0—palmitic acid; C16:1—palmitoleic acid; C18:0—stearic acid; C18:1n9c—oleic acid; C18:2n6c—linoleic acid; C18:3n3—α-linolenic acid; C20:0—arachidic acid.
Applsci 10 08347 g001
Figure 2. Composition of total saturated, monounsaturated, and polyunsaturated fatty acids from the oil samples which was determined by GC-FID and percentage distribution of fatty acids (a) sunflower; (b) sesame; (c) hemp; (d) walnut; (e) linseed; (f) sea buckthorn.
Applsci 10 08347 g002aApplsci 10 08347 g002bApplsci 10 08347 g002cApplsci 10 08347 g002dApplsci 10 08347 g002eApplsci 10 08347 g002f
Figure 3. Raman spectra for the six types of oils with the main marker bands employed for the simultaneous classifications.
Applsci 10 08347 g003
Figure 4. Classification of oil samples, based on fatty acid content.
Applsci 10 08347 g004
Figure 5. Box plot of pseudo probabilities obtained using a multilayer perceptron-artificial neural network (MLP-ANN) for the model that predicts oil variety.
Applsci 10 08347 g005
Figure 6. Gain and lift charts obtained from MLP-ANN modeling of oil samples.
Applsci 10 08347 g006
Figure 7. Independent variables importance chart obtained for oil sample prediction.
Applsci 10 08347 g007
Table 1. Composition of fatty acids (%) grouped by degree of saturation in oil samples.
Type of OilSaturated
Fatty Acids
Monounsaturated
Fatty Acids
Polyunsaturated
Fatty Acids
Concentration (%)
min.max.Averagemin.max.Averagemin.max.Average
Sunflower10.2912.7111.2023.5832.1726.1057.3166.1362.71
Sesame16.2116.7916.6439.9442.3441.0840.8743.8542.28
Hemp10.9811.3511.1613.4415.8214.5572.8375.5874.29
Walnut9.9110.3310.0816.9026.1619.7063.9372.9770.22
Linseed9.5412.6911.4017.8428.2822.3460.0272.6266.27
Sea buckthorn40.6142.541.5549.5850.0049.799.397.928.65
Table 2. Oil sample classification obtained after BP-ANN.
SamplesObservedPredicted
SunflowerRest of the SamplesPercent Correct
TrainingSunflower20100.0%
Rest of the samples017100.0%
Overall Percent10.5%89.5%100.0%
TestingSunflower1150.0%
Rest of the samples02100.0%
Overall Percent25.0%75.0%75.0%
Publisher’s Note: MDPI stays neutral with regard to jurisdictional claims in published maps and institutional affiliations.

