Article

Spatiotemporal Changes in and Driving Factors of Potential Evapotranspiration in a Hyper-Arid Locale in the Hami Region, China

1
Key Laboratory of Ecological Safety and Sustainable Development in Arid Lands, Xinjiang Institute of Ecology and Geography, Chinese Academy of Sciences, Urumqi 830011, China
2
State Key Laboratory of Desert and Oasis Ecology, Xinjiang Institute of Ecology and Geography, Chinese Academy of Sciences, Urumqi 830011, China
3
College of Resources and Environment, University of Chinese Academy of Sciences, Beijing 100049, China
4
Faculty of Earth Sciences, University of Silesia in Katowice, 41-200 Sosnowiec, Poland
*
Author to whom correspondence should be addressed.
Atmosphere 2024, 15(1), 136; https://doi.org/10.3390/atmos15010136
Submission received: 12 December 2023 / Revised: 15 January 2024 / Accepted: 17 January 2024 / Published: 22 January 2024
(This article belongs to the Section Biosphere/Hydrosphere/Land–Atmosphere Interactions)

Abstract

:
Potential evapotranspiration (PET) is a crucial variable for implementing adaptation measures to mitigate the potential impacts of climate change on water resources. In the context of global warming, PET is essential for predicting water resource supply and demand, guiding irrigation and water management decisions. However, there is limited understanding of the spatiotemporal changes in PET and its driving factors in the hyper-arid regions of Northwest China. In this study, the Hargreaves model was employed to estimate PET in the Hami region from 1991 to 2020. By combining relevant climate data and partial correlation analysis, we investigated the spatiotemporal distribution patterns of PET within the study area and analyzed the factors influencing these patterns. The results showed the following: (1) From 1991 to 2020, the overall PET in the Hami region demonstrated a tendency to rise. The interannual trend rates of PET for the full year, spring, summer, autumn, and winter were 0.933, 2.744, 0.906, 0.488, and −0.406 mm·a-1, respectively. Despite a decreasing trend in winter PET, the other seasonal PET values and the annual PET values exhibited an increasing trend. (2) The spatial distribution of both annual and seasonal PET showed significant regional heterogeneity, following a consistent pattern marked by lower values in the central part and higher values in the surrounding areas. The southern region tended to have relatively high PET, while the northwestern region experienced comparatively low PET. (3) Partial correlation analysis indicated significant differences in the impact of various climatic factors on PET. The maximum temperature emerged as the dominant factor influencing annual PET variation, while precipitation played a leading role in influencing autumn PET variation. This study underscores the influence of climate change on PET in the Hami region, contributing to an enhanced comprehension of PET variations.

1. Introduction

Evapotranspiration (ET) is a physical process intricately linked to the atmosphere, vegetation, soil, and human activities, directly shaping surface water cycling and energy balance and profoundly influencing water availability [1,2]. It plays a crucial role in the estimation and management of agricultural water demand [3]. Potential evapotranspiration (PET) represents the highest potential amount of water loss through evapotranspiration, serving as a crucial element in regional and global Earth system dynamics [4,5]. PET not only serves as the basis for calculating actual evapotranspiration but also constitutes an indispensable input for several important conceptual models. These include the Palmer Drought Severity Index (PDSI) [6], the aridity index (AI) [7] and hydrological models [8,9]. Therefore, gaining a comprehensive understanding of the dynamic processes of potential evapotranspiration (PET) and its influencing factors against the backdrop of climate change is of paramount significance. Such insights contribute to advancing regional and global hydrological and ecological research in addition to fostering sustainable societal development.
The application fields of PET are diverse, and there are various calculation models available. Examples include the Penman-Monteith (PM) model [10], which has been made accessible by the Food and Agriculture Organization of the United Nations (FAO); the Hargreaves model [11]; and the Priestley-Taylor model [12], among others. The numerous calculation models for PET indicate that there are numerous influencing factors, and the causes of variations are highly complex [13,14]. In addition to meteorological driving factors such as wind speed, temperature, vapor pressure deficit, and solar radiation, the structural, compositional, and distributional changes in plant communities also play a crucial role in the evolution of PET [15,16]. Currently, research on the impact of vegetation on PET is relatively limited [17]. Most studies have focused predominantly on the influence of climate change on PET [18,19,20]. However, there are significant variations in the factors influencing PET changes across different regions. Some studies suggest that a decrease in solar radiation is the reason for reduced PET in China and the United States [21,22]. On the other hand, research on the northeastern part of India [23], the Canadian prairies [24], and large parts of Australia [25] indicates that changes in wind speed are the factors contributing to PET reduction. The spatiotemporal heterogeneity of climate change is the fundamental reason for the diverse outcomes observed. Therefore, further in-depth research is needed to understand the regional variations in PET and its controlling factors.
The Hami region is situated in the eastern part of Xinjiang, China, and represents a typical arid area characterized by a dry climate and limited water resources. Agriculture, water resource management, and ecological balance face unique challenges in this region. In recent years, with the increasingly significant impact of climate change, the hydrological processes and dynamic changes in ecosystems in the Hami region have garnered widespread attention. A thorough understanding of the interactions among hydrological cycles, vegetation dynamics, and climate change in this region would contribute to filling knowledge gaps in water resource management and climate adaptation in arid areas. This knowledge forms the scientific groundwork for the region’s sustainable development.
The study of PET in the Hami region holds profound significance. PET, as a crucial parameter in the water cycle, plays a vital role in the scientific understanding of the distribution of water resources, supply–demand relationships, and the stability of hydroecosystems in the research area. By conducting in-depth research on PET, it becomes possible to more accurately predict the availability of water resources and formulate effective water resource management strategies [26]. In addition, in terms of agricultural production, PET is directly related to the water needs of plants. By gaining a deeper understanding of PET, we can optimize irrigation plans, improve the efficiency of water resource utilization, and thereby achieve sustainable development of agriculture in arid regions.

2. Study Area and Research Methods
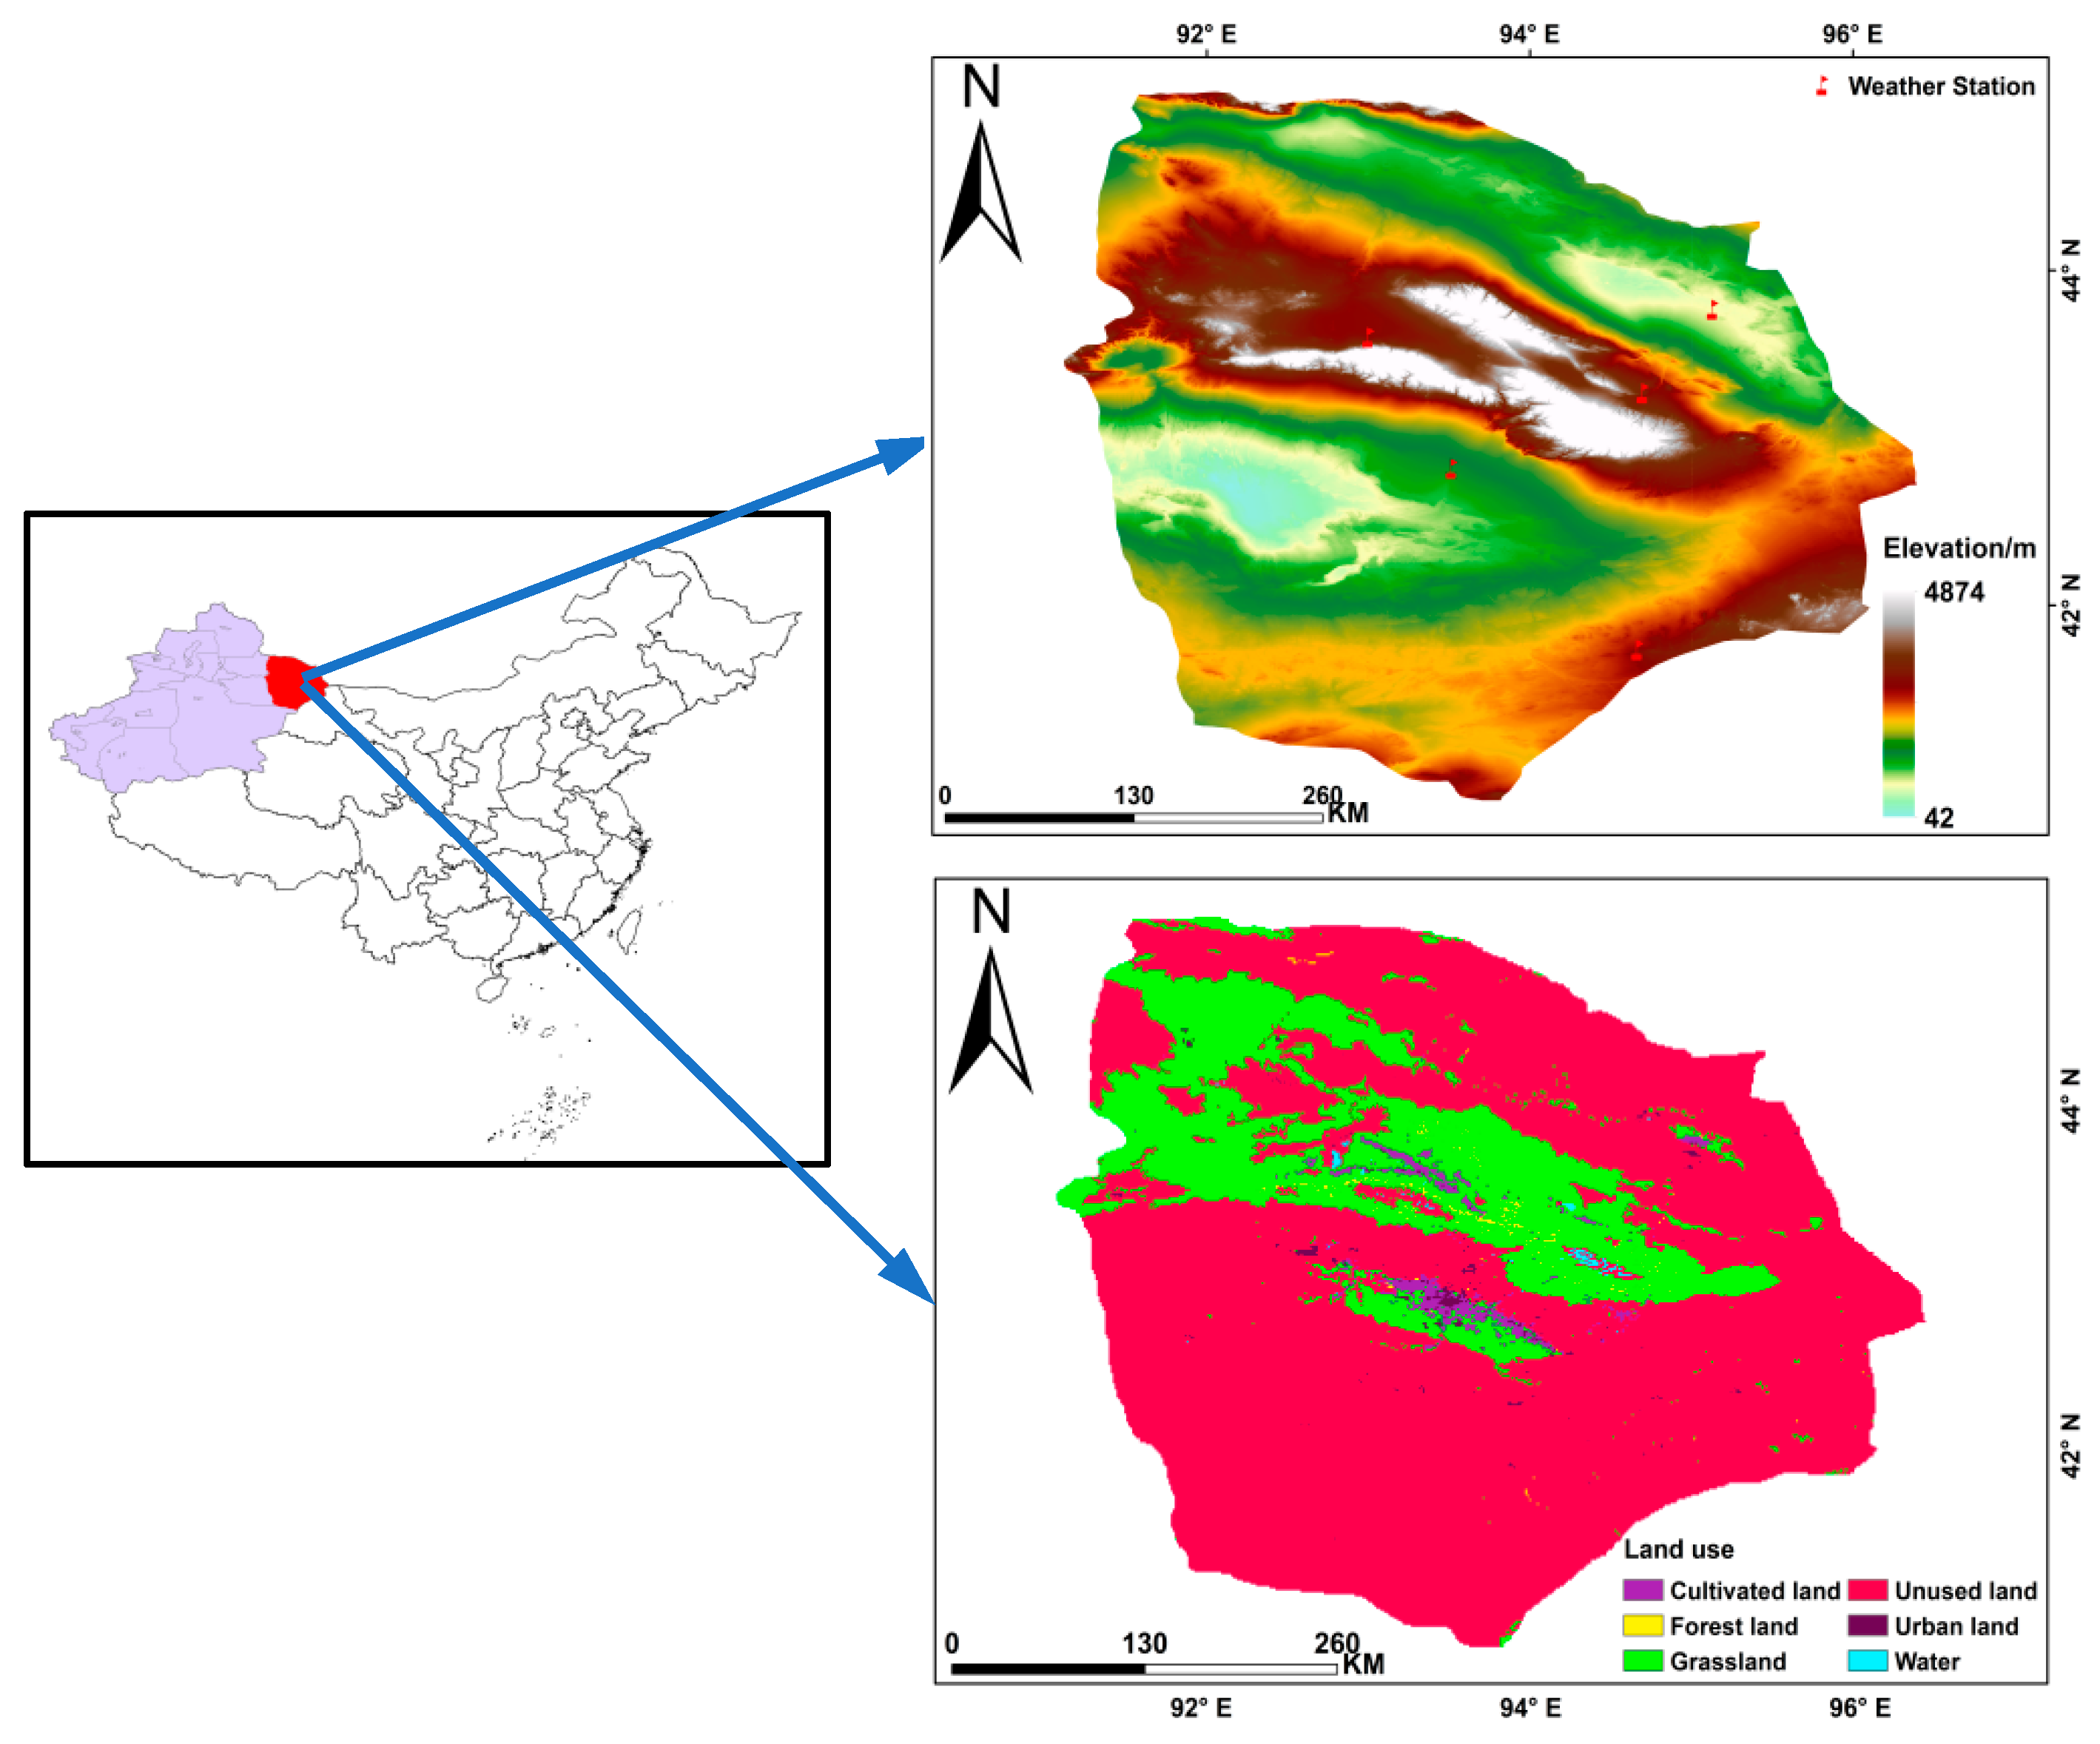
2.1. Study Area

Hami is located in the eastern part of the Xinjiang Uygur Autonomous Region, China (40°49′ N, 93°31′ E). Its geographical location exposes it to the influences of the Central Asian continental climate and topography (Figure 1). The climate in the Hami region is a dry continental climate, characterized by hot, dry summers and cold, dry winters. The annual average temperature is relatively high, but there is significant diurnal temperature variation. These climatic conditions have a significant impact on local ecology and agriculture. Due to the dry climate and geographical location, precipitation is relatively scarce in the Hami region, and surface water sources are limited. This has led to a high degree of dependence on groundwater for irrigation and domestic water needs. However, groundwater resources are also facing challenges of overextraction and depletion. Due to the unique climate in the Hami region, PET is a crucial meteorological indicator. The average PET during spring, summer, and autumn significantly influences vegetation growth and water management under the arid climate conditions of Hami. Detailed research on this aspect is crucial for effective water resource management and agricultural planning.

2.2. Data Sources

The spatial resolution of precipitation (MAP), average temperature (MAT), maximum temperature (Max-T), and minimum temperature (Min-T) in these datasets was 1 km. The data were generated through spatial downscaling based on the global 0.5° climate dataset released by CRU and the high-resolution global climate dataset released by WorldClim 1.4. The dataset was verified by the publisher using data from 496 weather stations, and the validation results were credible (https://data.tpdc.ac.cn/, accessed on 4 November 2023). The data used in this study ranged from 1991 to 2020. The data for the meteorological station included wind speed (WS), vapor pressure deficit (VPD), sunshine duration (SH), and relative humidity (RH); the details of the data are provided in Table 1. The annual data statistics followed the calendar-year algorithm, summing the values for each month from January to December. Seasonal data were calculated based on the following divisions: March, April, and May constitute spring (SP); June, July, and August constitute summer (SU); September, October, and November constitute autumn (AU); and December to the following February constitute winter (WI).

2.3. Research Methods

2.3.1. Hargreaves Model

In the study area, the major land-use type (other than unused land) is grassland; accordingly, the Hargreaves model was used to estimate the process of PET under monthly meteorological conditions. The specific expression of the formula is as follows:
P E T = 0.0023 × T M a x T M i n × ( T M e a n + 17.8 ) × S 0
In this formula, PET represents potential evapotranspiration (mm/month); TMax, TMin, and TMean correspond to the monthly maximum temperature, minimum temperature, and mean temperature, respectively; and S0 is the theoretical amount of solar radiation reaching the top of the Earth’s atmosphere.
The calculation of S0 is typically based on parameters such as the solar constant, Earth–Sun distance, Julian day, and solar declination. The formula is as follows:
S 0 = 24 × 60 π × G s × 1 + 0.033 × cos ( 2 π ( n 3 ) 365 ) π × d 2
In this formula, Gs represents the solar constant, indicating the intensity of solar radiation outside the Earth’s atmosphere, approximately 1367 w/m2; n is the Julian day of the year (1 for 1 January, 365 for 31 December); and d is the Earth–Sun distance, which is the average distance between the Earth and the Sun.

2.3.2. Kriging Interpolation Method

This study employed the Kriging interpolation method to interpolate data for WS, VPD, SH, and RH. The principle of Kriging interpolation involves obtaining the predicted values for specific location points through a specific interpolation calculation formula [27]. The calculation formula is as follows:
Z ( x 0 ) = i = 1 n a i z ( x i )
i = 1 n a i = 1
In Equations (3) and (4), Z ( x 0 ) is the predicted value of x 0 ; z ( x i ) is the measured value of x i ; and a i is the weight coefficient of the measured value on the predicted value.

2.3.3. Analysis Methods

Partial correlation analysis is a method used to assess the correlation between two variables while controlling for the influence of a third variable that is concurrently correlated with both, allowing for a more focused examination of the relationship between the two primary variables. The R value of the correlation coefficient is a decisive factor; a larger R value indicates a stronger correlation between variables, while a lower R value indicates a weaker correlation.
R i j , k = r i j r i k r j k ( 1 r i k 2 ) ( 1 r j k 2 )
where rij represents the correlation coefficient for a basic correlation between ri and rj, rik represents the correlation coefficient for a basic correlation between ri and rk, and rjk represents the correlation coefficient for a basic correlation between rj and rk.
The null hypothesis for the partial correlation coefficient test is that the overall partial correlation coefficient between two variables is 0. In the study of PET, partial correlation analysis plays a crucial role. Partial correlation analysis allows researchers to more accurately assess the true relationship between PET and two variables by considering the influence of other factors; this helps eliminate the interference of external factors, enabling researchers to gain a more precise understanding of the pure correlation between PET and a specific meteorological factor. The t-test method uses the following formula:
T = R i j , k ( 1 r i j , k 2 ) ( n m 1 )
In the formula, Rij,k represents the partial correlation coefficient, n is the number of samples, m is the number of independent variables, and (n − m − 1) is the number of degrees of freedom. When (T < 0.05 (n − k − 2)) or (p < 0.05), the null hypothesis is rejected.
The trends in the variations of each factor are analyzed through linear regression, with each factor as the dependent variable and years as the independent variable. The analysis was used to examine the temporal trends of each factor over the study period.

3. Results and Analysis

3.1. Temporal and Spatial Dynamic Changes in PET

3.1.1. Analysis of Annual Interannual Variation Characteristics in PET

The annual and seasonal PET variations in the Hami region from 1991 to 2020 are depicted in Figure 2. The trend rate of annual PET in Hami was 0.933 mm·a-1 (Figure 2e), indicating an overall increasing trend against the backdrop of global warming. Before 2010, there was significant fluctuation; however, after 2010, the fluctuation amplitude decreased. From a seasonal perspective, the annual trend rates of PET for SP, SU, AU, and WI were 2.744, 0.906, 0.488, and −0.406 mm·a-1, respectively (Figure 2a–d). This indicated that, except for WI, in which PET showed a declining pattern, all seasons exhibited an increasing trend. Among them, SP showed the most significant increase in PET. Additionally, there was a noticeable fluctuation trend in PET for each season, with SU and AU showing a similar annual fluctuation pattern.

3.1.2. Analysis of Spatial Variations in PET

The regional distribution of annual PET in the Hami region from 1991 to 2020 is illustrated in Figure 3. The figure encompasses data for six periods, namely, 1991, 1996, 2001, 2007, 2013, and 2020, depicting the variations in PET over these years. Throughout the entire study period, the annual PET in the Hami region ranged from 113 to 1111 mm, with a multiyear average of 871.54 mm. The spatial distribution characteristics remained relatively consistent. As can be observed from Figure 3a–f, PET exhibited significant regional variations, forming a distribution pattern with lower values in the central part and higher values in the surrounding areas. The southern region, in particular, had the highest PET values, while the northwestern region had relatively lower values.
The regional distribution of PET in the Hami region for each season from 1991 to 2020 is illustrated in Figure 4. The figure includes data for the SP, SU, AU, and WI seasons for the years 1991, 2005, and 2020, depicting the variations in PET over these three periods. Throughout the entire study period, the spatial distribution of PET for each season remained essentially consistent with the annual PET pattern. From Figure 4a–l, it can be observed that the average PET varied significantly among different seasons. In SP, PET ranged from 47 to 1436 mm, with an average of 1052.31 mm calculated over multiple years. For SU, the range was from 309 to 2116 mm, with an average of 1702.61 mm calculated over multiple years. AU exhibited a PET range of 77 to 817 mm, with an of 589.82 mm average calculated over multiple years. WI showed a PET range of 0 to 261 mm, with an average of 141.93 mm calculated over multiple years. These values represent 30.17%, 48.84%, 16.92%, and 4.07% of the annual PET, respectively. Throughout the year, the PET followed the order of SU > SP > AU > WI. This trend is consistent with higher values observed in regions characterized by deserts, barren lands, and bare surfaces compared to areas with natural grasslands and orchards.

3.2. Drivers of Spatiotemporal Changes in PET

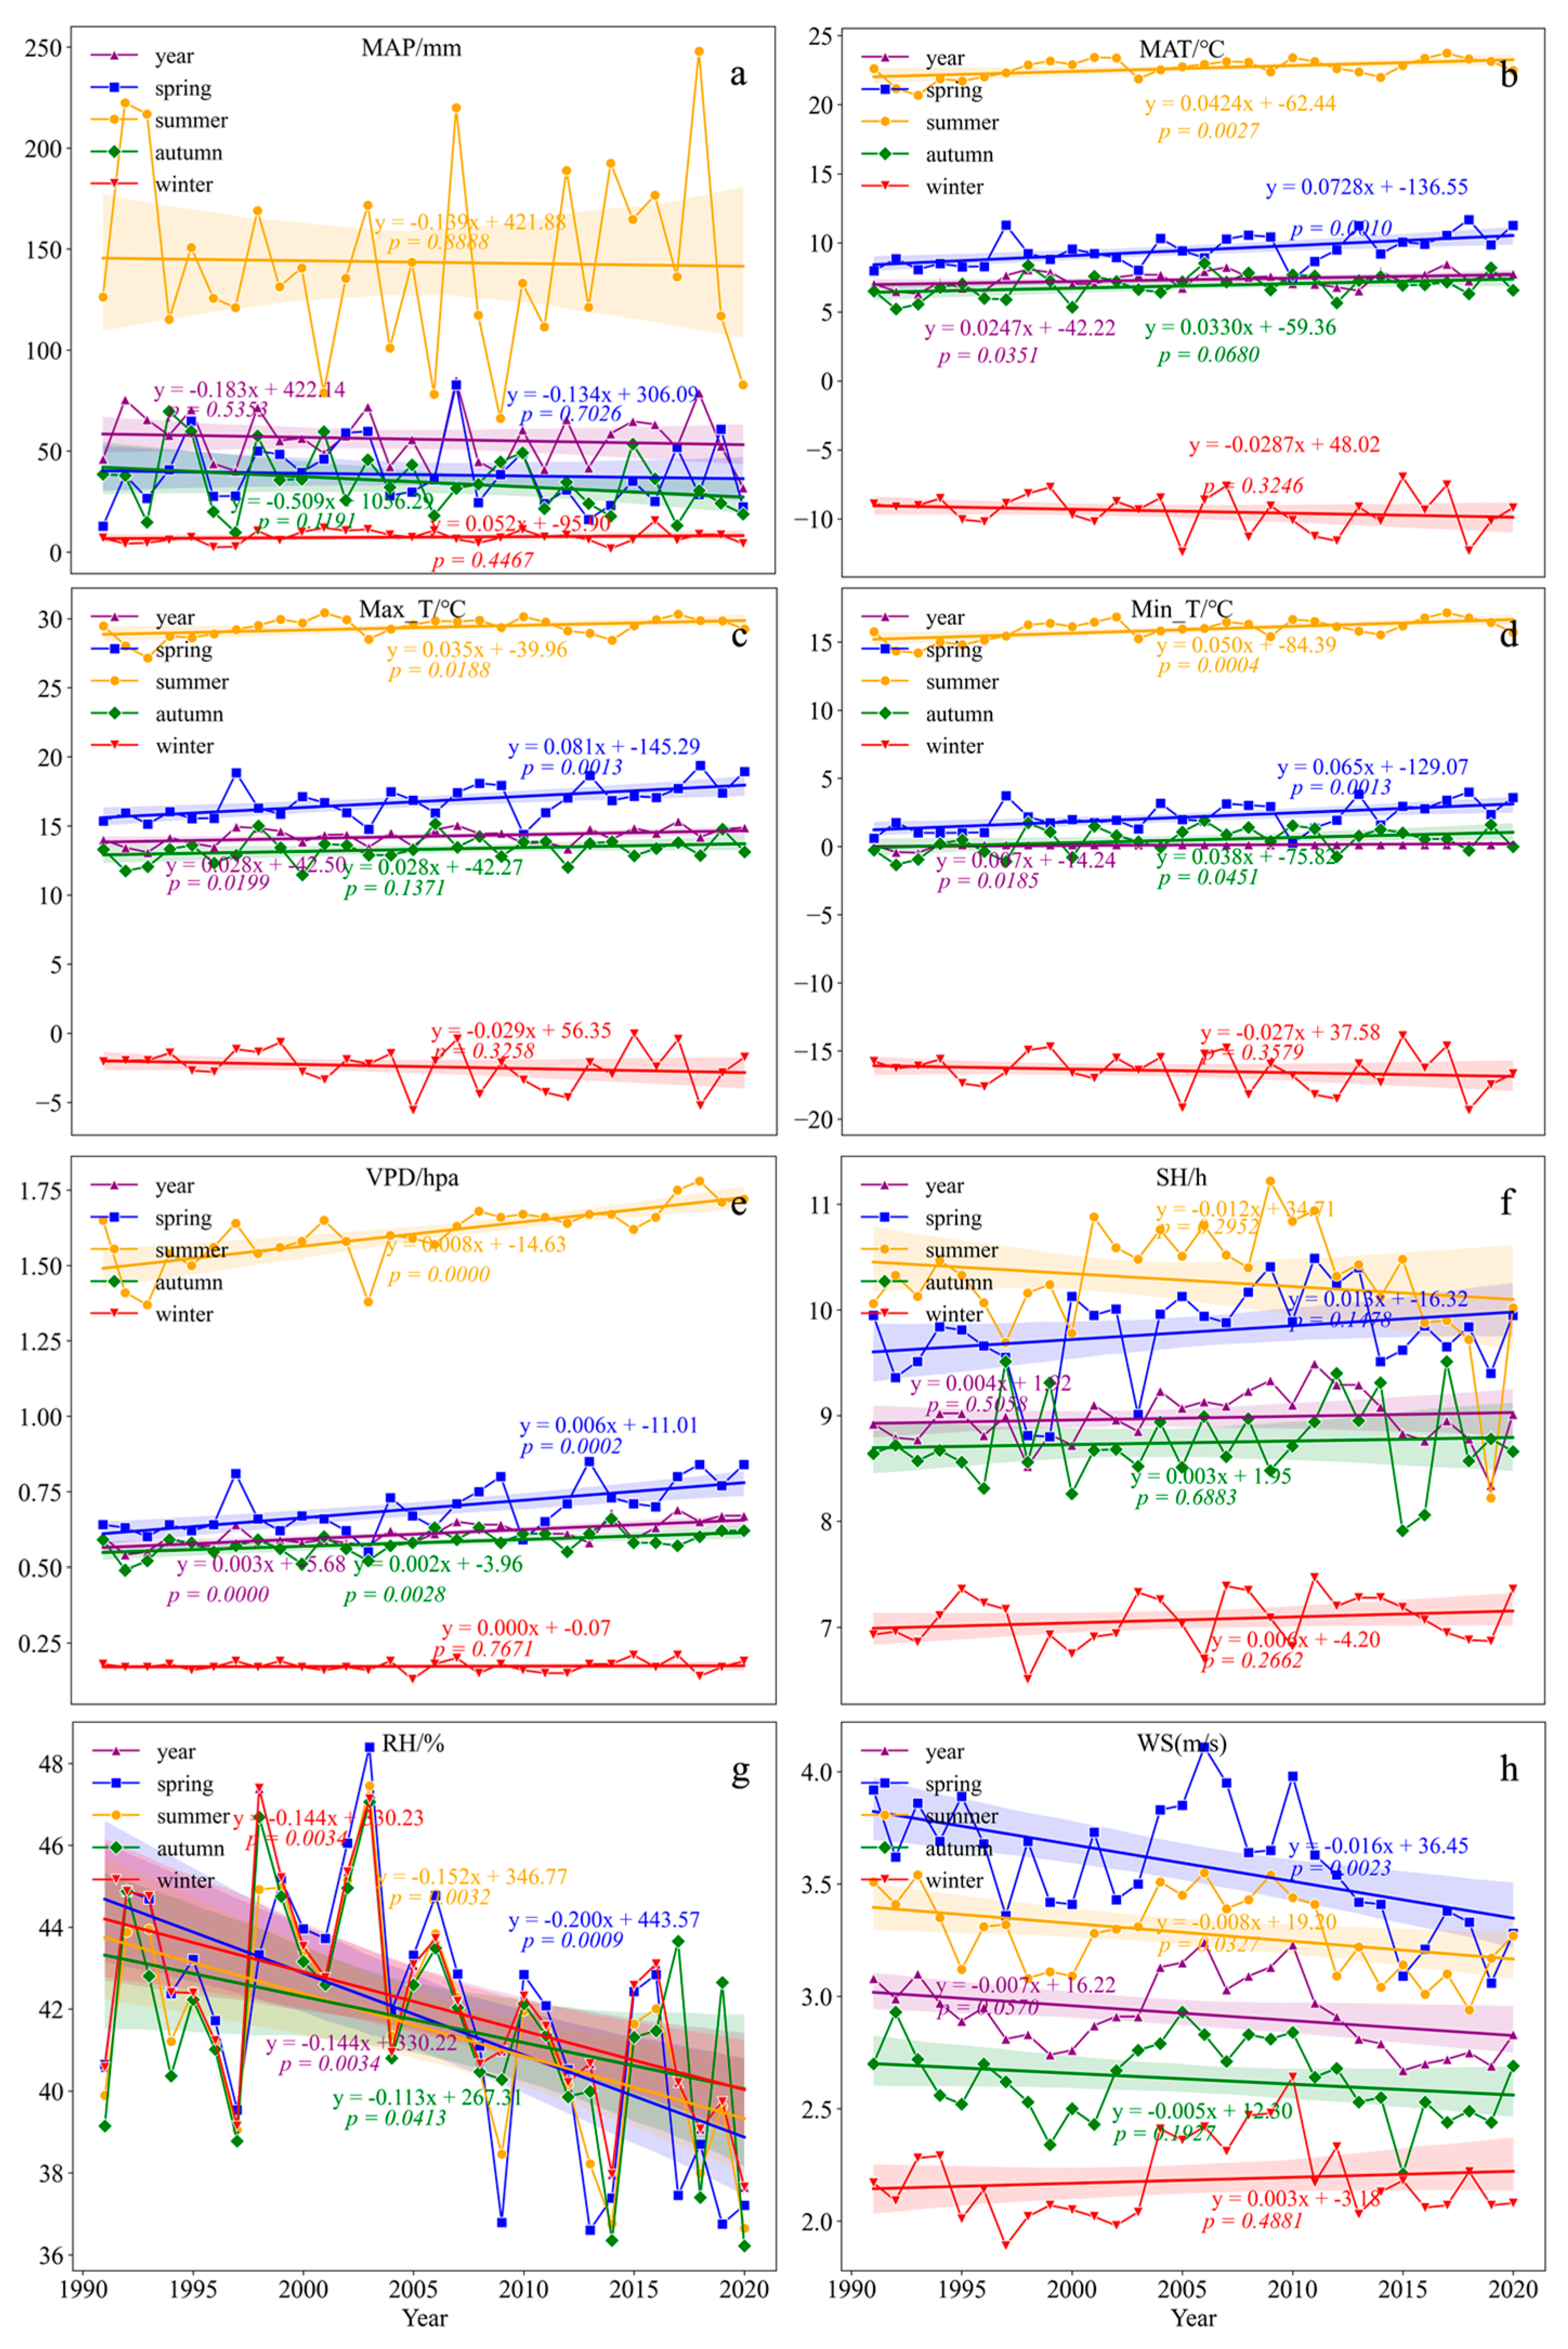
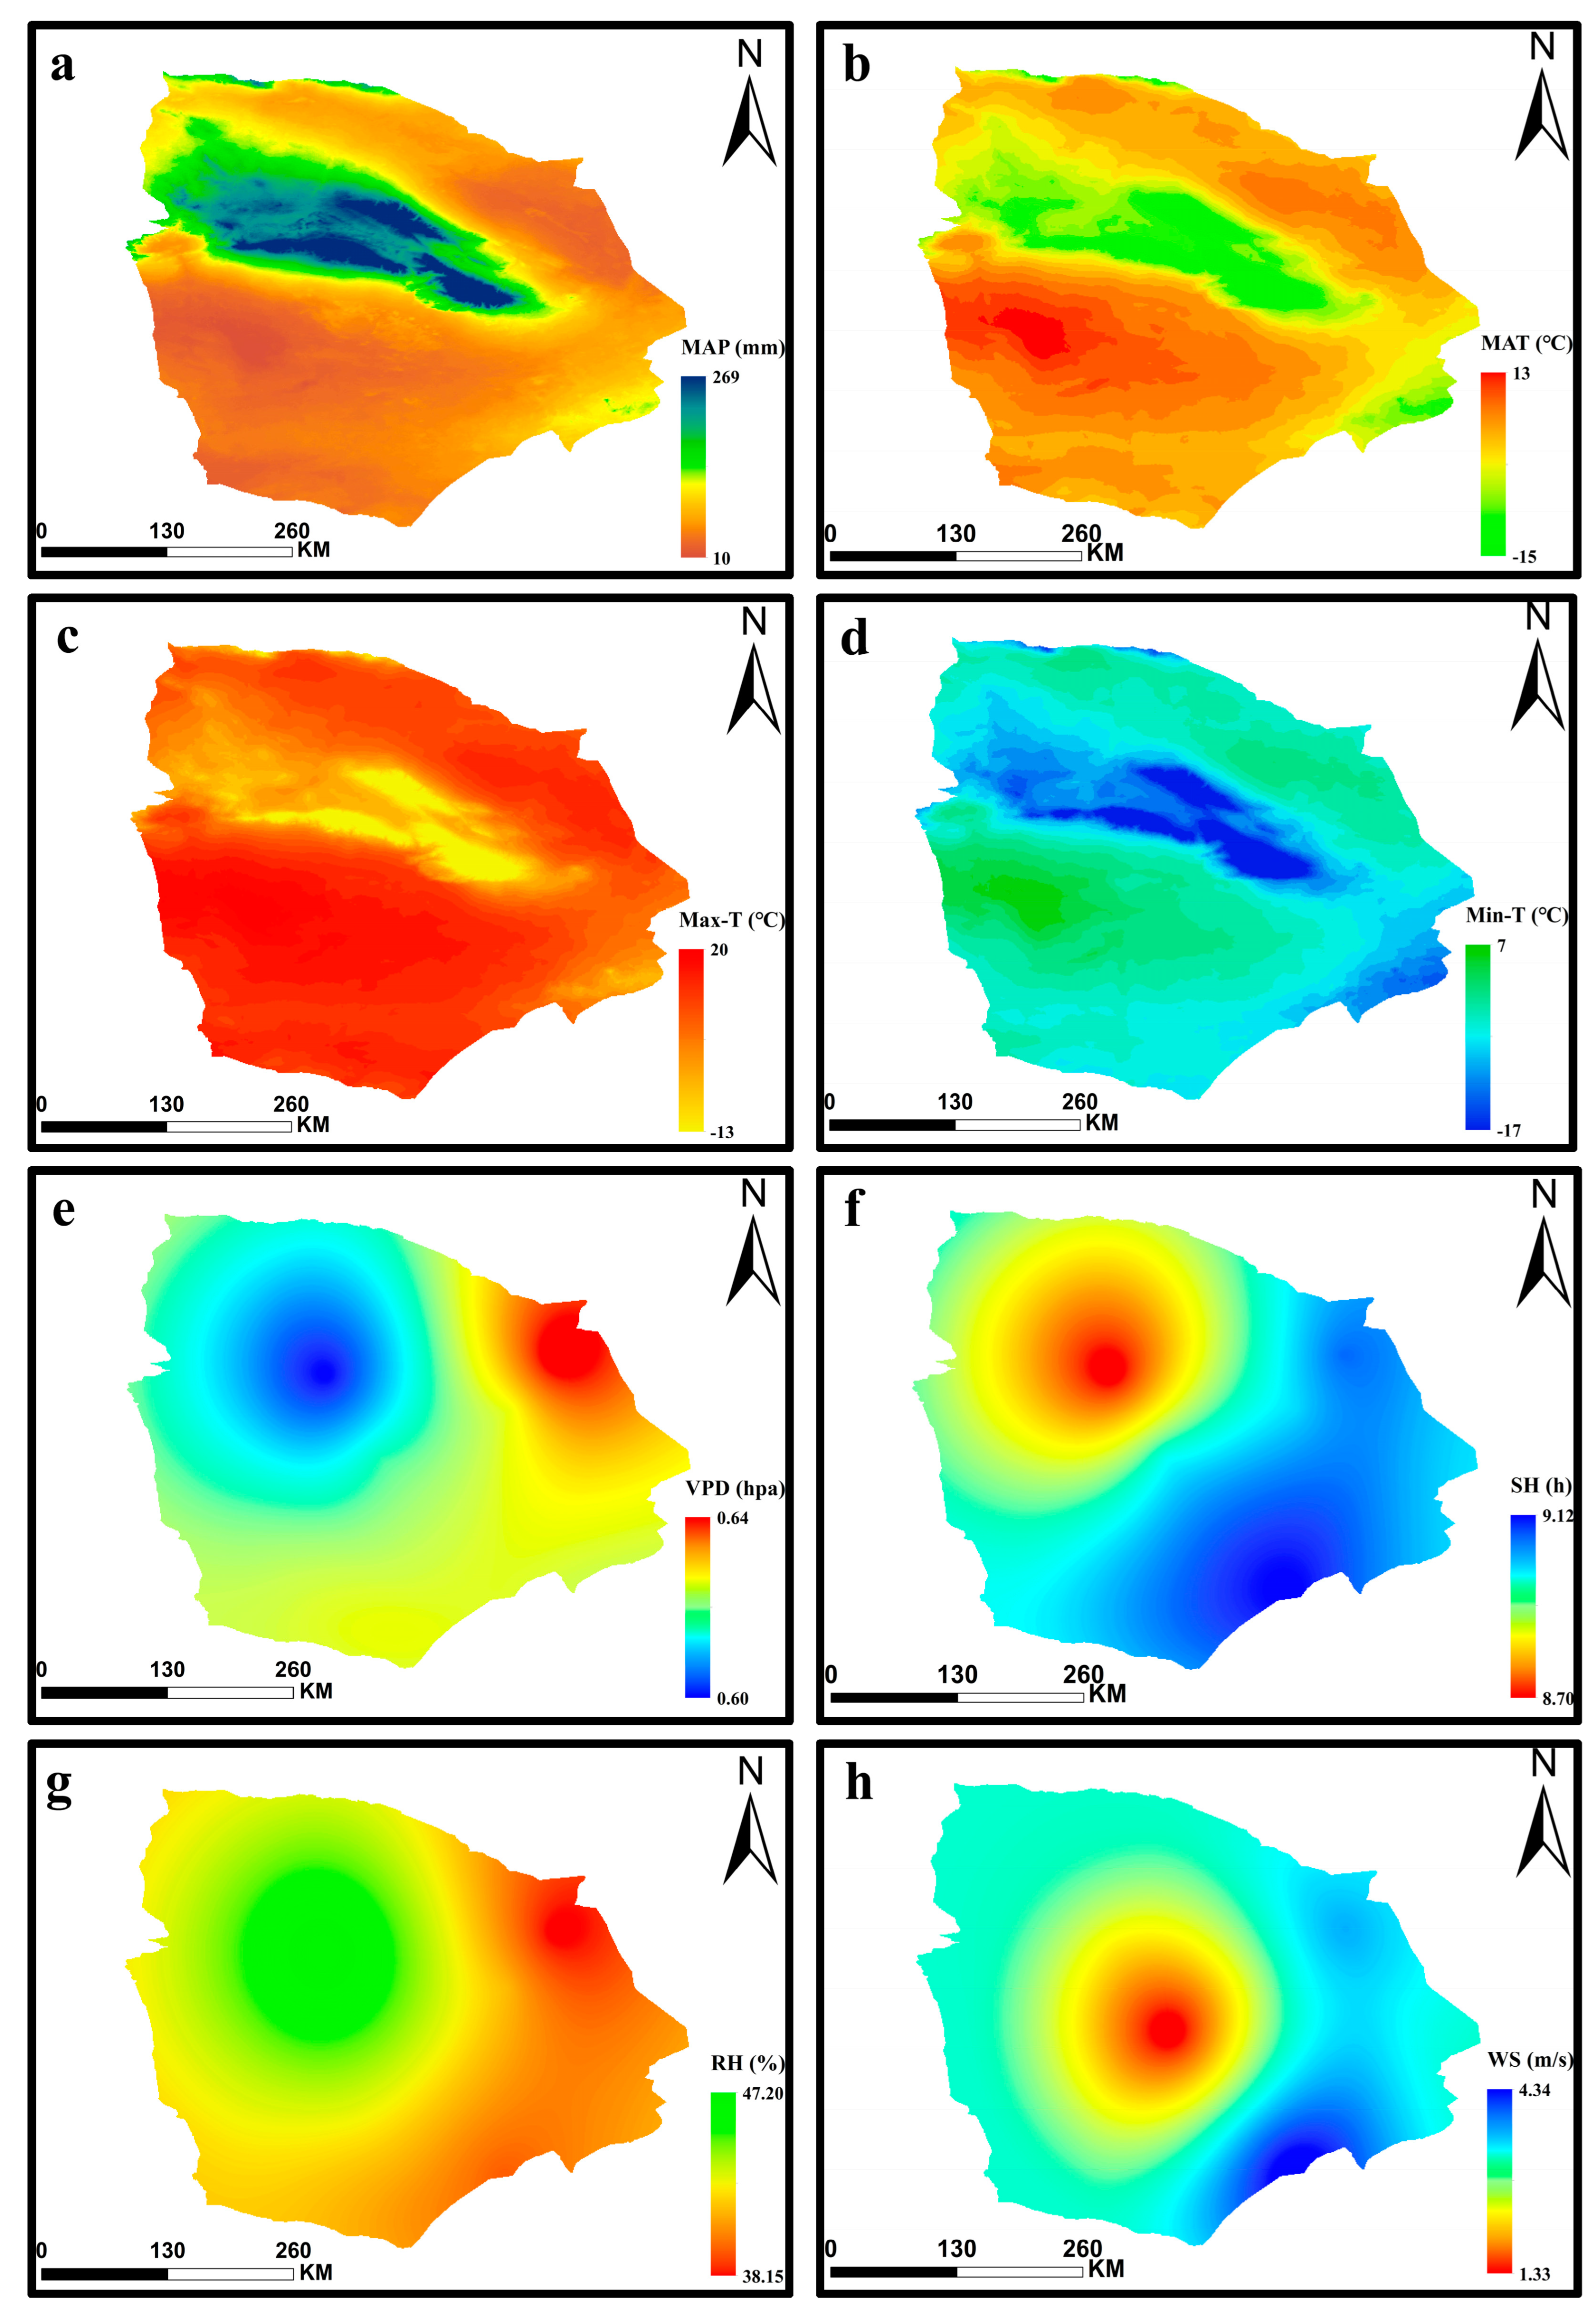
3.2.1. Spatiotemporal Distribution Characteristics of Environmental Factors in the Hami Region

The temporal and spatial dynamics of various environmental factors in the Hami region from 1991 to 2020 are illustrated in Figure 5 and Figure 6. The multiyear average MAP was 55.79 mm, with a trend rate of −0.18 mm·a-1 (Figure 5a), indicating an overall decreasing trend in MAP in the Hami region. The multiyear average MAP values for SP, SU, AU, and WI were 38.26, 143.46, 34.58, and 7.40 mm, respectively. The trend rates for these seasons were −0.13, −0.14, −0.51, and 0.05 mm·a-1, indicating a decreasing trend in all seasons except for WI, in which MAP showed an increasing trend. The most significant decrease was observed in AU. The spatial distribution of MAP in the Hami region exhibited an inverse pattern compared to that of PET, showing a high value in the central area and lower values in the surrounding regions (Figure 6a). The multiyear average MAT, Max-T, and Min-T were 7.33, 14.24, and 0.10 °C, respectively. The trend rates for each of these variables were 0.02, 0.03, and 0.01 °C·a-1 (Figure 5b–d), indicating an overall increasing trend in temperatures in the Hami region. The MAT, Max-T, and Min-T exhibited similar trends across all seasons. In SP, SU, and AU, there was an increasing trend with similar trend rates, while in WI, there was a decreasing trend with a consistent trend rate of −0.03 °C·a-1. The spatial distributions of MAT, Max-T, and Min-T were similar to that of PET, demonstrating a tendency toward lower values in the central area and higher values in the surrounding regions (Figure 6b–d).
The multiyear average VPD in the study area was 0.61 hpa, with a trend rate of 0.003 hpa·a-1 (Figure 5e). This indicates an overall increasing trend in VPD in the study area. The trend rates for VPD in SP, SU, AU, and WI were 0.006, 0.008, 0.002, and 0.000 hpa·a-1, respectively. This suggests that the VPD during WI showed the smallest change over the time series, while the other seasons exhibited an increasing trend, with the most significant increase observed in SU. The spatial distribution was characterized by relatively high VPD in the northeastern region and relatively low values in the northwestern region (Figure 6e). The multiyear average SH in the study area was 8.98 h, with a trend rate of 0.004 h·a-1 (Figure 5f). This indicates an overall increasing trend in SH in the study area. The trend rates for SH in SP, SU, AN, and WI were 0.013, −0.012, 0.003, and 0.006 h·a-1, respectively. This suggests that only the SH in SU showed a decline over time, while the other seasons exhibited an increasing trend, with the most significant increase observed in SP. The overall spatial distribution shows a gradual decrease in SH from southeast to northwest (Figure 6f). The multiyear average RH in the study area was 42.11%, with a trend rate of −0.144%·a-1 (Figure 5g). This indicates an overall trend of drying in the study area. The trend rates for RH in SP, SU, AU, and WI were −0.20, −0.152, −0.113, and −0.114%·a-1, respectively. This suggests a decreasing trend in RH for each season, with the most significant decrease observed in SP. The spatial distribution showed a gradual increase in RH from southeast to northwest (Figure 6g). The multiyear average WS in the study area was 2.92 m·s-1, with a trend rate of −0.007 m·s-1·a-1 (Figure 5h). This indicates an overall decreasing trend in WS in the study area. The trend rates for WS in SP, SU, AU, and WI were −0.016, −0.008, −0.005, and 0.003 m·s-1·a-1, respectively. This suggests that only the average WS in WI was increasing, while the WS in other seasons was decreasing, with the most significant decrease observed in SP. The spatial distribution reveals a pattern of lower WS in the central area and higher WS in the surrounding regions, with the southeastern area experiencing the highest WS (Figure 6h).

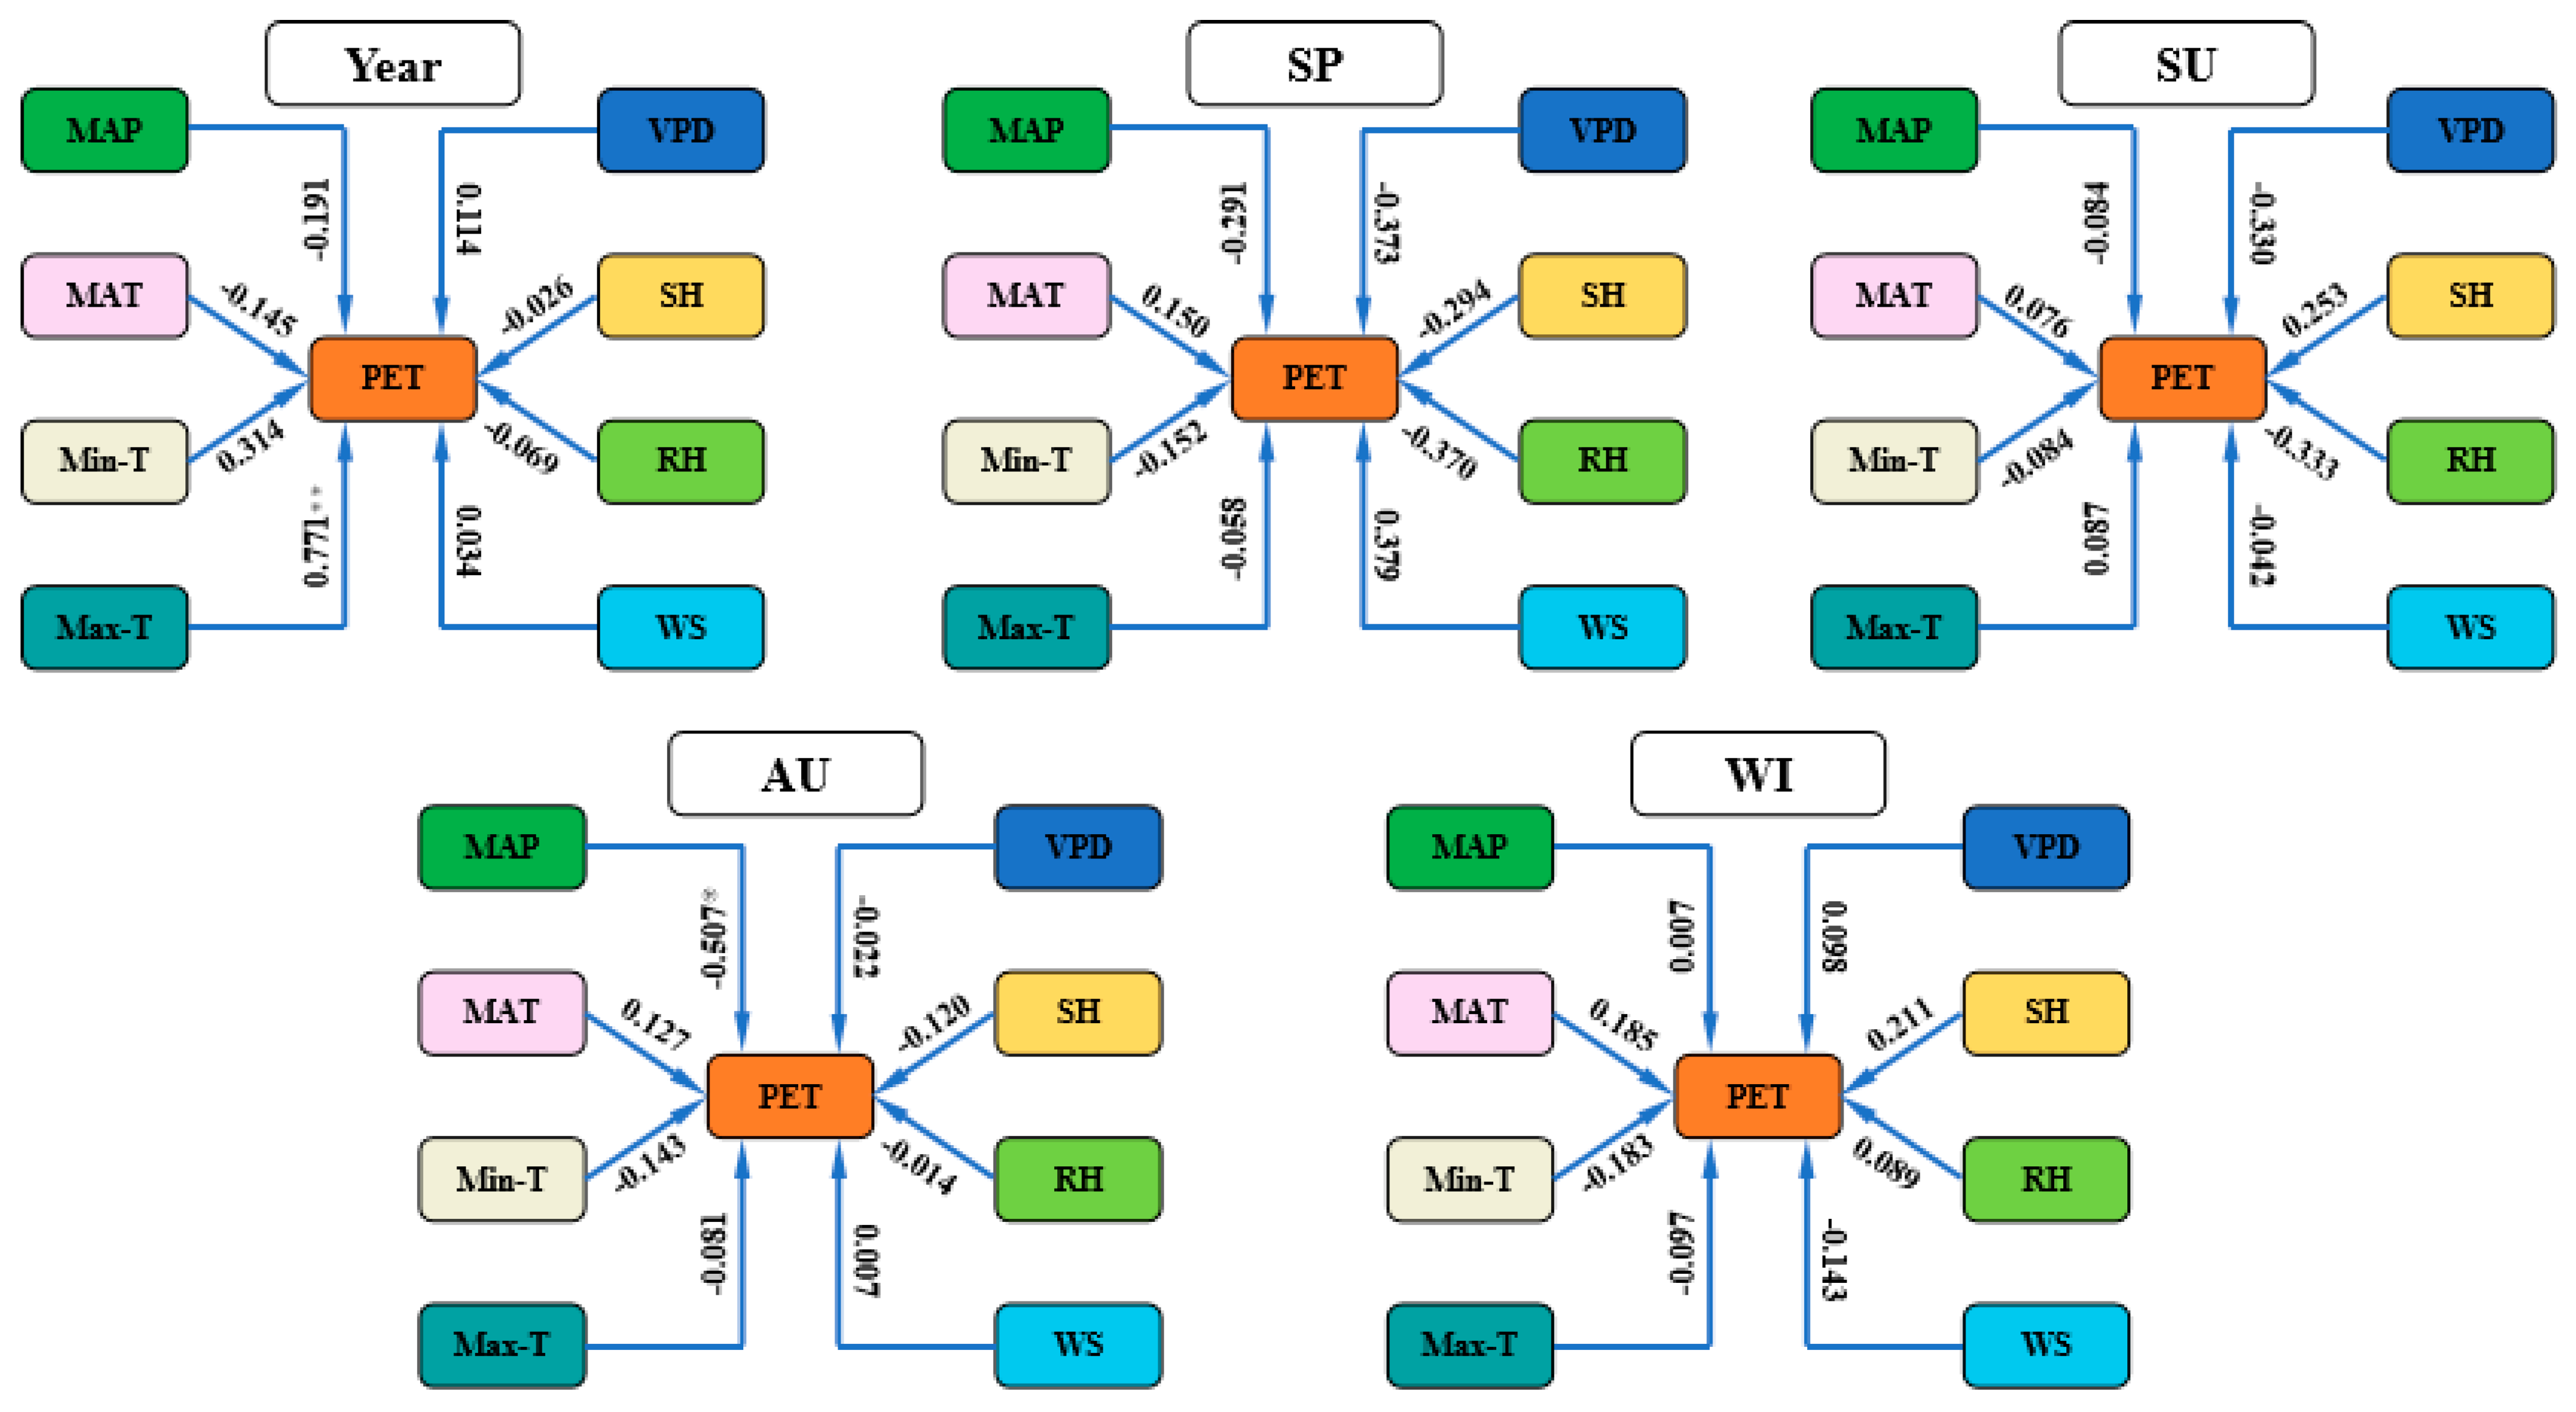
3.2.2. Partial Correlation Analysis of PET and Various Climatic Factors in the Hami Region

ET is influenced by a combination of various environmental factors, primarily including temperature, WS, SH, RH, VPD, MAP, and other meteorological elements. There are numerous factors influencing the variation of PET, and these factors interact with each other. Therefore, the causes of changes in PET are highly complex. In order to explore the causes of the annual and seasonal variations in PET in the Hami region, eight meteorological factors (MAP, MAT, Max-T, Min-T, VPD, SH, WS, RH) were selected. The dominant factors influencing PET were studied using partial correlation analysis. Based on the partial correlation coefficients between PET and various climatic factors (Figure 7), the Max-T, Min-T, WS, and VPD (0.771, 0.314, 0.034, 0.114) showed a positive correlation with annual PET. An increase in these climatic factors led to an increase in PET. On the other hand, RH, MAP, SH, and MAT (−0.069, −0.191, −0.026, −0.145) exhibited a negative correlation with annual PET. An increase in these climatic factors resulted in a decrease in PET. Among these, the partial correlation coefficient of Max-T was 0.771, which made it the primary climatic factor influencing annual PET, reaching a significant level (p < 0.01). Different climatic factors had varying degrees of impact on PET in different seasons. In SP, the factors with significant influence on PET were WS (0.379), VPD (−0.379), and RH (−0.370). In SU, VPD (−0.330), SH (0.253), and RH (−0.333) played significant roles. In AU, MAP (−0.507) was a major influencing factor, while in WI, SH (−0.211), MAT (0.185), and Min-T (−0.183) had notable impacts.

4. Discussion

Studying the temporal variations of PET contributes to understanding the trends in climate change; such research provides a predictive foundation for water resource management, guiding adaptation in fields such as agriculture and urban planning to cope with climate change [28]. In this study, the annual average PET in the Hami region from 1991 to 2020 was 871.54 mm; during WI, PET showed a decreasing trend, while in other seasons and annually, PET exhibited an increasing trend. Related studies showed that PET increased significantly in the arid areas of Northwest China [29,30,31]. The findings of the current study are generally consistent with this conclusion, with the only difference being that the winter PET in the Hami region showed a decreasing trend, which may be due to the drop in WI temperature; the specific reasons will be further studied.
Studying the spatial distribution pattern of potential evaporation is helpful in formulating differentiated water resource management strategies for various regions. This contributes to improving irrigation efficiency, ensuring the sustainability of agricultural and urban water usage [32]. The present study indicates that the annual and seasonal PET in the Hami region generally followed a distribution pattern of lower values in the central part and higher values in the surrounding areas. The southern region exhibited the highest PET, while the northwestern region experienced relatively lower values. Metzger et al. and other researchers have found that in desert ecosystems, ET is strongly influenced by vegetation and land use [33]. From homogeneous shrub areas to heterogeneous open forests and ranging further to sparsely covered arid agricultural lands, ET continuously increases. The central region of the Hami area is primarily characterized by natural grassland and orchards with a certain degree of coverage, resulting in relatively low ET. In contrast, the surrounding areas consist mainly of bare land and desert, which lack coverage, leading to relatively high ET. This observation aligns closely with the conclusions drawn by Metzger et al.
Clear identification of the driving factors influencing PET is crucial for understanding the impacts of meteorology, land use, and climate change on the water cycle. This knowledge contributes to more accurate predictions of PET changes, providing scientific guidance for irrigation, water resource management, and ecological conservation [34,35,36]. Research findings indicate that Max-T has a partial correlation coefficient of 0.771 with PET, making it the primary factor influencing annual PET changes in the Hami region. The partial correlation coefficient for MAP is −0.507, signifying it as the main factor influencing autumn PET changes. The factors of MAT, Min-T, WS, VPD, SH, and RH play enhancing or diminishing roles in the annual and seasonal variations of PET but do not reach statistical significance. Yao et al. found that solar radiation is the primary factor influencing PET in most parts of China, while WS is the predominant factor affecting PET in the Northwest region of China [31]. The results of our study differ from this conclusion, possibly because we did not include solar radiation data in our research. Solar radiation plays a crucial role as the primary energy driver in the Earth’s climate system. When solar radiation reaches the Earth’s surface, it directly influences the maximum temperature, consequently impacting the PET. Gao et al. conducted a study on the spatiotemporal variation of ET in 580 locations across China. Through partial correlation analysis, they found that SH, WS, and RH significantly influence ET [29]. From this, it can be inferred that the variations in ET across different regions result from the combined effects of multiple key climatic factors. Although WS is a primary climatic factor influencing PET on a large scale in the northwestern region, for localized small-scale areas within the western region, changes in underlying surface characteristics, such as determining canopy resistance, soil surface resistance, and other factors, also significantly affect PET [37,38]. Consequently, the dominant climatic factors affecting PET can change within localized areas due to these underlying surface features. However, its limitation lies in the lack of in-depth research on the impact of local land-use changes on PET. This is an area where the study falls short, and future research should delve more into factors such as land-use changes for a comprehensive understanding.

5. Conclusions

This study analyzed the spatiotemporal variations of PET in the Hami region of Xinjiang over the past 30 years. It expanded beyond the limitations of estimating PET at a single point and filled a gap in the existing research on regional changes in PET and their impact. The results can provide a scientific basis for water resource management strategies in arid regions. The conclusions drawn are as follows:
(1)
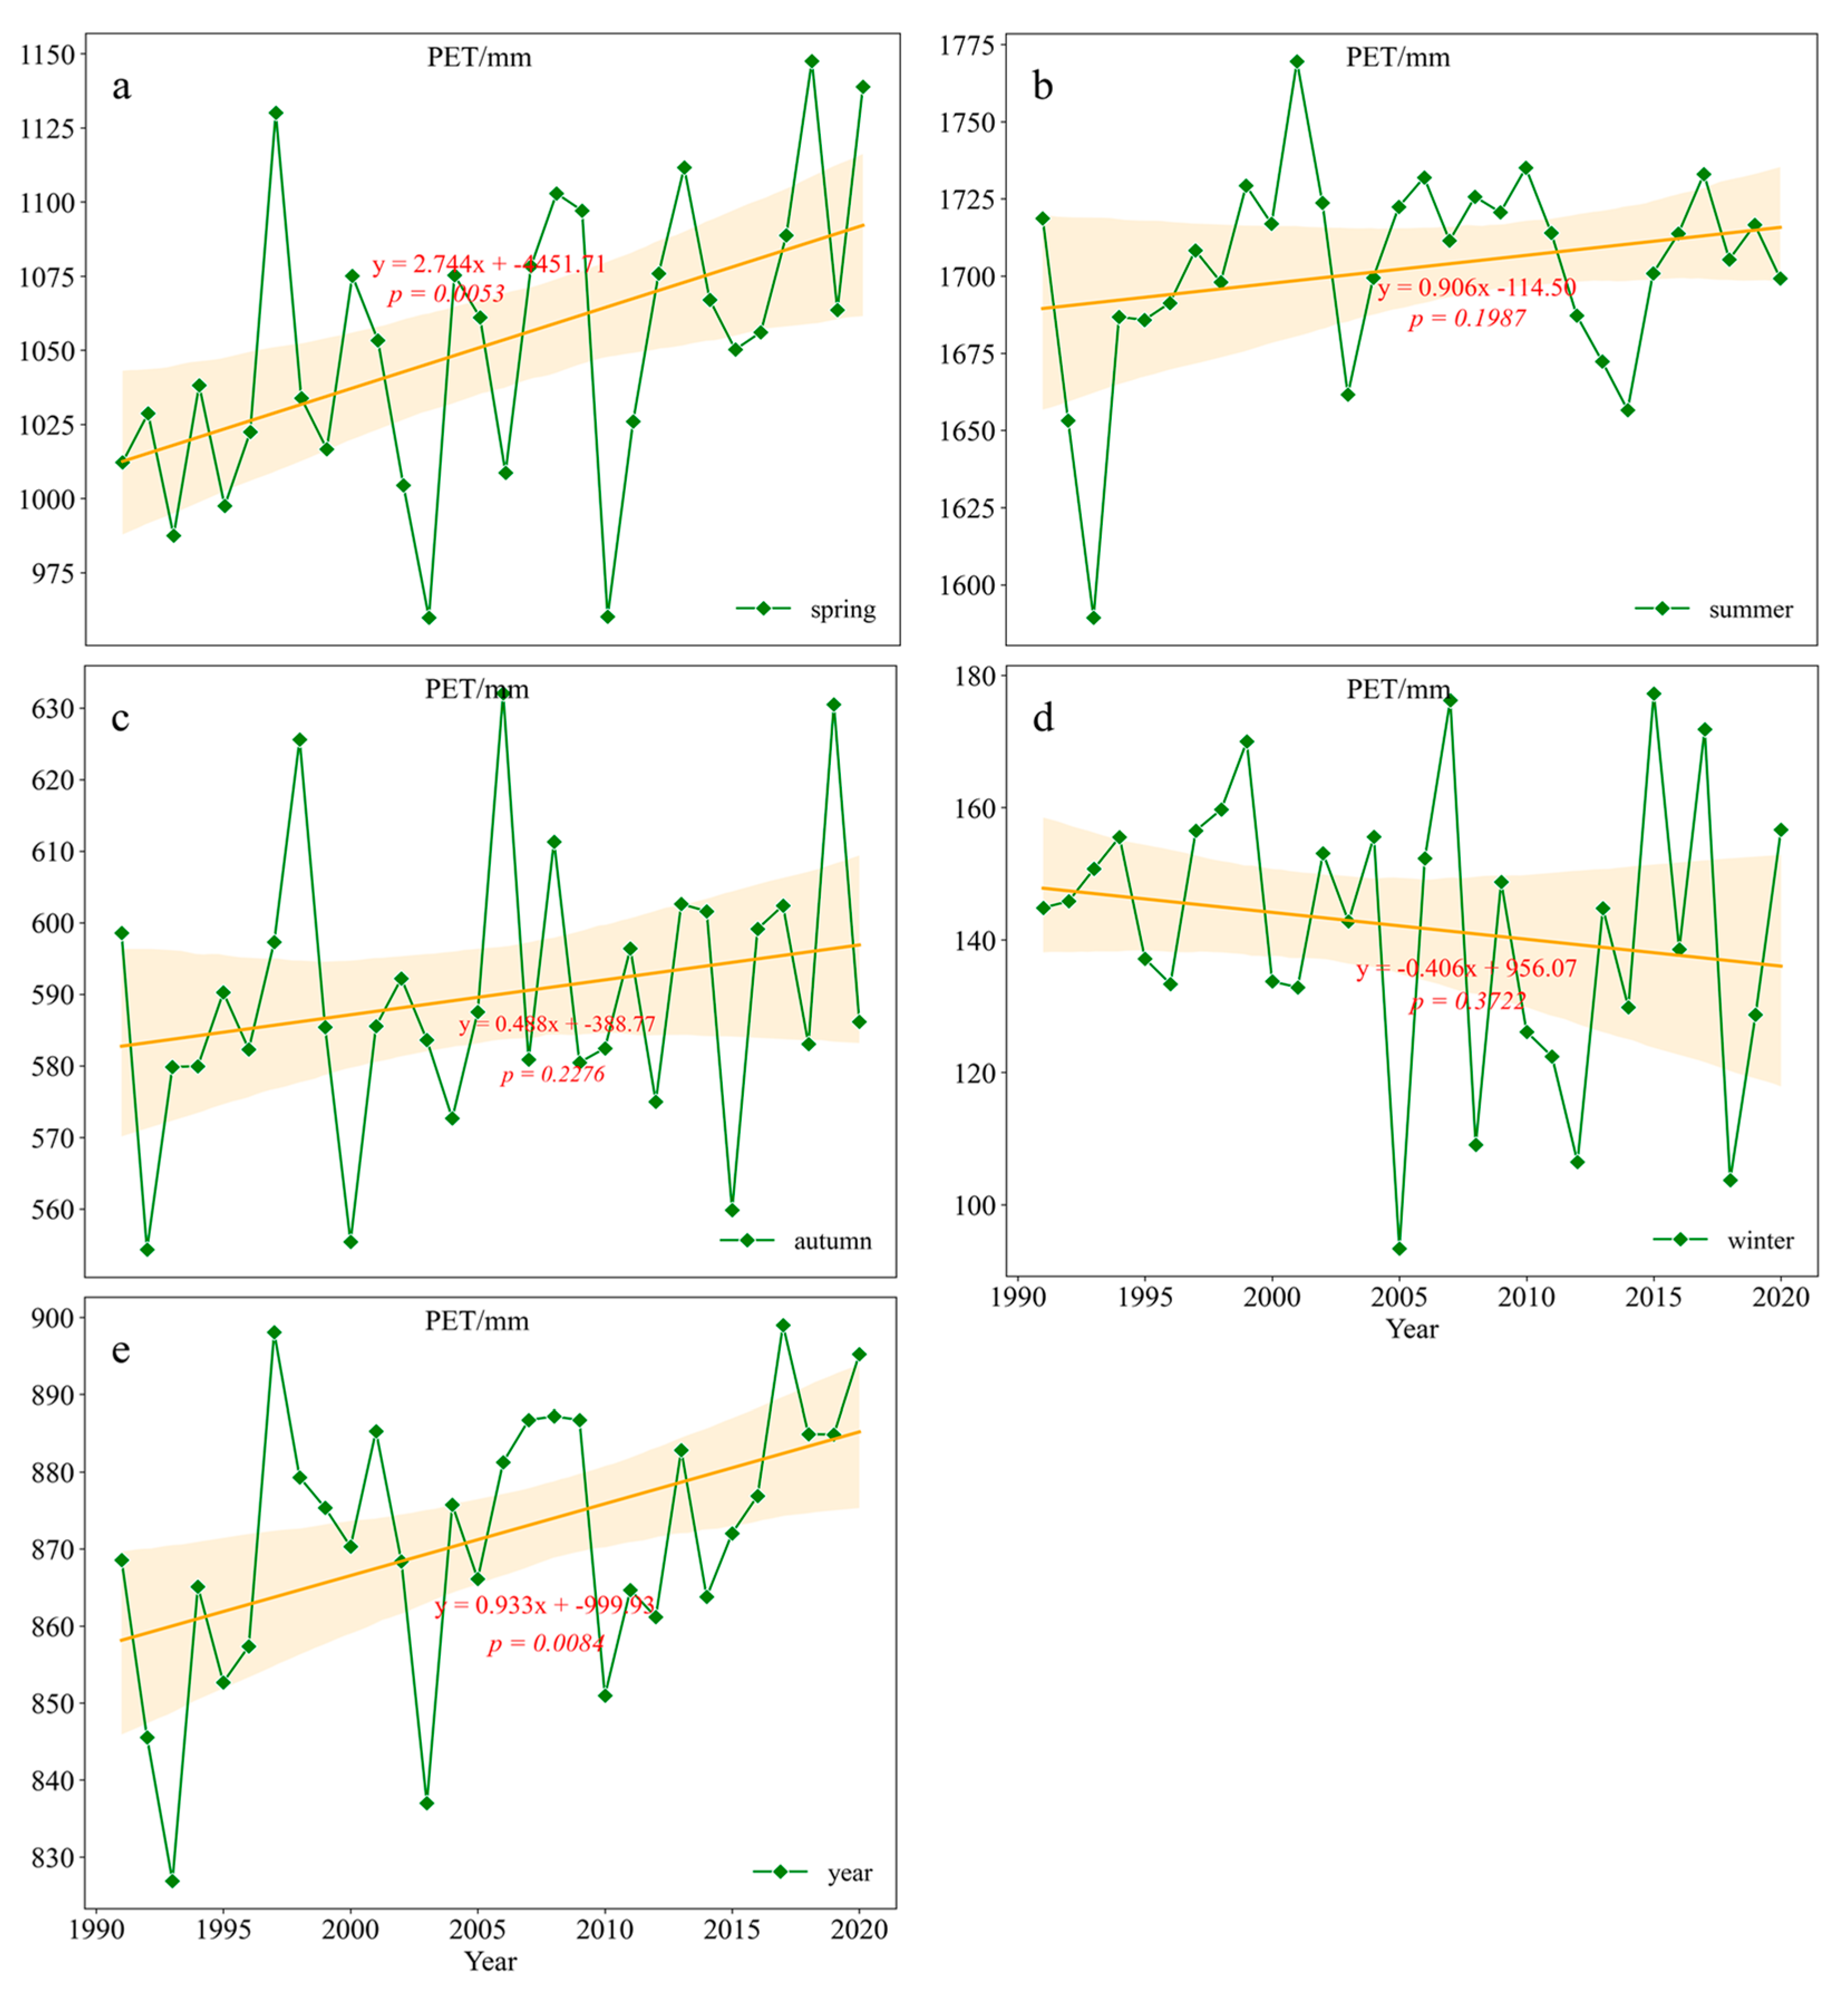
In the hyper-arid Hami region in Northwest China, the annual PET showed a fluctuating increasing trend from 1991 to 2020. The interannual trends of PET for full years, SP, SU, AU, and WI were 0.933, 2.744, 0.906, 0.488, and −0.406 mm·a-1, respectively. This indicates that, except for WI, PET increased in each season as well as annually, with the largest growth rate in SP. Spatial variations in the interannual changes of PET were observed across different seasons in the region.
(2)
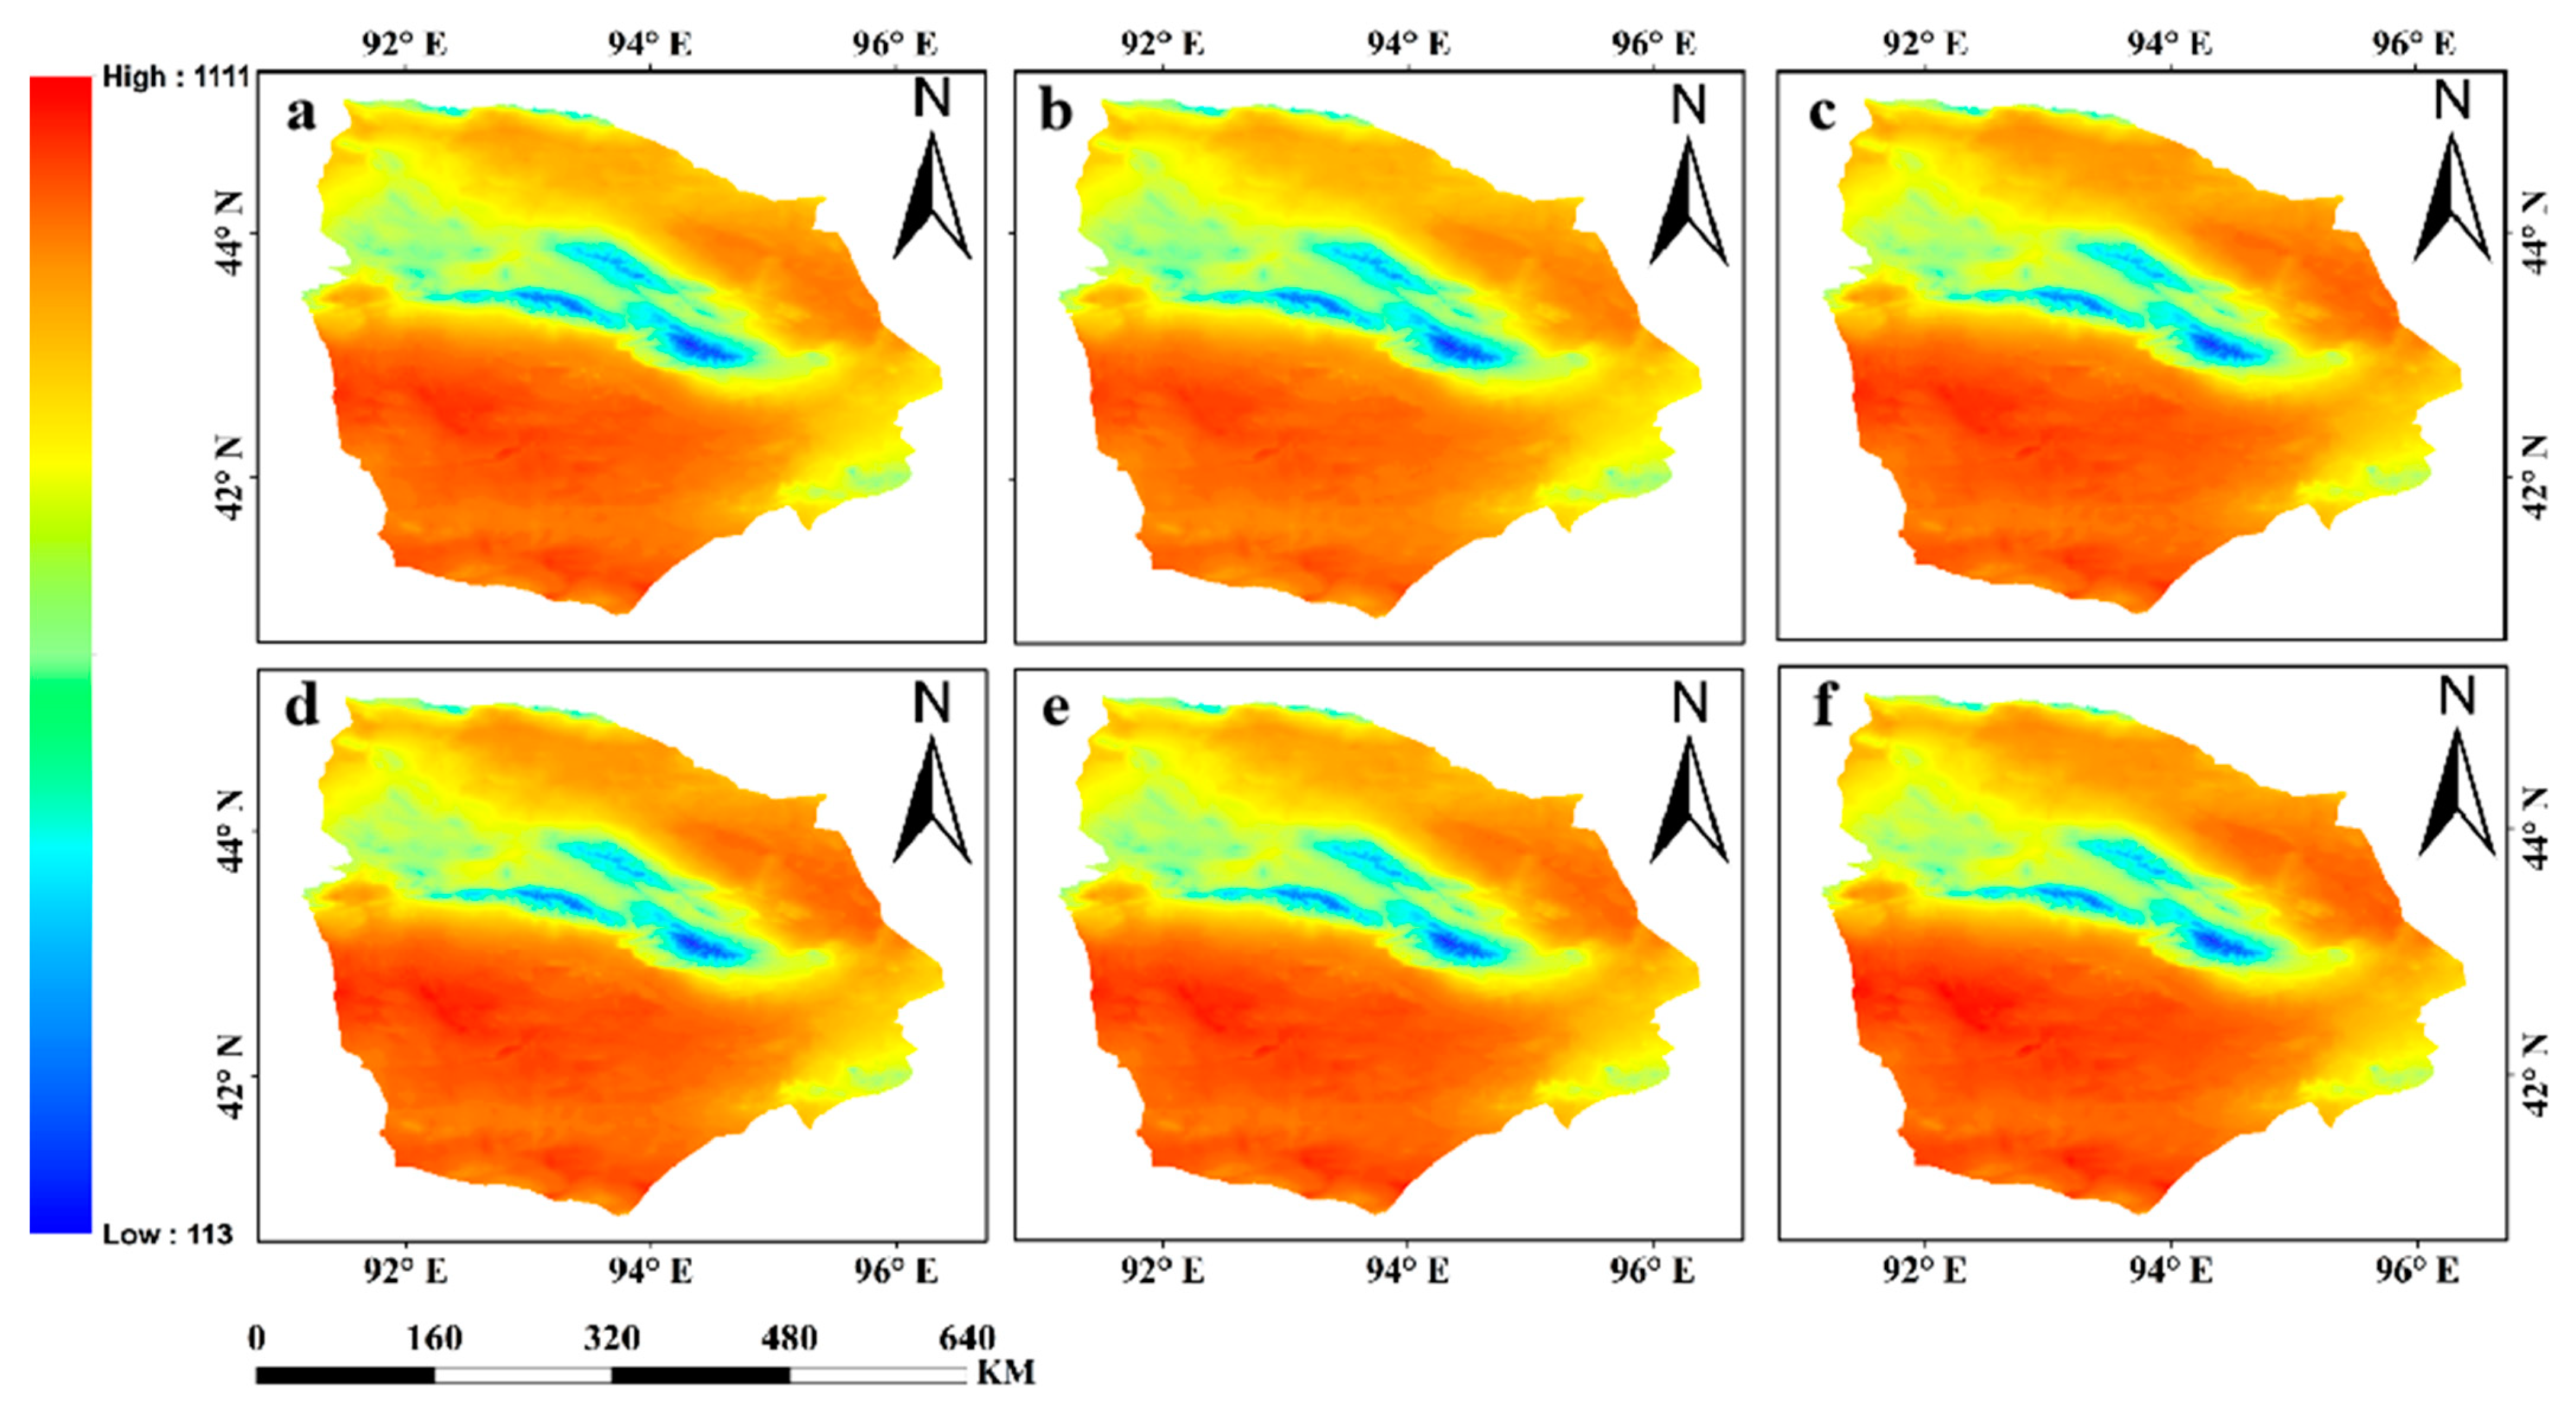
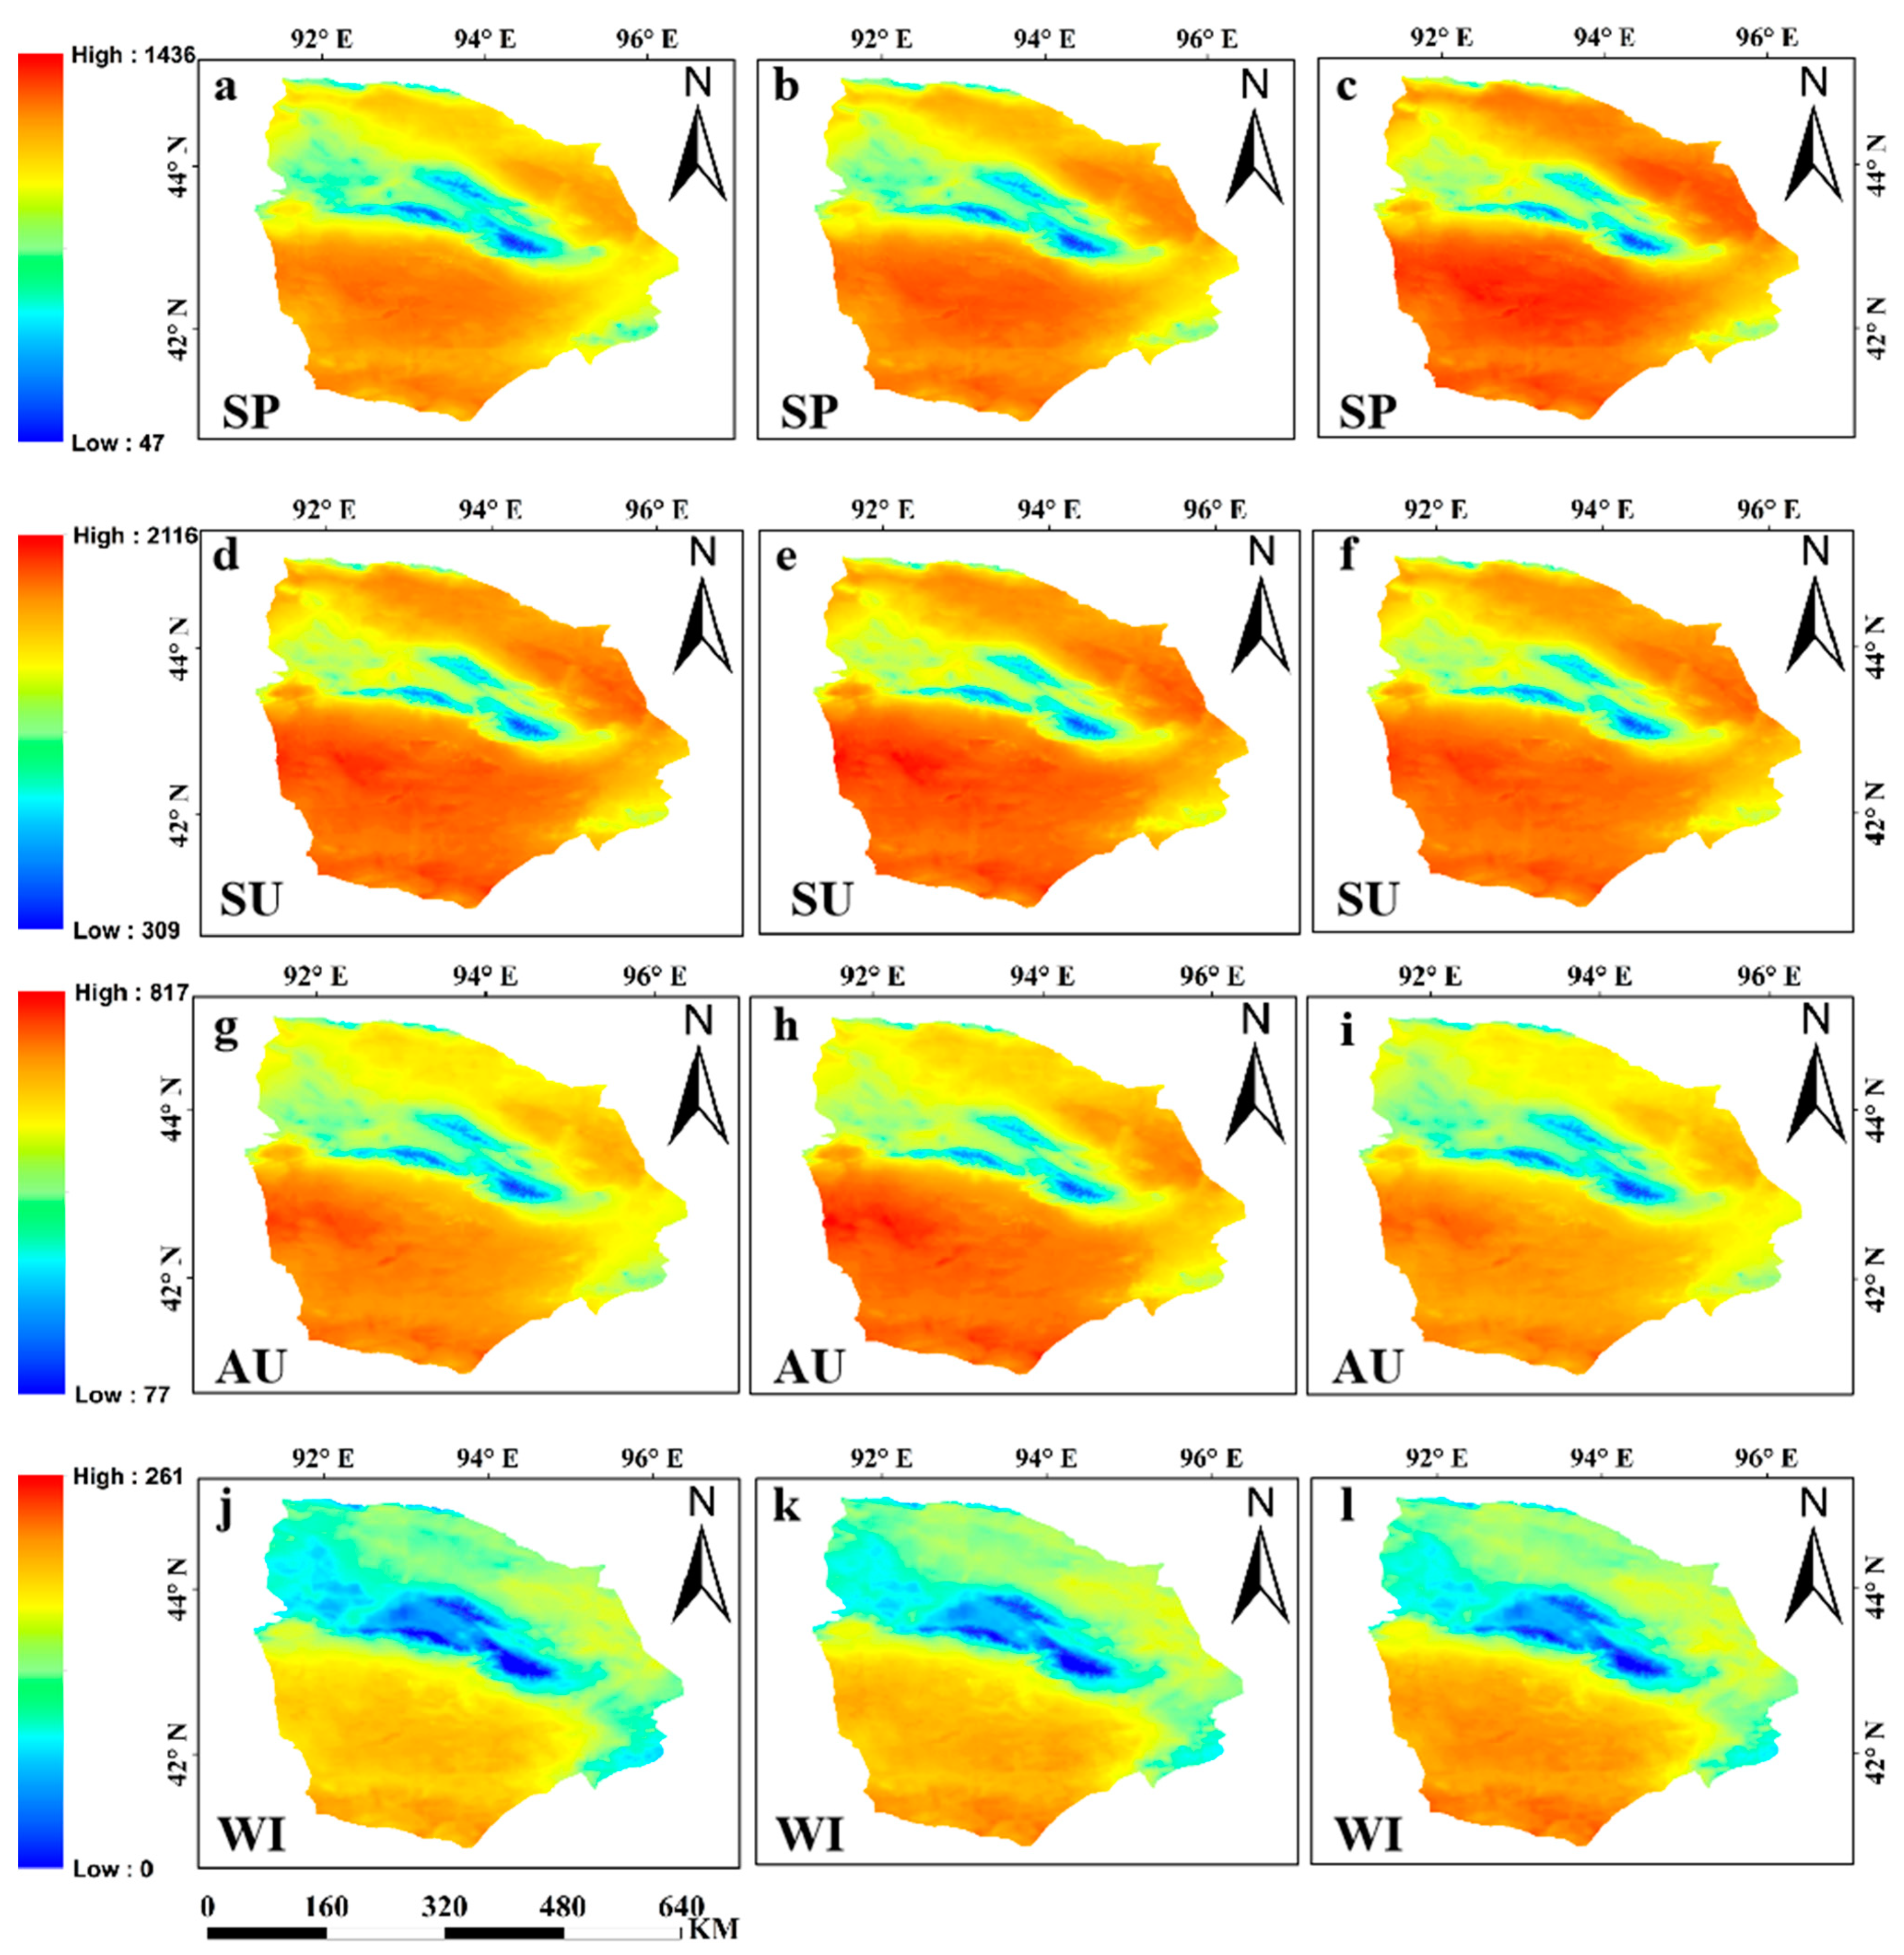
In the Hami region, the multiyear annual average PET ranged between 113 and 1111 mm from 1991 to 2020. The PET ranges for SP, SU, AU, and WI were 47–1436, 309–2116, 77–817, and 0–261 mm, respectively. The distribution of PET for different years and seasons across the entire region exhibited a consistent pattern, characterized by lower values in the central area and higher values in the surrounding regions. The southern area had the highest PET, while the northwestern region had relatively lower values.
(3)
The impact of trends and magnitudes of meteorological factors on annual and seasonal potential evapotranspiration varies. The dominant factor influencing annual PET is Max-T, while for AU PET, the main influencing factor is MAP. Other factors play a role in enhancing or reducing the changes in annual PET.

Author Contributions

Y.L.: conceptualization, draft syllabus, investigation, data collation and vali-dation, visualization and interpretation, analysis, write-up, and proofreading; Y.Y.: conceptualization, analysis, data interpretation, write-up, review, and editing; L.D., L.S., Z.G., J.Z., C.L. and J.H.: conceptualization and collection of primary data; E.Ł., I.M. and M.W.: provision of paper-writing suggestions. All authors have read and agreed to the published version of the manuscript.

Funding

This research has been funded by the Key Research and Development Program of Xinjiang (2022B01032-4), the National Natural Science Foundation of China (No. 42107084), and the Third Xinjiang Comprehensive Scientific Research Project on Comprehensive Evaluation and Sustainable Utilization of Land Resources in the Turpan-Hami Basin (2022xjkk1102) and supported by the China Scholarship Council (CSC).

Institutional Review Board Statement

Not applicable.

Informed Consent Statement

Statement not applicable.

Data Availability Statement

The data presented in this study are available on request from the lead author. The data are not publicly available because they also form part of an ongoing study.

Conflicts of Interest

The authors declare no conflicts of interest.

References

  1. Liu, B.; Henderson, M.; Zhang, Y.; Ming, X. Spatiotemporal change in China’s climatic growing season: 1955–2000. Clim. Chang. 2010, 99, 93–118. [Google Scholar] [CrossRef]
  2. Hajimirzajan, A.; Vahdat, M.; Sadegheih, A.; Shadkam, E.; Bilali, H.E. An integrated strategic framework for large-scale crop planning: Sustainable climate-smart crop planning and agri-food supply chain management. Sustain. Prod. Consum. 2020, 26, 709–732. [Google Scholar] [CrossRef]
  3. Vicente-Serrano, S.M.; Azorin-Molina, C.; Sanchez-Lorenzo, A.; Revuelto, J. Sensitivity of reference evapo-transpiration to changes in meteorological parameters in Spain (1961–2011). Water Resour Res. 2014, 50, 8458–8480. [Google Scholar] [CrossRef]
  4. Bond, N.A.; Bumbaco, K.A. Summertime potential evapotranspiration in eastern Washington state. J. Appl. Meteorol. Climatol. 2015, 54, 1090–1101. [Google Scholar] [CrossRef]
  5. Liu, L.; Zhang, Z.Y.; Yan, Q. Spatiotemporal Changes of Potential Evaporation of the Northern Slope in Tianshan Mountains. Res. Soil Water Conserv. 2015, 22, 306–311. [Google Scholar]
  6. Wells, N.; Goddard, S.; Hayes, M.J. A Self-Calibrating Palmer Drought Severity Index. J. Clim. 2004, 17, 2335–2351. [Google Scholar] [CrossRef]
  7. Kimura, R. Global detection of aridification or increasing wetness in arid regions from 2001 to 2013. Nat. Hazards 2020, 103, 2261–2276. [Google Scholar] [CrossRef]
  8. McCabe, G.J.; Hay, L.E.; Bock, A.; Markstrom, S.L.; Atkinson, R.D. Inter-annual and spatial variability of Hamon potential evapotranspiration model coefficients. J. Hydrol. 2015, 521, 389–394. [Google Scholar] [CrossRef]
  9. Bai, P.; Liu, X.; Yang, T.; Li, F.; Liang, K.; Hu, S.; Liu, C. Assessment of the Influences of Different Potential Evapotranspiration Inputs on the Performance of Monthly Hydrological Models under Different Climatic Conditions. J. Hydrometeorol. 2016, 17, 2259–2274. [Google Scholar] [CrossRef]
  10. Ma, T.X.; Liang, Y.; Lau, M.K.; Liu, B.; Wu, M.M.; He, H.S. Quantifying the relative importance of potential evapotranspiration and timescale selection in assessing extreme drought frequency in conterminous China. Atmos. Res. 2021, 263, 105797. [Google Scholar] [CrossRef]
  11. Ferreira, L.B.; da Cunha, F.F.; de Oliveira, R.A.; Filho, E.I.F. Estimation of reference evapotranspiration in Brazil with limited meteorological data using ANN and SVM—A new approach. J. Hydrol. 2019, 572, 556–570. [Google Scholar] [CrossRef]
  12. Valipour, M.; Gholami Sefidkouhi, M.A.; Raeini−Sarjaz, M. Selecting the best model to estimate potential evapotranspiration with respect to climate change and magnitudes of extreme events. Agric. Water Manag. 2017, 180, 50–60. [Google Scholar] [CrossRef]
  13. McMahon, T.A.; Peel, M.C.; Lowe, L.; Srikanthan, R.; McVicar, T.R. Estimating actual, potential, reference crop and pan evaporation using standard meteorological data: A pragmatic synthesis. Hydrol. Earth Syst. Sci. 2013, 17, 1331–1363. [Google Scholar] [CrossRef]
  14. Sonali, P.; Nagesh Kumar, D. Spatio-temporal variability of temperature and potential evapotranspiration over India. J. Water Clim. Chang. 2016, 7, 810–822. [Google Scholar] [CrossRef]
  15. Penman, H.L. Natural evaporation from open water, bare soil and grass. Proc. R. Soc. Lond. A 1948, 193, 120–146. [Google Scholar]
  16. Gan, G.; Liu, Y.; Sun, G. Understanding interactions among climate, water, and vegetation with the Budyko framework. Earth-Sci Rev. 2021, 212, 103451. [Google Scholar] [CrossRef]
  17. Gedney, N.; Cox, P.M.; Betts, R.A.; Boucher, O.; Huntingford, C.; Stott, P.A. Detection of a direct carbon dioxide effect in continental river runoff records. Nature 2006, 439, 835–838. [Google Scholar] [CrossRef] [PubMed]
  18. Zhang, Q.; Qi, T.Y.; Li, J.F.; Singh, V.P.; Wang, Z.Z. Spatiotemporal variations of pan evaporation in China during 1960–2005: Changing patterns and causes. Int. J. Climatol. 2015, 35, 903–912. [Google Scholar] [CrossRef]
  19. Yin, Y.H.; Wu, S.H.; Dai, E.F. Determining factors in potential evapotranspiration changes over China in the period 1971–2008. Chin. Sci. Bull. 2010, 55, 3329–3337. [Google Scholar] [CrossRef]
  20. Zhang, Y.; Liu, C.; Tang, Y.; Yang, Y. Trends in Pan Evaporation and Reference and Actual Evapotranspiration across the Tibetan Plateau. J. Geophys. Res. Atmos. 2007, 112. [Google Scholar] [CrossRef]
  21. Gao, G.; Chen, D.; Xu, C.Y.; Simelton, E. Trend of estimated actual evapotranspiration over China during 1960–2002. J. Geophys. Res. 2007, 112, D11120. [Google Scholar] [CrossRef]
  22. Peterson, T.C.; Golubev, V.S.; Groisman, P.Y. Evaporation losing its strength. Nature 1995, 377, 687–688. [Google Scholar] [CrossRef]
  23. Jhajharia, D.; Dinpashoh, Y.; Kahya, E.; Singh, V.P.; Fakheri-Fard, A. Trends in reference evapotranspiration in the humid region of northeast India. Hydrol. Process. 2012, 26, 421–435. [Google Scholar] [CrossRef]
  24. Burn, D.H.; Hesch, N.M. Trends in evaporation for the Canadian Prairies. J. Hydrol. 2007, 336, 61–73. [Google Scholar] [CrossRef]
  25. Roderick, M.L.; Rotstayn, L.D.; Farquhar, G.D.; Hobbins, M.T. On the attribution of changing pan evaporation. Geophys. Res. Lett. 2007, 34, L17403. [Google Scholar] [CrossRef]
  26. Fisher, J.B.; Melton, F.; Middleton, E.; Hain, C.; Anderson, M.; Allen, R.; McCabe, M.F.; Hook, S.; Baldocchi, D.; Townsend, P.A. The Future of Evapotranspiration: Global Requirements for Ecosystem Functioning, Carbon and Climate Feedbacks, Agricultural Management, and Water Resources. Water Resour. Res. 2017, 53, 2618–2626. [Google Scholar] [CrossRef]
  27. Fu, Y.P.; Xin, S.; Wang, Y.; Cao, Z.L. Adaptability Analysis of Three Spatial Interpolation Methods in Temperature—A Case Study of Jiangxi Province. J. Green Sci. Technol. 2023, 25, 51–56. [Google Scholar]
  28. Rehana, S.; Monish, N.T. Impact of potential and actual evapotranspiration on drought phenomena over water and energy-limited regions. Theor. Appl. Climatol. 2021, 144, 215–238. [Google Scholar] [CrossRef]
  29. Gao, G.; Chen, D.; Ren, G.; Chen, Y.; Liao, Y. Spatial and temporal variations and controlling factors of potential evapotranspiration in China: 1956–2000. J. Geogr. Sci. 2006, 16, 3–12. [Google Scholar] [CrossRef]
  30. Thomas, A. Spatial and temporal characteristics of potential evapotranspiration trends over China. Int. J. Climatol. 2000, 20, 381–396. [Google Scholar] [CrossRef]
  31. Yao, Y.; Zhao, S.; Zhang, Y.; Jia, K.; Liu, M. Spatial and Decadal Variations in Potential Evapotranspiration of China Based on Reanalysis Datasets during 1982–2010. Atmosphere 2014, 5, 737–754. [Google Scholar] [CrossRef]
  32. Sun, S.; Wang, G.; Huang, J.; Mu, M.; Yan, G.; Liu, C.; Hua, W. Spatial pattern of reference evapotranspiration change and its temporal evolution over Southwest China. Theor. Appl. Climatol. 2016, 130, 979–992. [Google Scholar] [CrossRef]
  33. Metzger, J.C.; Landschreiber, L.; Gröngröft, A.; Eschenbach, A. Soil evaporation under different types of land use in southern African savanna ecosystems. J. Plant Nutr. Soil Sci. 2014, 177, 468–475. [Google Scholar] [CrossRef]
  34. Shi, H.; Li, T.; Wang, G. Temporal and spatial variations of potential evaporation and the driving mechanism over Tibet during 1961–2001. Hydrol. Sci. J. 2017, 62, 1469–1482. [Google Scholar] [CrossRef]
  35. Li, Z.X.; Feng, Q.; Wei, L.; Wang, T.T.; Gao, Y.; Wang, Y.M.; Cheng, A.F.; Li, J.G.; Liu, L. Spatial and temporal trend of potential evapotranspiration and related driving forces in Southwestern China, during 1961–2009. Quat. Int. 2014, 336, 127–144. [Google Scholar]
  36. Luo, K.; Tao, F.; Deng, X.; Moiwo, J.P. Changes in potential evapotranspiration and surface runoff in 1981–2010 and the driving factors in Upper Heihe River Basin in Northwest China. Hydrol. Process. 2016, 31, 90–103. [Google Scholar] [CrossRef]
  37. Brauman, K.A.; Freyberg, D.L.; Daily, G.C. Potential evapotranspiration from forest and pasture in the tropics: A case study in Kona, Hawai’i. J. Hydrol. 2012, 440–441, 52–61. [Google Scholar] [CrossRef]
  38. Katerji, N.; Rana, G. Crop reference evapotranspiration: A discussion of the concept, analysis of the process and validation. Water Resour Manag. 2011, 25, 1581–1600. [Google Scholar] [CrossRef]
Figure 1. Digital elevation model (DEM) and land-use types of the study area.
Atmosphere 15 00136 g001
Figure 2. Interannual variation trends of annual and seasonal potential evaporation in Hami region: (a) SP average PET; (b) SU average PET; (c) AU average PET; (d) WI average PET; (e) annual average PET).
Atmosphere 15 00136 g002
Figure 3. The spatiotemporal distribution of PET in the Hami region (af) in 1991, 1996, 2001, 2007, 2013, and 2021 is illustrated. The maps represent the following years: (a) 1991; (b) 1996; (c) 2001; (d) 2007; (e) 2013; (f) 2021.
Atmosphere 15 00136 g003
Figure 4. The spatiotemporal distribution (al) of PET during the four seasons of 1991, 2005, and 2020 in the Hami region is illustrated [(a,d,g,j): 1991; (b,e,h,k): 2005; (c,f,i,l): 2020].
Atmosphere 15 00136 g004
Figure 5. Interannual and seasonal variation trends of various environmental factors in Hami region [(a) average precipitation; (b) average temperature; (c) average maximum temperature; (d) average minimum temperature; (e) average vapor pressure deficit; (f) average sunshine hours; (g) average relative humidity; (h) average wind speed].
Atmosphere 15 00136 g005
Figure 6. Spatial distribution of environmental factors in Hami region [(a) average precipitation; (b) average temperature; (c) average maximum temperature; (d) average minimum temperature; (e) average vapor pressure deficit; (f) average sunshine hours; (g) average relative humidity; (h) average wind speed].
Atmosphere 15 00136 g006
Figure 7. Partial correlation coefficients between annual and seasonal PET and environmental factors in the Hami region.
Atmosphere 15 00136 g007
Table 1. Data Sources and Basic Parameters.
ParameterAbbreviationUnitOriginal ResolutionData Source
Mean annual precipitationMAPmm1000 mhttps://doi.org/10.5281/zenodo.3185722, accessed on 4 November 2023
Mean annual temperatureMAT°C1000 mhttps://cstr.cn/18406.11.Meteoro.tpdc.270961, accessed on 4 November 2023
Maximum temperatureMax-T°C1000 mhttps://doi.org/10.5281/zenodo.3114194, accessed on 4 November 2023
Minimum temperatureMin-T°C1000 mhttps://doi.org/10.5281/zenodo.3114194, accessed on 4 November 2023
Wind speedWSm/s1000 mMeteorological station data
Vapor pressure differenceVPDhpa1000 mMeteorological station data
Relative humidityRH%1000 mMeteorological station data
Sunlight hoursSHh1000 mMeteorological station data
Disclaimer/Publisher’s Note: The statements, opinions and data contained in all publications are solely those of the individual author(s) and contributor(s) and not of MDPI and/or the editor(s). MDPI and/or the editor(s) disclaim responsibility for any injury to people or property resulting from any ideas, methods, instructions or products referred to in the content.

