Article

Spatial and Decadal Variations in Potential Evapotranspiration of China Based on Reanalysis Datasets during 1982–2010

1
State Key Laboratory of Remote Sensing Science, College of Global Change and Earth System Science, Beijing Normal University, No.19 Xinjiekou Street, Beijing 100875, China
2
Ministry of Environmental Protection, Environmental Satellite Center, East Road of Yongfeng Base, Beijing 100094, China
3
College of Resource Environment and Tourism, Capital Normal University, No.105 North Road, Beijing 100048, China
4
College of Earth Sciences, Chengdu University of Technology, No.1 Erxian Bridge Road, Chengdu 610059, China
*
Author to whom correspondence should be addressed.
Atmosphere 2014, 5(4), 737-754; https://doi.org/10.3390/atmos5040737
Submission received: 20 May 2014 / Revised: 17 September 2014 / Accepted: 19 September 2014 / Published: 17 October 2014

Abstract

:
Potential evapotranspiration (PET) is an important indicator of atmospheric evaporation demand and has been widely used to characterize hydrological change. However, sparse observations of pan evaporation (EP) prohibit the accurate characterization of the spatial and temporal patterns of PET over large spatial scales. In this study, we have estimated PET of China using the Penman-Monteith (PM) method driven by gridded reanalysis datasets to analyze the spatial and decadal variations of PET in China during 1982–2010. The results show that the estimated PET has decreased on average by 3.3 mm per year (p < 0.05) over China during 1982–1993, while PET began to increase since 1994 by 3.4 mm per year (p < 0.05). The spatial pattern of the linear trend in PET of China illustrates that a widely significant increasing trend in PET appears during 1982–2010 in Northwest China, Central China, Northeast China and South China while there are no obvious variations of PET in other regions. Our findings illustrate that incident solar radiation (Rs) is the largest contributor to the variation of PET in China, followed by vapor pressure deficit (VPD), air temperature (Tair) and wind speed (WS). However, WS is the primary factor controlling inter-annual variation of PET over Northwest China.

1. Introduction

Potential evapotranspiration (PET), an important indicator of atmospheric evaporation demand (AED), has been widely used to characterize environmental change and the response of water resource and the change of eco-environment [1,2,3,4,5]. Although some scholars use pan evaporation (EP) to analyze the variation in PET, many regions do not have EP observations [6,7,8,9]. There are many methods to calculate PET, including the Penman-Monteith (PM) method provided by the Food and Agriculture Organization (FAO), the Hargreaves method, Priestley-Taylor method and other empirical methods [9,10,11,12,13,14]. Especially for the FAO PM method, it has been considered as a standard equation for PET estimation and it is closely linked to the changes in climatic variables, such as the incident solar radiation (Rs), air temperature (Tair), vapor pressure deficit (VPD) and wind speed (WS) [12,15]. Recent decadal global change has raised the variations in meteorological variables to alter global and regional AED and PET [5,9].
On the contrary to the increasing global air temperature, observed EP has been found a decreasing trend in many regions of the world over the past several decades [5,6,7,16,17]. This is not consistent with the expected result from global warming as VPD increases with Tair [9,18,19]. There are various interpretations to account for the decreasing EP and PET. Reduction in sunlight caused by an increase in cloud coverage and aerosol concentration can be considered as the major contributor to the changes in pan evaporation [2,6,8]. The decreasing VPD due to increasing air relative humidity (RH) and the reduction of WS are also considered as the main contributors to the weakened EP [9,16,20,21,22].
Recently, China has experienced great environmental changes and PET impacts on the surface actual evapotranspiration (ET), groundwater recharge and runoff generation process to alter the water redistribution [23,24,25,26]. Many scientists have attempted to analyze and explain the variations in atmospheric evaporative demand using observed EP over different climatic regions of China [2,3,4,5,13,14,15,16]. Gao et al. [2] reported that PET in China has a decreasing trend in North China while the trend is opposite in South China. Cong et al. [27] documented that the observed EP in China exhibited a declining trend during 1956–1985 and attributed this to the decreasing trends in Rs and WS. After 1986, there was an increasing trend in EP which may be caused by the decreasing VPD. Similarly, Liu and Zhang [4] used the FAO PM method driven by point meteorological datasets to estimate PET in Northwest China and found that PET decreased from 1960 through 1993 by 2.34 mm per year and began to increase since 1994 by 4.80 mm per year. Although many studies have focused on detection of the variation in atmospheric evaporative demand, almost all of them use ground measured meteorological data to obtain point-based PET estimation. However, sparse observations of West China (especially west regions of Qinghai-Tibet plateau and Tarim Basin) influence the accurate spatio-temporal characterization of PET over these regions. As a result, little is known about the spatial and decadal variations in PET of entire China over long time periods.
In this study, we use the gridded reanalysis datasets to analyze the spatial and decadal variations in PET of China during 1982–2010. Our study has three major objectives. First, we estimate the PET of China using the Penman-Monteith (PM) method driven by gridded reanalysis datasets. Second, we examine the spatial and decadal variations in PET of China from 1982 through 2010. Finally, we detect the issue of what factors contribute to variability and trends of PET over China. The study area includes seven natural divisions: Northeast China, North China, Central China, South China, Inner Mongolia, Northwest China and Qinghai-Tibet region, as shown in Figure 1.
Figure 1. Location of the study area and seven natural divisions comprising China. Natural divisions are shown: I, Northeast China; II, North China; III, Central China; IV, South China; V, Inner Mongolia; VI, Northwest China; and VII, Qinghai-Tibet region.
Atmosphere 05 00737 g001

2. Materials and Methods

2.1. Data

To estimate PET of China, we use the gridded reanalysis meteorological datasets for daily near surface air water vapor pressure (e), daily maximum air temperature (Tmax), daily minimum air temperature (Tmin), relative humidity (RH), Rs, Tair, and WS from Environmental and Ecological Science Data Center for West China [28,29,30]. These cover the period 1982–2010 on a 0.1° × 0.1° grid and was developed by Data Assimilation and Modeling Center for Tibetan Multi-spheres, Institute of Tibetan Plateau Research, Chinese Academy of Sciences and provided by Environmental & Ecological Science Data Center for West China, National Natural Science Foundation of China (http://westdc.westgis.ac.cn). This data set has been generated by merging Princeton reanalysis data, Global Energy and Water Cycle Experiment (GEWEX) Surface Radiation Budget (SRB) products, Global Land Data Assimilation System (GLDAS) data and ground-observed meteorological data from China Meteorological Administration (CMA). Previous studies demonstrated that meteorological parameters derived from this data set shows a good agreement with the measurements and has an advantage of producing less root-mean-square errors and higher correlation coefficients than the other reanalysis and satellite products [28,29,30]. The original wind data represents 10 m height above ground and it is recalculated to 2 m height using the below equations [31].
U ( Z ) = U ( r ) ln ( Z Z 0 ) ln ( Z r Z 0 )
where Z is the 2 m height above ground level, U(r) is the wind speed at the reference height Zr (10 m here) above ground level, U(Z) is the wind speed at height Z and Z0 is the roughness length in the current wind direction.
To compare the estimated PET using reanalysis data with the corresponding PET calculated from the ground observations, we use the observed daily e, Tmax, Tmin, RH, Rs, Tair, and WS for 1982–2010 from all 752 meteorological stations in China. To calculate surface net radiation (Rn), we also use the 8-day Global Land Surface Satellite (GLASS) albedo products with 0.05 degrees [32]. In addition, we also use the bimonthly Normalized Difference Vegetation Index (NDVI) products provided by the Global Inventory Modeling and Mapping Studies (GIMMS) group with 8 km spatial resolution to calculate soil heat flux (G) [33]. AVHRR NDVI products were obtained from National Oceanic and Atmospheric Administration (NOAA)/AVHRR observations (http://islscp2.sesda.com/ISLSCP21/data/vegetation/gimms_ndvi_monthly_xdeg/). To match the gridded meteorological data, both GLASS albedo and GIMMS-NDVI are interpolated into 0.1° × 0.1° using bilinear interpolation. The daily albedo and NDVI values are temporally interpolated from the 8-day and bimonthly averages using linear interpolation, respectively.

2.2. FAO Penman-Monteith Method

The FAO Penman-Monteith method has been adopted by FAO as a standard method to estimate PET and successfully applied to all basins of China [12,34,35]. The FAO PM method can be expressed as:
P E T = 0.408 Δ ( R n G ) + γ ( 900 / ( T a i r + 273 ) ) W S ( e s e ) Δ + γ ( 1 + 0.34 W S )
where Δ is the slope vapor pressure curve (Pa∙°C1), γ is the psychometric constant (Pa∙°C1). es is the saturation vapor pressure (Pa) and e refers to air water vapor pressure. VPD is vapor pressure deficit and it equals to es-e. Rn is the surface net radiation and can be calculated using the method of Allen et al. [12].
R n = R s ( 1 a l b e d o ) R n l
R n l = σ ( T max 4 + T min 4 2 ) ( 0.34 0.14 e ) ( 1.35 R s R s o 0.35 )
where σ is the Stefan-Boltzmann constant (4.903 × 10⁻⁹ MJK−4∙m−2∙d−1) and Rso is clear-sky incoming shortwave radiation. Increased water vapor pressure leads to increased downward longwave radiation. A lower ratio of incident solar radiation at the surface to clear-sky solar radiation indicates the occurrence of clouds, which also means greater downward longwave radiation. G is the sum of the soil heat flux and heat storage in above-ground biomass for vegetated areas and heat storage in water bodies, which is calculated using Rn and NDVI [36,37].
G = { 0.26 R n ( N D V I 0.15 ) 0.058 R n exp ( 2.03 N D V I ) ( N D V I > 0.15 )

2.3. Statistical Analysis

To detect the spatiotemporal long-term trends in PET and other meteorological variables, we use a simple linear regression equation and a second order least-squares fit to calculate the annual values and trends in different variables (yt) against time (t).
y t = y 0 + b t
y t = y 1 + b 1 t + b 2 t 2
where yt is the annual value of variables, t is the year, b is the linear trends in variables, y0 and y1 are the constants, b1 and b2 are the regression coefficients. We also use the Student’s t-test distribution to obtain the confidence levels (p values) of the derived tendencies [38]. When p is less than 0.05, the trend is significant and when p is equal or more than 0.05, the trend is insignificant.

3. Results and Discussion

3.1. Comparison of the Estimated PET between Using Meteorological Observations Versus Using Reanalysis Data

To illustrate the validity of the estimated PET using gridded reanalysis meteorological datasets, we also calculate PET using meteorological observations from all 752 meteorological stations in China. Figure 2 shows the comparison of the multiyear (1982–2010) averaged annual PET estimated using meteorological observations and the corresponding PET calculated from reanalysis data. One can note that the bias of the estimated ET using reanalysis datasets that deviates from the estimated PET using meteorological observations is 0.01 mm. Furthermore, the RMSE is 15.02 mm and the R2 is 0.96. This small positive bias may partially reflect the subtle difference between reanalysis data and meteorological ground observations. The good agreement between the two independent datasets indicates that the estimated PET using reanalysis data provides reliable information for detection of spatial and decadal variations in PET of China.

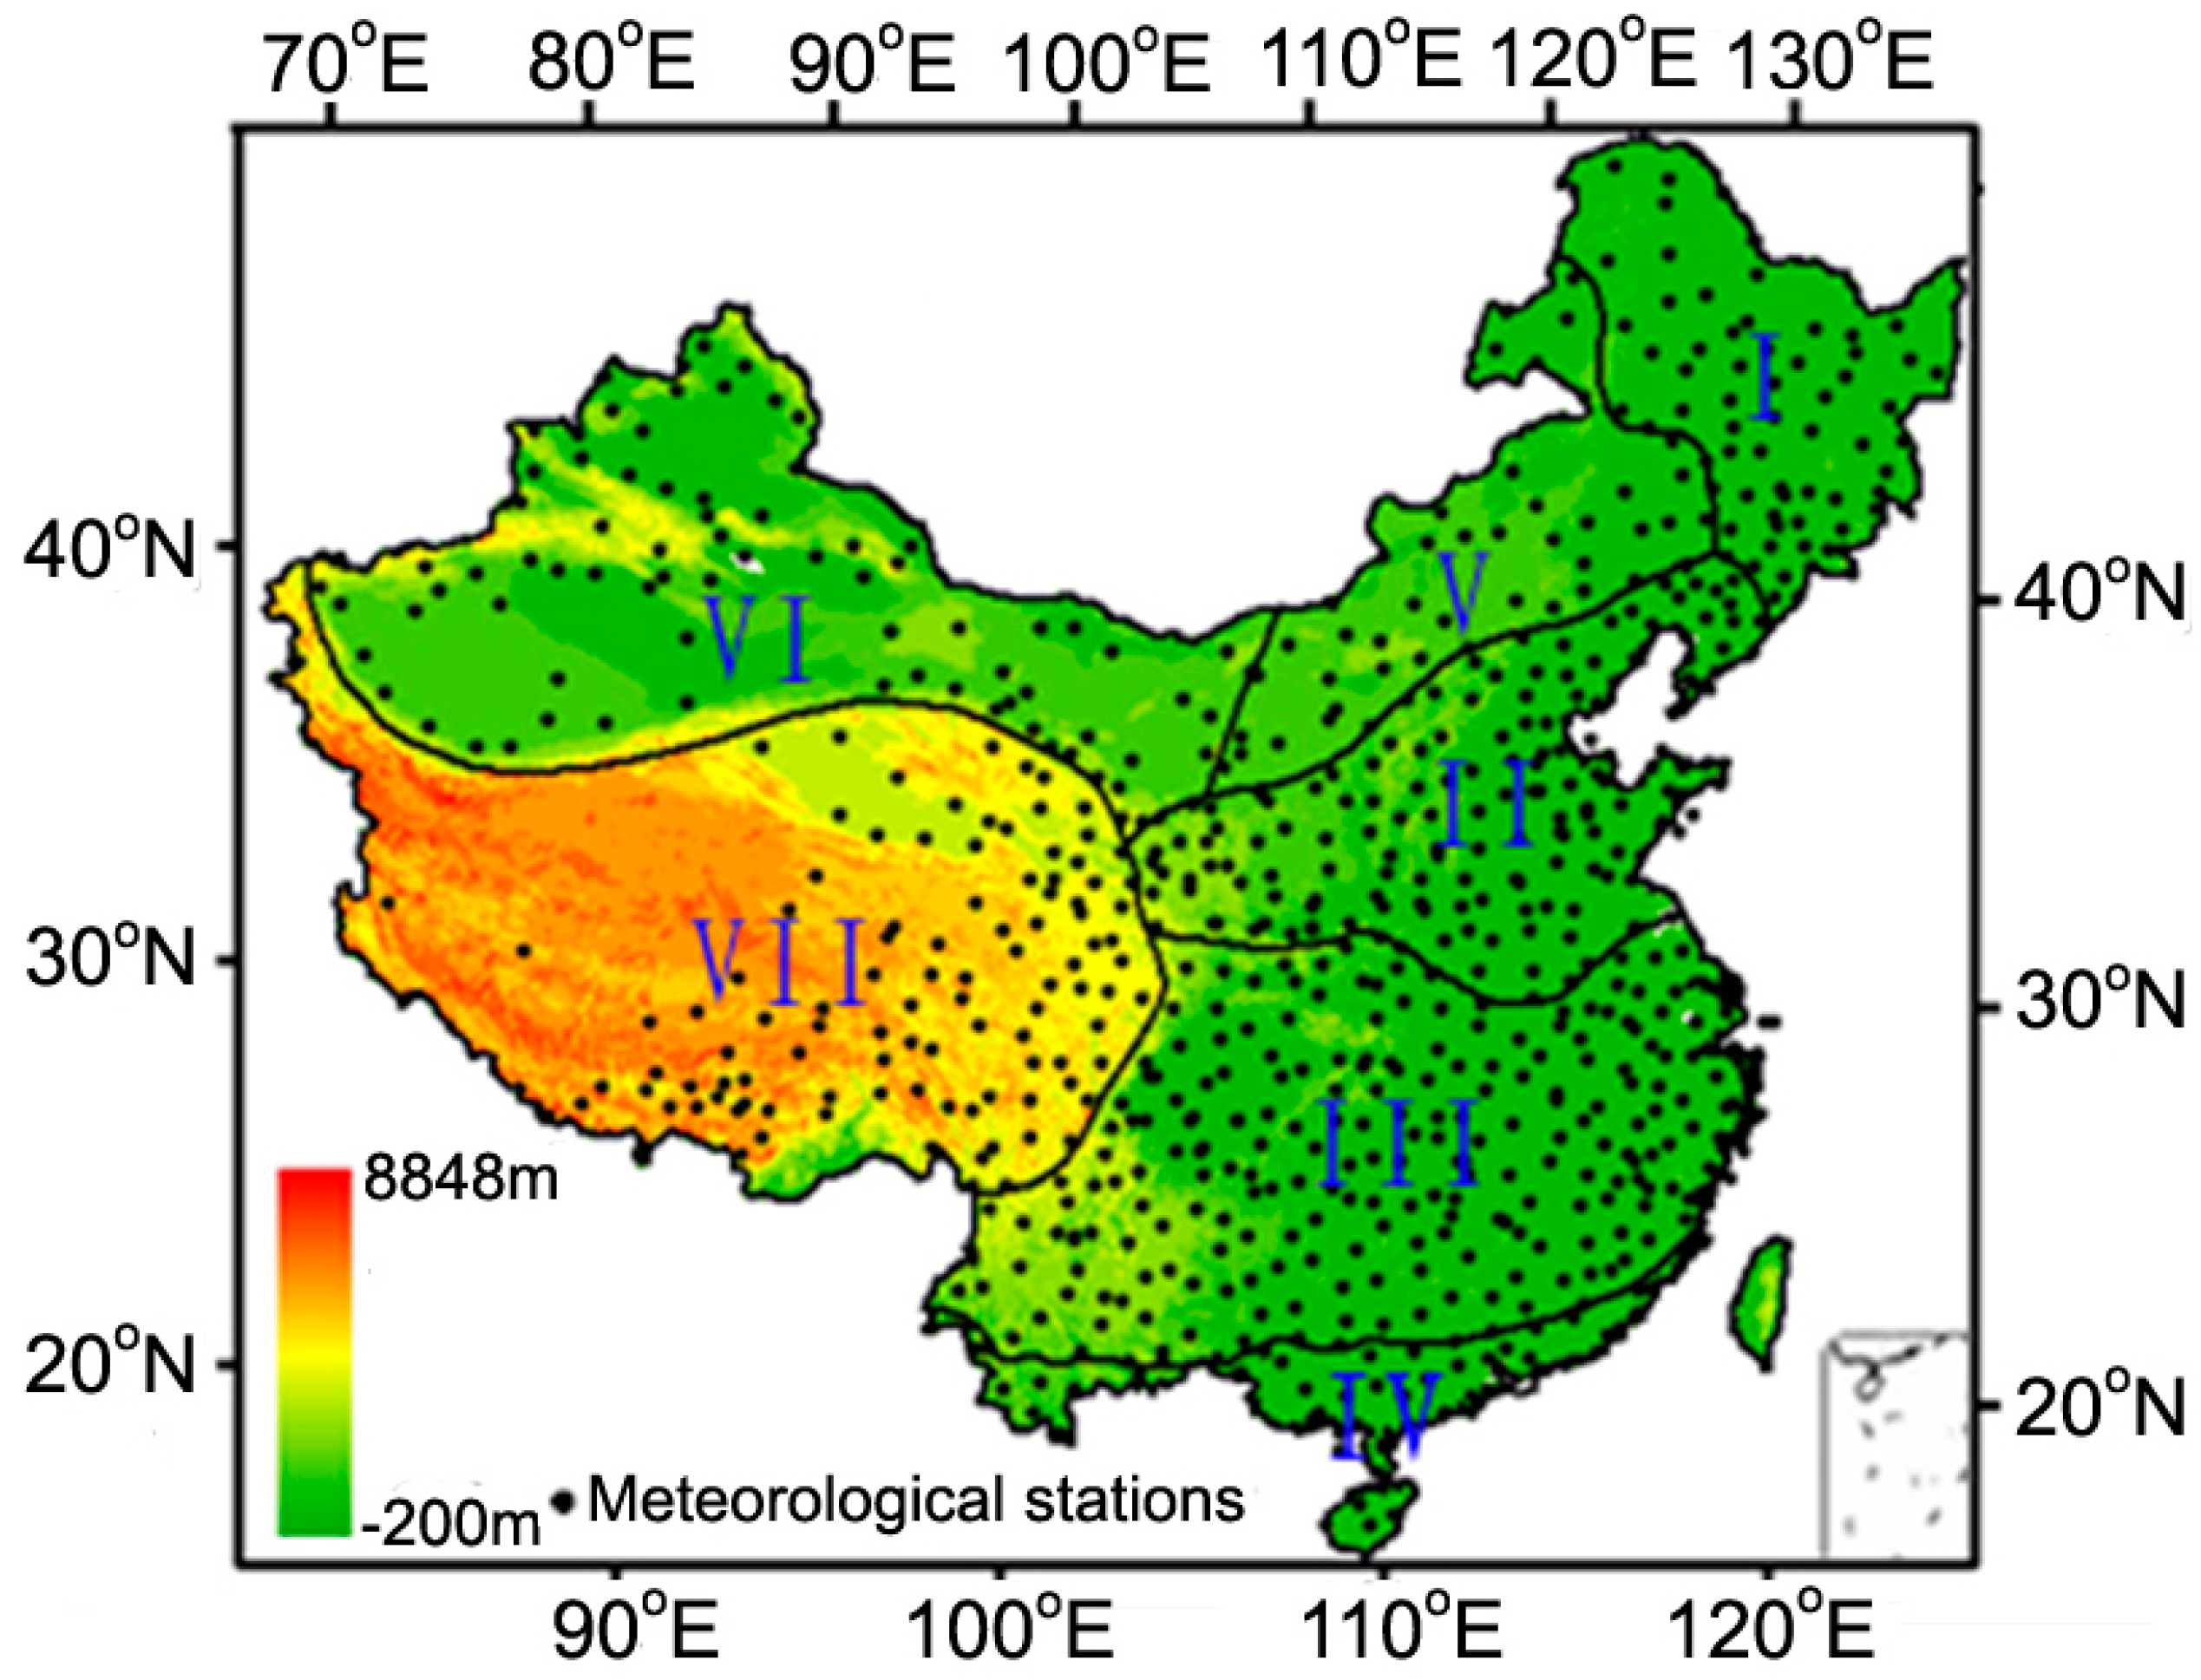
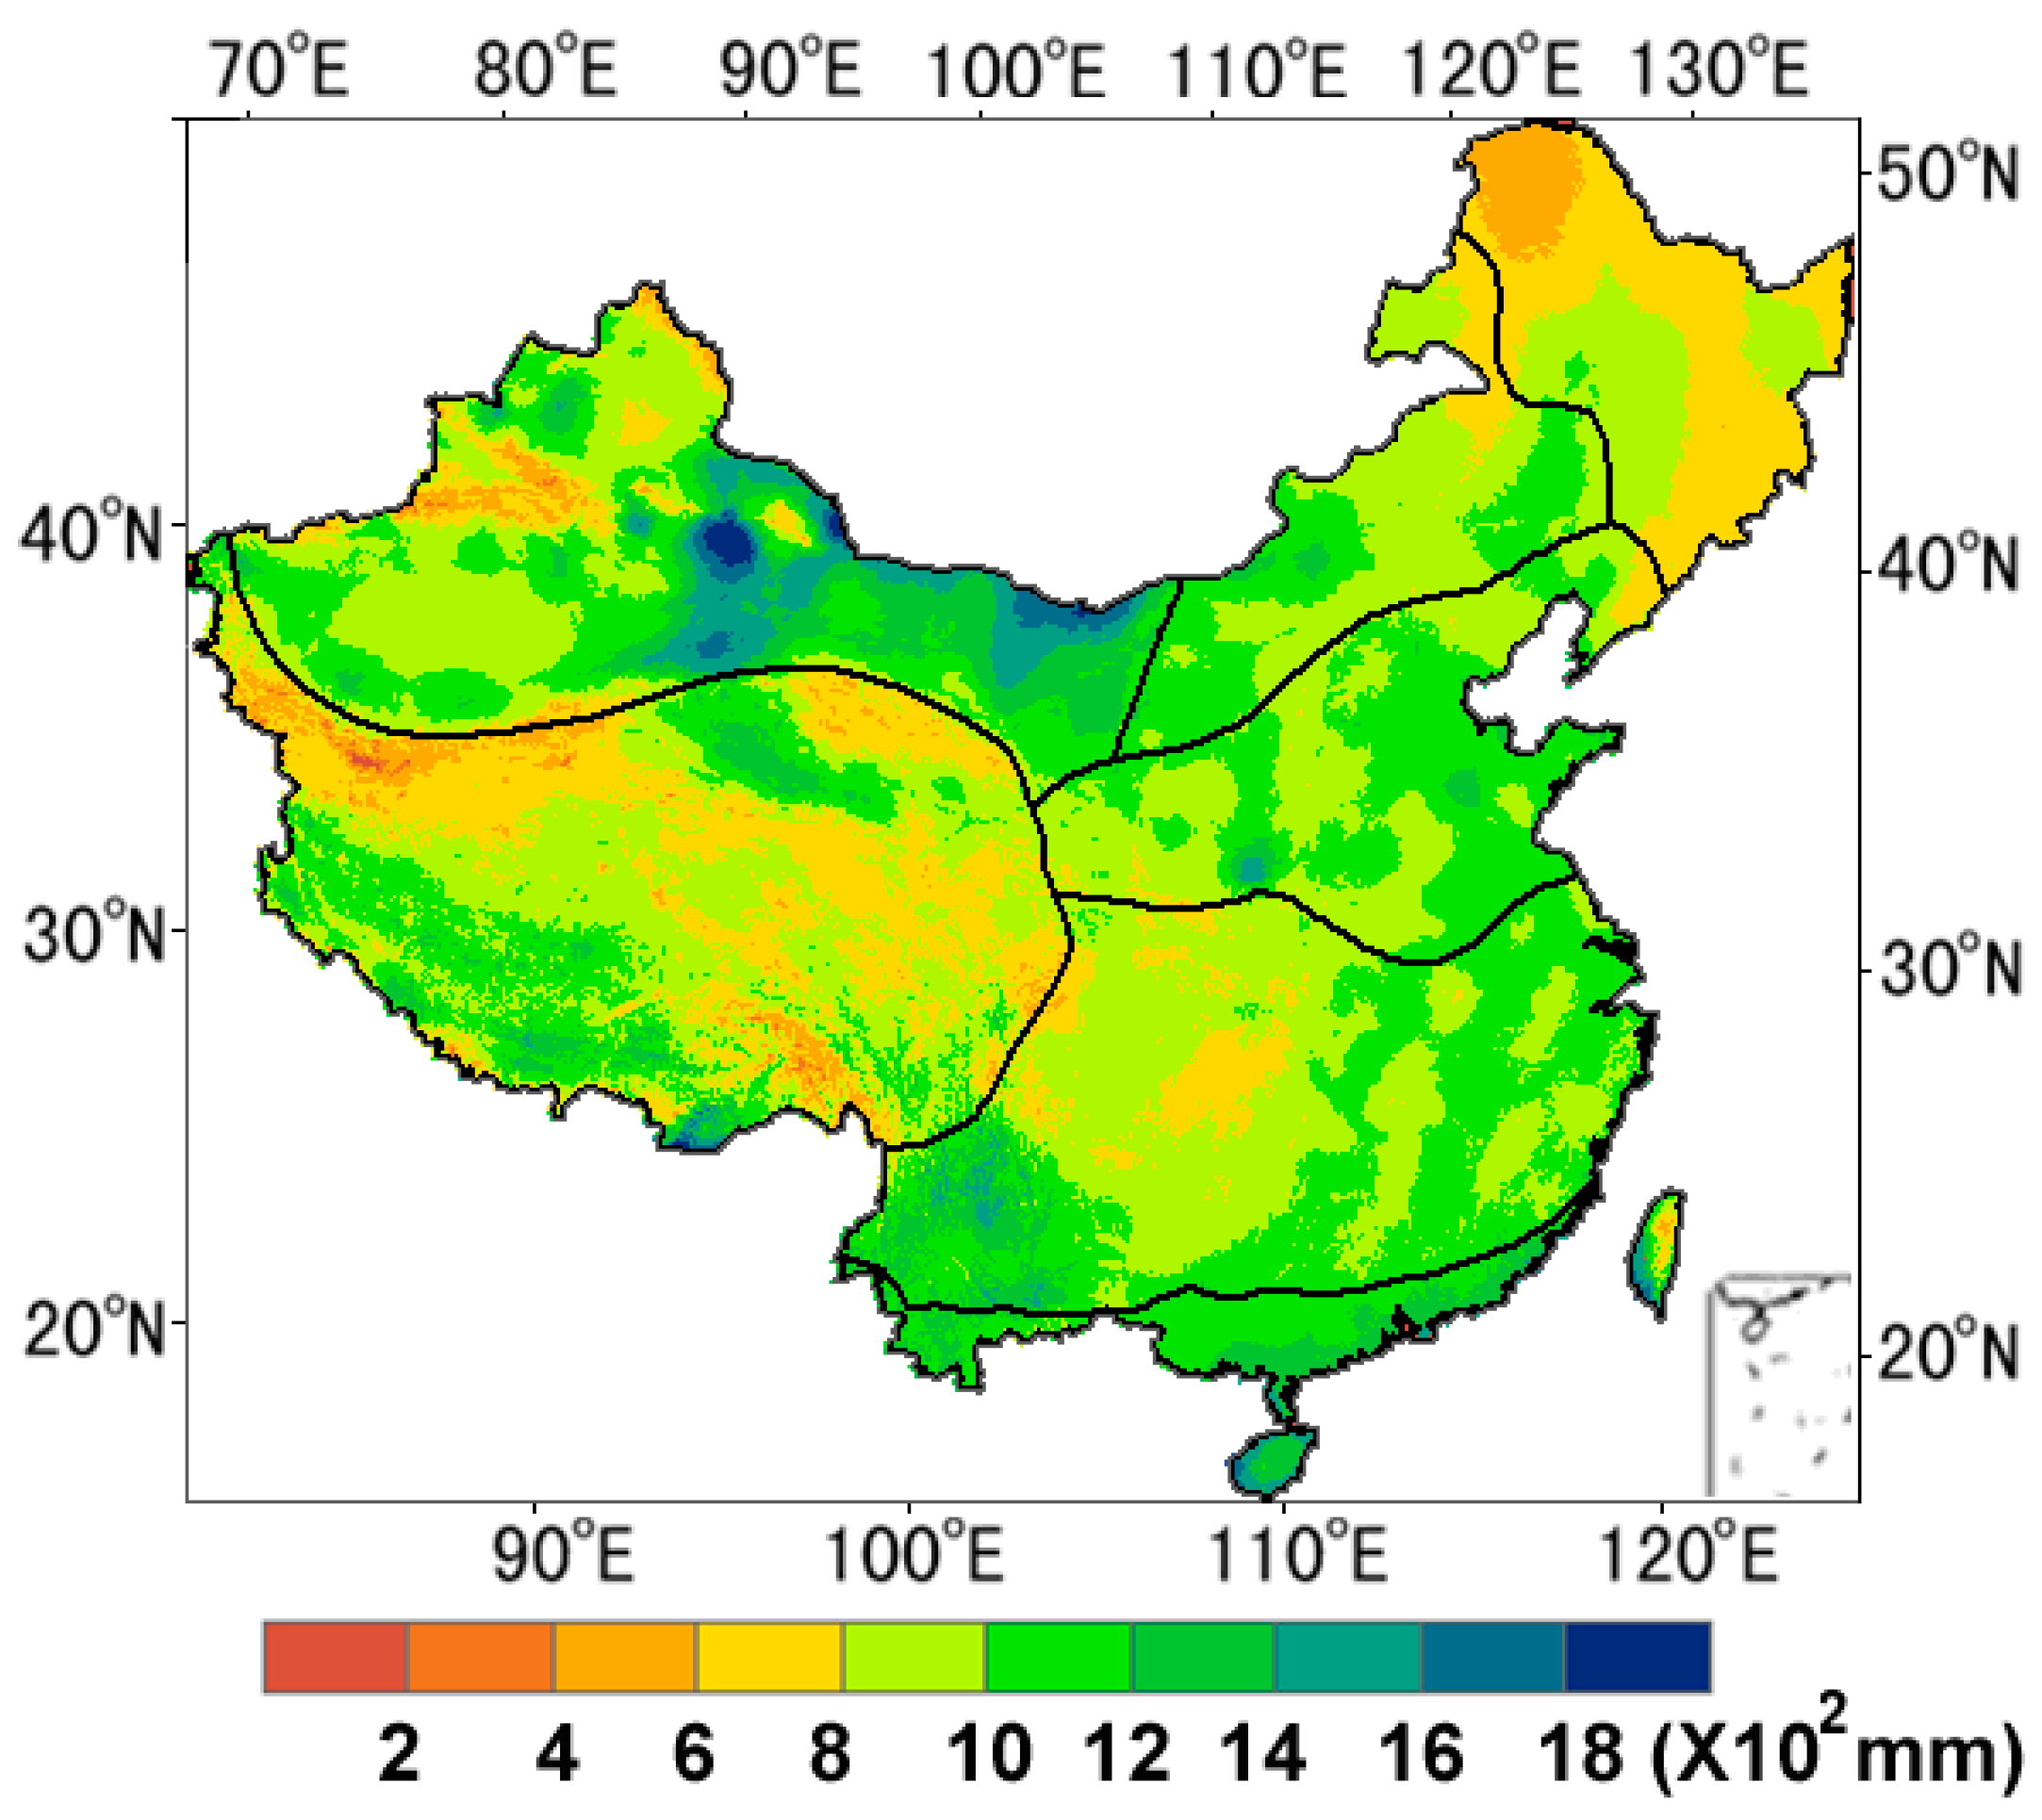
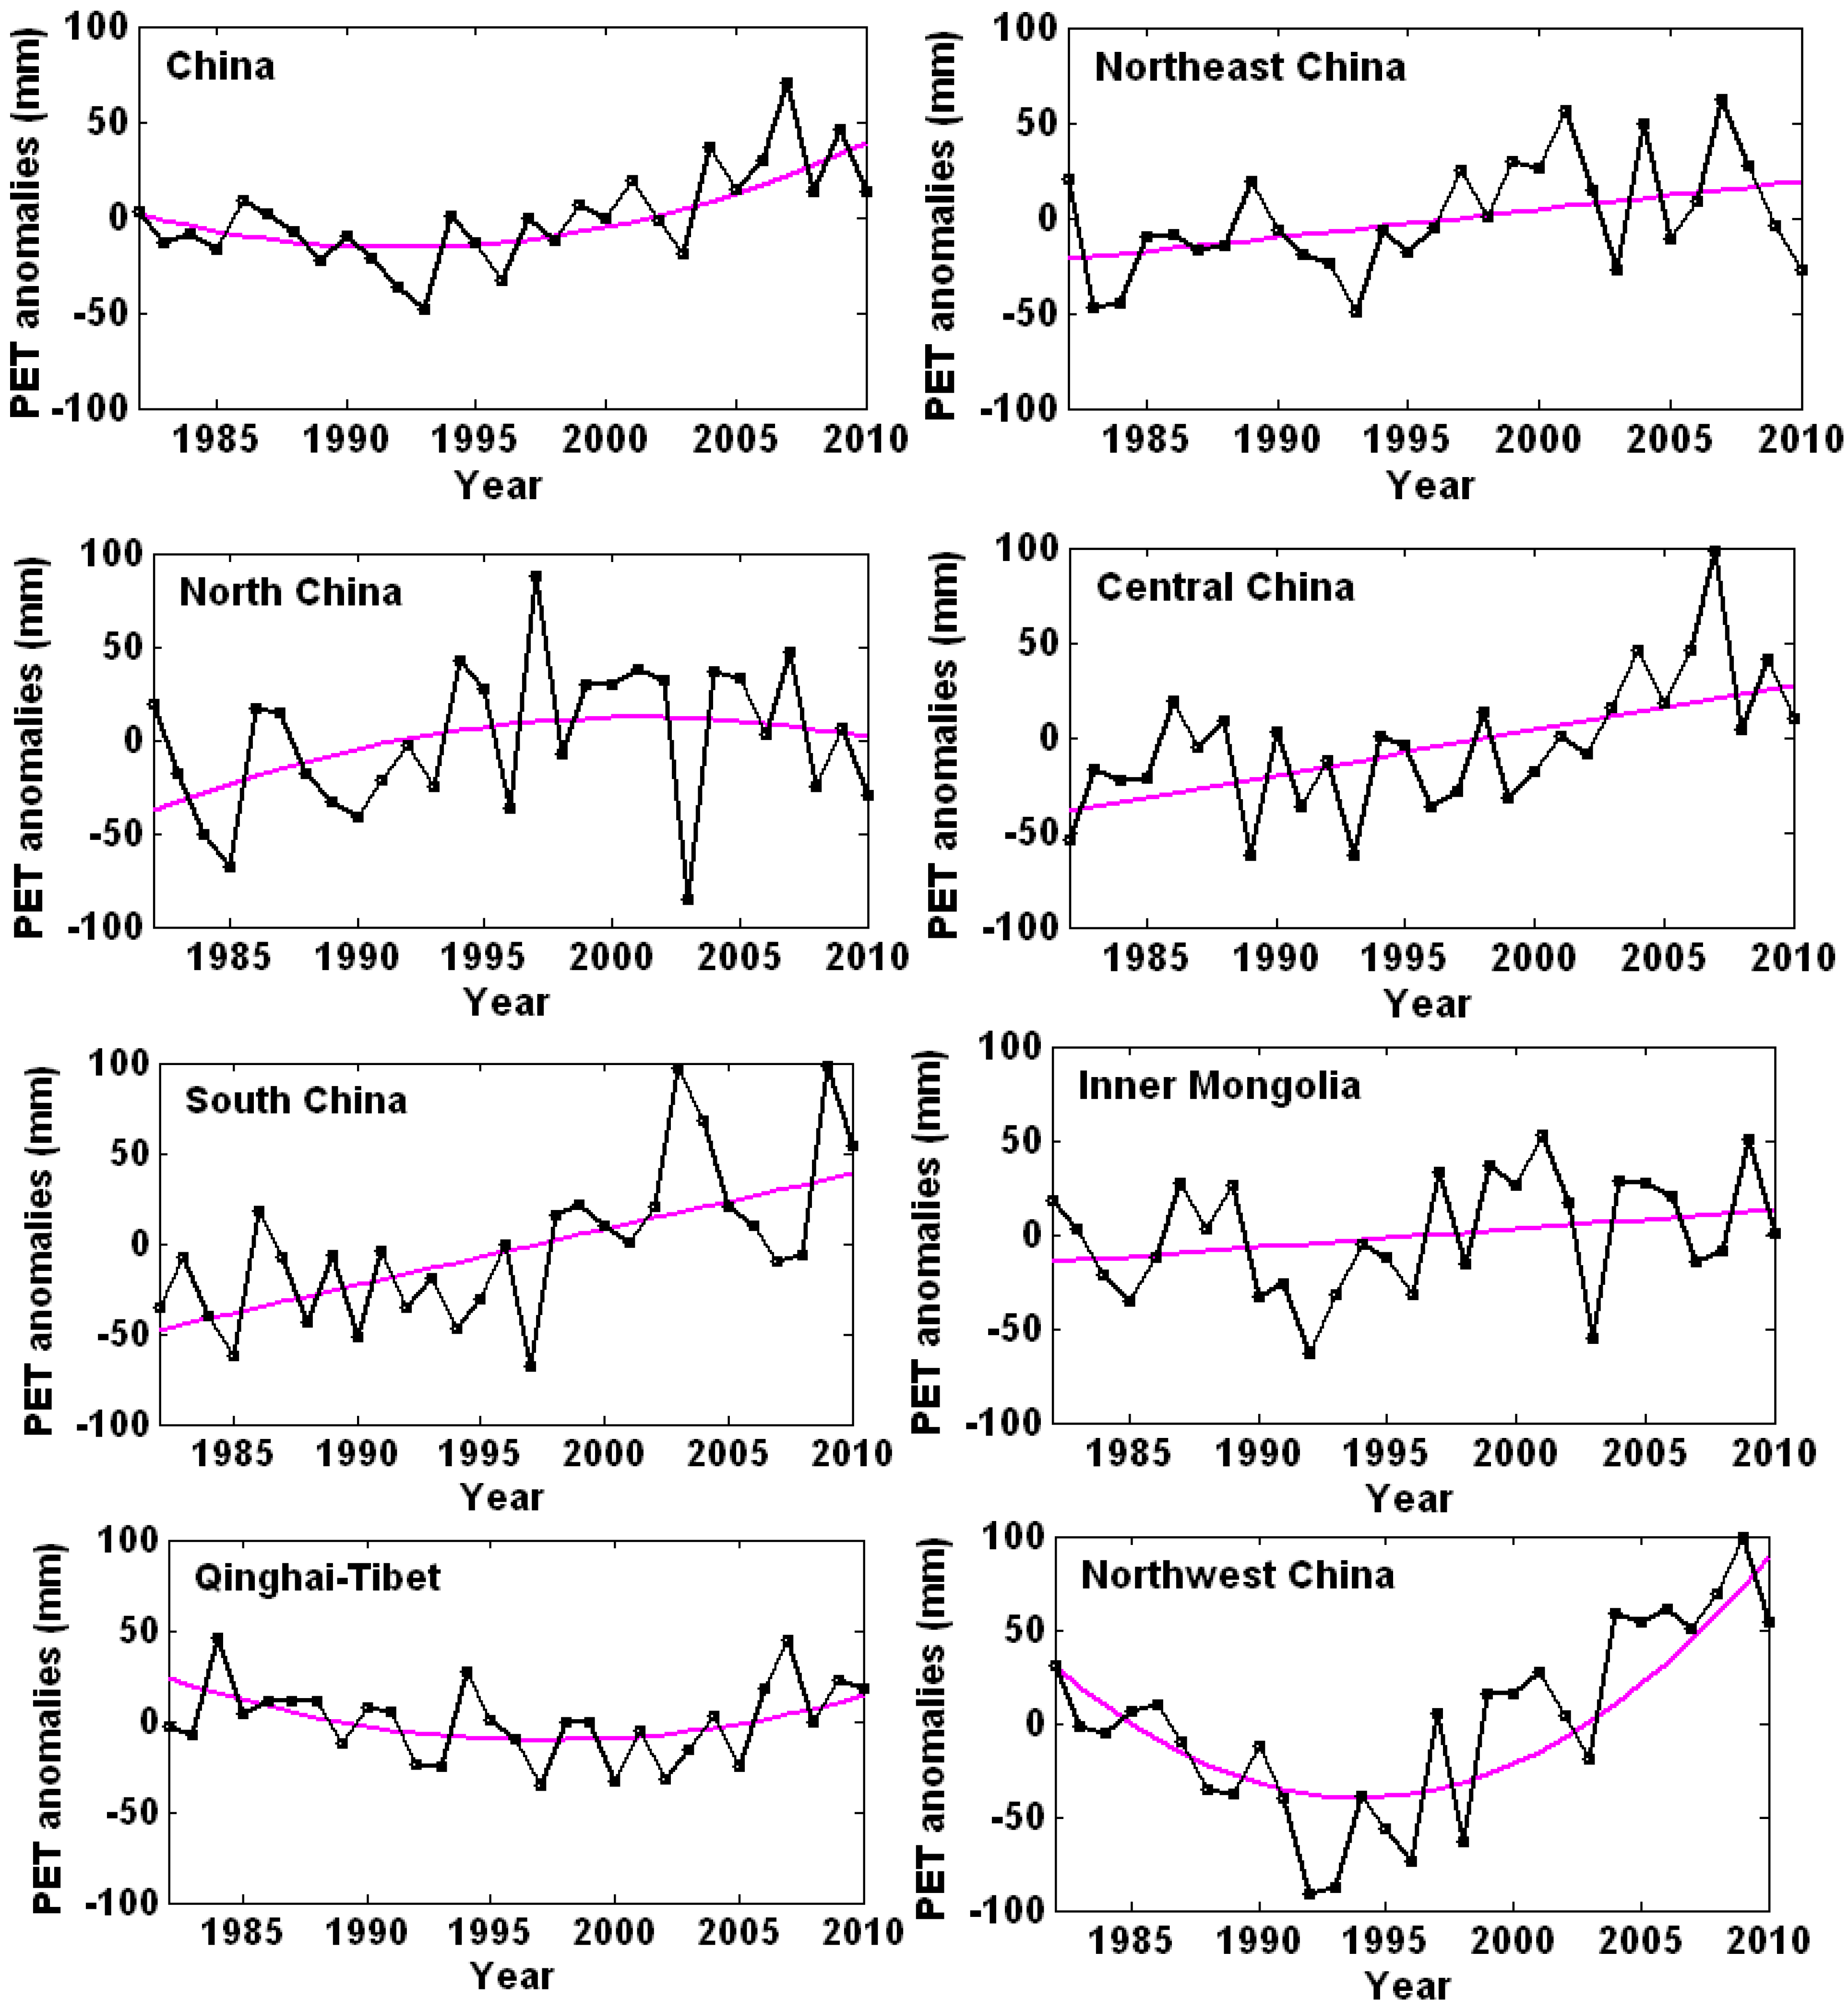
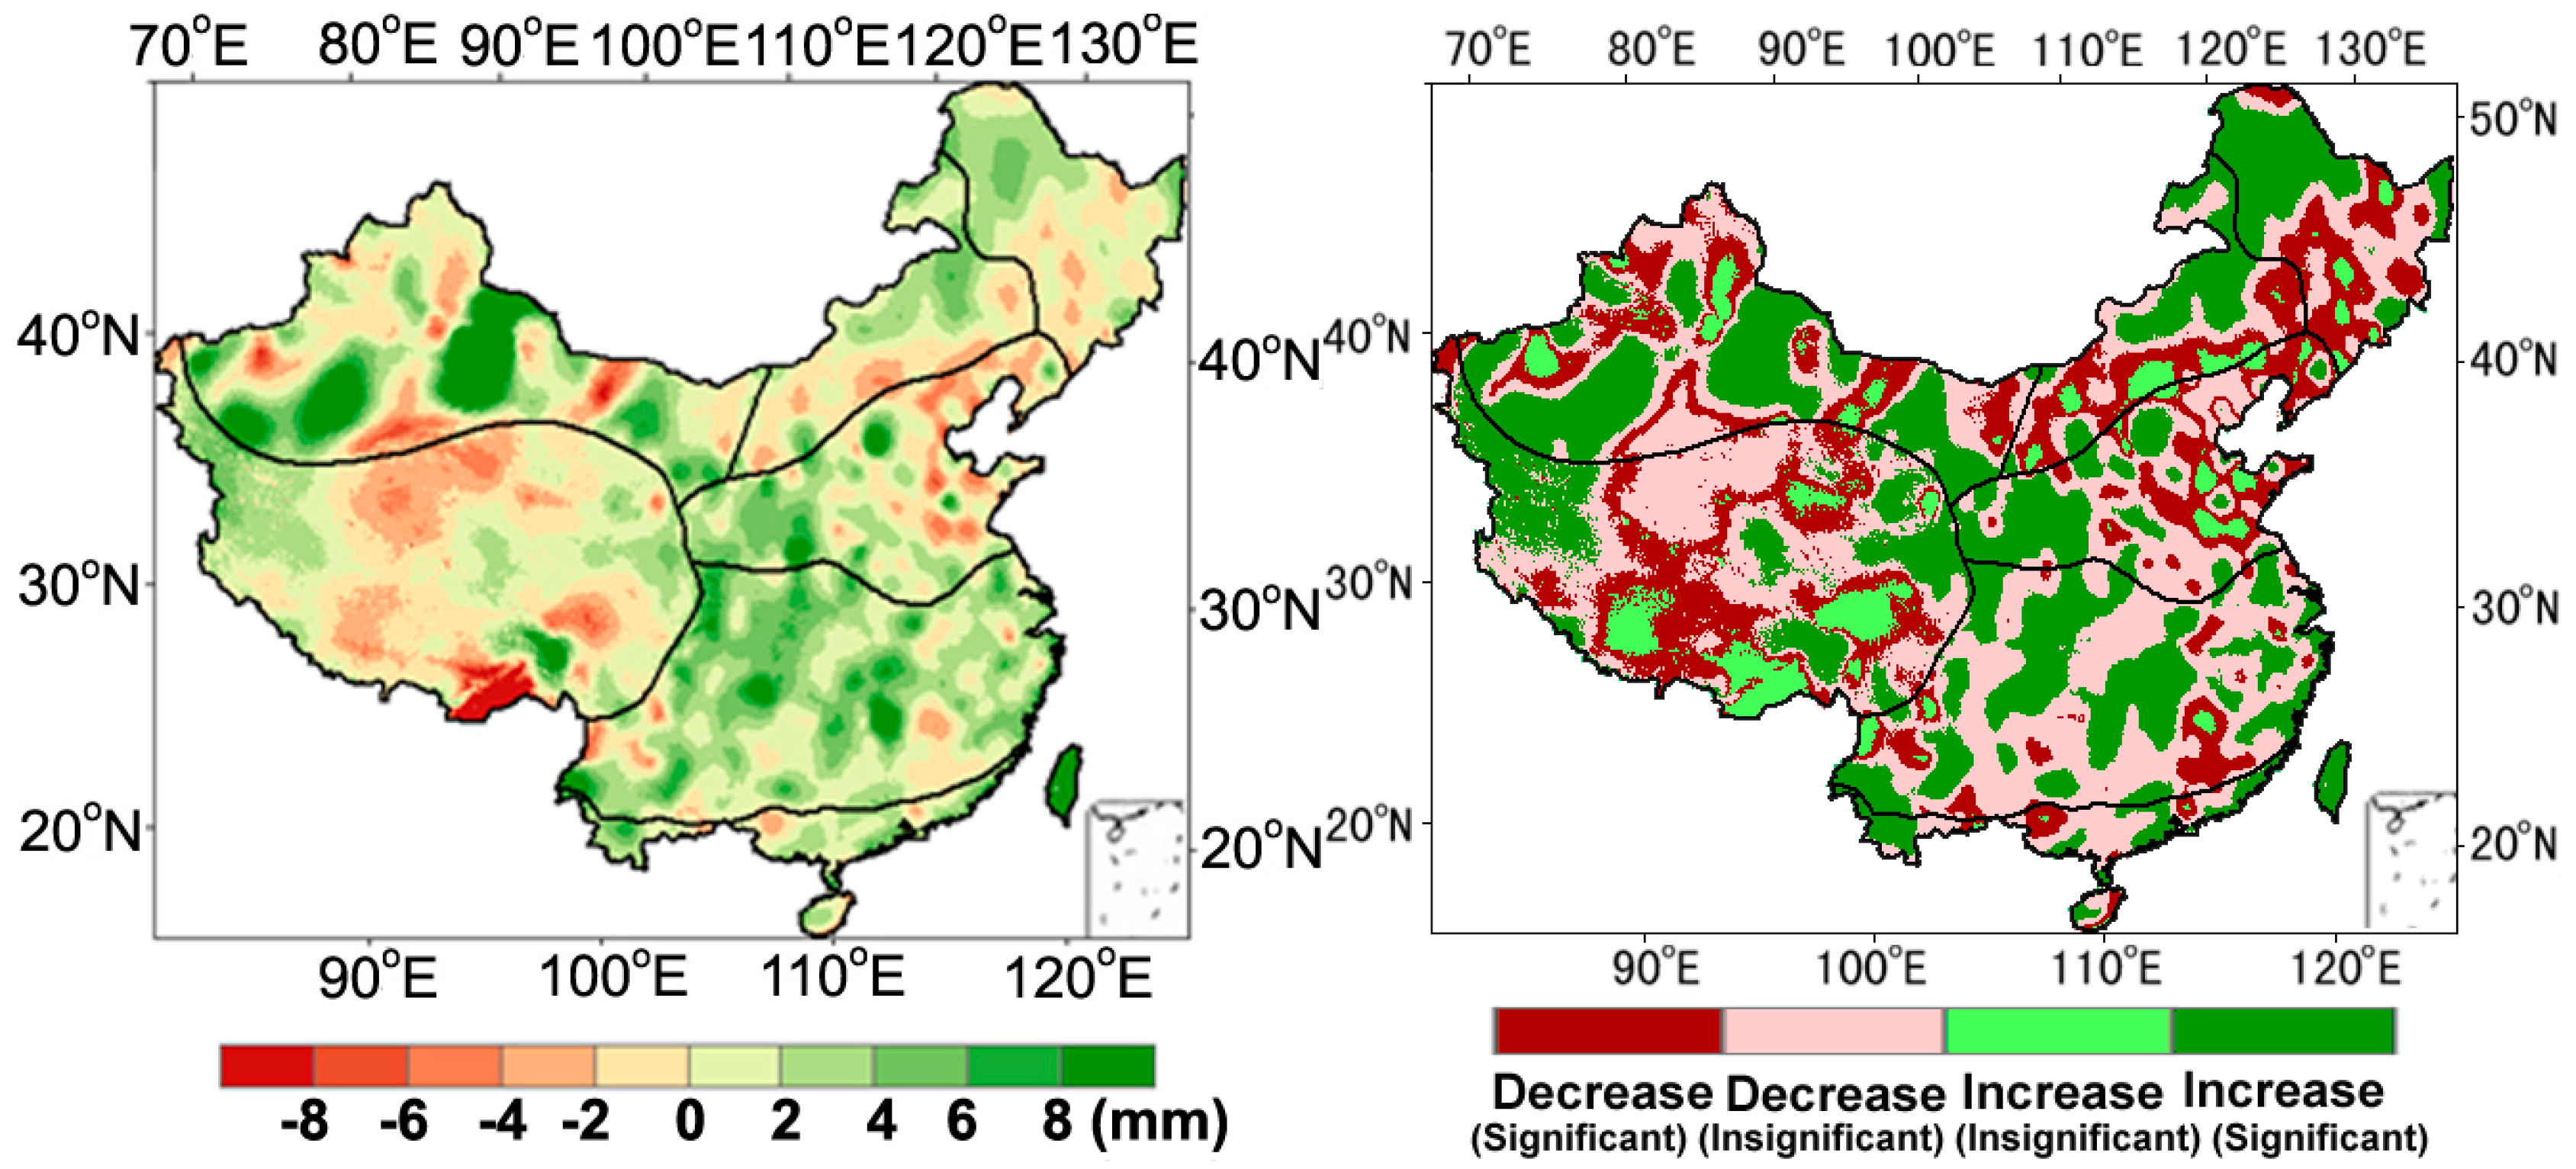
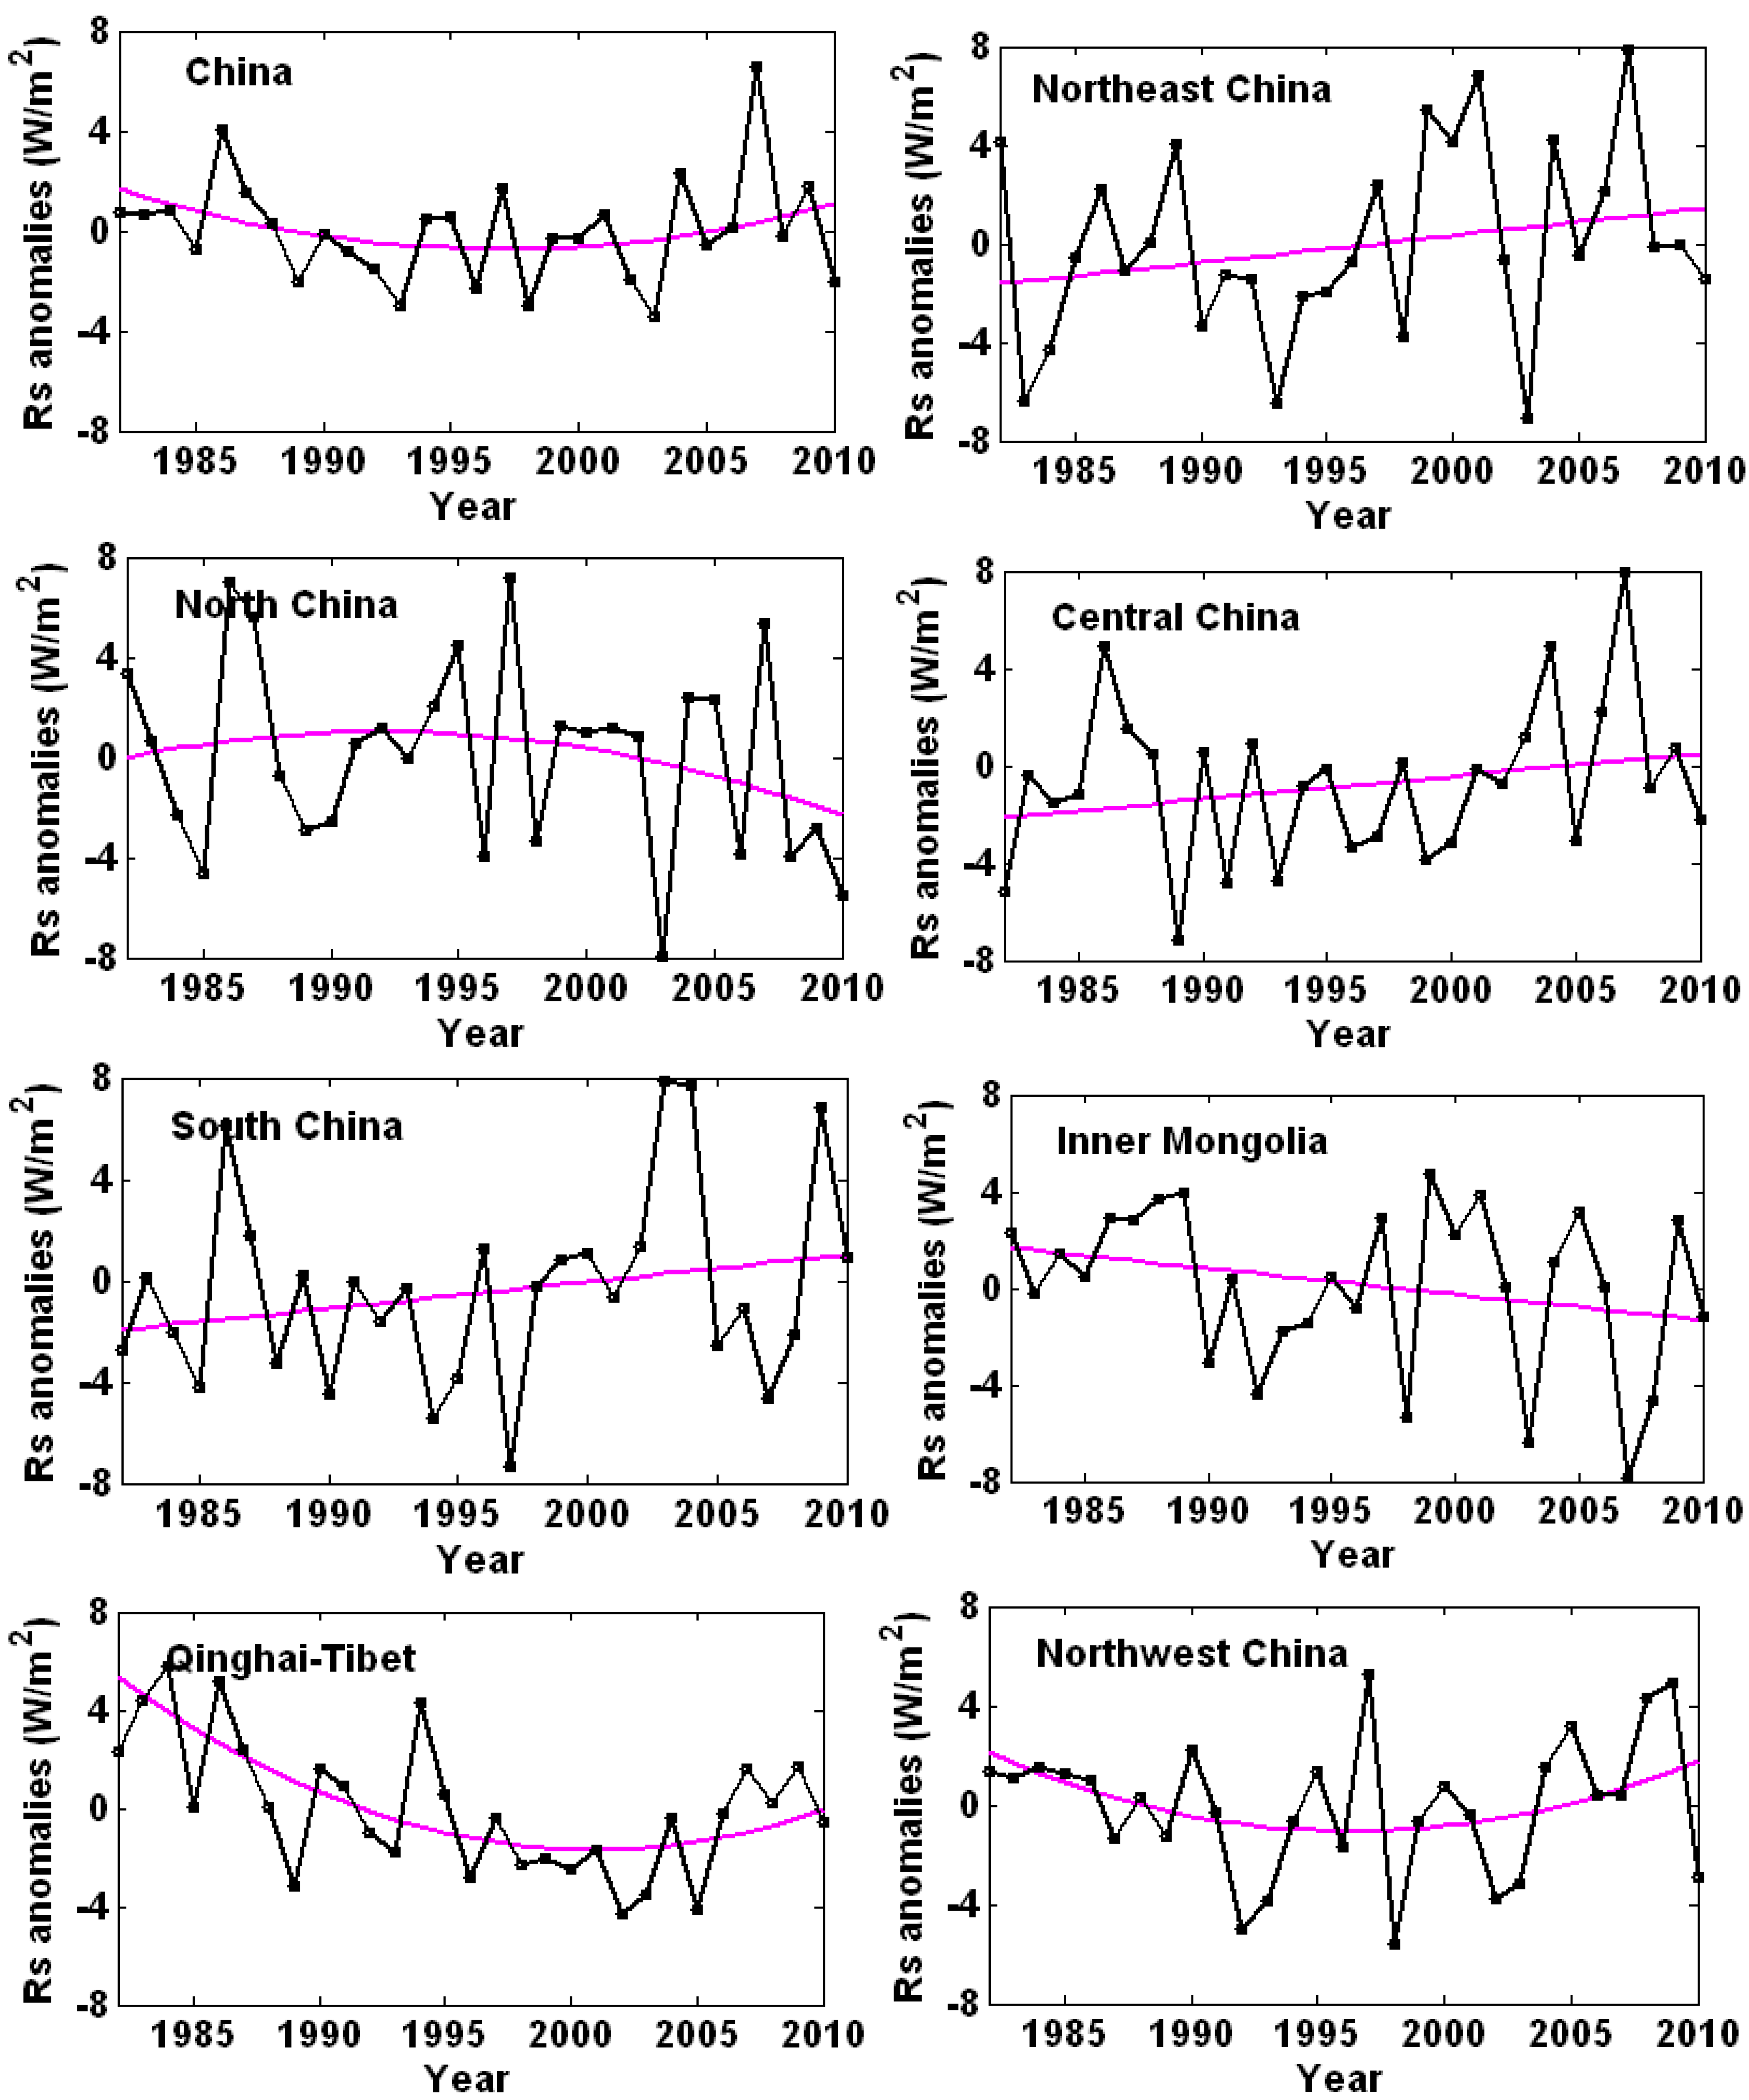
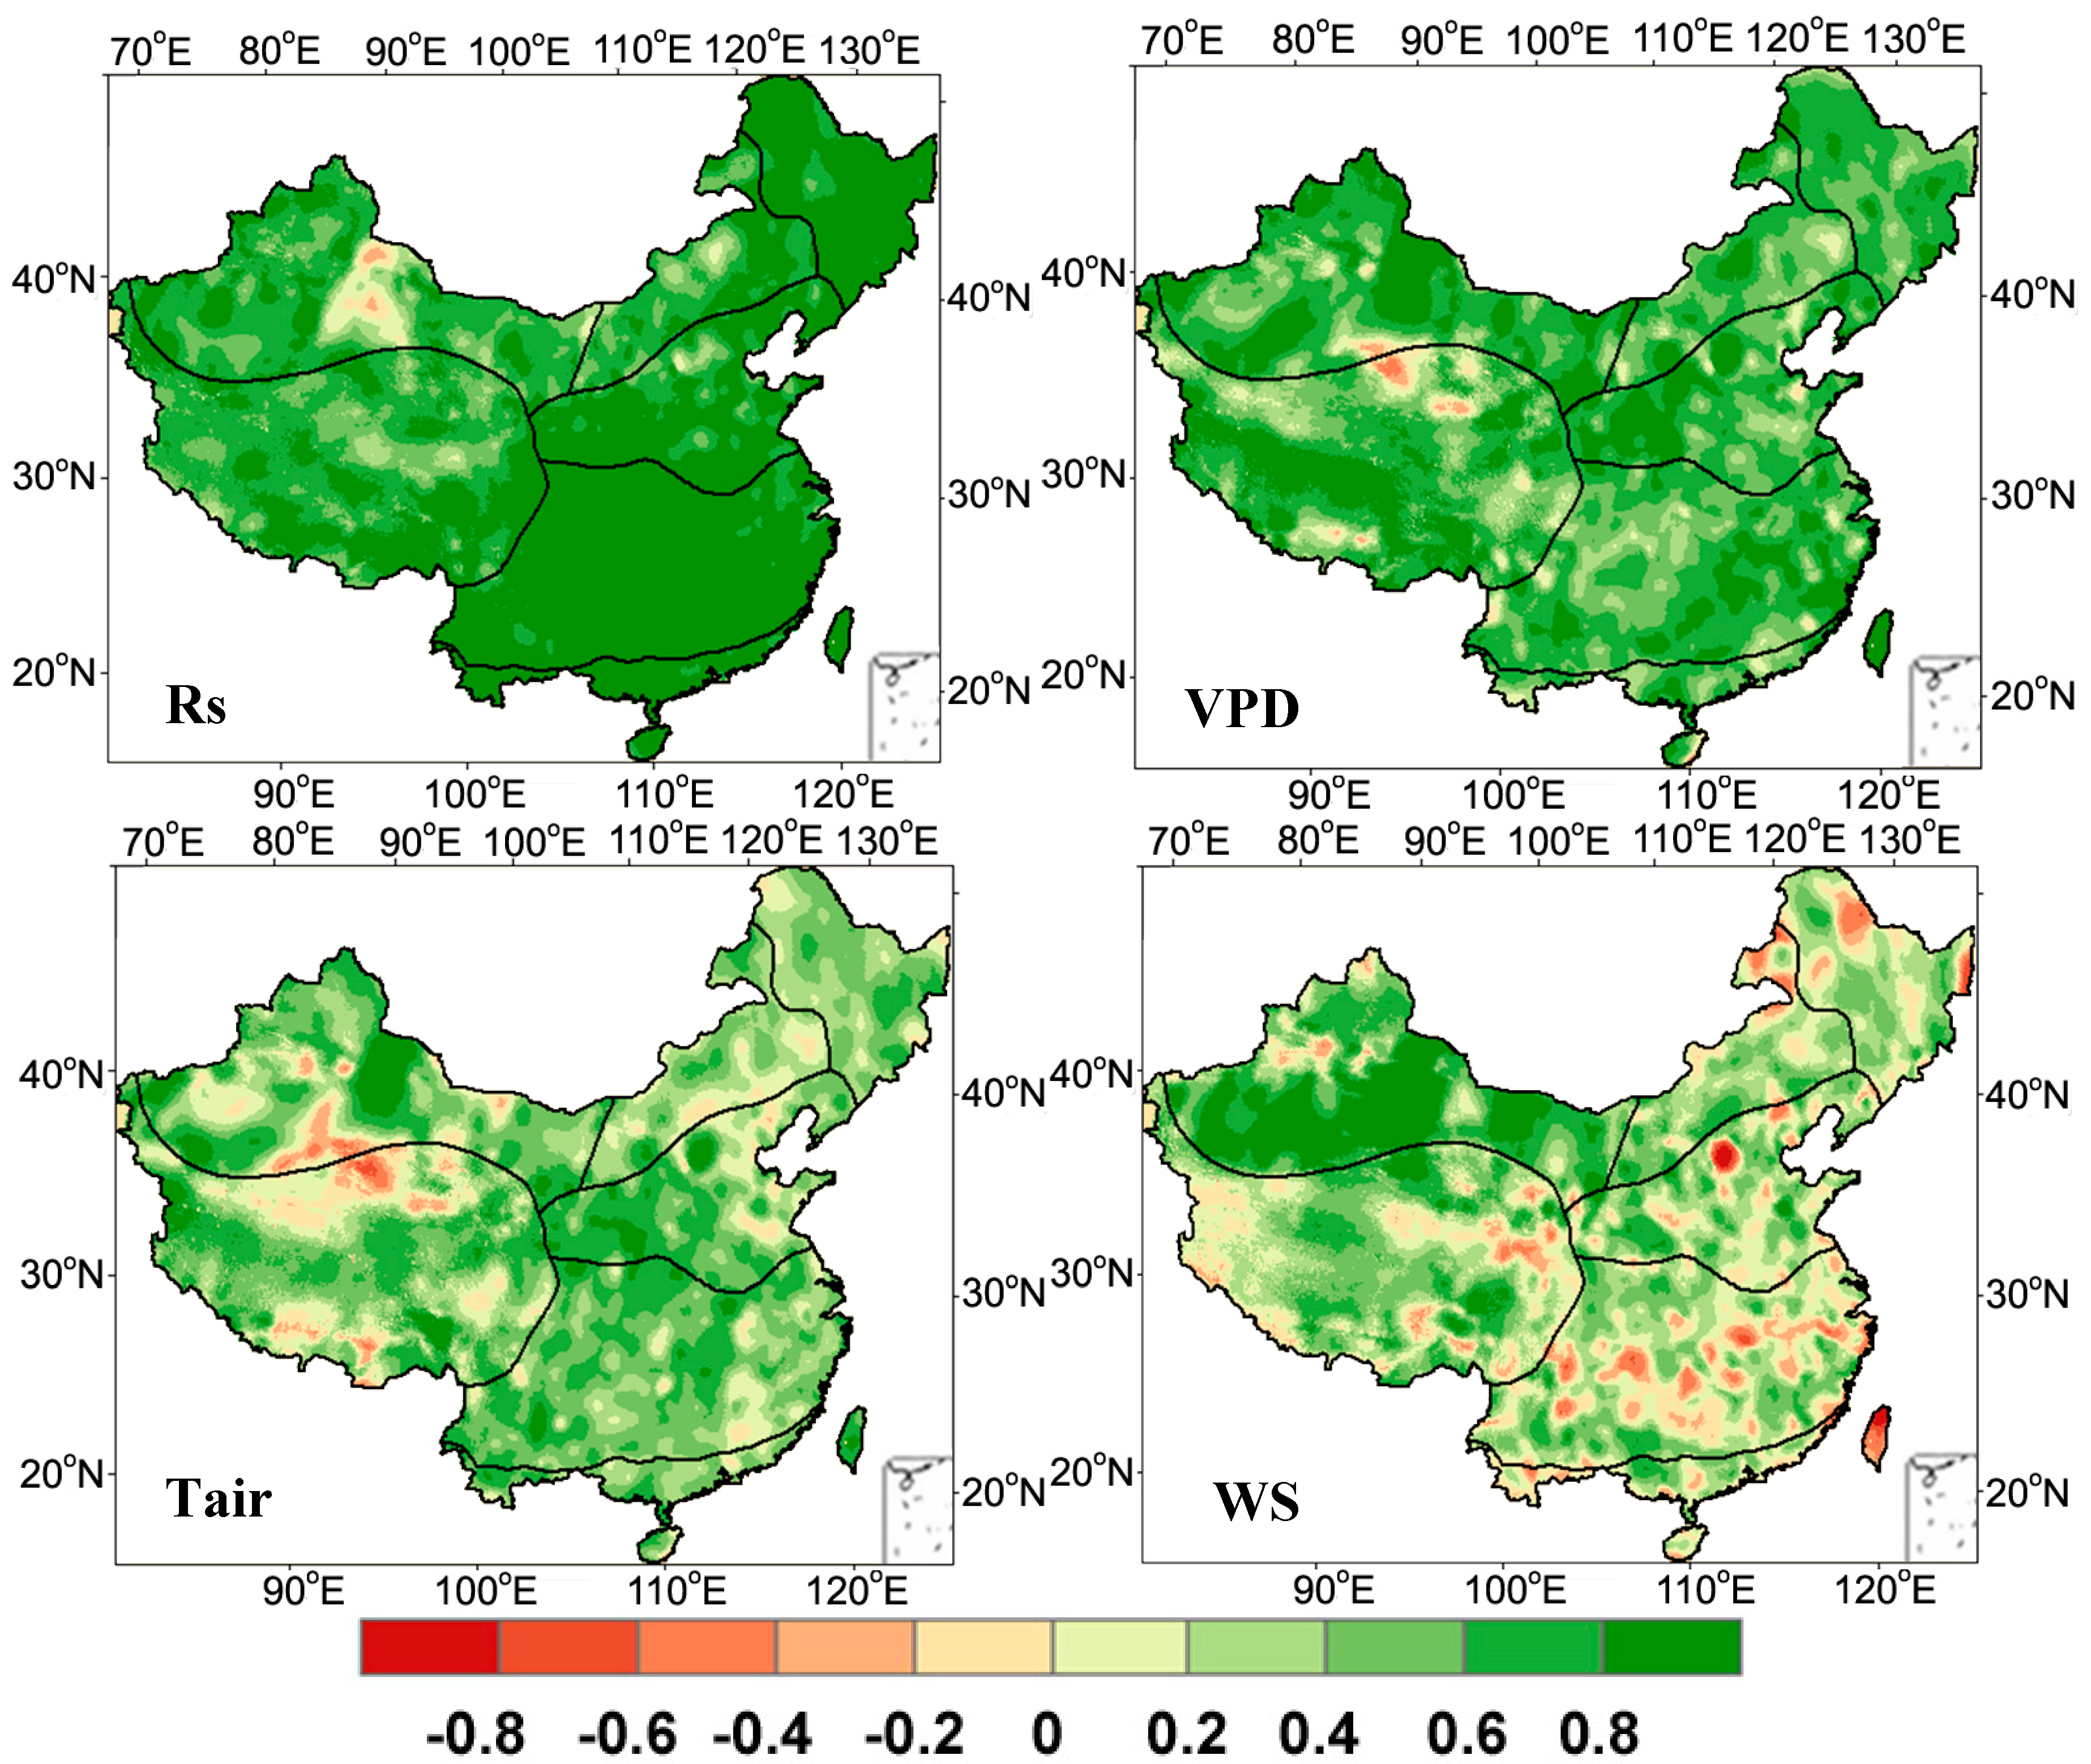
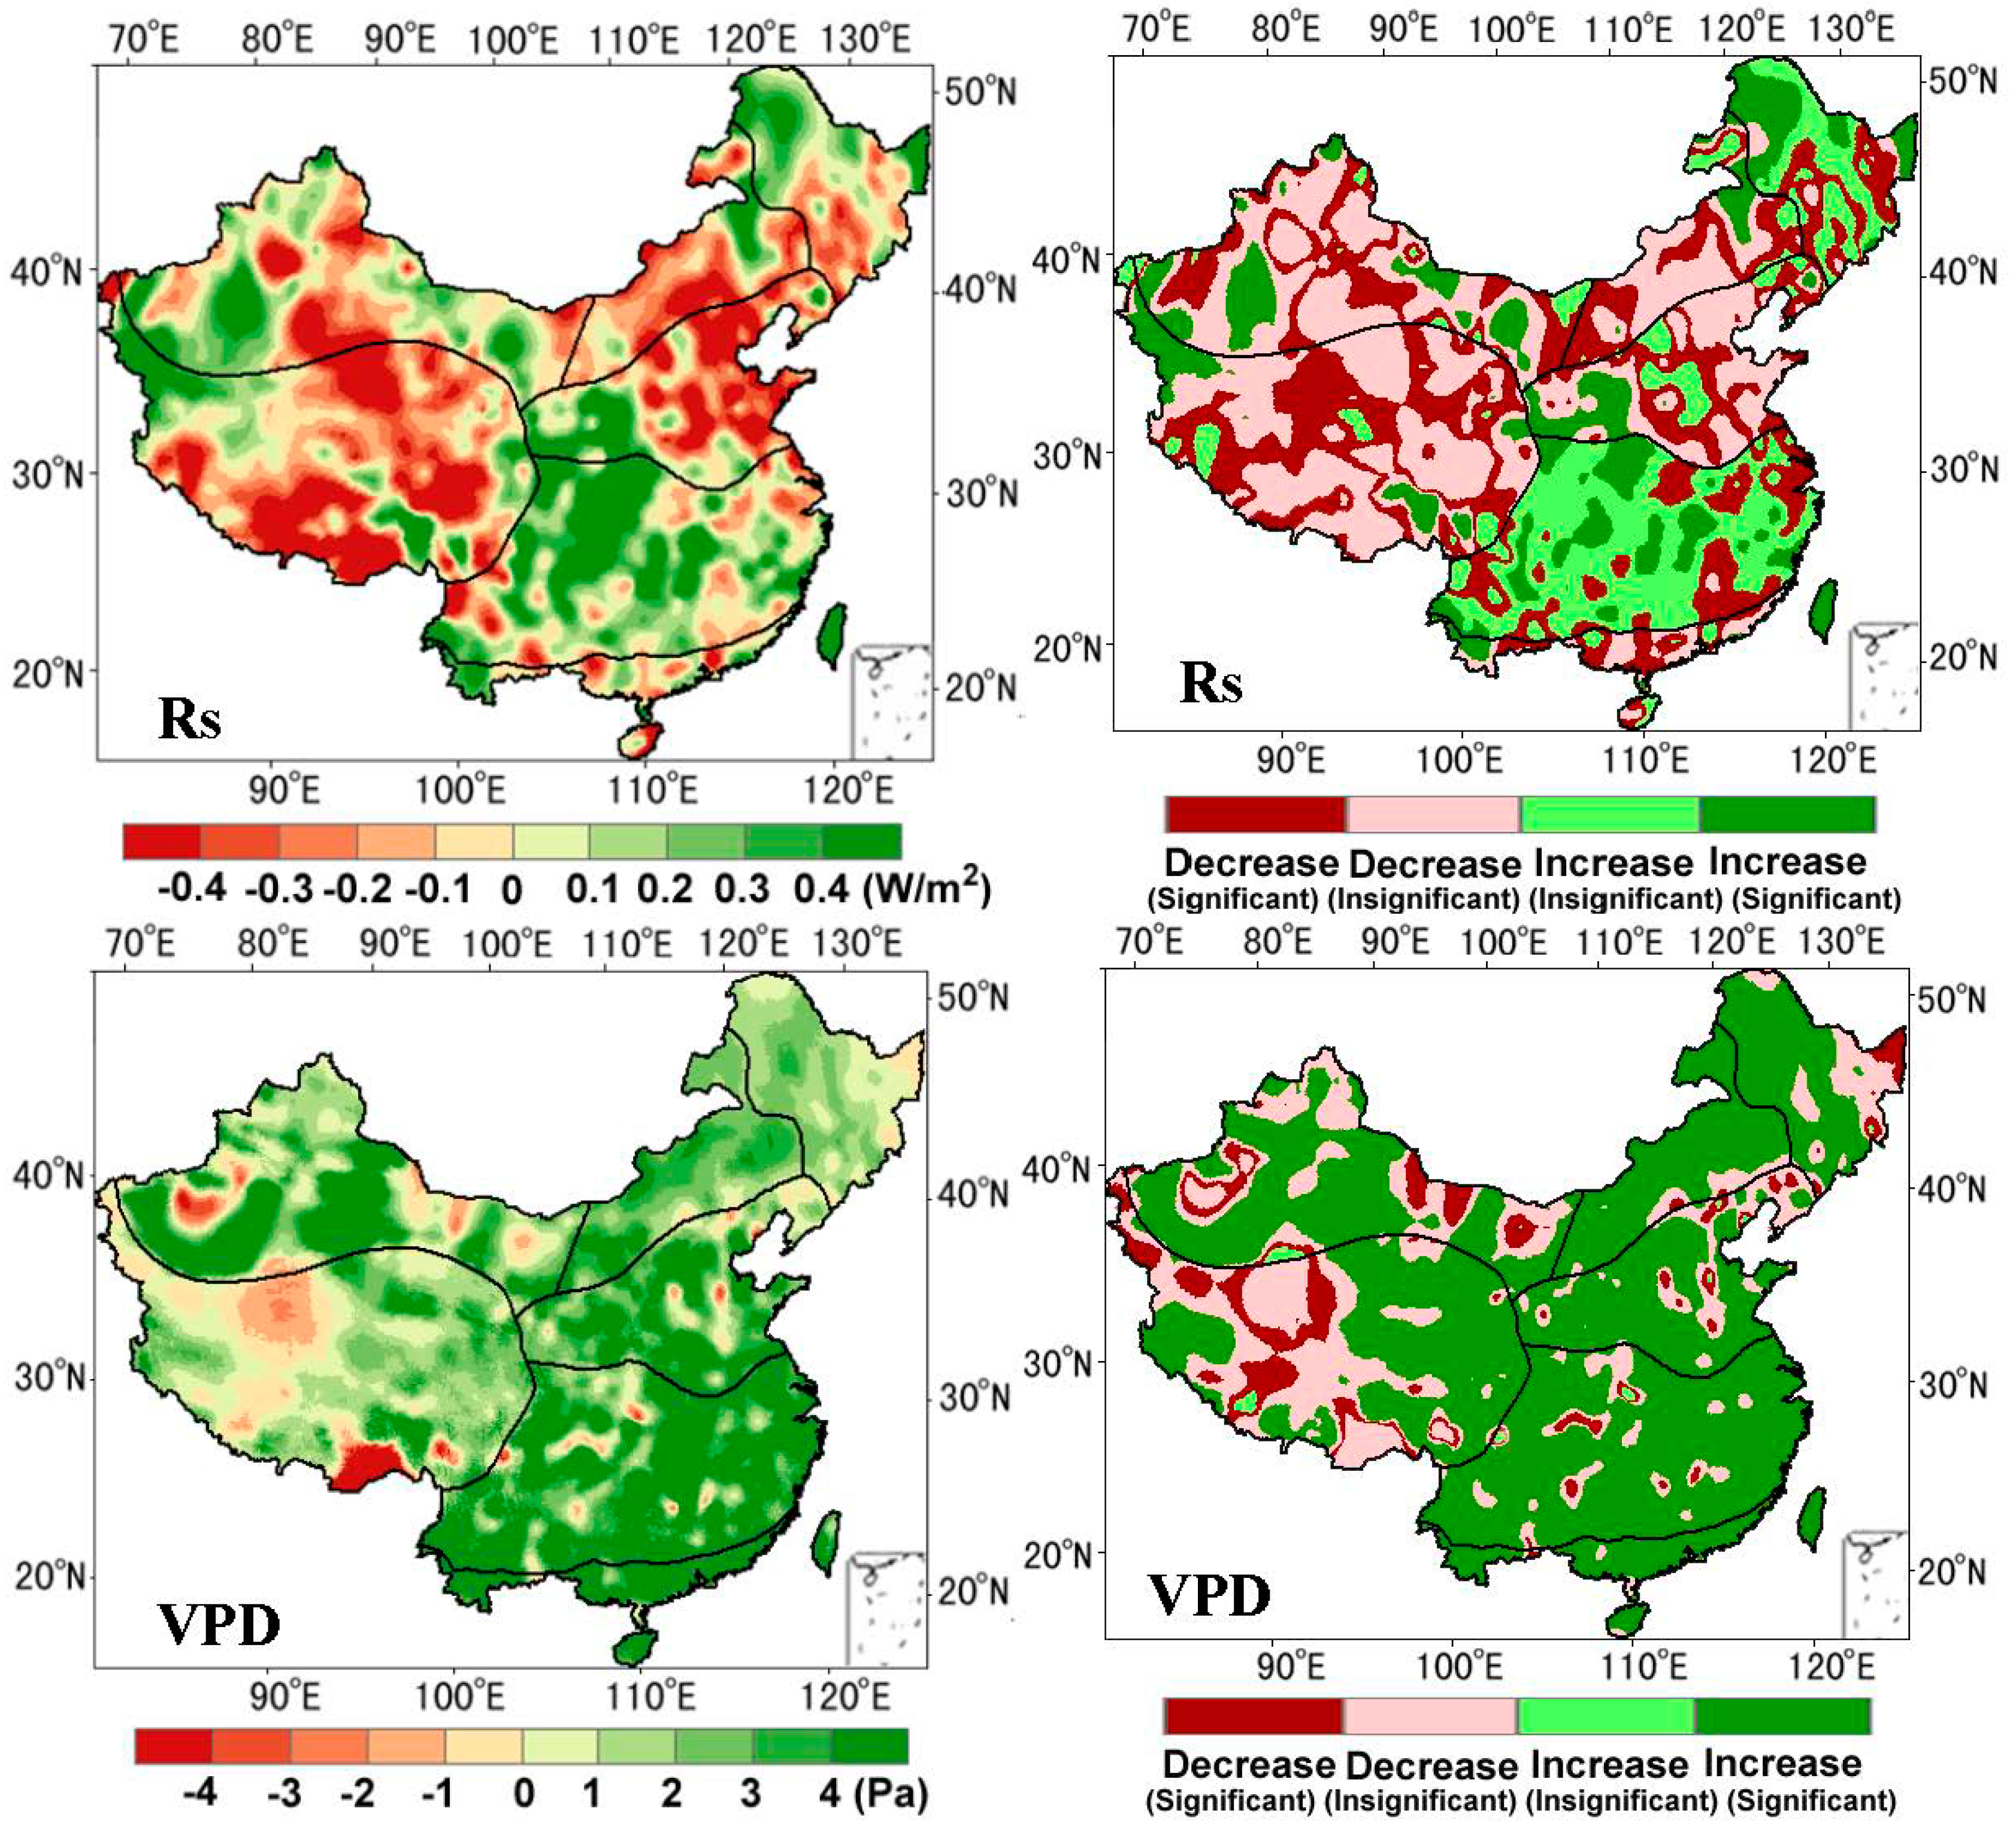
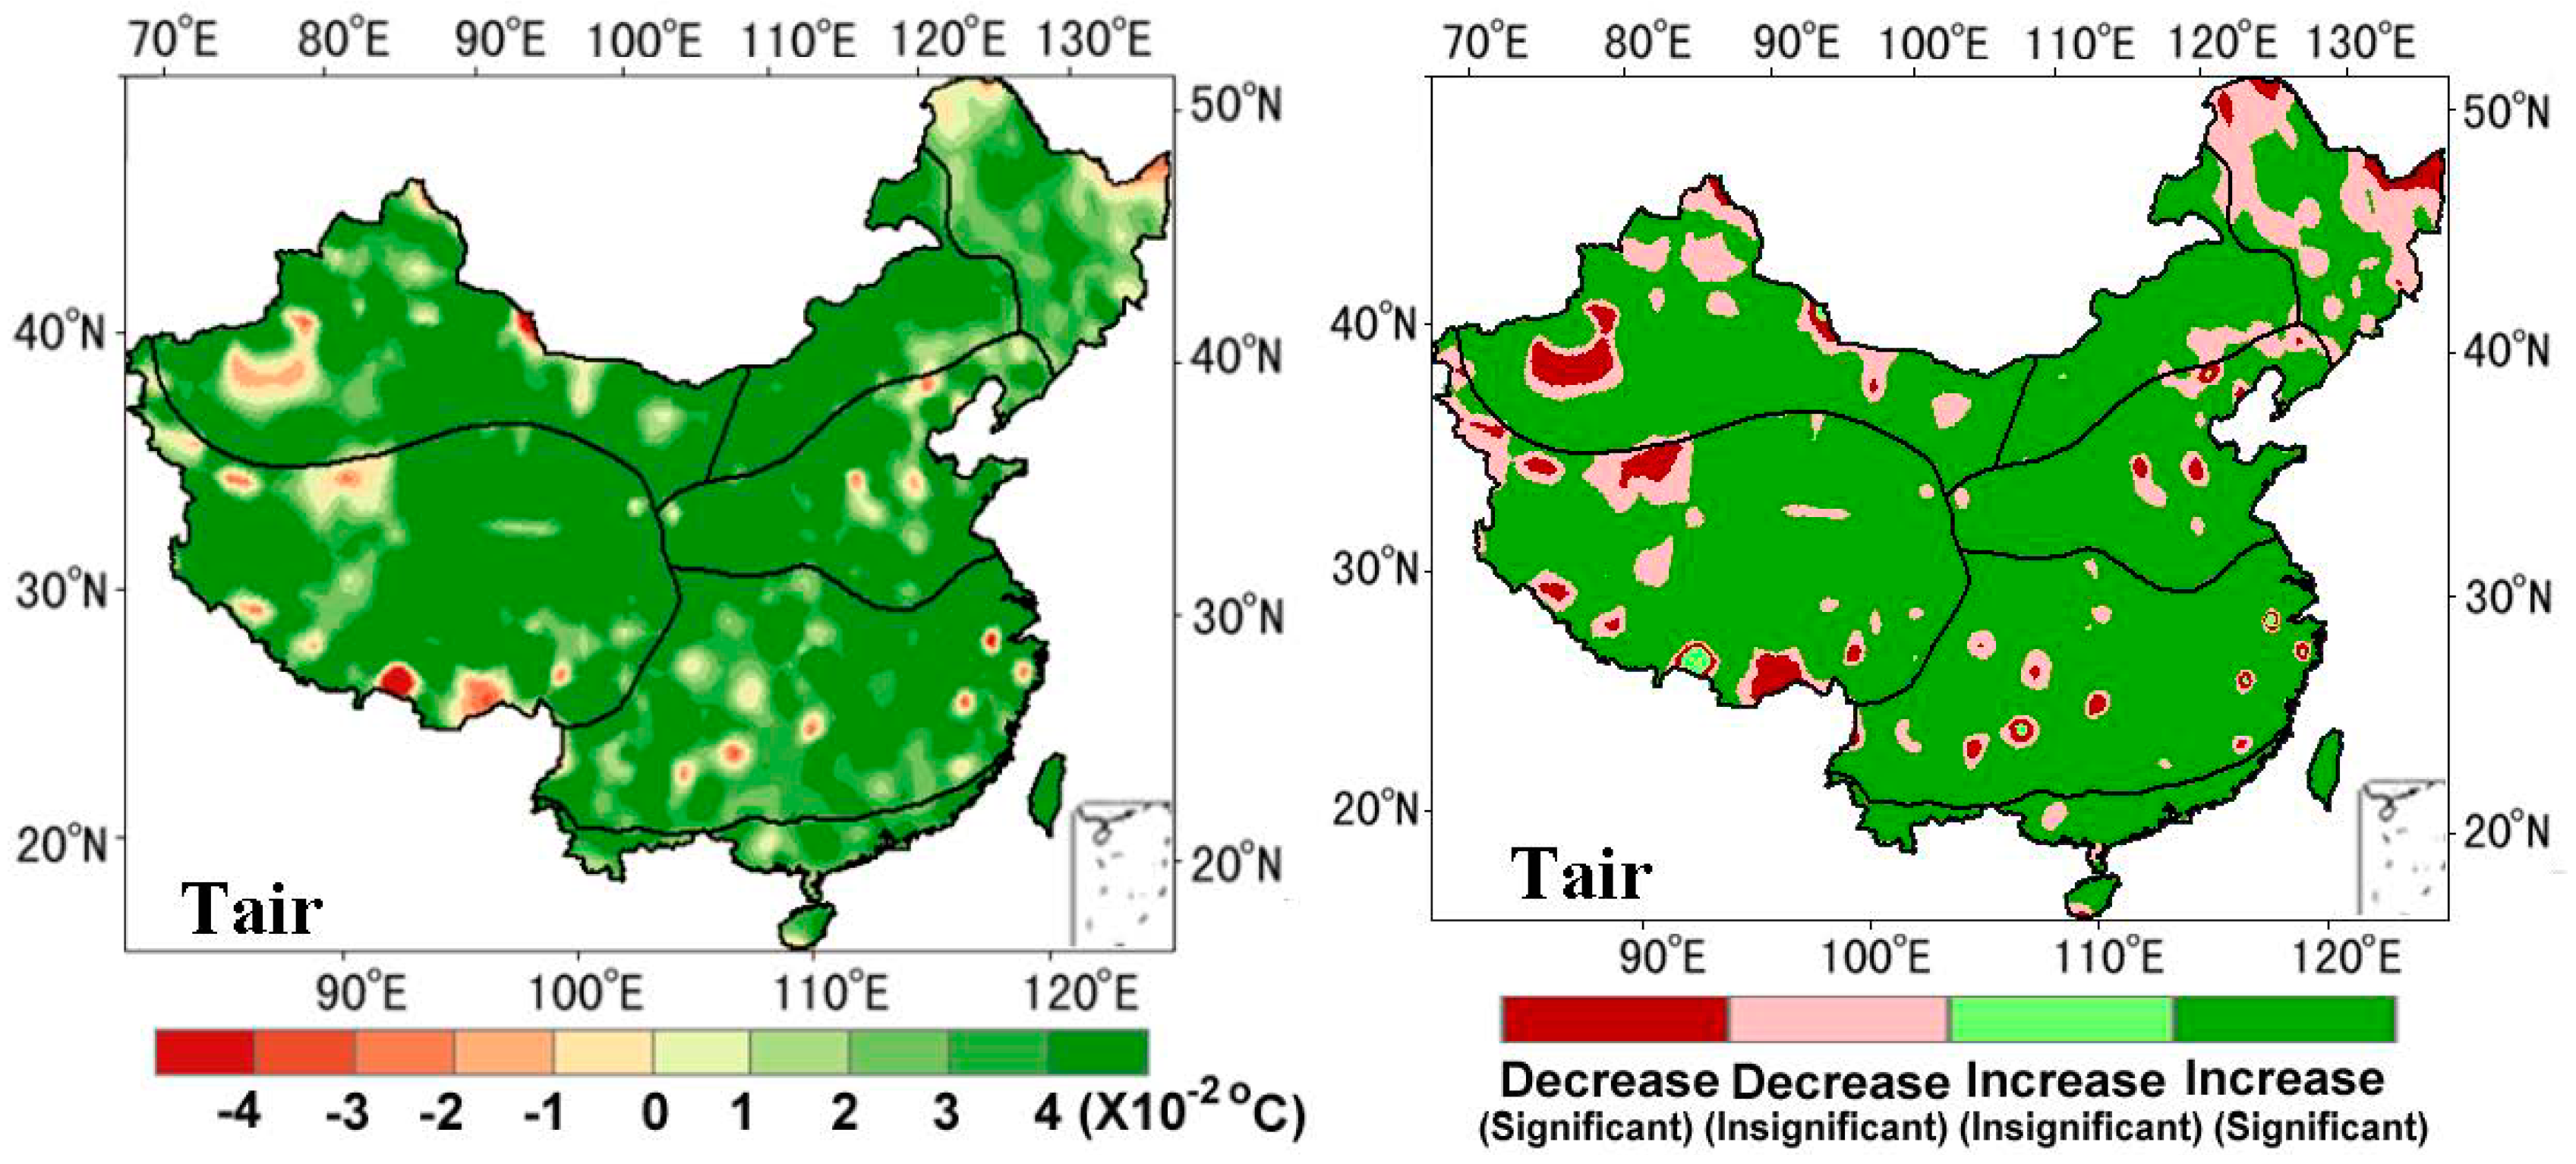
3.2. Spatial and Decadal Variability in PET of China

We calculated PET of China based on the FAO PM method and the gridded reanalysis meteorological datasets during 1982–2010. Figure 3 shows the spatial distribution of the average PET between 1982 and 2010 in China, which illustrates the strong regional variations corresponding to the climate patterns. Both Northwest arid regions and the sub-tropical forest regions show the highest annual PET, while Qinghai-Tibet and the Northeast areas within the cold-temperate regions show the lowest annual PET. Wang et al. [9] reported that in humid regions, there is sufficient water available to meet the evaporative demand and in arid and semi-arid regions, atmospheric evaporation demand is still higher due to the large VPD [39,40]. Our estimated PET in China from the gridded reanalysis meteorological datasets and GIMMIS-NDVI product after removal of the mean annual cycle show that the PET has decreased on average by 3.3 mm per year (p < 0.05) over the entire China during 1982–1993, while PET began to increase since 1994 by 3.4 mm per year (p < 0.05) (Figure 4). Figure 4 also illustrates that PET trends have decreased from 1982 through 1993 and reversed after 1994 in both Northwest China and Qinghai-Tibet regions. This change may be mainly caused by the variations in Rs and VPD, which lead to the reduction in PET and terrestrial net primary production [9,40,41]. In other regions, PET tends to slight increasing trends of less than 3mm per year (p > 0.05), which is similar to the previously documented increasing trend in PET over Northern China, as reported by Zhao et al. [14].
Figure 2. Comparison of the multiyear (1982–2010) averaged annual potential evapotranspiration (PET) estimated using meteorological observations of 752 stations in China and the corresponding PET calculated from reanalysis datasets in this study.
Atmosphere 05 00737 g002
Figure 3. Map of multiyear (1982–2010) averaged annual PET.
Atmosphere 05 00737 g003
Figure 4. Regional averaged annual PET anomalies. Pink lines represent the linear and second-order least-squares fit trends in the PET calculated using the gridded reanalysis meteorological datasets.
Atmosphere 05 00737 g004
The spatial pattern of the linear trend in PET of China was examined using the gridded reanalysis meteorological datasets and GIMMIS-NDVI product. Figure 5 shows the substantial spatial and temporal variation in PET. A widely significant increasing trend in PET appears during 1982–2010 in Northwest China, Central China, Northeast China and South China, which is consistent with previous studies [2,9,23]. In contrast, there are no obvious variations in PET in North China, Inner Mongolia and Qinghai-Tibet region. We found that the PET substantially increased in arid areas while the few changes in the Qinghai-Tibet region may be caused by increased precipitation in the area during the study period [9,42,43]. Similarly, Yin et al. [43] also found that there are obvious regional differences in annual average PET, in which low PET was distributed in the Northeast, the eastern Tibetan Plateau and Southwest China, and high values occurred across Northwest and South China. In general, the individual datasets, such as reanalysis datasets and satellite data, contain large errors compared with ground-observations [44,45,46,47]. Fortunately, our study highlights the accuracy and the continuity of spatial distribution of PET in China by driving gridded reanalysis meteorological datasets as inputs because this gridded dataset has reduced the uncertainty of the individual datasets by merging reanalysis data, GEWEX-SRB products, GLDAS data and ground-observed meteorological data [30].
Figure 5. Maps of the linear trend in PET calculated from the gridded analysis meteorological datasets. The trends are classified into four categories according to statistical linear trend analysis: Significant increase (p < 0.05), significant decrease (p < 0.05), insignificant increase (p < 0.05) and insignificant decrease (p < 0.05).
Atmosphere 05 00737 g005
Table 1. Summary of estimated PET in China and regions of China. Adapted from McVicar et al. [22]: Their Table 6.
Study NumberStudy AreaSites NumbersTime PeriodTrend (mm/Year)Reference
1China65 sites1954–1993−2.30Thomas [23]
2China603 sites1971–2008−0.66Yin et al. [43]
3China580 sites1951–2000−0.5Chen et al. [48]
4China, Haihe River Basin34 sites1950–2007−1.00Tang et al. [49]
5China, Yangtze River Basin150 sites1960–2000−1.24Xu et al. [16]
6China, Qinghai-Tibet Plateau75 sites1971–2004−1.49Zhang et al. [50]
Previous substantial studies documented that the 1990s mark a transition period in which the trend in PET of China increases but the overall trend in PET slightly decreases during 1951–2010 [16,23,43,48,49,50] (Table 1). Thomas [23] used the Penman-Monteith PET equation and meteorological observations from 65 sites in China to estimate PET and found that PET of China has decreased in all seasons from 1954 through 1993. Yin et al. [43] also reported that in general, annual average PET of China decreased in the period 1971–2008, but increased since the 1990s. Similarly, as shown in Table 1, other studies focused on regional PET of China and also pointed out that PET gradually had decreased across the whole region since the 1960s. However, there is a slightly increasing trend from 1993. Our findings in this study also support previous conclusions. In contrast, in this study, we have focused the variations in PET of China since the 1980s and found that a slightly increasing trend in PET appears from 1982 through 2010 because the value of the averaged PET during 1960–1970 is the biggest, followed by that of during 2000–2010, while the value of the averaged PET during 1980–1990 is the smallest.
Figure 6. Regional averaged annual Rs anomalies. Pink lines represent the linear and second-order least-squares fit trends in the Rs derived from the gridded reanalysis meteorological datasets.
Atmosphere 05 00737 g006
Figure 7. Regional averaged annual by vapor pressure deficit (VPD) anomalies. Pink lines represent the linear and second-order least-squares fits trends in the VPD derived from the gridded reanalysis meteorological datasets.
Atmosphere 05 00737 g007

3.3. Variations in Climatic Variables for Contributing to PET

PET represents the maximum evapotranspiration rate in response to forcing meteorological factors given an unlimited water supply [13,14,51,52]. According to the FAO PM method, the variations in Rs, VPD, Tair and WS all contribute to changes of the PET. The change of Rs contributes to the long-term variation of PET. The variations of PET over most regions of China (excluding Inner Mongolia) are almost consistent with Rs variations. From 1982 through 1993, Rs decreased significantly (p < 0.05) by 0.3 W/m2 and increased insignificantly (p > 0.05) by about 0.1 W/m2. However, in Inner Mongolia, there is a slight increasing trend in PET while Rs tend to decline during 1984–2010 (Figure 6). Other meteorological variables such as VPD have dominated the variations of PET over Inner Mongolia due to a reduction of atmospheric moisture saturation [15,43].
Figure 8. Maps of the correlation coefficient between annual PET and Rs, VPD, Tair, WS, respectively.
Atmosphere 05 00737 g008
Figure 7 shows the substantial increasing trends in VPD from 1982 through 2010 over South China, Central China and Inner Mongolia regions, although PET tends to slight trends in some regions. Figure 8 shows the spatial distribution of correlation coefficients between annual PET and Rs, VPD, Tair, WS, respectively. It is clear that the averaged coefficients of the China vary largely from 0.78 for Rs to 0.41 for WS. Rs is the most important factor controlling annual variation of PET in most regions of China (except for Northwest China). However, Wang et al. [9] found that VPD is the most important factor controlling monthly variation of global surface EP. We found that VPD is the second most important factor controlling annual PET of China and the average of coefficients is about 0.58. It is likely caused by the different mechanisms of atmospheric evaporation demand in different regions because more than 50% of regions in China belong to temperate, sub-tropic and tropic climatic zones and Rs is the most important driver of both PET and ET in these regions [40,43]. Figure 8 also shows both Tair and WS also contribute to the variations of PET and their contributions are smaller (with the averaged coefficients is 0.47 for Tair and 0.38 for WS) compared with those of Rs and VPD in most regions of China. However, WS is the primary factor controlling inter-annual variation of PET over Northwest China. This is consistent with recent analysis of EP observations and model simulations over arid regions [22]. Overall, PET estimation by the FAO PM method shows the contribution order: Rs > VPD > Tair > WS.
Figure 9. Maps of the linear trend in Rs and VPD derived from the gridded reanalysis meteorological datasets. The trends are classified into four categories according to statistical linear trend analysis: Significant increase (p < 0.05), significant decrease (p < 0.05), insignificant increase (p < 0.05) and insignificant decrease (p < 0.05).
Atmosphere 05 00737 g009
The spatial pattern of trends in annual total Rs, VPD, Tair and WS (Figure 9 and Figure 10) was examined. Substantial spatio-temporal variability appears in Rs trends derived from reanalysis datasets that is almost consistent with those of PET because Rs is the energy available to drive PET, as reported by Wild et al. [15]. A good coherence between the 1982–2010 PET trends was found using the FAO PM method and the trends in VPD in most regions in which VPD is expected to control PET. Therefore, the variation in VPD also directly determines the variation of PET due to the increased warming [53,54,55,56,57,58,59,60,61]. The contributions of both Tair and WS are less than those of both Rs and VPD. Especially for WS, there is an obvious decreasing trend (averaged −0.1 m/s per decade) over most regions of China during 1982–2010. Liu and Zhang [4] documented that increasing Tair had a positive effect on PET, but the effect had been offset by variations in Rs and VPD. Li et al. [5] used the meteorological data to find that WS may lead to the decrease of PET during 1956–1993. Wang et al. [9] reported that the reduction of WS also cancels out the impact of increased VPD on EP. Our results support their speculations, demonstrating that the variation in both Tair and WS are basic contributors to the variation in PET.
Figure 10. Maps of the linear trend in Tair and WS derived from the gridded reanalysis meteorological datasets. The trends are classified into four categories according to statistical linear trend analysis: Significant increase (p < 0.05), significant decrease (p < 0.05), insignificant increase (p < 0.05) and insignificant decrease (p < 0.05).
Atmosphere 05 00737 g010

4. Conclusions

We have estimated the PET of China using the Penman-Monteith (PM) method driven by gridded reanalysis datasets and made comparisons with the estimated PET using meteorological observations. The results show that the bias of the estimated ET using reanalysis data that deviates from the estimated PET using meteorological observations is 0.01 mm, indicating that the estimated PET using reanalysis data provides reliable information for detection of spatial and decadal variations in PET of China.
The spatial distribution of the average PET between 1982 and 2010 in China shows the strong regional variations corresponding to the climate patterns. Both Northwest arid regions and the sub-tropical forest regions show the highest annual PET, while Qinghai-Tibet and the Northeast areas within the cold-temperate regions show the lowest annual PET. The spatial pattern of the linear trend in PET of China shows that a widely significant increasing trend in PET appears during 1982–2010 in Northwest China, Central China, Northeast China and South China, which is consistent with previous studies. In contrast, there are no obvious variations in PET in North China, Inner Mongolia and Qinghai-Tibet region. The estimated PET had decreased on average by 3.3 mm per year (p < 0.05) over the entire China during 1982–1993, while PET began to increase from 1994 by 3.4 mm per year (p < 0.05). Previous substantial studies documented that the 1990s mark a transition period in which the trend in PET of China increased but the overall trend in PET had slightly decreased during 1951–2010. Our findings in this study support previous conclusions.
Our findings illustrate that Rs is the most important contributor to the variation in PET, and VPD is the second most important variable impacting on the variation in PET. The contributions of both Tair and WS are less than those of both Rs and VPD. Especially for WS, there is a slight decreasing trend (averaged −0.1 m/s per decade) across most regions of China during 1982–2010. Future studies are needed to further identify the complicated processes of PET variation by quantitatively pinpointing the cause of WS.

Acknowledgments

The authors thank three reviewers for their helpful suggestions. The authors thank Tim R. McVicar from CSIRO Land and Water, Australia and Qinglong You from College of Atmospheric Science, Nanjing University of Information Science and Technology, China for his good suggestions to improve this manuscript. We gratefully acknowledge Kun Yang Institute of Tibetan Plateau Research, Chinese Academy of Sciences, and Bojiang from Beijing Normal University for providing gridded meteorological and satellite data of China. The forcing dataset used in this study was developed by Data Assimilation and Modeling Center for Tibetan Multi-spheres, Institute of Tibetan Plateau Research, Chinese Academy of Sciences and this data set is provided by “Environmental & Ecological Science Data Center for West China, National Natural Science Foundation of China”. AVHRR NDVI products were obtained from National Oceanic and Atmospheric Administration (NOAA)/AVHRR observations. This work was partially supported by the Fundamental Research Funds for the Central Universities (No. 2013YB34), the National Science and Technology Support Plan During the 12th Five-year Plan Period of China (No. 2012BAC19B03 and 2013BAC10B01), and the Natural Science Fund of China (No. 41201331, No. 41101313 and No. 41301353).

Author Contributions

Yunjun Yao, Yuhu Zhang and Shaohua Zhao prepared the manuscript. Yuhu Zhang and Meng Liu made the data processing. Shaohua Zhao and Kun Jia contributed to the discussion.

Conflicts of Interest

The authors declare no conflict of interest.

References

  1. Cannarozzo, M.; Noto, L.V.; Viola, F. Spatial distribution of rainfall trends in Sicily (1921–2000). Phys. Chem. Earth 2006, 31, 1201–1211. [Google Scholar] [CrossRef]
  2. Gao, G.; Chen, D.L.; Ren, G.Y.; Chen, Y.; Liao, Y.M. Spatial and temporal variations and controlling factors of potential evapotranspiration in China: 1956–2000. J. Geogr. Sci. 2006, 16, 3–12. [Google Scholar] [CrossRef]
  3. Liang, S.; Wang, K.; Zhang, X.; Wild, M. Review on estimation of land surface radiation and energy budgets from ground measurements, remote sensing and model simulations. IEEE J. Sel. Top. Appl. Earth Obs. Remote Sens. 2010, 3, 225–240. [Google Scholar] [CrossRef]
  4. Liu, X.M.; Zhang, D. Trend analysis of reference evapotranspiration in Northwest China: The roles of changing wind speed and surface air temperature. Hydrol. Process 2013, 27, 3941–3948. [Google Scholar] [CrossRef]
  5. Li, Z.; Chen, Y.N.; Yang, J.; Wang, Y. Potential evapotranspiration and its attribution over the past 50 years in the arid region of Northwest China. Hydrol. Process 2014, 28, 1025–1031. [Google Scholar] [CrossRef]
  6. Peterson, T.C.; Golubev, V.S.; Groisman, P.Y. Evaporation losing its strength. Nature 1995, 377, 687–688. [Google Scholar] [CrossRef]
  7. Brutsaert, W.; Parlange, M.B. Hydrologic cycle explains the evaporation paradox. Nature 1998. [Google Scholar] [CrossRef]
  8. Roderick, M.L.; Rotstayn, L.D.; Farquhar, G.D.; Hobbins, M.T. On the attribution of changing pan evaporation. Geophys. Res. Lett. 2007. [Google Scholar] [CrossRef]
  9. Wang, K.; Dickinson, R.E.; Liang, S. Global atmospheric evaporative demand over land from 1973 to 2008. J. Clim. 2012, 25, 8353–8361. [Google Scholar] [CrossRef]
  10. Priestley, C.H.B.; Taylor, R.J. On the assessment of surface heat flux and evaporation using large-scale parameters. Mon. Weather Rev. 1972, 100, 81–92. [Google Scholar] [CrossRef]
  11. Hargreaves, G.H. Accuracy of estimated reference crop evapotranspiration. J. Irrig. Drain. Eng. 1989, 115, 1000–1007. [Google Scholar] [CrossRef]
  12. Allen, R.G.; Pereira, L.S.; Raes, D.; Smith, M. Crop Evapotranspiration Guidelines for Computing Crop Water Requirements; No.56; FAO: Rome, Italy, 1998. [Google Scholar]
  13. Yao, Y.; Liang, S.; Qin, Q.; Wang, K. Monitoring drought over the conterminous United States using MODIS and NCEP reanalysis-2 data. J. Appl. Meteorol. Climatol. 2010, 49, 1665–1680. [Google Scholar] [CrossRef]
  14. Zhao, S.; Yang, Y.; Zhang, F.; Sui, X.; Yao, Y.; Zhao, N.; Zhao, Q.; Li, C. Rapid evaluation of reference evapotranspiration in Northern China. Arab. J. Geosci. 2014. [Google Scholar] [CrossRef]
  15. Wild, M.J.; Grieser, M.J.; Schar, C. Combined surface solar brightening and increasing greenhouse effect support recent intensification of the global land-based hydrological cycle. Geophys. Res. Lett. 2008. [Google Scholar] [CrossRef]
  16. Xu, C.Y.; Gong, L.B.; Jiang, T.; Chen, D.L. Decreasing reference evapotranspiration in a warming climate: A case of Changjiang (Yangtze River) catchment during 1970–2000. Adv. Atmos. Sci. 2006, 23, 531–520. [Google Scholar] [CrossRef]
  17. Yao, Y.; Liang, S.; Qin, Q.; Wang, K.; Liu, S.; Zhao, S. Satellite detection of increases in global land surface evapotranspiration during 1984–2007. Int. J. Digit. Earth. 2012, 5, 299–318. [Google Scholar] [CrossRef]
  18. Dai, A. Recent climatology, variability, and trends in global surface humidity. J. Clim. 2006, 19, 3589–3606. [Google Scholar] [CrossRef]
  19. Wang, K.; Dickinson, R. A review of global terrestrial evapotranspiration: Observation, modeling, climatology and climatic variability. Rev. Geophys. 2012. [Google Scholar] [CrossRef]
  20. Cohen, S.; Ianetz, A.; Stanhill, G. Evaporative climate changes at Bet Dagan, Israel, 1964–1998. Agric. For. Meteorol. 2002, 111, 83–91. [Google Scholar] [CrossRef]
  21. Rayner, D.P. Wind run changes: The dominant factor affecting pan evaporation trends in Australia. J. Clim. 2007, 20, 3379–3394. [Google Scholar] [CrossRef]
  22. McVicar, T.R.; Roderick, M.L.; Donohue, R.J.; Li, L.T.; van Niel, T.G.; Thomas, A.; Grieser, J.; Jhajharia, D.; Himri, Y.; Mahowald, N.M.; et al. Global review and synthesis of trends in observed terrestrial near-surface wind speeds: Implications for evaporation. J. Hydrol. 2012, 416–417, 182–205. [Google Scholar] [CrossRef]
  23. Thomas, A. Spatial and temporal characteristics of potential evapotranspiration trends over China. Int. J. Climatol. 2000, 20, 381–396. [Google Scholar] [CrossRef]
  24. Xu, J.H.; Chen, Y.N.; Lu, F.; Li, W.H.; Zhang, L.J.; Hong, Y.L. The Nonlinear trend of runoff and its response to climate change in the Aksu River, western China. Int. J. Climatol. 2011, 31, 687–695. [Google Scholar] [CrossRef]
  25. Yao, Y.; Liang, S.; Cheng, J.; Liu, S.; Fisher, J.; Zhang, X.; Jia, K.; Zhao, X.; Qin, Q.; Zhao, B.; et al. MODIS-driven estimation of terrestrial latent heat flux in China based on a modified Priestley-Taylor algorithm. Agric. For. Meteorol. 2013, 171–172, 187–202. [Google Scholar] [CrossRef]
  26. Yao, Y.; Liang, S.; Li, X.; Hong, Y.; Fisher, J.B.; Zhang, N.; Chen, J.; Cheng, J.; Zhao, S.; Zhang, X.; et al. Bayesian multimodel estimation of global terrestrial latent heat flux from eddy covariance, meteorological, and satellite observations. J. Geophys. Res.: Atmos. 2014, 119, 4521–4545. [Google Scholar] [CrossRef]
  27. Cong, Z.T.; Yang, D.W.; Ni, G.H. Does evaporation paradox exist in China? Hydrol. Earth Syst. Sci. 2009, 13, 357–366. [Google Scholar] [CrossRef]
  28. Yang, K.; He, J.; Tang, W.; Qin, J.; Cheng, C. On downward shortwave and longwave radiations over high altitude regions: Observation and modeling in the Tibetan Plateau. Agric. For. Meteorol. 2010, 150, 38–46. [Google Scholar] [CrossRef]
  29. Chen, Y.; Yang, K.; He, J.; Qin, J.; Shi, J.; Du, J.; He, Q. Improving land surface temperature modeling for dry land of China. J. Geophys. Res.: Atmos. 2011. [Google Scholar] [CrossRef]
  30. He, J.; Yang, K. China Meteorological Forcing Dataset; Cold and Arid Regions Science Data Center: Lanzhou, China, 2011. [Google Scholar] [CrossRef]
  31. The Assessment and Rating of Noise from Wind Farms. Available online: https://www.gov.uk/government/uploads/system/uploads/attachment_data/file/49869/ETSU_Full_copy__Searchable_.pdf (accessed on 24 September 2014).
  32. Liang, S.; Zhao, X.; Yuan, W.; Liu, S.; Cheng, X.; Xiao, Z.; Zhang, X.; Liu, Q.; Cheng, J.; Tang, H.; et al. A long-term Global LAnd Surface Satellite (GLASS) dataset for environmental studies. Int. J. Digit. Earth 2013, 6, 5–33. [Google Scholar] [CrossRef]
  33. Tucker, C.J.; Pinzon, J.E.; Brown, M.E.; Slayback, D.A.; Pak, E.W.; Mahoney, R.; Vermote, E.F.; Saleous, N. An extended AVHRR 8-km NDVI dataset compatible with MODIS and SPOT vegetation NDVI data. Int. J. Remote Sens. 2005, 26, 4485–4498. [Google Scholar] [CrossRef]
  34. Chen, S.B.; Liu, Y.F.; Thomas, A. Climatic change on the Tibetan Plateau: Potential evapotranspiration trends from 1961 to 2000. Clim. Chang. 2006, 76, 291–319. [Google Scholar] [CrossRef]
  35. Meng, D.; Mo, X. Assessing the effect of climate change on mean annual runoff in the Songhua River basin, China. Hydrol. Process 2011, 26, 1050–1061. [Google Scholar] [CrossRef]
  36. Reginato, R.J.; Jackson, R.F.; Pinter, P.J. Evapotranspiration calculated from remote multispectral and ground station meteorological data. Remote Sens. Environ. 1985, 18, 75–89. [Google Scholar] [CrossRef]
  37. Yao, Y.; Qin, Q.; Ghulam, A.; Liu, S.; Zhao, S.; Xu, Z.; Dong, H. Simple method to determine the Priestley–Taylor parameter for evapotranspiration estimation using Albedo-VI triangular space from MODIS data. J. Appl. Remote Sens. 2011. [Google Scholar] [CrossRef]
  38. Pinker, R.T.; Zhang, B.; Dutton, E.G. Do satellites detect trends in surface solar radiation? Science 2005, 308, 850–854. [Google Scholar] [CrossRef]
  39. Wang, K.; Dickinson, R.; Wild, M.; Liang, S. Evidence for decadal variation in global terrestrial evapotranspiration between 1982 and 2002. Part 2: Results. J. Geophys. Res.: Atmos. 2010. [Google Scholar] [CrossRef]
  40. Jung, M.; Reichstein, M.; Ciais, P.; Seneviratne, S.; Sheffield, J.; Goulden, M.; Bonan, G.; Cescatti, A.; Chen, J.; Richard, D.; et al. Recent decline in the global land evapotranspiration trend due to limited moisture supply. Nature 2010, 467, 951–954. [Google Scholar] [PubMed]
  41. Zhao, M.S.; Running, S.W. Drought-induced reduction in global terrestrial net primary production from 2000 through 2009. Science 2010, 329, 940–943. [Google Scholar] [CrossRef] [PubMed]
  42. Qian, W.H.; Qin, A. Precipitation division and climate shift in China from 1960 to 2000. Theor. Appl. Climatol. 2008, 93, 1–17. [Google Scholar] [CrossRef]
  43. Yin, Y.H.; Wu, S.H.; Dai, E.F. Determining factors in potential evapotranspiration changes over China in the period 1971–2008. Chin. Sci. Bull. 2010, 55, 3329–3337. [Google Scholar] [CrossRef]
  44. You, Q.; Jiao, Y.; Lin, H.; Min, J.; Kang, S.; Ren, G.; Meng, X. Comparison of NCEP/NCAR and ERA-40 total cloud cover with surface observations over the Tibetan Plateau. Int. J. Climatol. 2014, 34, 2529–2537. [Google Scholar] [CrossRef]
  45. You, Q.; Fraedrich, K.; Ren, G.; Pepin, N.; Kang, S. Can temperature extremes in China be calculated from reanalysis? Glob. Planet. Chang. 2013, 111, 268–279. [Google Scholar] [CrossRef]
  46. You, Q.; Fraedrich, K.; Ren, G.; Ye, B.; Meng, S.; Kang, S. Inconsistencies of precipitation in the eastern and central Tibetan Plateau between surface adjusted data and reanalysis. Theor. Appl. Climatol. 2012, 109, 485–496. [Google Scholar] [CrossRef]
  47. Baule, W.J.; Shulski, M.D. Climatology and trends of wind speed in the Beaufort/Chukchi Sea coastal region from 1979 to 2009. Int. J. Climatol. 2014, 34, 2819–2833. [Google Scholar] [CrossRef]
  48. Chen, D.L.; Gao, G.; Xu, C.J.; Guo, J.; Ren, G.Y. Comparison of the Thornthwaite method and pan data with the standard Penman-Monteith estimates of reference evapotranspiration in China. Clim. Res. 2005, 28, 123–132. [Google Scholar] [CrossRef]
  49. Tang, B.; Tong, L.; Kang, S.; Zhang, L. Impacts of climate variability on reference evapotranspiration over 58 years in the Haihe river basin of north China. Agric. Water Manage. 2011, 98, 1660–1670. [Google Scholar] [CrossRef]
  50. Zhang, X.Y.; Ren, Y.; Yin, Z.Y.; Lin, Z.; Zheng, D. Spatial and temporal variation patterns of reference evapotranspiration across the Qinghai-Tibetan Plateau during 1971–2004. J. Geophys. Res.: Atmos. 2009. [Google Scholar] [CrossRef]
  51. Anderson, M.C.; Norman, J.M.; Mecikalski, J.R.; Otkin, J.A.; Kustas, W.P. A climatological study of evapotranspiration and moisture stress across the continental United States based on thermal remote sensing: 1. Model formulation. J. Geophys. Res.: Atmos. 2007. [Google Scholar] [CrossRef]
  52. Anderson, M.C.; Norman, J.M.; Mecikalski, J.R.; Otkin, J.A.; Kustas, W.P. A climatological study of evapotranspiration and moisture stress across the continental United States based on thermal remote sensing: 2. Surface moisture climatology. J. Geophys. Res.: Atmos. 2007. [Google Scholar] [CrossRef]
  53. Scheff, J.; Frierson, D.M.W. Scaling potential evapotranspiration with greenhouse warming. J. Clim. 2014, 27, 1539–1558. [Google Scholar] [CrossRef]
  54. Anagnostopoulos, G.G.; Koutsoyiannis, D.; Christofides, A.; Efstratiadis, A.; Mamassis, N. A comparison of local and aggregated climate model outputs with observed data. Hydrol. Sci. J. 2010, 55, 1094–1110. [Google Scholar] [CrossRef]
  55. Hamed, K.H. Trend detection in hydrologic data: The Mann–Kendall trend test under the scaling hypothesis. J. Hydrol. 2008, 349, 350–363. [Google Scholar] [CrossRef]
  56. Yao, Y.; Liang, S.; Xie, X.; Cheng, J.; Jia, K.; Li, Y.; Liu, R. Estimation of the terrestrial water budget over northern China by merging multiple datasets. J. Hydrol. 2014, 519, 50–68. [Google Scholar] [CrossRef]
  57. Koutsoyiannis, D.; Efstratiadis, A.; Mamassis, N.; Christofides, A. On the credibility of climate predictions. Hydrol. Sci. J. 2008, 53, 671–684. [Google Scholar] [CrossRef]
  58. Koutsoyiannis, D. Climate change, the Hurst phenomenon, and hydrological statistics. Hydrol. Sci. J. 2003, 48, 3–24. [Google Scholar] [CrossRef]
  59. Koutsoyiannis, D. Reconciling hydrology with engineering. Hydrol. Res. 2014, 45, 2–22. [Google Scholar] [CrossRef]
  60. Thomas, A. Development and properties of 0.25-degree gridded evapotranspiration data fields of China for hydrological studies. J. Hydrol. 2008, 358, 145–158. [Google Scholar] [CrossRef]
  61. Donohue, R.; McVicar, T.R.; Roderick, M.L. Assessing the ability of potential evaporation formulations to capture the dynamics in evaporative demand within a changing climate. J. Hydrol. 2010, 386, 186–197. [Google Scholar] [CrossRef]

