Article

Characteristics of Surface Ozone and Nitrogen Oxides over a Typical City in the Yangtze River Delta, China

1
College of Environmental and Resources Sciences, Zhejiang University of Technology, Hangzhou 310023, China
2
Hangzhou Meteorological Bureau, Hangzhou 310051, China
3
Zhejiang Lin’an Atmospheric Background National Observation and Research Station, Hangzhou 311300, China
4
Guilin Meteorological Bureau, Guilin 541001, China
5
Zhejiang Carbon Neutral Innovation Institute, Zhejiang University of Technology, Hangzhou 310023, China
*
Authors to whom correspondence should be addressed.
Atmosphere 2023, 14(3), 487; https://doi.org/10.3390/atmos14030487
Submission received: 14 February 2023 / Revised: 26 February 2023 / Accepted: 27 February 2023 / Published: 28 February 2023
(This article belongs to the Section Air Quality)

Abstract

:
The Yangtze River Delta (YRD) is the most developed region in China. Influenced by intensive and complex anthropogenic activities, atmospheric pollution in this region is highly variable, and reports are sparse. In this study, a seven-year history of the atmospheric O3 and NOx mixing ratios over a typical city, Hangzhou, was presented to enrich the studies on air pollution in the YRD region. Our results revealed that the diurnal variation in NOx corresponded to traffic rush hours, while O3 was mainly impacted by photochemical reactions in the daytime. The weekend effect was significant for NOx, but inapparent for O3. Two O3 peaks in May and September were caused by seasonal atmospheric stability and climatic conditions. The lower NOx and higher O3 levels observed suggested direct effects from traffic restrictions and large-scale industrial shutdowns during the COVID-19 lockdown in 2020 compared with those in the periods before and after lockdown. The model simulation results showed that O3 mixing ratios were not only related to regional anthropogenic emissions but were impacted by air mass transportation from surrounding provinces and the China shelf seas. The NOx mixing ratios showed a decreasing trend, while the O3 mixing ratios showed the opposite trend from 2015 to 2021, which is indicative of the implementation of the Air Pollution Prevention and Control Acton Plan issued by the Chinese government in 2013.

1. Introduction

Ambient air pollution is considered to be a global problem, especially due to the sharply increasing concentration of atmospheric ozone (O3) and nitrogen oxides (NOx = NO + NO2) in rapidly developing countries [1]. Surface O3 (tropospheric O3) can affect human health, ecosystems and climatic conditions [2,3], as it is not only considered to be a greenhouse gas [4], but also a major component of photochemical smog [5]. NOx, which is mainly emitted through the combustion of fossil fuels such as coal, oil and natural gas for power generation and transportation [6], plays an important role in tropospheric chemistry [7,8], being an important precursor of O3 and an excellent tracer of human activity [9].
There are intricate interactions between NOx, O3 and atmospheric aerosols [10,11,12,13]. Generally, tropospheric O3 in the urban environment increases after sunrise due to the photochemical reactions of VOCs (volatile organic compounds) and NOx [14,15]. As reported in previous studies, meteorological conditions, such as air temperature, solar radiation and wind speed, are strongly related to surface O3 concentration, as they impact chemical reactions and air mass transportation [16,17,18,19]. An increase in air temperature contributes to a decrease in the concentration of peroxyacetyl nitrate (PAN), and subsequently an increase in O3 concentration [20]. The wind speed can change the diffusion conditions of the atmosphere [21], while the wind direction can directly affect the transport paths of pollutants [22], resulting in a high O3 concentration in the downwind area of megacities [23].
With the rapid economic growth of China, energy consumption in urban areas is becoming more intensive and is causing increases in emissions of air pollutants. Currently, O3 is one of the primary pollutants in China during the summer [24,25]. Nitrogen dioxide (NO2) is the primary precursor to O3 under sunlight irradiation, while nitric oxide (NO) is an important scavenger of O3 at night and in winter (NO + O3 = NO2 + O2) [26]. Thus, O3 emission control is usually carried out by regulating NOx emissions [24]. Although Wang et al. [27] found that NOx levels in eastern China had fallen by more than 25% in recent years owing to strict emission reduction strategies, the air pollution in megacity zones is still severe, including in the Beijing–Tianjin–Hebei (BTH) region, the Yangtze River Delta (YRD) region and the Pearl River Delta (PRD) region, which are the most developed regions in China [12]. The YRD region, which mainly covers Jiangsu Province, Zhejiang Province and the city of Shanghai in eastern China, has witnessed rapid development in industry, urban construction, economy and population [28,29], and is considered to be the region most severely affected by O3 pollution with the most complicated photochemical processes [30].
Based on short-period observation campaigns, the variations in O3 and its atmospheric chemical processes related to NOx, VOCs and PM2.5 have been reported in some megacities in China [14,31], as well as the cities in the YRD region such as Ningbo, Shanghai and Nanjing [19,24,32]. However, due to the diverse local sources and intricate interactions between O3 and other pollutants, the research on surface O3 and NOx is still insufficient in the YRD region. As the third important and largest megacity in the YRD region, Hangzhou is the capital city of Zhejiang Province, with a size of 16,850 km2 and a population of 11.93 million (www.hangzhou.gov.cn, accessed on 21 June 2021). In this study, based on the continuous observation of atmospheric O3 and NOx from 2015 to 2021 at an urban observation station, the NRCS (National Reference Climatological Station) in Hangzhou, we systematically analyzed the temporal variations and regulatory mechanisms of surface O3 and NOx. Our study will add a new dataset for use by the scientific community and improve our understanding of the air pollution in the YRD region in China.

2. Materials and Methods
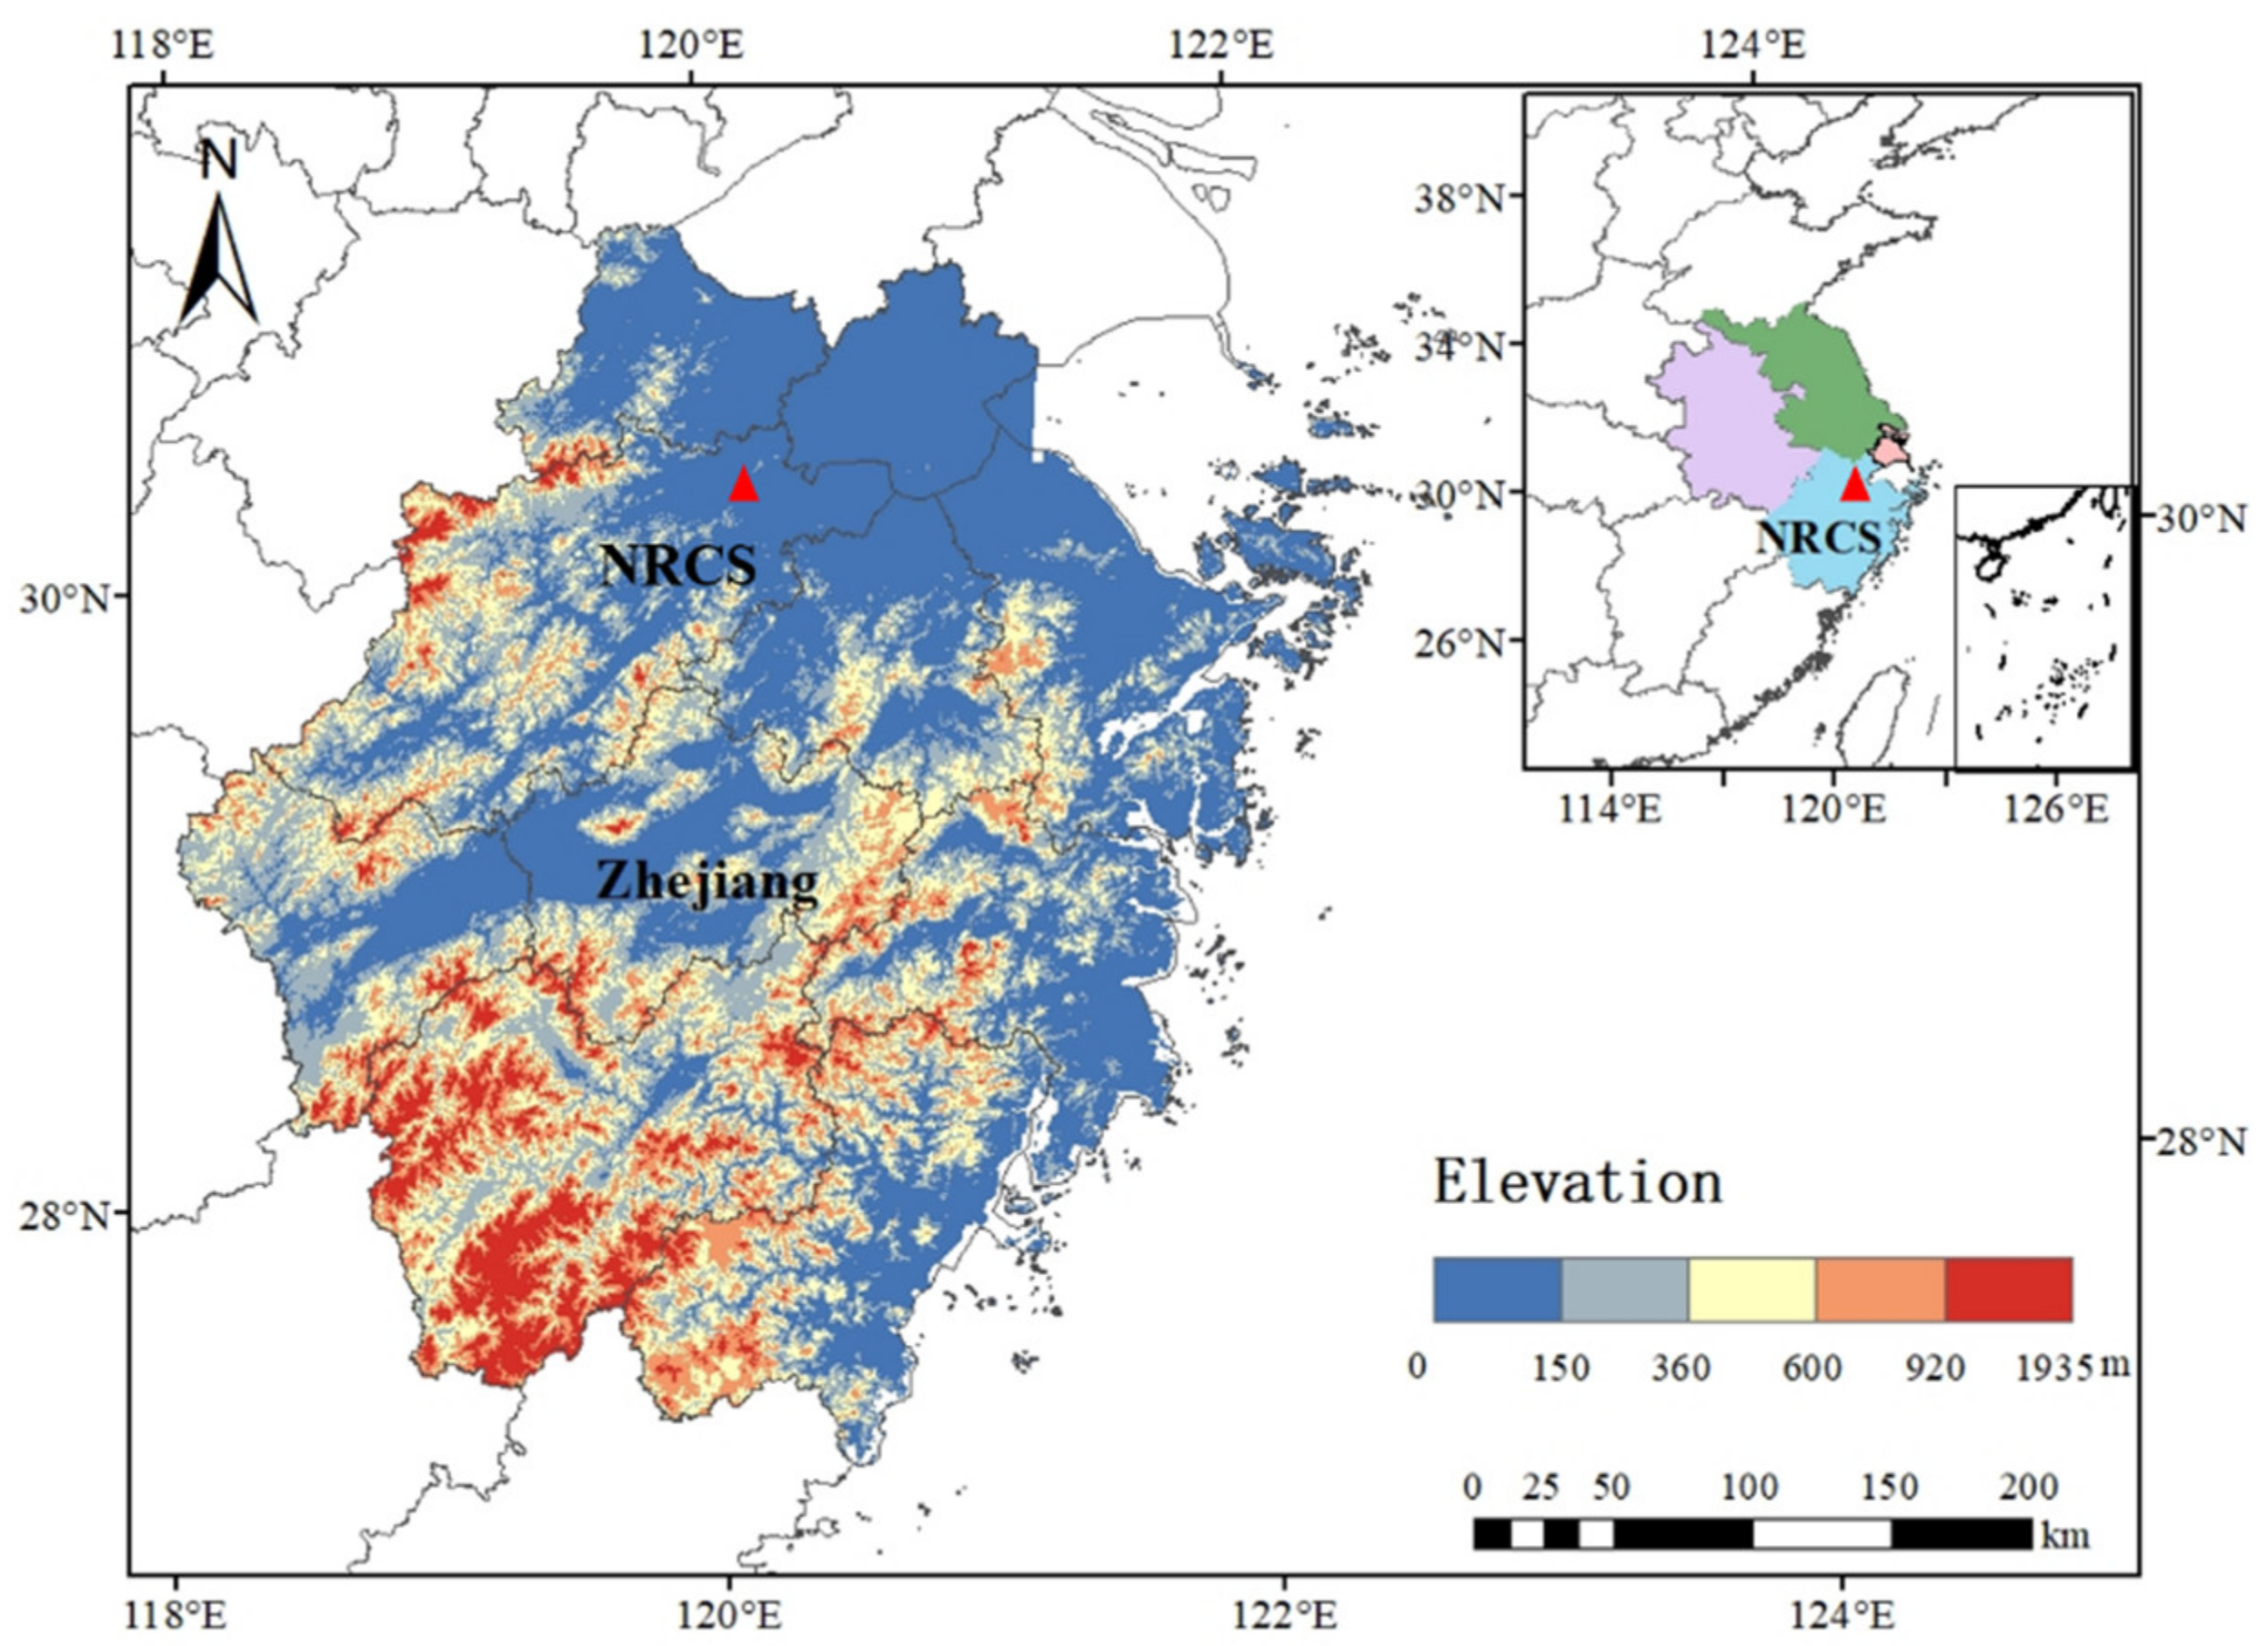
2.1. Study Area

Hangzhou is one of the most developed cities in the YRD region that is located to the northwest of Zhejiang Province and in the southeast of the YRD. Hangzhou has a humid subtropical monsoon climate with an average annual precipitation of ~1400 mm and an average annual temperature of ~17 °C (www.weather.com.cn, accessed on 12 January 2023). There mainly is a prevailing southerly wind in summer and northerly wind in winter. In late autumn and winter, the atmospheric pressure is relatively high and the atmospheric structure is relatively stable. The O3 and NOx observation site was located at the NRCS (120.17° E, 30.22° N, altitude 41.7 m) in the center of Hangzhou (Figure 1). There are no significant industrial emissions near the station. Thus, the urban plume of Hangzhou and regional air masses from the YRD region could be captured, especially when the northwest winds prevail [14].

2.2. Measurement Methods

Continuous long-term atmospheric O3 and NOx observations were conducted at the NRCS from 2011. The Model 49i O3 Analyzer from Thermo Scientific Instruments, Inc. (Waltham, MA, USA) (TEI 49i) was used to observe surface O3, and the TEI 42i NOx Analyzer was used for atmospheric NOx observations. The TEI 49i and TEI 42i both have a detection limit of 0.5 ppb and a precision of 1 ppb. The TEI 49i was calibrated with zero air and an O3 calibrator, and the TEI 42i was calibrated with the combination of a dynamic gas calibrator and zero air [33]. A quality inspection was carried out once a week, the filter element was replaced every two weeks and a multi-point calibration was carried out once a month. Ambient air sampling was performed with a PFA Teflon tube (inner diameter: 2 cm) situated 1.5 m above the roof and with a particulate filter connected to the NOx and O3 analyzers used in the laboratory.
The mixing ratios of NOx and O3 were obtained through continuous observation. Quality control of the observed data was carried out to determine a sampling time of at least 45 min per hour and an average concentration value of at least 20 h per day in accordance with the validity of the pollutant data statistics from the Ambient Air Quality Standards. After quality control, about 95% of total data remained as valid data. The average 5 min data were used to calculate the hourly average value, and consequently were used to calculate the diurnal, weekly, monthly and annual average values. The monthly average data were used to calculate the trend change. In trend analysis, to eliminate the seasonal effect of the data, the average of all monthly data of a given month was subtracted from the original data of the same month. Then, linear regression fitting was performed on the processed data [34], where a p-value determined by a t-test was used to indicate the significance level of the linear fitting trend.
Meanwhile, at the same altitude as the NRCS station, meteorological parameters such as visibility (VISIB), temperature (TEMP), air pressure (P), wind speed (WS), wind direction (WD) and relative humidity (RH) were observed.

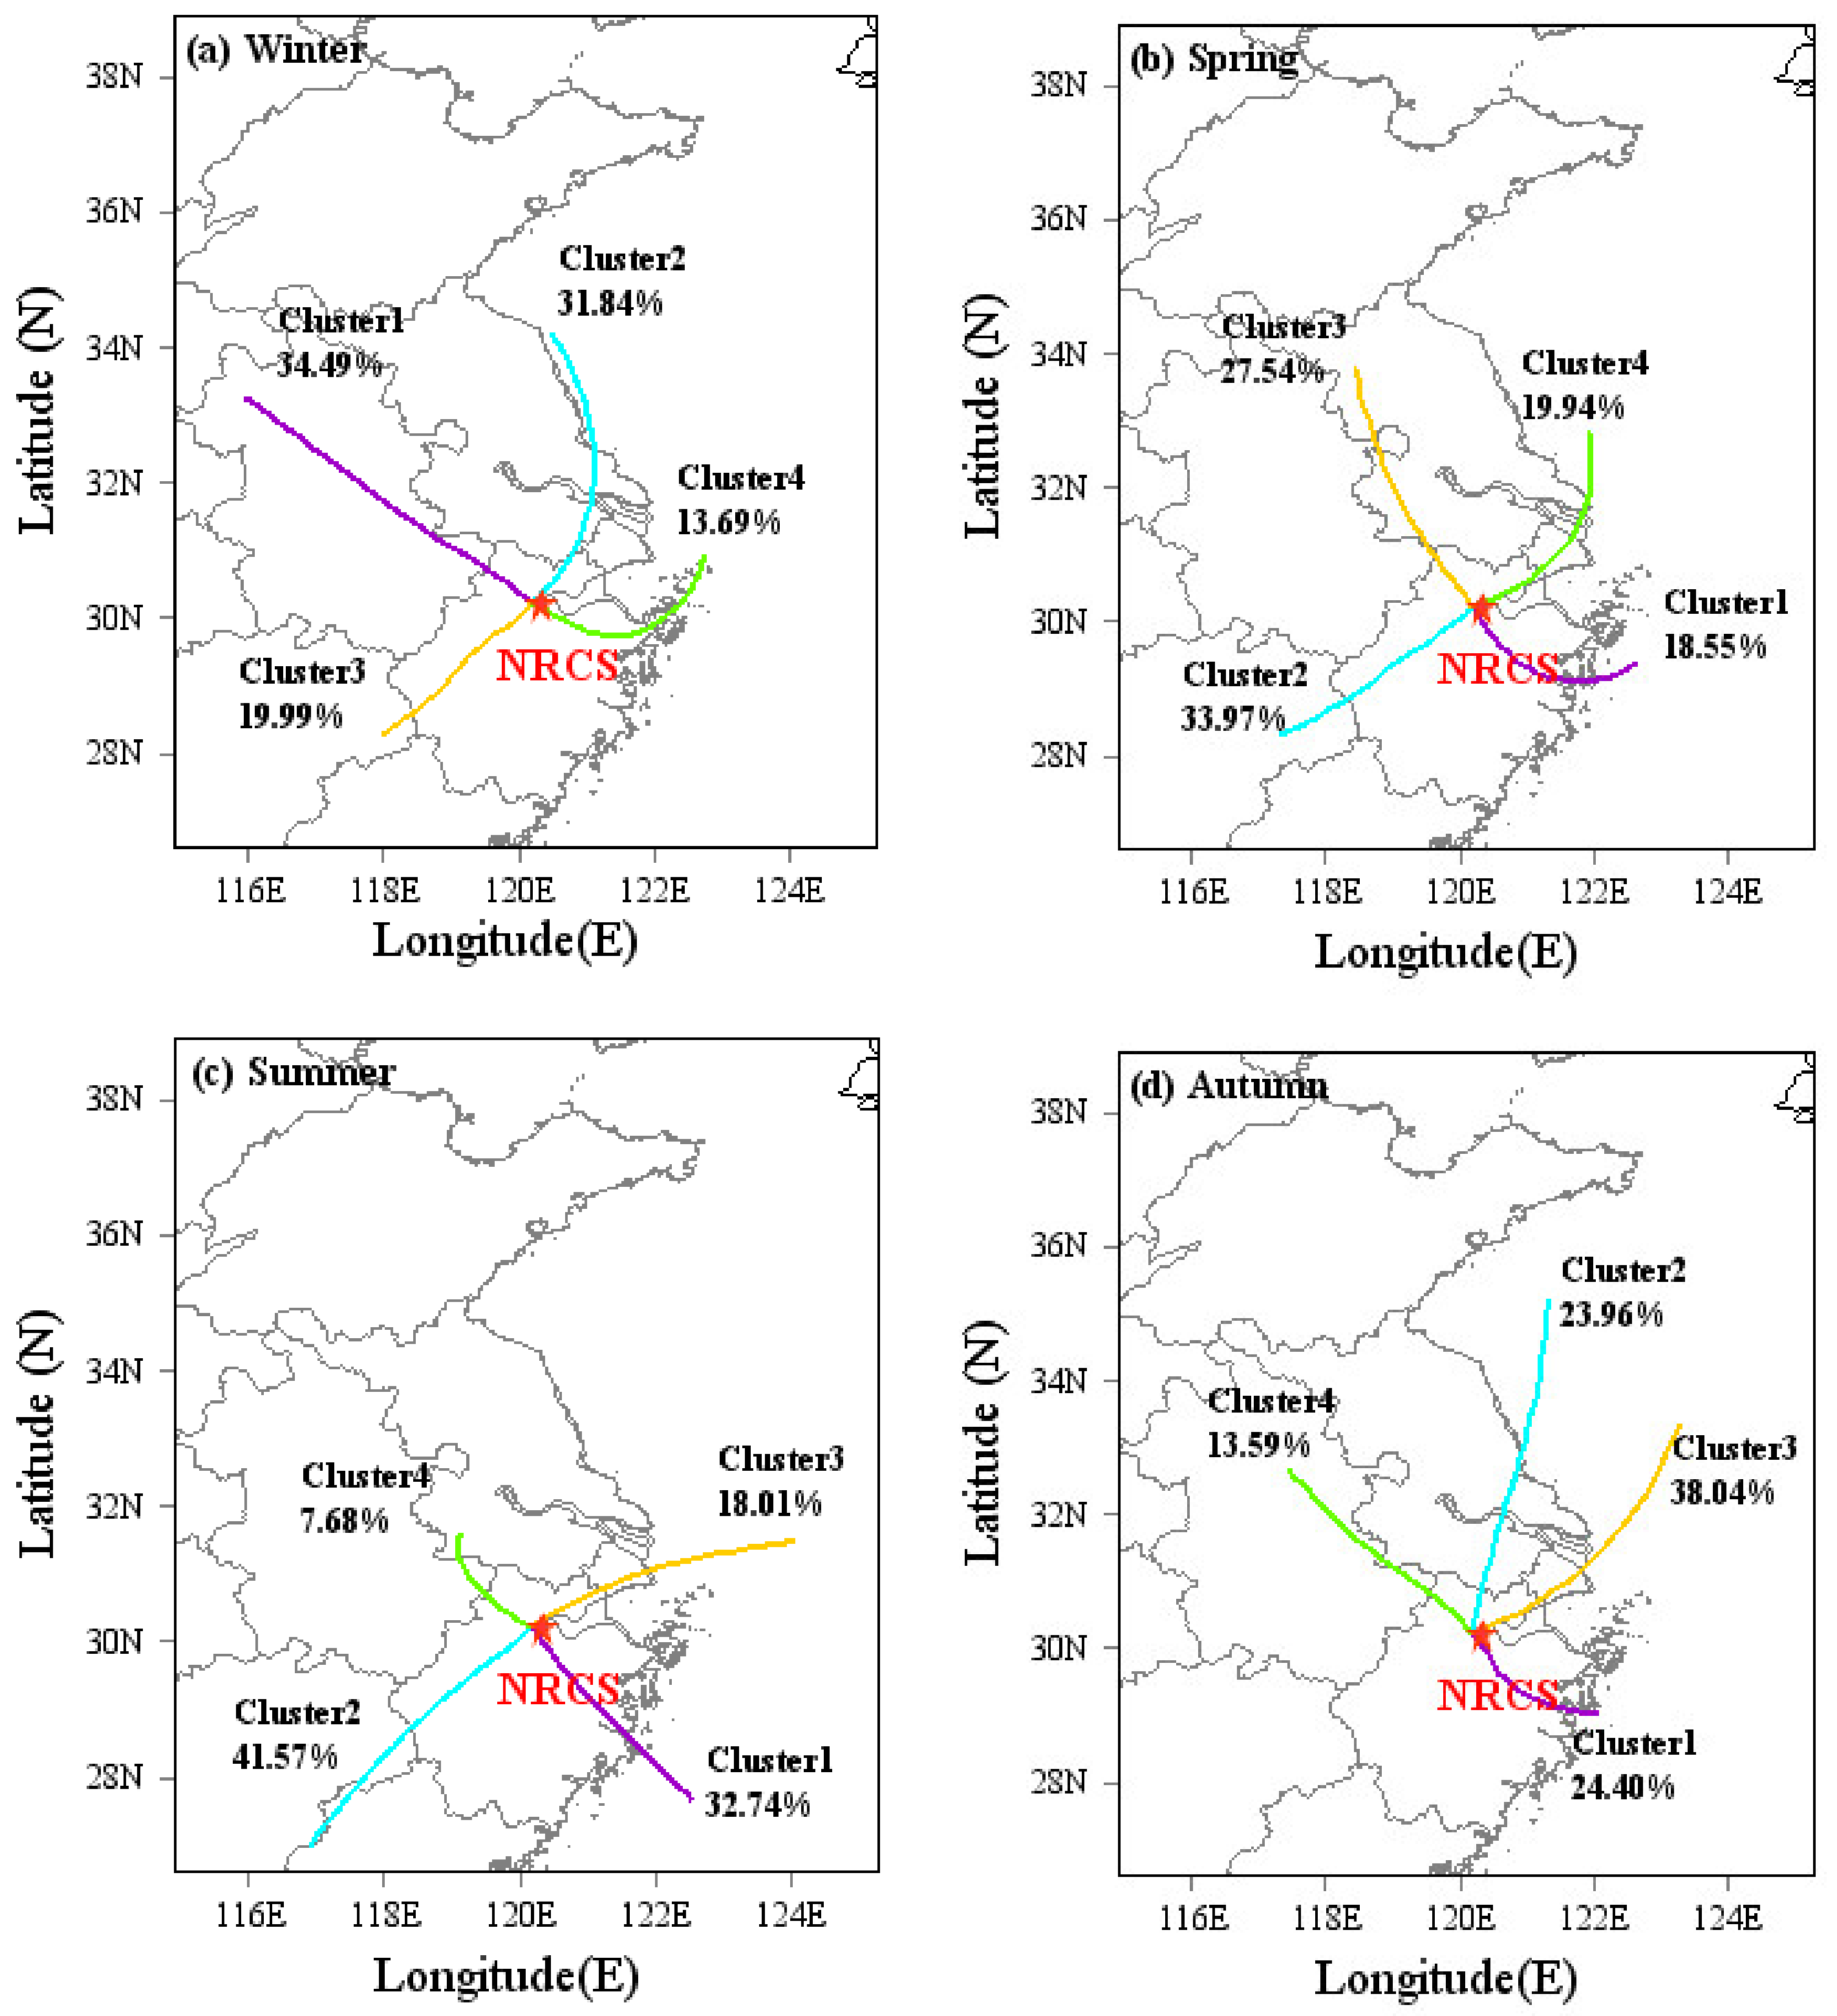
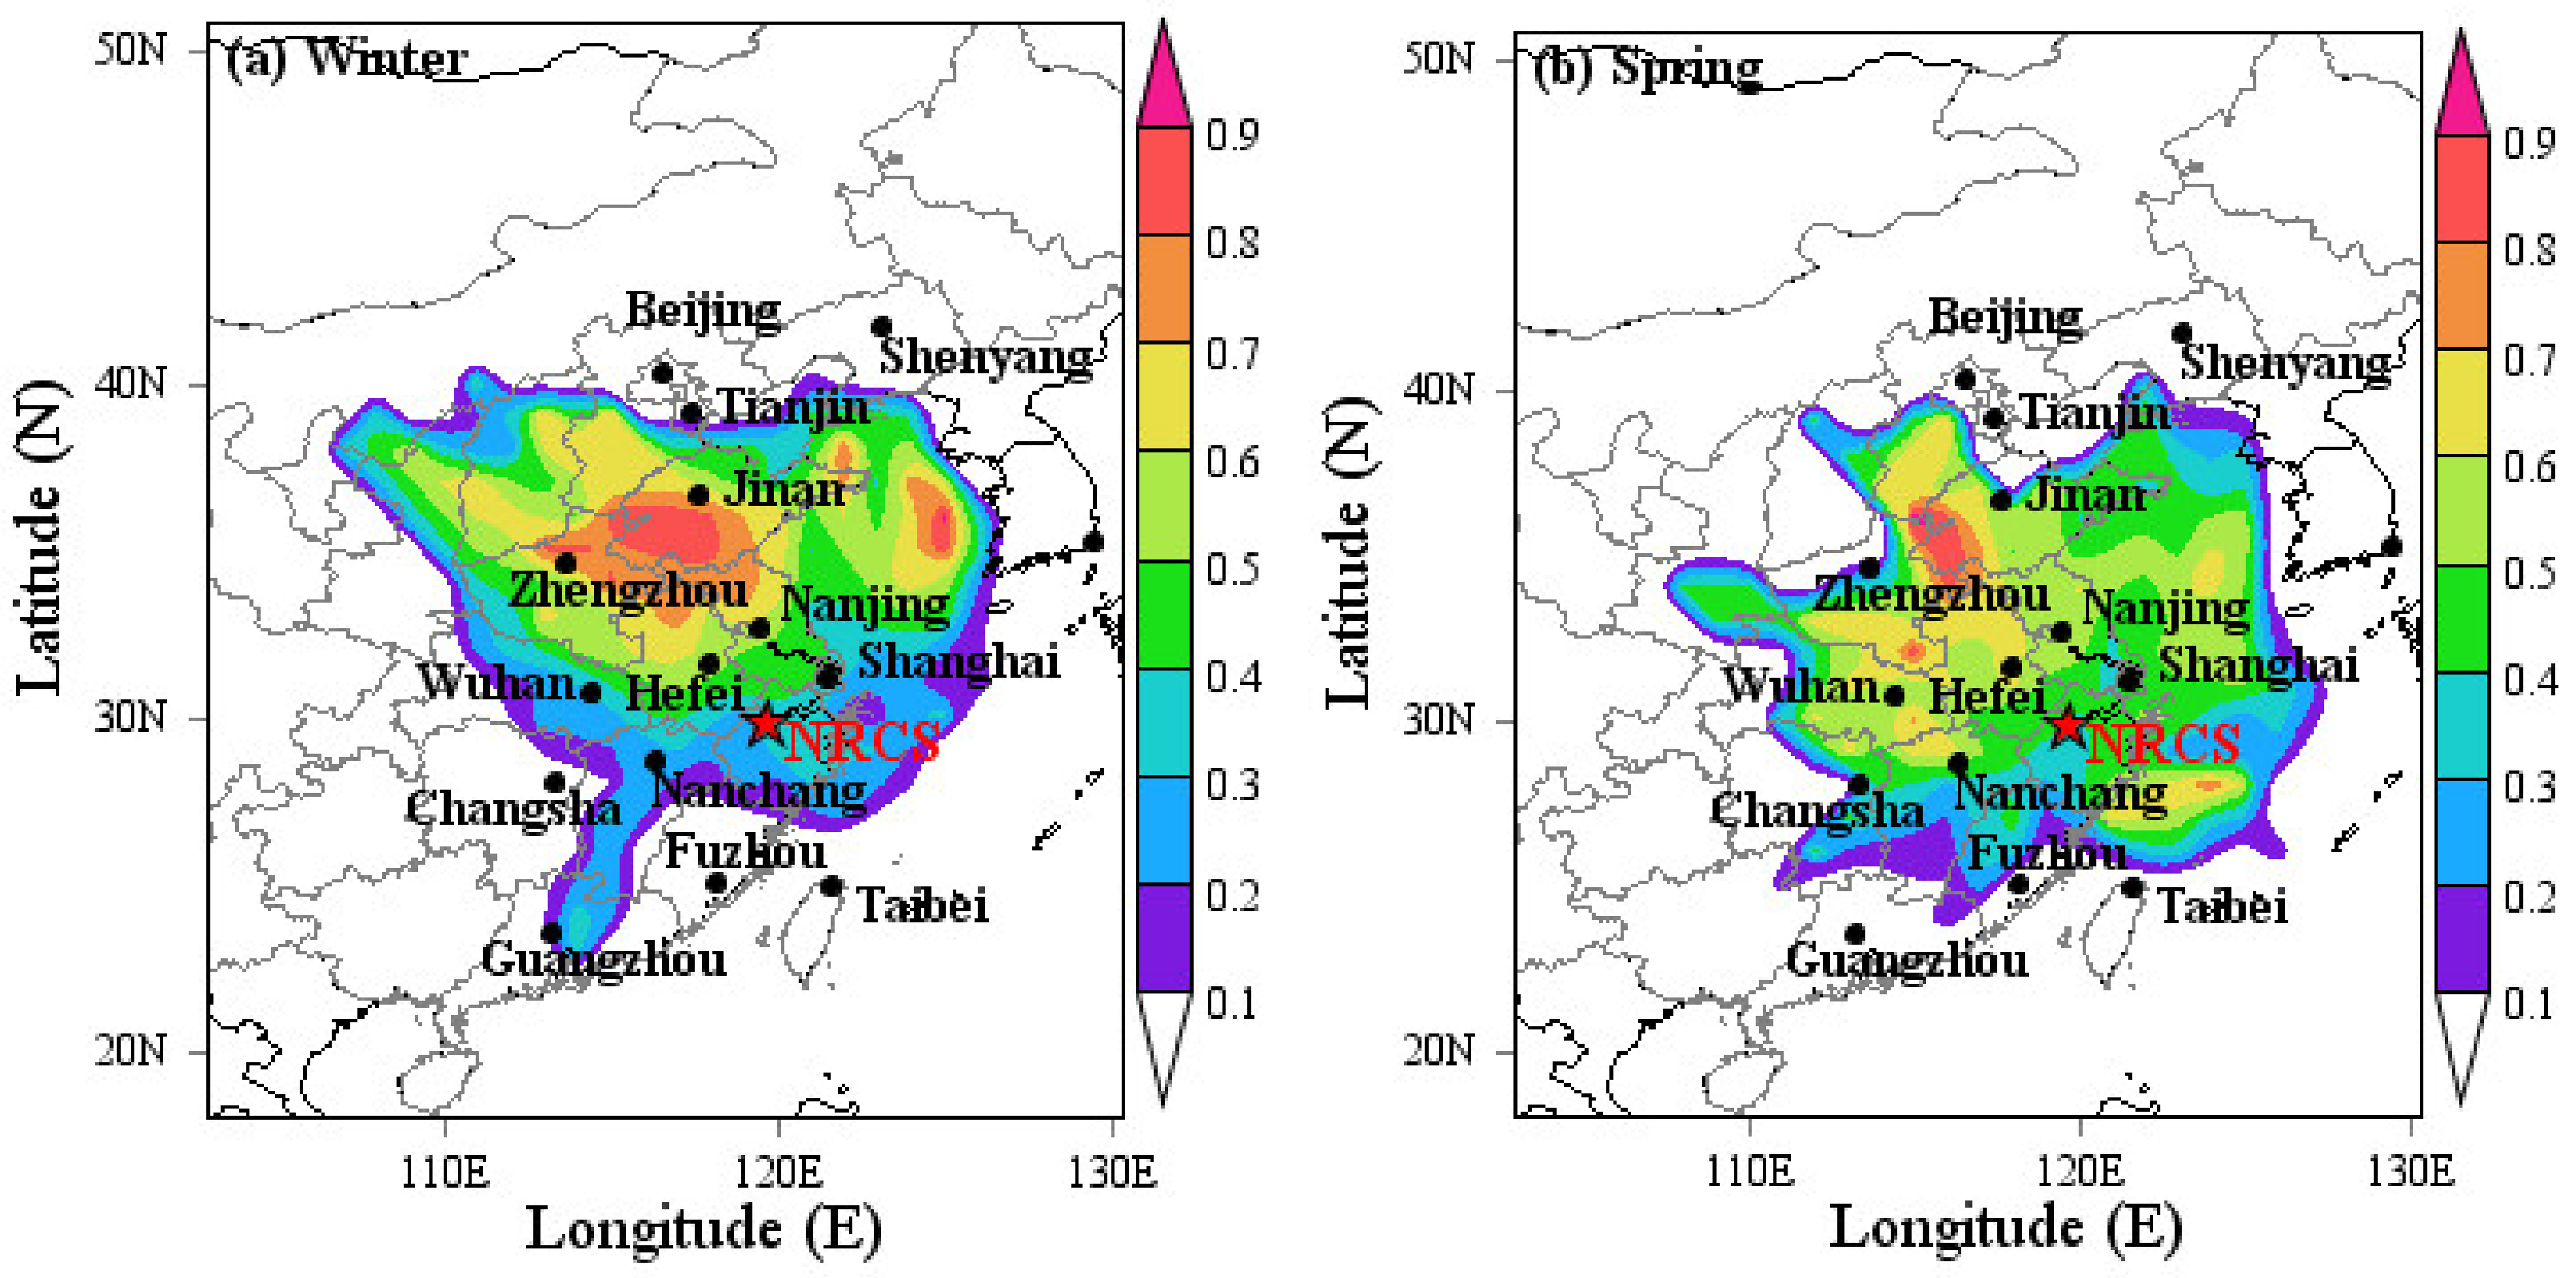
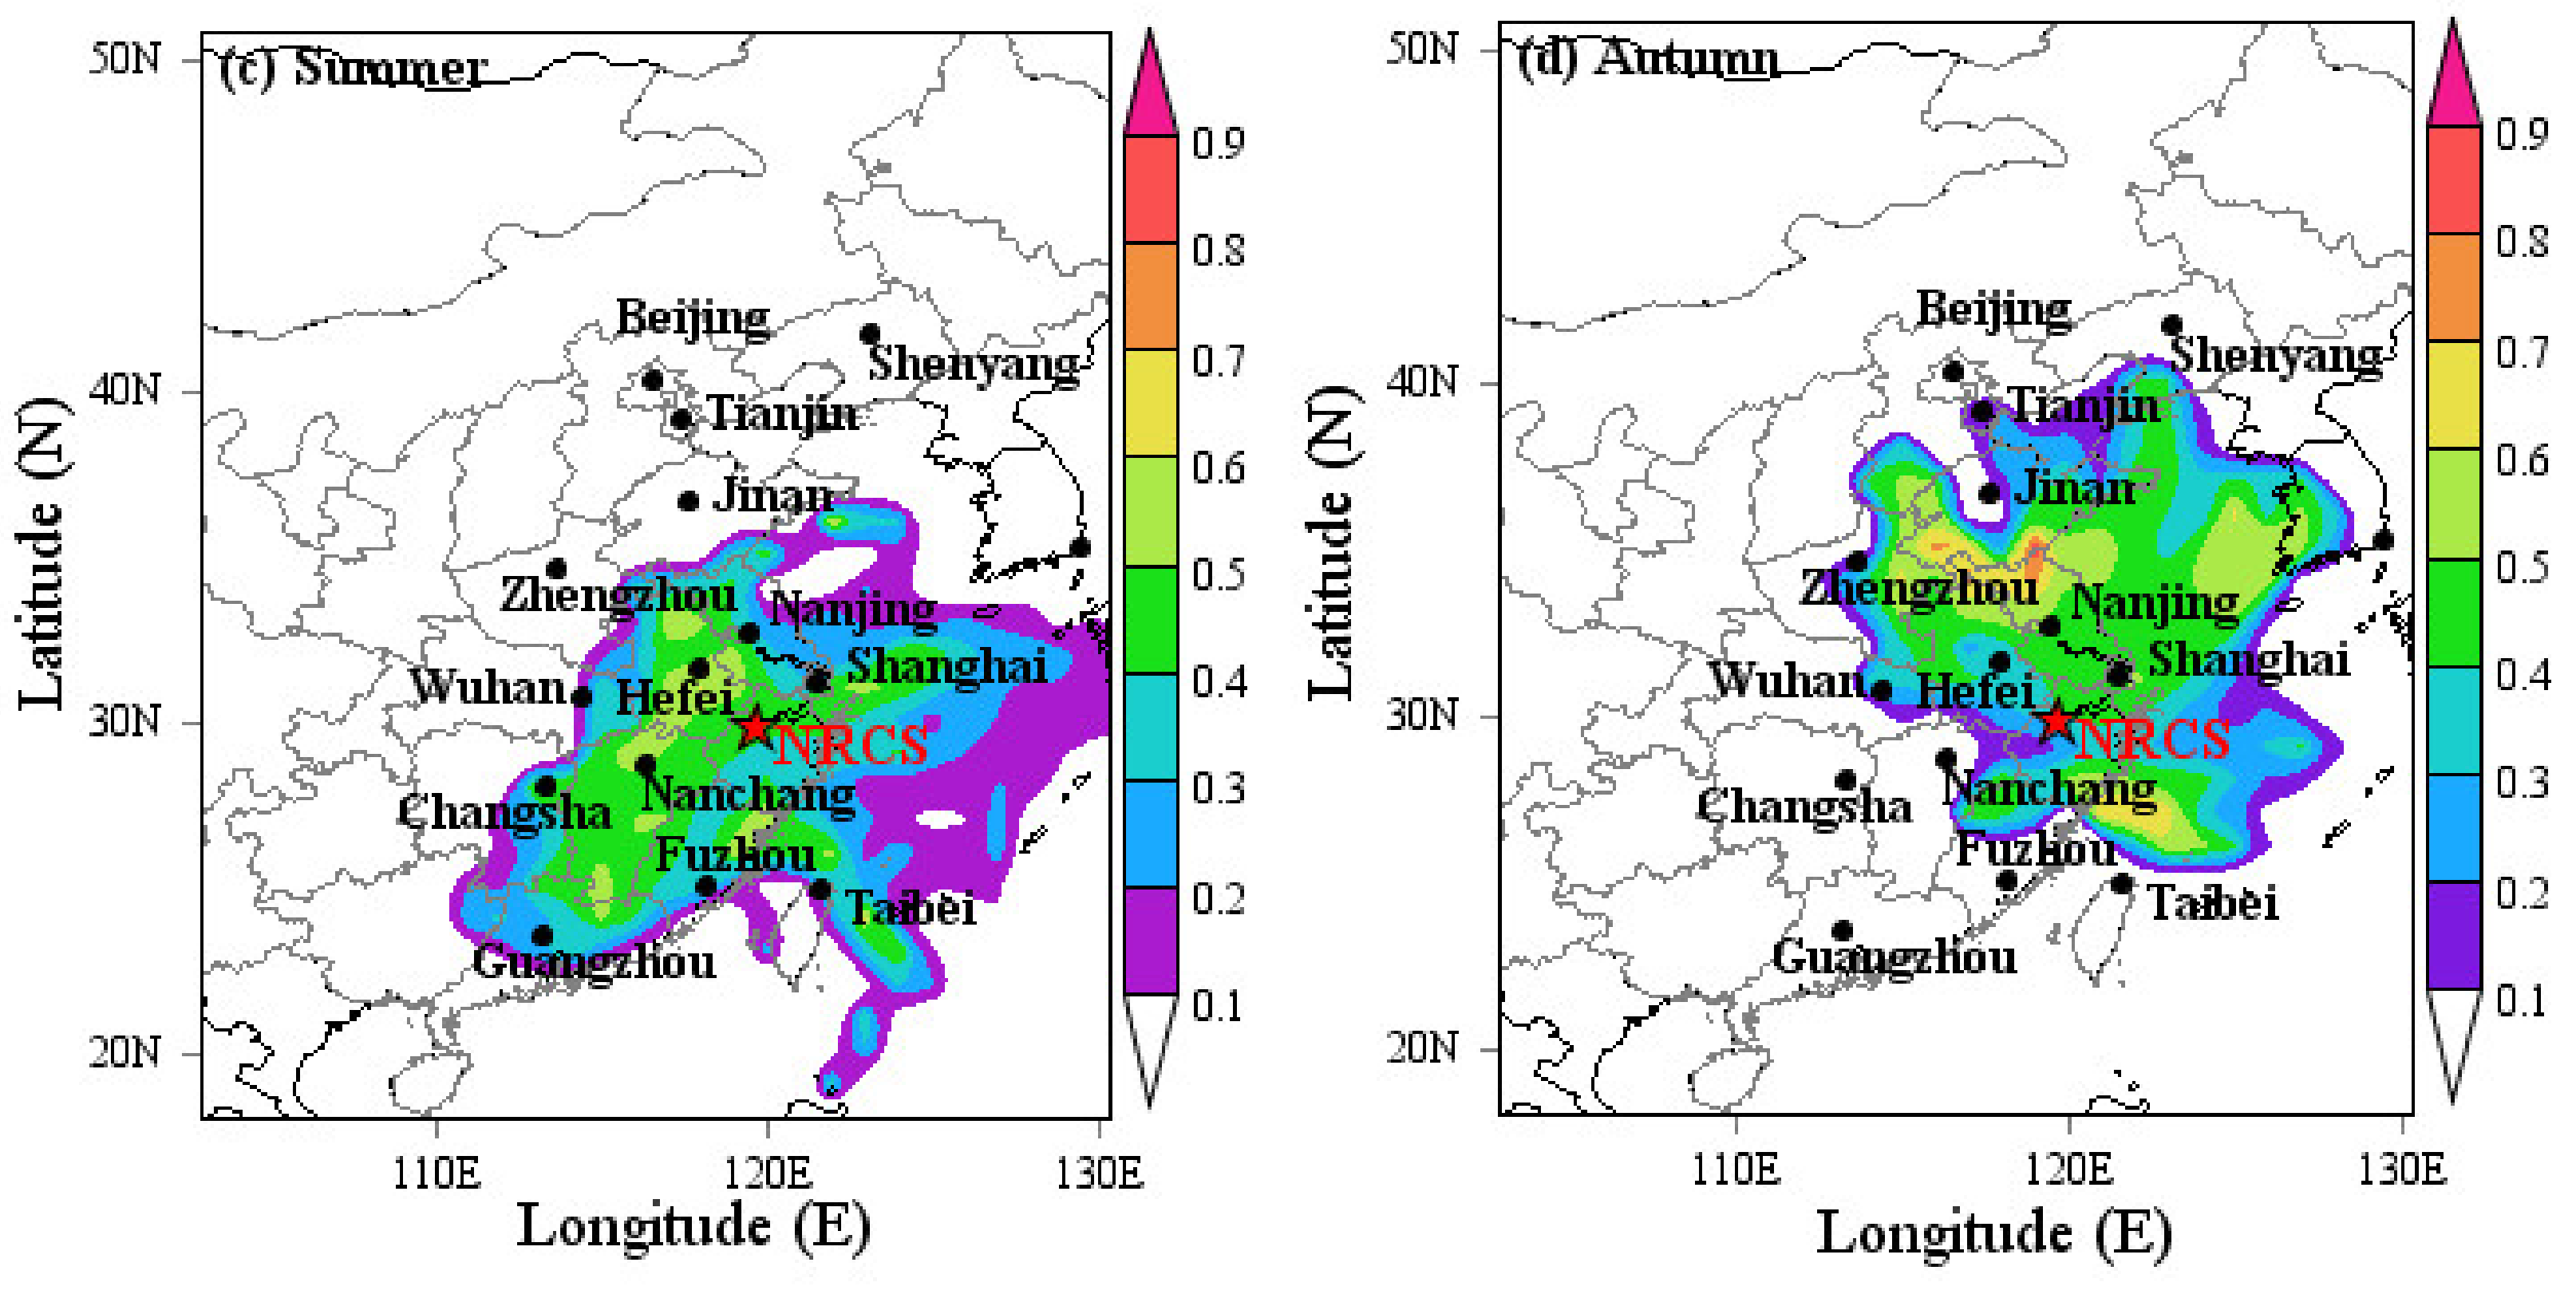
2.3. Air Mass Transport Analysis

The Hybrid Single-Particle Lagrangian Integrated Trajectory (HYSPLIT) was jointly developed by the National Ocean and Atmospheric Center (NOAA) and the Bureau of Meteorology of Australia, and was used in this study to simulate the source, transport and diffusion processes of atmospheric pollutants [35]. This method has been widely used to analyze the influence of air mass transport [36]. The backward trajectories of January, April, July and October were applied to represent the air mass transport of winter, spring, summer and autumn, respectively. The 24 h backward trajectories started every hour (0:00–23:00) and were calculated at 500 m above ground level (a.g.l.) each day using meteorological data (Global Data Assimilation System, ftp://arlftp.arlhp.noaa.gov/pub/archives/gdas1/, accessed on 6 June 2021). There are two common trajectory clustering analysis methods, namely the angle distance method and the European distance method. This study mainly focuses on the transport route of atmospheric component pollution in Hangzhou; thus, a cluster analysis of all the trajectories was also conducted to divide the abundant trajectories into distinct clusters by considering the angle distances. Considering the short lifetime of NOx [37], the long-range transport of this variation was not analyzed by backward trajectory in this study.
The potential source contribution function (PSCF) was further calculated to constrain the potential sources of regional O3. A trajectory plug-in for the MeteoInfo software developed by Wang et al. (http://www.meteothink.org/, accessed on 15 June 2021) was used to conduct a PSCF analysis. The PSCF method is a conditional probability function, and each region’s pollution contribution to the recipient point is characterized by the ratio of the residence time of the pollution trajectory to all trajectories in the passing region. A grid with a high PSCF value is interpreted as the potential source region, and the study region is divided into i × j grids. The PSCF is defined as Equation (1),
P S C F i j = m i j n i j
where nij is the residence time of all trajectories and mij is the residence time of the trajectory subset in the grid element (i, j).
The arriving height of the trajectory was 500 m a.g.l., the range of the PSCF was set as (120.17° N, 30.22° E) and the resolution was 1° × 1°. The 75th percentile of O3 over four seasons was used as the threshold for calculating mij [3]. In order to reduce the uncertainty of mij = nij for grid cells with limited points, the seasonal PSCF value was multiplied by a seasonal weight function, Wij, by using the method recommended by Polissar et al. [10]. It is expressed as the WPSCF to better reflect the uncertainty of the values of these cells, as expressed in Equation (2).
W i j = 1.00                                                 80 < n i j 0.70                           20 < n i j 80 0.42                         10 < n i j 20 0.05                                               n i j 10
Then, the WPSCFij can be expressed as Equation (3):
W P S C F i j = m i j n i j × W i j

3. Results and Discussion

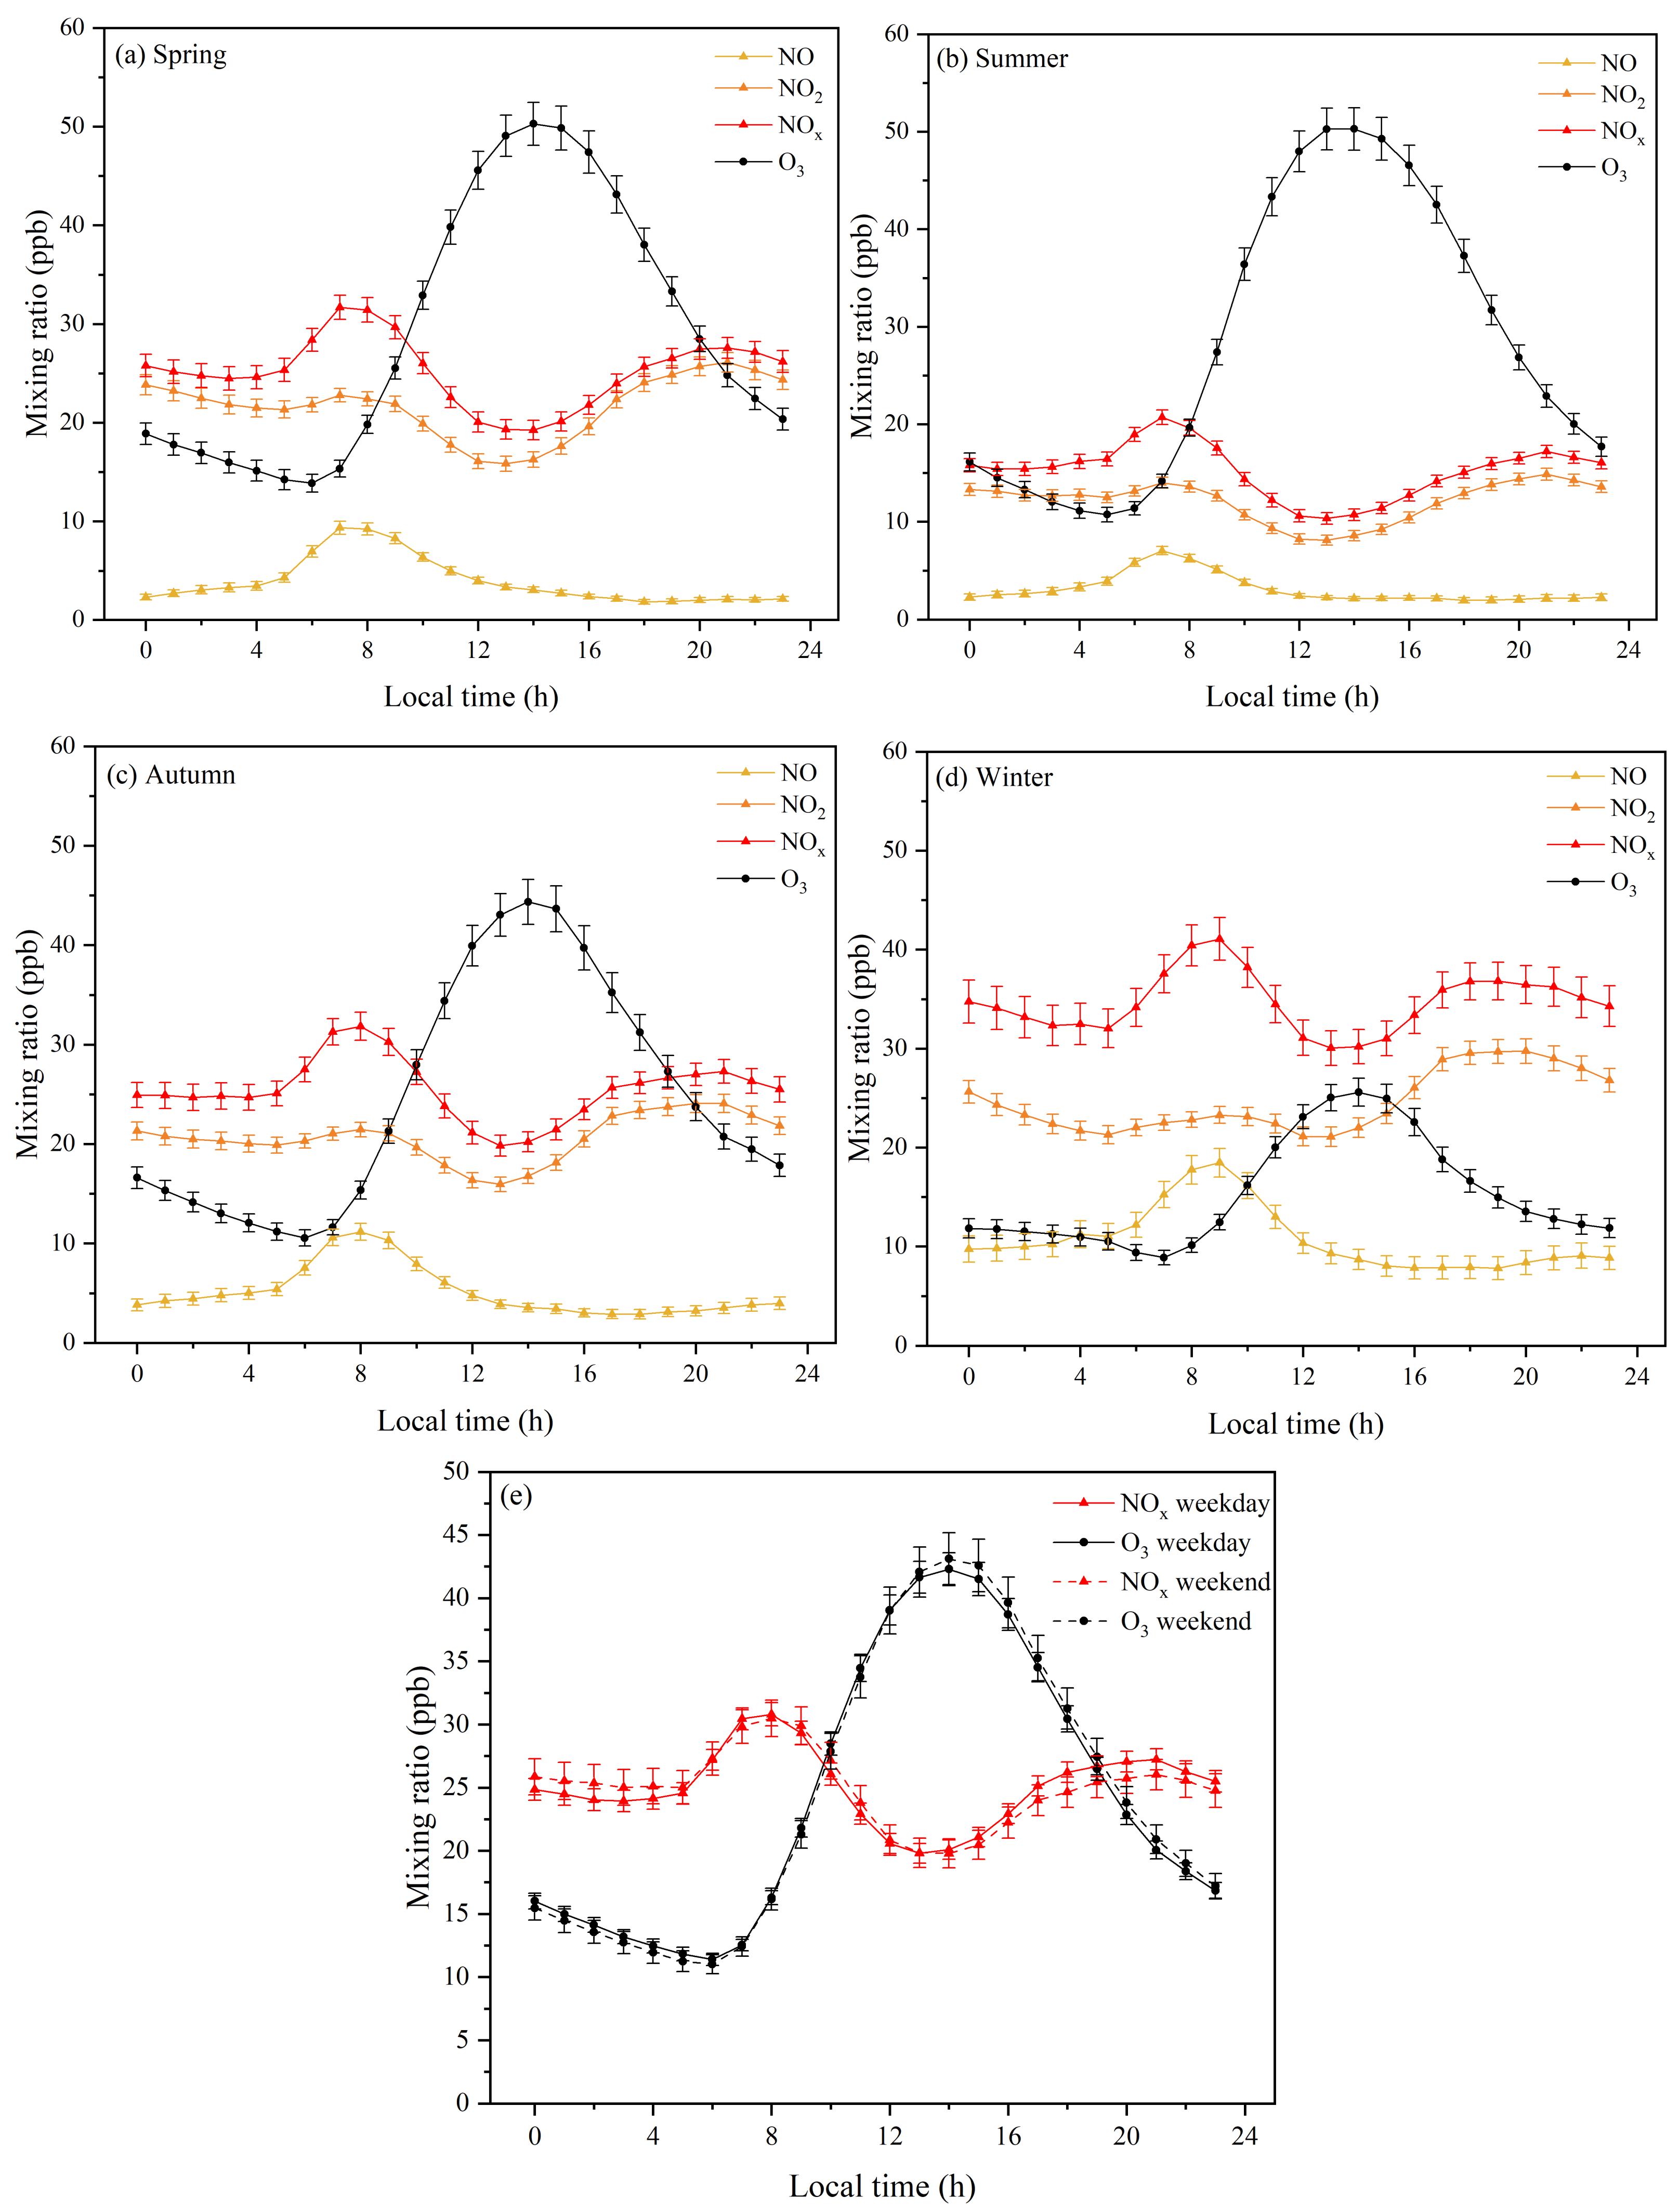
3.1. Diurnal Variations

Surface O3 mixing ratios obtained at the NRCS showed distinct diurnal variations with a single peak in all seasons (Figure 2); namely, a peak in the afternoon and a trough in the early morning. The peak value in summer was about 1 h ahead of those in other seasons (Figure 2) due to the earlier sunrise time and higher solar intensity, which stimulated the evolution of atmospheric O3 through photochemical oxidation reactions. Additionally, O3 mixing caused by the enhancement of the boundary layer height due to the thermal stratification and convective heat transfer of upper air to the ground might also contribute to the increase in the O3 level at noon [38]. The average O3 mixing ratios observed in spring (29.12 ± 1.40 ppb), summer (28.06 ± 1.35 ppb) and autumn (24.57 ± 1.43 ppb) were at a high level, while that observed in winter (15.28 ± 1.03 ppb) was much lower than the other three seasons.
Strong tropospheric photochemical reactions in summer produced high O3 mixing ratios. Theoretically, the O3 mixing ratios should be higher in summer than in spring. Nevertheless, the strong convective activity, which is characteristic of summer, led to higher levels of O3 mixing with precursors, resulting in a dilution of pollutants near the surface [39].
The average O3 mixing ratio in spring was ~4.55 ppb higher than in autumn. It has been reported that tropopause folding caused by the active subtropical jet at mid-latitudes in spring triggers the transport of O3 from the stratosphere to the troposphere [40], which might be the primary reason for the higher O3 mixing ratios in spring than in autumn. In addition, greenery removes air pollutants such as tropospheric O3 through leaf stomatal absorption [41]; Kašpar et al. [42] demonstrated that the high and dense canopy of mature trees traps air pollutants better than low saplings. The larger increment of O3 mixing ratios in Hangzhou in spring could also be caused by the vibrant photochemical reactions of abundant NOx and NMHC precursors which were accumulated over winter [19].
Unlike O3, the diurnal variation in NOx mixing ratios demonstrated a typical bimodal pattern in all seasons (Figure 2), with one peak in the morning (7:00–9:00 local time) and the other at night (21:00 local time), which was highly connected with anthropogenic emissions from traffic. Xue et al. [43] found that the high emission of motor vehicle pollutants was concentrated in the urban area of Hangzhou, and that the emission intensity decreased from the urban center to the urban edge. Without strong consumption by photochemical reactions, especially in the morning, NO emitted by traffic sources easily accumulates in the near-ground layer. Due to the decrease in the boundary layer thickness at night, the pollutants are trapped in the shallow surface with increasing mixing ratios [44], leading to NOx reaching its first peak in early morning (Figure 2). In this study, the second peak of the NOx mixing ratio occurred at 21:00–22:00 in all four seasons, which was 3–4 h after the evening rush hour. However, the fraction of NO2 in NOx was obviously higher than that in the morning, indicating that the conversion of NO to NO2 was much stronger in the evening.
Higher concentrations of O3 precursors were observed on weekdays, while O3 concentrations showed an opposite pattern, with higher concentrations on weekends, which has been reported as the “weekend effect” [45]. Mixing ratios of O3 and NOx vary significantly from weekends to weekdays in many big cities due to the regularity of human activities [46]. In Hangzhou, similar patterns of diurnal variations were observed during the observation period. During the daytime, we typically observed 0.28% lower daily NOx mixing ratios and 3.34% higher daily O3 mixing ratios on weekends than on weekdays when the photochemical reactions were active. As shown in Figure 2e, NOx mixing ratios on weekends were significantly higher than those on weekdays from 0:00 to 5:00, with a difference of 4.27%. From 7:00 to 9:00, the NOx mixing ratios on weekends were slightly lower than those on weekdays due to rush hour. From 14:00 to 23:00, the NOx mixing ratios were 3.82% lower on weekends than those on weekdays. The same diurnal trend on weekends and weekdays suggested the same sources of NOx, which might be attributed to people’s tendency for leisure time on weekends and the influence of downdrafts at night.
The O3 mixing ratios between 12:00 and 23:00 were larger on weekends than those on weekdays, with the peak appearing at 14:00 (43.11 ± 2.09 ppb). As a result of the intense illumination between 12:00 and 15:00, a large amount of O3 was generated by the photolysis of NO2 and trapped in the atmosphere. Lower NOx emissions on weekends could also reduce the NO titer of O3, thus making O3 accumulate earlier on weekends than on weekdays. Wang et al. [34] demonstrated that the decrease in NO titration is an indispensable factor in the elevated O3 mixing ratios over the weekend. Similar to results from Shanghai [29] and the BTH region [47], it was found that O3 increased as NOx decreased during the weekends in Hangzhou. The O3 “weekend effect” in urban areas is also attributed to the low concentrations of fine particles that reduce sunlight scattering and enhance visibility and photochemical reactions [48]. According to Figure 2e, the “weekend effect” of O3 was not apparent in Hangzhou. On the one hand, the visibility in Hangzhou on weekends (10,299.2 m) was not much higher than that on weekdays (9236.3 m); therefore, the conditions conducive to O3 generation might change slightly between weekdays and weekends. On the other hand, our research period is relatively recent, and in recent years, the implementation of vehicle control and other pollution emission control strategies in megacities in China have achieved good effects [49].

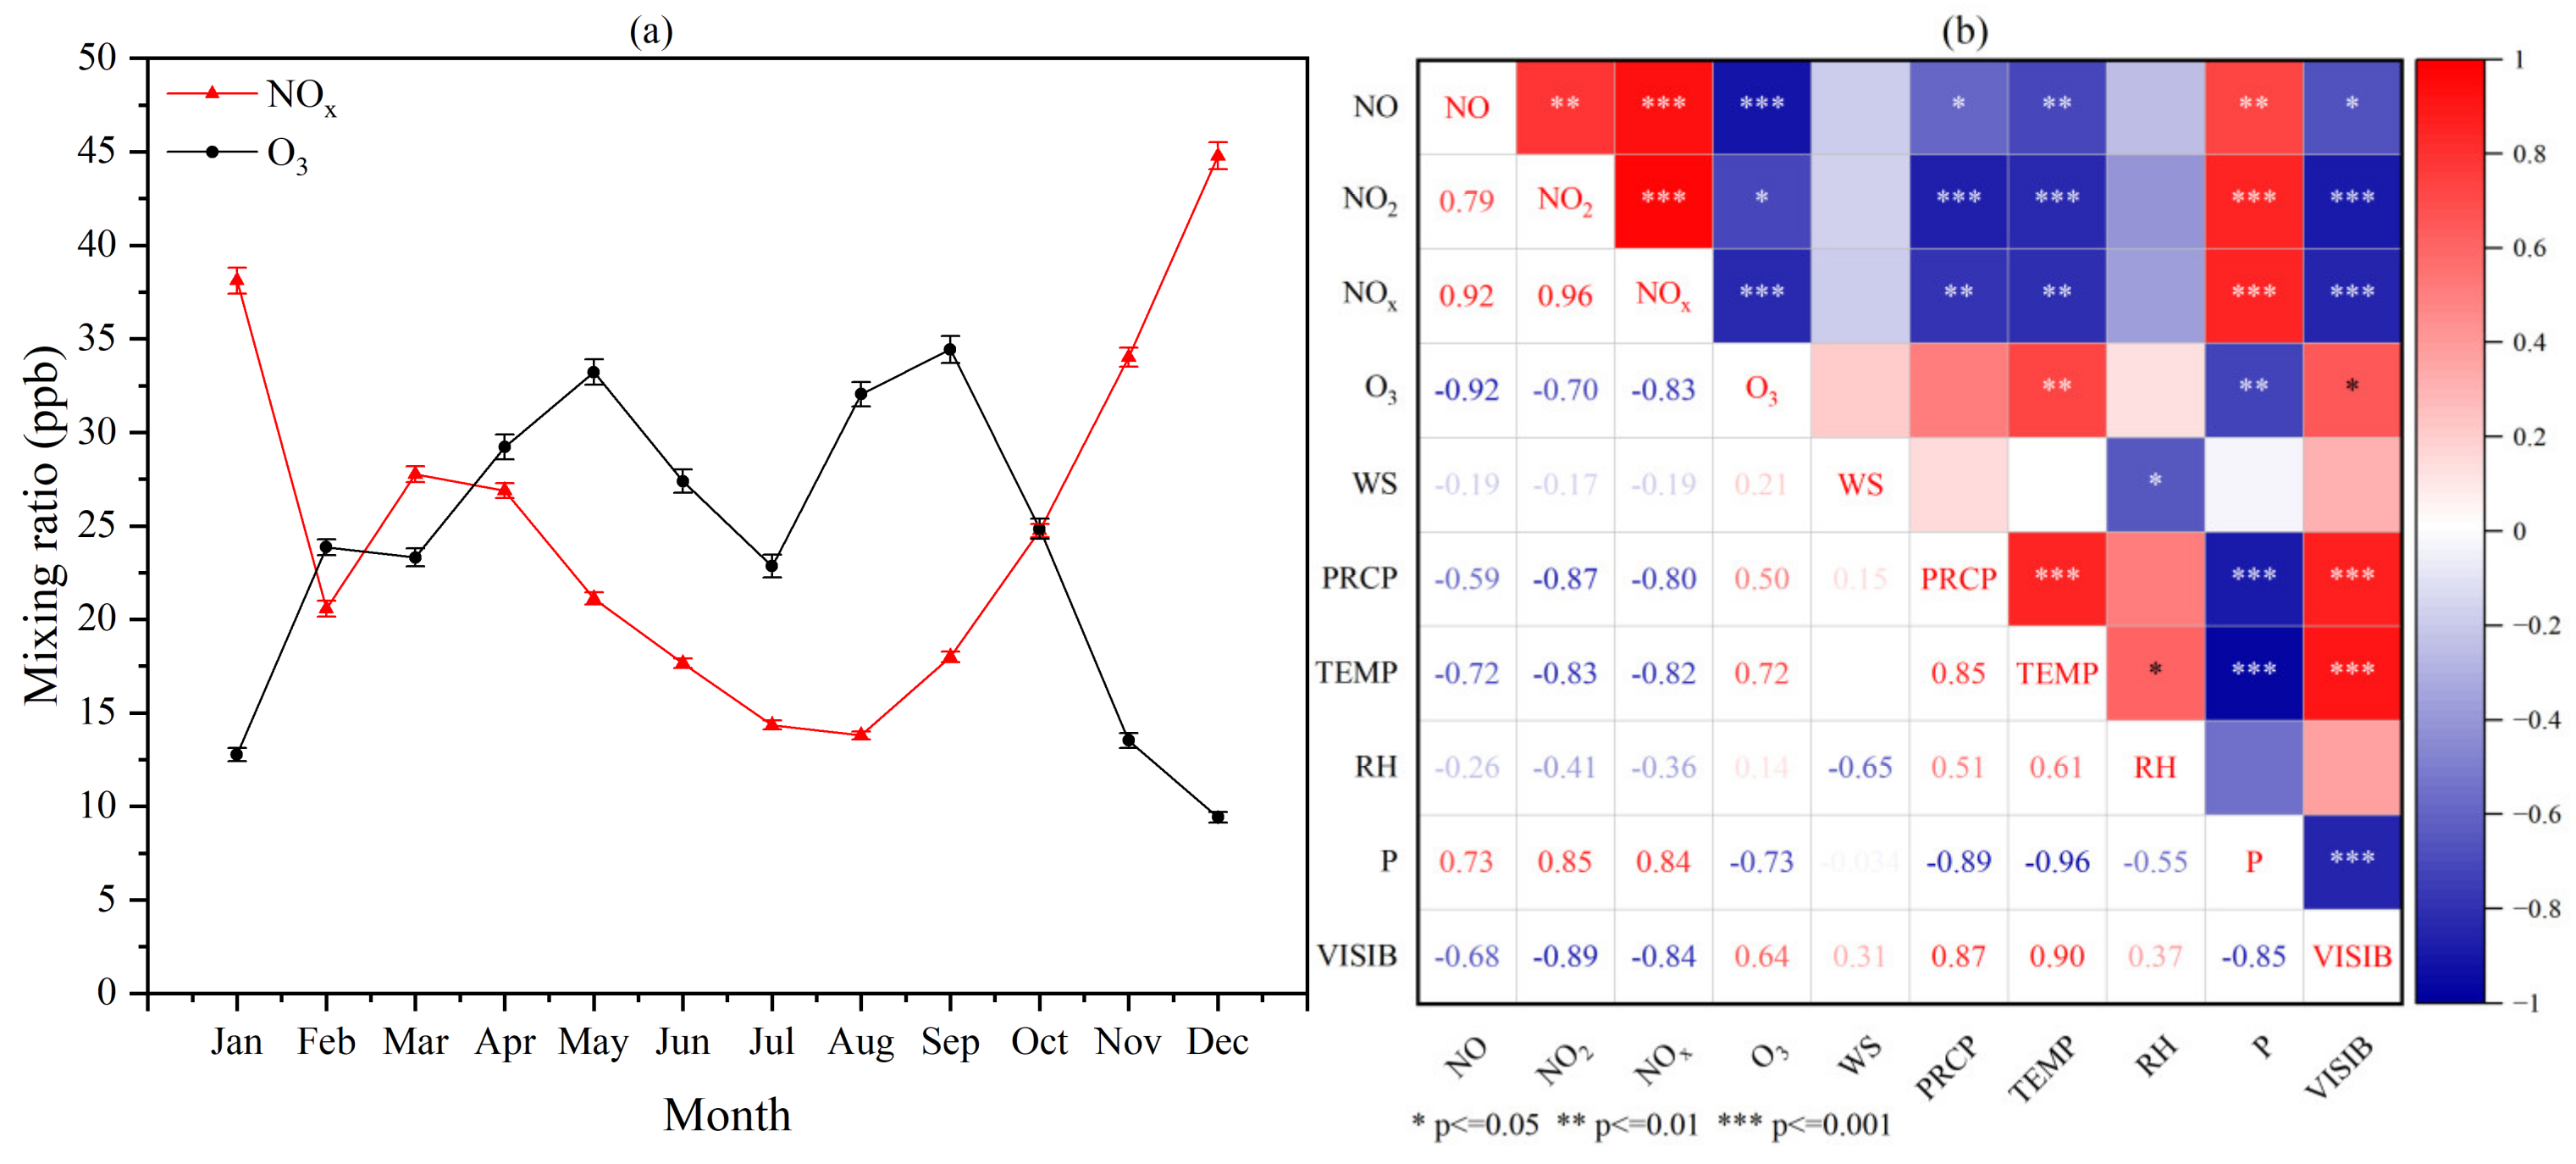
3.2. Monthly Variations

As can be seen from Figure 3a, the O3 mixing ratios showed a distinct bimodal pattern with two peaks in May (33.22 ± 0.68 ppb) and September (34.43 ± 0.72 ppb) and a valley in July (22.84 ± 0.61 ppb), which could be attributed to the influence of Asian summer monsoons [50,51]. The maximums might be related to the atmospheric instability and evident convection that occurred over the two months, which resulted in the transport of abundant O3 from the upper layer [52]. High O3 levels in May also appeared in studies in New Delhi [53], Weihai [54] and Shanghai [55]. In addition, Mao et al. [56] indicated that meteorological conditions such as intense solar radiation, low relative humidity, high visibility and high temperature in the YRD during the second half of the year were conducive to O3 formation, which is consistent with our correlation study (Figure 3b). There was a sharp decrease in atmospheric O3 in July (Figure 3a), with a trough value of 22.84 ± 0.61 ppb, despite this being the time when the solar radiation and the temperature are the highest in the year. This phenomenon was probably driven by the special regional climate in the YRD region. The period from the end of June to the beginning of July is the so-called “plum rain season” in Hangzhou, with an average precipitation of about 260 mm each year. A high density of moisture could not only absorb atmospheric O3, but also strengthen the wet removal effect [16].
The monthly average NOx mixing ratios from 2015 to 2021 had a clear variation pattern, with the highest value in December (44.78 ± 0.72 ppb) and the lowest value in August (13.79 ± 0.22 ppb) (Figure 3a). Similar to the variation in O3, heavy precipitation in summer also contributed to the depletion of atmospheric NOx, and eventually led to it being converted to nitric acid and nitrate particles, resulting in the minimum NOx mixing ratios of 13.79 ± 0.22 ppb in August [57]. Additionally, a high intensity of solar radiation in August contributed to an abundant concentration of OH radicals, leading to a high loss of NOx (NO2 + ·OH → HNO3) [58], which might also contribute to the lowest NOx value in August. After August, the temperature and visibility dropped, and the solar radiation became weaker, resulting in NOx accumulating and reaching its maximum in December. The highest mixing ratio of NOx in December can be explained by the following factors: (1) Insufficient vertical mixing and slower chemical loss due to the low temperature and weak solar radiation [19,57]. (2) Air masses with high mixing ratios of NOx were transported to the YRD region by winter monsoons from northern and northwestern China, where a large amount of NOx is emitted due to coal burning in winter [59]. (3) Hangzhou is located in the mid-latitude region. Bukhlova et al. [60] pointed out that temperature inversion was prone to prevail in the mid-latitude areas during wintertime, which is not conducive to the diffusion of pollutants.

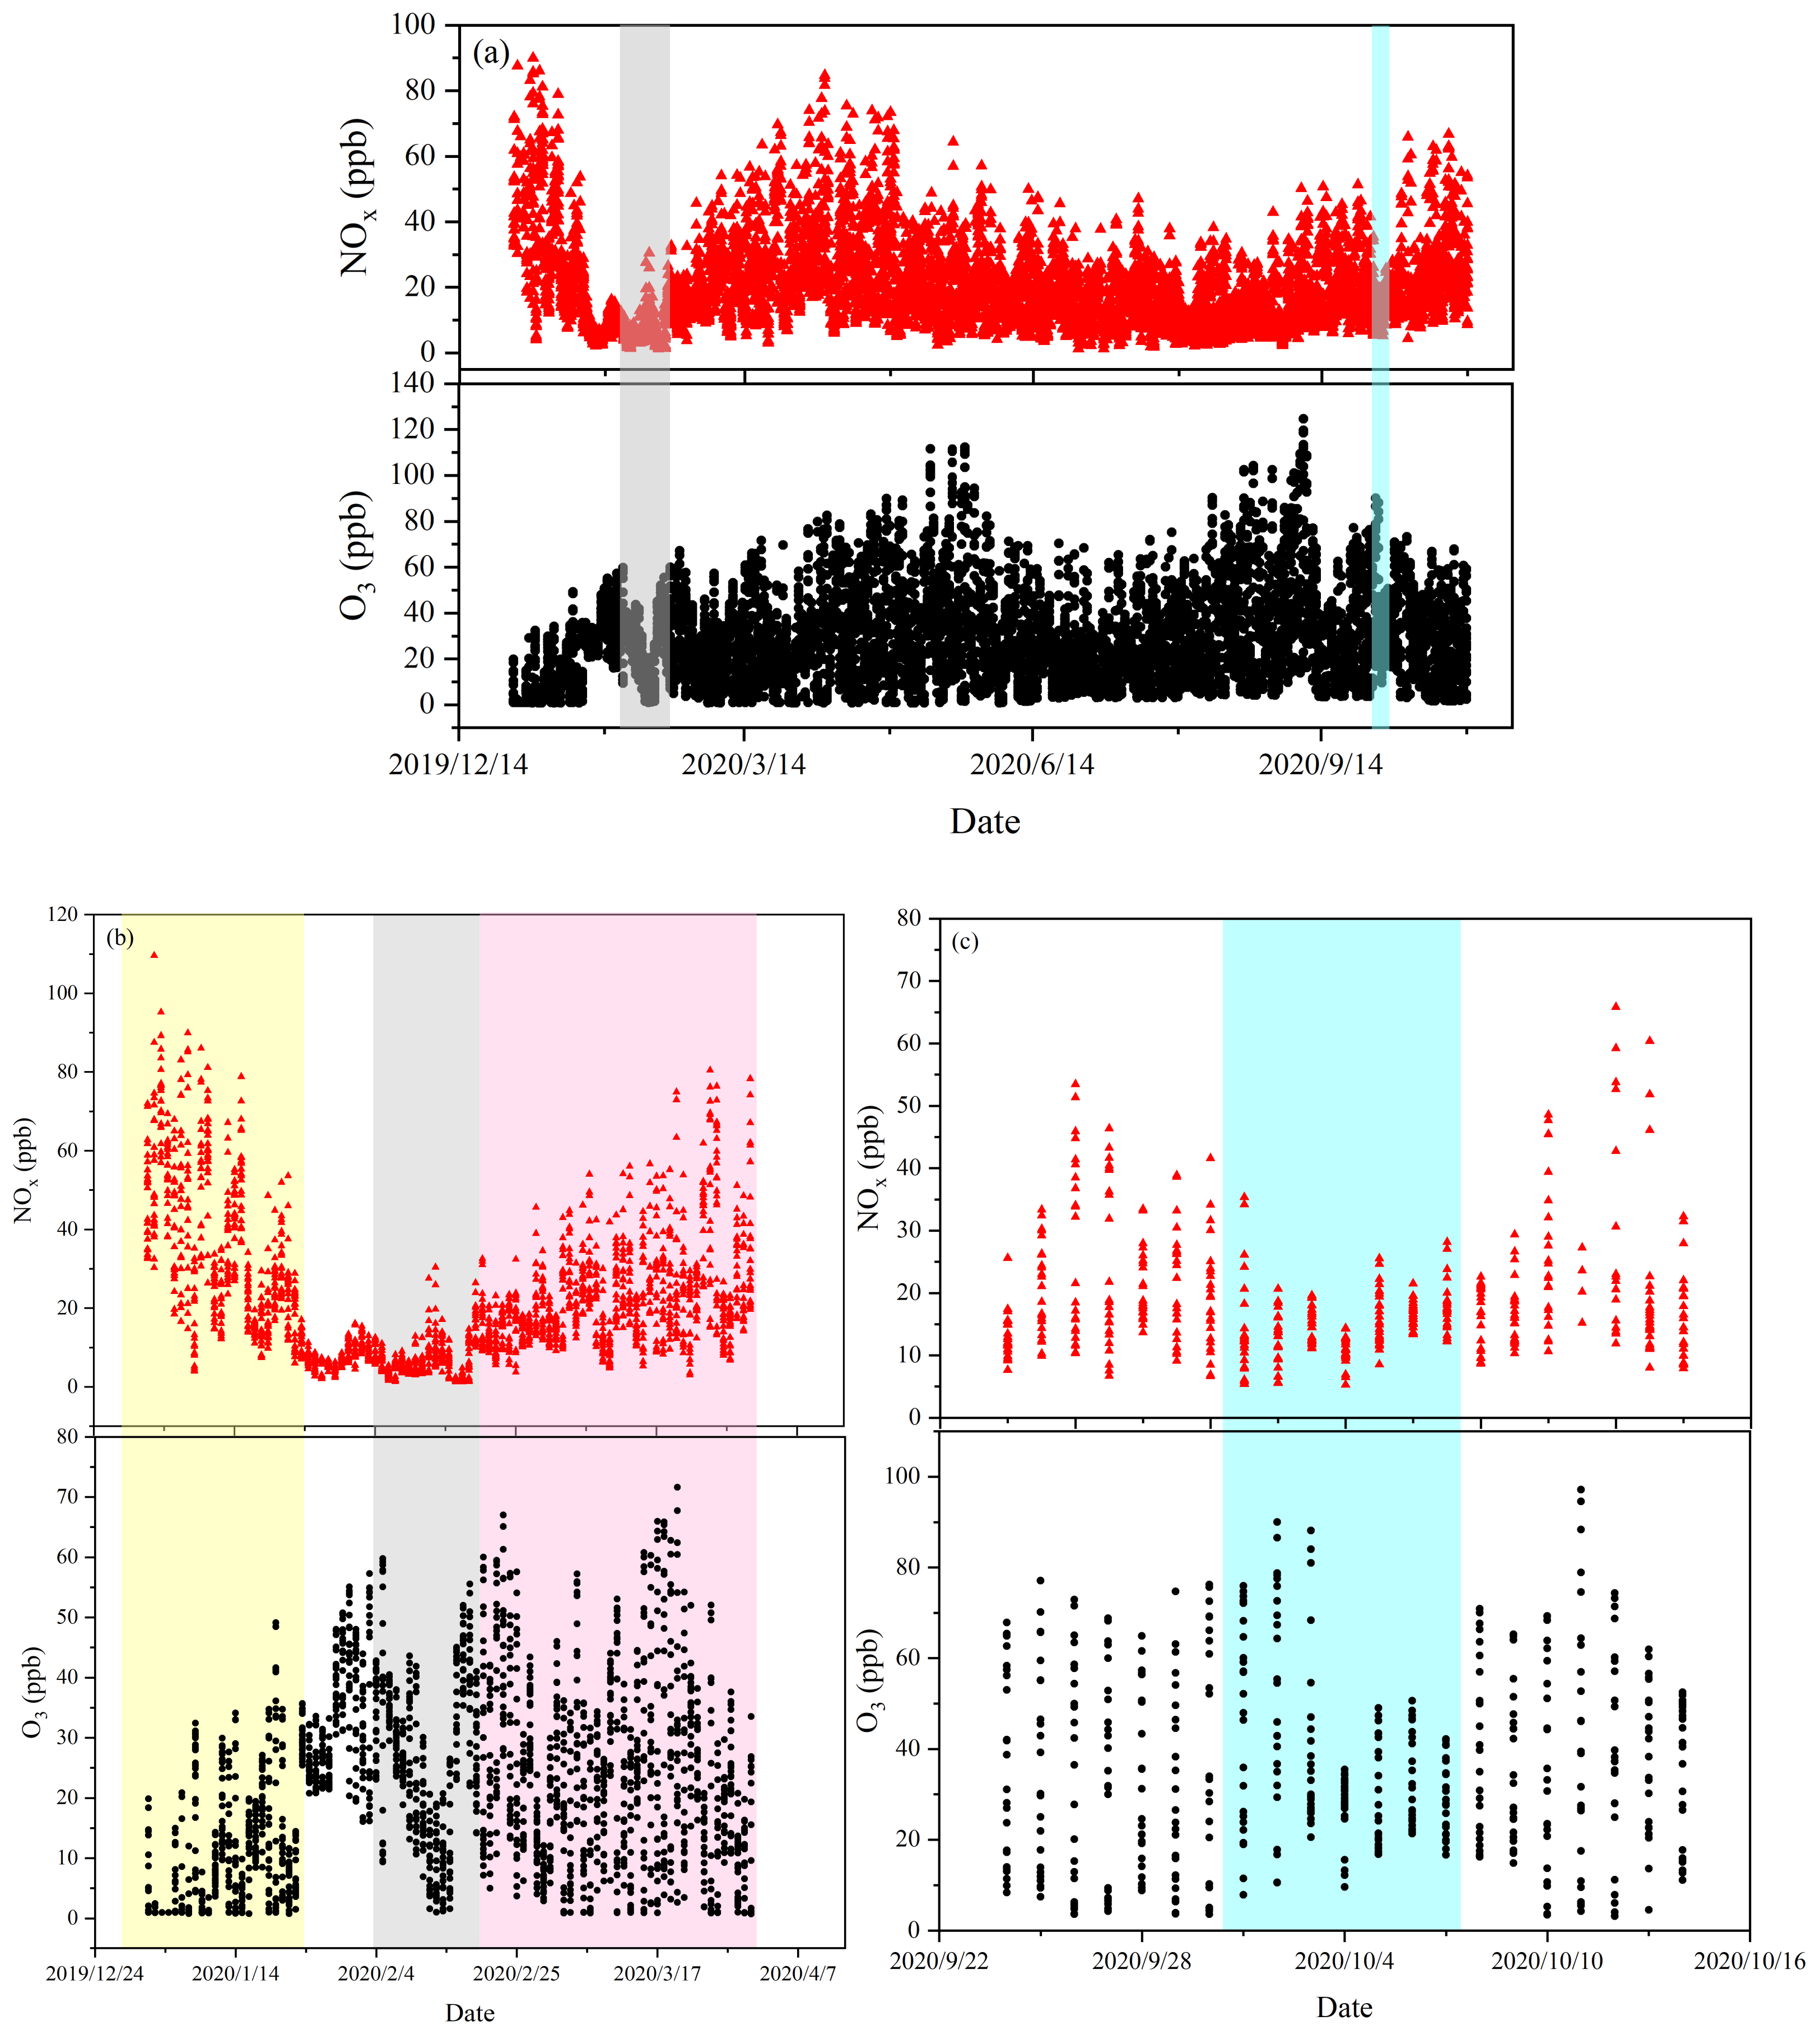
3.3. Impacts of Special Events

In order to assess the impacts of human activities on the variations in NOx and O3, observed data during two crucial and typical periods, the COVID-19 lockdown period (4 to 19 February 2020) and the National Day holiday (1 to 7 October 2020) in 2020, were obtained for our research (Figure 4).
According to time nodes and implementation of the COVID-19 prevention strategies and control notifications in Zhejiang Province, the COVID-19 pandemic period occurred mainly from January to March 2020 in Hangzhou, which can be divided into four phases: pre-COVID-19 (1 to 23 January 2020), Spring Festival (24 January to 3 February 2020), COVID-19 lockdown (4 to 19 February 2020) and post-COVID-19 (20 February to 31 March 2020).
Compared with pre-COVID-19 (1 to 23 January 2020), the NOx mixing ratios decreased by 82% during the lockdown in Hangzhou (4 to 19 February 2020), while O3 mixing ratios increased by more than 150% (Figure 4b). The special lockdown strategies also apparently resulted in the concentrations of PM2.5, NOx, SO2 and CO decreasing by 58%, 47%, 83%, 11% and 30%, respectively, in megacities in the YRD [61]. Data obtained by the pollution monitoring satellites from the National Aeronautics and Space Administration (NASA) also showed a considerable decrease in NO2 content in most parts of China during the lockdown period [62]. In Hangzhou, compared to the pre-COVID-19 period, the number of vehicles on the road during the lockdown (4 to 19 February 2020) decreased by 84%, and energy consumption by power plants and industry also decreased dramatically [63], which resulted in the observed drop in NOx mixing ratios. Meanwhile, since O3 production in Hangzhou was VOC limited [64,65], a decrease in NOx mixing ratios reduced the O3 titration effect, leading to a weaker sink in O3 during the COVID-19 lockdown. In addition, during the lockdown period, the intensification of solar radiation coincided with high visibility (more than 10 km), which was beneficial for O3 generation. Thus, the enhanced source strength and weakened sink caused an observed increase in O3 mixing ratios. However, the O3 mixing ratios in Hangzhou during the lockdown period were still below the critical value of the China Ambient Air Quality Standard II (GB3095-2012) (160 μg/m3 or 93.33 ppb, 1 h O3).
Compared with the last week of September, atmospheric NOx levels during the National Day holiday dropped by 28%, whereas O3 mixing ratios increased by 9% (Figure 4c). As a famous tourist destination, approximately 18 million tourists visit Hangzhou during the holiday each year (http://tb.hangzhou.gov.cn, accessed on 18 December 2021), which might to some extent enhance the anthropogenic emission of pollutants. However, on account of the implementation of anthropogenic and industrial emission control policies, the pollutant contents declined sharply during the National Day holiday of China in 2020 (1 to 7 October 2020).
In addition to anthropogenic factors, meteorological factors also play an important role in affecting the atmospheric NOx and O3 mixing ratios. Previous studies reported that a high air humidity induces enhanced cloud cover, which could weaken photochemical reactions, and consequently cause a reduction in O3 generation [19,21,66]. Meng et al. [67] also found that increased aerosol contents in the atmosphere could reduce visibility and contribute to the enhancement in light scattering, which negatively impacts photochemical reactions. Observed data from the NRCS showed that the humidity during the National Day holiday decreased from 73% to 69%, and the visibility increased from 15 km to 17 km. Thus, the fine weather (low air humidity and high visibility) during the National Day holiday in Hangzhou not only prevented the accumulation of pollutants at the ground level, but was also beneficial for the evolution of atmospheric O3 and induced a slightly higher O3 mixing ratio than that pre-holiday.

3.4. Impacts of Air Mass Transport

Figure 5 and Table 1 illustrate the cluster analysis of the 24 h air mass backward trajectories for each season and the average O3 mixing ratios of each cluster. The cluster trajectory length corresponds to the velocity of air mass transportation [36]. Long-distance and fast-moving trajectories originated primarily from the northwest (NW), north (N) and northeast (NE) in spring, autumn and winter, whereas their origin switched to the east (E), southwest (SW) and southeast (SE) in summer, as regulated by the seasonal eastern Asia monsoons.
In winter, air masses mainly came from north, and the transport distance was longer than that from other directions. Cluster 1 originated from the northern part of Anhui Province and was transported through Anhui to Hangzhou, accounting for 34.49%, whereas cluster 2 originated from the Yellow Sea and was transported through the southeastern part of Jiangsu Province, accounting for 31.84%. The long distance and fast movement of the two clusters could enhance the dilution and mixing of regional atmospheric pollutants, resulting in lower contents of O3 precursors [14]. However, the O3 mixing ratios within the slow movement of cluster 1 and 2 were relatively low and would not remarkably elevate O3 mixing ratios at the NRCS.
In spring, the O3 mixing ratio of each cluster was relatively high compared to the values in other seasons. As presented in Figure 5b, air masses mainly originated from the YRD and its close surrounding areas. Cluster 4 came from the Yellow Sea via Shanghai and had a relatively short length, but the highest mean O3 mixing ratio was 29.01 ± 2.69 ppb.
In summer, the air masses primarily came from the East China Sea, passing through Shanghai and the coastal cities of Zhejiang Province. Cluster 3, which accounted for 20.53%, had the highest O3 mixing ratio (35.50 ± 4.02 ppb) due to its short distance and slow movement, resulting in poor atmospheric diffusion conditions.
In autumn, the trajectories predominantly came from the Yellow Sea. It can be seen that O3 mixing ratios in marine air masses were high in different seasons, owing to sufficient chlorine free radicals in the marine boundary air, which could strongly promote the formation of O3 [68].
As shown in Figure 6, the potential sources of O3 suggested obvious seasonal variation characteristics, which is in line with our cluster analysis (Figure 5). In winter, a high WPSCF value (>0.6) indicated that the polluted air masses mainly came from the North China Plain and the Yellow Sea (Figure 6a).
In spring, high WPSCF values were mainly distributed in northeastern Anhui and western Shandong, where the pillar industries are steel, oil refining and coal (Figure 6b). In addition, the southeastern coastal area of Zhejiang also contributed to O3 pollution, which is consistent with previous research results [14].
High WPSCF values in summer were mainly distributed in central Anhui Province and the vegetation-rich junction between Jiangsu and Anhui Provinces (Figure 6c). A high O3 mixing ratio might be closely related to high VOC levels that were emitted by plants.
In autumn, potential source areas were mainly distributed in northern Jiangsu and the Yellow Sea (Figure 6d). Wang et al. [69] pointed out that the circulation of the sea–land breeze in coastal cities near the YRD and Hangzhou Bay was closely connected with urban O3 precursor emissions, which indirectly affected the increase in the O3 mixing ratio.

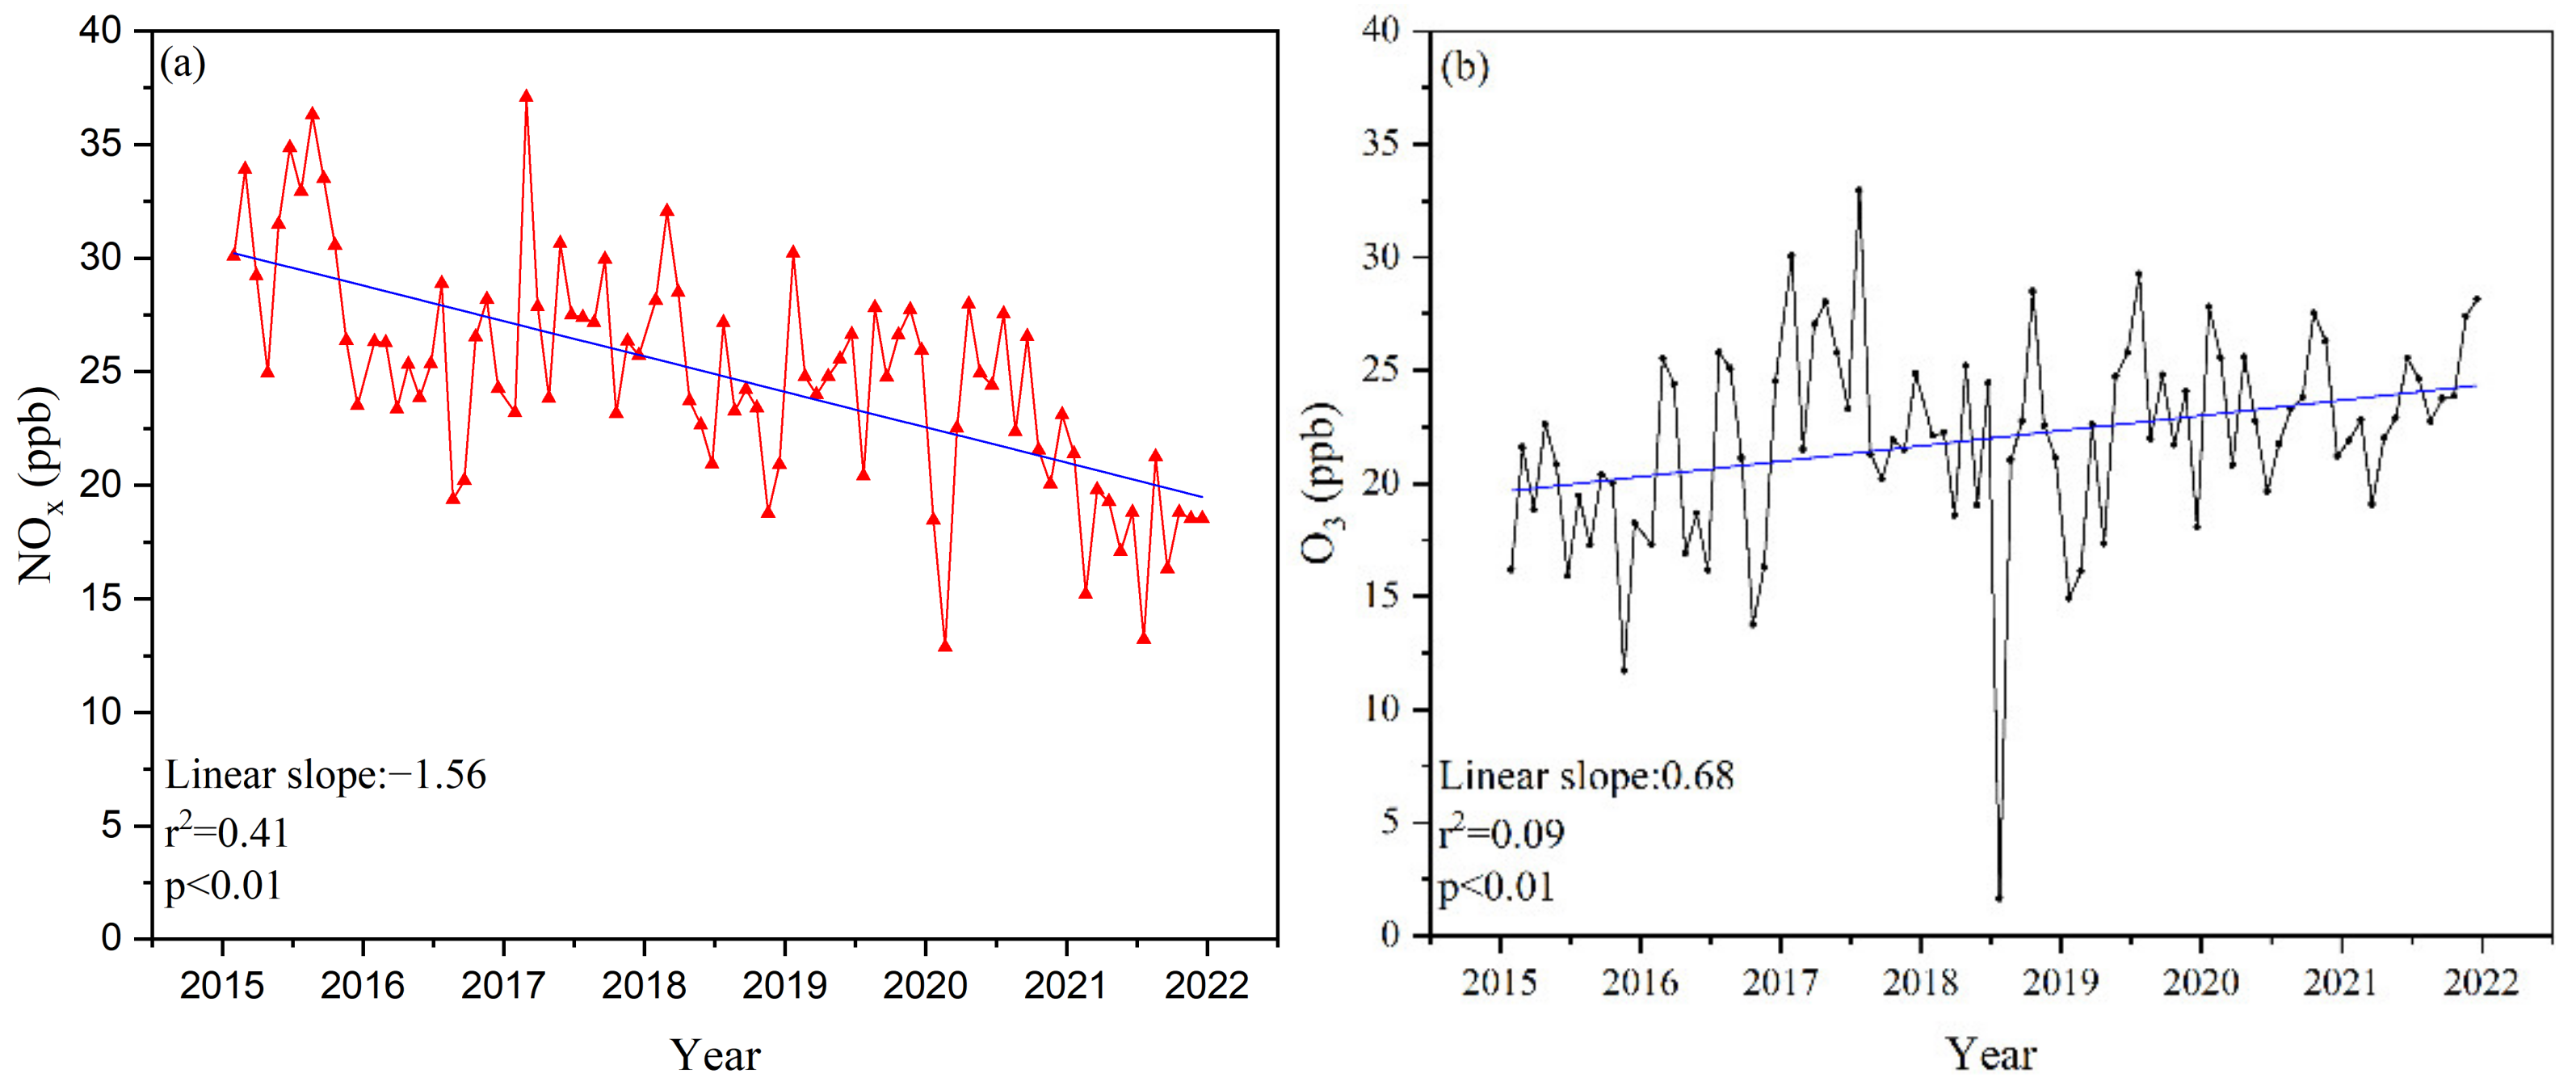
3.5. Trends in O3 and NOx Mixing Ratios from 2015 to 2021

Figure 7 displays the time series for NOx and O3 variation from 2015 to 2021. The long-term trends were evaluated based on a linear regression of average monthly data. It can be seen from Figure 7a that NOx shows a statistically significant downward trend (p < 0.01), with a decreasing rate of 1.56 ppb yr−1, which reflects the implementation of new air pollution control policies (such as improving fuel quality and emission standards) in Zhejiang Province during the 13th Five-Year Plan period [70].
Similar to the previous increasing trend in other cities in the Yangtze River Delta [24,71,72], the O3 levels in Hangzhou also showed a significant upward trend during 2015–2021 (p < 0.01), with an increasing rate of 0.68 ppb yr−1 (Figure 7b). Moreover, according to our observed data, there is a strong negative correlation between NOx and O3, with a negative correlation coefficient of 0.83 (Figure 3b). For instance, when the NOx mixing ratios were high/low (30.63 ± 2.56 ppb in 2015 and 18.18 ± 1.52 ppb in 2021), the O3 mixing ratios were low/high (18.60 ± 1.90 ppb in 2015 and 23.73 ± 1.57 in 2021) (Table 2). Thus, the increase in O3 might be related to the decrease in NOx during the same period.

4. Conclusions

Temporal variations in O3 and its NOx precursors from 2015 to 2021 at an urban site (NRCS) in Hangzhou, China, were investigated in this study. Diurnal variations in NOx and O3 mixing ratios were primarily influenced by local automobile exhaust, photochemical reactions and the height of the boundary layer. The elevated O3 mixing ratio in Hangzhou was not only affected by the emissions from adjacent cities in the YRD, but was also related to air mass transportation from the East China Sea and the Yellow Sea. Meanwhile, the NOx mixing ratio was high in winter, low in summer and moderate in spring and autumn in Hangzhou, which was regulated by coal burning and thermal inversion in the YRD region and northern China in winter, as well as by intensive wet removal caused by relatively heavy precipitation in summer.
A decrease in the NOx mixing ratio coincided with an increase in the O3 mixing ratio during the COVID-19 lockdown period and the National Day holiday in 2020, indicating that the former was directly impacted by anthropogenic emissions, whereas the latter was mainly regulated by local meteorological conditions and its precursor’s concentrations.
The mixing ratios of NOx showed a decreasing trend, while O3 showed an increasing trend between 2015 and 2021 in Hangzhou, which could be linked to new policy drivers and is consistent with air pollutant trends in most cities in China, implying that China still has a long way to go to reveal the complex regulation mechanisms of O3 pollution in cities. Additionally, this result proves that a longer observation should be conducted to precisely determine the long-term trend of O3 and NOx, which is currently being implemented by our team.

Author Contributions

Methodology, S.Q., R.D., G.T., K.Z.; Formal analysis, S.Q.; Writing—Original draft, S.Q.; Writing—review & editing, S.Q., R.D., G.T., K.Z., Y.L., Y.C., X.Q., J.L., H.X., K.J., H.H., S.F.; Resources, R.D., G.T., S.F.; Funding acquisition, K.Z., S.F.; Conceptualization, S.F. All authors have read and agreed to the published version of the manuscript.

Funding

This research was funded by [the National Key Research and Development Program of China] grant number [2020YFA0607502; 2020YFA0607501], [the National Natural Science Foundation of China] grant number [42275113], [the High-level Talent Special Support Plan in Zhejiang] grant number [2021R542048] and [the Fund of Key Laboratory of Global Change and Marine-Atmospheric Chemistry, MNR] grant number [GCMAC2001].

Institutional Review Board Statement

Not applicable.

Informed Consent Statement

Not applicable.

Data Availability Statement

All of O3, NOx and meteorological data were attained by National Reference Climatological Station; Data for backward trajectory and potential source analysis were from Global Data Assimilation System, ftp://arlftp.arlhp.noaa.gov/pub/archives/gdas1/ accessed on 25 February 2023.

Acknowledgments

This work was supported by the National Key Research and Development Program of China (2020YFA0607502; 2020YFA0607501), the National Natural Science Foundation of China (42275113), the High-level Talent Special Support Plan in Zhejiang (2021R542048) and the Fund of Key Laboratory of Global Change and Marine-Atmospheric Chemistry, MNR, (GCMAC2001). We would like to express our sincere gratitude to the National Reference Climatological Station in Hangzhou for providing air quality monitoring data and meteorological data, as well as to the anonymous reviewers for their valuable comments on this manuscript.

Conflicts of Interest

The authors declare no conflict of interest.

References

  1. Huang, L.; Zhang, C.; Bi, J. Development of land use regression models for PM2.5, SO2, NO2 and O3 in Nanjing, China. Environ. Res. 2017, 158, 542–552. [Google Scholar] [CrossRef] [PubMed]
  2. McDonald, B.C.; McKeen, S.A.; Cui, Y.Y.; Ahmadov, R.; Kim, S.-W.; Frost, G.J.; Pollack, I.B.; Peischl, J.; Ryerson, T.B.; Holloway, J.S.; et al. Modeling Ozone in the Eastern U.S. using a Fuel-Based Mobile Source Emissions Inventory. Environ. Sci. Technol. 2018, 52, 7360–7370. [Google Scholar] [CrossRef] [PubMed]
  3. Xu, W.; Xu, X.; Lin, M.; Lin, W.; Tarasick, D.; Tang, J.; Ma, J.; Zheng, X. Long-term trends of surface ozone and its influencing factors at the Mt Waliguan GAW station, China—Part 2: The roles of anthropogenic emissions and climate variability. Atmos. Chem. Phys. 2018, 18, 773–798. [Google Scholar] [CrossRef] [Green Version]
  4. Gilmore, C.K.; Barrett, S.R.H.; Koo, J.; Wang, Q. Temporal and spatial variability in the aviation NOx-related O3 impact. Environ. Res. Lett. 2013, 8, 034027. [Google Scholar] [CrossRef] [Green Version]
  5. Dickerson, R.R.; Kondragunta, S.; Stenchikov, G.; Civerolo, K.L.; Doddridge, B.G. The impact of aerosols on solar ultraviolet radiation and photochemical smog. Science 1997, 278, 827–830. [Google Scholar] [CrossRef] [Green Version]
  6. Liu, F.; Beirle, S.; Zhang, Q.; Dörner, S.; He, K.; Wagner, T. NOx lifetimes and emissions of cities and power plants in polluted background estimated by satellite observations. Atmos. Chem. Phys. 2016, 16, 5283–5298. [Google Scholar] [CrossRef] [Green Version]
  7. Sillman, S. The use of NOy, H2O2, and HNO3 as indicators for ozone-NOx-hydrocarbon sensitivity in urban locations. J. Geophys. Res. 1995, 100, 14175–14188. [Google Scholar] [CrossRef]
  8. Zhao, B.; Wang, S.X.; Liu, H.; Xu, J.Y.; Fu, K.; Klimont, Z.; Hao, J.M.; He, K.B.; Cofala, J.; Amann, M. NOx emissions in China: Historical trends and future perspectives. Atmos. Chem. Phys. 2013, 13, 9869–9897. [Google Scholar] [CrossRef] [Green Version]
  9. Yu, S.; Zhang, Q.; Yan, R.; Wang, S.; Li, P.; Chen, B.; Liu, W.; Zhang, X. Origin of air pollution during a weekly heavy haze episode in Hangzhou, China. Environ. Chem. Lett. 2014, 12, 543–550. [Google Scholar] [CrossRef]
  10. Polissar, A.V.; Hopke, P.K.; Kaufmann, Y.J.; Hall, D.K.; Bodhaine, B.A.; Dutton, E.G.; Harris, J.M. The aerosol at Barrow, Alaska: Long-term trends and source locations. Atmos. Environ. 1999, 33, 2441–2458. [Google Scholar] [CrossRef]
  11. Shi, C.; Wang, S.; Liu, R.; Zhou, R.; Li, D.; Wang, W.; Li, Z.; Cheng, T.; Zhou, B. A study of aerosol optical properties during ozone pollution episodes in 2013 over Shanghai, China. Atmos. Res. 2015, 153, 235–249. [Google Scholar] [CrossRef]
  12. Wang, T.; Xue, L.; Brimblecombe, P.; Lam, Y.F.; Li, L.; Zhang, L. Ozone pollution in China: A review of concentrations, meteorological influences, chemical precursors, and effects. Sci. Total Environ. 2017, 575, 1582–1596. [Google Scholar] [CrossRef] [PubMed]
  13. Li, J.; Chen, X.; Wang, Z.; Du, H.; Yang, W.; Sun, Y.; Hu, B.; Li, J.; Wang, W.; Wang, T.; et al. Radiative and heterogeneous chemical effects of aerosols on ozone and inorganic aerosols over East Asia. Sci. Total Environ. 2018, 622–623, 1327–1342. [Google Scholar] [CrossRef] [PubMed]
  14. Zhang, G.; Xu, H.; Qi, B.; Du, R.; Gui, K.; Wang, H.; Jiang, W.; Liang, L.; Xu, W. Characterization of atmospheric trace gases and particulate matter in Hangzhou, China. Atmos. Chem. Phys. 2018, 18, 1705–1728. [Google Scholar] [CrossRef] [Green Version]
  15. Bae, C.; Kim, H.C.; Kim, B.-U.; Kim, S. Surface ozone response to satellite-constrained NOx emission adjustments and its implications. Environ. Pollut. 2020, 258, 113469. [Google Scholar] [CrossRef] [PubMed]
  16. Boleti, E.; Hueglin, C.; Takahama, S. Trends of surface maximum ozone concentrations in Switzerland based on meteorological adjustment for the period 1990–2014. Atmos. Environ. 2019, 213, 326–336. [Google Scholar] [CrossRef]
  17. Pearce, J.L.; Beringer, J.; Nicholls, N.; Hyndman, R.J.; Tapper, N.J. Quantifying the influence of local meteorology on air quality using generalized additive models. Atmos. Environ. 2011, 45, 1328–1336. [Google Scholar] [CrossRef]
  18. Cheng, N.; Li, R.; Xu, C.; Chen, Z.; Chen, D.; Meng, F.; Cheng, B.; Ma, Z.; Zhuang, Y.; He, B.; et al. Ground ozone variations at an urban and a rural station in Beijing from 2006 to 2017: Trend, meteorological influences and formation regimes. J. Clean. Prod. 2019, 235, 11–20. [Google Scholar] [CrossRef]
  19. Tong, L.; Zhang, H.; Yu, J.; He, M.; Xu, N.; Zhang, J.; Qian, F.; Feng, J.; Xiao, H. Characteristics of surface ozone and nitrogen oxides at urban, suburban and rural sites in Ningbo, China. Atmos. Res. 2017, 187, 57–68. [Google Scholar] [CrossRef]
  20. Vogel, B.; Riemer, N.; Vogel, H.; Fiedler, F. Findings on NOy as an indicator for ozone sensitivity based on different numerical simulations. J. Geophys. Res. Atmos. 1999, 104, 3605–3620. [Google Scholar] [CrossRef] [Green Version]
  21. Tu, J.; Xia, Z.G.; Wang, H.; Li, W. Temporal variations in surface ozone and its precursors and meteorological effects at an urban site in China. Atmos. Res. 2007, 85, 310–337. [Google Scholar] [CrossRef]
  22. Wang, J.; Ho, S.S.H.; Ma, S.; Cao, J.; Dai, W.; Liu, S.; Shen, Z.; Huang, R.; Wang, G.; Han, Y. Characterization of PM2.5 in Guangzhou, China: Uses of organic markers for supporting source apportionment. Sci. Total Environ. 2016, 550, 961–971. [Google Scholar] [CrossRef] [PubMed]
  23. Wang, F.; Xu, J.; Huang, Y.; Xiu, G. Characterization of Black Carbon and Its Correlations with VOCs in the Northern Region of Hangzhou Bay in Shanghai, China. Atmosphere 2021, 12, 870. [Google Scholar] [CrossRef]
  24. Gao, W.; Tie, X.; Xu, J.; Huang, R.; Mao, X.; Zhou, G.; Chang, L. Long-term trend of O3 in a mega City (Shanghai), China: Characteristics, causes, and interactions with precursors. Sci. Total Environ. 2017, 603–604, 425–433. [Google Scholar] [CrossRef]
  25. Xu, Z.; Huang, X.; Nie, W.; Shen, Y.; Zheng, L.; Xie, Y.; Wang, T.; Ding, K.; Liu, L.; Zhou, D.; et al. Impact of Biomass Burning and Vertical Mixing of Residual-Layer Aged Plumes on Ozone in the Yangtze River Delta, China: A Tethered-Balloon Measurement and Modeling Study of a Multiday Ozone Episode. J. Geophys. Res. Atmos. 2018, 123, 11,786–11,803. [Google Scholar] [CrossRef]
  26. Atkinson, R. Atmospheric Chemistry of VOCs and NOx. Atmos. Environ. 2002, 34, 2063–2101. [Google Scholar] [CrossRef]
  27. Wang, N.; Lyu, X.; Deng, X.; Huang, X.; Jiang, F.; Ding, A. Aggravating O3 pollution due to NOx emission control in eastern China. Sci. Total Environ. 2019, 677, 732–744. [Google Scholar] [CrossRef]
  28. An, J.; Shi, Y.; Wang, J.; Zhu, B. Temporal Variations of O3 and NOx in the Urban Background Atmosphere of Nanjing, East China. Arch. Environ. Contam. Toxicol. 2016, 71, 224–234. [Google Scholar] [CrossRef]
  29. Shao, P.; An, J.; Xin, J.; Wu, F.; Wang, J.; Ji, D.; Wang, Y. Source apportionment of VOCs and the contribution to photochemical ozone formation during summer in the typical industrial area in the Yangtze River Delta, China. Atmos. Res. 2016, 176–177, 64–74. [Google Scholar] [CrossRef]
  30. Ding, A.J.; Huang, X.; Nie, W.; Sun, J.N.; Kerminen, V.M.; Petäjä, T.; Su, H.; Cheng, Y.F.; Yang, X.Q.; Wang, M.H.; et al. Enhanced haze pollution by black carbon in megacities in China. Geophys. Res. Lett. 2016, 43, 2873–2879. [Google Scholar] [CrossRef]
  31. Duan, J.; Tan, J.; Yang, L.; Wu, S.; Hao, J. Concentration, sources and ozone formation potential of volatile organic compounds (VOCs) during ozone episode in Beijing. Atmos. Res. 2008, 88, 25–35. [Google Scholar] [CrossRef]
  32. Xie, M.; Zhu, K.; Wang, T.; Chen, P.; Han, Y.; Li, S.; Zhuang, B.; Shu, L. Temporal characterization and regional contribution to O3 and NOx at an urban and a suburban site in Nanjing, China. Sci. Total Environ. 2016, 551–552, 533–545. [Google Scholar] [CrossRef] [PubMed]
  33. Shan, W.; Yin, Y.; Zhang, J.; Ding, Y. Observational study of surface ozone at an urban site in East China. Atmos. Res. 2008, 89, 252–261. [Google Scholar] [CrossRef]
  34. Wang, Y.; Konopka, P.; Liu, Y.; Chen, H.; Mvller, R.; Ploger, F.; Riese, M.; Cai, Z.; Lv, D. Tropospheric ozone trend over Beijing from 2002–2010: Ozonesonde measurements and modelling analysis. Atmos. Chem. Phys. 2012, 12, 8389–8399. [Google Scholar] [CrossRef] [Green Version]
  35. Wang, Y.Q.; Zhang, X.Y.; Draxler, R.R. TrajStat: GIS-based software that uses various trajectory statistical analysis methods to identify potential sources from long-term air pollution measurement data. Environ. Modell. Softw. 2009, 24, 938–939. [Google Scholar] [CrossRef]
  36. Fang, S.X.; Pieter, P.T.; Yao, B.; Luan, T.; Wu, Y.L.; Yu, D.J. Study of atmospheric CO2 and CH4 at Longfengshan WMO/GAW regional station: The variations, trends, influence of local sources/sinks, and transport. Sci. China Earth Sci. 2017, 60, 1886–1895. [Google Scholar] [CrossRef]
  37. Shah, V.; Jacob, D.J.; Li, K.; Silvern, R.F.; Zhai, S.; Liu, M.; Lin, J.; Zhang, Q. Effect of changing NOx; lifetime on the seasonality and long-term trends of satellite-observed tropospheric NOx columns over China. Atmos. Chem. Phys. 2020, 20, 1483–1495. [Google Scholar] [CrossRef] [Green Version]
  38. Swamy, Y.V.; Venkanna, R.; Nikhil, G.N.; Chitanya, D.N.S.K.; Sinha, P.R.; Ramakrishna, M.; Rao, A.G. Impact of Nitrogen Oxides, Volatile Organic Compounds and Black Carbon on Atmospheric Ozone Levels at a Semi Arid Urban Site in Hyderabad. Aerosol Air Qual. Res. 2012, 12, 662–671. [Google Scholar] [CrossRef] [Green Version]
  39. David, L.; Nair, P. Diurnal and seasonal variability of surface ozone and NOx at a tropical coastal site: Association with mesoscale and synoptic meteorological conditions. J. Geophys. Res. 2011, 116, D10303. [Google Scholar] [CrossRef]
  40. Wimmers, A.J. Signatures of tropopause folding in satellite imagery. J. Geophys. Res. 2003, 108, 8360. [Google Scholar] [CrossRef]
  41. Laisk, A.; Kull, O.; Moldau, H. Ozone concentration in leaf intercellular air spaces is close to zero. Plant Physiol. 1989, 90, 1163–1167. [Google Scholar] [CrossRef] [PubMed] [Green Version]
  42. Kašpar, V.; Zapletal, M.; Samec, P.; Komárek, j.; Bílek, J.; Juráñ, S. Unmanned aerial systems for modelling air pollution removal by urban greenery. J. Ufug. 2022, 78, 127757. [Google Scholar] [CrossRef]
  43. Xue, J.; Tian, W.; Zhang, Q. Development of NOx Emission Inventory from Motor Vehicles in Hangzhou and Study on Its Inflience on Air Quality. Res. Environ. Sci. 2010, 23, 613–618. [Google Scholar]
  44. Lal, S.; Naja, M.; Subbaraya, B.H. Seasonal variations in surface ozone and its precursors over an urban site in India. Atmos. Environ. 2000, 34, 2713–2724. [Google Scholar] [CrossRef]
  45. Sadanaga, Y.; Shibata, S.; Hamana, M.; Takenaka, N.; Bandow, H. Weekday/weekend difference of ozone and its precursors in urban areas of Japan, focusing on nitrogen oxides and hydrocarbons. Atmos. Environ. 2008, 42, 4708–4723. [Google Scholar] [CrossRef]
  46. Schipa, I.; Tanzarella, A.; Mangia, C. Differences between weekend and weekday ozone levels over rural and urban sites in Southern Italy. Environ. Monit. Assess. 2009, 156, 509–523. [Google Scholar] [CrossRef] [PubMed]
  47. Wang, Y.H.; Hu, B.; Ji, D.S.; Liu, Z.R.; Tang, G.Q.; Xin, J.Y.; Zhang, H.X.; Song, T.; Wang, L.L.; Gao, W.K.; et al. Ozone weekend effects in the Beijing–Tianjin–Hebei metropolitan area, China. Atmos. Chem. Phys. 2014, 14, 2419–2429. [Google Scholar] [CrossRef] [Green Version]
  48. Pont, V.; Fontan, J. Comparison between weekend and weekday ozone concentration in large cities in France. Atmos. Environ. 2001, 35, 1527–1535. [Google Scholar] [CrossRef]
  49. Song, X.; Hao, Y. Vehicular emission inventory and reduction scenario analysis in the Yangtze River Delta, China. Int. J. Environ. Res. Pub. He. 2019, 16, 4790. [Google Scholar] [CrossRef] [Green Version]
  50. Wang, H.; Zhou, L.; Tang, X. Ozone concentrations in rural regions of the Yangtze River Delta in China. J. Atmos. Chem. 2006, 54, 255–265. [Google Scholar] [CrossRef]
  51. Xu, X.; Lin, W.; Wang, T.; Yan, P.; Tang, J.; Meng, Z.; Wang, Y. Long-term trend of surface ozone at a regional background station in eastern China 1991–2006: Enhanced variability. Atomos. Chem. Phys. 2008, 8, 2595–2607. [Google Scholar] [CrossRef] [Green Version]
  52. Zhang, B.; Oanh, N. Photochemical smog pollution in the Bangkok Metropolitan Region of Thailand in relation to O3 precursor concentrations and meteorological conditions. Atmos. Environ. 2002, 36, 4211–4222. [Google Scholar] [CrossRef]
  53. Jana, P.K.; Goswami, S.; Midya, S.M. Short-term tropospheric ozone trend in India. Indian J. Phys. 2012, 86, 951–960. [Google Scholar] [CrossRef]
  54. Zhang, J.; Chao, W.; Qu, K.; Ding, J.W.; Shang, Y.Q.; Liu, H.F.; Wei, M. Characteristics of Ozone Pollution, Regional Distribution and Causes during 2014–2018 in Shandong Province, East China. Atmosphere 2019, 10, 501. [Google Scholar] [CrossRef] [Green Version]
  55. Chang, L.; He, F.; Tie, X.; Xu, J.; Gao, W. Meteorology driving the highest ozone level occurred during mid-spring to early summer in Shanghai, China. Sci. Total Environ. 2021, 785, 147253. [Google Scholar] [CrossRef]
  56. Mao, M.J.; Liu, H.T.; Du, R.G. Characteristics and control Factors of Ozone Pollution at Different Time Scales in Hangzhou City. Res. Environ. Sci. 2019, 32, 1844–1851. [Google Scholar]
  57. Tang, G.; Wang, Y.; Li, X.; Ji, D.; Hsu, S.; Gao, X. Spatial-temporal variations in surface ozone in Northern China as observed during 2009–2010 and possible implications for future air quality control strategies. Atmos. Chem. Phys. 2012, 12, 2757–2776. [Google Scholar] [CrossRef] [Green Version]
  58. Yadav, R.; Sahu, L.K.; Jaaffrey, S.N.A.; Beig, G. Distributions of ozone and related trace gases at an urban site in western India. J. Atmos. Chem. 2014, 71, 125–144. [Google Scholar] [CrossRef]
  59. Jin, Z.; Qian, L.; Shi, Y.; Fu, G.; Li, G.; Li, F. Quantifying major NOx sources of aerosol nitrate in Hangzhou, China, by using stable isotopes and a Bayesian isotope mixing model. Atmos. Environ. 2021, 244, 117979. [Google Scholar] [CrossRef]
  60. Bukhlova, G.V.; Krasnenko, N.P.; Stafeev, P.G. Dynamics of the thermal structure of the lower atmosphere above Tomsk from the data of acoustic sounding. IOP Conf. Ser. Earth Environ. Sci. 2008, 1, 012057. [Google Scholar] [CrossRef]
  61. Yuan, Q.; Qi, B.; Hu, D.; Wang, J.; Zhang, J.; Yang, H.; Zhang, S.; Liu, L.; Xu, L.; Li, W. Spatiotemporal variations and reduction of air pollutants during the COVID-19 pandemic in a megacity of Yangtze River Delta in China. Sci. Total Environ. 2021, 751, 141820. [Google Scholar] [CrossRef] [PubMed]
  62. NASA. Airborne Nitrogen Dioxide Plummets Over China. 2002. Available online: https://earthobservatory.nasa.gov/images/146362/airborne-nitrogen-dioxide-plummets-over-china (accessed on 23 January 2022).
  63. Liu, L.; Zhang, J.; Du, R.; Teng, X.; Hu, R.; Yuan, Q.; Tang, S.; Ren, C.; Huang, X.; Xu, L.; et al. Chemistry of Atmospheric Fine Particles during the COVID-19 Pandemic in a Megacity of Eastern China. Geophys. Res. Lett. 2021, 48, e2020GL091611. [Google Scholar] [CrossRef] [PubMed]
  64. Feng, R.; Luo, K.; Fan, J. Decoding Tropospheric Ozone in Hangzhou, China: From Precursors to Sources. Asia Pac. J. Atmos. Sci. 2020, 56, 321–331. [Google Scholar] [CrossRef]
  65. Li, L.; An, J.; Shi, Y.; Zhou, M.; Yan, R.; Huang, C.; Wang, H.; Lou, S.; Wang, Q.; Lu, Q.; et al. Source apportionment of surface ozone in the Yangtze River Delta, China in the summer of 2013. Atmos. Environ. 2016, 144, 194–207. [Google Scholar] [CrossRef]
  66. Londhe, A.; Jadhav, D.; Buchunde, P.; Kartha, M.J. Surface ozone variability in the urban and nearby rural locations of tropical India. Curr. Sci. 2008, 95, 1724–1729. [Google Scholar]
  67. Meng, Z.; Dabdub, D.; Seinfeld, J. Chemical coupling between atmospheric ozone and particulate matter. Science 1997, 277, 116–119. [Google Scholar] [CrossRef] [Green Version]
  68. Knipping, M.E.; Dabdub, D. Impact of chlorine emissions from sea-salt aerosol on coastal urban ozone. Environ. Sci. Technol. 2003, 37, 275–284. [Google Scholar] [CrossRef]
  69. Wang, Y.; Du, H.; Xu, Y.; Lu, D.; Wang, X.; Guo, Z. Temporal and spatial variation relationship and influence factors on surface urban heat island and ozone pollution in the Yangtze River Delta, China. Sci. Total Environ. 2018, 631–632, 921–933. [Google Scholar] [CrossRef]
  70. Ji, Y.; Qin, X.; Wang, B.; Xu, J.; Shen, J.; Chen, J.; Huang, K.; Deng, C.; Yan, R.; Xu, K.; et al. Counteractive effects of regional transport and emission control on the formation of fine particles: A case study during the Hangzhou G20 summit. Atmos. Chem. Phys. 2018, 18, 13581–13600. [Google Scholar] [CrossRef] [Green Version]
  71. Yu, Y.; Wang, Z.; He, T.; Meng, X.; Xie, S.; Yu, H. Driving factors of the significant increase in surface ozone in the Yangtze River Delta, China, during 2013–2017. Atmos. Pollut. Res. 2019, 10, 1357–1364. [Google Scholar] [CrossRef]
  72. Wang, W.J.; David, D.P.; Wang, S.W.; Bao, F.X.; Ni, R.J.; Li, R.J.; Li, X.; Yang, S.D.; Wang, H.L.; Cheng, Y.F. Long-term trend of ozone pollution in China during 2014–2020: Distinct seasonal and spatial characteristics and ozone sensitivity. Atmos. Chem. Phys. 2022, 22, 8935–8949. [Google Scholar] [CrossRef]
Figure 1. Location of the NRCS (National Reference Climatological Station) in the YRD (Yangtze River Delta) region (color area in the right image) and in the city of Hangzhou (left).
Atmosphere 14 00487 g001
Figure 2. Diurnal variations in NO, NO2, NOx and O3 mixing ratios in (a) spring (MAM), (b) summer (JJA), (c) autumn (SON) and (d) winter (DJF), as well as (e) diurnal variations in O3 and NOx mixing ratios on weekdays and weekends at the NRCS from 2015 to 2021. The error bars represent 95% confidence intervals.
Atmosphere 14 00487 g002
Figure 3. (a) Monthly variations in the NOx and O3 mixing ratios at NRCS, where the error bars represent 95% confidence intervals. (b) Correlation analysis of O3 with NO, NO2, NOx and meteorological conditions; the darker the red, the stronger the positive correlation, and the darker the blue, the stronger the negative correlation. *, ** and *** denote different levels of significance from weak to strong.
Atmosphere 14 00487 g003
Figure 4. The time series of NOx (upper) and O3 (bottom) mixing ratios observed at the NRCS (a) from January to November in 2020, (b) during COVID-19 lockdown (the yellow area, 1 to 23 January 2020; the grey area, 4 to 19 February 2020; the red area, 20 February to 31 March 2020) and (c) during the National holiday (the blue area, 1 to 7 October 2020).
Atmosphere 14 00487 g004
Figure 5. Cluster analysis of 24 h air mass backward trajectories obtained from the NRCS in Hangzhou in winter (a), spring (b), summer (c) and autumn (d).
Atmosphere 14 00487 g005
Figure 6. The weight potential source contribution function (WPSCF) regions for O3 calculated from trajectory statistics in January (a), April (b), July (c) and October (d) during the observation period (from January 2015 to December 2021).
Atmosphere 14 00487 g006aAtmosphere 14 00487 g006b
Figure 7. The monthly trends in NOx (a) and O3 (b) from 2015 to 2021. The solid blue line shows the trend.
Atmosphere 14 00487 g007
Table 1. Seasonal statistics of cluster analysis and the average O3 mixing ratios.
Season ClusterPercentage (%)Average O3 Mixing Ratio (ppb)
Winter134.4917.23 ± 0.66
231.8412.97 ± 0.52
319.997.98 ± 0.72
413.6911.79 ± 0.89
Spring118.5528.47 ± 1.25
233.9729.01 ± 1.16
327.5426.52 ± 1.15
419.9434.14 ± 1.42
Summer132.7421.11 ± 1.12
241.5724.44 ± 0.92
318.0120.67 ± 1.21
47.6829.01 ± 2.69
Autumn124.4021.83 ± 1.24
223.9626.86 ± 0.97
338.0425.73 ± 0.87
413.5924.87 ± 1.40
Table 2. Annual mean mixing ratios of atmospheric NOx and O3 from 2015 to 2021.
YearNOx (ppb)O3 (ppb)
201530.63 ± 2.5618.60 ± 1.90
201624.82 ± 1.8220.46 ± 2.80
201727.48 ± 2.4524.87 ± 2.54
201824.47 ± 2.4120.77 ± 4.19
201925.77 ± 1.5321.78 ± 2.77
202022.70 ± 2.6923.84 ± 1.72
202118.18 ± 1.5223.73 ± 1.57
Disclaimer/Publisher’s Note: The statements, opinions and data contained in all publications are solely those of the individual author(s) and contributor(s) and not of MDPI and/or the editor(s). MDPI and/or the editor(s) disclaim responsibility for any injury to people or property resulting from any ideas, methods, instructions or products referred to in the content.

