
Spatial Analysis of SO2, PM10, CO, NO2, and O3 Pollutants: The Case of Konya Province, Turkey

1
Department of Geomatics Engineering, Necmettin Erbakan University, 42090 Konya, Turkey
2
Department of Environmental Engineering, Necmettin Erbakan University, 42090 Konya, Turkey
*
Author to whom correspondence should be addressed.
Atmosphere 2023, 14(3), 462; https://doi.org/10.3390/atmos14030462
Submission received: 31 January 2023
/
Revised: 15 February 2023
/
Accepted: 24 February 2023
/
Published: 26 February 2023
(This article belongs to the Special Issue Urban Airflow and Pollutant Dispersion: Monitoring, Modeling, Challenges, and New Perspectives)
Abstract
:Geographical information systems are frequently used in analyses of air quality based on location and time. They are also used in the creation of pollution distribution maps to determine the parameters related to air pollutants. In this study, a spatial analysis of SO2, PM10, CO, NO2 and O3 pollutants, which cause air pollution within the borders of the municipal urban areas of Konya province, was carried out for the years 2019–2020. In this context, air pollution maps were produced using the IDW interpolation method with data obtained from the National Air Quality Monitoring Network stations, which belong to the Ministry of Environment and Urbanization, in the Konya region. The results obtained were examined with maps and graphics based on the limit values found in the Air Quality Assessment and Management Regulation published by the Ministry of Environment and Urbanization. In this context, the periods of lockdown experienced during the COVID-19 pandemic were also evaluated in terms of air pollution. From the evaluation made on the values taken from the air quality stations, it can be observed that the air pollution did not violate the national limit value much in 2019 and 2020.
1. Introduction
Air pollution is one of the most critical concerns encountered in urban areas, especially in developing nations. According to reports from the World Health Organization (WHO), 7,000,000 people die from air pollution each year. Of this number, 4,000,000 deaths are caused by outdoor pollution and 3,000,000 are caused by indoor pollution [1]. The situation is even worse for younger age groups. According to the World Health Organization, 7% of children aged 15 and younger worldwide live in areas below the PM2.5 limit value set by the World Health Organization. This rate is more serious in children aged 5 years and younger, and 10% of these children die from air pollutants. [2].
Scientists and researchers have long been working to measure and monitor the values of pollutants, monitor and model their quality, and determine the causes and sources of pollution. In addition, work has been performed to find solutions to air quality problems by determining strategies. Mathematical models (statistical model—multiple linear regression and deterministic models—point, area, and line source models, etc.) show how pollutants emitted into the atmosphere from any source will disperse according to their chemical reactions to atmospheric conditions [3]. These mathematical models are divided into statistical and deterministic models. Statistical models are based on the analysis of past air quality monitoring data. Deterministic models are based on a mathematical description of the physical and chemical processes that occur in the atmosphere. These models are based on mathematical equations that express conservation laws of mass, momentum, and energy [4]. Air quality modeling is crucial for preventing environmental damage from the emissions emitted from facilities or sources in a region and to create control strategies [5,6]. The American Meteorological Society and Environmental Protection Agency Regulatory Model (AERMOD) is mostly used to model air quality. AERMOD examines the distribution of emissions from industrial facilities over a short distance (a maximum of 50 km). In addition, there are point, areal, and linear models developed by the California Puff Model (CALPUFF) and the Environmental Protection Agency (EPA). Meteorology and the meteorological parameters in a region play a vital role in air quality modeling [7,8,9,10]. However, the process of obtaining these data is time-consuming [10]. There are also various studies on air quality monitoring using remote sensing data [11,12,13,14,15,16]. In addition to these methods, geographic information systems (GISs) are used in modeling air quality. GISs are a very important application of information technology in terms of producing new and fast solutions to social problems apart from the traditional approach by using a variety of geographical information found around the world. GISs allow researchers to evaluate and analyze the results obtained from any map-based data or information. Since the coordinates of stations at which pollutants are measured can be determined, GISs are very effective in creating pollution distribution maps. There are many studies in the world and in Turkey that are using GISs in pollutant analyses of PM10, PM2.5, CO, SO2, NO2, and NOx [17,18,19,20,21,22,23,24,25,26,27]. In these studies, spatial distribution maps of air quality were designed using GISs, and the results of the pollution index map, designed using ArcGIS software, were discussed. In addition, when using a GIS, the air pollution potential of the study area is investigated by considering the determining factors, such as population density, traffic, industries, wind speed, precipitation, and temperature.
In many recent studies, the effect of the lockdown due to the COVID-19 pandemic on air pollution was investigated [28,29,30]. During the COVID-19 pandemic, public transportation or vehicle usage rates greatly decreased with the transition to distance education in schools, the flexible working method of institutions, and the announcement of curfews. In the research conducted in large cities (New York, Los Angeles, Zaragoza, Rome, Dubai, Delhi, Mumbai, Beijing, and Shanghai) around the world, it was stated that the PM2.5 value decreased during the closures due to COVID-19 compared to previous periods (2017–2019) [28]. In a study conducted in Brazil, the concentrations of PM, CO, NO2, and O3 were determined during the closure period and before the closure. A certain decrease in the pollutant levels was determined. It was stated this decrease may also be caused by meteorological effects. [29]. In China in 2019, almost all avoidable activities were prohibited since Wuhan announced a lockdown on 23 January 2020. Despite reduced activity, severe air pollution events still occurred in the North China Plain, prompting discussions regarding the reasons for which severe air pollution was not avoided. Due to the meteorological effects, it was concluded that the pollution continued despite the closure and that additional measures should be taken [30]. In addition to these studies, there were also studies investigating the discomfort and death rates caused by COVID-19 in regions in which the air pollution was intense [31,32,33]. According to mobility reports published by Google, the mobility rates of public transport stations decreased by 64% throughout Turkey from the time that the rule for passenger transport in public transport vehicles at 50% capacity was implemented on March 23 to the normalization [34].
Konya is one of the cities with the highest air pollution in Turkey. With the IKONAIR (Improvement of Air Quality Management In Metropolitan Cities) project, which was completed in 2012 after two years of work, the Konya air quality was studied in detail, and comprehensive action plans covering the years 2012–2019 were prepared with all positive and negative scenario evaluations. At the beginning of the project, information describing the emissions from all relevant sources in Konya was collected, including emissions from domestic heating, traffic, and industry. The contemporary state of air quality in Konya was determined based on the air quality measurements taken from continuous monitoring stations, data collected from a specially designed measurement campaign, distribution model calculations, and an emissions inventory [35,36]. In another study, the air quality of eight provinces in Turkey, including Konya, was analyzed with respect to PM10, SO2, NO2, NO, NOx, CO, and O3 data between 2009 and 2016. As of 2016, a decrease of 22.4% was detected in the air pollution in these cities according to the PM, O3, and NO2 data. While air pollution was above the national legal limit value from 2009 to 2013, it showed a decreasing trend from 2013 to 2016. It can be speculated that the determinations, improvements, and plans that were made in line with the scenarios envisaged within the scope of the ICONAIR project initiated in 2012 contributed to this decrease [37]. Similarly, in a study conducted using SO2 and PM10 data from the years 2010–2012, air pollution was revealed to be above the national limit values, despite the causes of pollution and solution suggestions [38].
In this study, a spatial analysis of SO2, PM10, CO, NO2, and O3 pollutants was carried out using data from 2019–2020 from within the borders of the adjacent area of Konya. Air pollution maps were created by using the SO2, PM10, CO, NO2, and O3 data, measured in 1, 8, and 24 h, that were obtained from air quality monitoring stations within the borders of the adjacent area of Konya. Pollution maps were examined according to European Union and national limit values. The spatial analysis was carried out while taking into account the effects of traffic density, industry, industrialization, etc. The effects of the closure processes experienced in 2019–2020 on air pollution during the COVID-19 lockdown were also evaluated.
2. Air Pollutants and Air Quality
Air quality monitoring stations under the control of the Ministry of Environment and Urbanization were established in all provinces in order to obtain accurate air pollution values, raise awareness that the fight against air pollution is important for people, and to explain that management policies must be created to allow access to clean air for all people. Sulfur dioxide (SO2), particulate matter (PM10), nitrogen oxides (NOx), carbon monoxide (CO), and ozone (O3) parameters are automatically measured from these stations..
In order to determine the air quality, measuring instruments that record the concentrations of pollutants with existing connections are used. The data obtained from these measurement instruments were converted into Air Quality Index (AQI) parameters using the developed algorithms. These converted values were obtained separately for each pollutant. The highest AQI value obtained for a day provides the evaluated pollutant value [39].
The air quality index is calculated for five main pollutants (PM10, SO2, NO2, O3, and CO). The AQI consists of six categories: the first category includes very good quality (very clean) air, while the sixth category indicates very bad quality (very polluted) air [5].
Air quality in Turkey is measured by the Ministry of Environment and Urbanization at 355 stations in 81 provinces through the National Air Quality Monitoring Network. It is available to relevant researchers (www.havaizleme.gov.tr (accessed on 12 February 2023) and http://mobil.havaizleme.gov.tr (accessed on 12 February 2023)).
3. Materials and Methods
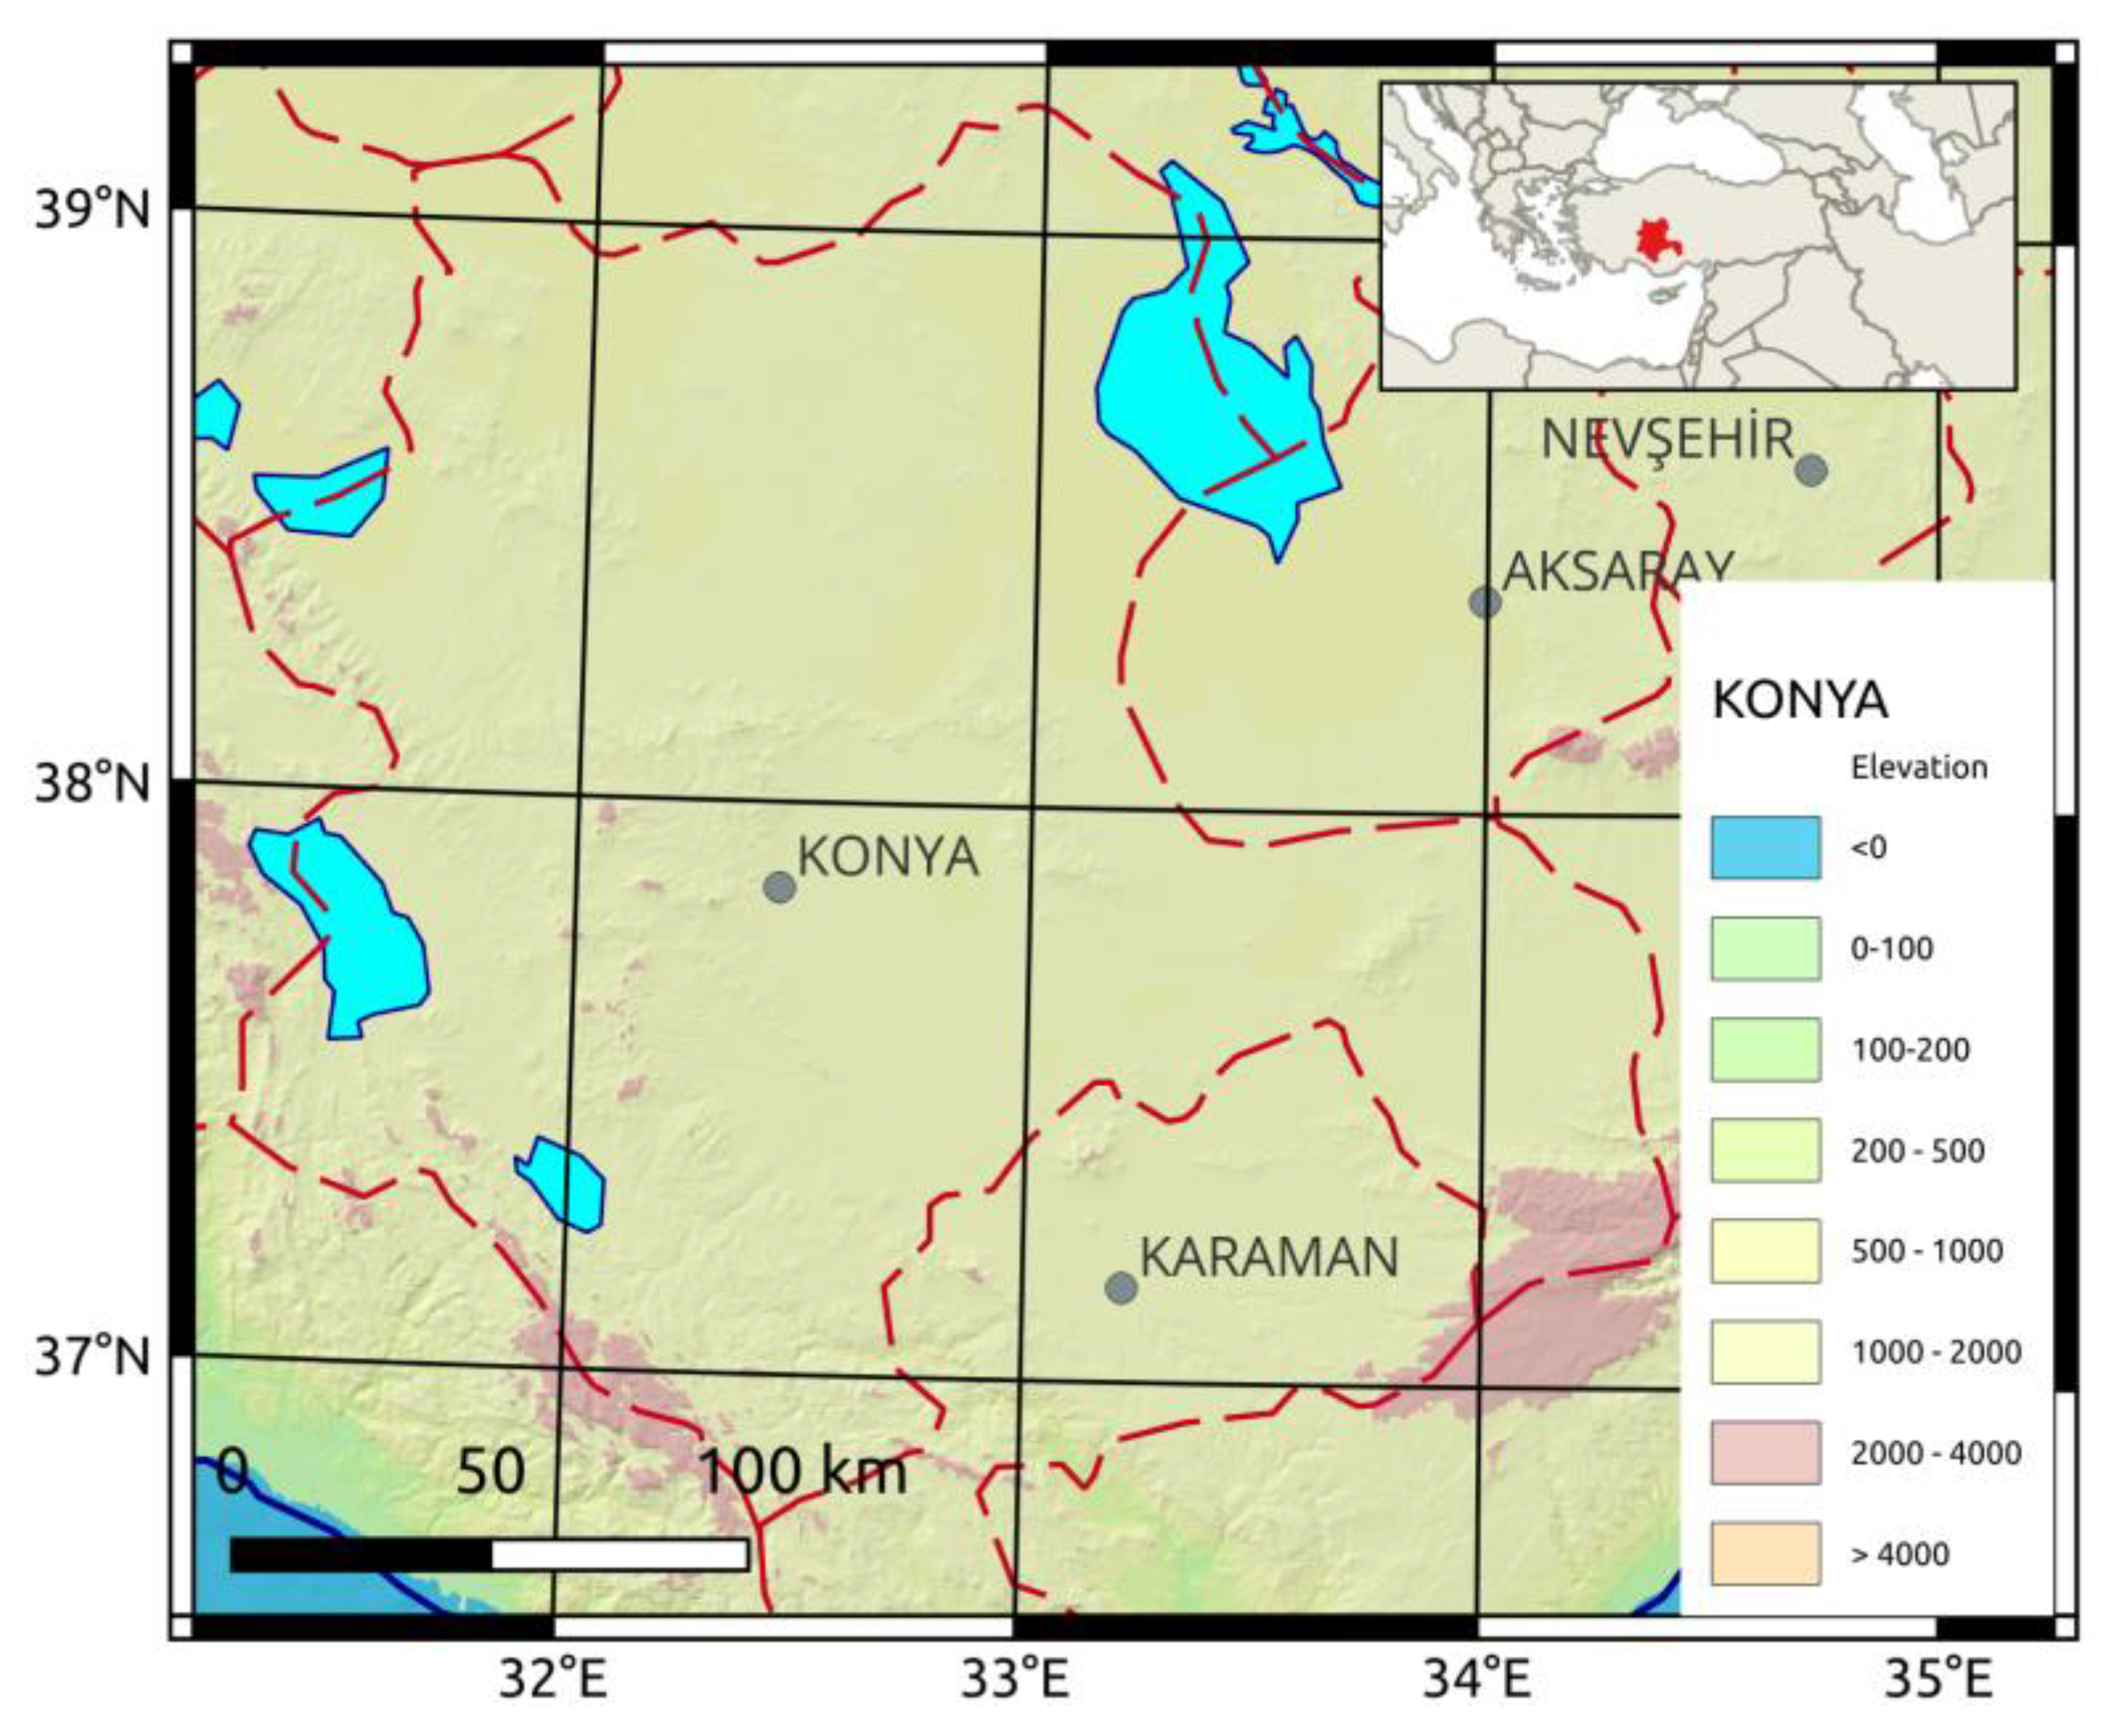
Konya is located between the 36°41′ and 39°16′ north latitudes and the 31°14′ and 34°26′ east longitudes (Figure 1). The average elevation of Konya is 1.016 m, and it has a population of approximately 2 million. It is a closed basin surrounded by mountains that form a vast pit. The surrounding mountain ranges limit air movement and wind formation and, especially in winter, prevent the polluted air from leaving the city, causing fog and smoke to concentrate and increasing air pollution [40,41,42]. The south of the basin has warm and rainy winters and hot and dry summers, while the central and northern parts have cold winters and hot and dry summers. Generally, precipitation occurs in the winter and spring.
In recent years, the renewable energy, software, food, weapons, automotive spare parts, defense, and agricultural and other machinery-manufacturing industries and the pharmaceutical sectors, etc., have been developing in Konya. As one of the 81 provinces of Turkey, Konya ranks first in the export of agricultural machinery and equipment, fourth in the export of the defense industry, fifth in the number of industrial enterprises, second in the number of automotive sub-industries and basic metal manufacturers, third in the number of machinery equipment manufacturers, and third in the number of food manufacturers. Fossil fuels consumed in residences and workplaces due to the need for heating are among the biggest causes of air pollution in the Konya city center. However, it is known that pollutants originating from large-scale industrial establishments, which are established in the city center, and exhaust emissions resulting from the rapidly increasing vehicle density, industry, and human factors also increase pollution [35,36].
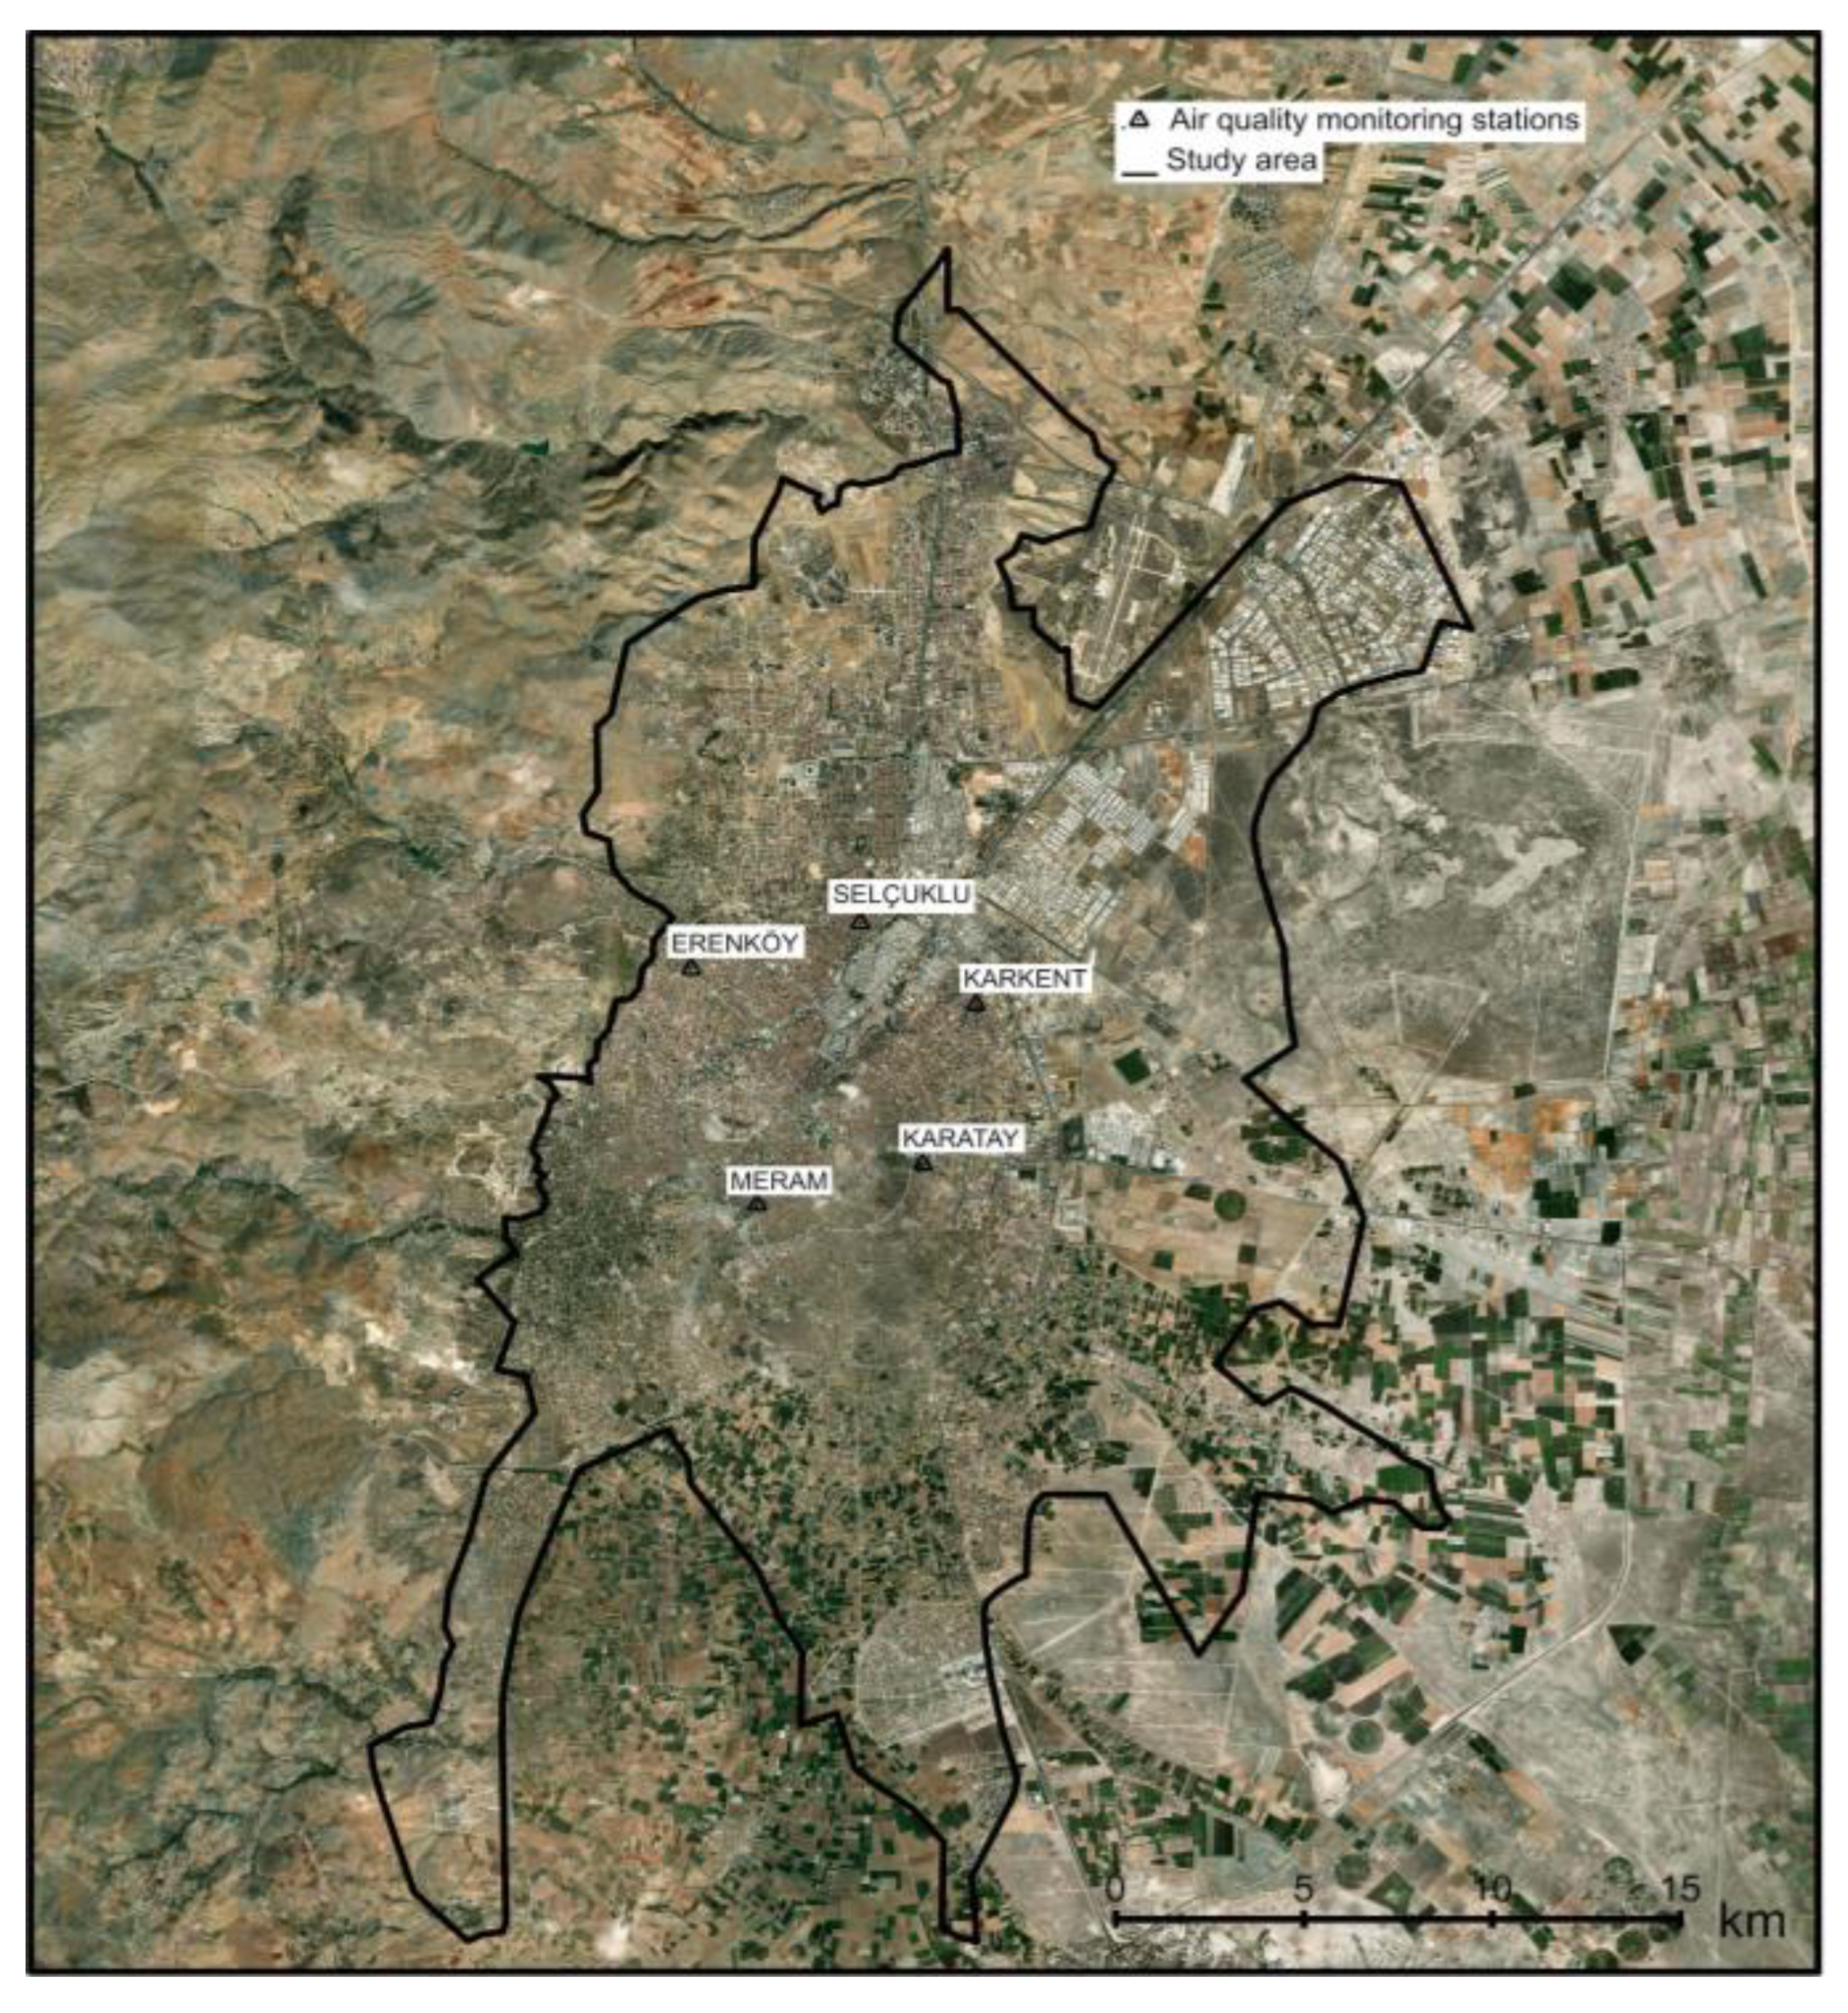
This study was carried out within the borders of the adjacent area of Konya province. Data from 2019-2020 on the SO2, PM10, CO, NO2, and O3 pollutants, obtained from five stations which regularly measure pollutants and are operated by the Ministry of Environment, Urbanization and Climate Change, were used. These data are presented hourly and daily on the Ministry website free of charge. These stations allow for detailed measurements to be taken with a high accuracy. The type of sensors and type of measurements are shared in detail on the Ministry’s air quality centers web page [43,44]. However, the number of stations is not yet high enough for geospatial analysis. For this purpose, low-cost sensors (LCS) can be used; however, the European Union does not allow measurements from these sensors to be used for reporting [45,46].
The locations and study areas of the stations belonging to the province of Konya are shown in Figure 2.
Complex data began to be supported by producing a type of software called spatial data server software. This software allows spatial data to be stored in database systems. These software find a wide application area in GISs because they allow for different queries and are easy to use. The most important analytical operation of a GIS is the use and analysis of spatial data [47]. Statistical analysis and geostatistical analysis can be performed with a GIS. In statistical analysis, the daily highest, lowest, and average temperatures can be easily calculated without the need for the spatial information of the stations. Geostatistical analysis, on the other hand, is an inexpensive and logical method for analyzing various datasets that require a high cost and long-term analysis [48]. Geostatistical analysis enables the estimation of the variables by interpolating the variables that do not have an observational area with a certain structure in a certain area and the positions of the observable variables [48]. By combining geostatistical and spatial analyses, users can decide on the frequency, distribution, and impact of the sampling stations and analyze the interaction between transport and air pollution. Kriging and deterministic methods (inverse distance weighted—IDW, global polynomial, local polynomial, radial-based functions, and linear regression) can be mentioned for geostatistical analysis [10,16,49,50]. One of these studies aimed at assessing the spatial air quality and the fitness of spatial mapping using data collected by twelve selected monitoring stations in Mumbai, India. The collected data were spatially interpolated using the available interpolation tools of ArcGIS [51], including inverse distance weight (IDW), Kriging (spherical and Gaussian), and Spline techniques by the leave-one-out scheme [10]. To estimate the amount of PM10 and SO2, the traditional multiple linear regression (MLR) and artificial neural network (ANN) modeling were applied to the processed remote sensing data. The results thus obtained were assessed using an independent test data. Multitemporal Landsat ETM+ remote sensing imagery of the study area in Vadodara, India, was used [16]. The objective of another study was to map PM2.5 using two widely used spatial interpolation techniques (Kriging and IDW) by predicting the concentration at distinct, unmonitored locations. The generated maps can help in policy formulation, with financial, logistical, and location problems, and with decision making by providing aid in the PM2.5 visualisation of spatial and temporal variabilities [52]. Ray and Kim evaluated the spatial and temporal distributions and the standard deviation and means of SO2 in seven major cities. The potential sources of SO2 and its exposure risk in the target cities were also assessed [49].
The most commonly used deterministic methods are the inverse distance weighted (IDW) and Spline methods [10,47,48,49]. The IDW method was used in this study.
The IDW method is preferred for obtaining the value of unknown points by using the values of known points. In this method, only the data are evaluated and compared locally [53].
IDW method formulated with (Equation (1));
where Z(X0) is the location where the estimates will be made, z(Xi) is a function of n where the measurements are made, r represents the weights assigned to the predicted value, and d is the distance between the known value point and the value to be estimated. This method is very suitable for describing continuously changing data (precipitation, wind, pollution, etc.) covering a region [53].
4. Results and Discussion
National and EU member state limit values are provided in Table 1. The graphics and maps of the pollutants were evaluated according to this table. Considering the different effects of different air pollutants at different concentrations and durations, the level of air pollution is explained with a numerical scale so that it can be understood more easily in daily life. The Air Quality Index (AQI) consists of six categories. Category 1 represents very high quality (very clean) air; Category 6 refers to very poor quality (very polluted) air [11]. A comparison of the AQI values and the concentration levels of pollutants for the five main pollutants (PM10, SO2, NO2, O3, CO) is provided in Table 2.
No data could be obtained from the Erenköy station in 2019. For this reason, this station was disabled while the maps were being created. Therefore, data from four stations in 2019 and five stations in 2020 were used.
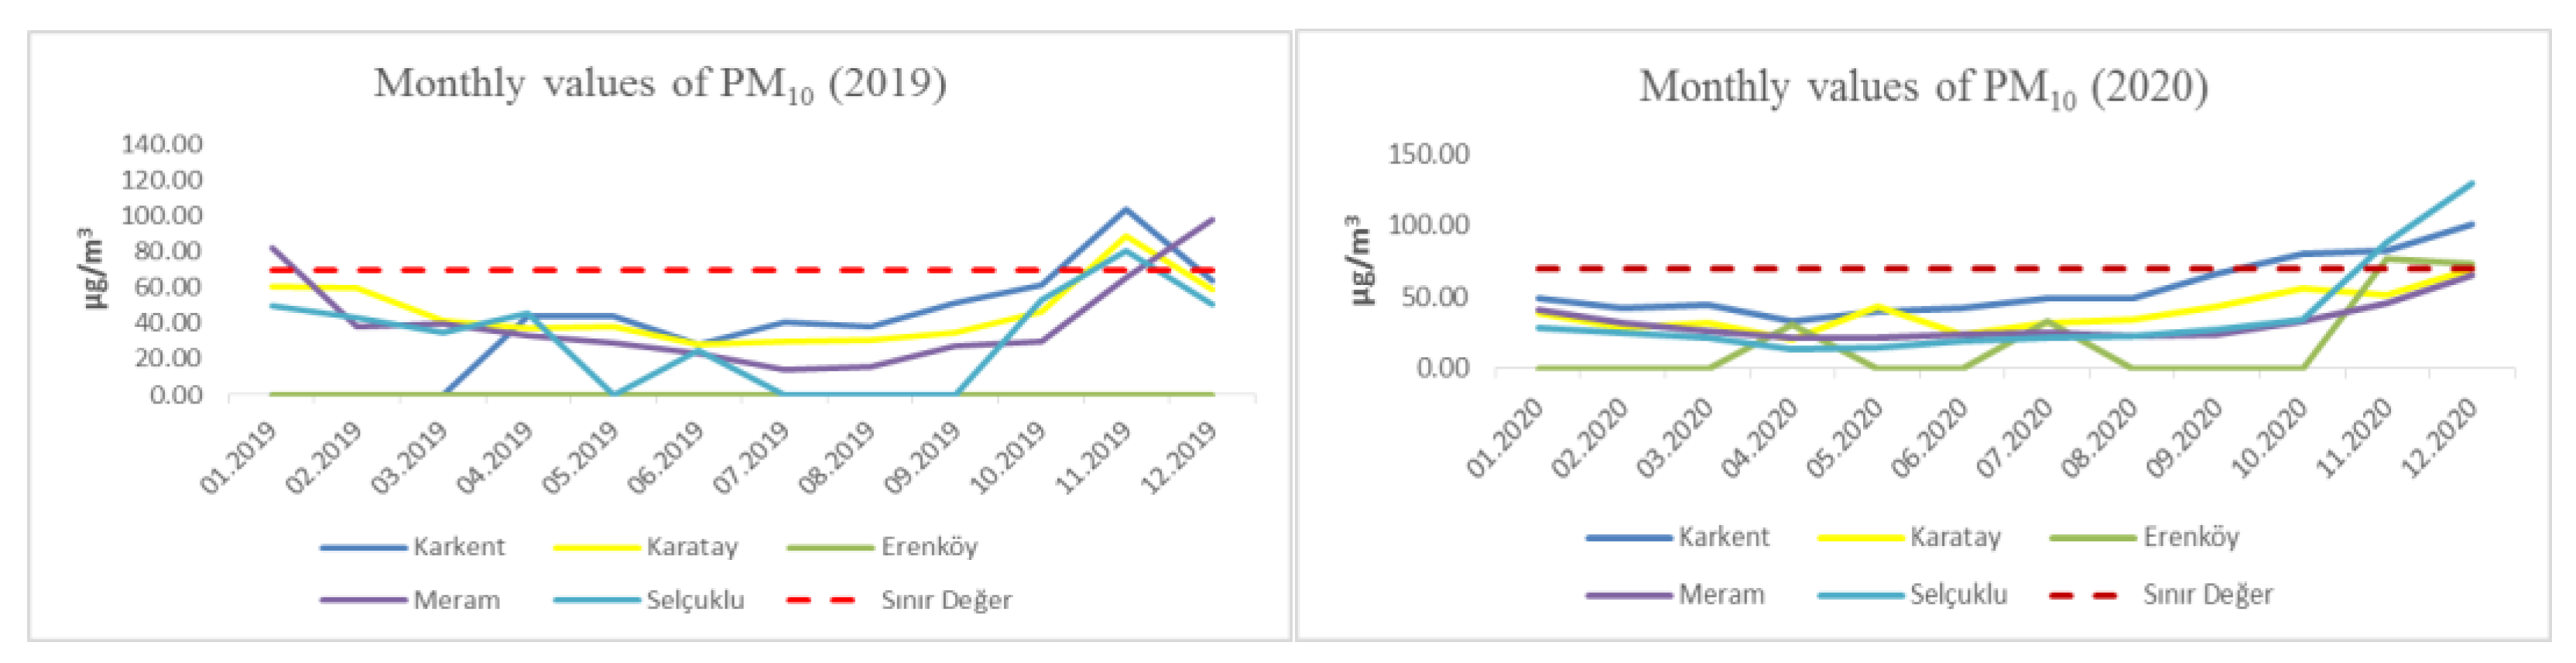
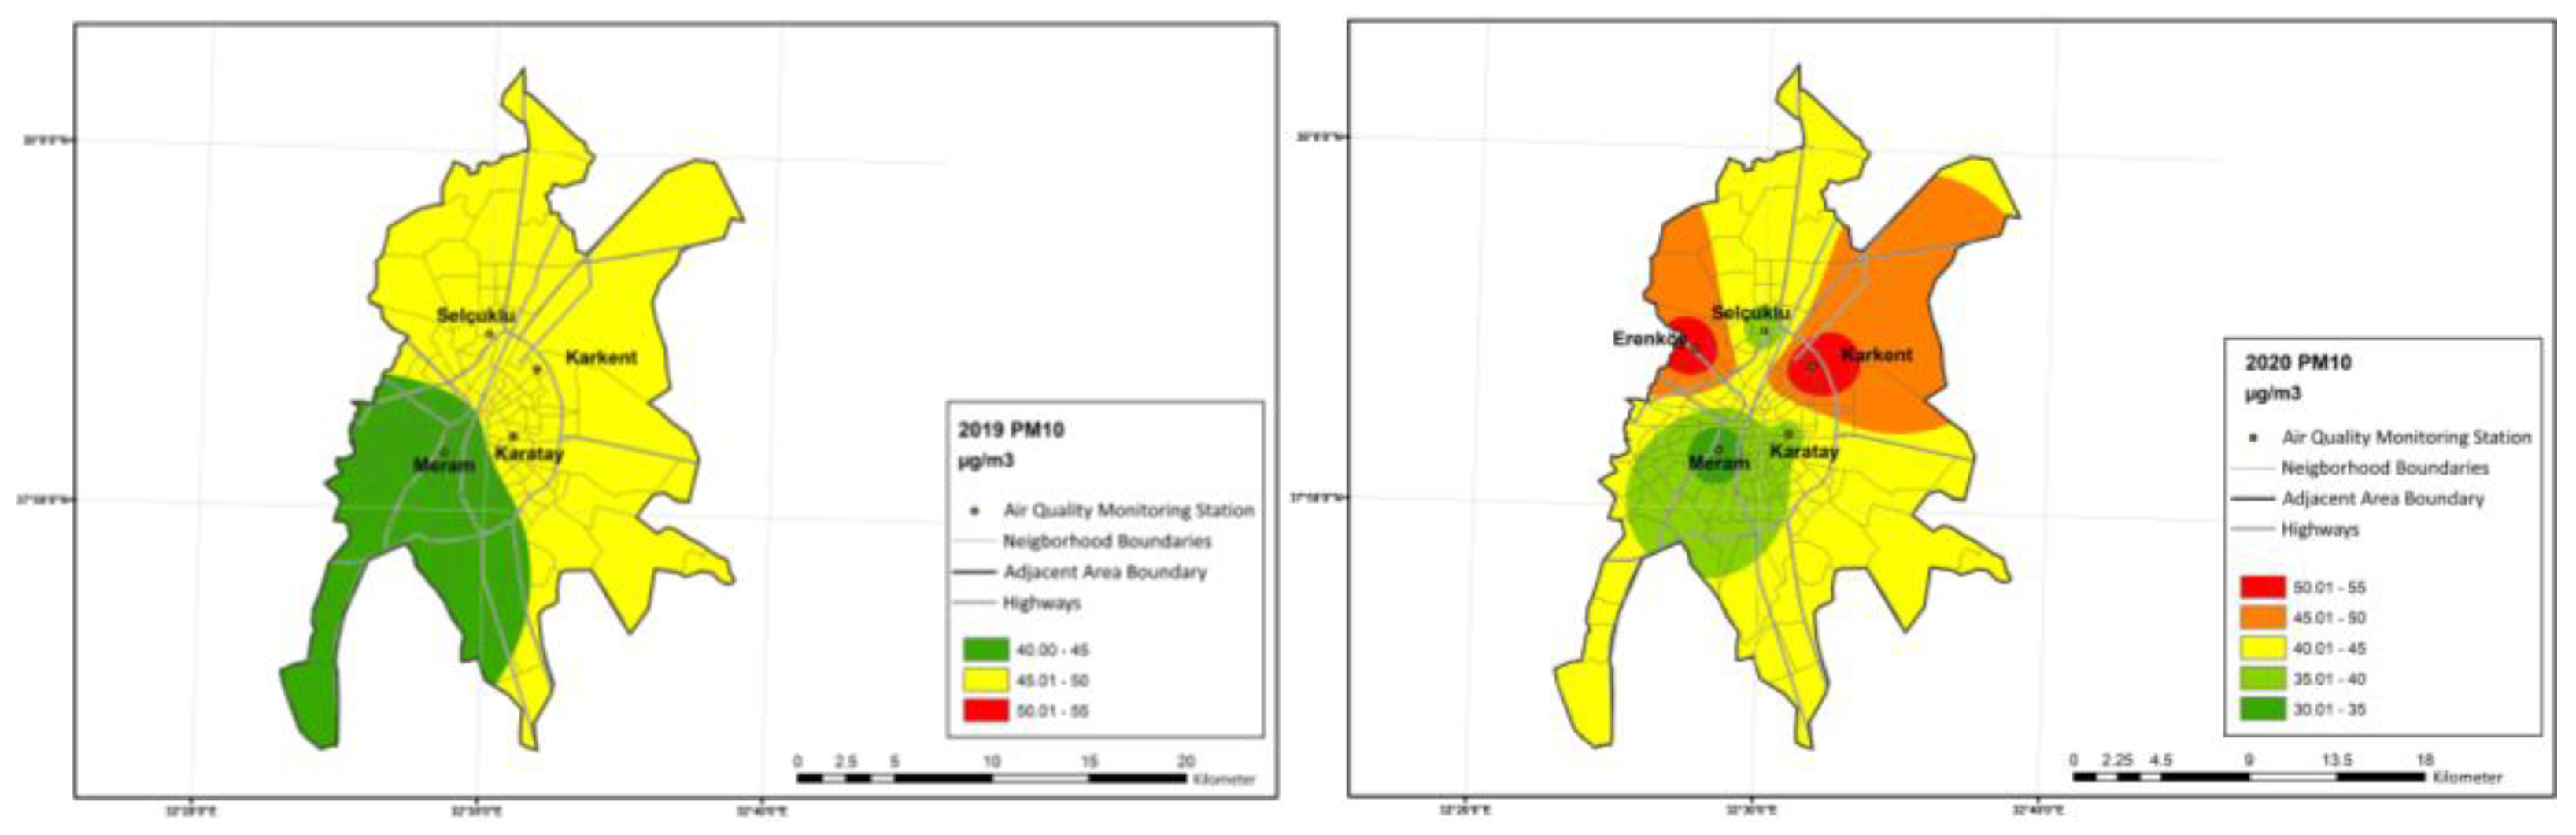
In Figure 3, the monthly 24 h averages of PM10 air pollution for the years 2019 and 2020 taken for one year are shown. The limit value given in Table 1 is 70 µg/m3 for PM10. It is shown using a red dashed line. When the values are examined, it can be observed that the value is below the limit value during the year; however, the limit value is approached and then exceeded in October, November, and December. PM10 pollution maps are shown in Figure 4.
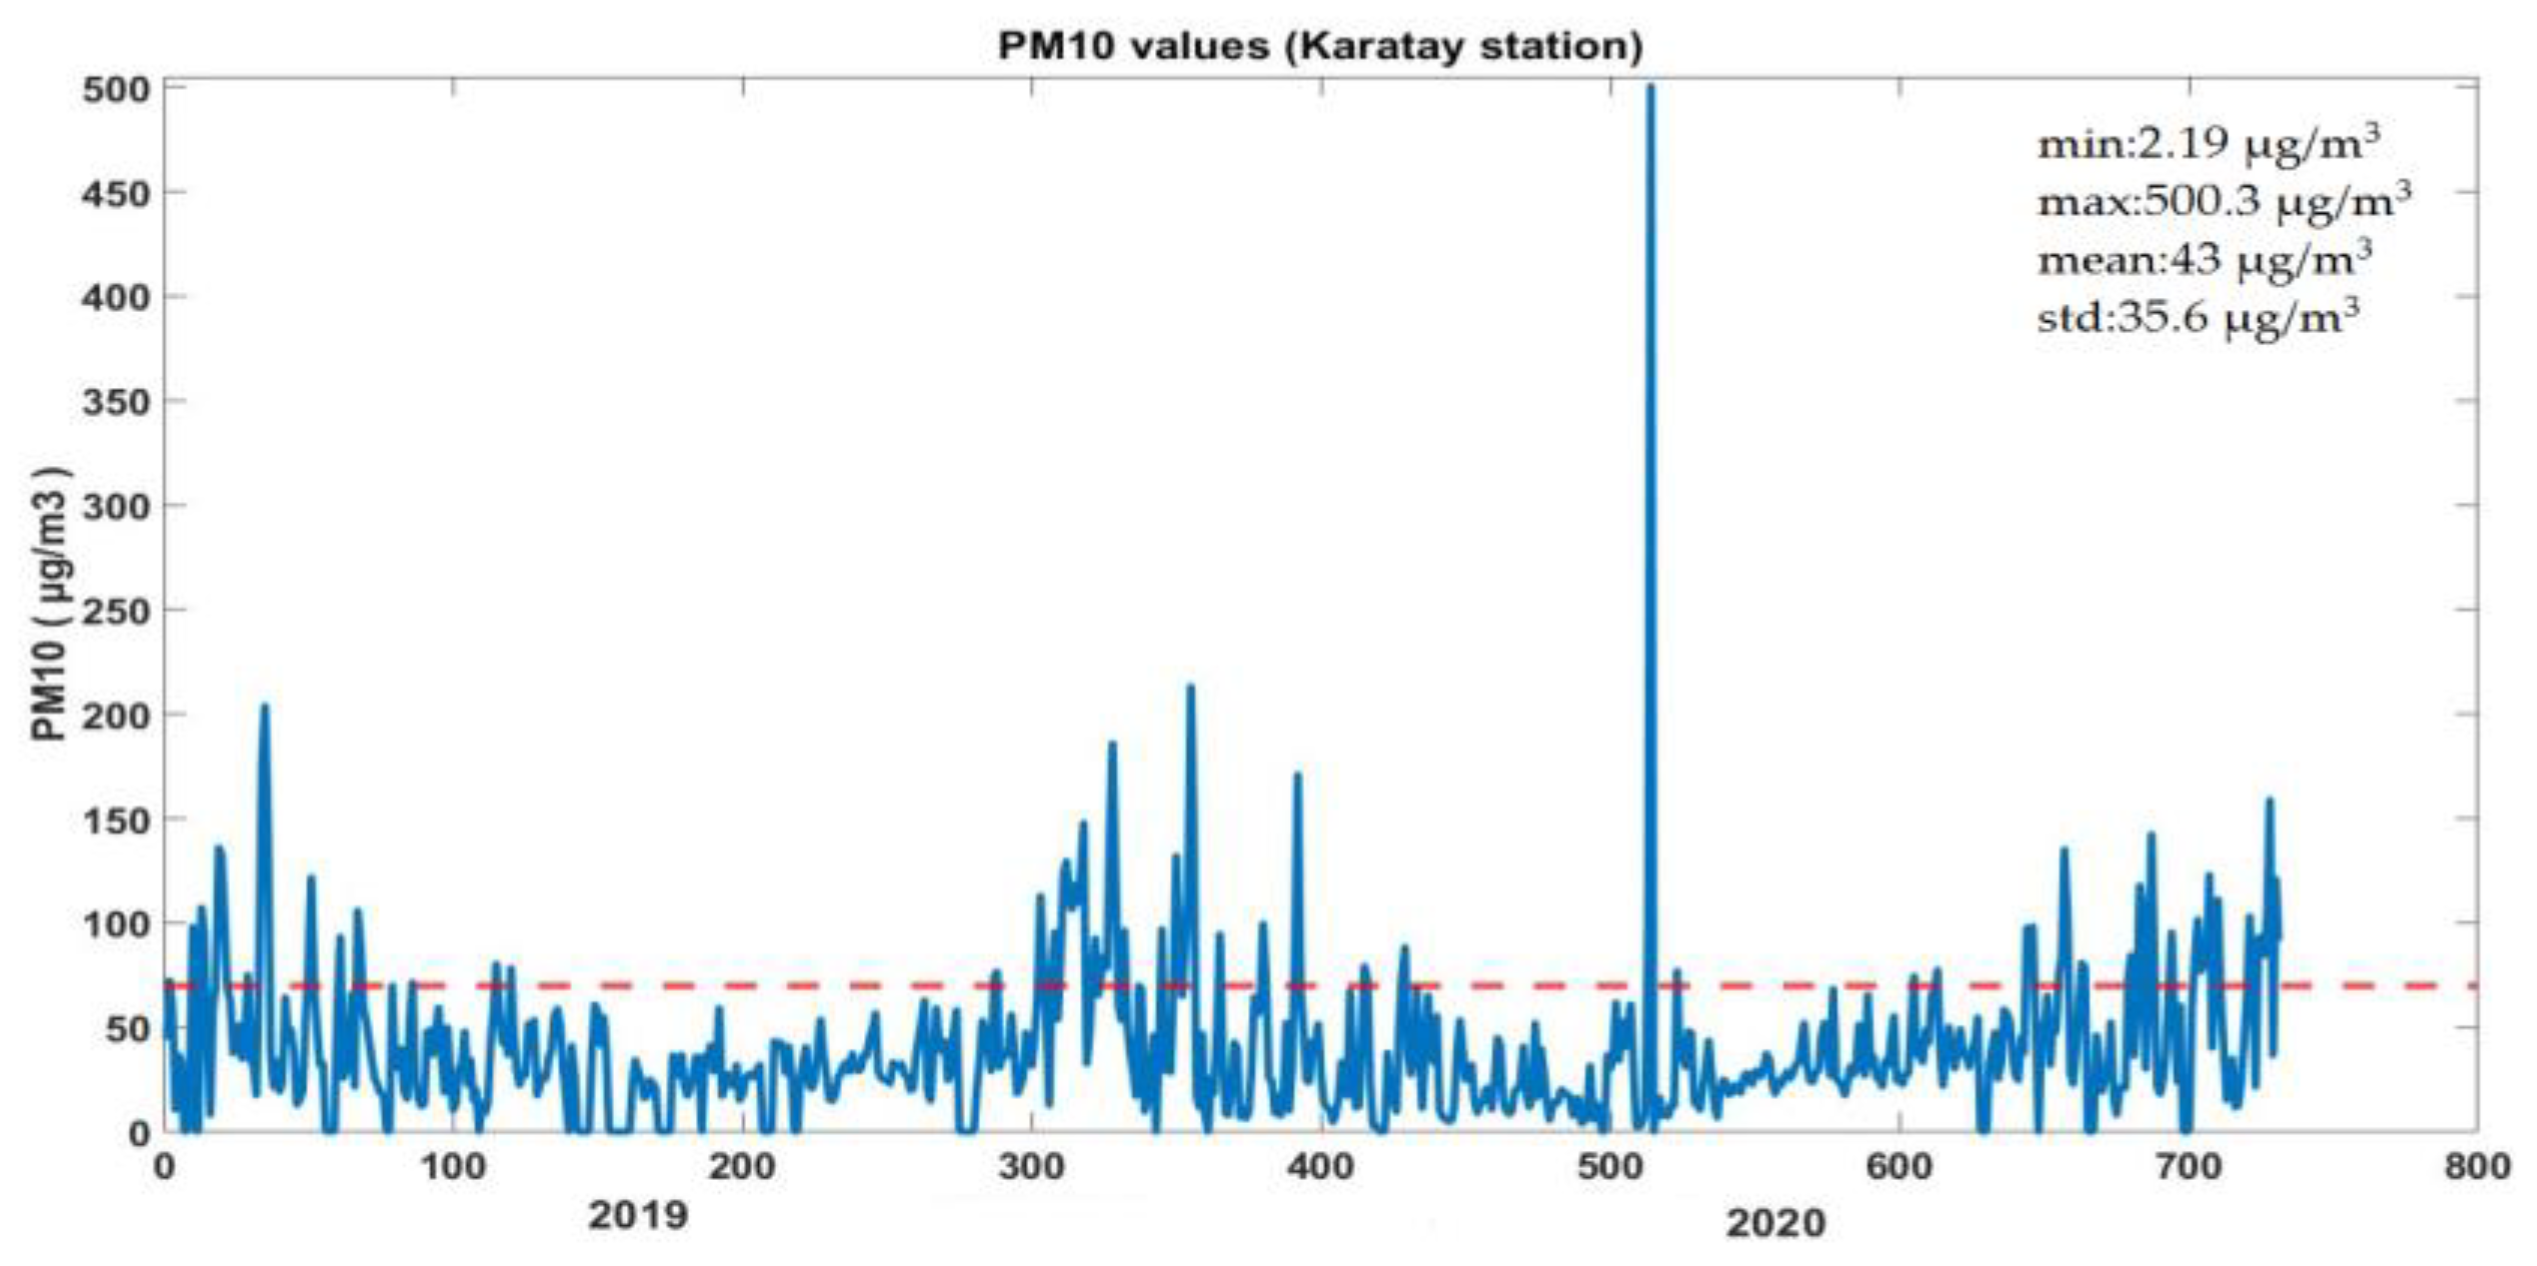
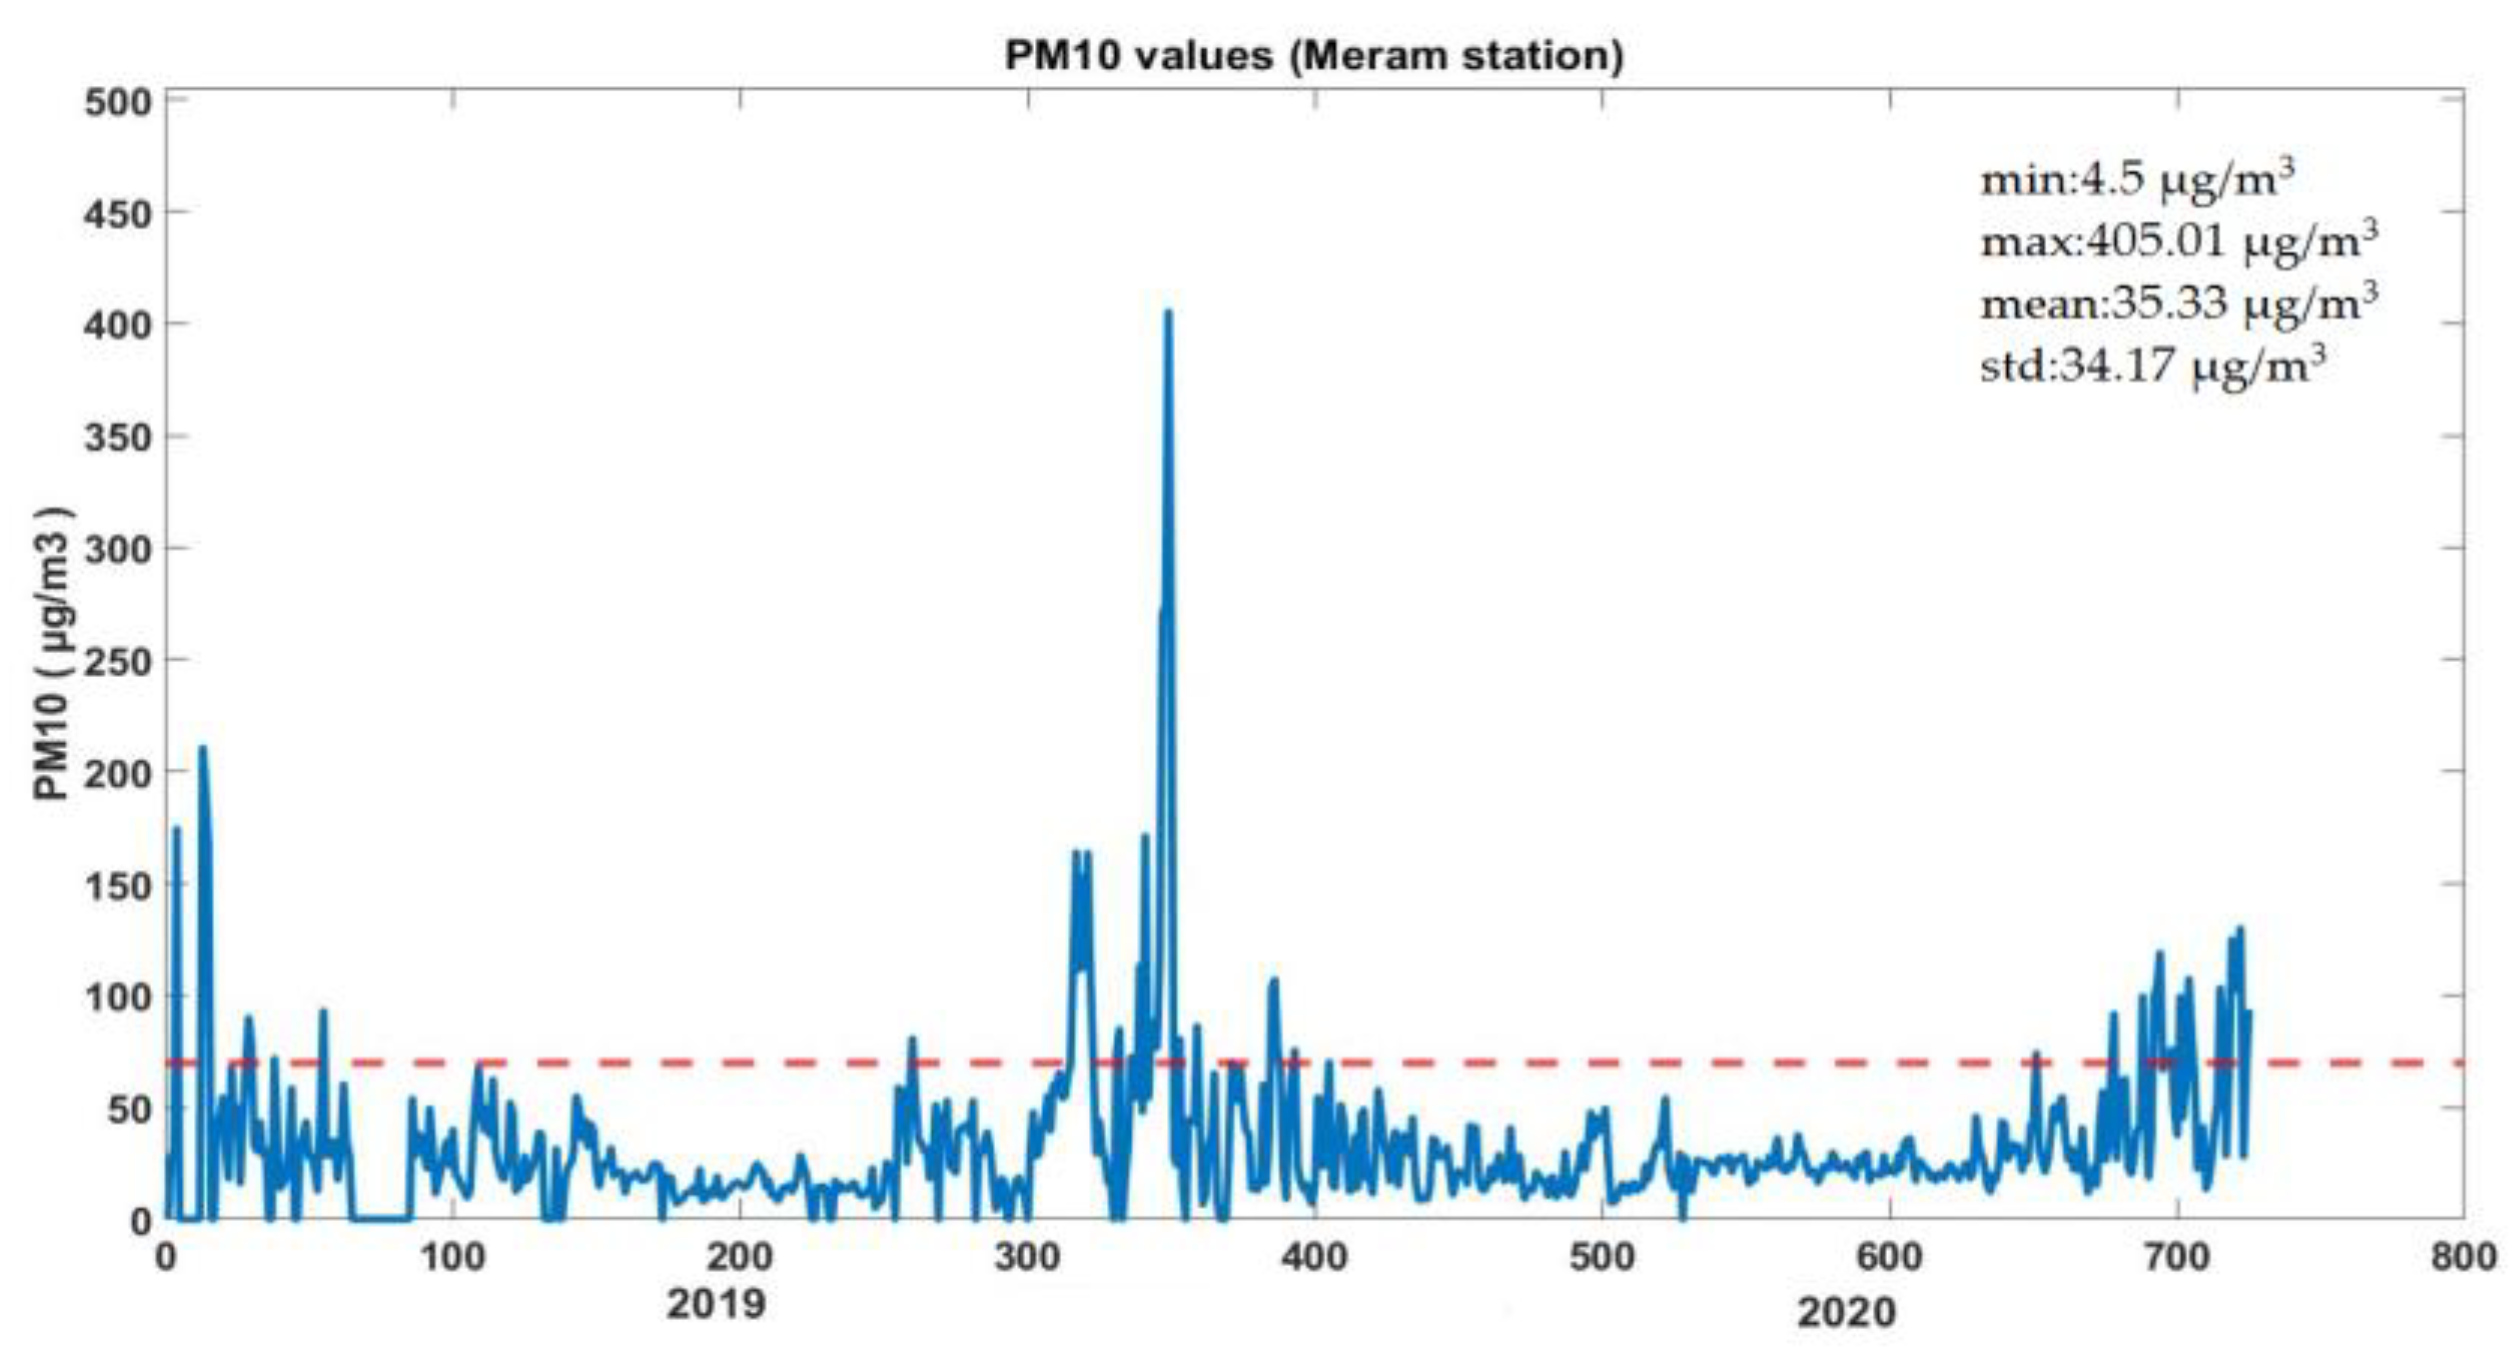
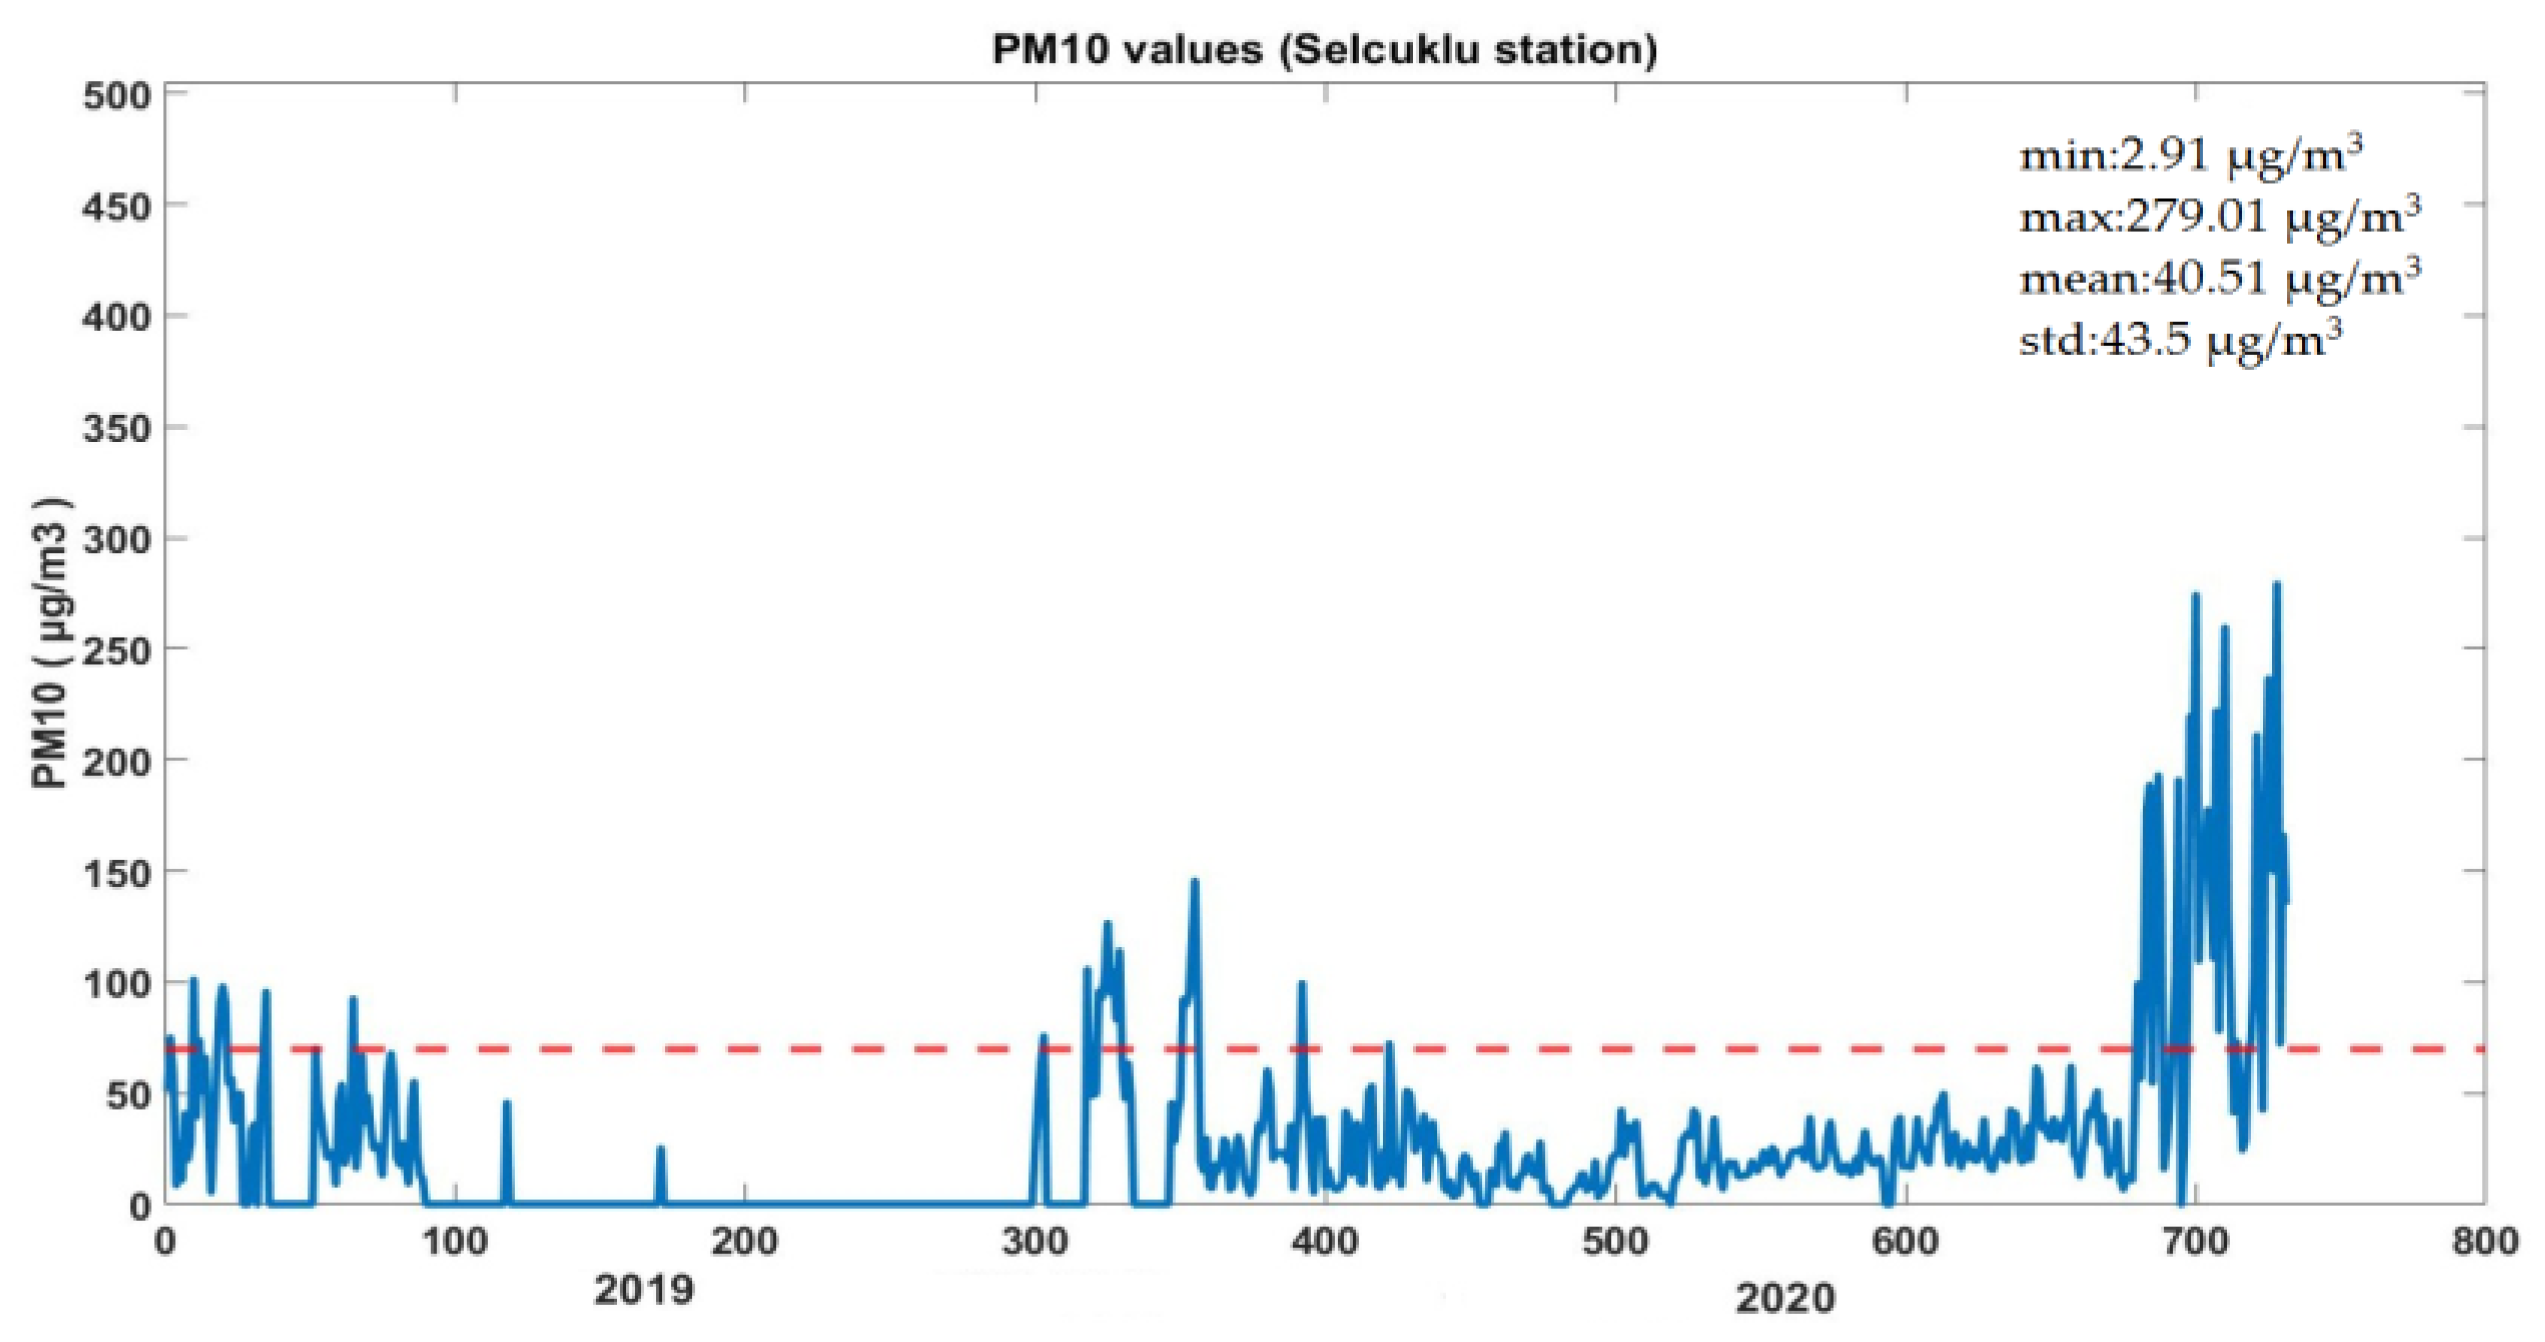
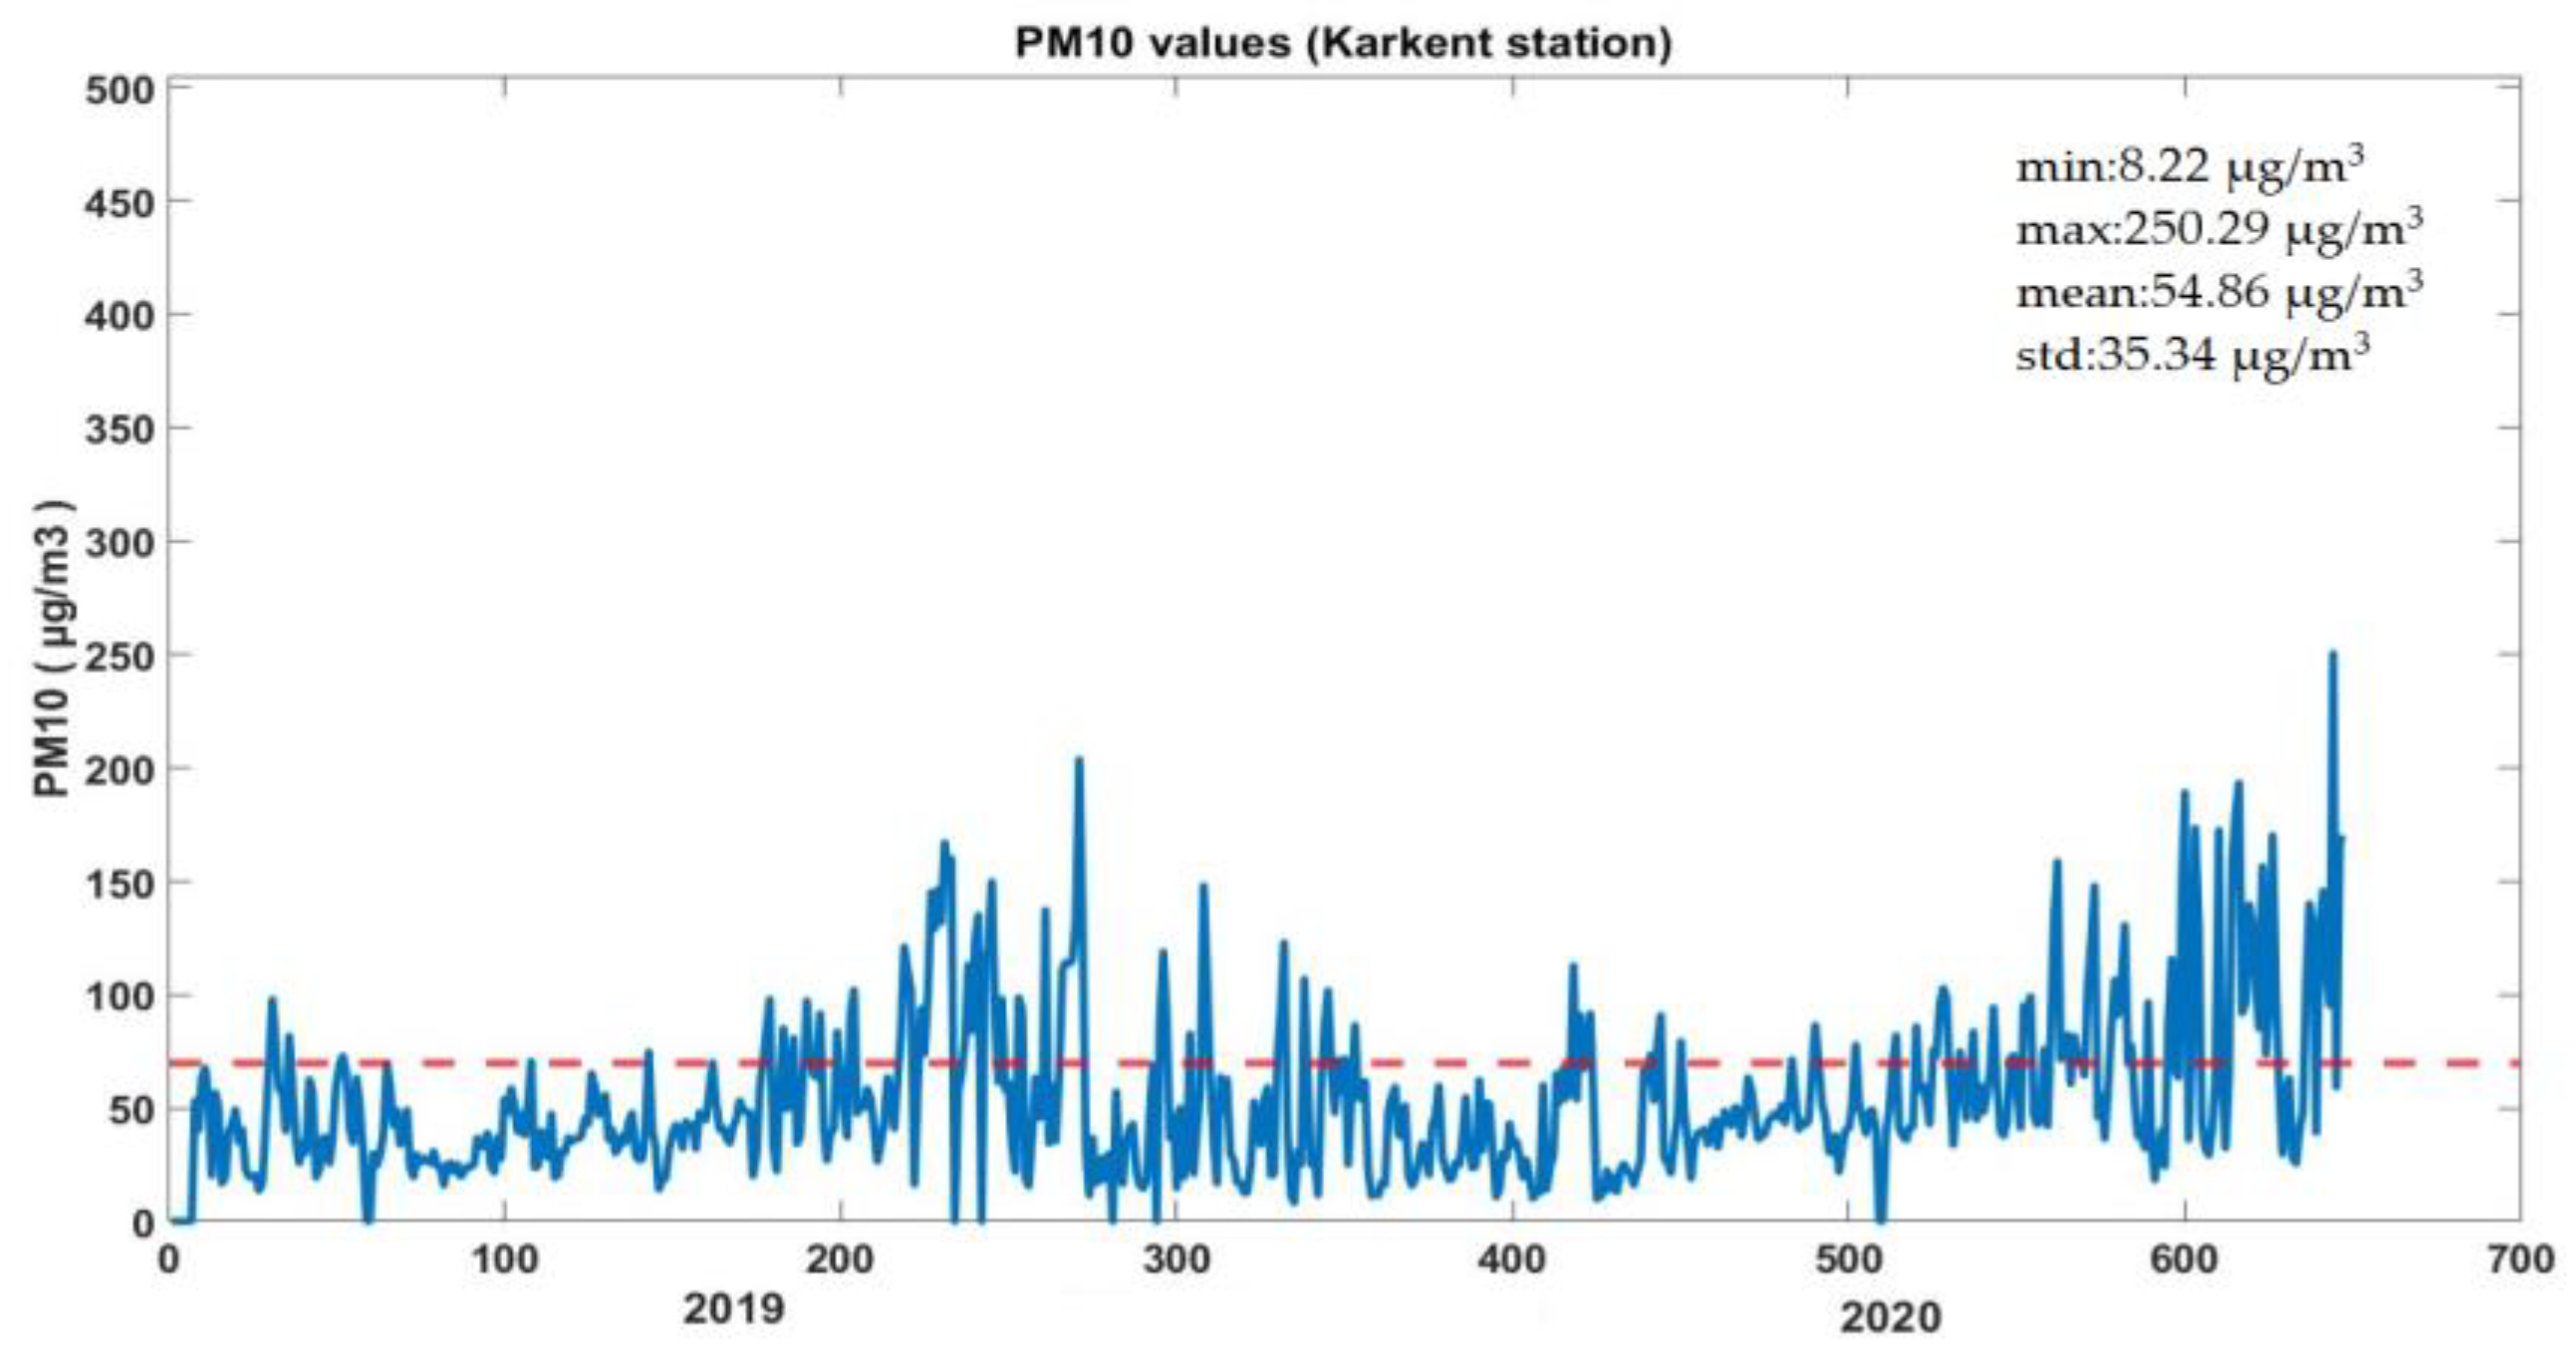
Industry activities are at the forefront of the factors affecting the PM10 value. Heating-induced fuel consumption activities also negatively affect the PM10 value and are very harmful to human health. Particulate matter emitted from the factories operating in the central districts of Konya, which was chosen as the study area, maintain standards throughout the year. However, an increase was observed in October, December, and January, when the consumption of heating fuel increased. When the values formed on the map are examined, it can be seen that the monthly averages for 2019 and 2020 are generally in the good category. Sometimes there is a transition to the middle category, and very rarely the values are in the sensitive category. The time series of the PM10 index and the standard deviation, minimum, maximum, and average values of the PM10 values are provided for each station in Figure 5, Figure 6, Figure 7 and Figure 8. Among the pollutants, only the PM10 value is observed to exceed the national legal limit value at certain times. For this reason, only the PM10 value was examined with the daily time series graph. As can be seen in Figure 5, Figure 6, Figure 7 and Figure 8, the PM10 values are quite high in winter months compared to summer months.
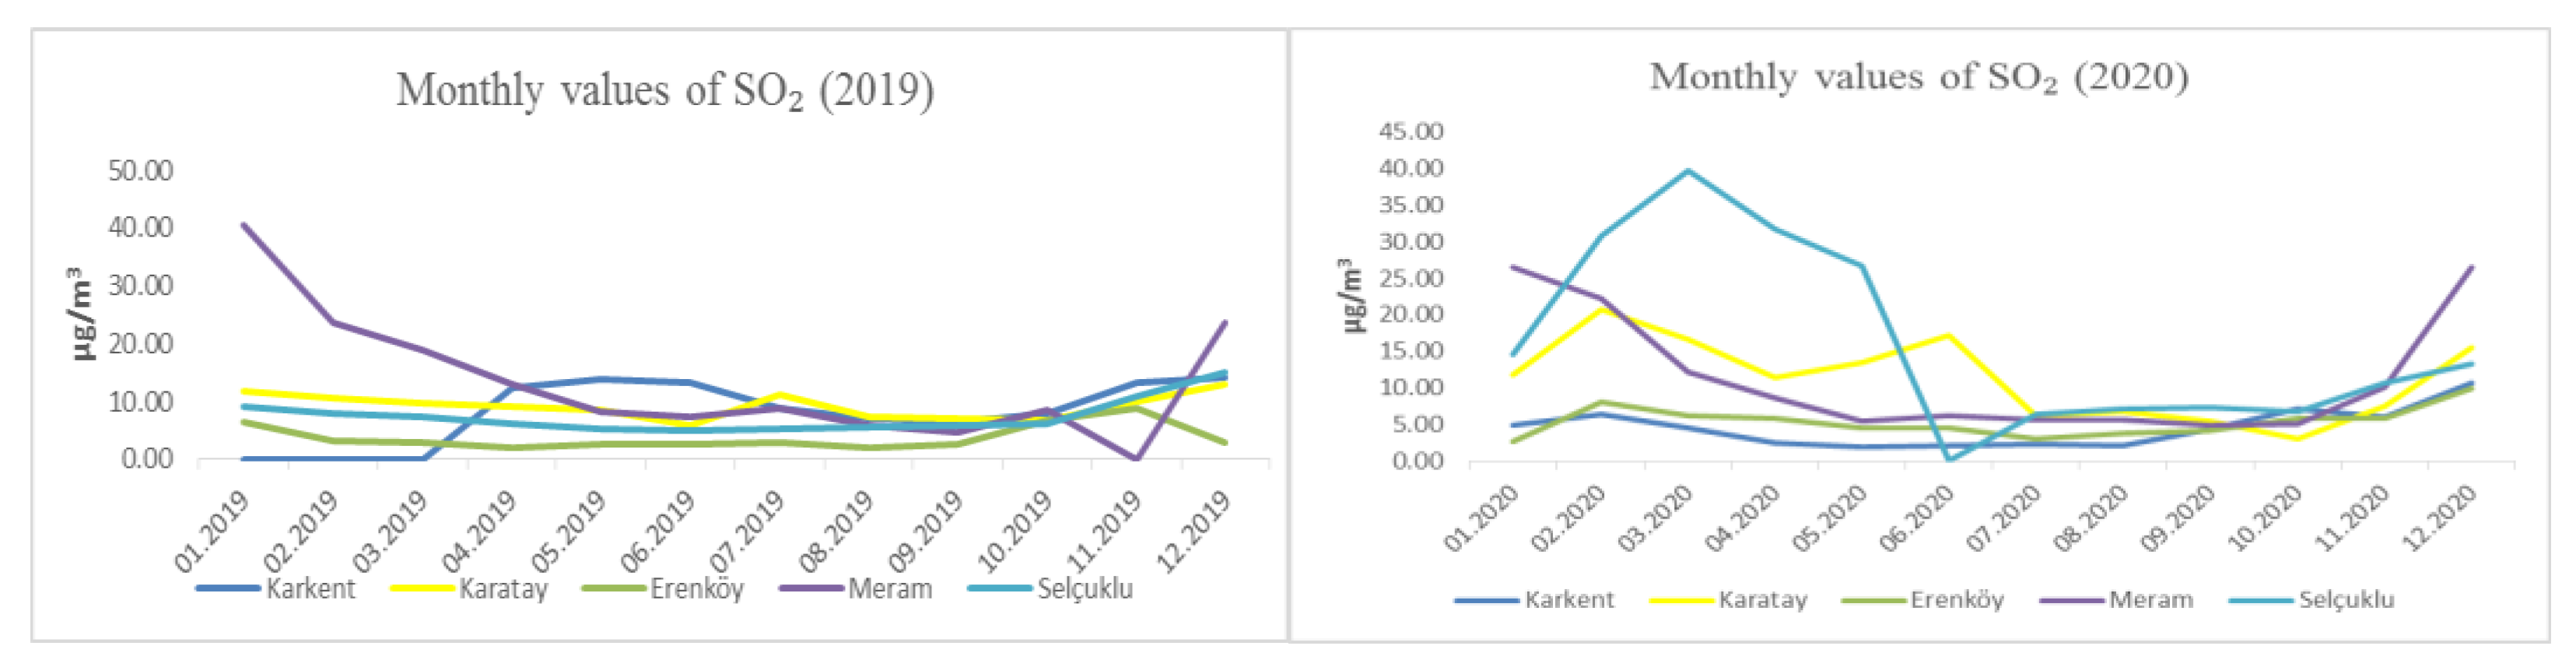
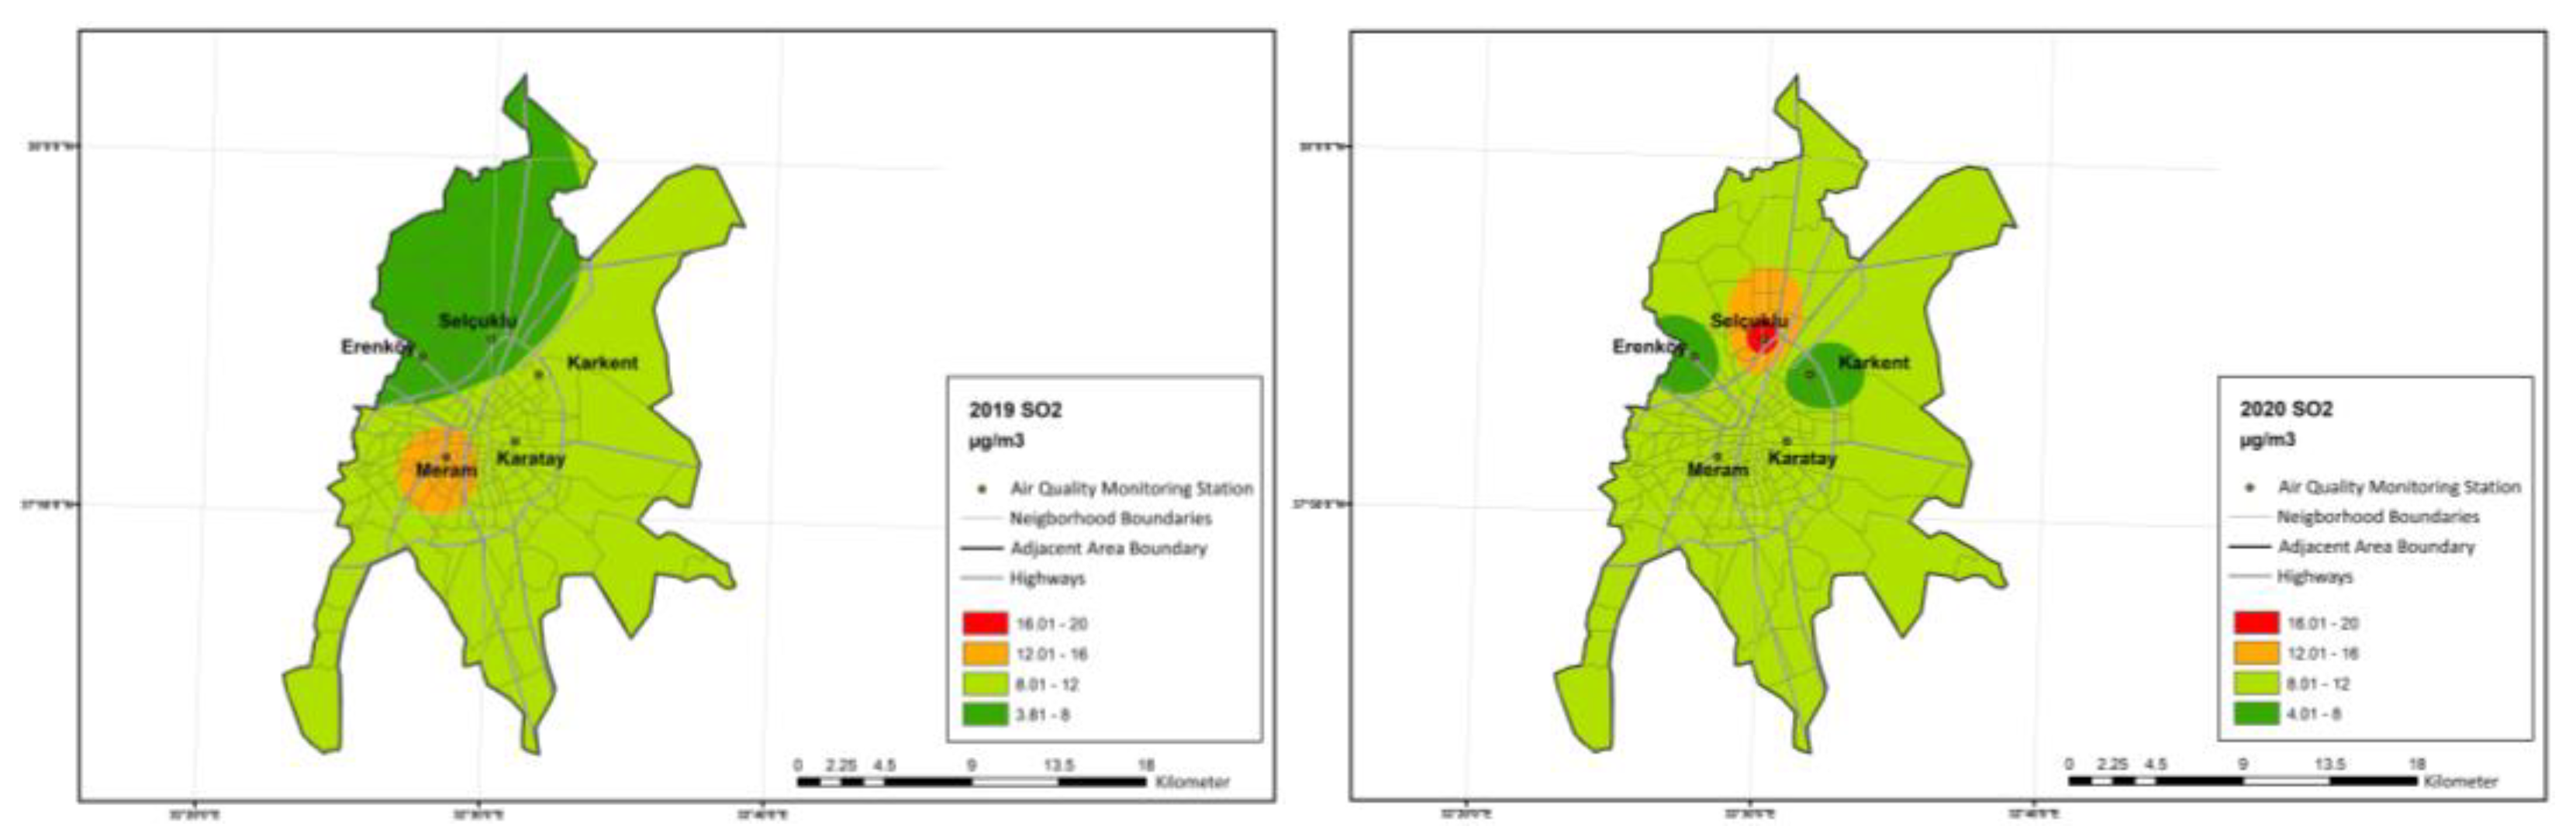
In Figure 9, the monthly 1 h averages of the SO2 air pollutants, taken for one year for the years 2019 and 2020, are shown. According to the Table 1, the limit value for SO2 is 410 µg/m3. When the maps are examined, the averages for 2019 and 2020 all appear in the good category. When an evaluation is made on the maximum and minimum values, it has been observed that the dirtiest place is Meram and the cleanest place is the Selçuklu district (Figure 10). It can be seen that the values are higher in the winter season, and that the values decrease depending on the season and the warming of the weather conditions. During the lockdown period, when curfews were enforced, industrial emissions decreased compared to the pre-pandemic period.
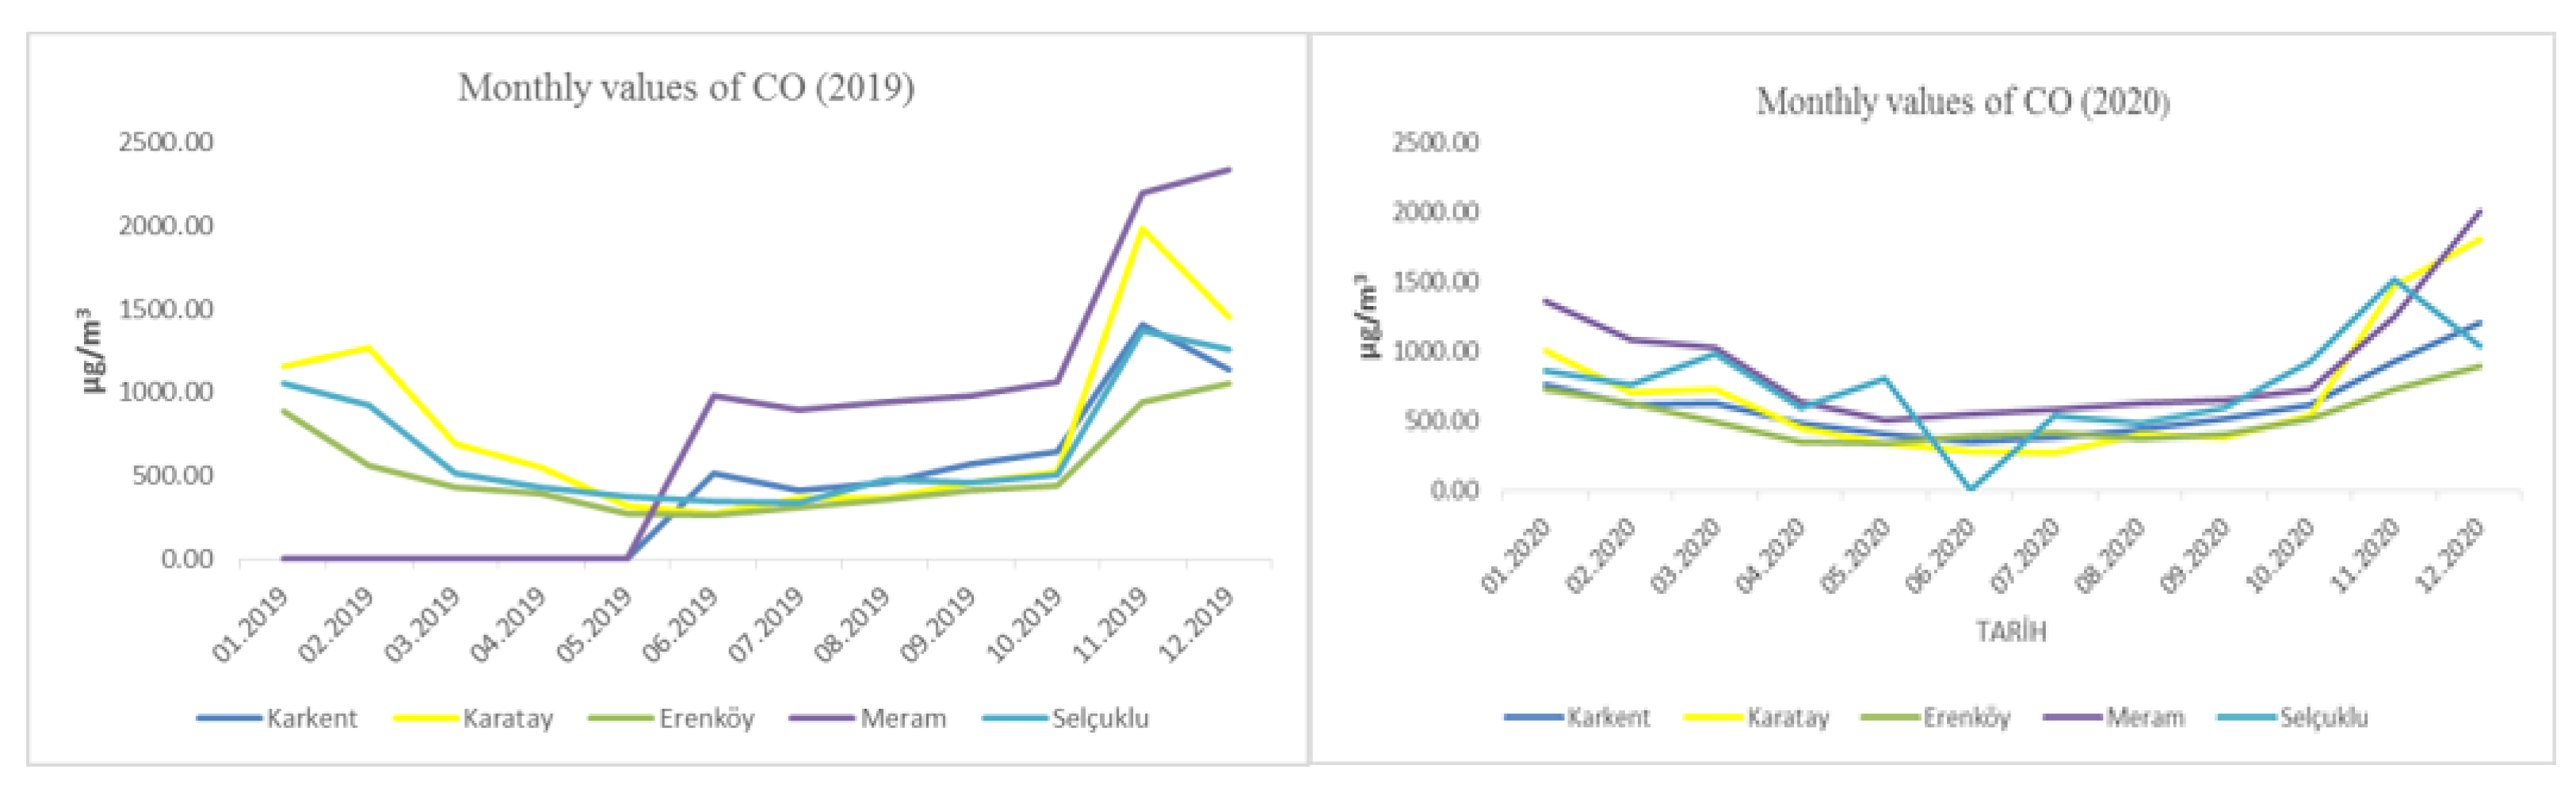
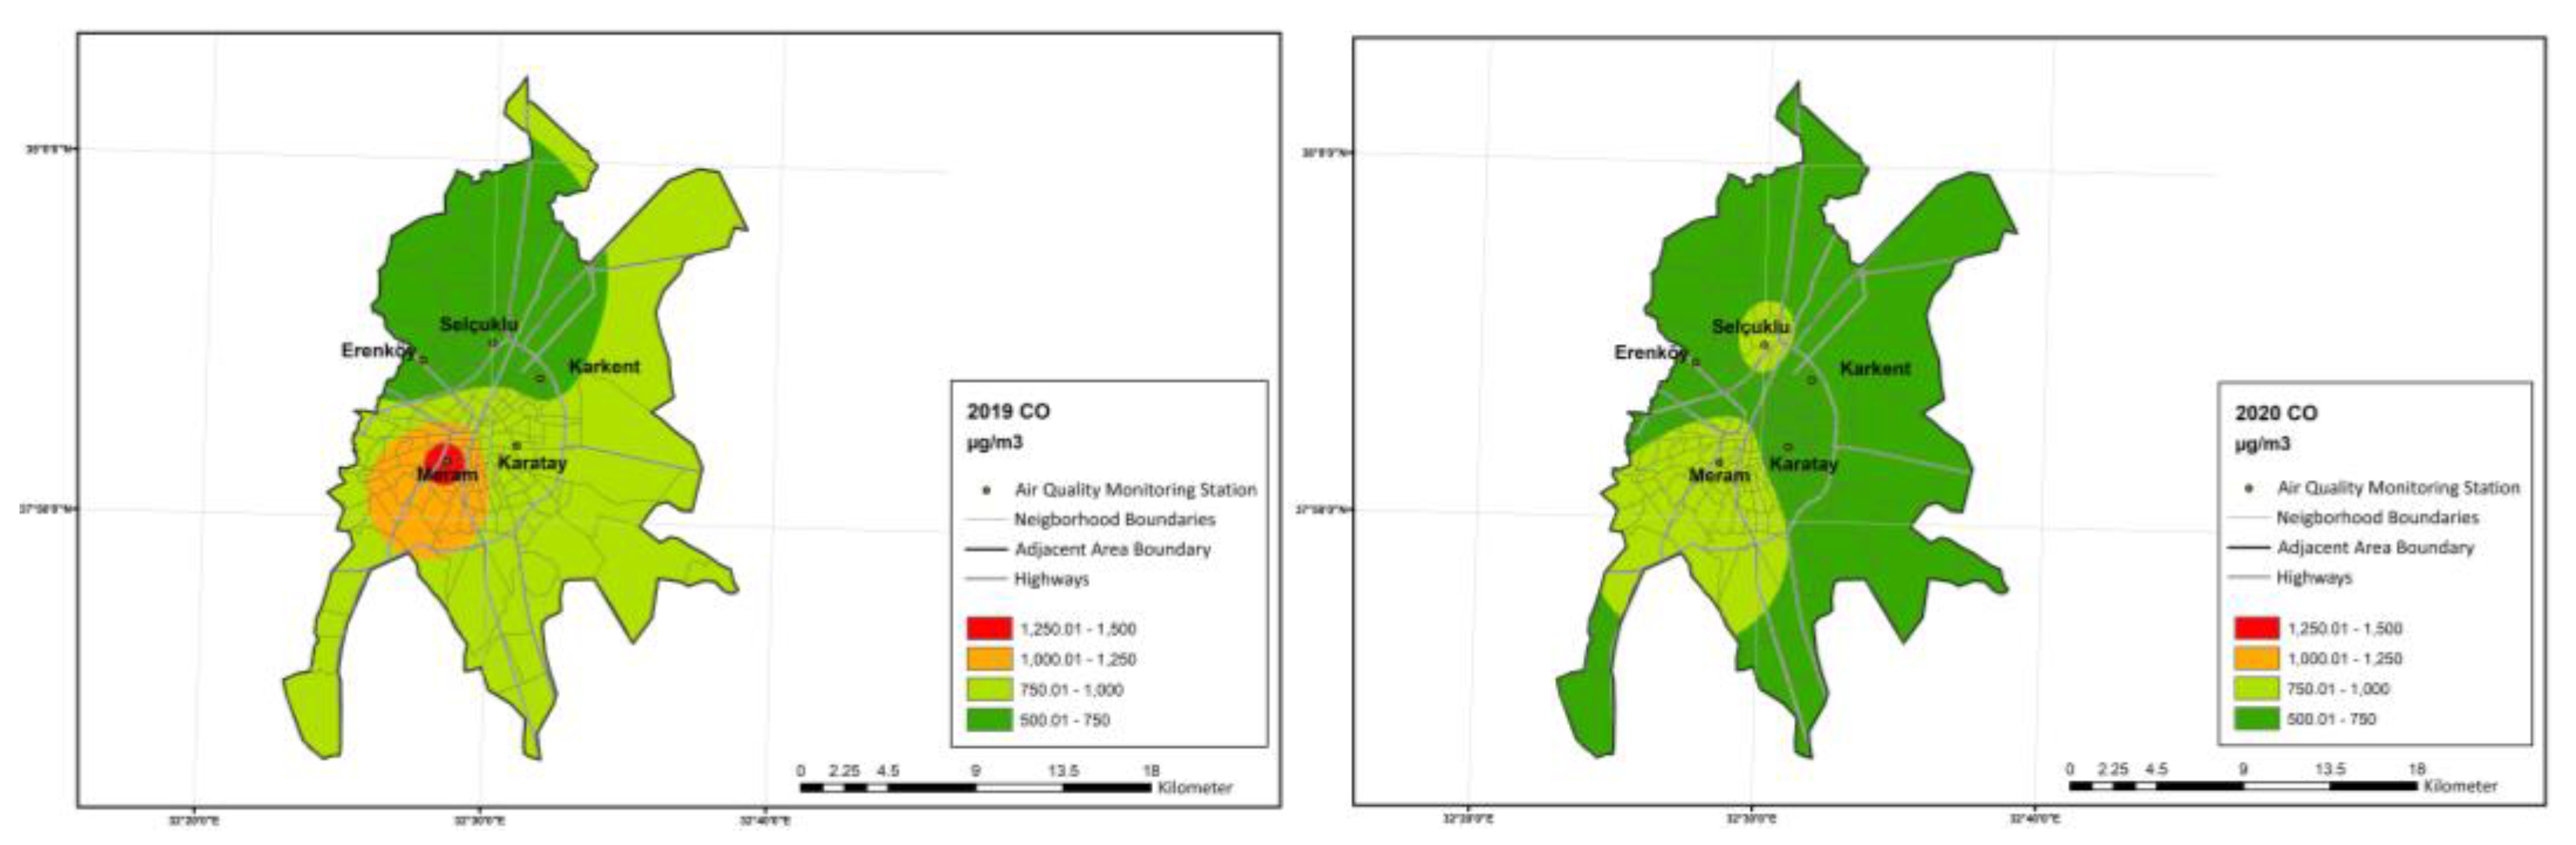
In Figure 11, the monthly 8 h averages, taken for one year, of CO air pollutants for the years 2019 and 2020 are shown. The limit value for CO is 10,000 µg/m3 (Table 1); it is not shown on the chart in order to avoid complicating the reading of the tables since it is a much higher value than the other values obtained. While the main sources of indoors CO pollutant are cigarette smoke and heating, approximately 90% of the sources in outdoor environments are gasoline vehicles. In addition, fires, forest fires, and solid waste incineration plants are responsible for 10% of the carbon monoxide in the outdoor environment. Since it is a colorless, odorless, and tasteless gas, people who are exposed to this gas may not realize it most of the time. Therefore, it is very important to have protection systems in living spaces [3]. The maximum value for 2019, 2333.02 µg/m3, was recorded at Meram station in December. The maximum value for 2020, 2006.52 µg/m3, was recorded at Meram station in December. It can be seen that there is a higher increase in the winter months compared to other times. Despite this increase, the CO value is below the national legal limit value. Figure 12 shows the CO pollution maps of the adjacent areas of Konya province for the years 2019–2020.
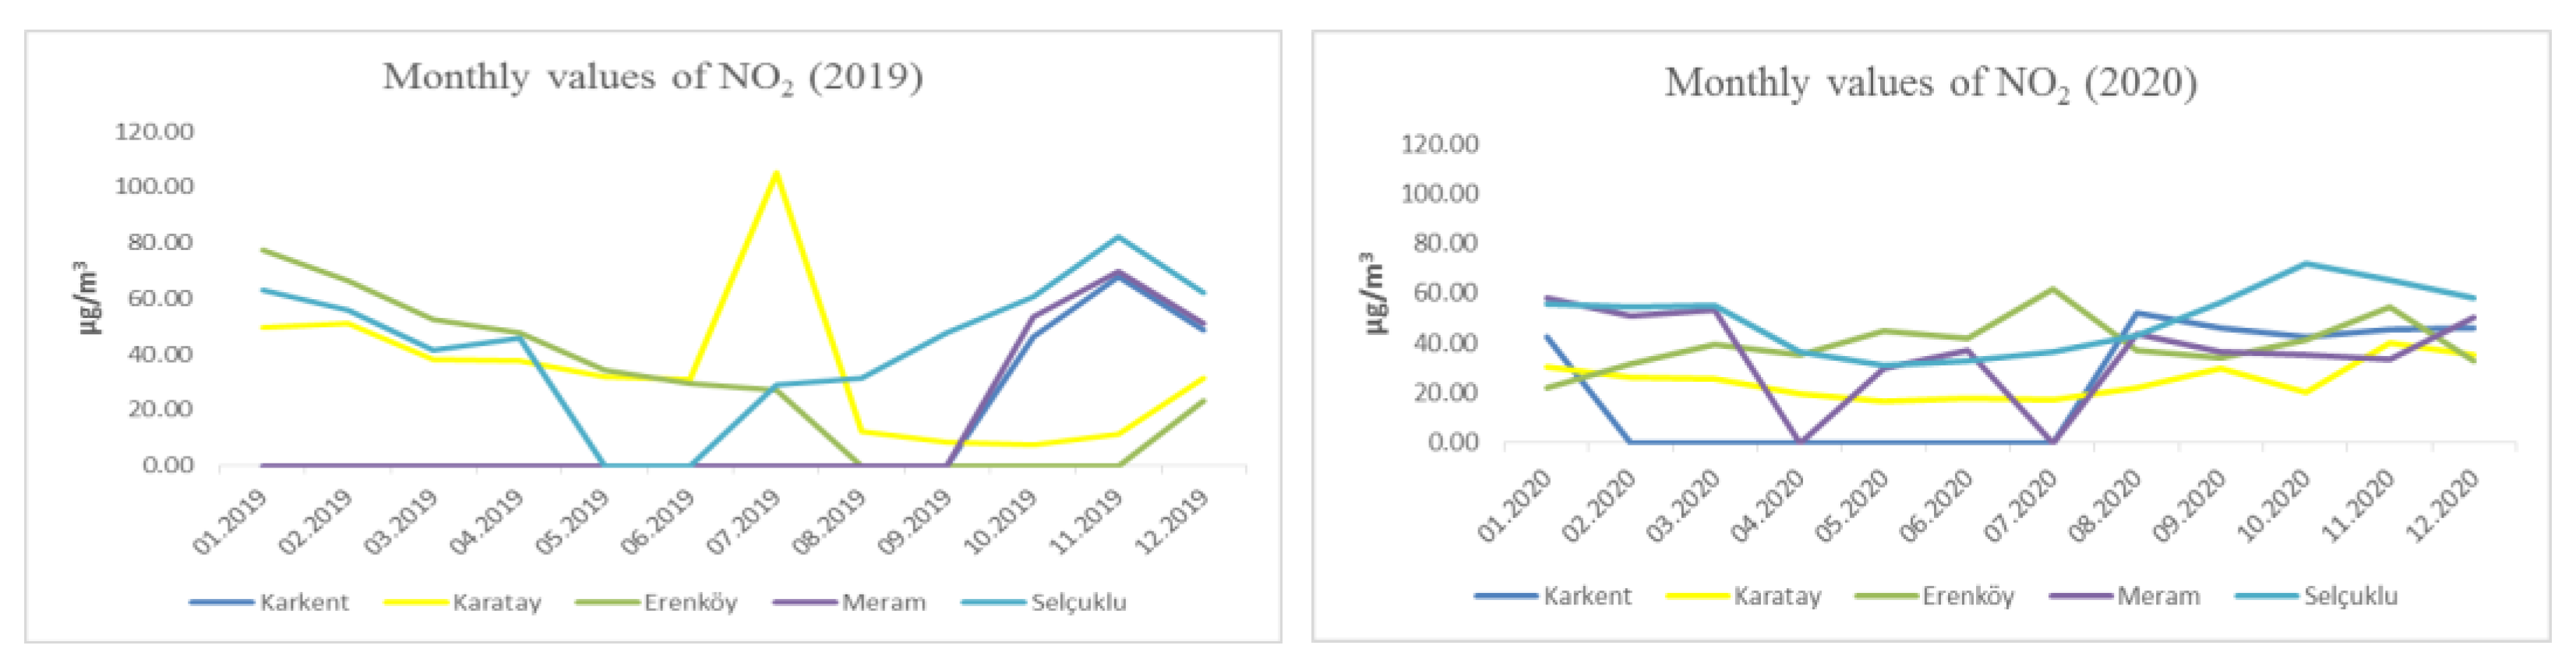
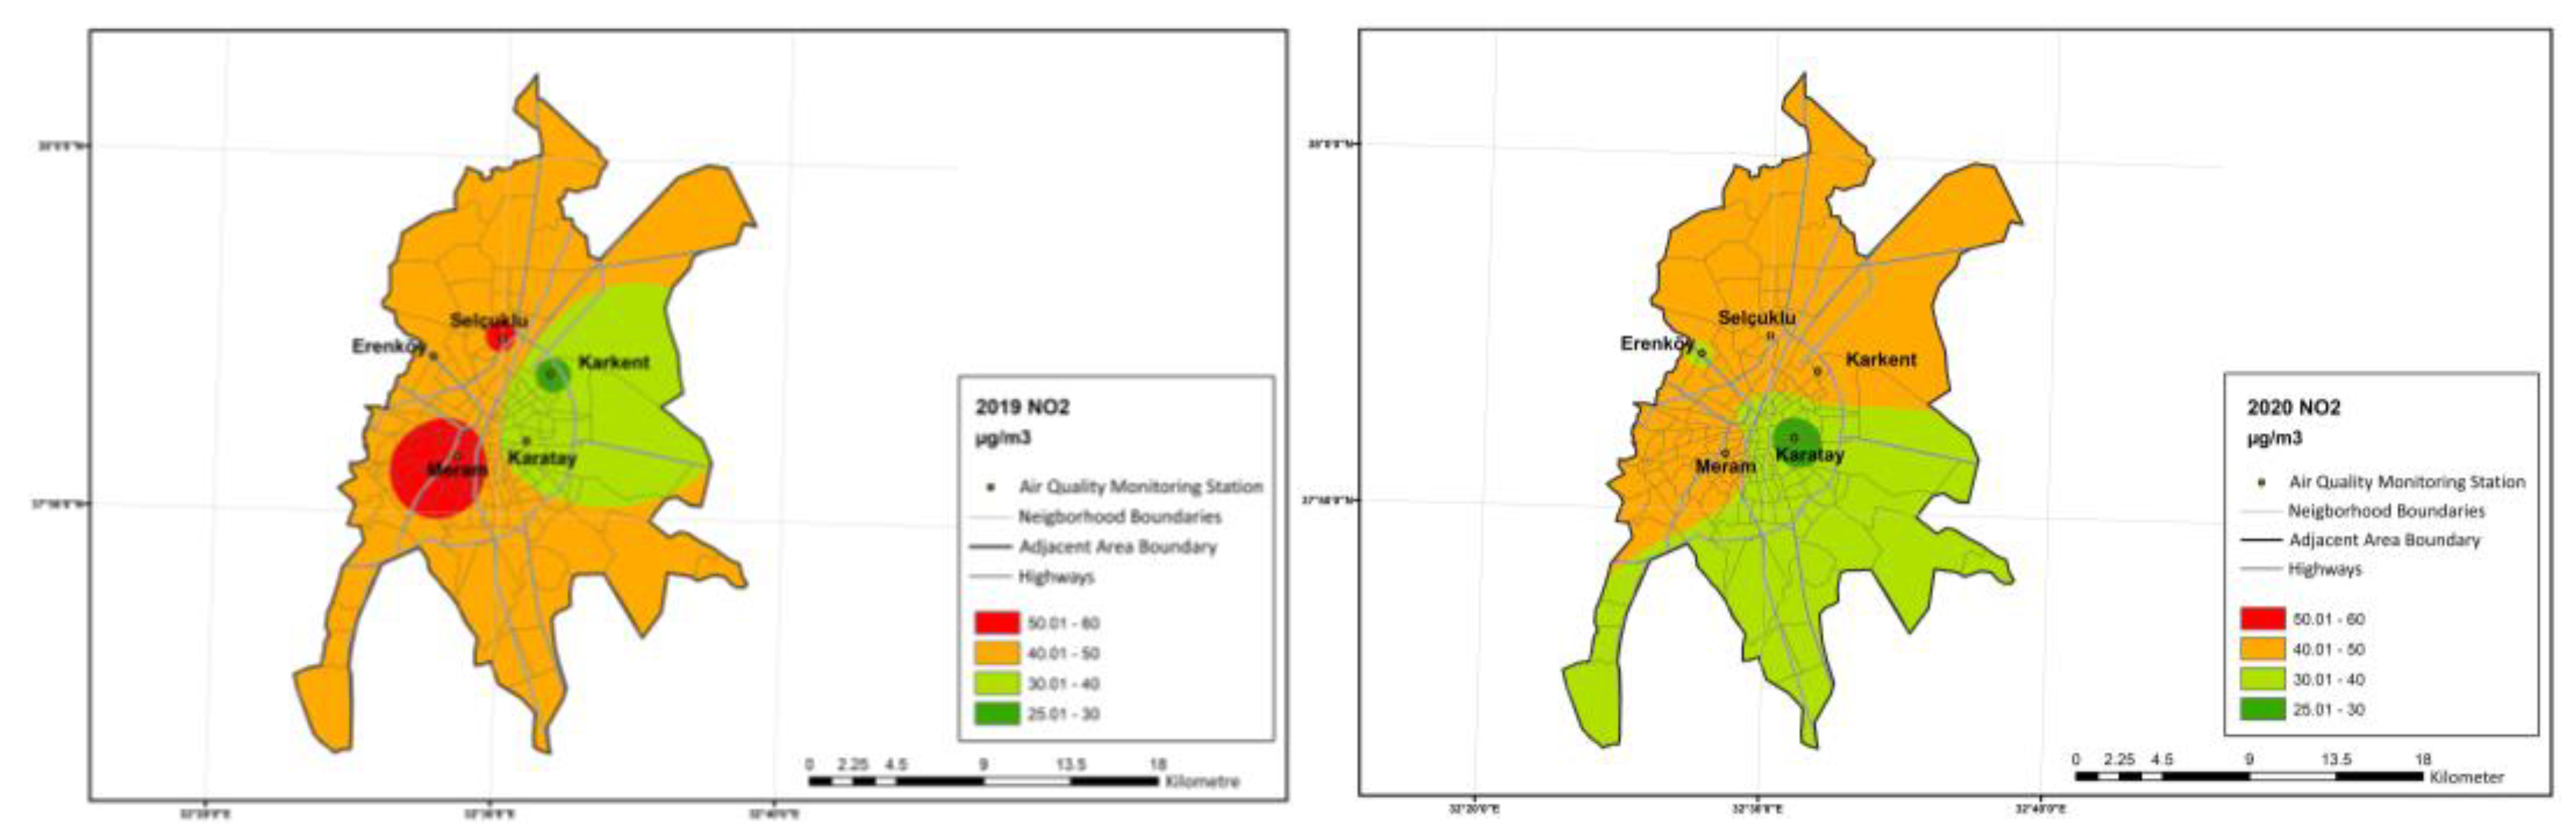
In Figure 13, monthly averages of 1 h, taken for one year of NO2 air pollutants in 2019 and 2020, are shown. The maximum value for 2019 (105.01 µg/m3) was recorded at Karatay station in July. The maximum value for 2020 (71.77 µg/m3) was recorded at Selçuklu station in October. The limit value for NO2 is 270 µg/m3; all averages are in the good category. NO2 pollution maps are shown in Figure 14. NO2 greatly affects human health and is one of the most important air pollutants in urban areas. The main sources of NO2 pollutants are human resources and the overuse of these resources, such as fossil-fuel-burning boilers in industrial plants, and vehicles on land, in the air, and in the sea. In terms of human health effects, even the brief exposure of a healthy person to very high NO2 concentrations can cause serious lung damage. It has been observed that the curfews initiated with the measures taken during the lockdown period caused the air quality to increase, and the NO2 values decreased in parallel.
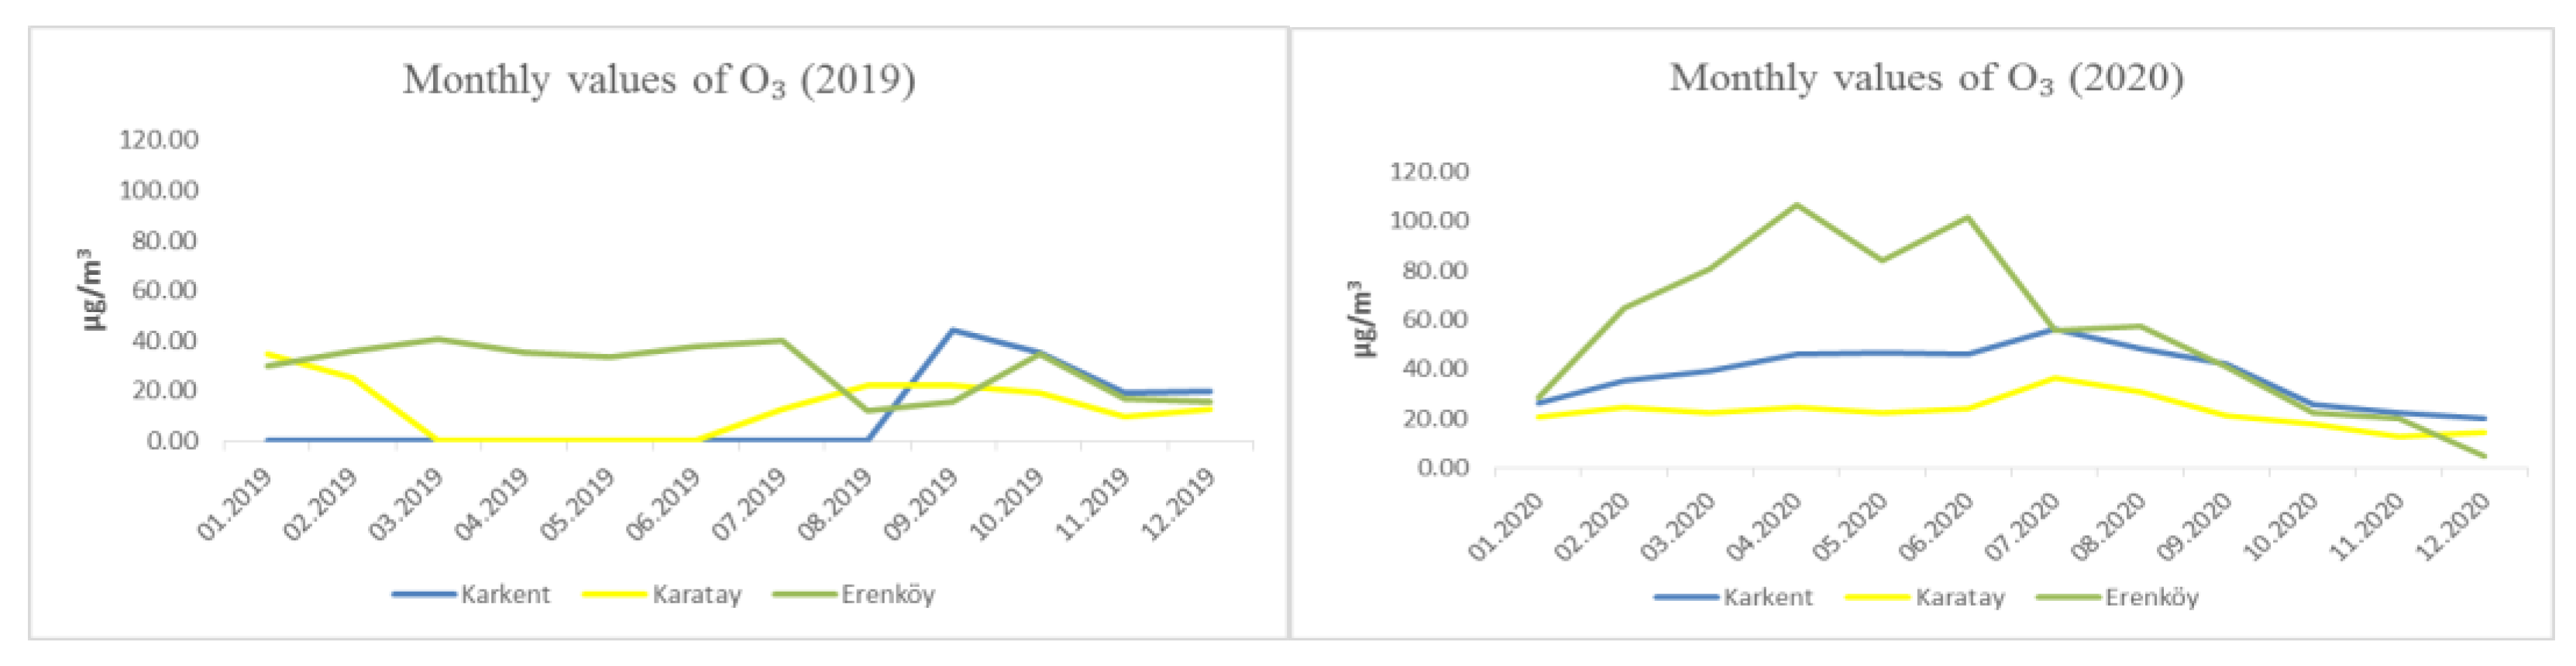
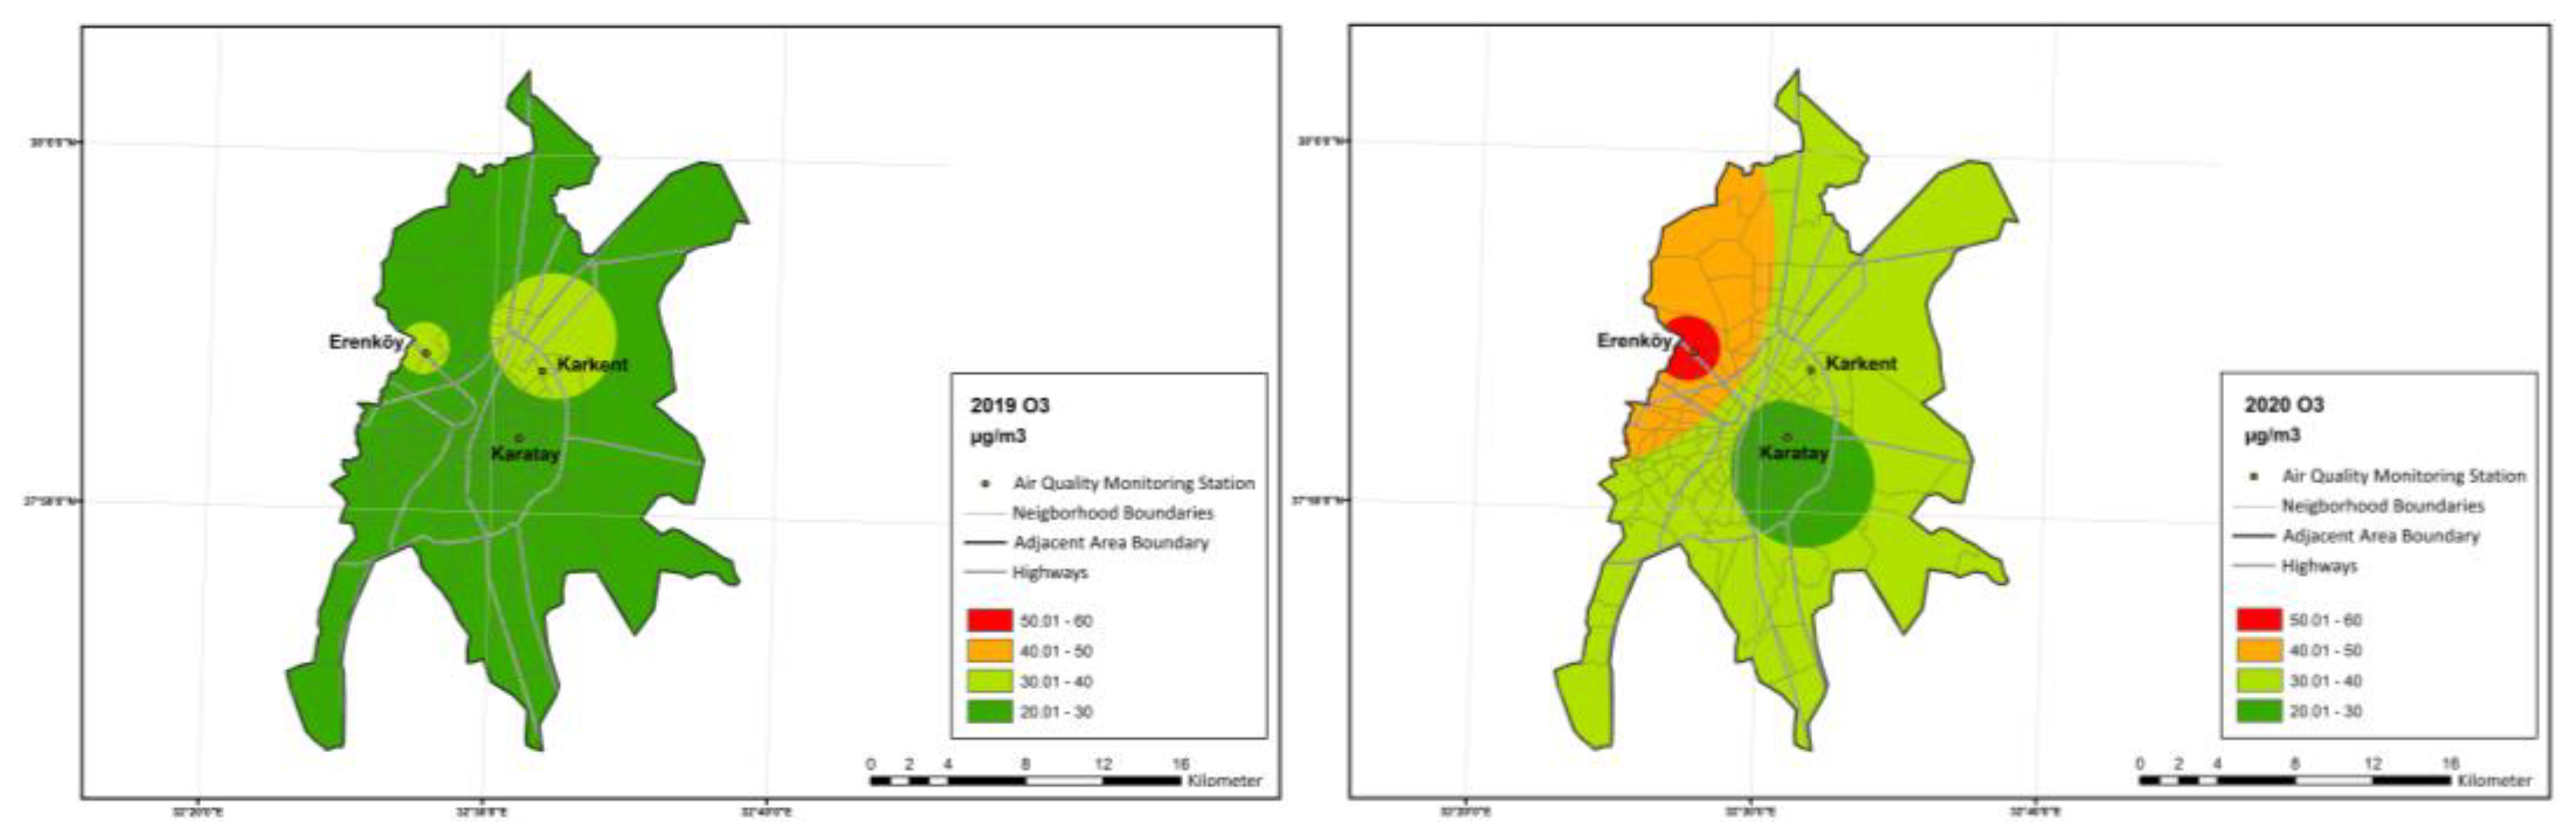
The O3 pollutant was recorded only at the Karkent, Karatay, and Erenköy stations. The limit value provided in Table 1 is 120 µg/m3, and it was not possible to exceed the limit value for 2019 and 2020. It can be seen that the highest values for 2020 were recorded at the Erenköy station in the first 6 months. Monthly values and pollution maps of O3 are shown in Figure 15 and Figure 16. The ozone concentration usually occurs in the summer months when the sun is effective; that is, during the high temperatures of the summer. It can seriously badly affect those who perform physical activity outside at noon, the entire respiratory system, asthma patients, lung patients, children, and the elderly. Considering the monthly values, it can be seen that there was a significant decrease in air pollution in 2019 and 2020 due to the COVID-19 lockdown.
5. Conclusions
The data obtained in this study, which was carried out within the borders of the adjacent area of Konya Province, were examined through graphics. Air pollution maps of SO2, PM10, CO, NO2, and O3 pollutants were designed, and air pollution analyses were made for the years 2019 and 2020.
In the evaluation of air pollution, it can be seen that the national limit value was not violated often in 2019 and 2020. It can be observed that the PM10 value exceeded the limit value in only in October, November, and December in both years. When the full restriction, partial restriction, and full closure processes which occurred in Turkey due to the COVID-19 pandemic in 2020 were examined, no difference could be detected from 2019.
It has been determined that the study area can be evaluated as good according to the limit values of the Air Quality Assessment and Management Regulation published by the Ministry of Environment and Urbanization. Within the scope of the IKONAIR project, action plans with different scenarios were prepared for the years 2012–2019. In order to prevent city air pollution and improve air quality, the current situation has been examined through maps and graphics. Facilities with a high pollution load (emission output) on a source basis, the incineration of industrial wastes, roads with high traffic density, fuel distribution used in domestic heating, and public transportation and alternative roads, etc., were examined. Regions with a high pollution load were graded, and action plans were prepared by planning relevant measures on a regional basis. It is thought that the clean air action plans put into practice for the years 2012–2019 were effective in their results. From the analyses, which included meteorological factors, pollutant emissions, industrial zone facilities, and transportation network plans where fuel use was taken into account with precision, it can be seen that the air pollution is under control. For now, the 2020–2024 clean air action plans have been implemented. In this context, it is stated that the inspection of industrial and domestic fuel use has been increased, transportation networks are planned to reduce air pollution, and air quality monitoring stations are regularly controlled and monitored [54].
Especially in winter, the use of fossil fuels used for heating should be limited, or the use of natural gas should be encouraged. In addition, current pollution maps should be created by determining the situation at certain time intervals. Air pollution action plans should be updated regularly and should be ready for implementation at any time. The carbon fraction is highly effective in PM10 values. This can be caused by the migration of air pollutants from neighboring municipalities (where the use of fossil fuels for heating is allowed). In regions with air pollution potential, the surroundings should also be kept under control [55]. It is stated that Krakow is the city with the highest air pollution, despite many restrictive laws in Poland. It has been revealed that the pollutants are transported from the surrounding regions due to the effect of meteorological factors with respect to location. A significant relationship was found between the topographic structure of the city and its meteorological features in terms of air pollution. Solid fuel heating outside the city raises PM1, PM2.5, and PM10 concentrations due to air pollution input [55]. As a result of the analysis of wind direction, pressure, temperature, and humidity data, it can be stated that the air pollution caused by solid fuel heating decreased to a certain extent during the closures due to COVID-19 in Krakow [46]. Konya is a closed basin surrounded by mountains. For this reason, it is not stated that air pollution from the surrounding regions is carried by meteorological effects. Air pollution can be interfered with by locally taken measures.
Regarding the study carried out using the data obtained from the Air Quality monitoring stations: in order to obtain more reliable and more accurate results, it is recommended to shorten the maintenance times, to intervene immediately in cases of failure, and to provide a temporary station when necessary. The number of stations should be increased for a more rigorous analysis of pollution.
When the air pollution reports are examined by years, it can be seen that the pollution was slightly reduced by the measures taken. However, there are still deficiencies in some areas, especially in the industry. At this point, changing the existing laws and rules related to air pollution, making frequent inspections in the light of these rules, investigating the reasons for the instant increase in air pollution values, and taking the necessary precautions are important steps.
The study is the result of a two-year due diligence. It was intended to make a prediction regarding air pollution in the coming periods by examining the time periods determined in the past.
Author Contributions
Conceptualization, I.B. and O.U.; methodology, I.B. and O.U.; writing—original draft preparation, I.B. and O.U.; writing—review and editing, I.B. and O.U.; visualization, I.B. and O.U.; supervision, I.B and F.K. All authors have read and agreed to the published version of the manuscript.
Funding
This research received no external funding.
Institutional Review Board Statement
Not applicable.
Informed Consent Statement
Not applicable.
Data Availability Statement
Data were downloaded from the Ministry of Environment, Urbanization and Climate Change / National Air Quality Monitoring Network web page (https://www.havaizleme.gov.tr/), accessed on 14 May 2021. The stations are regularly checked and updated.
Acknowledgments
This article was produced from the master thesis titled “Spatial Analysis of Factors Affecting Air Pollution in Konya Province” completed at Institute of Science at Necmettin Erbakan University.
Conflicts of Interest
Authors state no conflict of interest.
References
- Air Pollution Report of the Ministry of Environment and Urbanization. Available online: https://www.cmo.org.tr (accessed on 5 January 2023).
- Ministry of Environment, Urbanization and Climate Change. Air Pollution Report. Available online: https://csb.gov.tr/ (accessed on 1 December 2022).
- Kılıç, A. Exhaust Gas Emissions from Ships and Dispersion Modeling. Master’s Thesis, İstanbul Technical University, İstanbul, Turkey, 2006. [Google Scholar]
- Goyal, P.; Kumar, A. Mathematical Modeling of Air Pollutants: An Application to Indian Urban City. In Air Quality-Models and Applications; IntechOpen Limited: London, UK, 2011. [Google Scholar] [CrossRef] [Green Version]
- Erdogan, E. The Role of Models in Terms of Decision Making in Industry Based Air Pollution. Master’s Thesis, İstanbul Technical University, İstanbul, Turkey, 2012. [Google Scholar]
- Kudal, S. Environmental and Spatial Modelling, Analysis and Visualization with Thematic Maps of Air Pollution. Master’s Thesis, İstanbul Technical University, İstanbul, Turkey, 2009. [Google Scholar]
- Kesarkar, A.P.; Dalvi, M.; Kaginalkar, A.; Ojha, A. Coupling of the weather research and forecasting model with AERMOD for pollutant dispersion modeling. A case study for PM10 dispersion over Pune, India. Atmos. Environ. 2007, 41, 1976–1988. [Google Scholar] [CrossRef]
- Russell, A.; Dennis, R. NARSTO critical review of photochemical models and modeling. Atmos. Chem. Phys. 2000, 34, 2283–2324. [Google Scholar] [CrossRef]
- Seaman, N.L. Future directions of meteorology related to airquality research. Environ. Int. 2003, 29, 245–252. [Google Scholar] [CrossRef] [PubMed]
- Kumar, A.; Dhakhwa, S.; Dikshit, A.K. Comparative Evaluation of Fitness of Interpolation Techniques of ArcGIS Using Leave-One-Out Scheme for Air Quality Mapping. J. Geovisualization Spat. Anal. 2022, 6, 9. [Google Scholar] [CrossRef]
- Hashim, M.; Kanniah, K.D.; Ahmad, A.R.A.W.; Ibrahim, A.L. The use of AVHRR data to determine the concentration of visible and invisible tropospheric pollutants originating from a 1997 forest fire in Southeast Asia. Int. J. Remote Sens. 2004, 25, 4781–4794. [Google Scholar] [CrossRef] [Green Version]
- Othman, N.; MatJafri, M.Z.; Lim, H.S.; Abdullah, K. Retrieval of aerosol optical thickness (AOT) and its relativity to air pollution particulate matter (PM10). In Proceedings of the CGIV’09, Sixth International Conference on Computer Graphics Imagery and Visualization, Tianjin, China, 11–14 August 2009. [Google Scholar]
- Zhang, H.; Liu, Y.; Shi, R.; Yao, Q. Evaluation of PM10 forecasting based on the artificial neural network model and intake fraction in an urban area: A case study in Taiyuan City, China. J. Air Waste Manag. Assoc. 2013, 63, 755–763. [Google Scholar] [CrossRef] [Green Version]
- Jumaaha, H.J.; Ameenb, M.H.; Kalantarc, B.; Jumaah, H.M.; Rizeeidand, S.J. Air quality index prediction using IDW geostatistical technique and OLS-based GIS technique in Kuala Lumpur, Malaysia. Geomat. Nat. Hazards Risk 2019, 10, 2185–2199. [Google Scholar] [CrossRef] [Green Version]
- Zang, L.; Mao, F.; Guo, J.; Wang, W.; Pan, Z.; Shen, H. Estimation of spatiotemporal PM distributions in China by combining PM observations with satellite aerosol optical depth. Sci. Total Environ. 2019, 658, 1256–1264. [Google Scholar] [CrossRef]
- Ajay, R. Atmospheric Pollution Retrieval Using Path Radiance Derived from Remote Sensing Data. J. Geovisualization Spat. Anal. 2021, 5, 26. [Google Scholar]
- Phuong, D.T.K.; Nhut, M.C.; Tri, N.D. Air Pollution Assessment Using Rs and Gis In Ho Chi Minh City, Viet Nam: A Case Study Of Period 2015-2019 For SO2 And NO2. In IOP Conference Series: Earth and Environmental Science; IOP Publishing Ltd.: Bristol, UK; Ho Chi Minh City Univ Technol: Ho Chi Minh City, Vietnam, 2021; Volume 652. [Google Scholar]
- Adza, W.K.; Hursthouse, A.S.; Miller, J.; Boakye, D. Exploring the Combined Association between Road Traffic Noise and Air Quality Using QGIS. Int. J. Environ. Res. Public Health 2022, 19, 17057. [Google Scholar] [CrossRef]
- Oji, S.; Adamu, H. Air Pollution Exposure Mapping by GIS in Kano Metropolitan Area. Pollution 2021, 7, 101–112. [Google Scholar]
- Koc, A.; Yılmaz, S.; Mutlu, E. Effect of Large Green Areas on Air Quality in Center of Erzurum. Iğdır Univ. J. Inst. Sci. Tech. 2016, 6, 109–112. [Google Scholar] [CrossRef]
- Demirarslan, K.O.; Akıncı, H. Assessment of Winter Season Air Quality in the Marmara Region Using GIS and Air Quality Data. J. Nat. Hazards Environ. 2018, 4, 11–27. [Google Scholar]
- Karabas, A.S. The Formation and Analysis of the Energy, Noise and Air Pollution Maps Through the Geographic Information System Based on Province of Kayseri. Master’s Thesis, Erciyes University, Kayseri, Turkey, 2012. [Google Scholar]
- Chaudhary, M.T. Air pollution modeling in İskenderun region of Turkey. Master’s Thesis, Middle East Technical University, Ankara, Turkey, 2003. [Google Scholar]
- Daylan, E.G.; Incecik, S. Investigation of air quality and spatial analysis using GIS approach in İstanbul. ITU Eng. J. 2002, 1, 51–62. [Google Scholar]
- Elbir, T.; Müezzinoğlu, A.; Bayram, A.; Seyfioğlu, R.; Demircioğlu, H. Air Pollutant Emission Inventory of Aegean Region. DEU J. Sci. Eng. 2001, 3, 21–27. [Google Scholar]
- Karimi, H.; Soffianian, A.; Mirghaffari, N.; Soltani, S. Determining Air Pollution Potential Using Geographic Information Systems and Multi-criteria Evaluation: A Case Study in Isfahan Province in Iran. Environ. Process-An Int. J. 2016, 3, 229–246. [Google Scholar] [CrossRef]
- Gaga, E.O.; Döğeroğlu, T.; Özden, Ö.; Ari, A.; Yay, O.D.; Altuğ, H.; Akyol, N.; Örnektekin, S.; Van Doorn, W. Evaluation of air quality by passive and active sampling in an urban city in Turkey: Current status and spatial analysis of air pollution exposure. Environ. Sci. Pollut. Res. 2012, 19, 3579–3596. [Google Scholar] [CrossRef] [PubMed]
- Chauhan, A.; Singh, R.P. Decline in PM2.5 concentrations over major cities around the World associated with COVID-19. Environ. Res. 2020, 187, 109634. [Google Scholar] [CrossRef]
- Dantas, G.; Siciliano, B.; França, B.B.; da Silva, C.M.; Arbilla, G. The impact of COVID-19 partial lockdown on the air quality of the city of Rio de Janeiro, Brazil. Sci. Total Environ. 2020, 729, 139085. [Google Scholar] [CrossRef]
- Wang, P.; Chen, K.; Zhu, S.; Wang, P.; Zhang, H. Severe air pollution events not avoided by reduced anthropogenic activities during COVID-19 outbreak. Resour. Conserv. Recycl. 2020, 158, 104814. [Google Scholar] [CrossRef] [PubMed]
- Karan, A.; Kabeer, A.; Surujpal, T.; Sateesh, S. The impact of air pollution on the incidence and mortality of COVID-19. Glob. Health Res. Policy 2020, 5, 39. [Google Scholar] [CrossRef]
- Munzel, T.; Hahad, O.; Pozzer, A.; Lelieveld, J. Air pollution as important cofactor in COVID-19 deaths. Kardiologe 2021, 15, 645–651. [Google Scholar]
- Roy, M.P. Air Pollution and COVID-19: Experience from India. Eur. Rev. Med. Pharmacol. Sci. 2021, 25, 3375–3376. [Google Scholar]
- HalkBank. Available online: https://www.halkbank.com.tr/tr/blog/surdurulebilirlik/covid-19-doneminde-bireysel-arac-kullanimi.html (accessed on 5 January 2023).
- IKONAIR 2012–2019. Available online: https://webdosya.csb.gov.tr/ (accessed on 5 January 2023).
- Konya Clean Air Action Plan. 2013.
- Tosun, E. The Evaluation of Turkey’s Air Quality Data Between 2009 and 2016. Master’s Thesis, Hacettepe Univerity, Ankara, Turkey, 2017. [Google Scholar]
- Çiftçi, Ç.; Dursun, S.; Levend, S.; Kunt, F. Effect of Topographic Structure, Climatic conditions and Town Planning on Konya City Air Pollution Problem. In Proceedings of the Restructuring of Cities Symposium with International Participation, İstanbul, Turkey, 26–29 September 2012. [Google Scholar]
- Ozdemir, F. Sulfur Dioxide and Throughout Turkey Particulate Material Pollution Distributions Analysis. Master’s Thesis, Yıldız Thecnical University, İstanbul, Turkey, 2008. [Google Scholar]
- Dursun, S.; Gürü, M. Investigation of the Relationship of SO2 Concentration with Meteorological Factors and Measurement of Non-Oxidized SO2 in Rainwater, Combustion and Air Pollution Control. III. In Proceedings of the National Symposium, Ankara, Turkey; 1995. [Google Scholar]
- Dursun, S. Measurement of Sulfur Dioxide and Smoke Pollution in Samsun City Center and Investigation of Other Factors Affecting This Pollution. Niğde J. Sci. 1996, 1, 53–61. [Google Scholar]
- Dursun, S. The Effect of Topographical Structure Around Samsun Province on Air Pollution of the Region. In Proceedings of the 20th Geology Symposium, Konya, Turkey; 1997. [Google Scholar]
- Air Quality Centers. Available online: https://havakalitesi.ibb.gov.tr/Icerik/hakkimizda/olcum-cihazlar (accessed on 11 February 2023).
- Air Quality Centers. Available online: https://havakalitesi.ibb.gov.tr/Icerik/hakkimizda/olcum-yontemleri (accessed on 11 February 2023).
- Gerboles, M.; Spinelle, L.; Borowiak, A. Measuring Air Pollution with Low-Cost Sensors; JRC107461; European Commission: Brussels, Belgium. Available online: https://ec.europa.eu/environment/air/pdf/Brochure%20lower-cost%20sensors.pdf (accessed on 29 September 2021).
- Zaręba, M.; Danek, T. Analysis of Air Pollution Migration during COVID-19 Lockdown in Krakow, Poland. Special Issue on Air Quality in a Changed World: Regional, Ambient, and Indoor Air Concentrations from the COVID to Post-COVID Era (III). Aerosol Air Qual. Res. 2021, 22, 210275. [Google Scholar] [CrossRef]
- Maguire, D. ArcGIS: General Purpose GIS Software System. In Encyclopedia of GIS; Shekhar, S., Xiong, H., Eds.; Springer: Boston, MA, USA, 2008. [Google Scholar] [CrossRef]
- Tural, S. Acquisition, Analysis and Mapping of the Meteorological Data. Master’s Thesis, Ankara University, Ankara, Turkey, 2011. [Google Scholar]
- Ray, S.; Kim, K.H. The pollution status of sulfur dioxide in majör urban areas of Korea between 1989 and 2010. Atmos. Res. 2014, 147–148, 101–110. [Google Scholar] [CrossRef]
- Loizeau, M.; Buteau, S.; Chaix, B.; McElroy, S.; Counil, E.; Benmarhnia, T. Does the air pollution model influence the evidence of socio-economic disparities in exposure and susceptibility? Environ. Res. 2018, 167, 650–661. [Google Scholar] [CrossRef] [PubMed]
- Esri-ArcGIS. Available online: https://www.esri.com/en-us/home (accessed on 9 February 2023).
- Shukla, K.; Kumar, P.; Mann, G.S.; Khare, M. Mapping spatial distribution of particulate matter using kriging and inverse distance weighting at supersites of megacity Delh. Sustain. Cities Soc. 2019, 54, 101997. [Google Scholar] [CrossRef]
- Akyurek, O.; Arslan, O.; Karademir, A. Spatial Analysis of Air Pollution Parameters SO2 and PM10 wıth GIS: A Case Study of Kocaeli Province. In Proceedings of the Geographic Information Systems Congress, Ankara, Turkey, 5–8 November 2013. [Google Scholar]
- Konya Metropolitan Municipality. Available online: https://www.konya.bel.tr/haberayrinti.php?haberID=7751 (accessed on 5 January 2023).
- Danek, T.; Weglinska, E.; Zaręba, M. The influence of meteorological factors and terrain on air pollution concentration and migration: A geostatistical case study from Krakow, Poland. Sci Rep. 2022, 12, 11050. [Google Scholar] [CrossRef]
Figure 1.
The map of Konya Province.

Figure 2.
Locations of study area and Konya Province air quality monitoring stations.

Figure 3.
Monthly Values of PM10 (2019–2020).

Figure 4.
PM10 pollution maps of the adjacent areas of Konya province for the years 2019–2020.

Figure 5.
PM10 time series and min., max., mean, and std values of Karatay station (2019–2020).

Figure 6.
PM10 time series and min., max., mean, and std values of Meram station (2019–2020).

Figure 7.
PM10 time series and min., max., mean, and std values of Selcuklu station (2019–2020).

Figure 8.
PM10 time series and min., max., mean, and std values of Karkent station (2019–2020).

Figure 9.
Monthly values of SO2 (2019–2020).

Figure 10.
SO2 pollution maps of the adjacent areas of Konya province for the years 2019–2020.

Figure 11.
Monthly values of CO (2019–2020).

Figure 12.
CO pollution maps of the adjacent areas of Konya province for the years 2019–2020.

Figure 13.
Monthly Values of NO2 (2019–2020).

Figure 14.
NO2 pollution maps of the adjacent areas of Konya province for the years 2019–2020.

Figure 15.
Monthly values of O3 (2019–2020).

Figure 16.
O3 pollution maps of the adjacent areas of Konya province for the years 2019–2020.


Table 1.
Limit values of some pollutants [2].
Table 1.
Limit values of some pollutants [2].
| Air Quality Standards | SO2 µg/m3 | NO2 µg/m3 | CO µg/m3 | O3 µg/m3 | PM10 µg/m3 |
|---|---|---|---|---|---|
| 1 h Average | 1 h Average | 8 h Average | 8 h Average | 24 h Average | |
| national legal limit value | 410 | 270 | 10,000 | 120 | 70 |
| EU member states limit value | 350 | 200 | 10,000 | 120 | 50 |
Table 2.
Air Quality Index and concentration levels [2].
Table 2.
Air Quality Index and concentration levels [2].
| Air Quality Index | SO2 µg/m3 | NO2 µg/m3 | CO µg/m3 | O3 µg/m3 | PM10 µg/m3 | |
|---|---|---|---|---|---|---|
| 1 h Average | 1 h Average | 8 h Average | 8 h Average | 24 h Average | ||
| Good | 0–50 | 0–100 | 0–100 | 0.5–500 | 0–120 | 0–50 |
| Satisfactory | 51–100 | 101–250 | 101–200 | 5500–10,000 | 121–160 | 51–100 |
| Moderate | 101–150 | 251–500 | 201–500 | 10,001–16,000 | 161–180 | 101–260 |
| Poor | 151–200 | 501–850 | 501–1000 | 16,001–24,000 | 181–240 | 261–400 |
| Very poor | 201–300 | 851–1100 | 1001–2000 | 24,001–32,000 | 241–700 | 401–520 |
| Severe | 301–500 | >1101 | >2001 | >32,001 | >701 | >521 |
Disclaimer/Publisher’s Note: The statements, opinions and data contained in all publications are solely those of the individual author(s) and contributor(s) and not of MDPI and/or the editor(s). MDPI and/or the editor(s) disclaim responsibility for any injury to people or property resulting from any ideas, methods, instructions or products referred to in the content. |
© 2023 by the authors. Licensee MDPI, Basel, Switzerland. This article is an open access article distributed under the terms and conditions of the Creative Commons Attribution (CC BY) license (https://creativecommons.org/licenses/by/4.0/).
Share and Cite
MDPI and ACS Style
Bugdayci, I.; Ugurlu, O.; Kunt, F. Spatial Analysis of SO2, PM10, CO, NO2, and O3 Pollutants: The Case of Konya Province, Turkey. Atmosphere 2023, 14, 462. https://doi.org/10.3390/atmos14030462
AMA Style
Bugdayci I, Ugurlu O, Kunt F. Spatial Analysis of SO2, PM10, CO, NO2, and O3 Pollutants: The Case of Konya Province, Turkey. Atmosphere. 2023; 14(3):462. https://doi.org/10.3390/atmos14030462
Chicago/Turabian StyleBugdayci, Ilkay, Oguz Ugurlu, and Fatma Kunt. 2023. "Spatial Analysis of SO2, PM10, CO, NO2, and O3 Pollutants: The Case of Konya Province, Turkey" Atmosphere 14, no. 3: 462. https://doi.org/10.3390/atmos14030462
Note that from the first issue of 2016, this journal uses article numbers instead of page numbers. See further details here.