Article

Effect of Cucumber Continuous Monocropping on Traditional Chinese Medicine Residue through Analysis of Physicochemical Characteristics and Microbial Diversity

1
Department of Life Sciences, Changzhi University, Changzhi 046011, China
2
Zhejiang Province Key Laboratory of Plant Secondary Metabolism and Regulation, College of Life Sciences and Medicine, Zhejiang Sci-Tech University, Hangzhou 310018, China
*
Authors to whom correspondence should be addressed.
These authors contributed equally to this work.
Agronomy 2024, 14(4), 709; https://doi.org/10.3390/agronomy14040709
Submission received: 26 February 2024 / Revised: 25 March 2024 / Accepted: 27 March 2024 / Published: 28 March 2024
(This article belongs to the Special Issue Rhizosphere Microorganisms—Volume II)

Abstract

:
The use of traditional Chinese medicine (TCM) residue as a crop culture substrate has unique advantages in alleviating the obstacles associated with continuous monocropping, such as increasing production, improving quality and alleviating pests and diseases. However, the effect of TCM residue application on substrates in continuous monocropping practices has not been determined. In this study, the cucumber variety “Jinyou No. 10” was used as the material, and fermented TCM residue, vermiculite and perlite were used as organic substrates (3:1:1). The cucumbers were cultivated on substrates for different durations of continuous monocropping, which were the first cropping cycle (A1), second cropping cycle (A2), third cropping cycle (A3) and fourth cropping cycle (A4). The control (A0) was the substrate sample without any crop planted in it. After the cucumbers were harvested, substrate samples (areas around the cucumber roots) were collected. The physiochemical properties of the cultivated substrates were determined, and the microbial community structures were analyzed through 16S rRNA and ITS sequencing. The physiochemical indices of the substrates with different durations of continuous monocropping (A1–A4) were significantly different than those of the control (A0) substrate. Moreover, the continuous cropping of cucumber had greater effects on fungal communities than on bacterial communities. Bacterial community structure analysis revealed a greater proportion of important bacterial taxa (Proteobacteria, Chloroflexi, and Nitrospirae) in the continuous monocropping substrates than in the A0 substrate. For the fungal community, Ascomycota accounted for the largest percentage of the fungal community in all the samples. The diversity of the microbial community was found to be influenced primarily by electrical conductivity, organic matter content, pH and total potassium content according to the correlation analysis of physicochemical properties and relative abundance of the microbial community. Our study would provide a basis for addressing persistent challenges in continuous cropping and for obtaining the utmost benefit from using TCM organic residue waste.

1. Introduction

Soilless plant cultures, such as those of Plagiomnium acutum [1], cucumber [2], slippery mushroom [3], cherry tomato [4], and lettuce [5], are widely applied in vegetable production. The advantages of soilless plant culture include not only increasing yield but also satisfying specific nutrient requirements [6,7]. In organic substrate culture systems, crops can grow normally for weeks or even years [3]. Organic substrates can be affected by the mineralization of the substrate itself, the metabolism of microorganisms in the substrate, the mechanical interaction between the roots of cultivated crops and the substrate, and the activity of animals in the substrate during cultivation, resulting in constant changes in their physicochemical properties [8,9]. These changes are highly important for the regulation of water and nutrients in the substrate. Therefore, the substrate stability of physicochemical properties during crop cultivation has important impacts on crop productivity and quality [10,11]. The screening of new microorganisms from the root microbiome of substrate-cultivated crops can provide us with strain resources for the development of fertilizer or mycorrhizal products adapted to new cultivation techniques [12].
Cucumber is an important vegetable crop that is widely cultivated and has great economic value [13]. With the improvement of living standards, the demand for off-season vegetables has increased substantially [14]. However, continuous monocropping can cause soil degradation, yield reduction and increased disease occurrence [15,16]. Hence, an increasing number of farmers are opting to cultivate in soilless substrates. This method can effectively reduce the occurrence of root diseases, while simultaneously stimulating the growth of cucumber roots, and improving fertilizer efficiency, which ultimately results in increased cucumber yields [9].
Accordingly, Zhou et al. [9] studied the root microbiome of cucumber plants using three different cultivation substrates, namely, greenhouse soil and two artificial plant cultivation substrates. The authors found that the root bacterial communities of these three samples were significantly different in abundance, and the beneficial bacteria that promote growth were significantly enriched in the two artificial plant cultivation substrates. Moreover, Chen et al. [17] discussed the diversity of the rhizosphere microbial community of cucumber plants after continuous cropping in an agricultural greenhouse. The authors revealed that the available nutrients decreased with continuous cropping, and the abundance of bacterial genera associated with nutrient cycling decreased as well. Chen et al. [18] discovered that crop residue mixed into soil can mitigate soil deterioration resulting from cucumber continuous cropping. The presence of beneficial bacteria in the soil increased, while the population of harmful pathogens decreased with the incorporation of crop residues. Additionally, garlic/cucumber crop rotation reportedly alleviates this obstacle caused by continuous cropping to a certain extent [19].
Currently, agricultural waste, such as corn stalks and sawdust [3], spent mushroom substrates [20,21], chitin [22], and biochar and earthworm casts [23], can be added to cultivation substrates, which can result in low-cost and high-yield alternative culture substrates for production. The consumption of traditional Chinese medicine (TCM) in China is high, and the amount of TCM residue produced can reach tens of millions of tons after its manufacture and usage. On the one hand, the waste treatment cost of TCM residue is high, and TCM residue easily causes environmental pollution [24]. On the other hand, TCM residue contains abundant nutrients such as nitrogen, phosphorus, and potassium, as well as organic substances such as cellulose, hemicellulose, lignin, protein, and nucleic acid. The use of TCM as a crop culture substrate has unique advantages, such as improving quality and reducing pests and diseases [25]. Accordingly, treatment with Sophora flavescens Radix residue showed superior results restoring soil health and promoting the yield and quality of Salvia miltiorrhiza than chemical fertilizers [26]. TCM residues can enhance soil physicochemical properties, recruit beneficial bacteria, reduce the relative abundance of the pathogen Fusarium, and restore the microbial community balance to improve the health of deteriorated soil.
Compound kushen injection (CKI, also known as Yanshu injection) has been used to treat cancer for many years in China. The two main medicinal herbs used in CKI are Sophora flavescens and Rhizoma Smilacis glabrae [27]. The main active compounds include alkaloids and flavonoids [28,29,30]. In this study, we used TCM residues from CKI production to explore the changes in TCM residue-amended substrates after continuous monocropping of cucumber plants. We conducted a comprehensive analysis of the changes in organic substrates (consisting of fermented TCM residue, vermiculite and perlite) after continuous monocropping of cucumber plants. The physicochemical indices and microbial 16S rRNA and ITS sequencing results from the substrates after four cycles of cucumber planting were also evaluated. Subsequently, a range of bioinformatics analyses were performed to explore these changes. This study provides theoretical support for overcoming obstacles in continuous cropping and is important for the sustainable development of the environment, energy, and comprehensive utilization of the herb residues generated in the TCM industry.

2. Materials and Methods

2.1. Sample Collection

The cucumber variety “Jinyou No. 10” was obtained from the Cucumber Research Institute of Tianjin Kerun Agricultural Technology Co., Ltd (Tianjin, China). TCM residues, specifically residue from compound kushen injection production, were obtained from Shanxi Zhendong Pharmaceutical Company (Changzhi, Shanxi, China). The experiments were conducted in the experimental greenhouse of Changzhi University (Changzhi, Shanxi, China) from March 2020 to December 2021. First, TCM residues that had been fermented and fully rotted were piled as organic substrates, and the cucumber plants were cultivated four times by continuous monocropping in cultivation tanks. The organic substrate was mixed with fermented TCM residue, vermiculite and perlite (the volume ratio was 3:1:1). The cultivation tanks were 10 m long, 0.6 m wide and 0.4 m high inside and customized into two rows. Cucumbers were planted in cultivation tanks with row spacing of 40 cm and plant spacing of 30 cm, and 50 cucumber plants were planted in each cropping cycle. The substrate was mixed well after each cropping cycle and kept at a depth of 30 cm. There was no fertilizer application; only water irrigation was applied throughout the whole experiment. The whole experimental period was 30 months. The four cycles of continuous cropping were conducted as follows: the first cropping cycle of cucumber plants (A1) was planted from September 2020 to January 2021; the second cropping cycle (A2) was planted from March 2021 to July 2021; the third cropping cycle (A3) was planted from September 2021 to December 2021; and the fourth cropping cycle (A4) was planted from March 2022 to July 2022. The control (A0) consisted of a substrate sample that was proportionate with the TCM substrate without any crops planted in it.
The substrate samples (areas around the cucumber roots) of A1, A2, A3 and A4 were collected after cucumber harvest. Each sample was collected randomly from 5 individuals. A five-point sampling method was used, and the substrates were collected from within the range of 0–15 cm around the root system. After sampling, plant and animal residues were removed. For each treatment, there were 3 biological replicates. These substrate samples were subdivided into two portions, one used for characterizing physicochemical indices and the other for conducting 16S rRNA and ITS sequencing. The samples were promptly frozen using liquid nitrogen and stored at a temperature of −80 °C to facilitate future utilization.

2.2. Physicochemical Indices of the Substrates

The assays were conducted following the methods from Chen et al. [18] and included measuring the substrate electrical conductivity (EC), pH, organic matter (OM) content, total nitrogen (TN), total phosphorus (TP) and total potassium (TK) contents. Briefly, the EC and pH of the substrates were determined by taking a representative 1 g sample, mixing it with deionized water at a 1:2 ratio, stirring it and then leaving it standing to obtain a clarified supernatant. The EC was assessed utilizing an EC meter (HI993310, Hanna Instruments, Shanghai, China), while the pH of the substrate samples was determined using a pH meter (HI99121, Hanna Instruments, Shanghai, China). The OM content was determined by the potassium dichromate method [31]. The TN content was measured via sulfuric acid-hydrogen peroxide digestion and the so-dium salicylate method [32]. The determination of TP content was determined by sulfuric acid-hydrogen peroxide-molybdenum-antimony resistance spectrophotometry [33]. The TK content in the substrate samples was determined through flame photometry after digestion with sulfuric acid (analytical grade; Sigma-Aldrich Corporation, Shanghai, China) and hydrogen peroxide (analytical grade; Sigma-Aldrich Corporation, Shanghai, China) [18]. Three biological replicates of substrate samples were taken at each time point.

2.3. DNA Extraction, PCR Amplification and Sequencing

Total microbiota DNA was extracted from the substrate samples using an OMEGA Soil DNA Kit (M563502 Omega Bio Tek, Norcross, GA, USA) following the manufacturer’s instructions. The purity of the obtained DNA was assessed through agarose gel electrophoresis (1%) and a NanoDrop spectrophotometer (Thermo Fisher Scientific, Waltham, MA, USA).
Amplification of the V3-V4 hypervariable region in the bacterial 16S rRNA gene was performed using the primers listed in Table S1 [17,34]. For each substrate sample, sample-specific 7-bp barcodes were incorporated into the primers (provided by Shanghai Personal Biotechnology Company, Shanghai, China) for multiplex sequencing. Thermal cycling consisted of initial denaturation at 98 °C for 5 min; 25 cycles of denaturation at 98 °C for 30 s, annealing at 53 °C for 30 s, and extension at 72 °C for 45 s; and a final extension of 5 min at 72 °C.
The V1 region of fungal ITS gene was amplified using the primers specified in Table S1 [17,34]. The 5′ ends of both primers were tagged and provided by Shanghai Personal Biotechnology Company, China. The PCR procedure was carried out as described for bacteria.
The PCR mixture contained 5 μL of buffer (5×), 0.25 μL of Fast Pfu DNA Polymerase (5 U/μL), 2 μL (2.5 mM) of dNTPs, 1 μL (10 μM) of each forward and reverse primer, 2 μL of DNA template (20 ng/μL), and 8.75 μL of ddH2O.
PCR amplicons were purified with Vazyme VAHTSTM DNA Clean Beads (Vazyme, Nanjing, China) and quantified using the Quant-iT PicoGreen dsDNA Assay Kit (Invitrogen, Carlsbad, CA, USA). After the individual quantification steps, amplicons were pooled in equal amounts, and paired-end 2 × 250 bp sequencing was performed using the Illumina NovaSeq platform with a NovaSeq 6000 SP Reagent Kit (500 cycles) at Shanghai Personal Biotechnology Co., Ltd. (Shanghai, China).

2.4. Bioinformatics and Statistical Analysis

Relevant microbiome bioinformatics analysis was conducted using QIIME2 [35], following minor adjustments based on official tutorials (https://docs.qiime2.org/2019.4/tutorials/, accessed on 24 April 2022). Quality control was conducted using the cutadapt plugin and DADA2 plugin. Based on the QIIME microbiota analysis, the soil microbiota composition was assessed via 16S rRNA and ITS sequencing. Taxonomy was assigned to ASVs using the classify-sklearn naive Bayes taxonomy classifier in the feature-classifier plugin [36]. For the annotation of bacterial 16S rRNA and ITS regions, we used the Greengenes (13.8) [37] and UNITE (8.0) [38] databases, respectively, to assign taxonomic information. We used the QIIME feature-table rarefy function for normalizing the data to determine differences in sequencing depth, and the leveling depth was set to 95% of the minimum sample sequence size. We conducted a comparative analysis of the bacterial and fungal proportions and percentages across various taxonomic levels (domain, kingdom, phylum, class, order, family and genus) within each sample to further investigate variations in the composition of the substrate microbiota.

2.5. Species Diversity Analysis

The α diversity indices, including the Chao1 [39], Shannon [40], observed species, Simpson [41], Pielou’s evenness [42], and Goods’ coverage [43] indices, were calculated using QIIME2 (2019.4) and visualized as box plots to compare the species richness and evenness of bacteria and fungi. Using R (version 3.6) and QIIME2 (2019.4) software, β diversity analysis was performed using the Bray-Curtis metric to investigate changes in microbial community structure between samples, which can be visualized by principal coordinate analysis (PCoA). The unweighted pair-group method with arithmetic means (UPGMA) was used for hierarchical clustering of samples according to Euclidean distance based on species composition profiles at the genus level. To compare the memberships and structures of communities among different samples, heatmaps were generated with the top 20 ASVs using Mothur (v.1.35.1) software.

2.6. Correlation Analysis between Physicochemical Properties and Microbial Communities

Based on the physicochemical parameters and the relative abundances of the bacterial and fungal communities, redundancy analysis (RDA) was conducted using Canoco 4.5 software.

2.7. Analysis of Key Microbiota

To identify key bacteria and fungi within different groups, we analyzed characteristic strains using the default parameters through linear discriminant analysis (LDA) effect size (LEfSe) [44]. The Kruskal-Wallis test was applied with a significance threshold of 0.05 for variance analysis. Similarly, the Wilcoxon rank sum test was conducted with a significance threshold of 0.05. Moreover, discriminating features were determined based on a logarithmic LDA score threshold of 3.0.

3. Results

3.1. The Physicochemical Properties Changed Due to Continuous Monocropping

The physicochemical properties of the substrate samples after cucumber harvest (as described in the Section 2) were measured, including EC, pH, OM, TC, TN, TP and TK contents. As shown in Table 1, with the exception of the pH for A3, the pH increased with cultivation duration and reached 8.12 in the substrate after the fourth cropping cycle (A4). The results show that the substrates were weakly alkaline. The EC first increased and then decreased with increasing cropping cycles, and the maximum and minimum values were 2.64 and 1.03, respectively, in the substrate after both the first (A1) and fourth (A4) cropping cycles. The OM and TN contents in the control substrate (A0) were the highest and decreased with the number of cropping cycles. However, the TP content increased in the substrate after the first cropping cycle (A1) but decreased in the other three substrates (A2, A3 and A4). The TK content in the substrates did not change among the different cultivation times. Moreover, the coefficients of variation (CVs) of pH, and OM, TN, TP and TK contents ranged from 3.75% to 15.15% (Table S2), which indicated that these indices had low sensitivity. The CV value of the EC was 32.23%, so it was considered a moderately sensitive index.

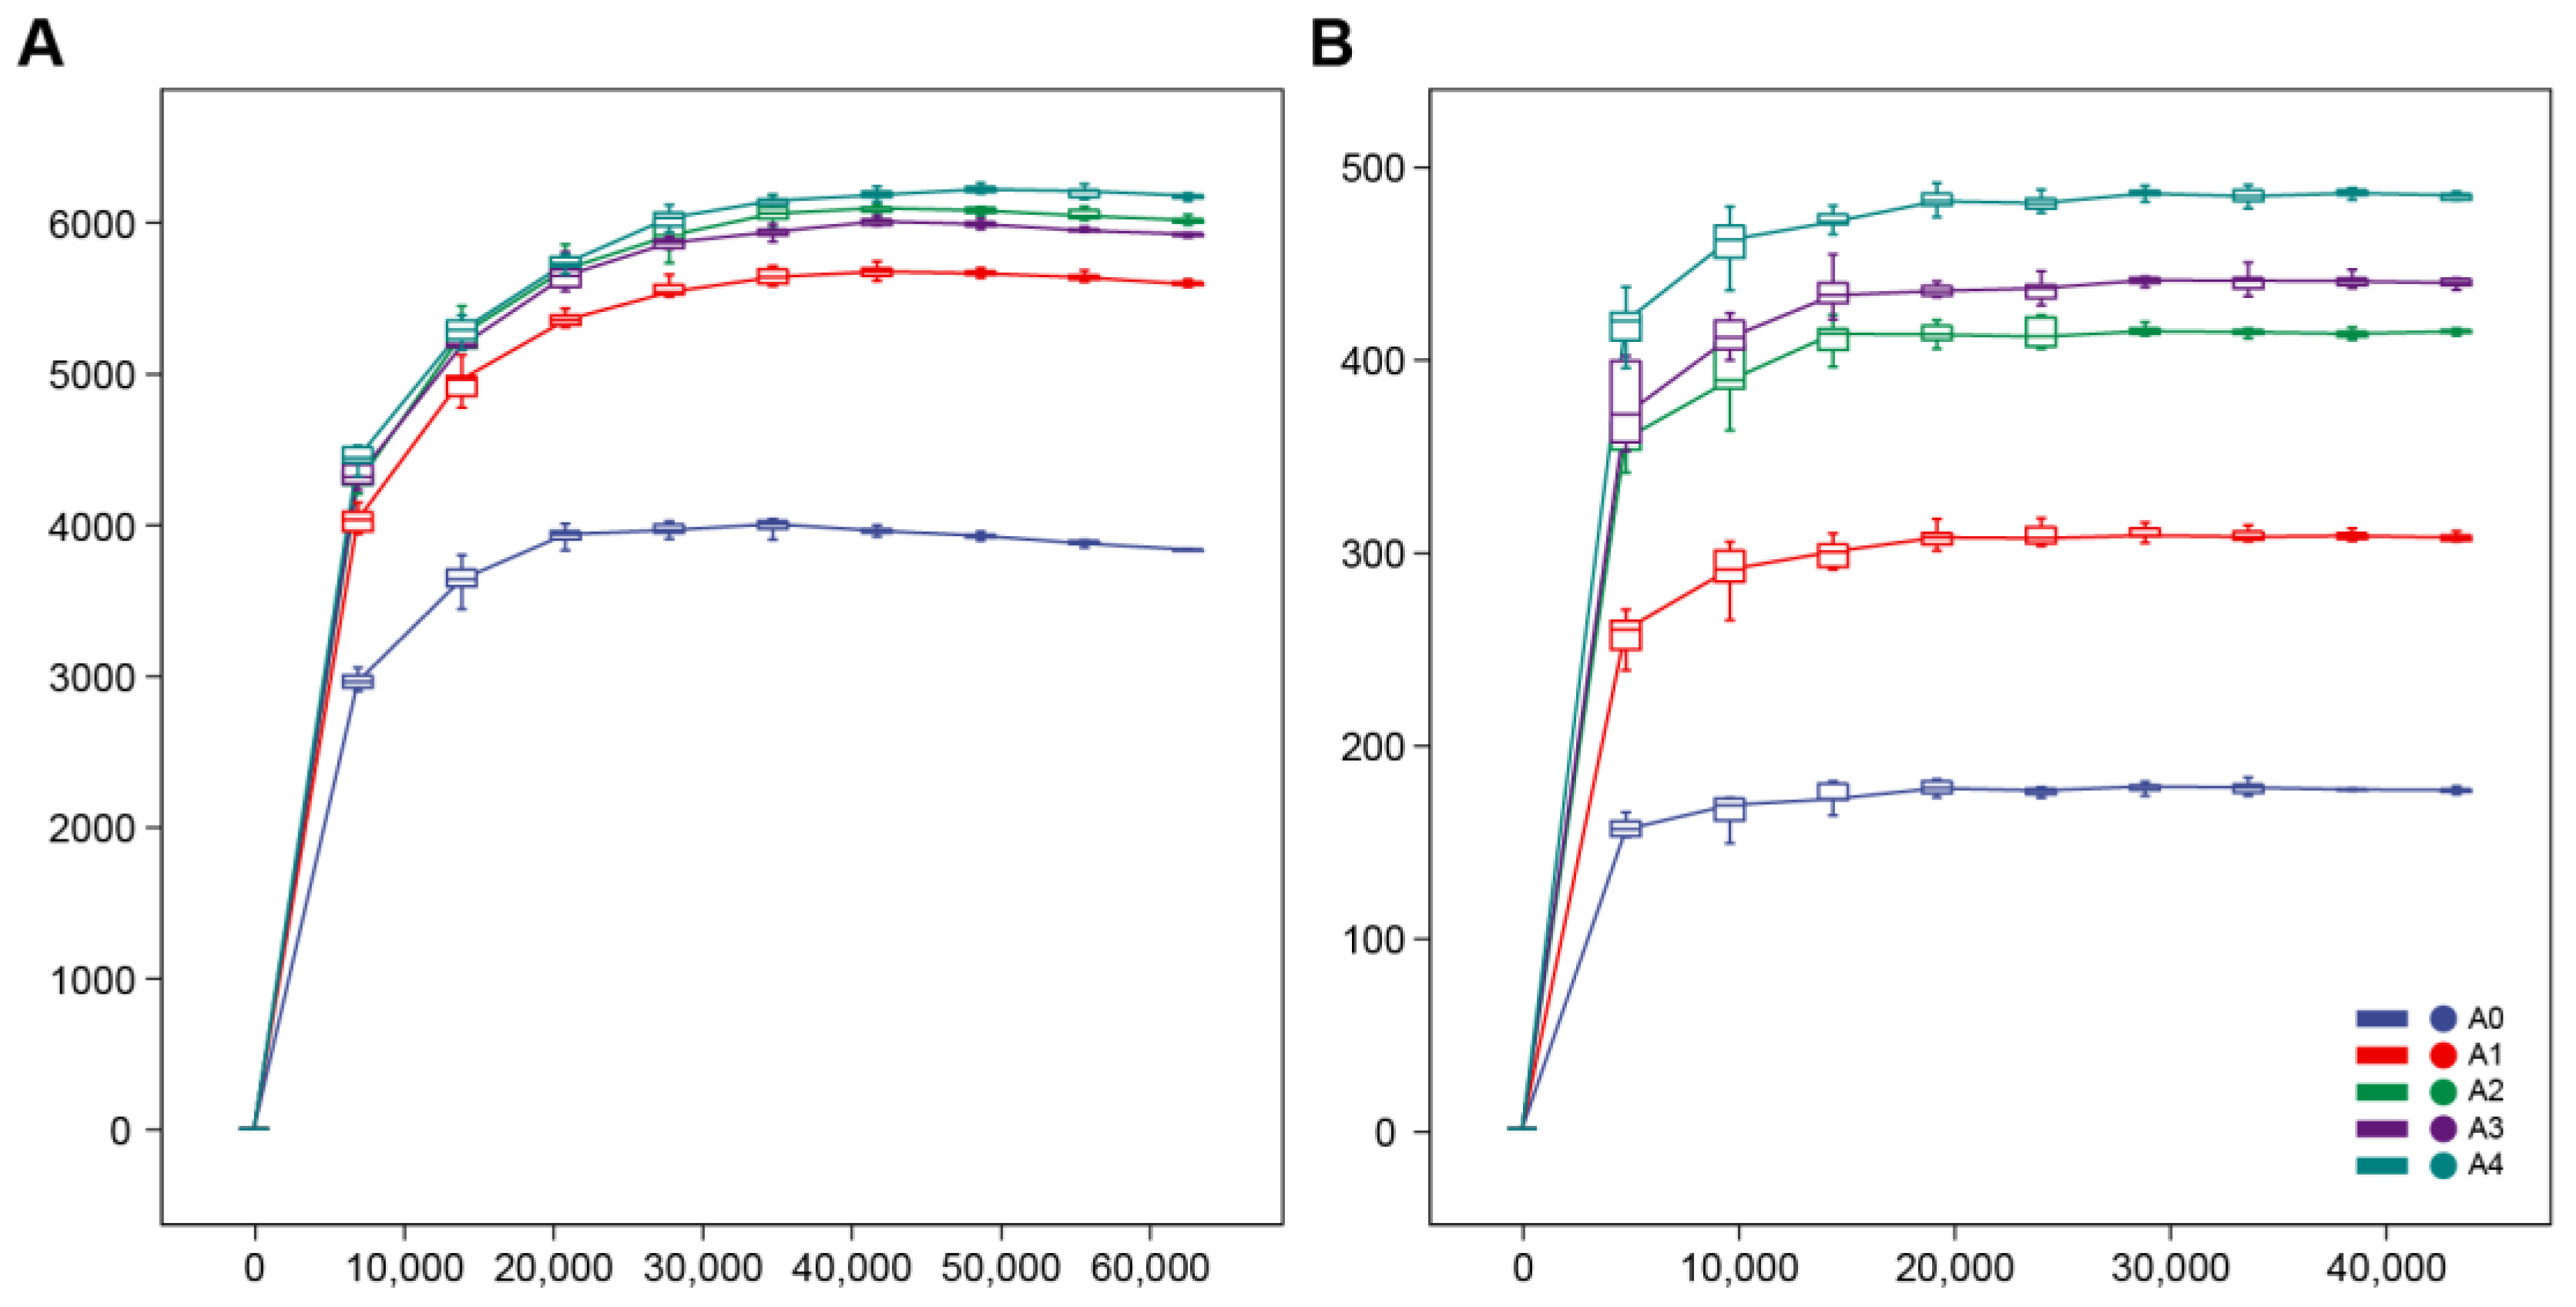
3.2. Assessment of the Sequencing Quality

To further understand the difference in the microbial community among substrates with TCM residues after different durations of continuous cucumber monocropping, we obtained 1,863,307 and 971,678 high-quality bacterial and fungal sequences, respectively, from the 15 substrate samples through high-throughput sequencing (Table S3). The sequence length of the bacterial library ranged from 50 to 442, while that of the fungal library ranged from 60 to 426. The rarefaction curve reflects the diversity of the samples to some extent. When the number of read lengths in the sequencing exceeded 30,000, a plateau was observed in the curves. This finding indicated that the sequencing results effectively captured the diversity present in the current substrate samples (Figure 1).

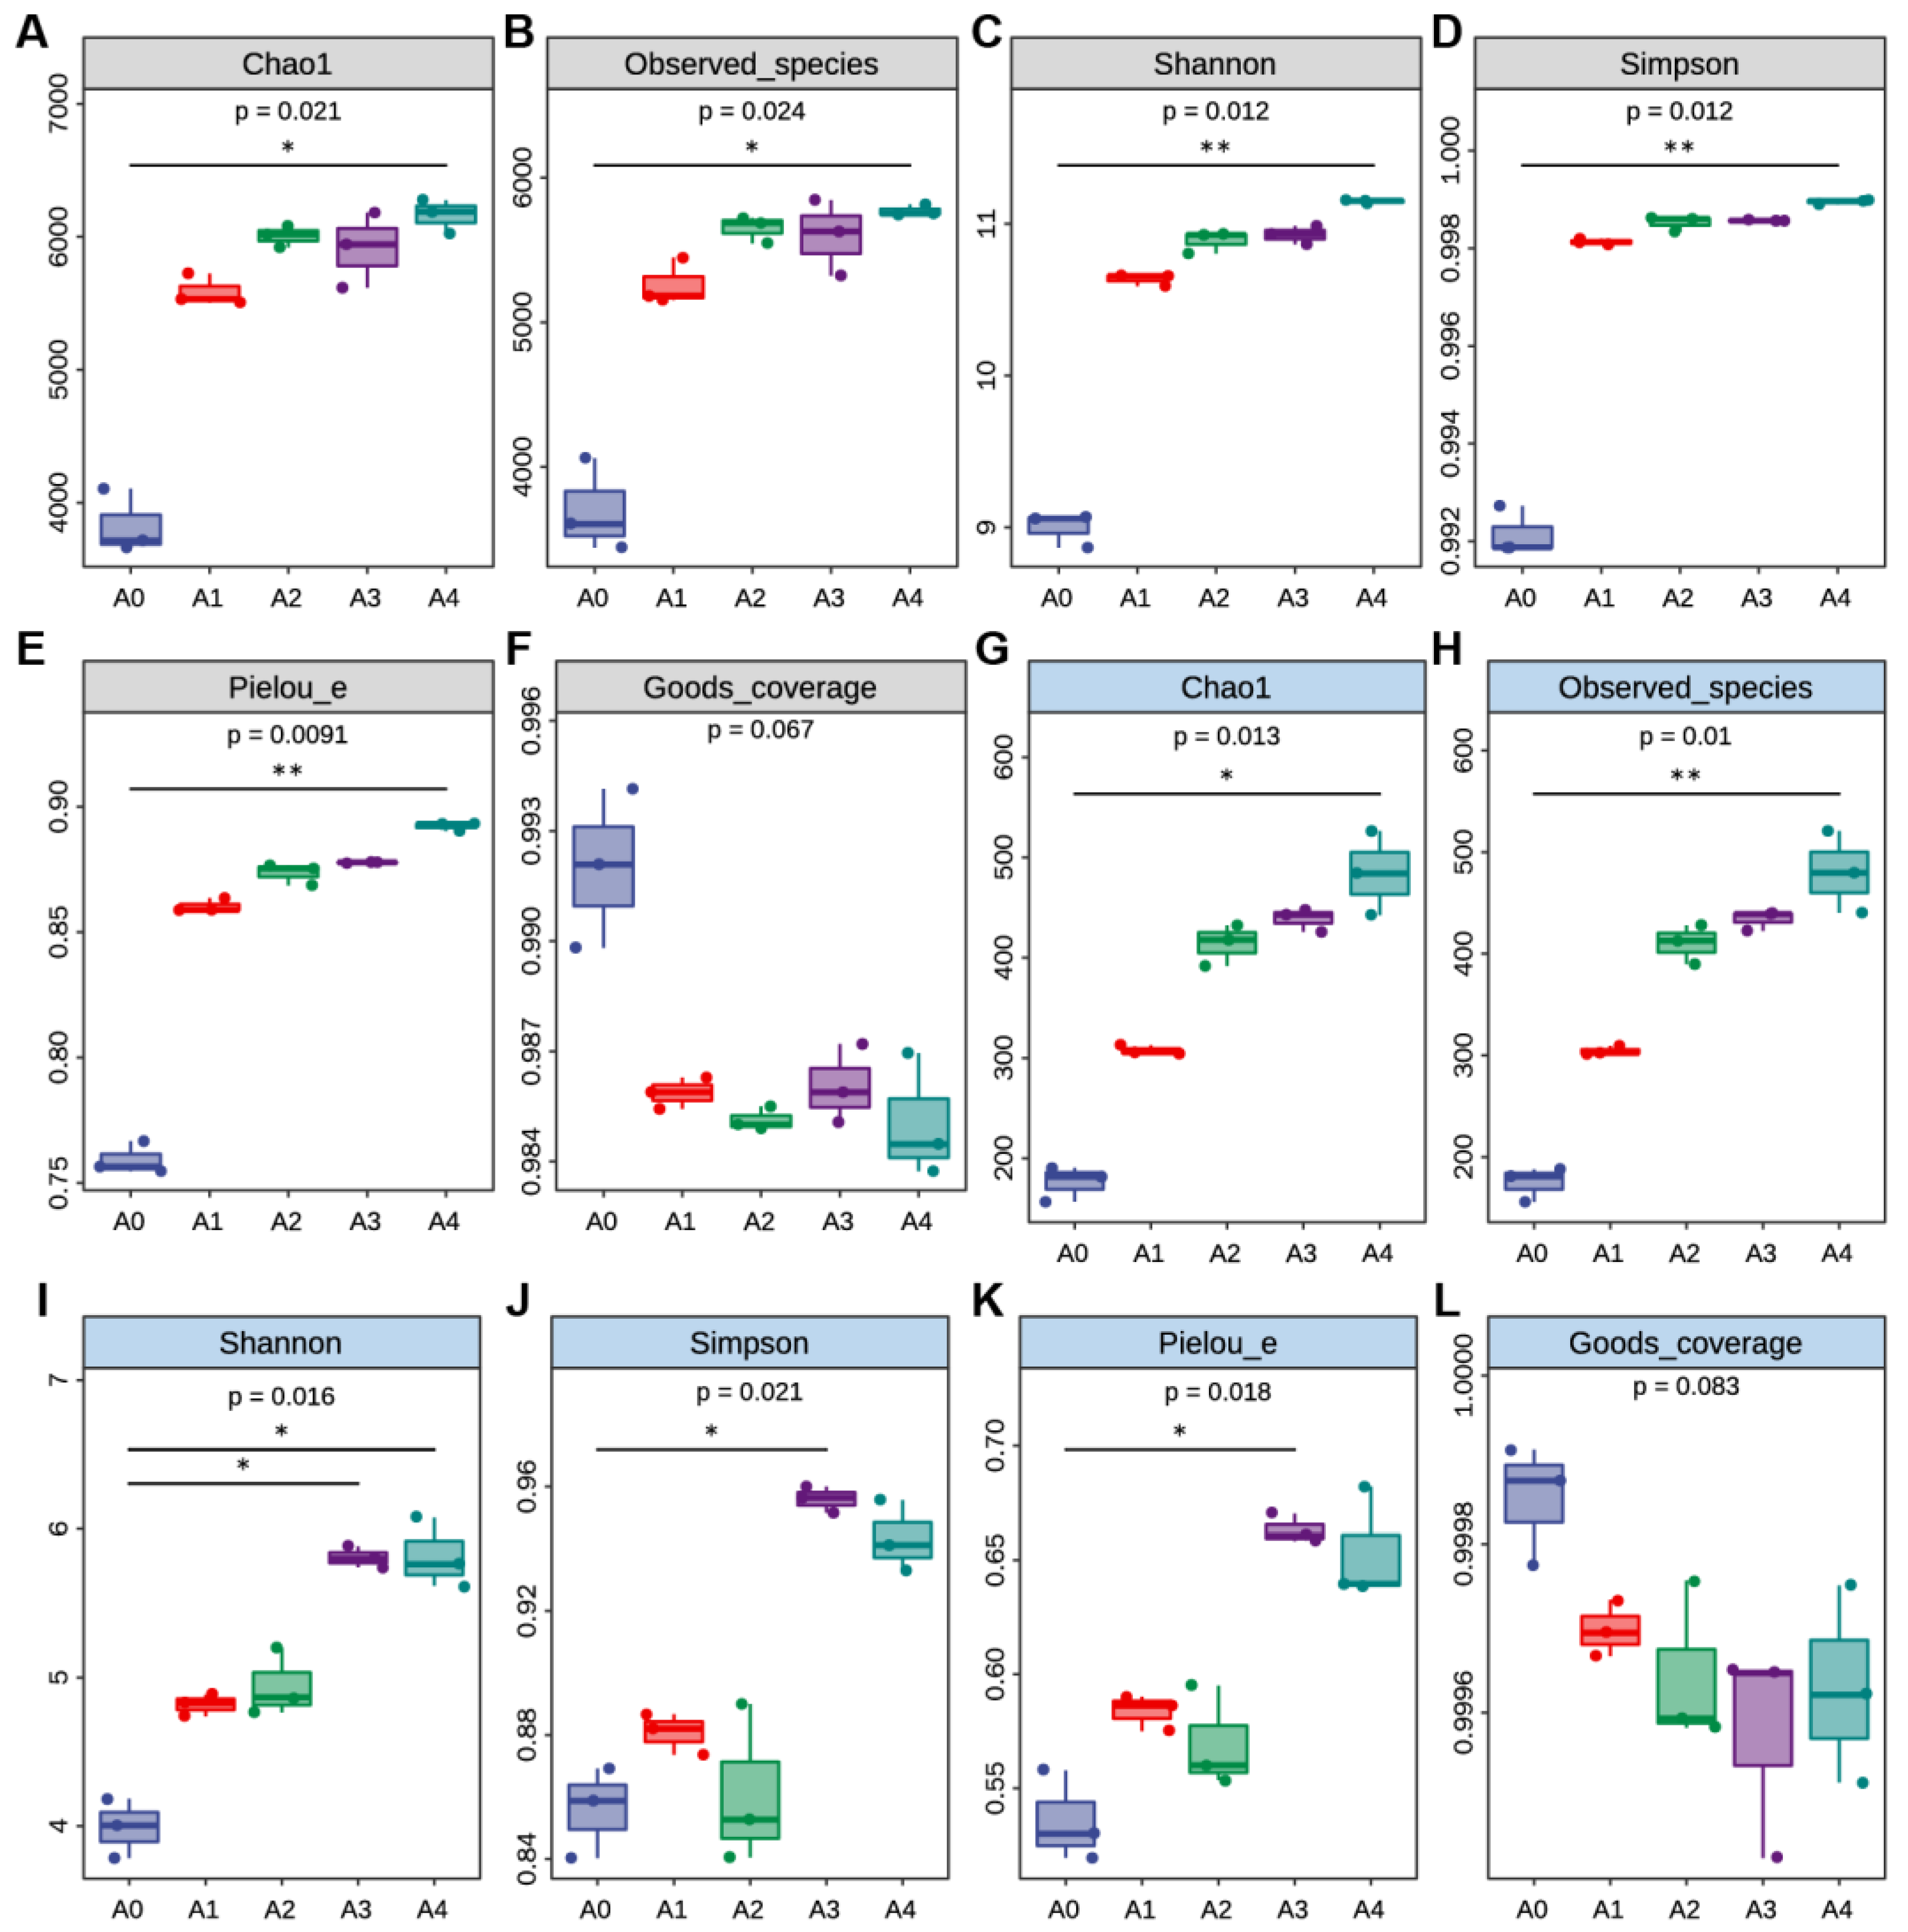
3.3. The Microbial α-Diversity Increased with Cucumber Continuous Cropping

The α- and β-diversity are indicators of the variation in microbial populations within and among treatments [45,46]. For the α diversity index, the Chao1 and observed species values represent the richness of the microbial communities, the Shannon and Simpson indices reflect their diversity, Pielou’s evenness index was used to characterize evenness, and Good’s coverage indices indicate community coverage. Here, we compared the α diversity of bacteria and fungi among the different treatments and found that the bacterial α diversity of the continuous cropping substrate samples (A1, A2, A3 and A4) exhibited greater community diversity and richness indices than that of the control (A0) (Figure 2A–F). The findings indicate an increase in bacterial community richness alone with cucumber continuous cropping, with the highest richness observed in A4. The trend of bacterial diversity aligned with that of richness.
Additionally, notable disparities were observed in fungal diversity, with the continuous cropping substrate samples exhibiting greater community diversity and richness indices than the control group (Figure 2G–L). A4 had significantly greater Chao1, Shannon, and observed species values than A0. Furthermore, notable variations in the Shannon coefficient were observed between A0 and A3. The highest indices were achieved during the fourth cropping cycle, aligning with the bacterial results.
Additionally, we computed the CV for the α diversity indices of bacteria and fungi (Table S2). The CVs of the Shannon, Chao1, observed species and Goods coverage indices of the bacterial community ranged from 0.3% to 17.42%, and these indices were low sensitivity indices. For the fungal community, the CV of the Shannon index was 15.12%, and that of the Good’s coverage was 0.013%. Although the percentages for Chao1 and observed species were 33.92% and 33.91%, respectively, it can be concluded that these indices exhibited a moderate level of sensitivity in assessing the fungal community.

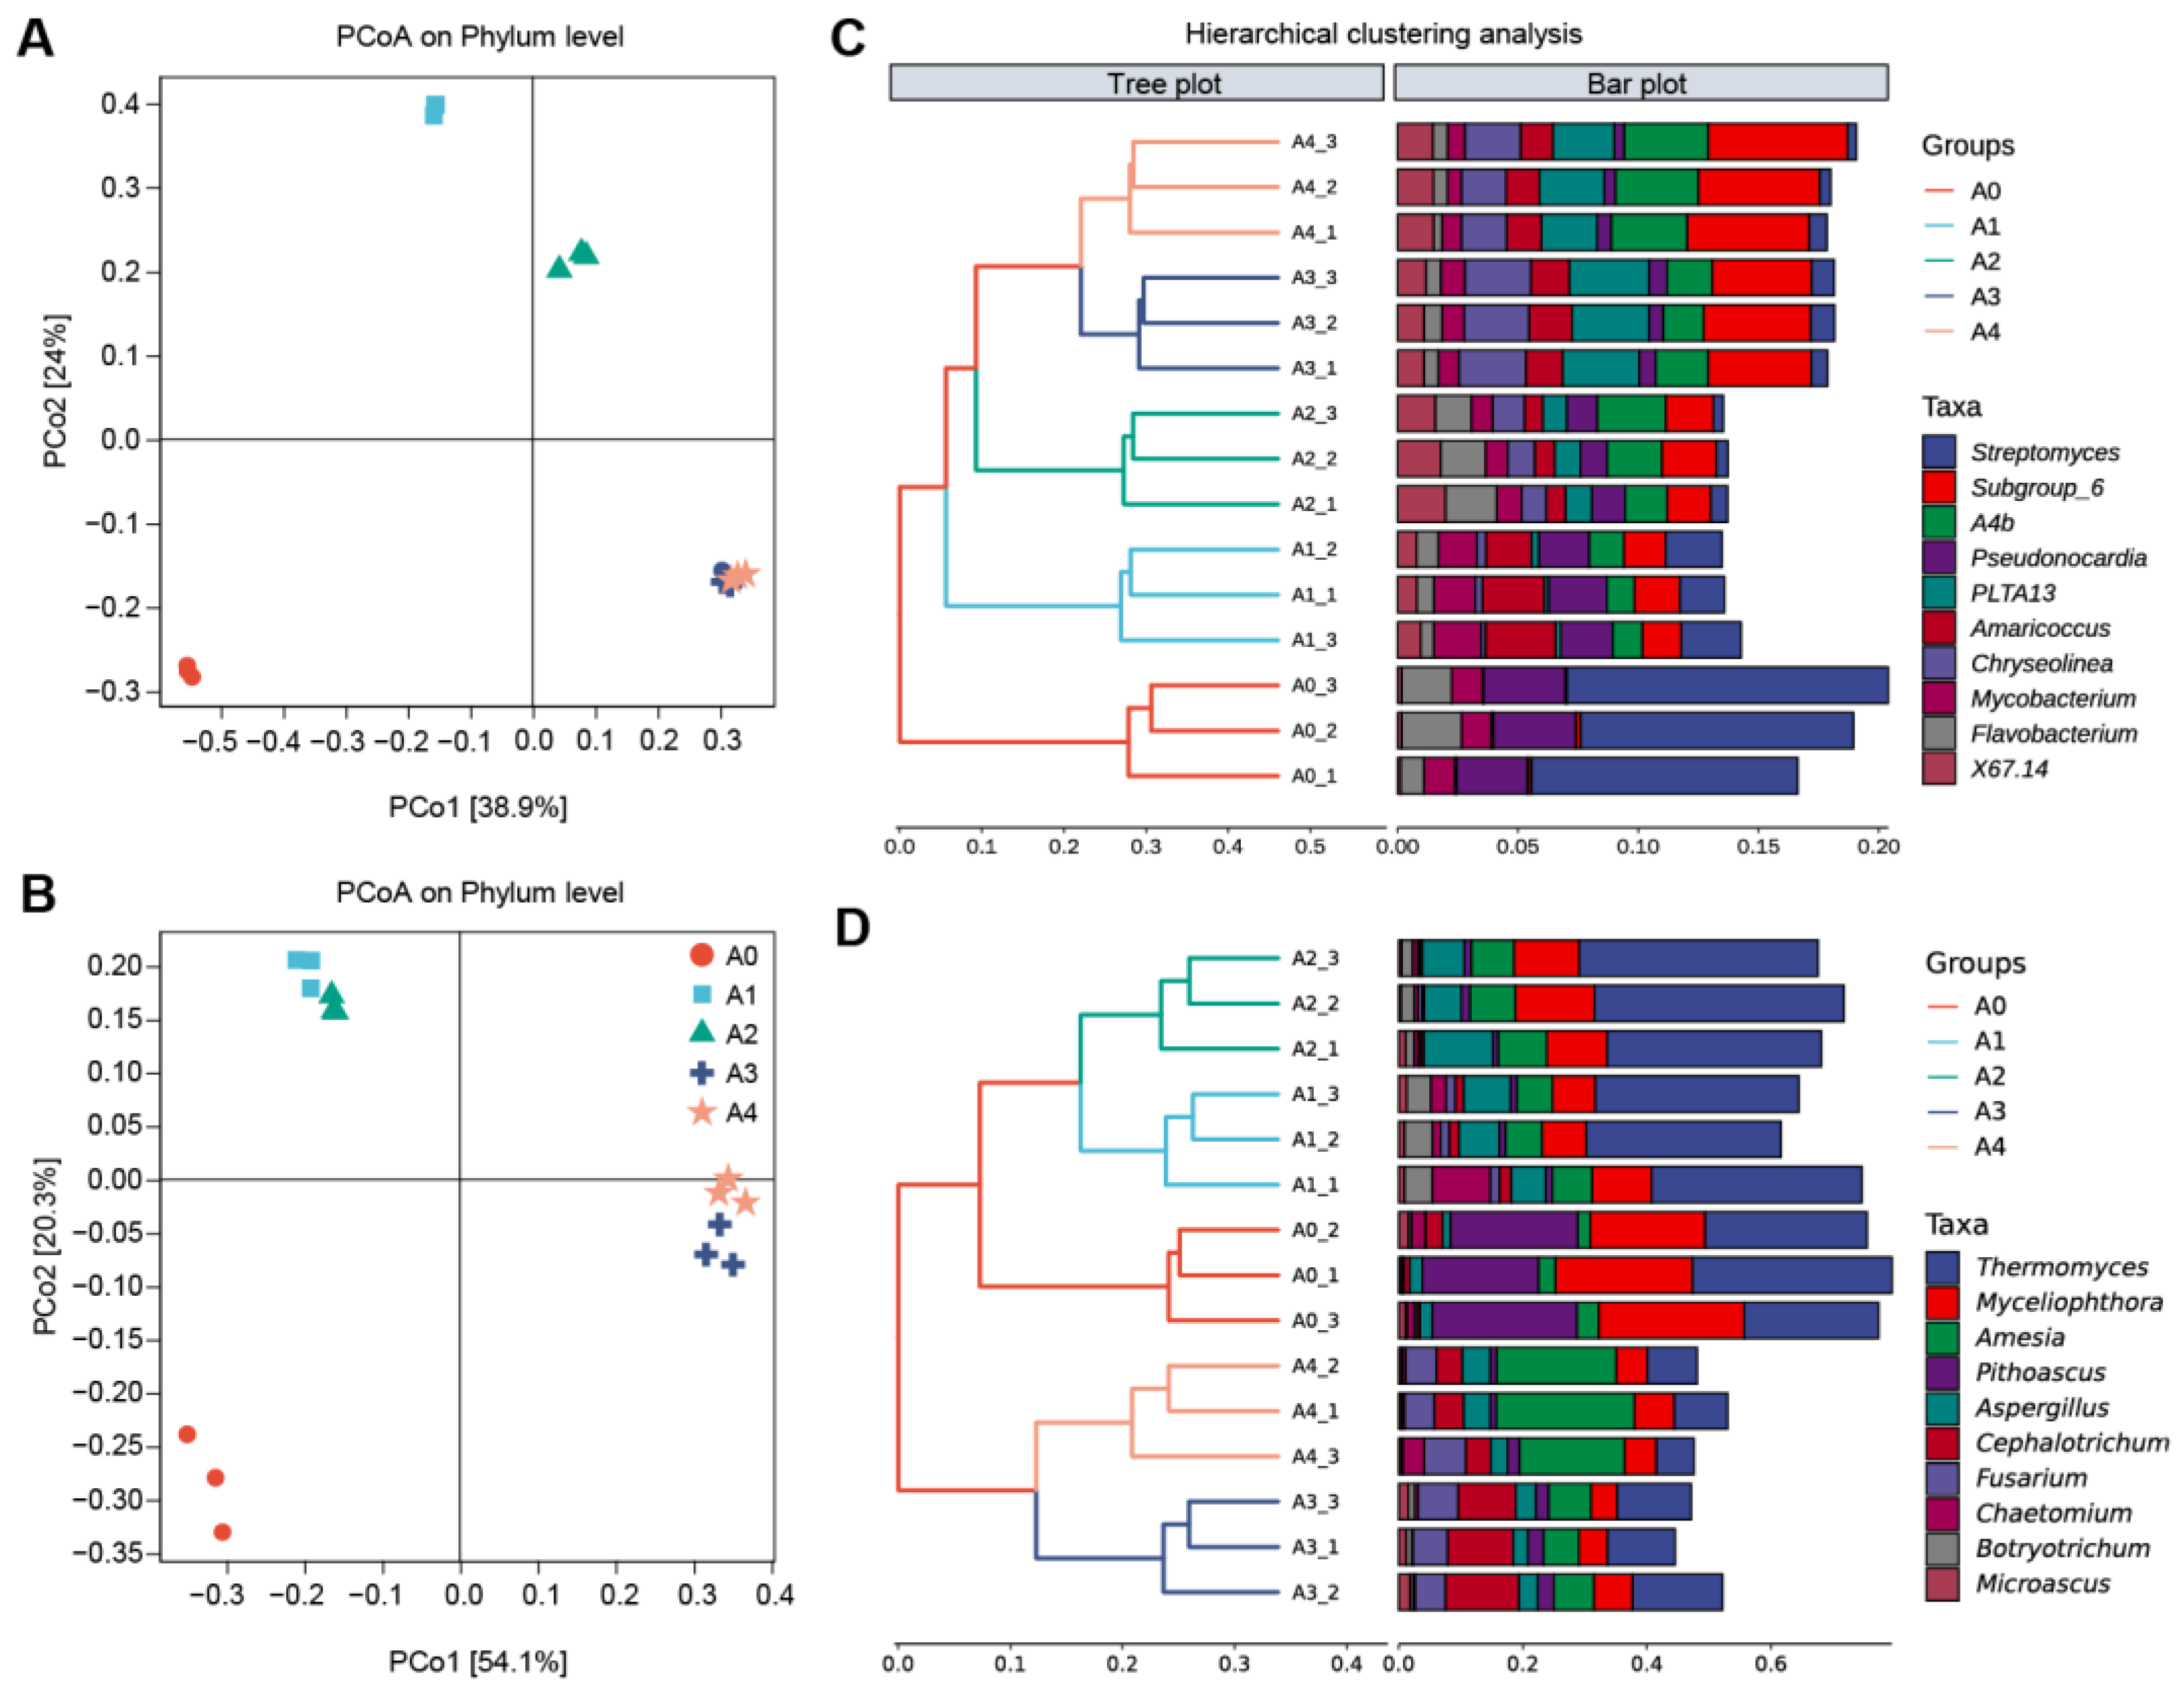
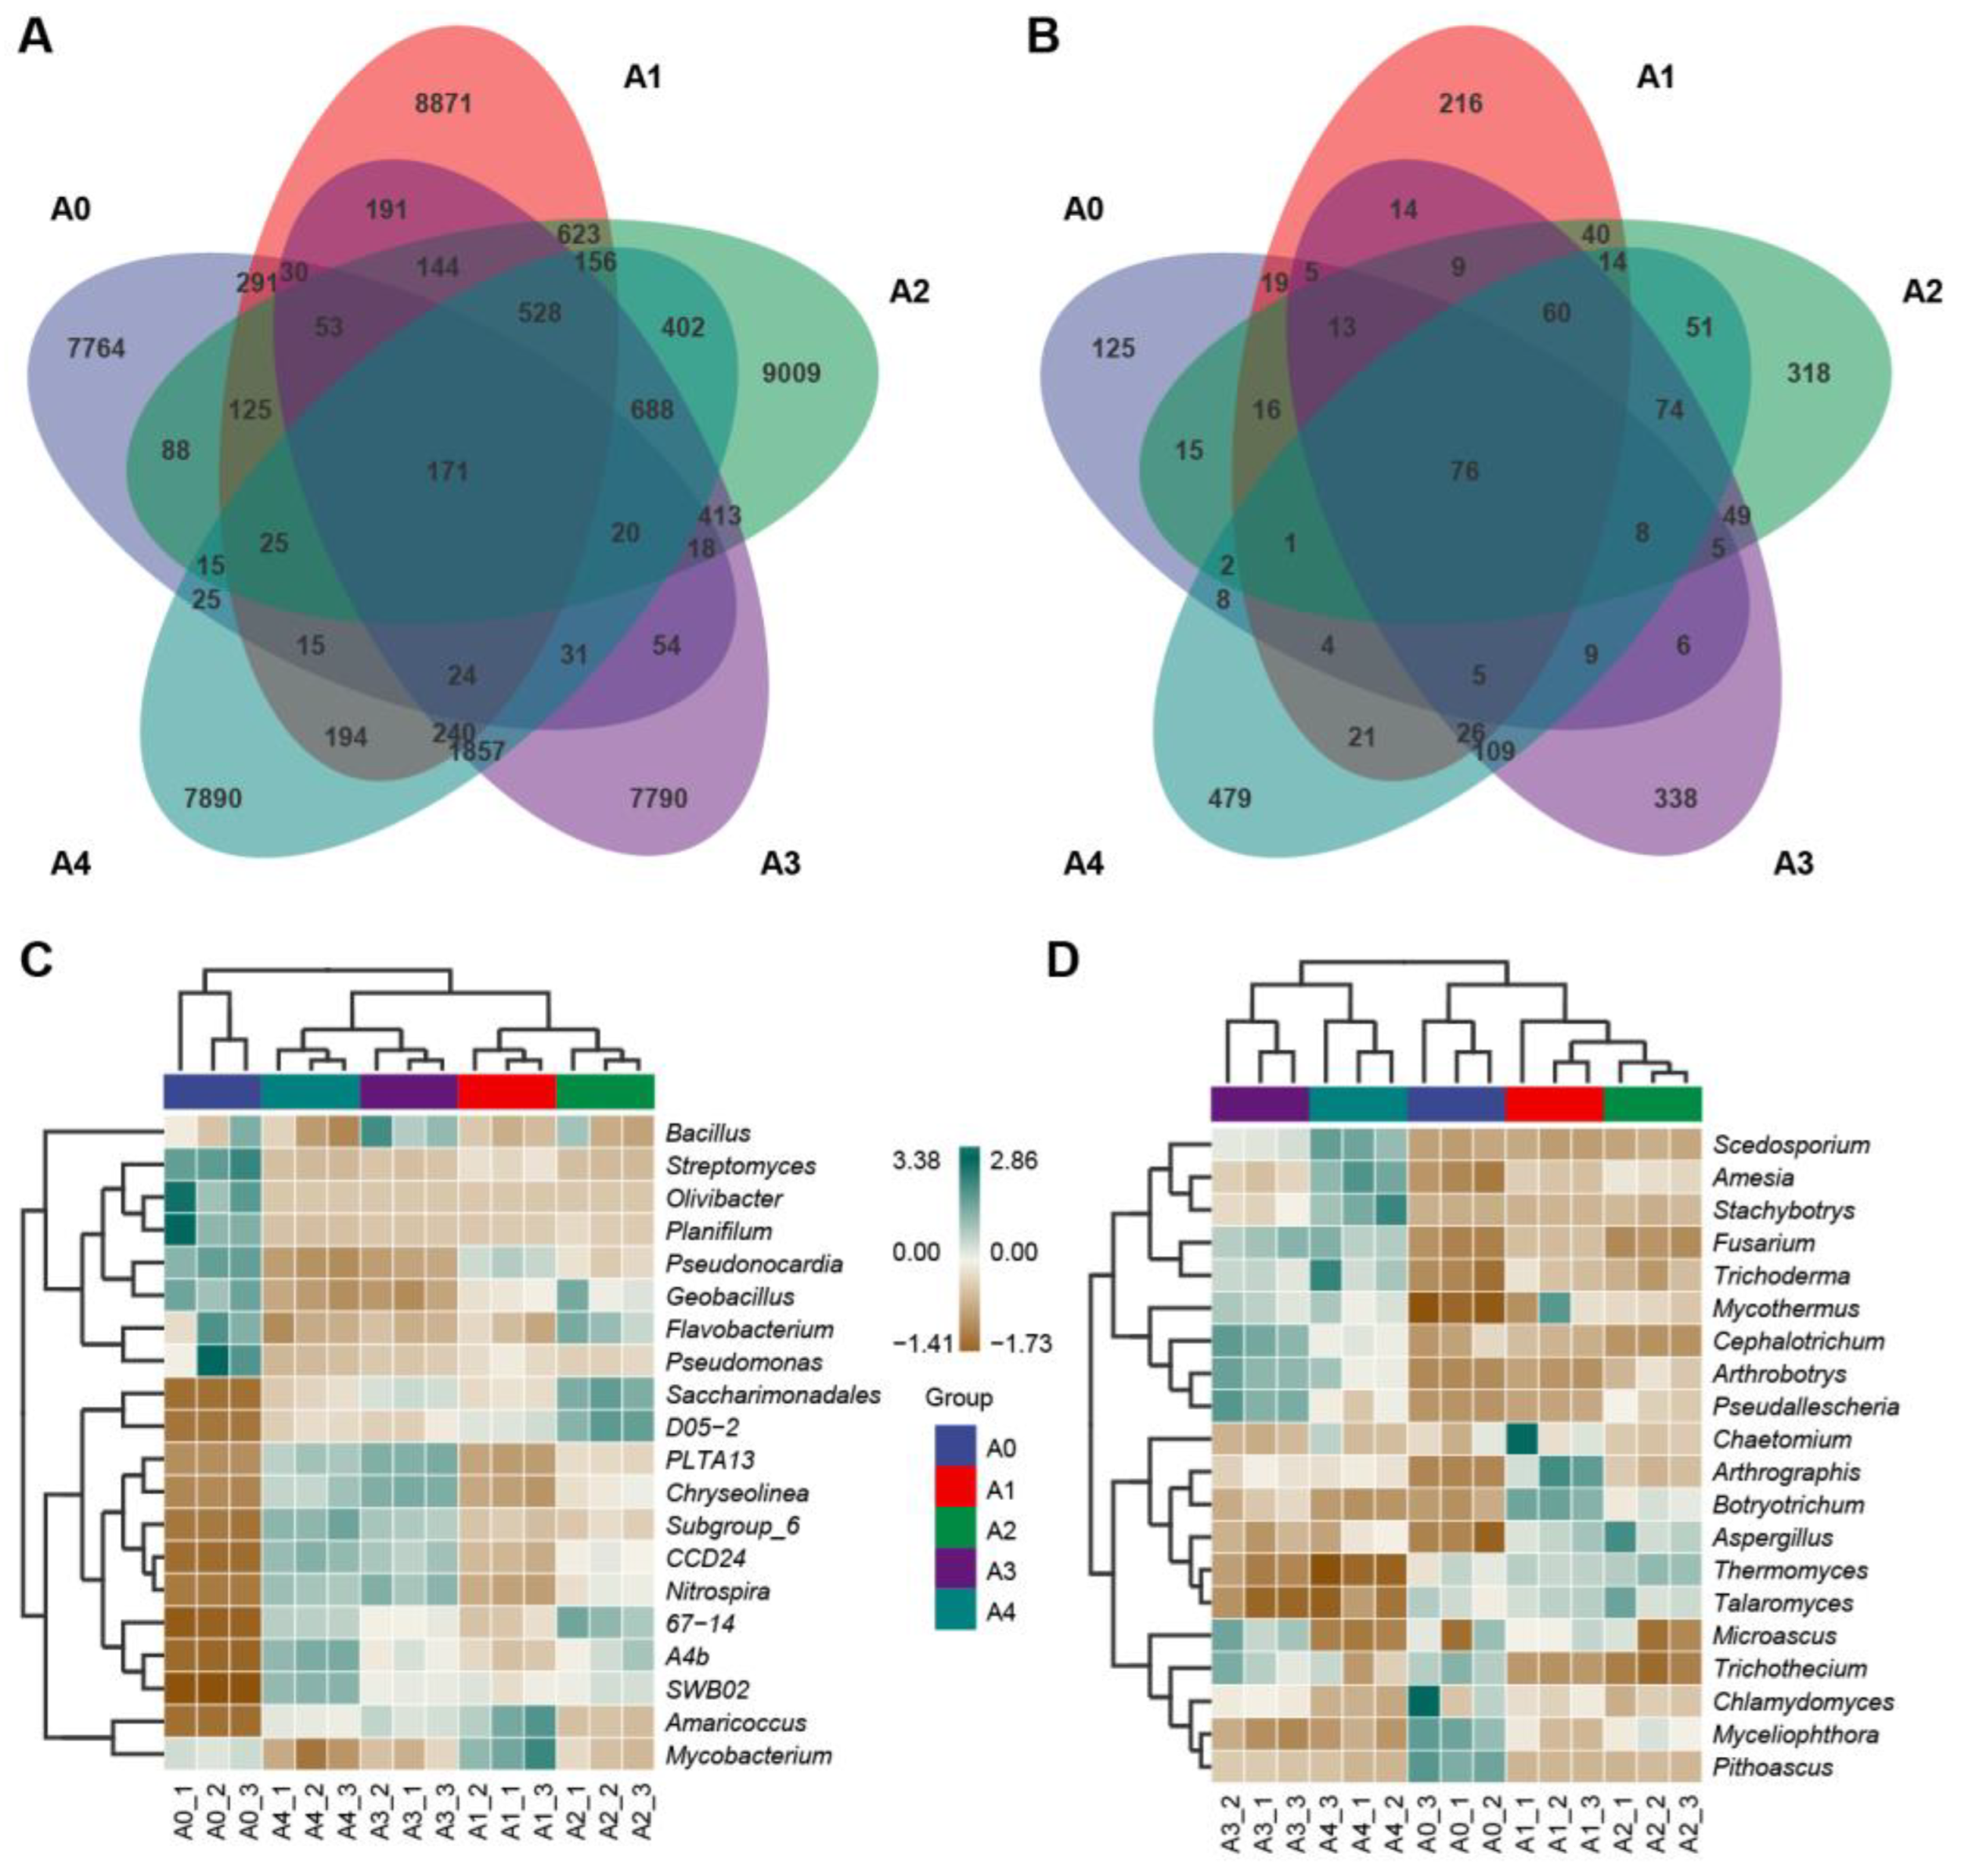
3.4. Analysis of Dissimilarities in the Composition of Microbial Communities

β diversity pertains to the variation in species composition among distinct communities. PCoA is a widely used technique for classical multidimensional scaling (cMD) [47]. The PCoA plots for the microbial communities are presented in Figure 3. Cluster analysis revealed that at the bacterial and fungal levels, each group was clustered individually. The first and second principal components of the bacterial communities accounted for 38.9% and 24%, respectively, of the overall contribution (Figure 3A). For the bacterial communities, compared with A0, the community composition in the substrates changed greatly after continuous cucumber cropping, and the community compositions in A3 and A4 were the closest. The fungal communities were influenced by the 1st and 2nd principal components of the PCoA, accounting for 54.1% and 20.3%, respectively (Figure 3B). The fungal communities of A1 and A2 were similar to that of A0, and the fungal communities of A3 and A4 were similar to each other. Figure 3C,D show that the three biological replicates from each treatment clustered into one class at the genus level (the same was true at other levels), indicating that the continuous cropping of cucumber changed the structural distribution of bacteria and fungi in the substrates. Moreover, there was a significant difference between the bacteria and fungi communities in A0 and those in continuous cropping substrates, and those in A3 and A4 were more similar to each other. Above all, it can be concluded that both plant cultivation and continuous cropping may alter the microbial community of the substrates.

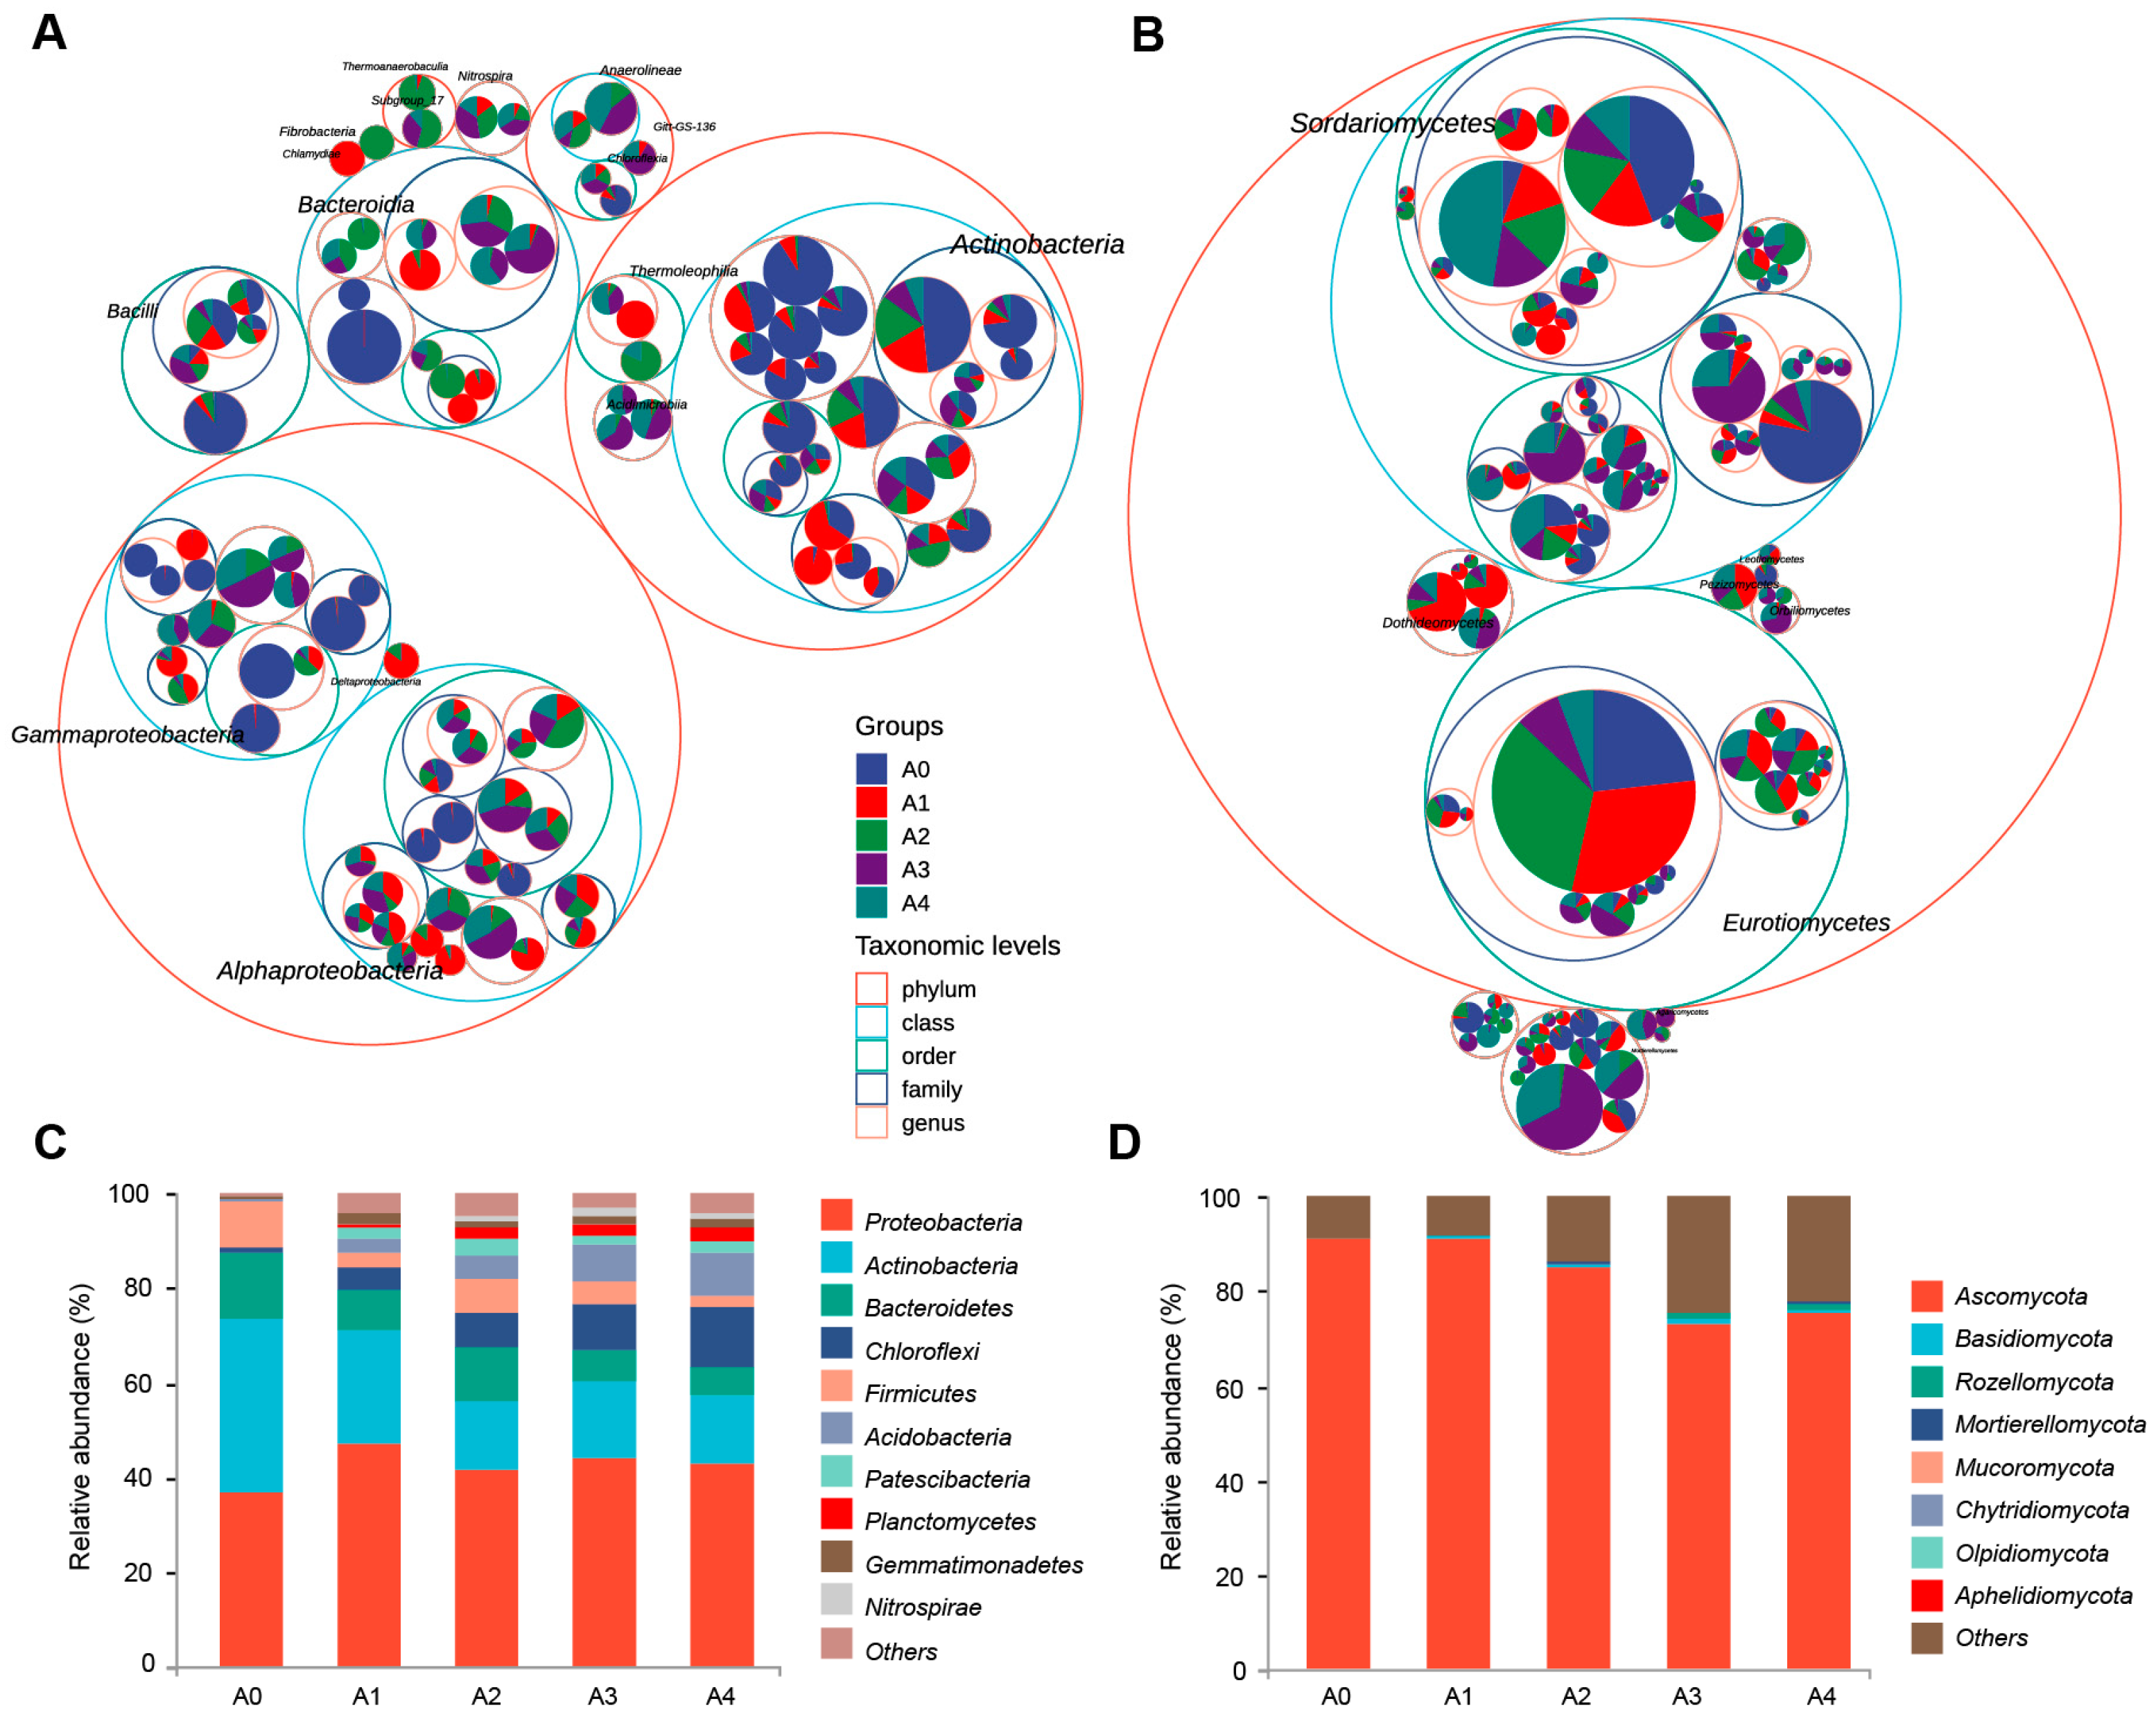
3.5. Composition Analysis of the Bacterial and Fungal Communities

Figure 4A shows the classification tree of the bacterial communities in the cucumber culture substrates; these communities were distributed in four main phyla, among which Proteobacteria and Actinobacteria included the most abundant species. Alphaproteobacteria, Gammaproteobacteria and Actinobacteria belong to these two phyla. Figure 4B shows the classification tree of the fungal community in the cucumber culture substrates, which included mainly one phylum, Ascomycota, within which both Sordariomycetes and Eurotiomycetes had the highest abundance. Furthermore, the composition of the bacterial community at the phylum level in the five samples is shown in Figure 4C. There were significant differences between the composition and relative abundance of the bacterial community following continuous monocropping and those of the bacterial community in A0. Proteobacteria, Actinobacteria, Bacteroidetes, Chloroflexi, Firmicutes, Acidobacteria, Patescibacteria, Planctomycetes, Gemmatimonadetes and Nitrospirae were identified as the top ten bacteria phyla among the substrates. These phyla collectively accounted for 74.97–88.75% of all the identified phyla. The dominant bacteria included Proteobacteria, Actinobacteria, Bacteroidetes and Chloroflexi. Compared with those in A0, the abundances of Proteobacteria, Chloroflexi, Acidobacteria, Planctomycetes, Gemmatimonadetes and Nitrospirae increased with continuous cropping. Conversely, there was a decrease in the abundance of Actinobacteria and Bacteroidetes. Compared with those in A0, the percentages of Proteobacteria in A1, A2, A3 and A4 increased by 26.09%, 12.65%, 18.85% and 15.97%, respectively. Prior to planting, the abundances of Chloroflexi, Acidobacteria, Planctomycetes, Gemmatimonadetes and Nitrospirae were relatively low; however, their proportions significantly increased after continuous cropping. Compared to that in A0, the relative abundance of Chloroflexi increased 2.59–8.84 times. Conversely, the percentage of Actinobacteri decreased by 34.02%, 60.62%, 55.37% and 61.30%, respectively. The percentage of Bacteroidetes decreased by 35.56%, 15.80%, 54.13% and 54.16%, respectively.
Furthermore, we analyzed the alterations in the fungal communities among the five samples (Figure 4D). Eight main phyla were identified from the substrate samples, and they accounted for more than 75.57% of the total identified phyla. In A0, Ascomycota accounted for the largest proportion (90%) of the fungi, which gradually decreased in A1, A2, and A3. The percentage of Ascomycota in A4 slightly increased. The percentage of Ascomycota decreased by 0%, 6.54%, 19.73 and 17%, respectively. In addition, the proportions of Basidiomycota, Mortierellomycota and Mucoromycota notably increased in A1, A2, A3, and A4 compared with those in A0, indicating that significant changes in the composition of these fungi occurred during continuous monocropping. Similarly, compared with those in A0, the relative abundances of Basidiomycota, Mortierellomycota and Mucoromycota in A0 were 2.31–11.89, 5.68–97.16 and 4.19–25.73 times greater, respectively. Rozellomycota, Chytridiomycota, Olpidiomycota and Aphelidiomycota were not detected in A0 samples; however, Rozellomycota was identified in A2, A3 and A4, and its percentage was highest in A3 (0.89%). Chytridiomycota and Olpidiomycota were identified in all the samples, but their abundances were relatively low. Moreover, Aphelidiomycota was detected in only A1 and A2, with low abundances of 0.0023% and 0.018%, respectively.
To conduct community analysis and examine the core and unique species across various samples, core ASVs were identified for all the samples (Figure 5). A bacterial community consisted of 171 core ASVs (Figure 5A), whereas the fungal community contained 76 core ASVs (Figure 5B). Samples A1, A2, A3, and A4 contained a total of 8871 unique bacterial ASVs, with 9009 in sample A2, 7790 in sample A3, and 7890 in sample A4. Similarly, sample A1 had 216 unique fungal ASVs, while samples A2, A3, and A4 had 318, 338, and 479, respectively. Figure 5C shows that there were significant differences in the abundance distribution of the main bacterial genera among the samples. For example, in sample A0, the genera with high abundance mainly included Bacillus, Streptomyces, Olivibacter, Planifilum, Pseudonocardia, Geobacillus, Flavobacterium and Pseudomonas. Amaricoccus and Mycobacterium were mainly included in A1. Flavobacterium, Pseudomonas, Saccharimonadales, D05-2 and 67-14 were mainly included in A2. In A3, Bacillus, PLTA13, Chryseolinea, Subgroup_6CCD24 and Nitrospira were dominantly distributed. In A4, these dominant genera were PLTA13, Chryseolinea, Subgroup_6CCD24, Nitrospira, 67-14, A4b, and SWB02. Differences were also detected in the abundance distributions of the main fungi at the genus level among the different samples (Figure 5D). For example, the genera with high abundance in sample A0 were Trichothecium, Chlamydomyces, Myceliophthora, and Pithoascus. Arthrographis, Botryotrichum, Aspergillus, Thermomyces and Talaromyces were mainly included in A1. Aspergillus, Thermomyces and Talaromyces were mainly included in A2. In A3, Fusarium, Trichoderma, Mycothermus, Cephalotrichum, Arthrobotrys, Pseudallescheria, Microascus and Trichothecium were dominantly distributed. In A4, the dominant genera were Scedosporium, Amesia, Stachybotrys, Fusarium, Trichoderma and Mycothermus.

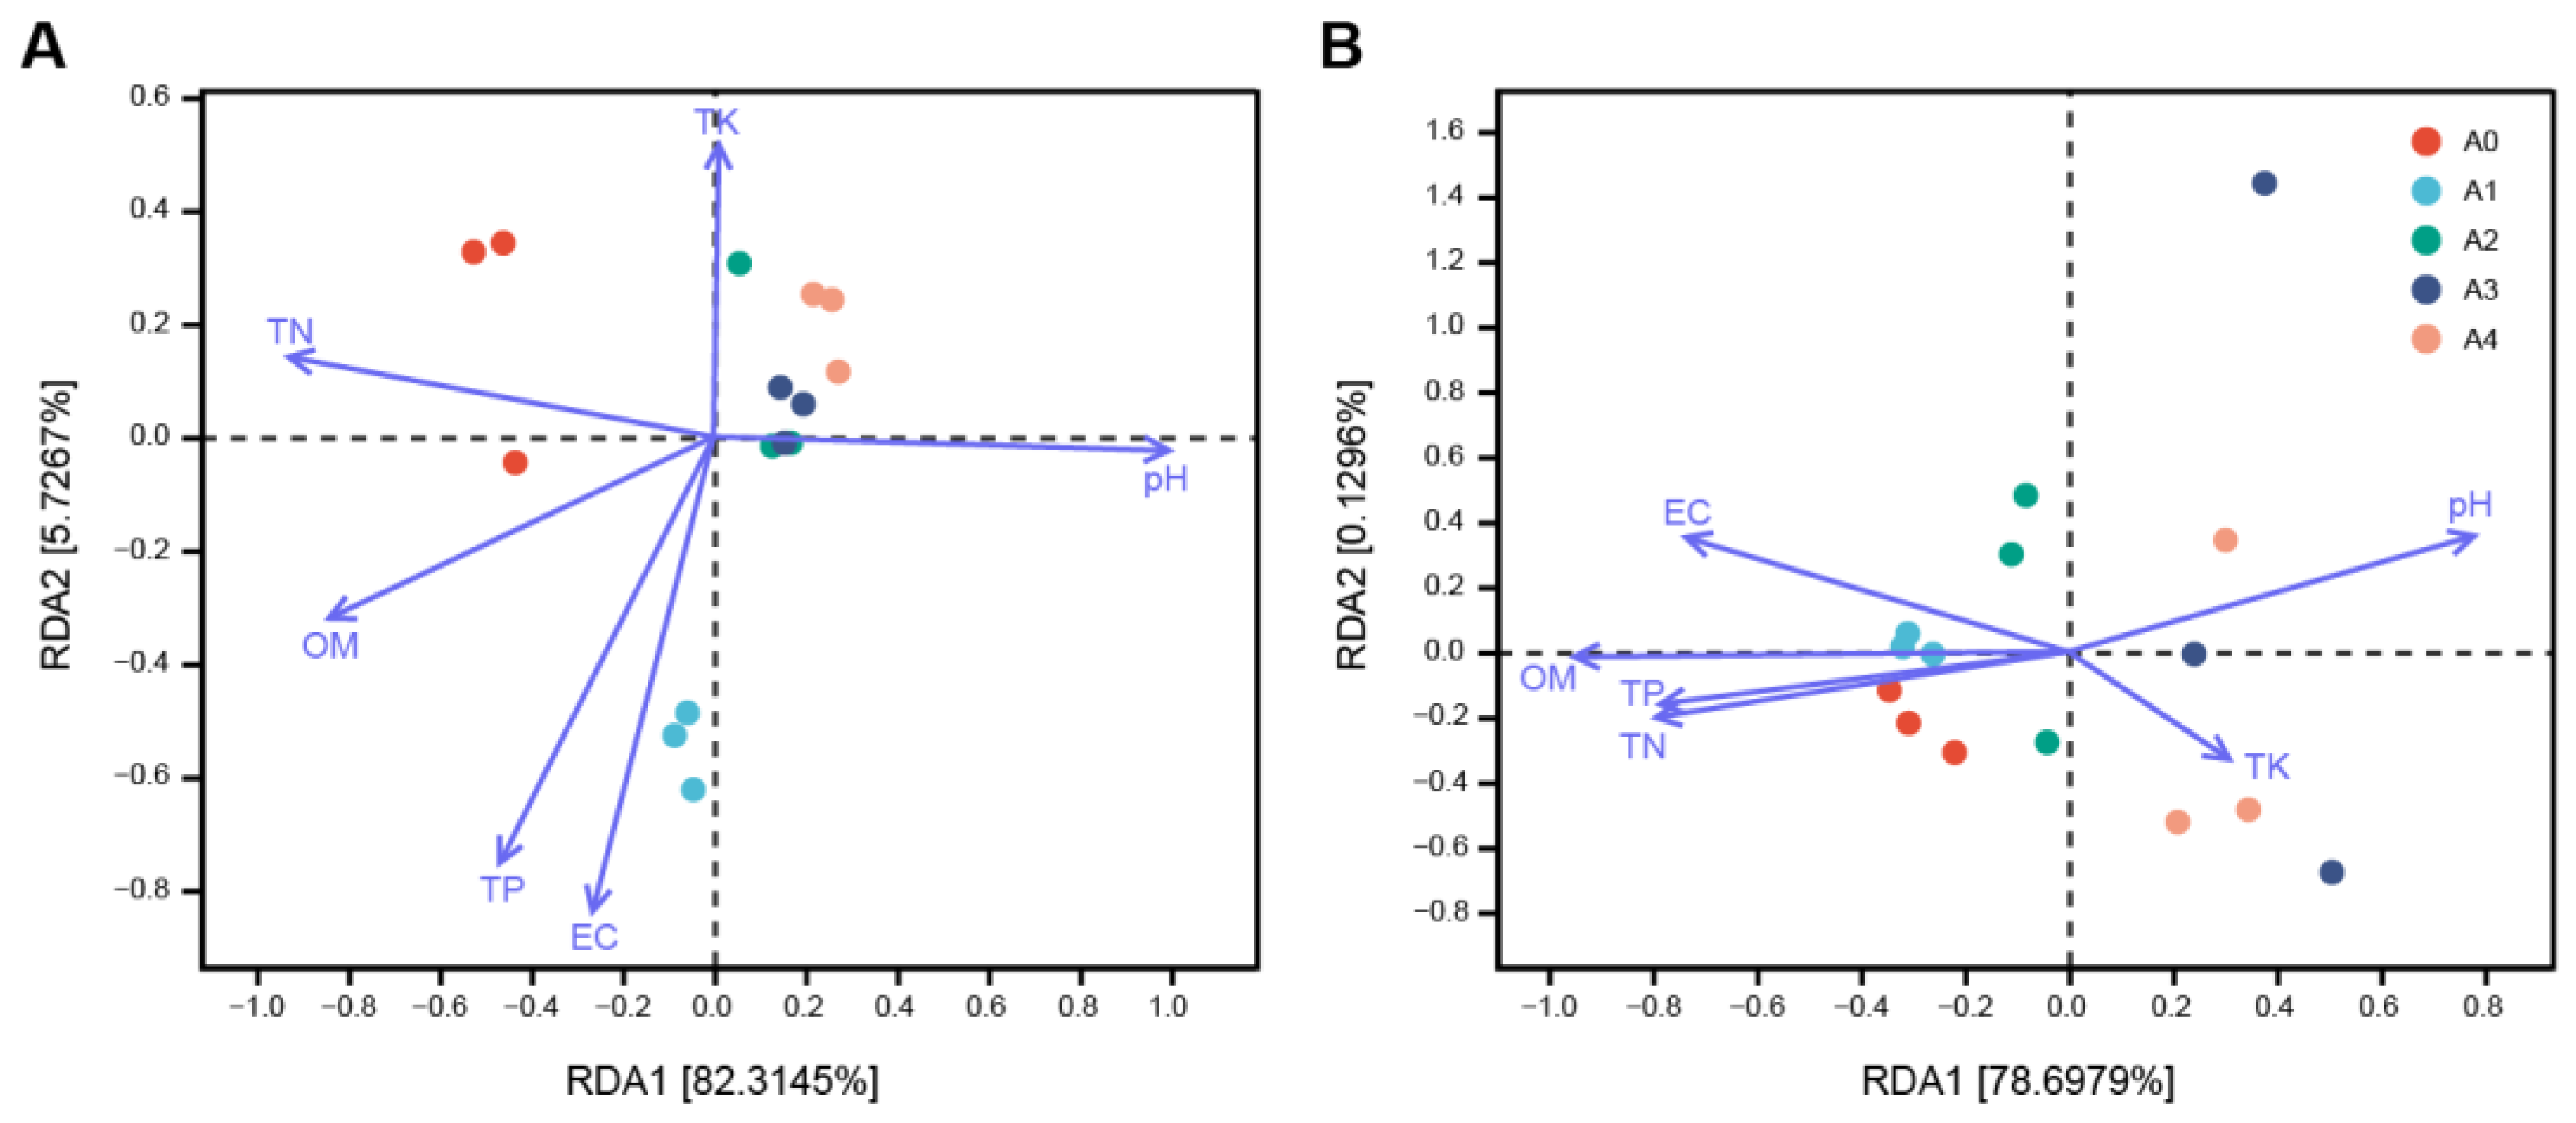
3.6. Correlation Analysis of Physicochemical Properties with Microbial Diversity

The microbial communities were significantly influenced by the physicochemical characteristics of the substrates, such as pH, CE, and OM, TP, TN and TK contents. The clustering and separation of bacterial and fungal communities in the samples induced by environmental factors were investigated using RDA (Figure 6). The bacterial community in A1 substrate was correlated to EC, and those in A2, A3 and A4 substrate were related to pH and TK content. The TN and OM contents determined the bacterial community of A0 substrate (Figure 6A). Similarly, these physicochemical indices of the substrates also affected the fungal community (Figure 6B). The fungal community in A0 substrate was correlated to TN and TP contents, and the fungal community in A1 substrate was associated with OM content. In addition, the fungal community in A2 was correlated with the EC and TN content, and the fungal community in A3 and A4 substrates were correlated with pH and TK content. Overall, TK content had a greater influence on the bacterial community than on the fungal community.

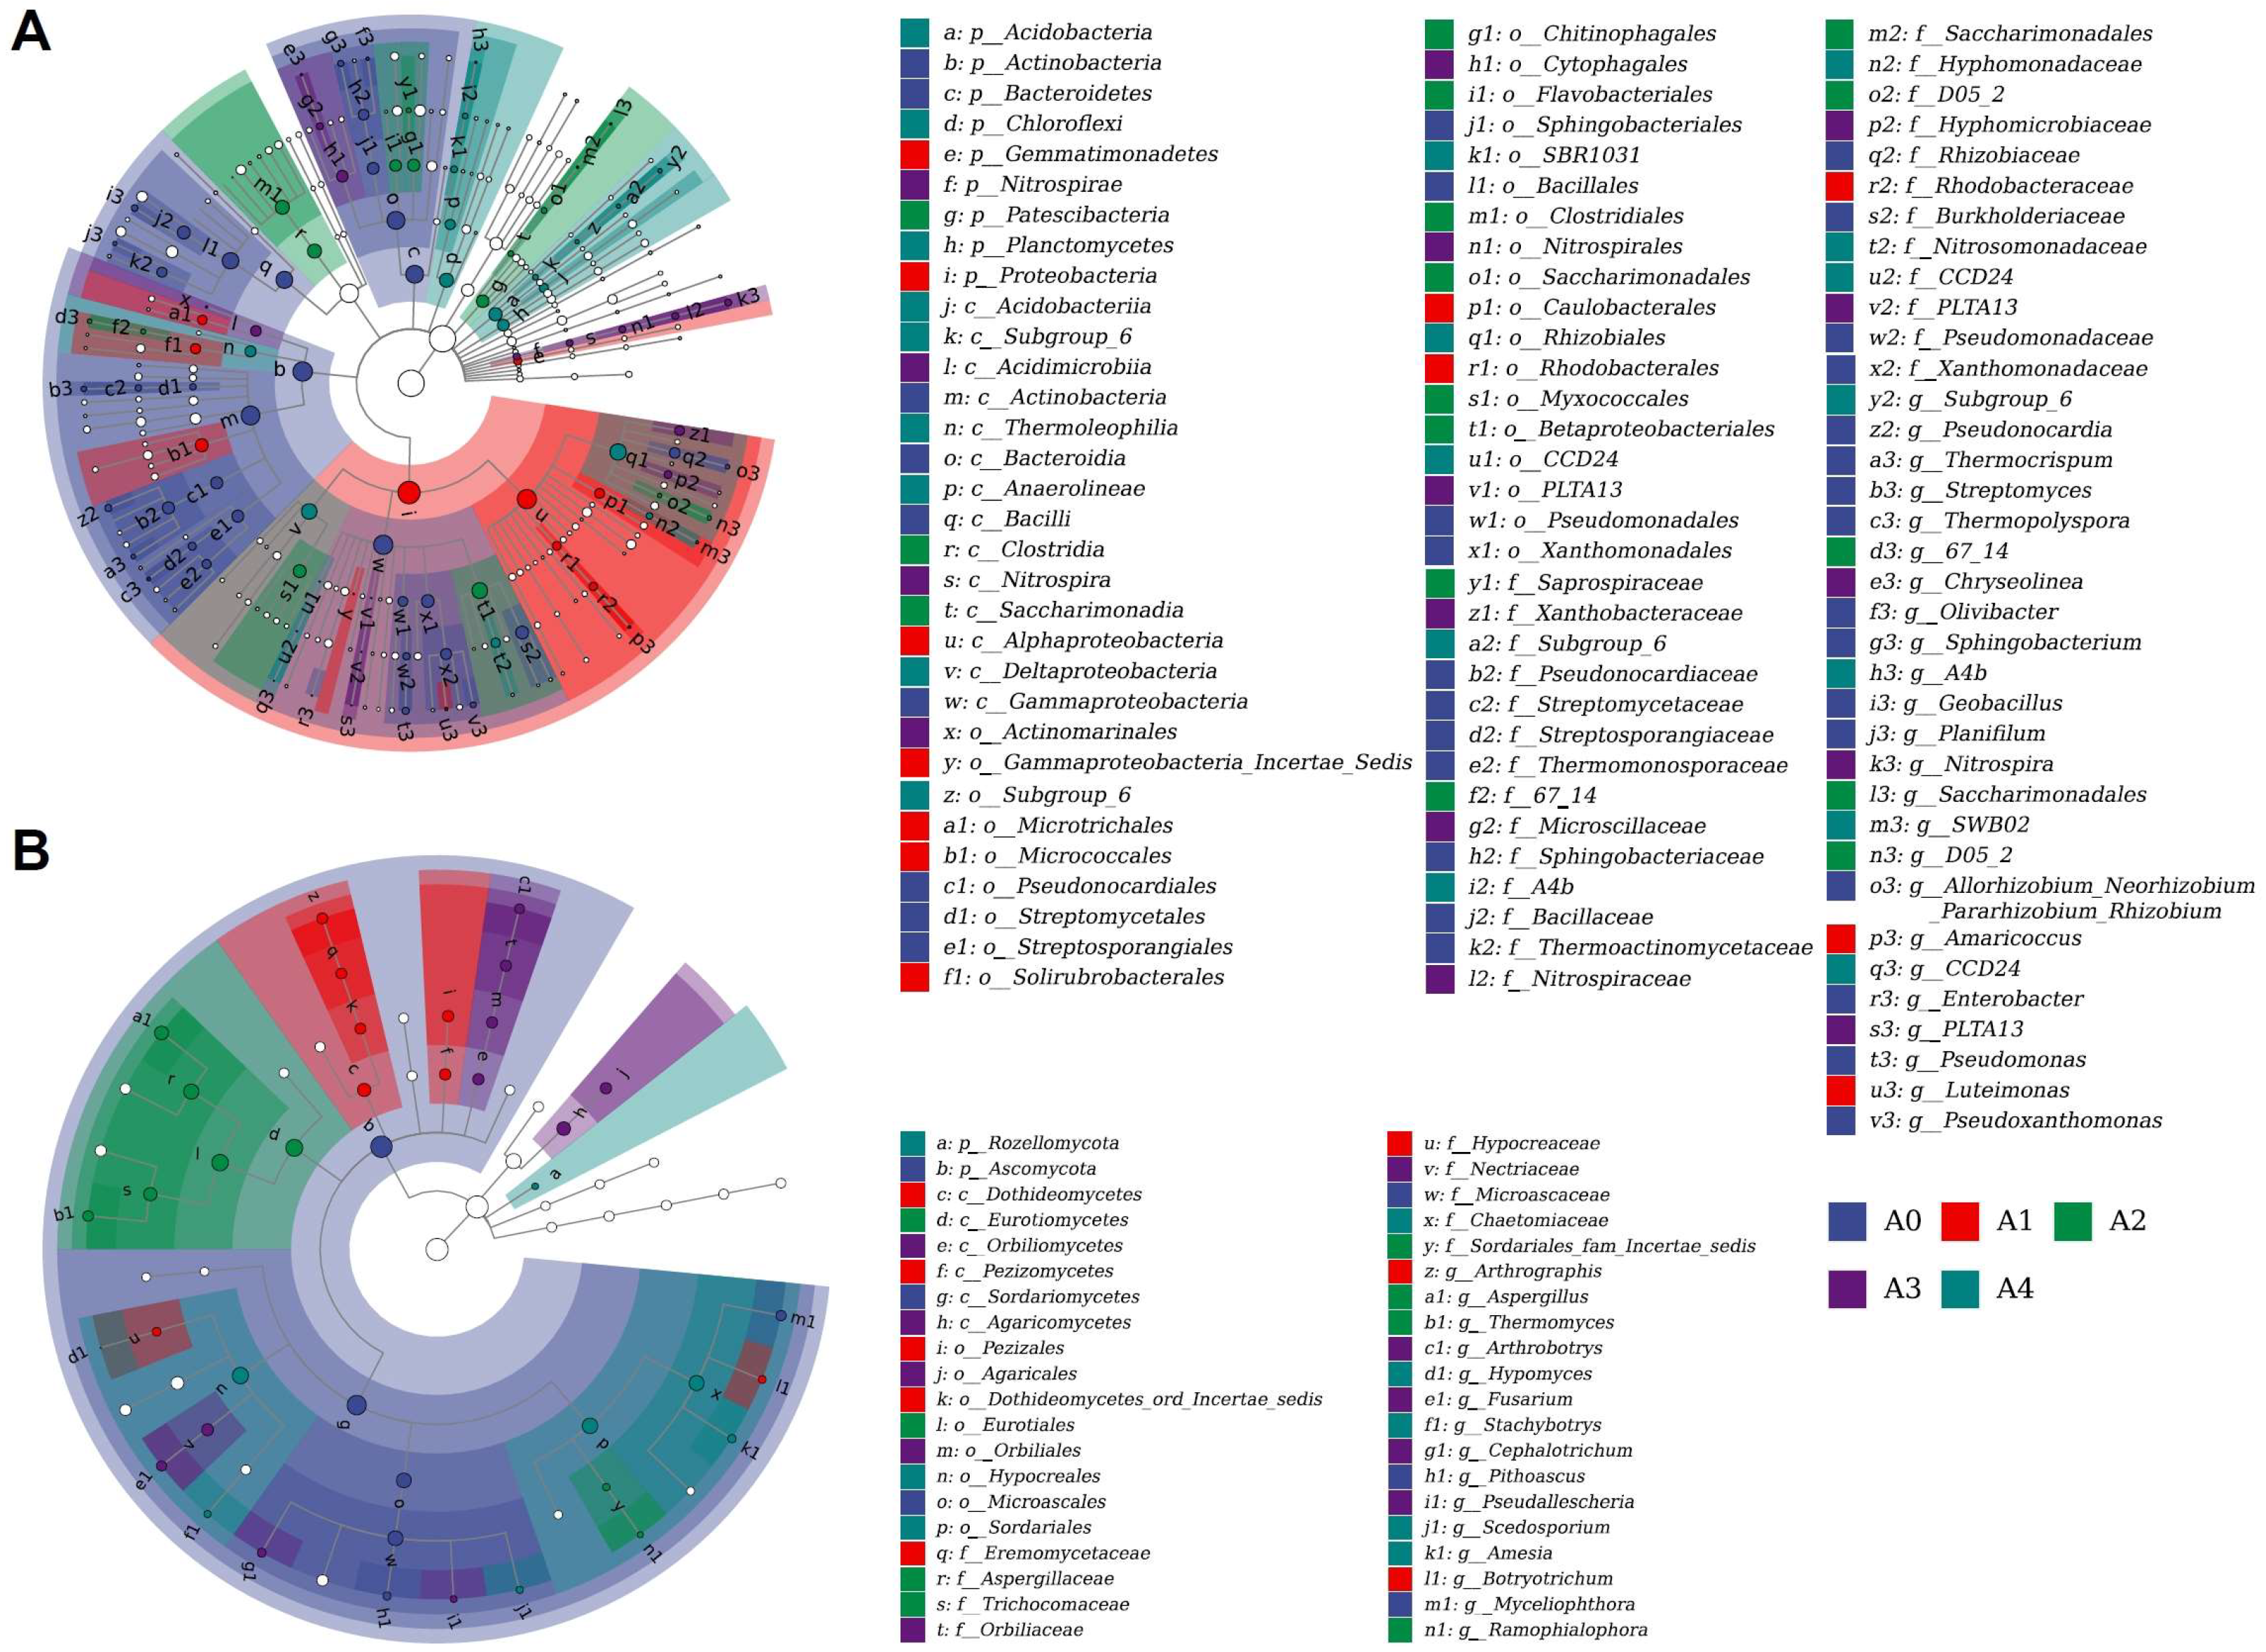
3.7. Analysis of Biomarkers in Substrate Samples

LEfSe (LDA Effect Size) analysis was used to find biomarkers among different treatments [44]. For the bacterial community, 46, 44, 33, 36 and 41 biomarkers were identified for the A0, A1, A2, A3 and A4 substrates, respectively (Figure 7A and Figure S1). The fungal community contained 7, 20, 17, 23 and 18 biomarkers for the A0, A1, A2, A3 and A4 substrates, respectively (Figure 7B and Figure S2). All of these findings indicate that the bacterial and fungal communities in the substrates underwent important alterations due to continuous monocropping. Actinobacteria and Gammaproteobacteria were found to be the most prevalent bacterial biomarkers in A0 substrate. The A1 sample had a great abundance of the Alphaproteobacteria and Gammaproteobacteria bacterial communities. A2 substrate exhibited a significant abundance of Proteobacteria, whereas A3 substrate showed a great abundance of Chloroflexi and Proteobacteria. The abundant bacteria in A4 were Proteobacteria, Chloroflexi, Planctomycetes and Acidobacteria.
The most abundant fungal biomarkers in the A0 substrate were mainly Sordariomycetes. In addition to Sordariomycetes, other biomarkers (Dothideomycetes, Pezizomycetes, Eurotiomycetes and Tremellomycetes) were identified in the A1 substrate. The biomarkers identified in the A2 substrate were Eurotiomycetes, Sordariomycetes, Mortierellomycetes and Orbiliomycetes. Sordariomycetes was abundant in the A3 substrate, while the most abundant fungi in A4 were Sordariomycetes, Rozellomycota and Dothideomycetes.

4. Discussion

4.1. Effect of TCM on the Physicochemical Properties of Substrates

The main obstacles posed by continuous cropping is the decrease in soil quality, which can include soil compaction, nutrient imbalance, salinization, enzyme activity reduction, and the accumulation of harmful microorganisms [48]. In our study, the physiochemical property indices of the substrates (EC, and OM, TN and TP contents) decreased with continuous cropping. The (slightly alkaline) pH increased, but the change in TK content did not significantly change when the cucumber plants were continuously cropped (Table 1). Among these physicochemical property indices, EC was identified as a moderately sensitive index, which may indicate that continuous monocropping has a greater effect on EC than on other physicochemical properties. As OM, TN and TP were indicators of the quality of substrate [49], the fertility-holding capacity of the substrates decreased to some extent. This might be caused by the lack of readdition or replacement of TCM residue substrate during the continuous planting process. In actual agricultural production, fermented TCM residue can be readded after each crop is planted to maintain soil fertility.

4.2. Effect of TCM on the Diversity of the Bacterial and Fungal Communities

During the extensive process of evolution, plants and microorganisms have established a mutually beneficial association [50]. Certain microorganisms in the rhizosphere have a significant impact on the absorption of nutrients and the ability to withstand stress [51]. In practice, continuous monocropping can exert a significant influence on the microbial community of soil, thereby impacting its characteristics [52]. Such alterations may result in diminished soil fertility and even give rise to severe plant diseases and pests [53].
In this study, microbial diversity analysis revealed that continuous cropping on substrate with TCM had a greater effect on the diversity of fungi than on that of bacteria (Figure 2, Table S1). The most dominant bacteria found among all the samples were Proteobacteria, Actinobacteria, Bacteroidetes and Chloroflexi (Figure 3). The percentages of beneficial bacteria, including Proteobacteria, Chloroflexi and Nitrospirae, increased with the continuous cropping of cucumber. A positive correlation was observed between soil pH and Proteobacteria abundance, which in turn was associated with the cycling of carbon, sulfur, and nitrogen within the substrate [54]. Chloroflexi produces energy through photosynthesis and can decompose drug residues in substrates [18,55]. Actinobacteria can decompose cellulose and lignin and can fix nitrogen and resolve phosphorus [18]. Nitrospirae is related to the uptake and usage of nitrogen [56].
In terms of the fungal community, the abundance of Ascomycota was highest in all the treated substrates. Accordingly, Ascomycota are related to crop yields because they can inhibit plant pathogens and promote plant growth [57,58]. In addition, Ascomycota is related to the soil C content, and Basidiomycota is related to plant cell wall degradation [59]. In the A0 substrate, more than 90% of the fungi were Ascomycota, and the lowest proportion was 73% in the A3 substrate. The fungi Basidiomycota, Rozellomycota, Mortierellomycota and Mucoromycota were newly discovered after cucumber plants were monocropped. Among them, Basidiomycota is an important decomposing agent that can decompose cellulose, hemicelluloses and lignin [60], and its content in the A3 substrate was the highest, which was 12 times greater than that in the A0 substrate. Moreover, Mortierella fungi can decompose polysaccharides in the soil, which can benefit grape growth [61].
Among the physicochemical properties of the substrate, pH and TK were identified as the primary factors influencing the bacterial community structure of A2, A3 and A4 (Figure 6A). Previous studies have consistently reported that pH plays a crucial role in shaping soil bacterial diversity [62]. In this study, continuous planting resulted in a slight alkaline shift in substrate pH (Table 1), which is consistent with earlier findings [52,63]. The growth potential of fungi is reported to encompass a broader pH spectrum compared to bacteria [64]. For fungal community, the fertility of the substrate in the early stage (A1 and A2) exerted a stronger influence on fungal diversity within communities, whereas pH played a more prominent role during the late stage (A3 and A4) (Figure 6B).
The continuous cropping of cucumber plants has also been extensively studied [17,32,65]. Previous studies have demonstrated that as the duration of continuous monocropping increased, the presence of beneficial bacteria decreased, but the abundance of pathogenic fungi increased. To alleviate and resolve the obstacles in continuous monocropping of cucumber plants, methods such as cucumber-green garlic intercropping/crop rotation [19,66] or the application of Bacillus subtilis as a soilless substrate [67] have been extensively studied, the results of which indicate that the growth and quality of cucumber plants have improved to some extent with such methods. In the soilless cultivation system of cucumber, garlic [68] and corn straw [23] were added to produce high-quality cultivation substrates. In the present study, we produced a cultivation substrate with TCM residue, and the abundance of beneficial microbes increased with the continuous cropping of cucumber. Therefore, our study may not only provide a new way to reduce the obstacles associated with the continuous cropping of cucumber plants but also lay a theoretical basis for how to perform the scientific reuse of TCM residue waste.

5. Conclusions

The continuous cropping of cucumber strongly influences the physiological indices of cultivation substrates. Moreover, the diversity and structure of the rhizosphere microbial communities also greatly changed. The abundances of beneficial bacteria (Proteobacteria, Chloroflexi and Nitrospirae) increased after continuous monocropping. Important fungi (Ascomycota) occupied large proportions (over 73%) of the fungal community in all the samples. The diversity of the microbial community was found to be primarily influenced by EC, as well as OM, pH and TK contents. Our study aims to provide a conceptual basis for tackling the difficulties linked to continuous cropping and the utilization of organic waste in the TCM industry.

Supplementary Materials

The following supporting information can be downloaded at: https://www.mdpi.com/article/10.3390/agronomy14040709/s1, Figure S1. Histogram of the LDA distribution derived from LEfSe analysis of the bacterial communities in the substrate soils; Figure S2. Histogram of LDA distribution derived from LEfSe analysis of fungal communities in substrate soils; Table S1. Primers used for PCR; Table S2. The statistical characteristics of the different treatment substrates; Table S3. The statistics of the raw data of 15 substrate samples.

Author Contributions

Conceptualization, L.X. and A.L.; Methodology, Q.Z.; Software, J.D.; Validation, Q.Z., J.D. and A.L.; Formal analysis, Q.Z. and J.D.; Investigation, Q.Z., Z.Y. and L.X.; Data curation, Q.Z. and Z.Y.; Writing—original draft, Q.Z. and J.D.; Writing—review and editing, L.X. and A.L.; Visualization, A.L.; Funding acquisition, Q.Z. and J.D. All authors have read and agreed to the published version of the manuscript.

Funding

This research was funded by the fund for Shanxi “1331 Project” Key Subjects Construction (1331KSC), Technological Innovation Programs of Higher Education Institutions in Shanxi (2021L523, 2023L332).

Data Availability Statement

The raw sequencing data have been deposited in the NCBI Sequence Read Archive (SRA) under accession number PRJNA1077650 and PRJNA1077721.

Acknowledgments

We thank Liying Meng (Shanxi University) for her technical support for uploading raw data to NCBI database. We also thank Shanghai Personal Biotechnology Co., Ltd. for sequencing service.

Conflicts of Interest

The authors declare no conflicts of interest.

References

  1. Shi, B.; Wang, X.; Yang, S.; Chen, H.; Zhao, Y. Addition Pinus massoniana fallen wood improved the growth of Plagiomnium acutum in a substrate cultivation. Sci. Rep. 2022, 12, 17755. [Google Scholar] [CrossRef]
  2. Ulaganathan, K.; Dong, C.-J.; Li, Q.; Wang, L.-L.; Shang, Q.-M. Dynamic changes in bacterial communities in the recirculating nutrient solution of cucumber plug seedlings cultivated in an ebb-and-flow subirrigation system. PLoS ONE 2020, 15, e0232446. [Google Scholar] [CrossRef]
  3. Meng, L.; Fu, Y.; Li, D.; Sun, X.; Chen, Y.; Li, X.; Xu, S.; Li, X.; Li, C.; Song, B.; et al. Effects of corn stalk cultivation substrate on the growth of the slippery mushroom (Pholiota microspora). RSC Adv. 2019, 9, 5347–5353. [Google Scholar] [CrossRef]
  4. Siddiqui, Z.; Hagare, D.; Liu, M.-H.; Panatta, O.; Hussain, T.; Memon, S.; Noorani, A.; Chen, Z.-H. A Food Waste-Derived Organic Liquid Fertiliser for Sustainable Hydroponic Cultivation of Lettuce, Cucumber and Cherry Tomato. Foods 2023, 12, 719. [Google Scholar] [CrossRef]
  5. Conversa, G.; Bonasia, A.; Lazzizera, C.; La Rotonda, P.; Elia, A. Reduction of Nitrate Content in Baby-Leaf Lettuce and Cichorium endivia Through the Soilless Cultivation System, Electrical Conductivity and Management of Nutrient Solution. Front. Plant Sci. 2021, 12, 645671. [Google Scholar] [CrossRef]
  6. Tzortzakis, N.; Nicola, S.; Savvas, D.; Voogt, W. Editorial: Soilless Cultivation Through an Intensive Crop Production Scheme. Management Strategies, Challenges and Future Directions. Front. Plant Sci. 2020, 11, 529970. [Google Scholar] [CrossRef]
  7. Renna, M.; D’Imperio, M.; Maggi, S.; Serio, F. Soilless biofortification, bioaccessibility, and bioavailability: Signposts on the path to personalized nutrition. Front. Nutr. 2022, 9, 966018. [Google Scholar] [CrossRef]
  8. Xu, B.; Yang, X.; Li, Y.; Yang, K.; Xiong, Y.; Yuan, N. Pyrite-Based Autotrophic Denitrifying Microorganisms Derived from Paddy Soils: Effects of Organic Co-Substrate Addition. Int. J. Environ. Res. Public Health 2022, 19, 11763. [Google Scholar] [CrossRef]
  9. Zhou, F.; Wu, X.; Gao, Y.; Fan, S.; Zhou, H.; Zhang, X. Diversity Shifts in the Root Microbiome of Cucumber under Different Plant Cultivation Substrates. Front. Microbiol. 2022, 13, 878409. [Google Scholar] [CrossRef]
  10. Rabbani, M.; Kazemi, F. Water need and water use efficiency of two plant species in soil-containing and soilless substrates under green roof conditions. J. Environ. Manag. 2022, 302, 113950. [Google Scholar] [CrossRef]
  11. Suwannarach, N.; Kumla, J.; Zhao, Y.; Kakumyan, P. Impact of Cultivation Substrate and Microbial Community on Improving Mushroom Productivity: A Review. Biology 2022, 11, 569. [Google Scholar] [CrossRef]
  12. Anzalone, A.; Mosca, A.; Dimaria, G.; Nicotra, D.; Tessitori, M.; Privitera, G.F.; Pulvirenti, A.; Leonardi, C.; Catara, V. Soil and Soilless Tomato Cultivation Promote Different Microbial Communities That Provide New Models for Future Crop Interventions. Int. J. Mol. Sci. 2022, 23, 8820. [Google Scholar] [CrossRef]
  13. Burza, W.; Zuzga, S.; Yin, Z.; Malepszy, S. Cucumber (Cucumis sativus L.). In Agrobacterium Protocols; Wang, K., Ed.; Humana Press: Totowa, NJ, USA, 2006; pp. 427–438. [Google Scholar]
  14. Zhang, Y.; Chen, H.; Zhu, W.; Li, C. Comparison of the carotenoid compositions and protection of in-season and anti-season tomato extracts againstd-galactose-induced cognition deficits and oxidative damage in mice. Int. J. Food Sci. Nutr. 2016, 67, 983–994. [Google Scholar] [CrossRef]
  15. Larkin, R.P. Characterization of soil microbial communities under different potato cropping systems by microbial population dynamics, substrate utilization, and fatty acid profiles. Soil Biol. Biochem. 2003, 35, 1451–1466. [Google Scholar] [CrossRef]
  16. Liu, W.; Wang, Q.; Wang, B.; Wang, X.; Franks, A.E.; Teng, Y.; Li, Z.; Luo, Y. Changes in the abundance and structure of bacterial communities under long-term fertilization treatments in a peanut monocropping system. Plant Soil 2015, 395, 415–427. [Google Scholar] [CrossRef]
  17. Chen, X.; Zhang, D.; Li, Y.; Li, H.; Lou, J.; Li, X.; Wei, M. Changes in rhizospheric microbiome structure and soil metabolic function in response to continuous cucumber cultivation. FEMS Microbiol. Ecol. 2022, 98, fiac129. [Google Scholar] [CrossRef]
  18. Chen, X.; Zhang, D.; Li, X.; Li, X.; Lou, J.; Wei, M. Effect of vegetable residues incorporation on soil fertility, rhizosphere microbial community structure, and plant growth of continuously cropped cucumber in a solar greenhouse. Ann. Microbiol. 2022, 72, 32. [Google Scholar] [CrossRef]
  19. Ding, H.; Ali, A.; Cheng, Z. Effect of green garlic/cucumber crop rotation for 3 years on the dynamics of soil properties and cucumber yield in Chinese anthrosol. J. Sci. Food Agric. 2019, 100, 362–370. [Google Scholar] [CrossRef]
  20. Xu, S.-Y.; Wei, J.-K.; Xue, F.-Y.; Li, W.-C.; Guan, T.-K.; Hu, B.-Y.; Chen, Q.-J.; Han, Y.-Y.; Liu, C.-J.; Zhang, G.-Q. Microbial inoculation influences microbial communities and physicochemical properties during lettuce seedling using composted spent mushroom substrate. Appl. Soil Ecol. 2022, 174, 104418. [Google Scholar] [CrossRef]
  21. Ma, Y.; Liu, L.; Zhou, X.; Tian, T.; Xu, S.; Li, D.; Li, C.; Li, Y. Optimizing Straw-Rotting Cultivation for Sustainable Edible Mushroom Production: Composting Spent Mushroom Substrate with Straw Additions. J. Fungi 2023, 9, 925. [Google Scholar] [CrossRef] [PubMed]
  22. Vandecasteele, B.; Amery, F.; Ommeslag, S.; Vanhoutte, K.; Visser, R.; Robbens, J.; De Tender, C.; Debode, J. Chemically versus thermally processed brown shrimp shells or Chinese mitten crab as a source of chitin, nutrients or salts and as microbial stimulant in soilless strawberry cultivation. Sci. Total Environ. 2021, 771, 145263. [Google Scholar] [CrossRef]
  23. Zheng, W.; Ma, Y.; Wang, X.; Wang, X.; Li, J.; Tian, Y.; Zhang, X. Producing high-quality cultivation substrates for cucumber production by in-situ composting of corn straw blocks amended with biochar and earthworm casts. Waste Manag. 2022, 139, 179–189. [Google Scholar] [CrossRef]
  24. Huang, C.; Li, Z.-X.; Wu, Y.; Huang, Z.-Y.; Hu, Y.; Gao, J. Treatment and bioresources utilization of traditional Chinese medicinal herb residues: Recent technological advances and industrial prospect. J. Environ. Manag. 2021, 299, 113607. [Google Scholar] [CrossRef]
  25. Ma, J.; Chen, Y.; Zhao, Y.; Chen, D.; Wang, H. Effects of traditional Chinese medicine residue on plant growth and soil properties: A case study with maize (Zea mays L.). Environ. Sci. Pollut. Res. 2019, 26, 32880–32890. [Google Scholar] [CrossRef]
  26. Liu, S.; Yang, G.; Wu, F.; Ge, Y.; Liu, F.; Pu, C.; Wang, Z.; Shen, Y.; Zhou, X.; Luo, Y.; et al. Traditional Chinese medicine residues promote the growth and quality of Salvia miltiorrhiza Bunge by improving soil health under continuous monoculture. Front. Plant Sci. 2023, 14, 1112382. [Google Scholar] [CrossRef]
  27. Yang, Y.; Sun, M.; Yao, W.; Wang, F.; Li, X.; Wang, W.; Li, J.; Gao, Z.; Qiu, L.; You, R.; et al. Compound kushen injection relieves tumor-associated macrophage-mediated immunosuppression through TNFR1 and sensitizes hepatocellular carcinoma to sorafenib. J. Immunother. Cancer 2020, 8, e000317. [Google Scholar] [CrossRef]
  28. Zhao, Z.; Fan, H.; Higgins, T.; Qi, J.; Haines, D.; Trivett, A.; Oppenheim, J.J.; Wei, H.; Li, J.; Lin, H.; et al. Fufang Kushen injection inhibits sarcoma growth and tumor-induced hyperalgesia via TRPV1 signaling pathways. Cancer Lett. 2014, 355, 232–241. [Google Scholar] [CrossRef]
  29. Wang, W.; You, R.-l.; Qin, W.-j.; Hai, L.-n.; Fang, M.-j.; Huang, G.-h.; Kang, R.-x.; Li, M.-h.; Qiao, Y.-f.; Li, J.-w.; et al. Anti-tumor activities of active ingredients in Compound Kushen Injection. Acta Pharmacol. Sin. 2015, 36, 676–679. [Google Scholar] [CrossRef]
  30. Lei, H.; Niu, T.; Song, H.; Bai, B.; Han, P.; Wang, Z.; Liu, A. Comparative transcriptome profiling reveals differentially expressed genes involved in flavonoid biosynthesis between biennial and triennial Sophora flavescens. Ind. Crops Prod. 2021, 161, 113217. [Google Scholar] [CrossRef]
  31. Ciavatta, C.; Govi, M.; Antisari, L.V.; Sequi, P. Determination of organic carbon in aqueous extracts of soils and fertilizers. Commun. Soil Sci. Plant Anal. 2008, 22, 795–807. [Google Scholar] [CrossRef]
  32. Sun, K.; Fu, L.; Song, Y.; Yuan, L.; Zhang, H.; Wen, D.; Yang, N.; Wang, X.; Yue, Y.; Li, X.; et al. Effects of continuous cucumber cropping on crop quality and soil fungal community. Environ. Monit. Assess. 2021, 193, 436. [Google Scholar] [CrossRef] [PubMed]
  33. Grimshaw, H.M. The determination of total phosphorus in soils by acid digestion. Chem. Anal. Environ. Res. 1987, 18, 92–96. [Google Scholar]
  34. Guo, Y.-X.; Chen, Q.-J.; Qin, Y.; Yang, Y.-R.; Yang, Q.-Z.; Wang, Y.-X.; Cheng, Z.-A.; Cao, N.; Zhang, G.-Q. Succession of the microbial communities and function prediction during short-term peach sawdust-based composting. Bioresour. Technol. 2021, 332, 125079. [Google Scholar] [CrossRef] [PubMed]
  35. Bolyen, E.; Rideout, J.R.; Dillon, M.R.; Bokulich, N.A.; Abnet, C.C.; Al-Ghalith, G.A.; Alexander, H.; Alm, E.J.; Arumugam, M.; Asnicar, F.; et al. Reproducible, interactive, scalable and extensible microbiome data science using QIIME 2. Nat. Biotechnol. 2019, 37, 852–857. [Google Scholar] [CrossRef] [PubMed]
  36. Bokulich, N.A.; Kaehler, B.D.; Rideout, J.R.; Dillon, M.; Bolyen, E.; Knight, R.; Huttley, G.A.; Gregory Caporaso, J. Optimizing taxonomic classification of marker-gene amplicon sequences with QIIME 2’s q2-feature-classifier plugin. Microbiome 2018, 6, 90. [Google Scholar] [CrossRef]
  37. DeSantis, T.Z.; Hugenholtz, P.; Larsen, N.; Rojas, M.; Brodie, E.L.; Keller, K.; Huber, T.; Dalevi, D.; Hu, P.; Andersen, G.L. Greengenes, a Chimera-Checked 16S rRNA Gene Database and Workbench Compatible with ARB. Appl. Environ. Microbiol. 2006, 72, 5069–5072. [Google Scholar] [CrossRef] [PubMed]
  38. Kõljalg, U.; Nilsson, R.H.; Abarenkov, K.; Tedersoo, L.; Taylor, A.F.S.; Bahram, M.; Bates, S.T.; Bruns, T.D.; Bengtsson-Palme, J.; Callaghan, T.M.; et al. Towards a unified paradigm for sequence-based identification of fungi. Mol. Ecol. 2013, 22, 5271–5277. [Google Scholar] [CrossRef] [PubMed]
  39. Chao, A. Nonparametric Estimation of the Number of Classes in a Population. Scand. J. Stat. 1984, 11, 265–270. [Google Scholar]
  40. Shannon, C.E. A Mathematical Theory of Communication. Bell Syst. Tech. J. 1948, 27, 623–656. [Google Scholar] [CrossRef]
  41. Simpson, E.H. Measurement of Diversity. Nature 1949, 163, 688. [Google Scholar] [CrossRef]
  42. Pielou, E.C. The measurement of diversity in different types of biological collections. J. Theor. Biol. 1966, 13, 131–144. [Google Scholar] [CrossRef]
  43. Good, I.J. The Population Frequencies of Species and the Estimation of Population Parameters. Biometrika 1953, 40, 237–264. [Google Scholar] [CrossRef]
  44. Segata, N.; Izard, J.; Waldron, L.; Gevers, D.; Miropolsky, L.; Garrett, W.S.; Huttenhower, C. Metagenomic biomarker discovery and explanation. Genome Biol. 2011, 12, R60. [Google Scholar] [CrossRef] [PubMed]
  45. Nabout, J.C.; Walters, K.E.; Martiny, J.B.H. Alpha-, beta-, and gamma-diversity of bacteria varies across habitats. PLoS ONE 2020, 15, e0233872. [Google Scholar] [CrossRef]
  46. Li, Z.; Zhou, J.; Liang, H.; Ye, L.; Lan, L.; Lu, F.; Wang, Q.; Lei, T.; Yang, X.; Cui, P.; et al. Differences in Alpha Diversity of Gut Microbiota in Neurological Diseases. Front. Neurosci. 2022, 16, 879318. [Google Scholar] [CrossRef] [PubMed]
  47. Ramette, A. Multivariate analyses in microbial ecology. FEMS Microbiol. Ecol. 2007, 62, 142–160. [Google Scholar] [CrossRef]
  48. Zeeshan Ul Haq, M.; Yu, J.; Yao, G.; Yang, H.; Iqbal, H.A.; Tahir, H.; Cui, H.; Liu, Y.; Wu, Y. A Systematic Review on the Continuous Cropping Obstacles and Control Strategies in Medicinal Plants. Int. J. Mol. Sci. 2023, 24, 12470. [Google Scholar] [CrossRef] [PubMed]
  49. van Es, H.M.; Karlen, D.L. Reanalysis Validates Soil Health Indicator Sensitivity and Correlation with Long-term Crop Yields. Soil Sci. Soc. Am. J. 2019, 83, 721–732. [Google Scholar] [CrossRef]
  50. Drew, G.C.; Stevens, E.J.; King, K.C. Microbial evolution and transitions along the parasite–mutualist continuum. Nat. Rev. Microbiol. 2021, 19, 623–638. [Google Scholar] [CrossRef]
  51. Olanrewaju, O.S.; Babalola, O.O. The rhizosphere microbial complex in plant health: A review of interaction dynamics. J. Integr. Agric. 2022, 21, 2168–2182. [Google Scholar] [CrossRef]
  52. Lei, H.; Liu, A.; Hou, Q.; Zhao, Q.; Guo, J.; Wang, Z. Diversity patterns of soil microbial communities in the Sophora flavescens rhizosphere in response to continuous monocropping. BMC Microbiol. 2020, 20, 272. [Google Scholar] [CrossRef] [PubMed]
  53. Santhanam, R.; Luu, V.T.; Weinhold, A.; Goldberg, J.; Oh, Y.; Baldwin, I.T. Native root-associated bacteria rescue a plant from a sudden-wilt disease that emerged during continuous cropping. Proc. Natl. Acad. Sci. USA 2015, 112, E5013–E5020. [Google Scholar] [CrossRef] [PubMed]
  54. Wang, Y.; Xu, X.; Liu, T.; Wang, H.; Yang, Y.; Chen, X.; Zhu, S. Analysis of bacterial and fungal communities in continuous-cropping ramie (Boehmeria nivea L. Gaud) fields in different areas in China. Sci. Rep. 2020, 10, 3264. [Google Scholar] [CrossRef] [PubMed]
  55. Buijs, Y.; Bech, P.K.; Vazquez-Albacete, D.; Bentzon-Tilia, M.; Sonnenschein, E.C.; Gram, L.; Zhang, S.-D. Marine Proteobacteria as a source of natural products: Advances in molecular tools and strategies. Nat. Prod. Rep. 2019, 36, 1333–1350. [Google Scholar] [CrossRef]
  56. Daims, H.; Lücker, S.; Wagner, M. A New Perspective on Microbes Formerly Known as Nitrite-Oxidizing Bacteria. Trends Microbiol. 2016, 24, 699–712. [Google Scholar] [CrossRef] [PubMed]
  57. Barrera, V.A.; Martin, M.E.; Aulicino, M.; Martínez, S.; Chiessa, G.; Saparrat, M.C.N.; Gasoni, A.L. Carbon-substrate utilization profiles by Cladorrhinum (Ascomycota). Rev. Argent. Microbiol. 2019, 51, 302–306. [Google Scholar] [CrossRef] [PubMed]
  58. Challacombe, J.F.; Hesse, C.N.; Bramer, L.M.; McCue, L.A.; Lipton, M.; Purvine, S.; Nicora, C.; Gallegos-Graves, L.V.; Porras-Alfaro, A.; Kuske, C.R. Genomes and secretomes of Ascomycota fungi reveal diverse functions in plant biomass decomposition and pathogenesis. BMC Genom. 2019, 20, 976. [Google Scholar] [CrossRef] [PubMed]
  59. Bastida, F.; Torres, I.F.; Moreno, J.L.; Baldrian, P.; Ondoño, S.; Ruiz-Navarro, A.; Hernández, T.; Richnow, H.H.; Starke, R.; García, C.; et al. The active microbial diversity drives ecosystem multifunctionality and is physiologically related to carbon availability in Mediterranean semi-arid soils. Mol. Ecol. 2016, 25, 4660–4673. [Google Scholar] [CrossRef] [PubMed]
  60. Schmidt-Dannert, C. Biocatalytic portfolio of Basidiomycota. Curr. Opin. Chem. Biol. 2016, 31, 40–49. [Google Scholar] [CrossRef]
  61. Yan, H.; Ge, C.; Zhou, J.; Li, J. Diversity of soil fungi in the vineyards of Changli region in China. Can. J. Microbiol. 2022, 68, 341–352. [Google Scholar] [CrossRef]
  62. Liu, Z.; Liu, J.; Yu, Z.; Yao, Q.; Li, Y.; Liang, A.; Zhang, W.; Mi, G.; Jin, J.; Liu, X.; et al. Long-term continuous cropping of soybean is comparable to crop rotation in mediating microbial abundance, diversity and community composition. Soil Tillage Res. 2020, 197, 104503. [Google Scholar] [CrossRef]
  63. Fernandez-Gnecco, G.; Smalla, K.; Maccario, L.; Sørensen, S.J.; Barbieri, P.; Consolo, V.F.; Covacevich, F.; Babin, D. Microbial community analysis of soils under different soybean cropping regimes in the Argentinean south-eastern Humid Pampas. FEMS Microbiol. Ecol. 2021, 97, fiab007. [Google Scholar] [CrossRef]
  64. Nevarez, L.; Vasseur, V.; Le Madec, A.; Le Bras, M.A.; Coroller, L.; Leguérinel, I.; Barbier, G. Physiological traits of Penicillium glabrum strain LCP 08.5568, a filamentous fungus isolated from bottled aromatised mineral water. Int. J. Food Microbiol. 2009, 130, 166–171. [Google Scholar] [CrossRef]
  65. Zhou, X.; Wu, F. Dynamics of the diversity of fungal and Fusarium communities during continuous cropping of cucumber in the greenhouse. FEMS Microbiol. Ecol. 2012, 80, 469–478. [Google Scholar] [CrossRef]
  66. Xiao, X.; Cheng, Z.; Lv, J.; Xie, J.; Ma, N.; Yu, J. A green garlic (Allium sativum L.) based intercropping system reduces the strain of continuous monocropping in cucumber (Cucumis sativus L.) by adjusting the micro-ecological environment of soil. PeerJ 2019, 7, e7267. [Google Scholar] [CrossRef]
  67. Li, B.; Zhao, L.; Liu, D.; Zhang, Y.; Wang, W.; Miao, Y.; Han, L. Bacillus subtilis Promotes Cucumber Growth and Quality under Higher Nutrient Solution by Altering the Rhizospheric Microbial Community. Plants 2023, 12, 298. [Google Scholar] [CrossRef]
  68. Ali, A.; Ghani, M.I.; Haiyan, D.; Iqbal, M.; Cheng, Z.; Cai, Z. Garlic Substrate Induces Cucumber Growth Development and Decreases Fusarium Wilt through Regulation of Soil Microbial Community Structure and Diversity in Replanted Disturbed Soil. Int. J. Mol. Sci. 2020, 21, 6008. [Google Scholar] [CrossRef]
Figure 1. Rarefaction curves of different substrate samples. (A) Bacterial communities. (B) Fungal communities. The horizontal coordinate is the sequencing depth, and the vertical coordinate is the median value of the α diversity index calculated 10 times; these values are presented in a box plot.
Agronomy 14 00709 g001
Figure 2. The α diversity of the microbial community in the substrate samples. (AF) The α diversity of bacteria. (GL) The α diversity of the fungi, including Chao1, observed species, Shannon, Simpson, Goods coverage and Pielou’s evenness indices. * and ** indicate significant differences between the substrate samples (Dunn’s test, p < 0.05 and p < 0.01).
Agronomy 14 00709 g002
Figure 3. β diversity analysis of the microbial community structures. (A,B) PCoA plots of the bacterial and fungal communities. (C,D) The panel on the left is a hierarchical clustering diagram in which samples are clustered according to their similarity of bacterial and fungal communities. The panel on the right is a stacked bar chart of the top 10 genera in terms of abundance.
Agronomy 14 00709 g003
Figure 4. Classification tree and taxonomic composition of the microbial community structures among the different substrate samples. (A,B) The classification tree of the detected bacteria and fungi. (C,D) The taxonomic composition of the bacterial and fungal community structures at the phylum level.
Agronomy 14 00709 g004
Figure 5. ASV comparison of microbial communities and profiles of the top 20 genera in abundance among substrate samples. (A,B) ASVs of the bacterial and fungal communities. The Venn diagrams present the distributions of sample-specific ASVs (depicted in the outermost circumference) and core ASVs (displayed at the center) for all the samples. (C,D) The profile of the top 20 genera in terms of abundance among the substrate samples. UPGMA clustering of samples according to the Euclidean distance of the species composition data.
Agronomy 14 00709 g005
Figure 6. RDA plots of microbial communities with environmental variables. (A) Bacterial communities. (B) Fungal communities. TP content (mg/kg), OM content (g/kg), TN content (g/kg), and TK content (g/kg).
Agronomy 14 00709 g006
Figure 7. LEfSe analysis of the microbial sequencing. (A) Bacterial 16S rDNA sequences. (B) Fungal ITS rDNA sequences. The concentric circles depict the hierarchical classification levels ranging from phylum to genus. Each small circle at a specific level represents a taxonomic classification, the size of which is directly proportional to the relative abundance of that particular taxon. The unfilled connections symbolize species that do not exhibit significant differences, while the biomarkers for distinct species are color coded in accordance with their respective groups. The legend on the right provides the names of the species denoted by letters.
Agronomy 14 00709 g007
Table 1. Physicochemical indices of the substrate samples.
SampleECpHOMTN (g/kg)TP (g/kg)TK (g/kg)
A01.75 ± 0.002 c6.93 ± 0.06 d0.38 ± 0.01 a17.3 ± 0.07 a10.02 ± 0.32 b9.80 ± 0.07 a
A12.64 ± 0.035 a7.65 ± 0.02 c0.35 ± 0.01 b16.23 ± 0.28 b11.14 ± 0.43 a9.08 ± 0.88 a
A22.23 ± 0.047 b8.05 ± 0.03 ab0.34 ± 0.003 c16.18 ± 0.43 b9.73 ± 0.51 bc9.48 ± 0.32 a
A31.73 ± 0.057 c7.97 ± 0.07 b0.31 ± 0.01 d15.93 ± 0.04 bc9.18 ± 0.61 bc10.04 ± 0.77 a
A41.03 ± 0.001 d8.12 ± 0.05 a0.25 ± 0.01 e15.66 ± 0.3 c8.88 ± 0.33 c9.64 ± 0.25 a
The values shown are the means ± SDs (three biological replicates). Different letters (a–e) in the same columns indicate significant differences according to ANOVA under the Tukey test at p < 0.05. EC: electrical conductivity; OM: organic matter; pH: potential of hydrogen; TN: total nitrogen; TP: total phosphorus; TK: total potassium.
Disclaimer/Publisher’s Note: The statements, opinions and data contained in all publications are solely those of the individual author(s) and contributor(s) and not of MDPI and/or the editor(s). MDPI and/or the editor(s) disclaim responsibility for any injury to people or property resulting from any ideas, methods, instructions or products referred to in the content.

