
Developing an Evaluation Framework for Circular Agriculture: A Pathway to Sustainable Farming

1
Institute of Research for Agriculture Economy and Rural Development, 61 Mărăști Blvd., District 1, 011464 Bucharest, Romania
2
National Institute of Research and Development for Biological Sciences, 296 Splaiul Independenţei, District 6, 060031 Bucharest, Romania
*
Author to whom correspondence should be addressed.
Agriculture 2023, 13(11), 2047; https://doi.org/10.3390/agriculture13112047
Submission received: 29 September 2023
/
Revised: 20 October 2023
/
Accepted: 23 October 2023
/
Published: 25 October 2023
(This article belongs to the Special Issue Sustainable Rural Development and Agri-Food Systems)
Abstract
:This article examines how circularity can be measured and evaluated in the agricultural sector. Circularity represents a key approach for promoting sustainability in agriculture and for the efficient management of resources. Through a comprehensive review of the scientific literature and employing rigorous selection methods, we identify the relevant indicators and tools for assessing circularity in the agri-food chain. The initial bibliometric analysis was performed by using a Biblioshiny instrument from R package tool Bibliometrics. Additionally, this article analyzes the methodologies based on the indicators and metrics that can be applied to measure the restorative capacity and effectiveness of the agricultural system. Most current research follows the 3R principles of the circular economy and establishes an evaluation index system based on the regional characteristics. Methods such as the multi-criteria decision analysis, data envelopment analysis, and life cycle assessment are the most used to date. For the micro-level analysis, system dynamics, material flow analysis, and emergy analysis were the most suitable. Our results provide a clear perspective on the current state of the research in the field of measuring circularity in agriculture and lay the groundwork for the future development of effective strategies for implementing the circular economy in this crucial sector.
1. Introduction
The global economy has witnessed unprecedented growth and technological advancements in recent decades, leading to improved living standards. However, this rapid progress has also given rise to significant environmental challenges, with resource depletion, waste accumulation, and climate change showing negative effects. Agriculture is an essential part of the global economy and, at the same time, has a significant impact on natural resources and environmental conservation and preservation [1,2]. With the world’s population growing and the concerns about climate change, there is increasing pressure on the agricultural sector to become more resource-efficient and environmentally sustainable [3,4]. Some authors believe that resources are being depleted 50% faster than they can naturally regenerate, and by 2030, our demands will require the equivalent of the resources from two planets [5]. Given that our world has finite resources, the current patterns of production and consumption need a more sustainable approaches, especially with the current challenges in the COVID-19 era and disruptions of supply chains [6]. Consumers are becoming more and more educated in choosing products that are healthy, produced in an environmentally friendly manner, and locally designed.
The primary production sector plays an indispensable role in providing food, fiber, and other resources to meet the demands of a growing global population. The requirements of the current development policies intensify the pressure for this sector to adapt in practice, becoming not only more productive, but also more judicious towards the finite resources it relies on and the ecosystems it interacts with [7].
In light of these challenges, the need to include innovation and sustainable technologies in agricultural practices becomes evident. Stakeholders, from farmers and agricultural businesses to decision makers and environmental advocates, recognize the need to find a balance between meeting the demands of the population, producing healthy food in a resource-efficient way, both economically and from a limited available natural resources point of view [1,8].
This requires a paradigm shift towards optimizing resource use, reducing generated waste, and responsible land management practices. This is practically translated into the fact that the agricultural sector should increase its renewable energy source use in the current practices, minimize greenhouse gas emissions, and apply solutions that contribute positively to climate change mitigation efforts.
In response, the concept of the circular economy has appeared as a promising paradigm shift that seeks to reconcile economic growth with ecological balance [9,10]. Over time, the circular economy has become a key concept in global efforts to address the challenges of finite resources and the environmental impact of human activity [10].
The European Parliament defines the “circular economy” as a model of production and consumption, which involves sharing, leasing, reusing, repairing, refurbishing, and recycling existing materials and products for as long as possible [11]. Other definitions describe the circular economy as an economic system that is based on business models that replace the “end-of-life” concept with reducing, alternatively reusing, recycling, and recovering materials in production/distribution and consumption processes [12]. In 2015, the European Commission adopted the first circular economy plan in order to facilitate the shift from an actual economy model to a circular economy model. In March 2020, the European Commission adopted the new Circular Economy Action Plan in order to improve the entire life cycle of products. The Circular Economy Action Plan is strongly related to other important global strategies, such as the 2030 Agenda, or regional strategies, such as the European Green Deal, published in 2019 with zero-pollution action plan [10]. In order to fulfill the core objective of establishing a more competitive and cleaner Europe, the Circular Economy Action Plan implements 35 actions related to sustainable products, value chains, waste management, climate neutrality, transition through research, innovation, and digitalization. One of the major steps in order to transpose circular economy European strategies in practice is related to waste management. According to the Circular Economy Plan, “each citizen produces on average nearly half a tonne of municipal waste” and, despite efforts to reduce waste, the reference statistics are not encouraging. The circular material use rate is, at present, 11.8%, a value that shows progress, but also shows that the European community is still at a distance from achieving the European targets.
The circular economy presents an innovative framework that challenges the traditional linear “take–make–dispose” model, aiming to create a regenerative and restorative economic system [11,12]. However, the application of the circular economy in the agricultural sector involves unique aspects and specific challenges, and, although the circular economy provides a suitable framework for achieving sustainability goals, measuring the progress in this area is essential for piloting agricultural policies and practices in the right direction [13,14,15].
Circular economy and environmentally friendly agricultural practices are inherently interconnected, representing an essential response to the contemporary challenges regarding sustainability and efficient natural resource management. In a circular system, the resources are designed to be reused, recovered, repaired, and recycled for the minimization of generated waste and reducing the environmental impact. In the context of the agriculture sector, this principle takes the form of the conservation of natural resources, such as water and soil, the recycling and recovery of nutrient substances, and sustainable energy use [16,17].
The application of the circular economy concept to agriculture represents a paradigm shift in how we approach food production, resource management, and sustainability. In a circular agriculture system, the focus is on the conservation and regeneration of natural resources, minimizing generated waste, and promoting resilience [18]. This involves practices such as reducing chemical inputs, the recirculation of nutrients, implementing precision agriculture, and optimizing resource use through techniques, like crop rotation and cover cropping [19]. Circular agriculture strongly emphasizes the recycling of organic matter, such as crop residues and animal waste, for improving or maintaining soil fertility, reducing the need for synthetic fertilizers [20]. Additionally, it encourages the use of local food systems, shortening supply chains and reducing transportation-related emissions [21]. Overall, the circular economy’s application to agriculture aligns with the urgent need for more sustainable and environmentally friendly farming practices, ensuring that agriculture not only meets the needs of the present, but also preserves the resources and ecosystems essential for future generations.
In this sense, the present paper explores how the circular economy can be measured and evaluated in the agriculture sector, highlighting the importance of indicators and metrics for monitoring the progress towards a more sustainable and circular agricultural system.
In the context of exploring how circularity can be measured and evaluated in the agricultural sector in order to promote sustainability and efficient resource management, this study aims to address the following research points:
- (1)
- The evolution of research interests across the years;
- (2)
- Who the countries, organizations, and authors are that have worked towards setting up a framework for the evaluation of circular agriculture;
- (3)
- The thematic axes that have been established, their evolution, and the updated reference framework.
The principal scope of this paper is the collection of the research data published in scientific and non-scientific databases, to analyze the defining characteristics of applying the circular economy concept to agriculture and to create a reference framework for both researchers and stakeholders interested in the approach of the circular economy for practical applications in agriculture. The investigation of the literature allows us to analyze the studies and reports that address the framework for the evaluation of the circular economy in agriculture with different approaches.
Through an initial bibliometric analysis and an exhaustive review of the scientific literature, we aim to provide a clear perspective on the current state of the research in the field of measuring circularity in agriculture, laying the groundwork for the future development of effective strategies for implementing circularity in this vital sector.
2. Materials and Methods
2.1. Research Methodology
The research methodologies of this study was the following:
- Using the Web of Science database to reveal statistical information related to the framework evaluation of circular agriculture literature;
- Creating a graphical representation of the data for a general user-friendly visual overview;
- Presenting a thematic map of the research areas of the selected documents that are helpful for mapping a literature matrix;
- Scanning framework evaluation of circular agriculture literature matrix by analyzing the abstracts, keywords, key findings, and concluding remarks to properly filter and retain for further in depth analyses only the short-listed papers;
- Comprehensively review the remaining papers and add several other documents obtained by the snowball technique.
To fulfill our scope, we used the Web of Science database to perform a bibliometric analysis by searching for the terms to conduct the study in the fields of circular economy and agriculture. The bibliometric analysis was based on mathematical and statistical methods for evaluating the bibliometric data. By employing this research method, efforts were made to understand the connections between countries and authors for the studies, including the reference frameworks for tools and instruments for the evaluation and monitoring of circular agriculture development.
Biblioshiny, a graphical web interface based on Bibliometrix 3.0 [22], was run in the rStudio package (https://RStudio.com (accessed on 31 August 2023)) to analyze the WoS records. Thematic maps generated in Biblioshiny were important tools when analyzing the importance and development of the research topics.
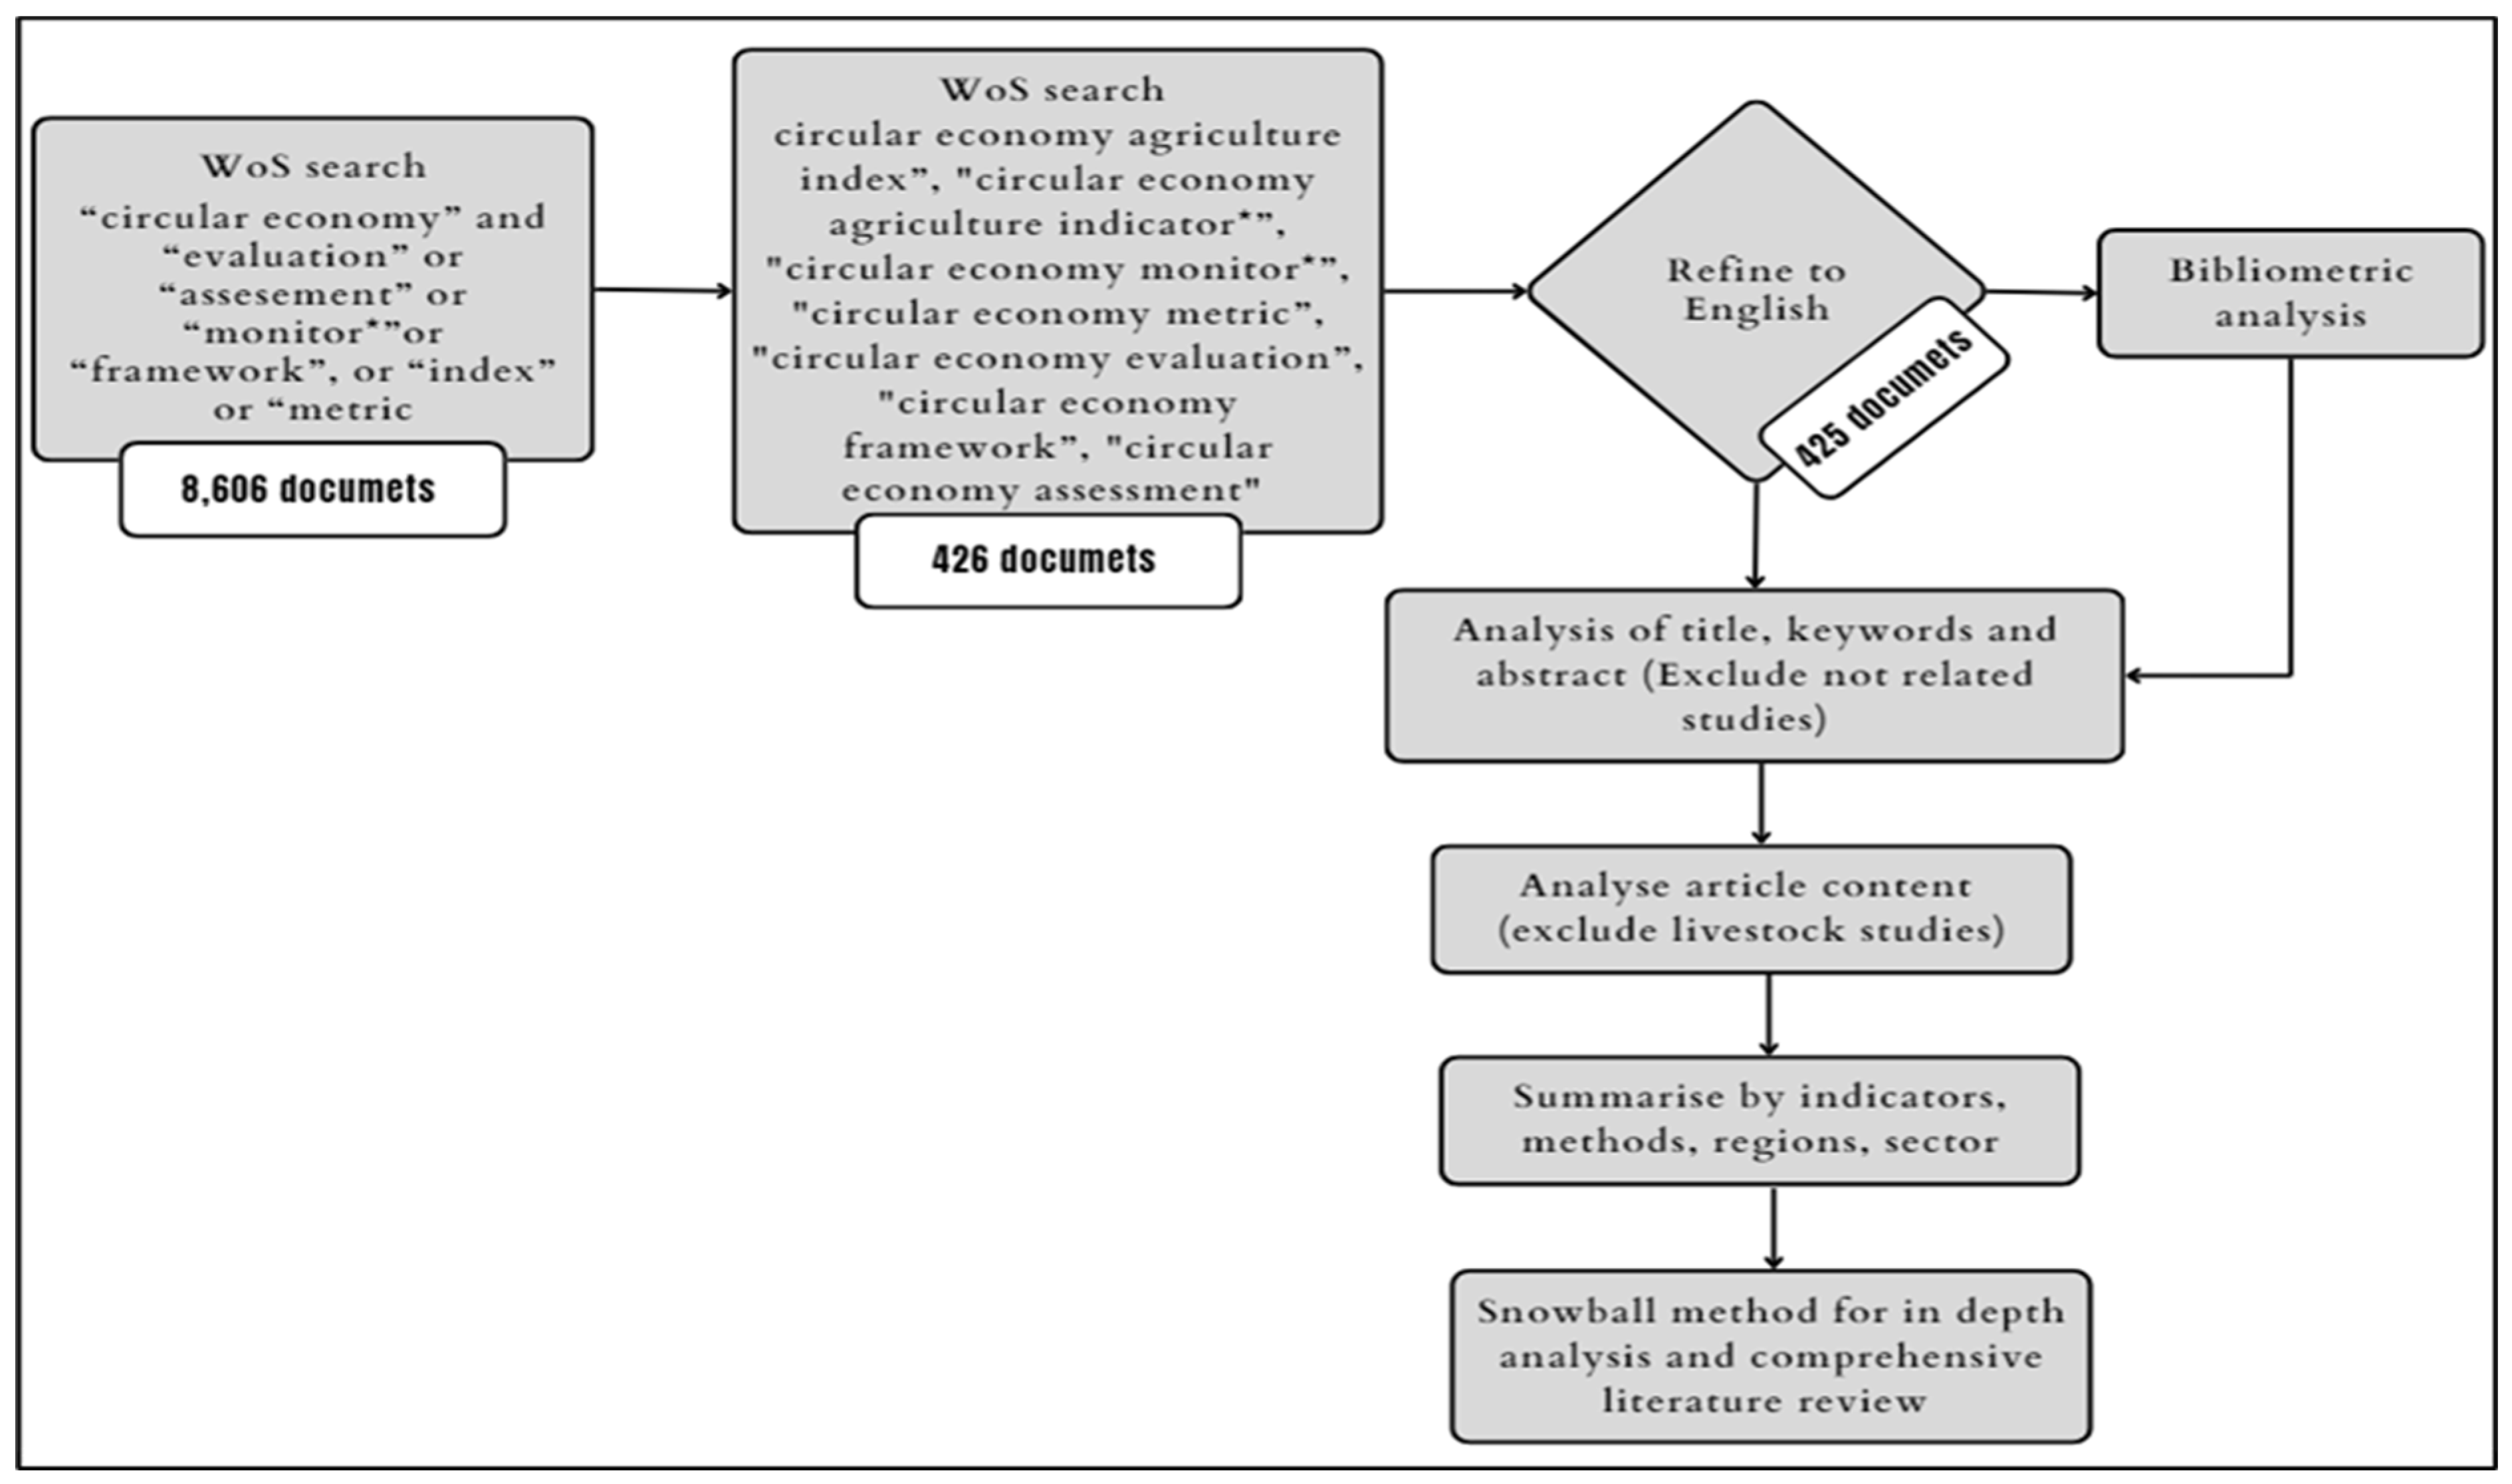
First, to evaluate the overall interest in this topic, the statistics from Web of Science were analyzed. The keyword “circular economy” and variations of evaluation, framework, index, and metric were initially searched. A total number of 8606 papers published during 1991 and 2023 were found.
Subsequently, articles focusing on the CE framework and containing agriculture in their titles, keywords, or abstracts were searched in the Web of Science database. An article search was performed by configuring the “Topi” field in WoS, which filtered the search based on the titles, abstracts, authors, keywords, and keywords plus. The search string was set to “circular economy agriculture index”, “circular economy agriculture indicator *”, “circular economy monitor *”, “circular economy metric”, “circular economy evaluation”, “circular economy framework”, and “circular economy assessment”.
This search equation returned 425 studies in the English language, which were taken into account for the identification of the studies that best served the aim of this comprehensive study. Biblioshiny from the Bibliometrics R package was used for the graphical presentation and mapping of documents for further analyses [22] (Figure 1).
2.2. Literature Review
A review of the scientific literature was conducted to define the framework for implementing the circular economy (CE) in the agricultural sector and to identify the indicators and methods for assessing circular processes applicable to the agricultural system.
The literature review aimed to examine the differences in the monitoring circularity of the agricultural sector and involved a subset of the papers included in the bibliometric analysis. Therefore, the final step of the study’s methodology focused on a qualitative analysis through a comprehensive review of the literature published in English, which consisted of identifying all the publications related to circular agriculture assessments.
The search for scientific articles focusing on the CE and agriculture sector was followed by the “snowball” or “reference chain” technique. This method implies collecting additional data and building up a conceptual framework with documents, reports, and data from sources other than the initial search platform.
The focus was on the implementation of the CE in the agricultural system, expanding the bibliographic analysis by considering documents that proposed or analyzed the indicators for measuring the restorative capacity in the agricultural sector. The results used for the bibliometric analysis were re-examined to identify the documents that contributed to the CE framework applied to the agricultural system. For a document to be selected for further analysis, it had to include specific circular elements related to the agricultural sector.
The review process involved the evaluation of 425 papers. Based on the abstract and title, we performed a selection of 45 papers that were related to agriculture. The studies that were excluded did not tackle the quantification of circularity, or they exhibited a significant overlap with articles already included in the review.
Furthermore, the articles dealing with the livestock sector or mainly food sector were eliminated, as they were out of our study scope. Following this step, 29 documents were considered for further analyses.
The retained documents were further screened by teams of two persons in order to enhance the reliability. The findings were summarized in a database, considering aspects such as the research objectives, methods, scope regarding the industry sector, and regional coverage.
3. Results and Discussion
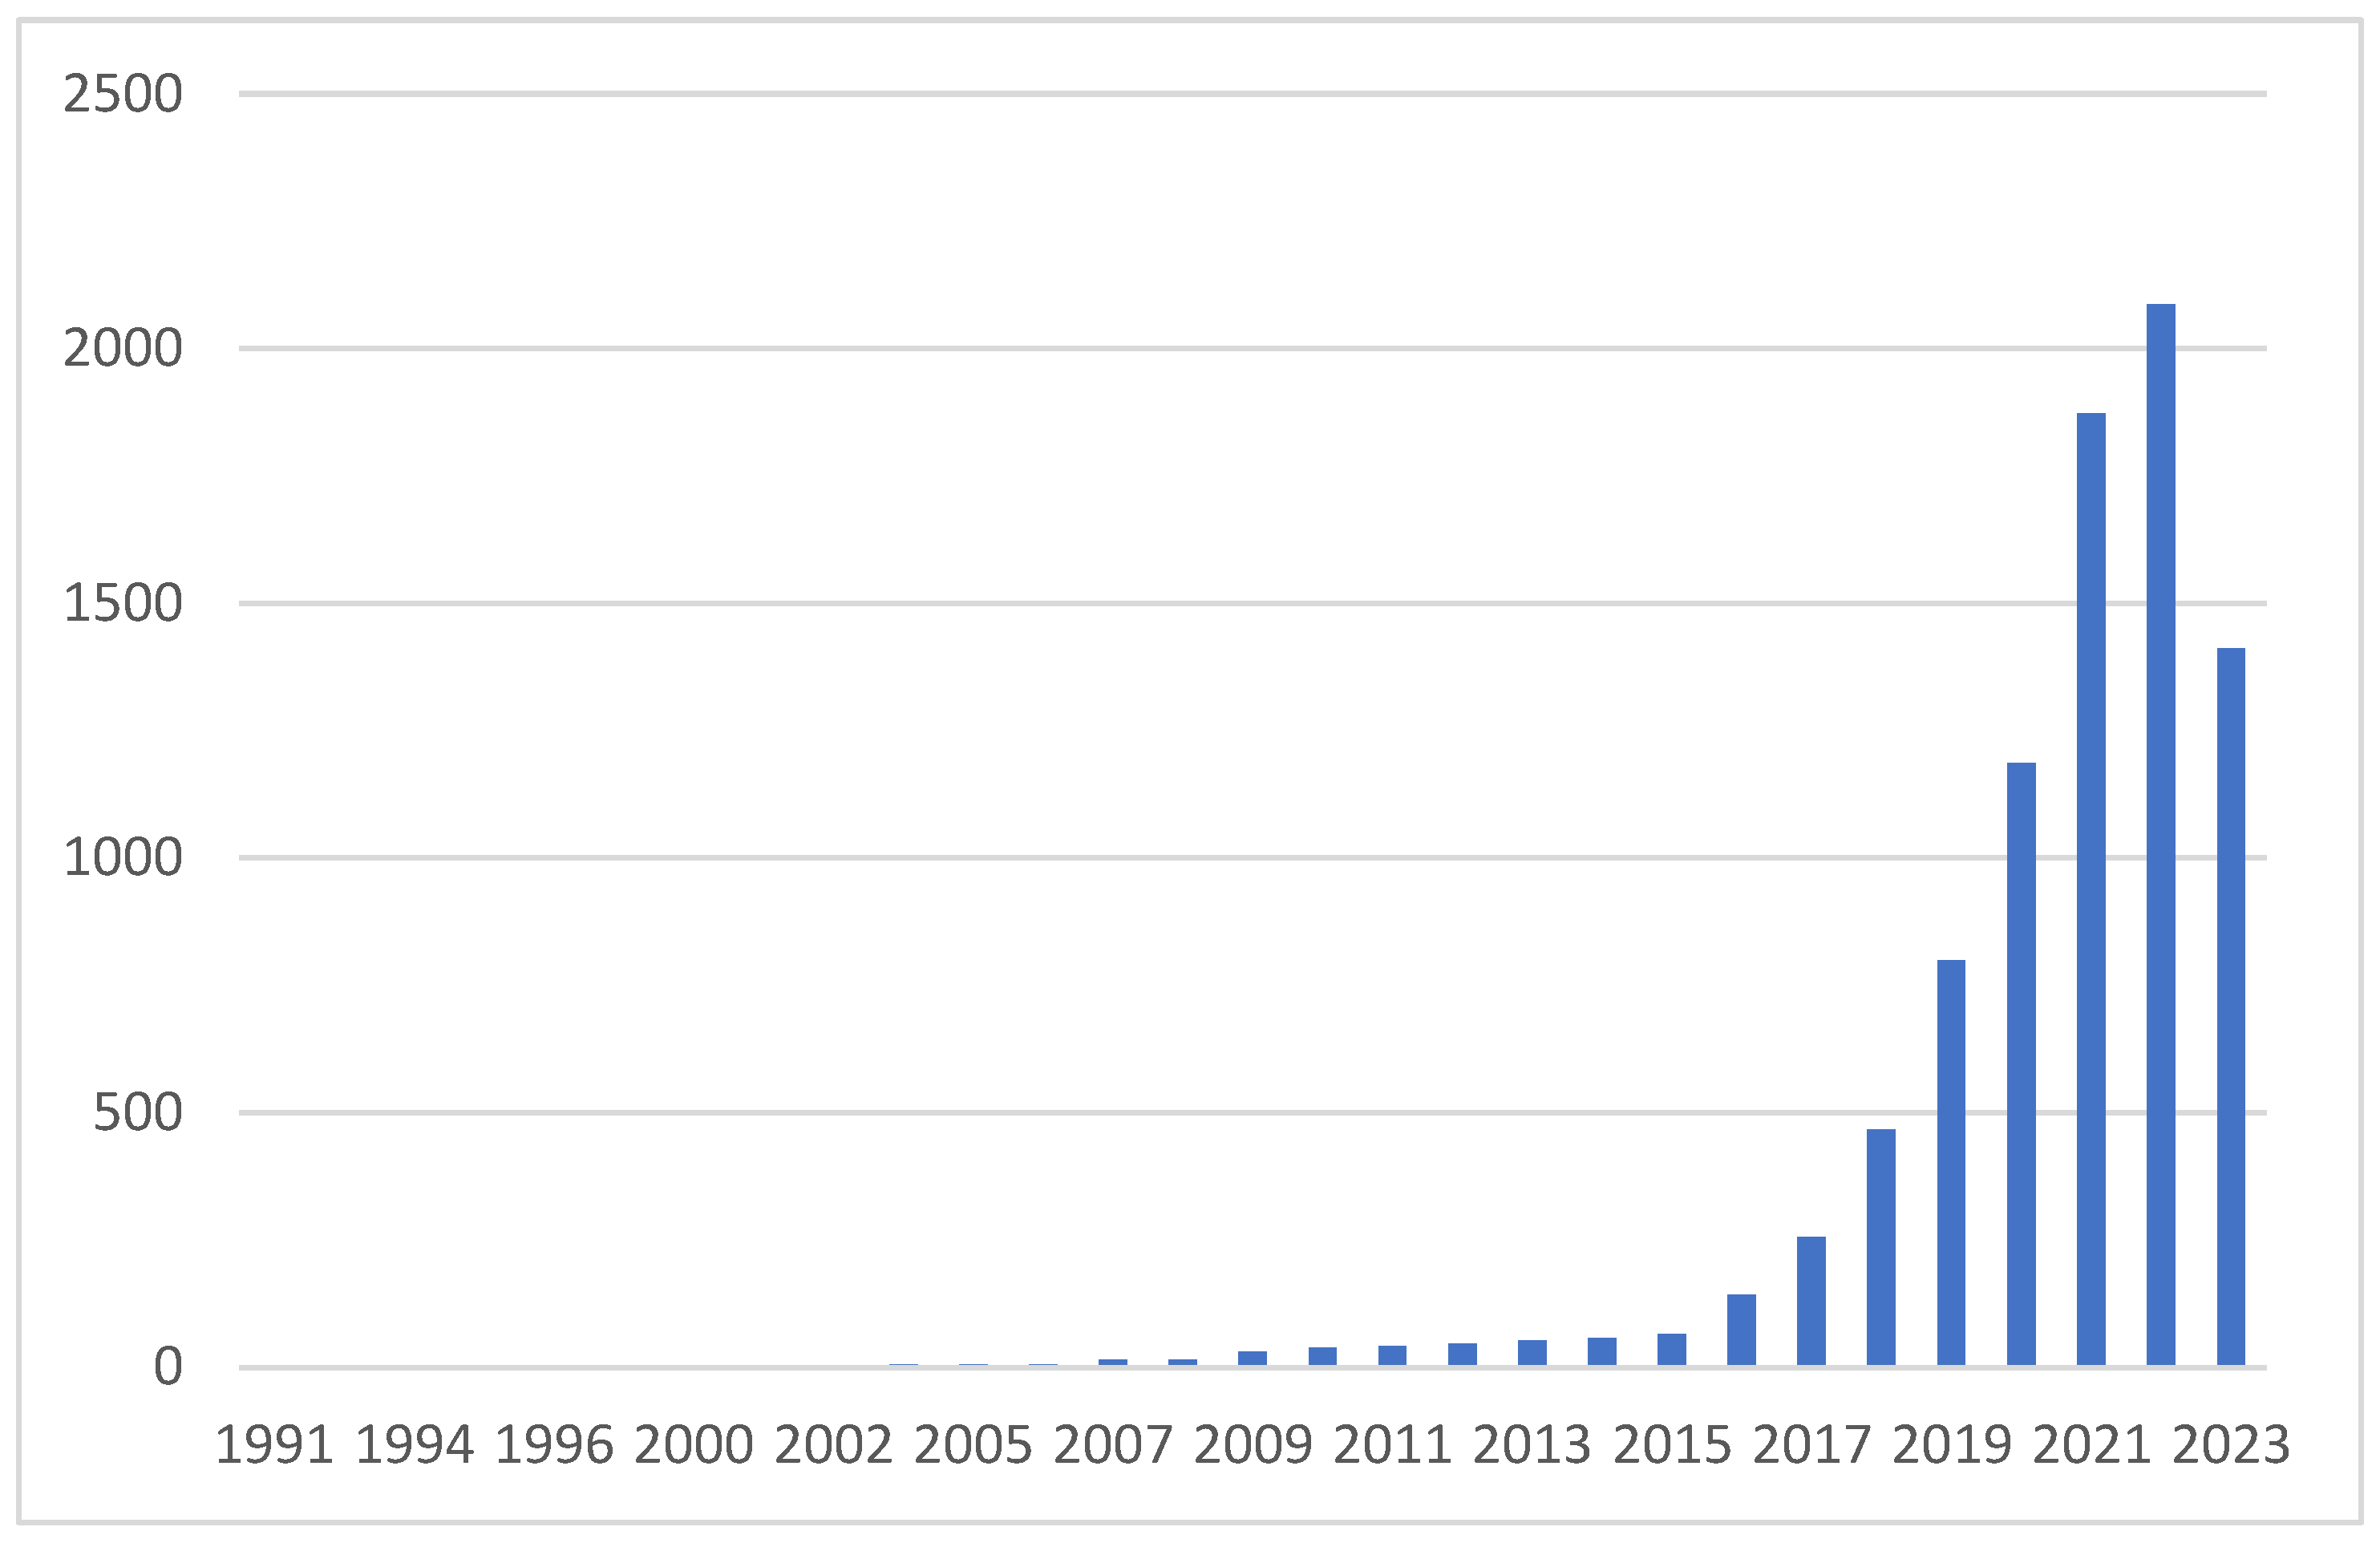
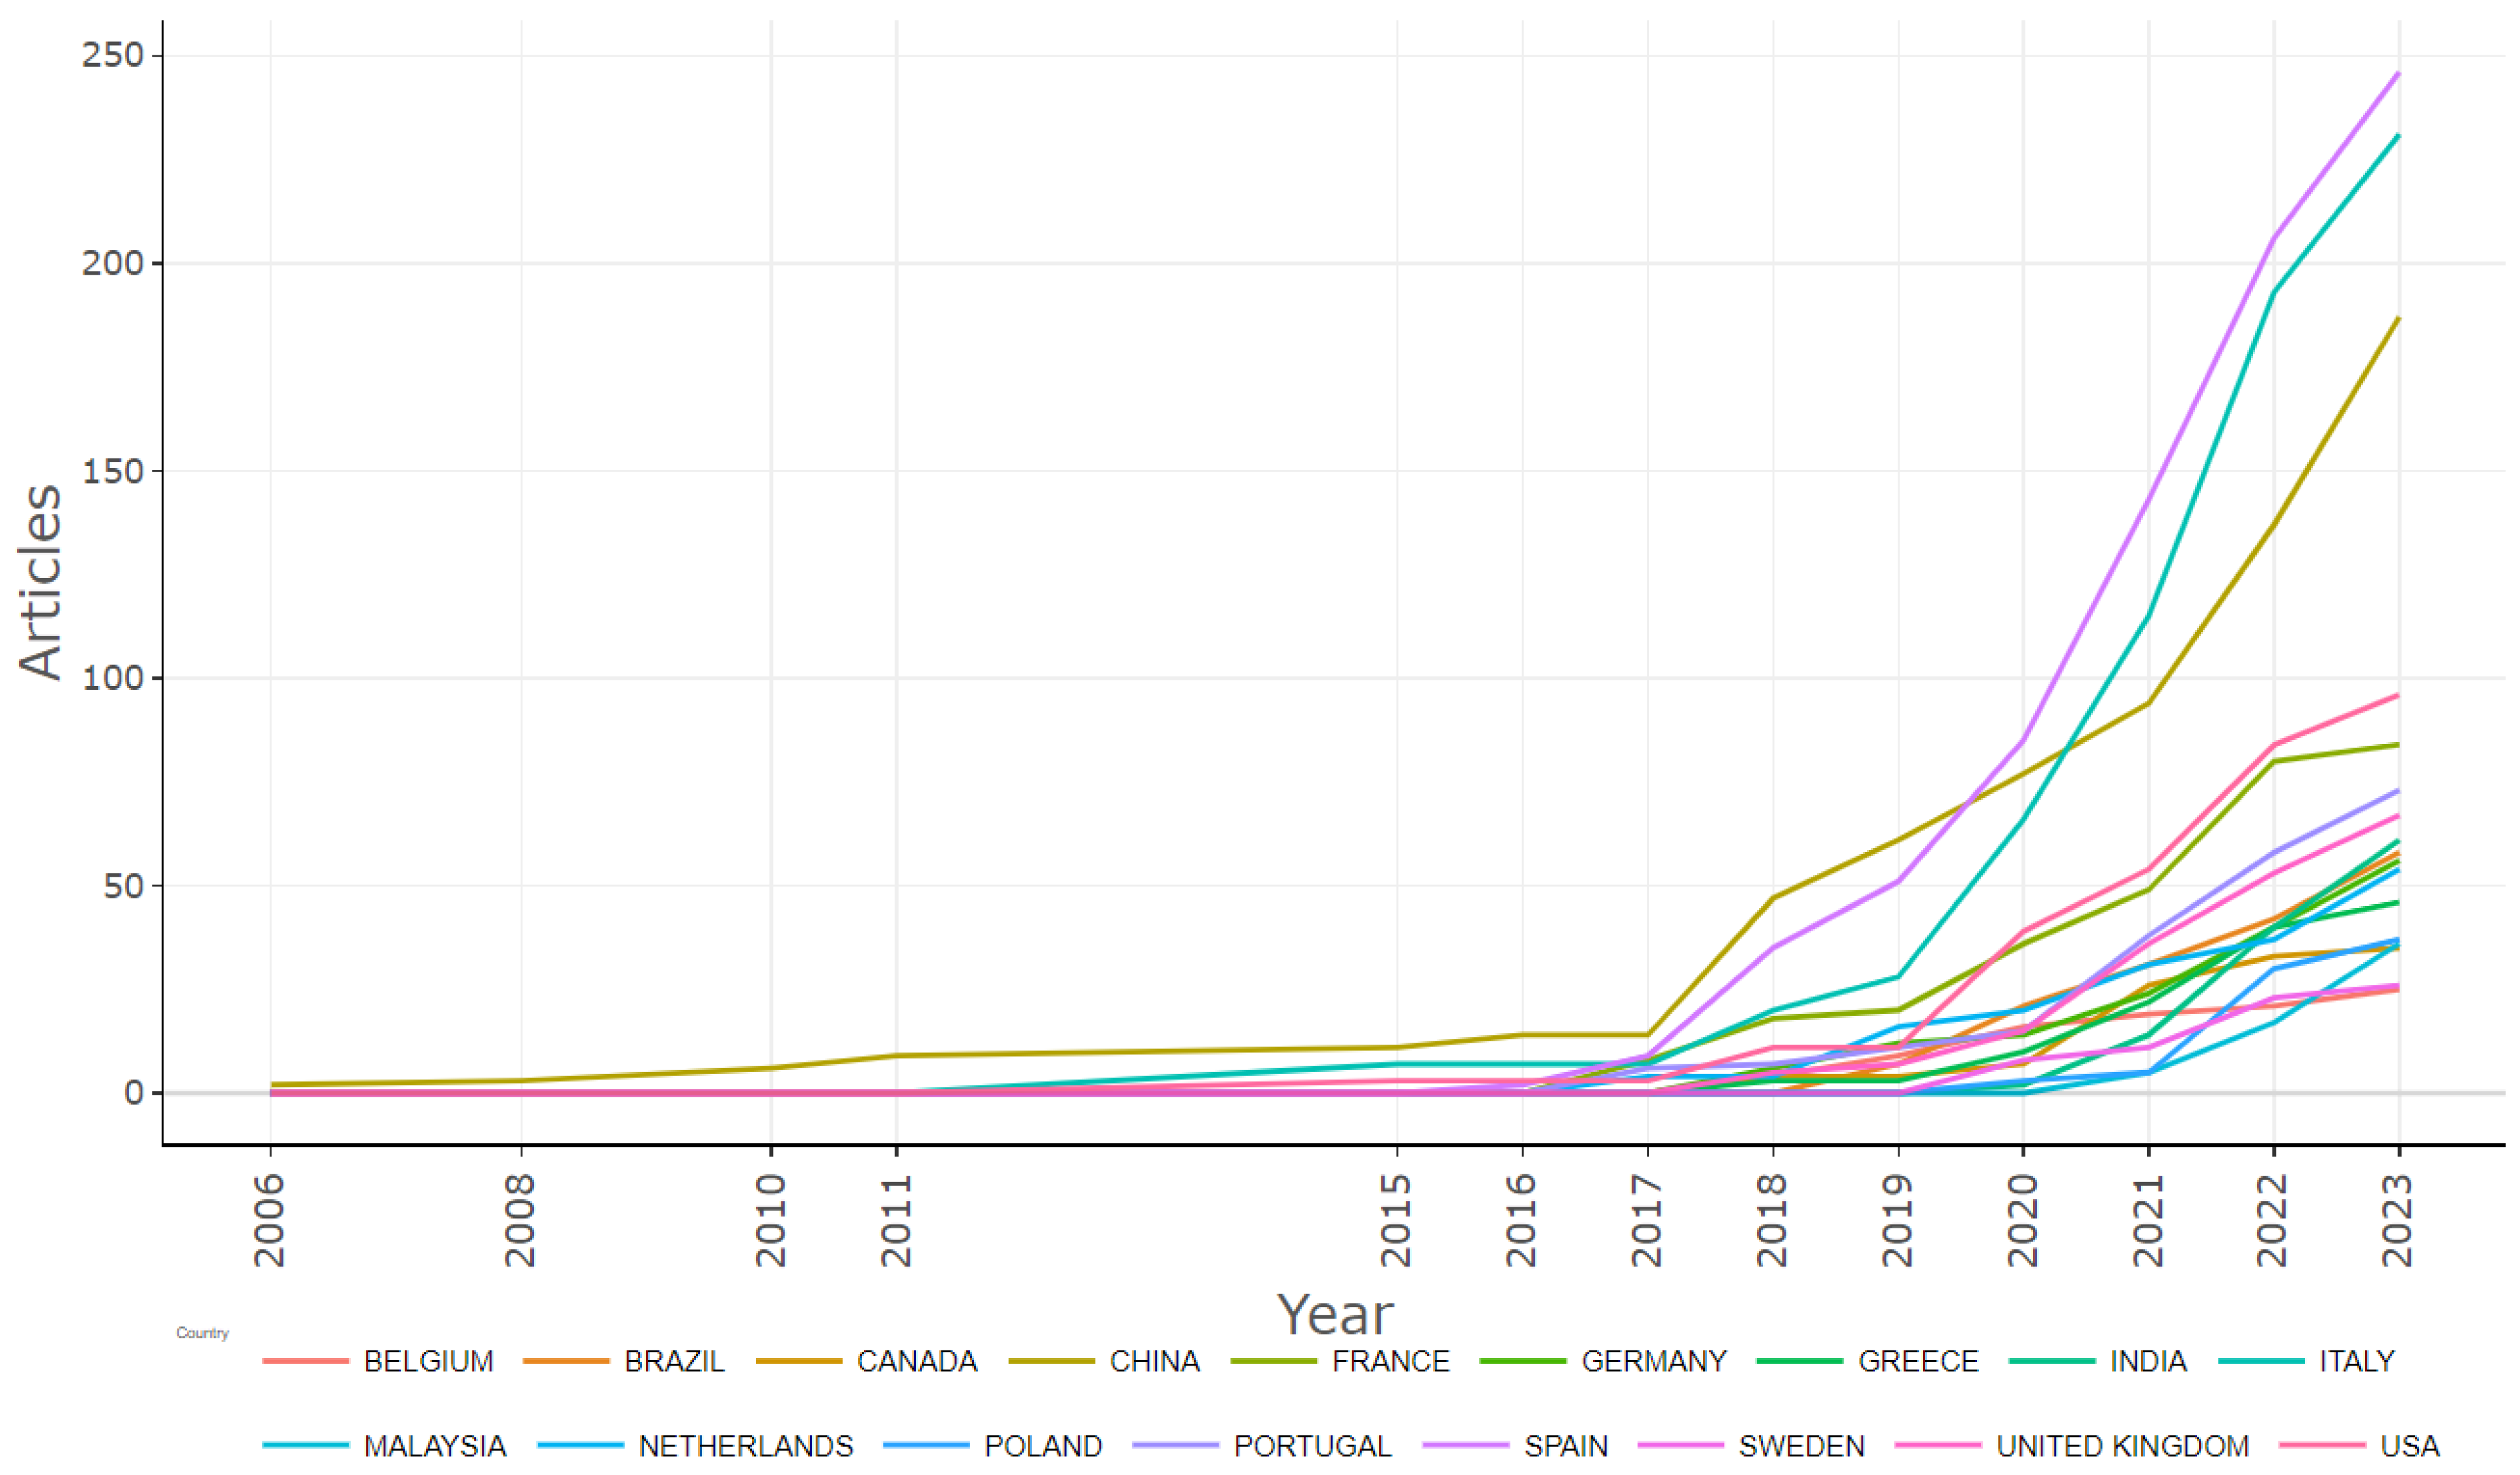
As can be observed in Figure 2, the interest in the topic of the circular economy is constantly increasing, starting with the year 2016.
From 2006 to 2023, 425 documents related to the circular economy framework for agriculture were compiled in the WoS Core Collections database. The documents were obtained from 194 sources, using 1359 keywords plus and 1595 author’s keywords. A total number of 1814 authors contributed to the development of the knowledge in the field. The resulting collaboration index (4.46), indicated a high degree of collaboration among the retrieved publications. The document-to-author ratio was 4.27, this being translated into the fact that, on average, approximately 4–5 authors collaborated on a document (Table 1).
3.1. The Evolution of Research Interests across the Years
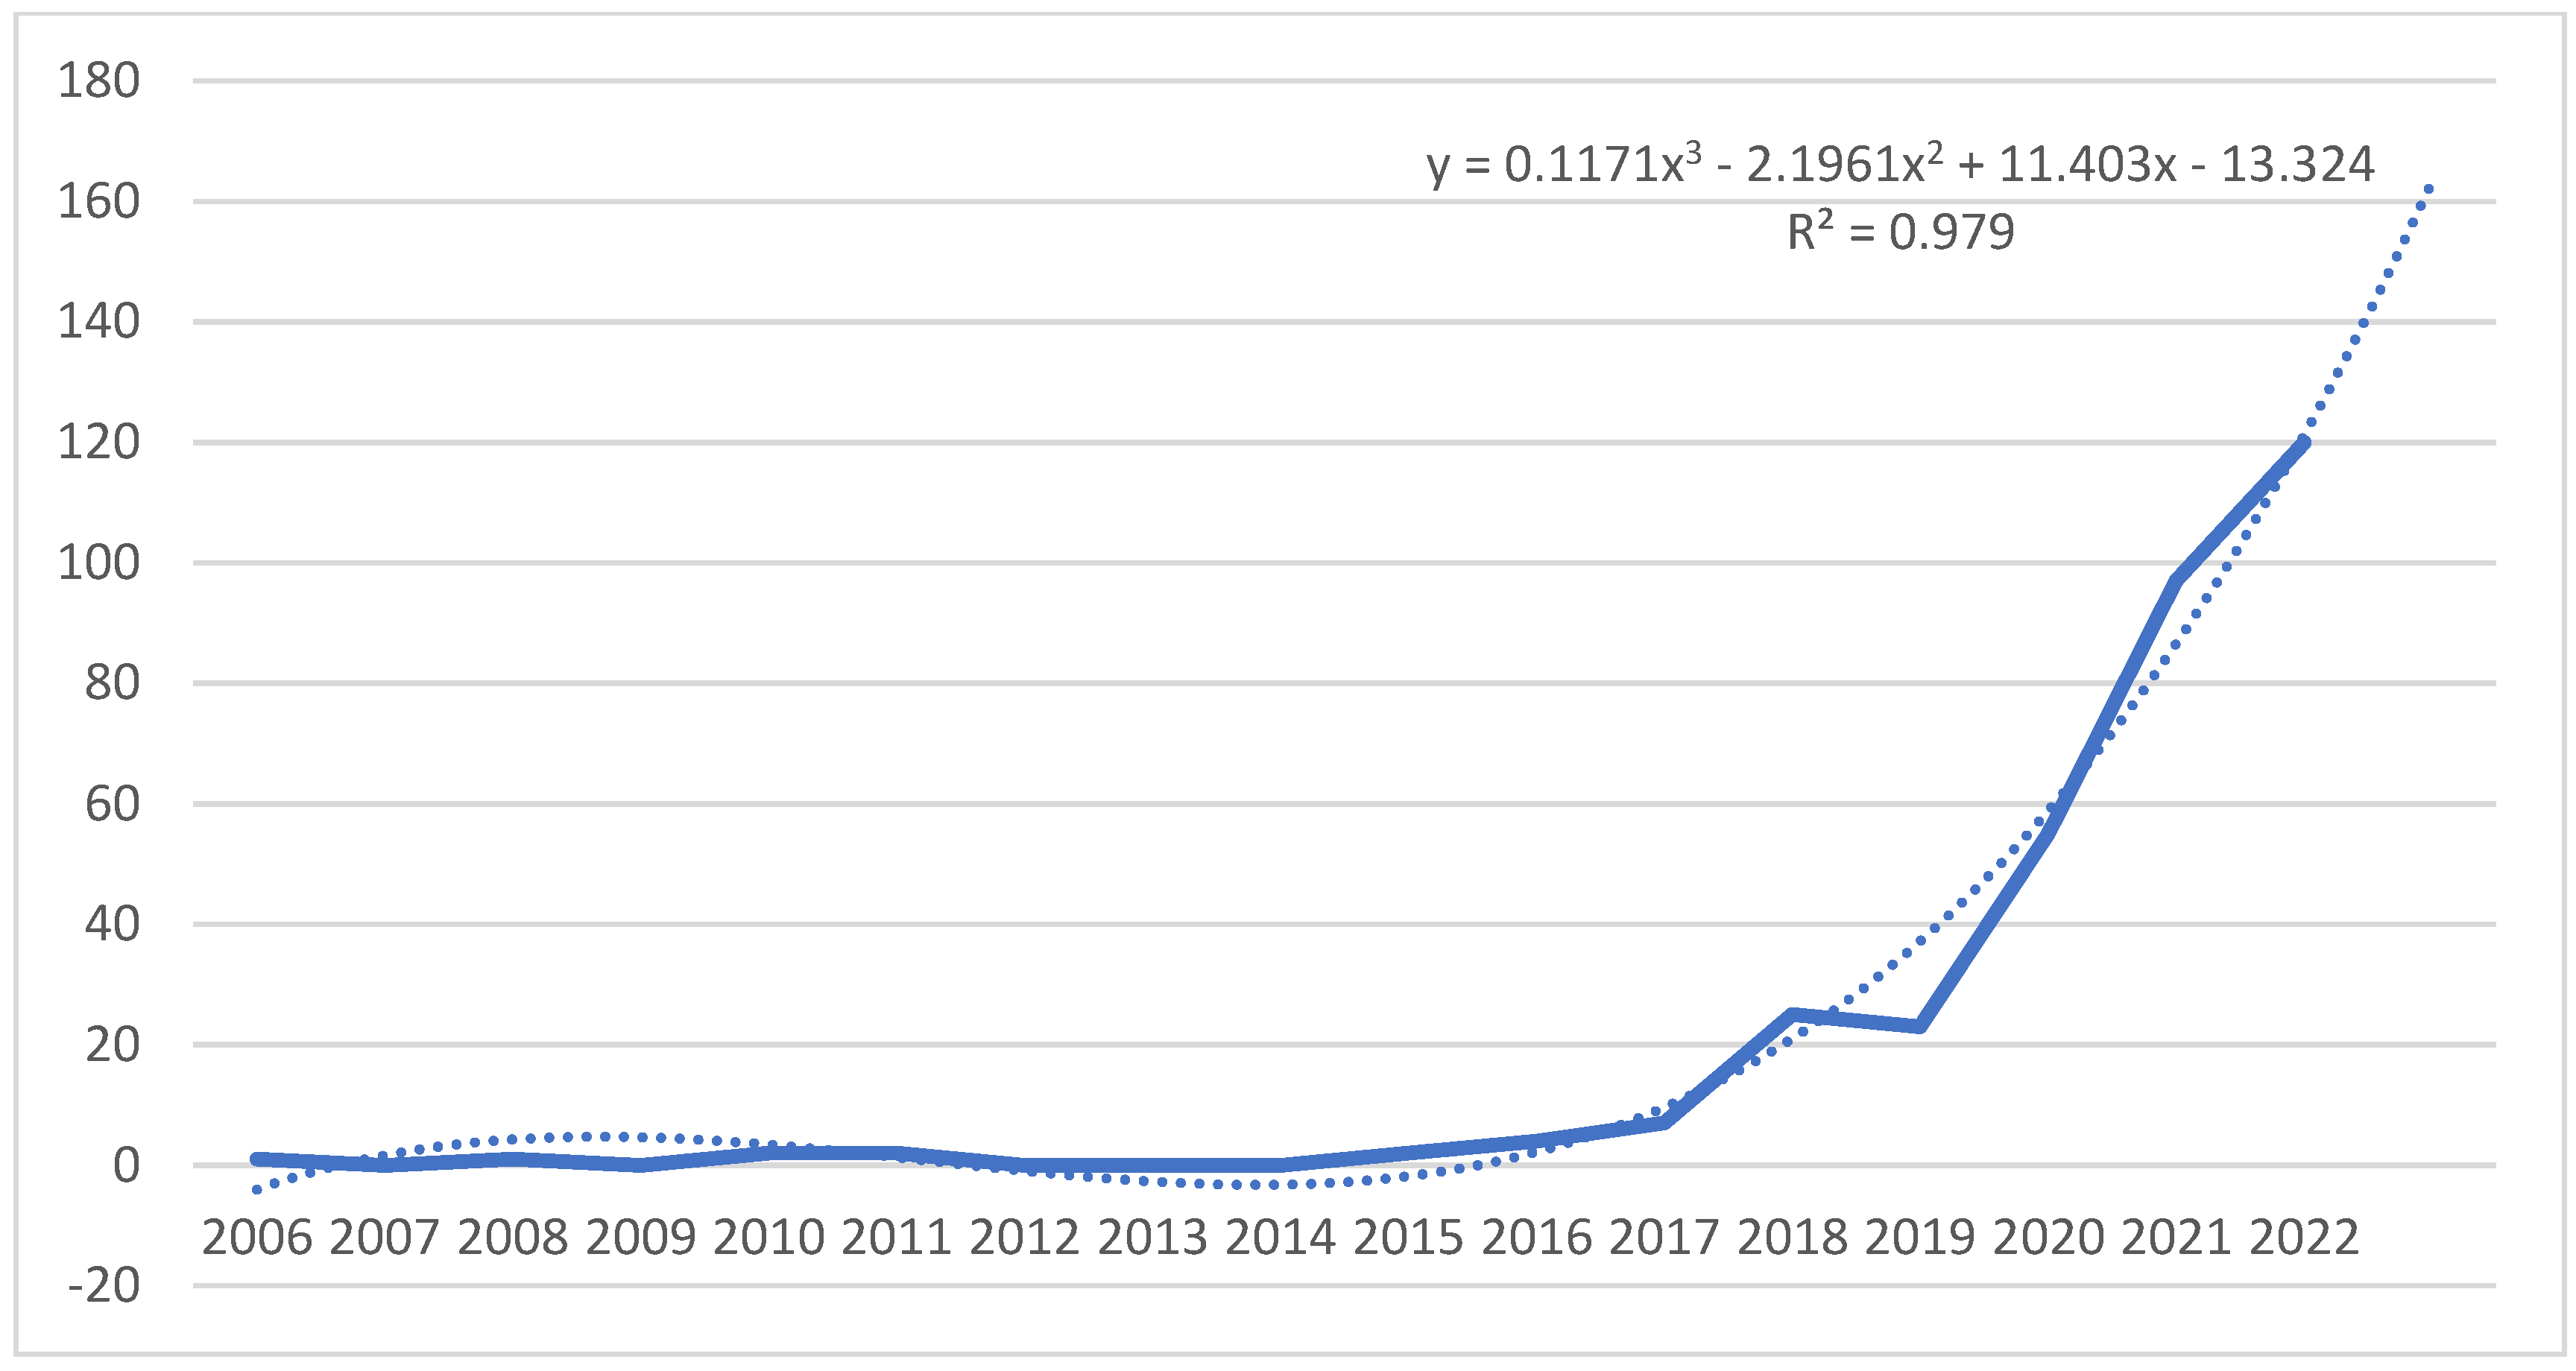
Figure 3 shows the annual production rates and citations of the CE framework in peer-reviewed documents. The scientific interest was limited until 2015, but evolved over time, with an increased rate starting in 2016. Before 2018, the average annual growth rate was 23.6%. Over the last 4 years, an exponential growth rate can be observed. The growth curve can be fitted into the third-order equation (dashed line in Figure 3) y = 0.1171x3 − 2.1961x2 + 11.403x − 13.324, R2 = 0.98. Therefore, it can be estimated that the number of publications (solid line in Figure 3) by 2023 will reach 166.
3.2. Countries, Organizations, and Authors That Worked towards Setting up a Framework for the Evaluation of Circular Agriculture
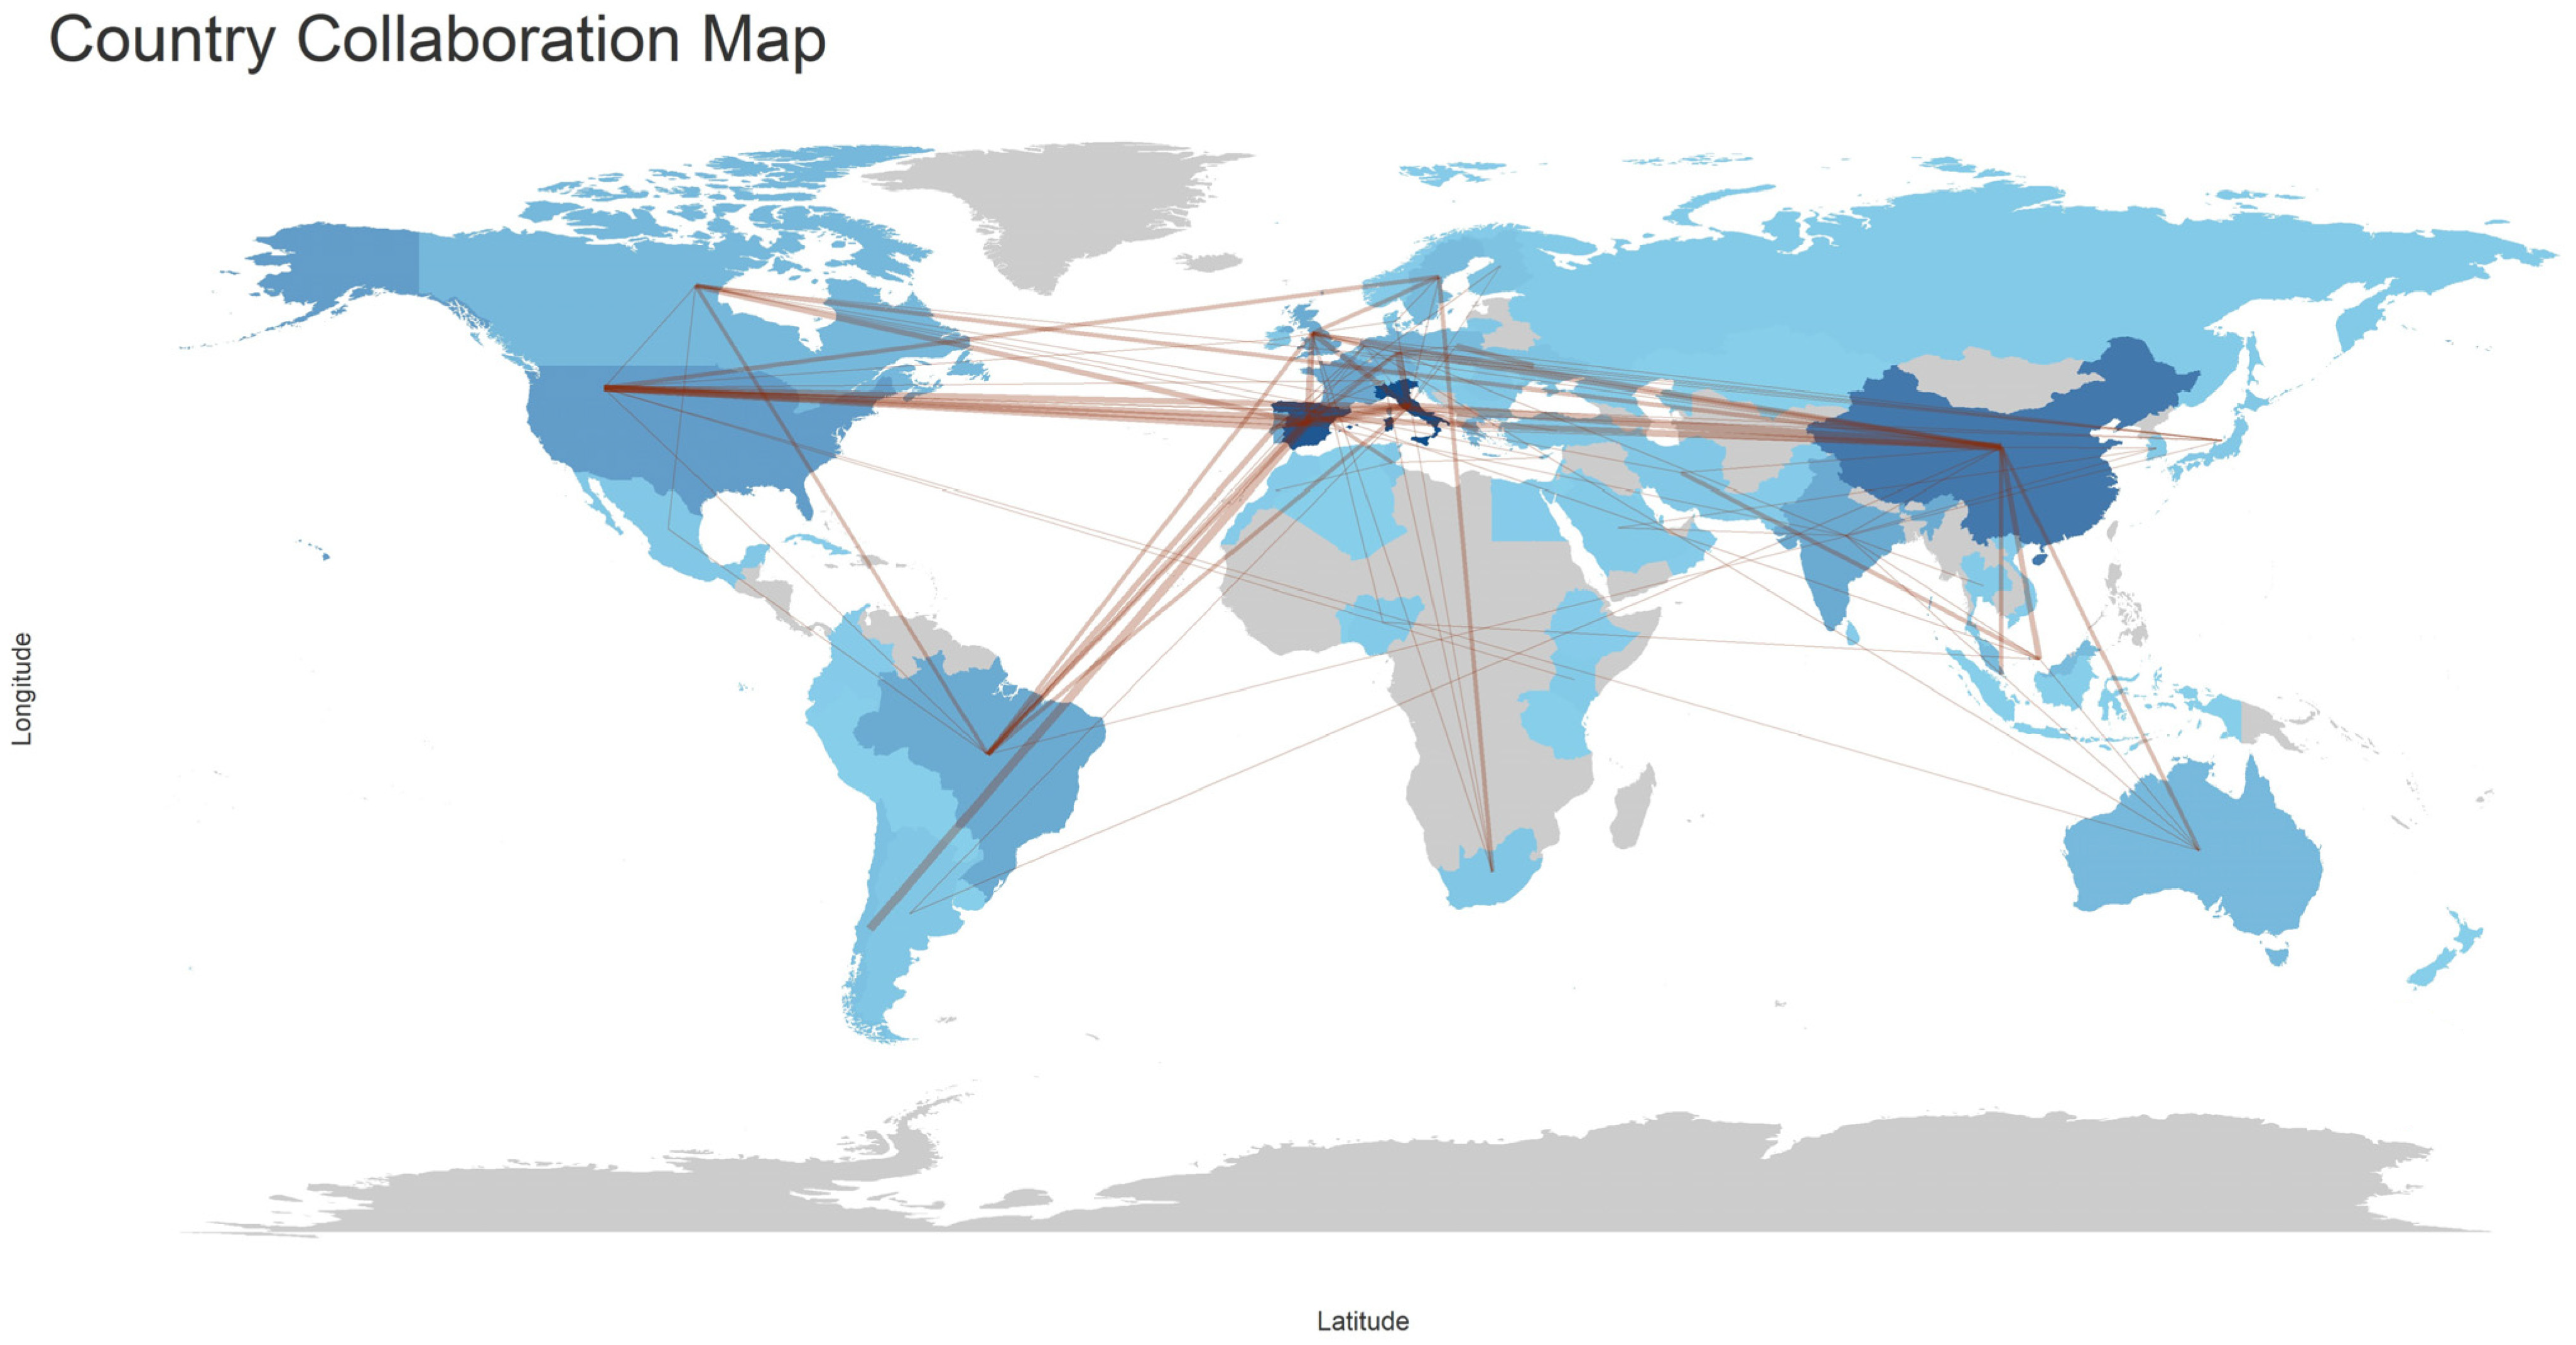
The international research collaboration for setting up a framework for circular agriculture is shown in Figure 4. The number of documents is designated by the intensity of the blue color. The thickness of the brown line indicates the intensity of frequency-based collaborations. The analysis revealed a strong cross-continents collaboration (Figure 3), Italy being the country with the highest cooperation activity (frequency = 70), followed by Spain (Frequency = 64), China (Frequency = 52), the USA (41), and France (38).
The obtained results highlight a significant increase in the production of the scientific literature related to the circular economy framework between the years 2006 and 2023. This increase can be correlated with an increased global awareness of the importance of sustainability and efficient resource management. Until 2015, production was limited, but it increased exponentially in recent years, with an average annual growth rate of 23.6% in 2018, according to the equation-adjusted growth curve observed in Figure 2.
This exponential growth in the circular economy literature corresponds to the trends observed in the existing literature, where the circular economy has become a topic of major interest in the context of sustainable development [23]. In particular, an international research collaboration highlighted the intense cooperation between different countries, with Italy, Spain, and China being the most active in this field. This highlights the importance of transnational collaborations addressing global circularity process issues.
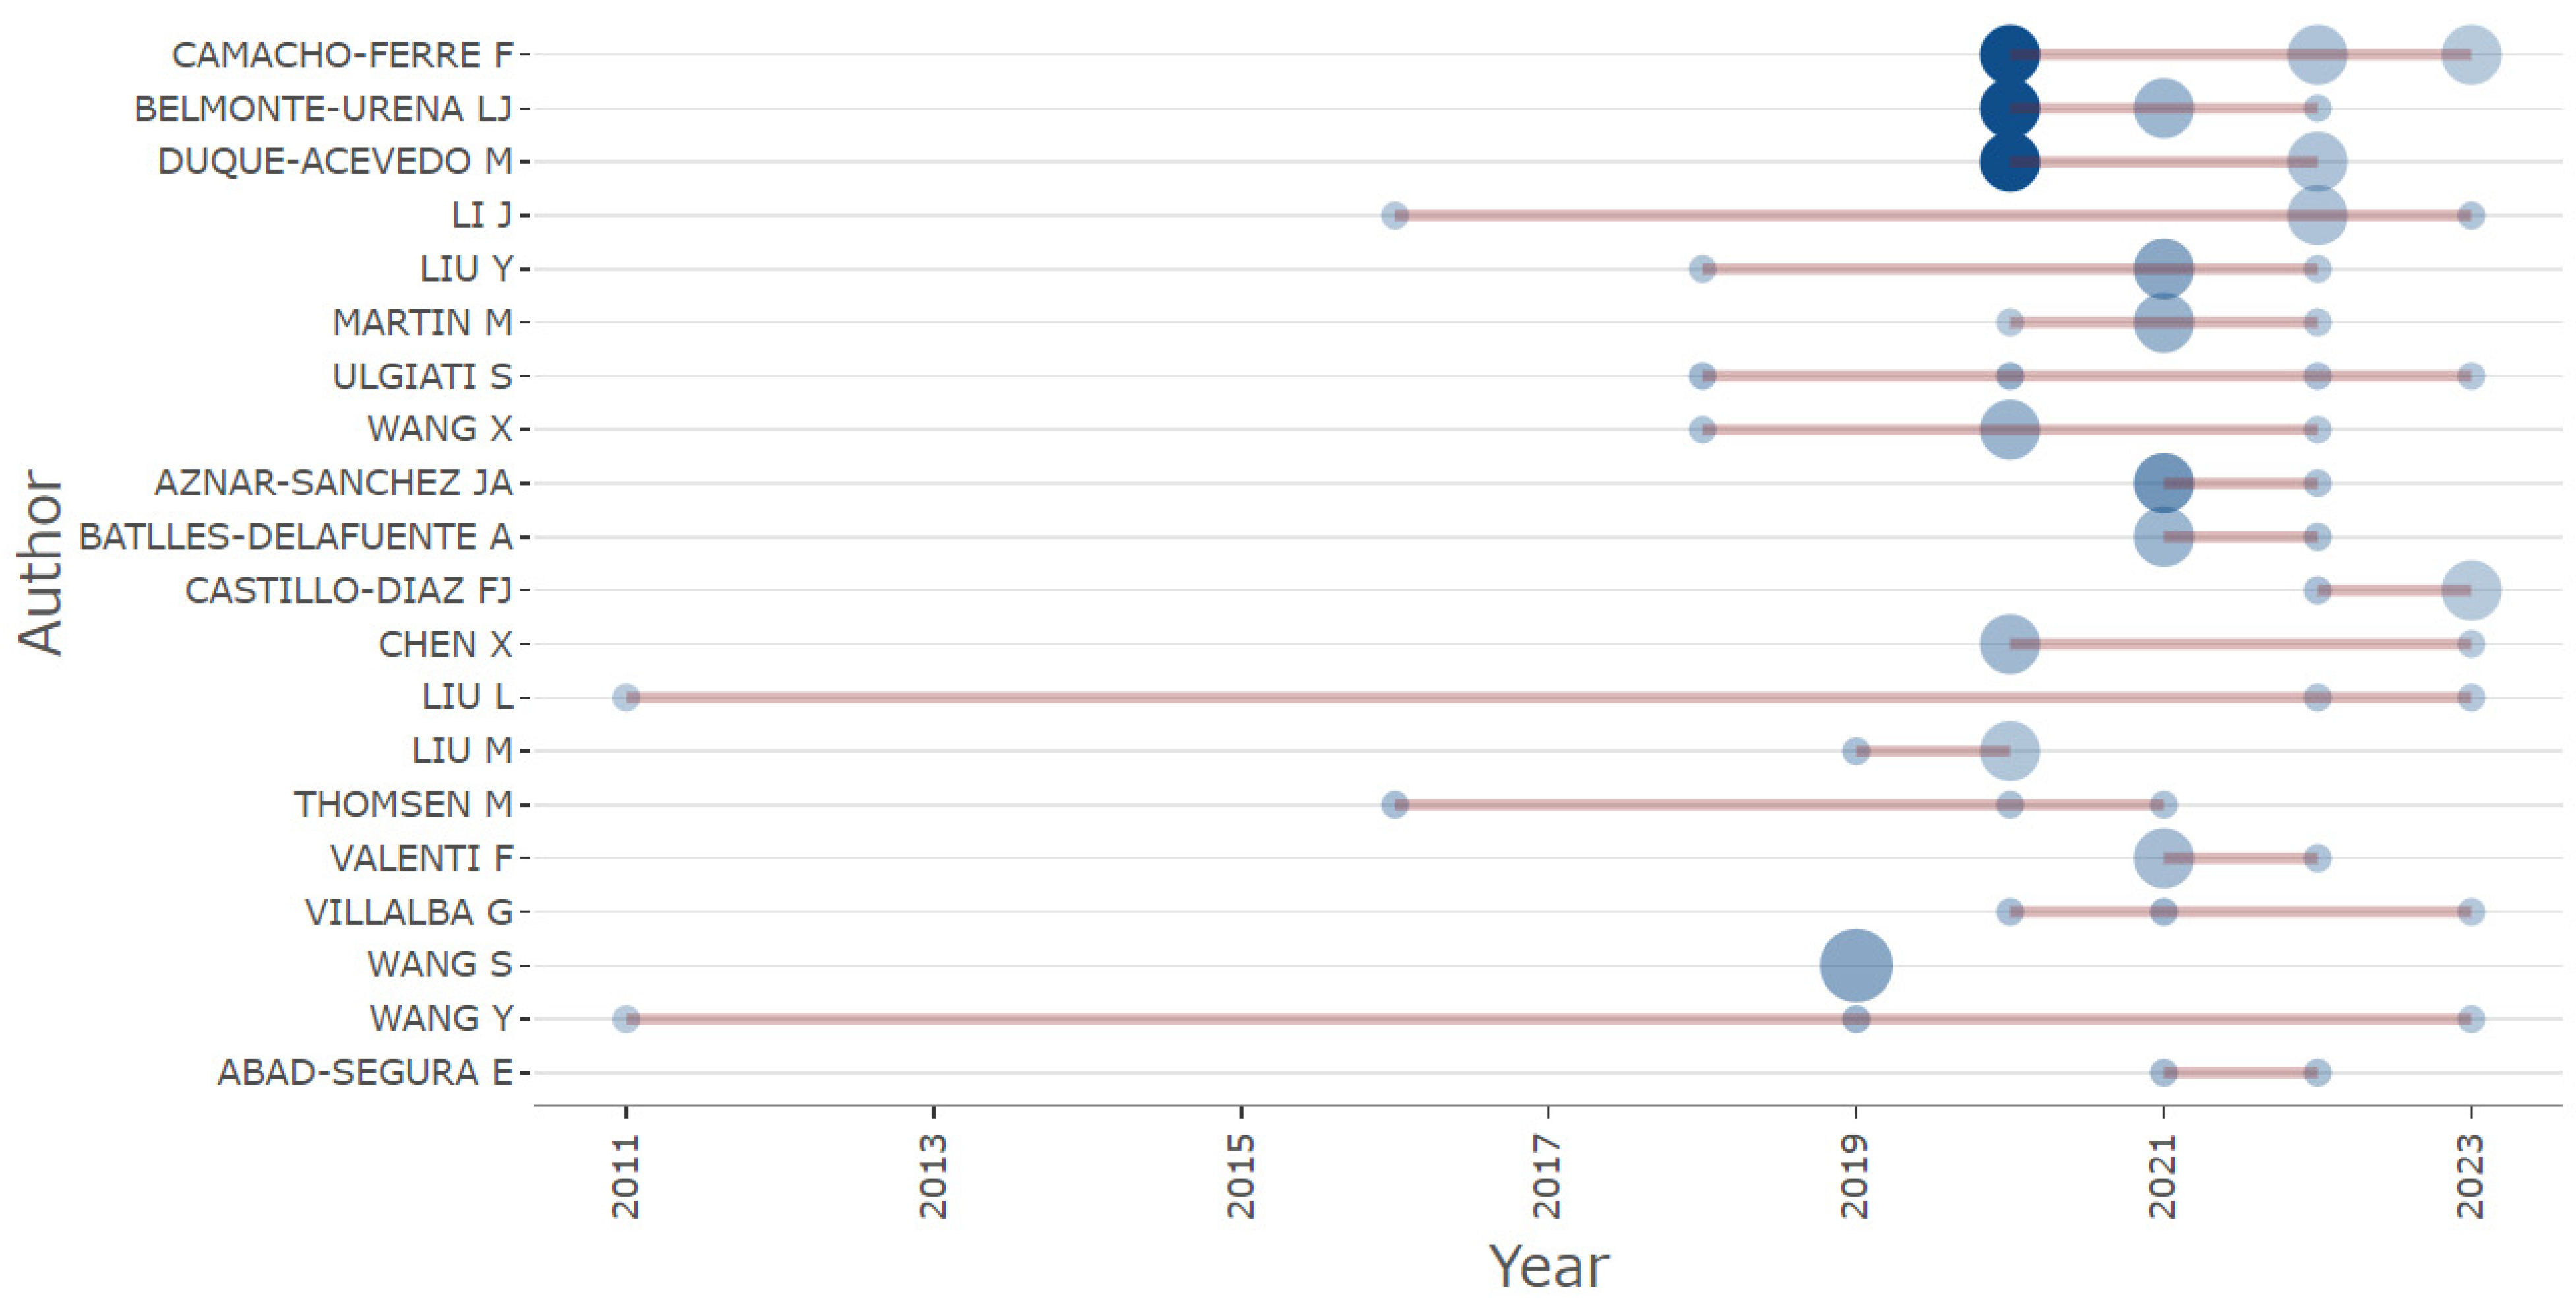
China showed particular interest in the period 2006–2011, a period when most countries were not monitoring circularity in agriculture. As of 2019, Spain and Italy have become the most prolific countries in this field. This may reflect the changes in the national and international research and policy priorities, with an increased focus on sustainable agricultural practices, waste management, and the circular use of resources [24,25].
Although China was the most interested in the subject in the period 2006–2011, when most of the countries did not study the monitoring of circularity in agriculture, beginning with 2019, Spain followed by Italy were the countries who were the most prolific in this area (Figure 5).
Figure 6 presents a chart of the authors who published the most publications during the study period, thus providing a visual representation of the significant contributions to the field of circular farming. The size of the dots reflects the number of articles published by each author, thus indicating their prolificacy in exploring and developing the evaluative framework for circular agriculture. At the same time, the color intensity represents the number of citations per year, providing a measure of the impact and recognition these authors had in the scientific community. The analysis of these authors’ contributions therefore not only highlights their continued efforts in defining and evaluating circularity in the agricultural sector, but also the academic recognition and practical relevance of their research. This chart, by highlighting the key actors and their impacts, contributes to achieving a greater understanding of the evolution of the research and progress in establishing a robust evaluative framework for circular agriculture.
3.3. Thematic Axes Established, Their Evolution, and the Updated Reference Framework
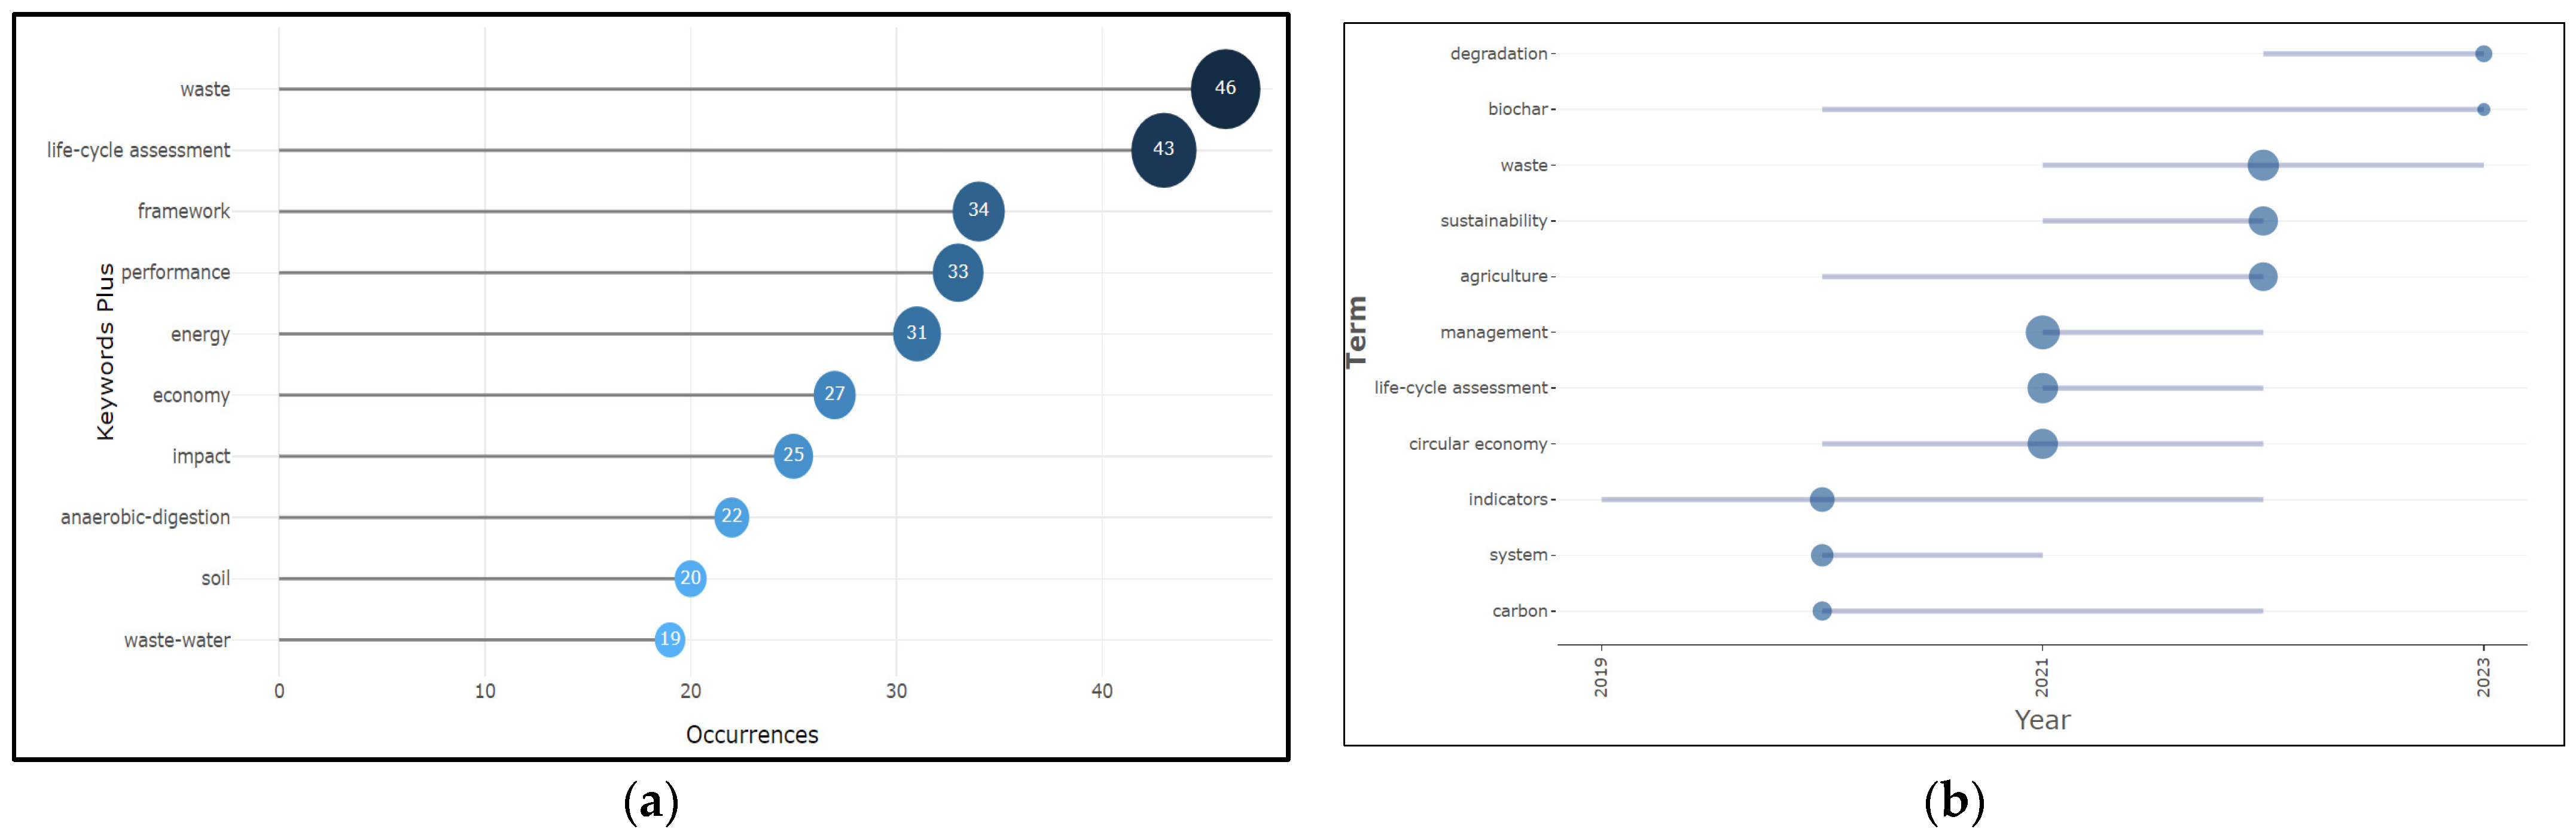
The most frequent topics were related to waste, framework, lifecycle assessment, energy, impact, anaerobic digestion, soil, and wastewater (Figure 7a).
Figure 7b represents the presence of a particular keyword over the studied period of time. The longer the line, the more consistent the subject among the publications. The larger the bullet, the more frequently was the term included in the research publications. This co-occurrence network mapping was used for showcasing the updated contemporary topics and future directions in a specific domain, sorted by topic area and date of publications. It can be seen that, while indicators as a keyword related to the evaluation framework constantly appear in publications in 2019–2023, the latest scientific interest shifts towards degradation processes, waste, and sustainability. Although with the lowest occurrence, biochar remains a constant preoccupation related to circular agriculture. The method for the assessment, represented by the LCA, is also present in the most-used terms.
The analysis of common themes, such as waste management, life cycle assessment, impact, anaerobic digestion, soil, and wastewater, reflect the current concerns in the circular economy. The consistency of certain themes over the years indicates the continued relevance of these topics in CE research [25].
Most of the circularity metrics developed to date have faced criticism for their failure to capture the systemic and multidisciplinary aspects of the circular economy. They tend to solely focus on monitoring the closure of material loops without taking into account the diversity of circular cycles (whether short- or long-term cycles) and the multifaceted aspects of sustainability, encompassing environmental, economic, and social considerations.
A recent study [26] introduced a comprehensive analysis including a classification, categorizing circularity metrics for products and services from the existing literature into two distinct groups.
First, the “Circularity measurement indices” quantifies the degree of circularity in a system by assigning a value on a 0 to 100% scale based on specific attributes (e.g., recycled materials). Second, the “Circularity assessment tool” focuses on assessing the societal impact of circular strategies, categorized as a “CE assessment indicator” (using single or aggregate scores) and “CE assessment framework” (employing multiple adaptable indicators). This review identified and examined recent indicators, revealing seven circularity measurement indices and eight circularity assessment tools. Additionally, the study highlighted other measurement tools better suited for assessing the food system. It monitored tools for the food system, six waste management indicators, seven decision-making processes, and ten exemplary experiences and practices.
In the agriculture sector, Silvesti et al. [27] started from the gaps identified regarding the lack of applied and in-depth studies, regarding the existence of sustainability measurement indicators at the level of the circular economy. The authors emphasized the importance of the cooperation between stakeholders in the supply chain and eco-innovation. Following a bibliometric analysis, the authors classified the sample of articles into three clusters, “LCA Assessment”, “Best practice”, and “Decision making”), showing an increasing trend in terms of the attention given to the three mentioned pillars of sustainability.
Moreover, in another study, the recently published literature on energy-related indicators in the agri-food sector was reviewed to provide a comprehensive overview of the relevant activities and inputs [28]. The main findings of the study were as follows:
- Energy-intensive activities in the agri-food sector were primarily related to the movement of agricultural machinery and transportation.
- Fuel consumption was a key consideration in energy-related analyses, with attention being given to its source, whether it was a fossil fuel or biological in origin.
- The use of clean energy sources was consistently recognized as a critical factor in assessing the sustainability of agri-food production.
These findings underscore the significance of energy-related factors in the agri-food sector and their impacts on environmental decision making for a sustainable future.
Priyadarshini and Abhilash [29] presented a composite index named the circular agriculture and food economy index (CAFEI). The authors’ findings from the CAFEI suggest that efforts to enhance resource efficiency and sustainability are primarily concentrated in high-productivity states, potentially at the expense of environmental quality. It was noted that the CAFEI results were somewhat influenced by variations in the agricultural land area at the state level, which could impact indicators, such as crop yield, electricity consumption, and groundwater extraction. However, the index successfully achieved its goal of compiling a set of indicators suitable for the periodic monitoring of state-level progress in resource efficiency and circularity, offering a quantitative tool for evidence-based policy development. Overall, the study highlighted that the agricultural sector in India continued to prioritize productivity and economic returns, despite some institutional reforms aimed at improving water and energy efficiency outcomes and waste management, as well as enhancing the food-processing capacity.
Nutrients, like nitrogen (N), phosphorus (P), and potassium (K), are crucial elements in agriculture, indispensable for the production of food and ensuring food security. Conversely, the intensive practices of agriculture and the excessive application of fertilizers have significantly disrupted innate nutrient cycles, emerging as a primary factor contributing to the eutrophication of coastal and freshwater ecosystems [30].
A quantitative indicator known as the CLS ratio used to assess how external nitrogen inputs are allocated between soil/crop and livestock components in MC–LS farms was also calculated. This ratio was then linked to nitrogen-use efficiency (NUE), partial nitrogen balance (PNB), and farm income. The analysis revealed that the CLS ratio was a pivotal indicator for characterizing mixed farms, as it was closely associated with farm income, PNB, and NUE at the farm level. Farms with a lower CLS ratio tended to allocate a significant portion of external nitrogen inputs to the livestock rather than crops. Consequently, farms emphasizing a livestock-oriented nitrogen allocation exhibited substantially higher nitrogen input levels (four-to-five-times higher), significantly greater PNBs (more than seven-times higher), and an increased farm income (two-to-four-times higher) compared to farms focusing on crop-oriented nitrogen allocations [31].
A comprehensive approach for crafting indicators using a structured methodology and analytical framework to evaluate the CE at the micro-level within agriculture was introduced by Rukundo et al. [32]. The approach drew from the ECOGRAI method for the indicator development and underwent a validation by experts and end-users through an application in Canadian egg production. A total of 25 performance indicators (PIs) were identified for 11 crucial decision variables in the sector, ultimately providing a practical tool suggesting 14 actions to enhance the economic circularity of egg farms [32].
An economic evaluation was performed to determine the profitability of upgrading an existing biogas plant from Italy, which incorporated vegetable waste from a frozen vegetable production facility, in order to establish a sustainable circular model. The analysis employed the discounted cash-flow method and assessed four key indicators: NPV (net present value), DPBT (discounted payback time), IRR (internal rate of return), and PI (profitability index). The findings emphasize that maintaining the original characteristics of the plant during the upgrading process results in an unprofitable biogas–biomethane chain [33].
The Spanish legislative framework was linked to the topic of circular agriculture, including subjects related to ecosystem restoration. More precisely, a method for designing social indicators for monitoring ecosystem restoration was proposed by Patino et al. [34]. The authors identified the need to include social indicators in the process design for policies and initiatives intended to enhance the transition towards a circular economy and to face the consequent challenges. The results of a quantitative study conducted on 350 respondents, performed before and after the restoration process, were presented [34]. Models encompassing the examination of the circular economy concept are necessary for addressing the social aspect of this concept. This social pillar includes aspects such as human well-being, promoting healthy aging, and ensuring health and social justice [35].
Environmental and energy indicators in the life cycle of olive oil and durum wheat were evaluated by an Italian team for integrating the whole life cycle of agri-food systems from the primary production stage until the end-of-life stage in agreement with the circular economy and EU “farm to fork strategy” frameworks [36]. The indicators were grouped by primary production, both crop production and livestock, shifting towards processing, distribution, retail, and consumption. More specifically, the list included monitoring of the EU CAP indicators, water-quality indicators, and energy use in agriculture. The calculated indicators for Italy confirmed that the EU strategy could be considered as a good starting point for a more sustainable pattern in agri-food systems.
The circular flow tool was introduced by Barros et al. [37]. It aims to identify circular economy opportunities for enhancing organizational competitiveness. The tool assesses an organization’s or system’s circularity level, encompassing material and energy flows as well as the interactions with other entities. The proposed tool can be applied at both process and organizational levels, offering a circularity index ranging from 0% to 100% for evaluating material and energy management practices. Furthermore, the study introduced the online platform agrocirclewins.com.br (accessed on 28 September 2023), applicable across various sectors for assessing the circularity of different systems. This platform generates comprehensive reports with indices and graphics, emphasizing the environmental and economic aspects based on the user-provided data.
One interesting indicator was presented by Cayzer et al. [38], known as the Circular Economy Indicator Prototype (CEIP), which was designed to evaluate the environmental sustainability of products within the context of the circular economy. It comprises a questionnaire featuring 15 questions distributed across five stages of the product’s life cycle, spanning from raw material extraction to end-of-life considerations. The outcomes are generated using an electronic spreadsheet, ultimately yielding an assessment of the product’s environmental performance.
A set of five indicators to measure circularity in the agro-food system were developed and tested in Belgium [39]. The study analyzed the agricultural and food systems by examining nutrient flows across components and assessing soil balances for nitrogen, phosphorous, and potassium at various scales. Different spatial scales (national, regional, and sub-regional) were used to achieve a comprehensive understanding of the agro-food system and utilize the most relevant data. The study suggested that improving circularity in agro-food systems should involve reducing the dependency on imported flows, employing stricter regulations, and adopting a holistic approach that connects the food system to the local landscape and population for tighter nutrient loops [39].
Considering that the studies analyzing the influence of the revitalization strategy on the overall efficiency of China’s agricultural circular economy are rather limited, Guo et al. measured and assessed the efficiency of China’s agricultural circular economy under the rural revitalization strategy and analyzed its development trend. The study employed the data envelopment analysis (DEA) method to assess the efficiency of the circular economy in agriculture. In this analysis, the dependent variable was derived from the DEA method, while the independent variables encompassed factors associated with the rural revitalization strategy. These included variables such as the Degree of Financial Support for Agriculture, Degree of Agribusiness Development, Percentage of Rural Population, Degree of Energy Support, Degree of Water Infrastructure Support, and Degree of Informatization. To explore the correlation between these policies and the efficiency of the agricultural circular economy, a Tobit regression model was applied. Furthermore, the DEA–Malmquist method was utilized to calculate the index model of the agricultural circular economy across China’s 31 provinces [40].
An analysis of Xingyuan Fuqing’s circular agriculture company in China evaluated their current status, identified the existing issues, and proposed improvements through a sensitivity analysis [41]. The study used the LCA method to quantify and compare the environmental pressure of circular agriculture on the pig-farming model. Key elements that restricted the development of the circular agriculture model were identified by a sensitivity analysis. The authors stated that circular agriculture did not achieve zero emissions; however, it offered environmental and economic advantages over the traditional methods [41]. Three types of indicators were used for the assessment of the environmental load created by the industry chains of circular agriculture, such as (i) total raw material or resource consumption levels—abiotic resource-depletion potential (ADP) elements and ADP fossil fuels; (ii) atmosphere and water resources—acidification potential (AP), global warming potential (GWP), photochemical ozone-creation potential (POCP), ozone-layer-depletion potential (ODP), and eutrophication potential (EP); and (iii) toxicity, including freshwater aquatic eco-toxicity potential (FAETP), human toxicity potential (HTP), marine aquatic eco-toxicity potential (MAETP), and terrestrial eco-toxicity potential (TETP).
Regarding the methods for circular agriculture monitoring, a systematic literature review was conducted by Romero et al. [42] with the aim of understanding how MCDA was integrated into the LCA in an assessment framework and its utility in the circular bioeconomy transition of agri-food waste biomass. The MCDA/LCA framework showed the integration of different multi-criteria techniques and life cycle tools. The MCDA/LCA framework also supported holistic assessments of sustainability, and the environmental, economic, and social factors were studied together with the technical, business strategy, and governance aspects. Further, the study continued with the synthesis of the literature in order to identify the work methods that can be used and on which sectors they have been applied (Table 2).
3.4. Methods and Indicators Involved in the Circular Agriculture Evaluation
When analyzing the selected literature data, it can be observed that, while developing the circular economy, there is a transformation of the agriculture sector towards circularity. Several authors demonstrated that it was necessary to simultaneously conduct an evaluation on the development level of circular agriculture. From a macro-perspective (city, province, region, or nation), various regions performed different scales and types of circular agriculture practices. The progress and operational status of circular agriculture from the macro-perspective requires a well-structured, consistent, and unified indicator system. From a micro-perspective, the circular economy can be evaluated for how to choose the technology and methods that conform to the principles of circular agriculture development for a demonstration. The relative lower number of studies related to the micro-level perspective indicates that the research on circular agriculture at a micro-level is currently underdeveloped.
3.4.1. Methods for a Macro-Level Assessment
The multi-criteria decision analysis (MCDA) can be useful for advancing the principles of circular agriculture. In the context of circular agriculture, the MCDA serves as a tool for farmers, policymakers, and stakeholders to navigate decision trees involved in transforming traditional agricultural practices into more regenerative and eco-friendly systems. The MCDA allows for a structured assessment of the diverse production factors of agriculture, each with its own set of criteria and objectives. By employing MCDA techniques, stakeholders can weigh the environmental, economic, and social aspects of various agricultural strategies, providing an improved perspective on the consequences of their choices [36,52,53].
The DEA, a mathematical and statistical technique, is used to evaluate the performance of agricultural systems by comparing the inputs (such as land, water, energy, and labor) and outputs (crop yields, waste reduction, and ecological benefits) across farms. The DEA goes beyond simple productivity measures, offering a nuanced understanding of how efficiently resources are utilized within circular agricultural systems [44]. By identifying the inefficiencies and best practices, it helps guide decision makers in optimizing their operations, reducing resource waste, and enhancing the sustainability of their agricultural practices. Additionally, the DEA can highlight areas where innovations and investments are needed, fostering continuous improvements in circular agriculture initiatives [44,54].
Indicators can take the form of either single variables or be derived from a combination of variables, such as a ratio (a value compared to a reference point), an index (a single value generated by merging multiple variables), or the outcome of a sophisticated simulation process.
Macro-level indicators for circular agriculture are tools for assessing and guiding the sustainability and circularity of agricultural practices and systems at regional, national, or global scales [55]. These indicators usually follow the complex interaction between agriculture and the environment, society, and the overall economy ecosystem. Such indicators include resource efficiency, highlighting how efficiently water, energy, land, and natural resources are utilized for agricultural production compared to historical trends [56].
Circular economy metrics measure the extent to which circular principles, such as recycling, reusing, and reducing waste, are integrated into agricultural processes. Ecosystem health indicators measure biodiversity and the vitality of ecosystems within and around agricultural areas, reflecting the impact of farming on the natural world. Carbon neutrality and climate impact metrics evaluate the net carbon emissions from agriculture, including carbon sequestration and the adoption of climate-smart practices. Water management at scale assesses water use efficiency and sustainable practices across regions, safeguarding the water quality in major water bodies affected by agriculture. Supply chain sustainability indicators focus on the adoption of circular and sustainable practices throughout the agricultural supply chain, promoting transparency and traceability. Economic impact indicators measure the contribution of circular agriculture to regional or national GDPs, job creation, and economic development, while the socio-economic benefits evaluate social well-being and livelihood improvements in farming communities. Policy and regulatory alignment indicators assess the existence and effectiveness of policies that promote circular agriculture and their alignment with international sustainability goals [57,58,59,60,61].
3.4.2. Methods Used for a Micro-Level Assessment
After analyzing the retrieved documents, we concluded that multiple authors agreed that the life cycle assessment serves as an excellent tool for evaluating the impacts of the circular economy. The life cycle assessment is an objective process used to evaluate the environmental load related to products, processes, or actions. It analyzes and quantifies the resource consumption and environmental emissions throughout the life cycle of the evaluation object and evaluates the impact of these resource consumption values and environmental emissions. This method focuses on analyzing the impacts of products or actions on the environment and is not suitable for the evaluation of large-scale complex systems. Furthermore, the utilization of LCA-based metrics proves to be particularly effective when assessing CE strategies at a micro-level. In this case, the objective is to scale the circularity of either a product (to evaluate its capacity to maintain both material quantity and quality) or a system (to evaluate a company’s proficiency in implementing circular practices) [27,28,36,52].
System dynamics (SDs) are also valuable tools for evaluating circular agriculture systems. SDs enable the modeling and simulation of complex interactions and feedback loops within the agricultural ecosystem, allowing for a holistic assessment of resource flows, environmental impacts, and economic viability. By creating dynamic models, we can gain insights into how the changes in one aspect of the system, such as nutrient cycling or waste reduction, are able to affect the overall development of circular agriculture practices [62,63,64].
An Emergy analysis is a valuable approach in evaluating circular agriculture systems. The Emergy analysis converts different elements in the ecological economic system into solar energy values, unifies different types of energy that are difficult to compare in ecological or ecological economic systems, and quantitatively analyzes the utilization status of various resource inputs and outputs [36,51]. Emergy represents the solar energy required to produce the considered inputs. This method effectively overcomes the non-additivity of different substances as energy carriers in a traditional analysis method; however, at the same time, there are also problems, such as the energy value conversion rate [51,65,66].
Circular agriculture aims to minimize resource wastage and enhance the use of renewable resources making it particularly well-suited for an emergy analysis. By quantifying the emergy flows within a circular agricultural system, it becomes possible to assess its ecological and economic sustainability comprehensively. This analysis helps in identifying areas where circularity is successfully achieved, such as through efficient nutrient cycling and reduced waste, and highlights the opportunities for further improvements [65,66].
The material flow analysis (MFA) is also an input–output analysis. Its basic principle is the material balance theory [67]. By quantifying the flow and storage conditions of a certain type of substance into and out of a specific system, as well as within the system, the flow and storage conditions are established. The result of this analysis is a quantitative relationship between the economy and environment within a system. The material flow analysis approach for circular agriculture involves quantifying the inputs, such as water, nutrients, seeds, and energy, used in farming operations. By monitoring the resources utilization during crop cultivation, livestock management, and post-harvest processes, farmers can identify areas where circularity can be improved, such as nutrient recycling, optimizing water use, the potential for waste reduction, and incorporation of renewable materials [54,62,68].
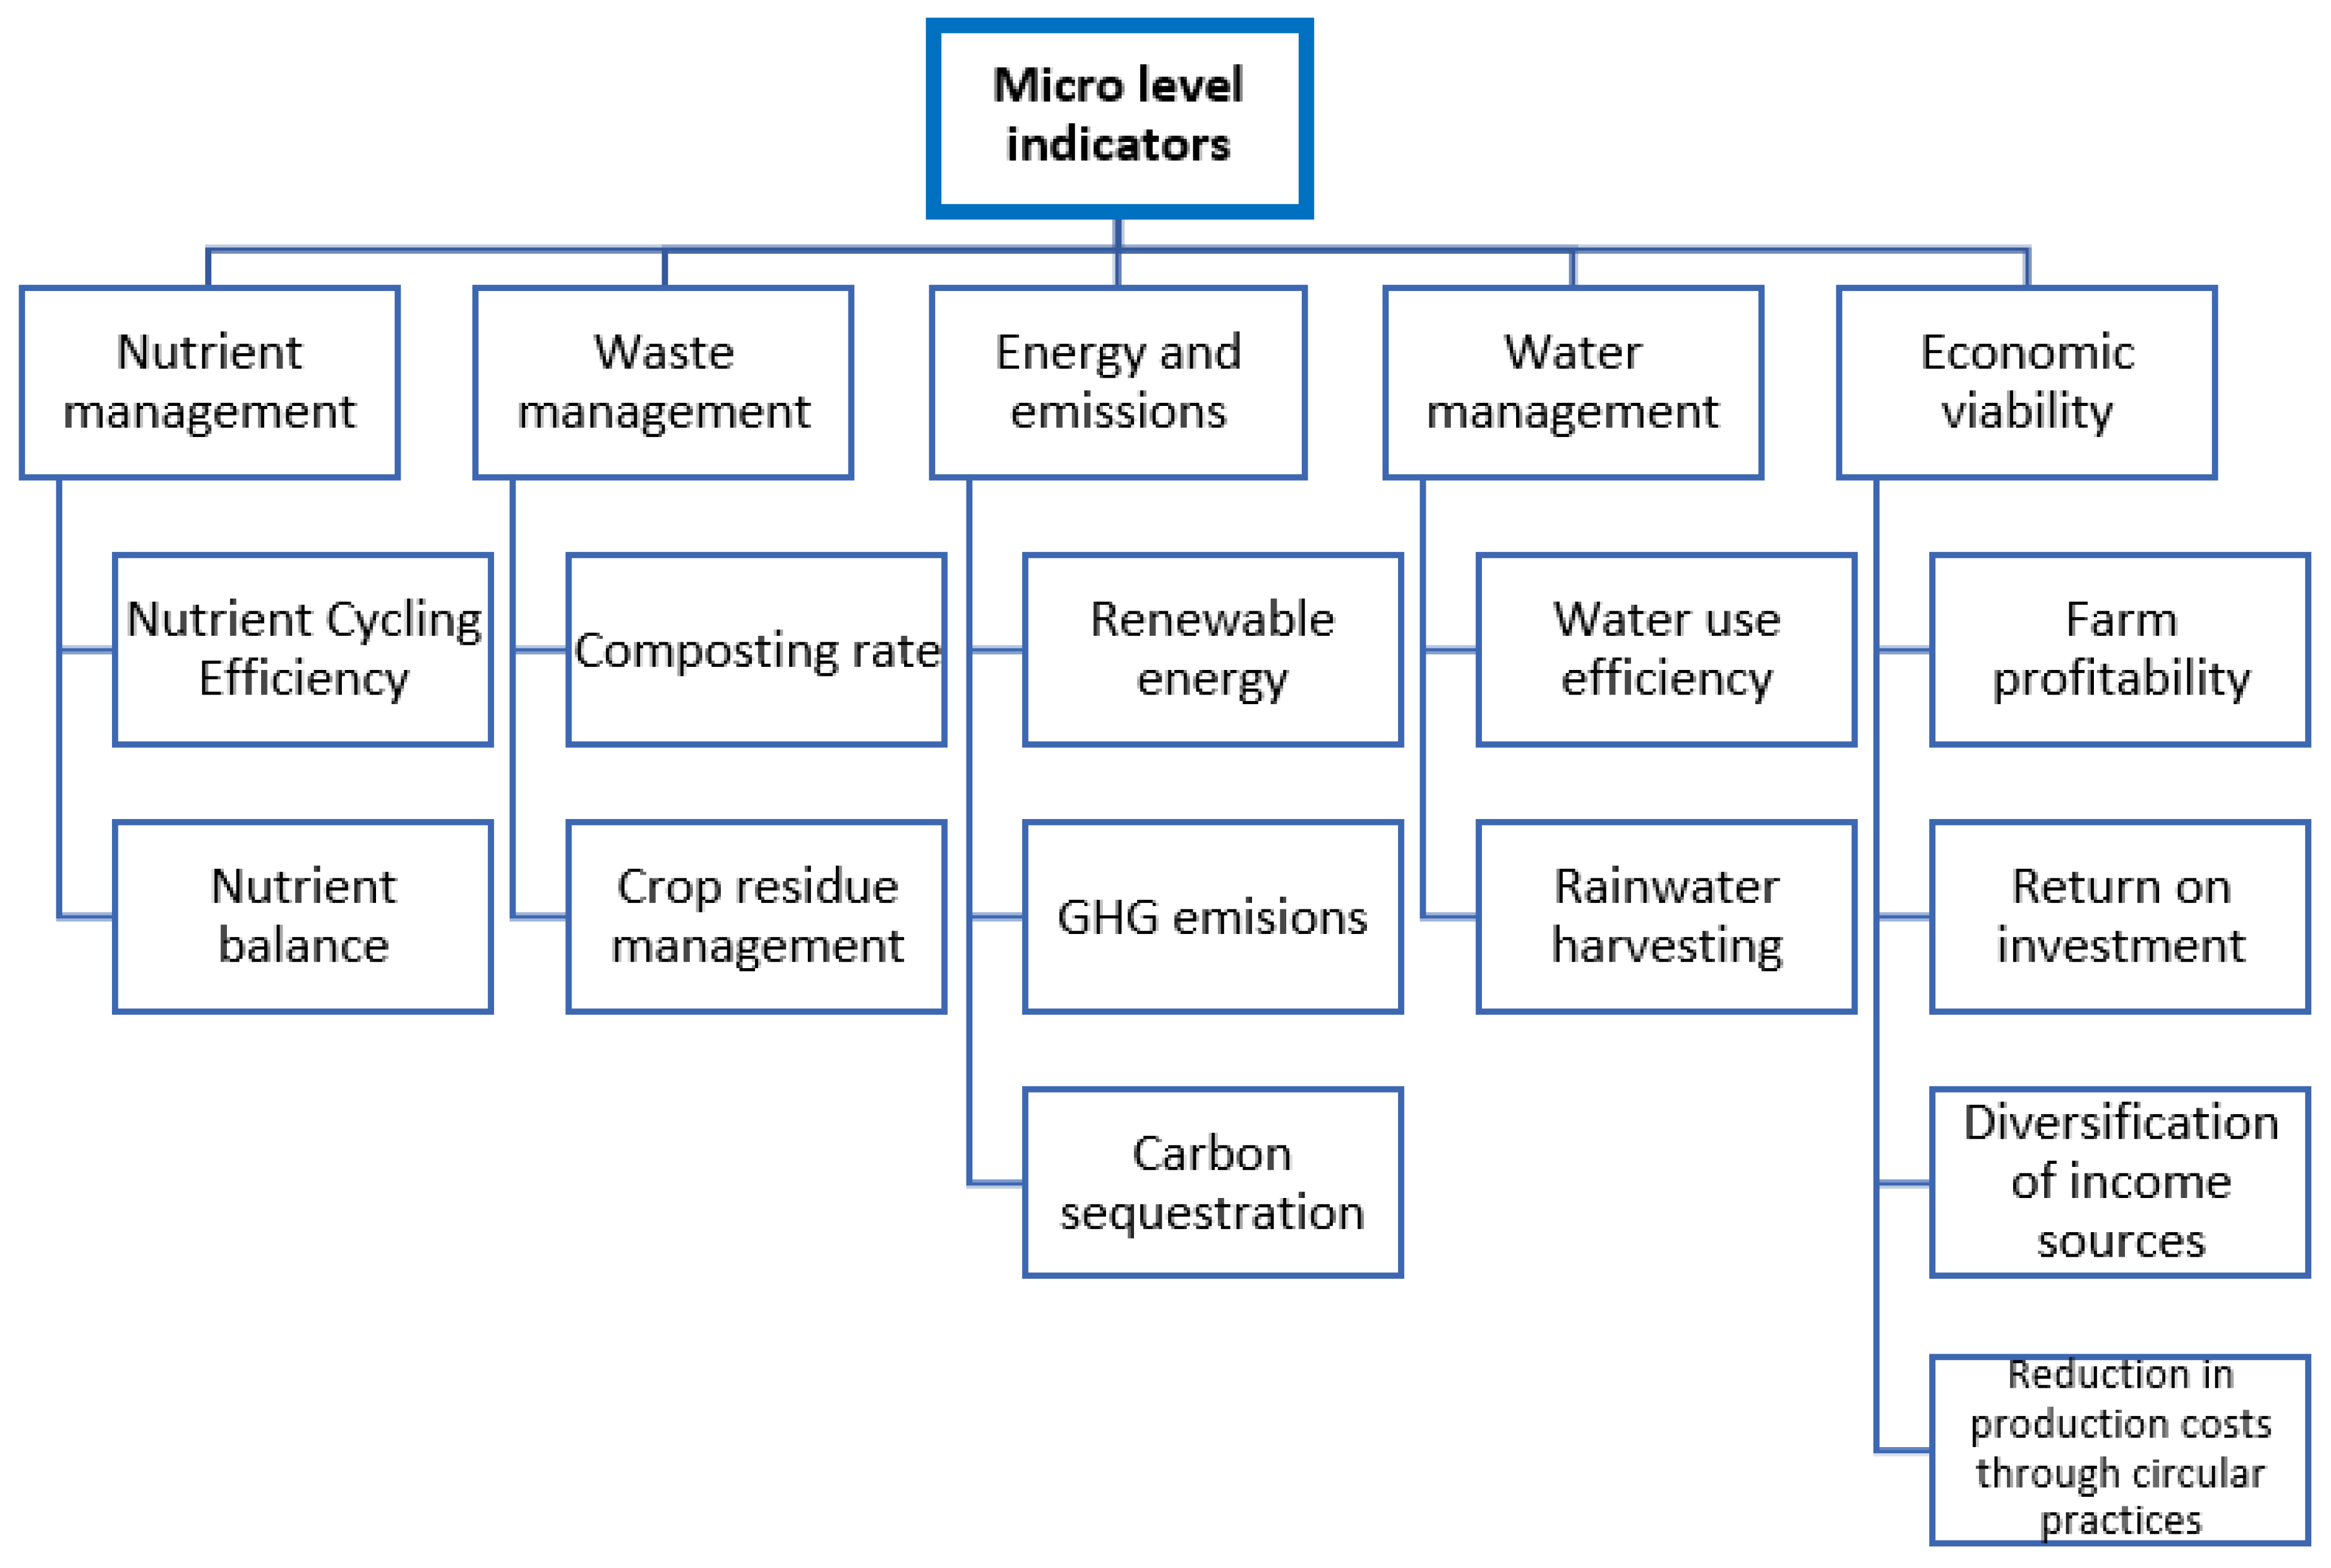
Micro-level indicators play an important role in the comprehensive assessment of circular agriculture practices at the individual farm or agricultural operation levels. These indicators include different criteria that offer insights into the sustainability, efficiency, and environmental impacts of agricultural systems (Figure 8). Examples of micro-level indicators include measures of resource efficiency, such as the ratio of resource inputs to agricultural outputs, highlighting how efficiently the resources are utilized, such as fertilizers [69,70,71,72,73,74,75], water [76,77,78], and energy [11,17,20,28,38,48].
Additionally, the indicators related to waste reduction, such as tracking the volume of waste generated per unit of agricultural production and assessing the extent of waste recycling or repurposing, provide valuable information on circularity efforts [33,77,79].
Evaluating soil and crop health, measuring the biodiversity, and assessing the effectiveness of nutrient cycling practices [21,39,48,70,71,72,73,80] are critical components of micro-level indicators, as they directly influence the long-term ecological sustainability of agricultural systems.
Furthermore, economic viability indicators, including returns on investments and income diversification through various agricultural products or value-added processes, ensure that circular agriculture practices are financially sound [75,77].
An important aspect to mention as a limitation of this study is that the analysis was restricted to the publications only available from the Web of Science (WoS) Core Collections database. Even if the snowball method was applied for the literature review, there was a possibility that some relevant papers, published in other academic databases or in journals not indexed in the WOS, were not included in this analysis. This may lead to a partial and possibly non-exhaustive representation of the existing circular economy literature.
However, there is a need for the continuous monitoring of circularity indicators in agriculture to assess the progress and adjust the policies and practices according to the developments. Further research in the field of circular agriculture measuring the framework should focus on refining and standardizing the metrics to comprehensively assess the circularity of agricultural systems. This includes the development of quantitative indicators that encompass resource efficiency, waste reduction, and the closed-loop nature of agricultural processes. Additionally, the studies should investigate the scalability of circular agriculture practices, exploring how they can be effectively implemented in various types and sizes of farming systems and regions, while considering the socio-economic and cultural factors. The long-term monitoring and evaluation of circular agricultural systems are essential to understand their dynamic nature and resilience in the face of environmental changes. Interdisciplinary research that bridges the gap between environmental science, economy, and sociology is still needed for providing an integrated perspective on the challenges of circular agriculture, ultimately guiding policymakers, farmers, and stakeholders towards more sustainable and resilient production systems.
4. Conclusions
Measuring the circular economy in agriculture is essential to assess and improve the sustainability of the agricultural sector. With the right indicators and metrics, we can monitor the progress towards achieving a more circular agricultural system and develop strategies and policies to encourage more sustainable practices. This research highlights the fact that the circular economy is a heterogenous sector, with multiple implications in the agricultural systems. Moreover, circular agriculture is highly diversified and therefore there is a need of using a diverse range of indicators to measure the circularity in the field of agriculture. The possible indicators cover aspects such as resource use, waste management, environmental sustainability, and the overall efficiency of the agricultural system.
From 2006 to 2023, there was a marked surge in the scientific literature focusing on the circular economy framework. This trend not only highlights the significance of the circular economy in the domain of the sustainable development of agriculture, but also the pivotal role of international collaborations in addressing the challenges associated with agriculture circularity processes. Notably, while China was a forerunner in the early phase, Spain and Italy took the lead in later years.
For future perspectives, it is important to continue the development of more accurate measuring instruments, while at the same time adapting to the specificity of the agricultural context in different regions. We identified a gap in the practical application of circular economy monitoring to the agriculture sector, especially from a micro-level to the crop sector. An additional aim of our research is the assessment of circular agriculture development in Romania with a specific focus on sectoral studies, such as field and horticulture crops.
Author Contributions
Conceptualization, S.R.; methodology, S.R. and C.S.; formal analysis, S.R., R.P., A.G. and C.S.; investigation, S.R. and A.G.; data curation, E.D.; writing—original draft preparation, S.R.; writing—review and editing, S.R., R.P. and E.D.; supervision, S.R.; project administration, S.R.; funding acquisition, S.R. All authors have read and agreed to the published version of the manuscript.
Funding
This research was partially funded by Ministry of Agriculture and Rural Development (MARD) Romania through the sectorial program, ctr. ADER 22.1.4. Research on the development of technical-economic solutions for the creation of value chains in the agri-food sector for the transition to the circular bioeconomy.
Institutional Review Board Statement
Not applicable.
Data Availability Statement
Not applicable.
Conflicts of Interest
The authors declare no conflict of interest.
Abbreviations
| ADP | Abiotic resource-depletion potential |
| AP | Acidification potential |
| CAFEI | Composite agri-food efficiency index |
| CAP | Common agricultural policy |
| CE | Circular economy |
| CEIP | Circular economy indicator prototype |
| CLS | Cumulative layout shift |
| DEs | Author’s keywords |
| DEA | Data envelopment analysis |
| DPBT | Discounted payback time |
| ECOGRAI | Name of method for developing performance indicators that comes from ECO: economy, GRAI: Groupe de Recherche en Automatisation Intégrée (Research Group for Integrated Automation) |
| EP | Eutrophication potential |
| EU | European Union |
| FAETP | Freshwater aquatic eco-toxicity potential |
| GDP | Gross domestic product |
| GRAFS | Generalized representation of agro-food systems approach |
| GWP | Global warming potential |
| HTP | Human toxicity potential |
| ID | Keywords plus |
| IRR | Internal rate Of return |
| K | Potassium |
| LCA | Life cycle assessment |
| MAETP | Marine aquatic eco-toxicity |
| MCDA | Multi-criteria decision analysis |
| MFA | Material flow analysis |
| N | Nitrogen |
| NFI | Net farm income |
| NPV | Net present value |
| NUE | Nitrogen use efficiency |
| ODP | Ozone-layer-depletion potential |
| P | Phosphorus |
| PI | Profitability index |
| PNB | Partial nitrogen balance |
| POCP | Photochemical ozone-creation potential |
| SDs | System dynamics |
| TETP | Terrestrial eco-toxicity potential |
| WoS | Web of Science |
References
- Tilman, D.; Fargione, J.; Wolff, B.; D’antonio, C.; Dobson, A.; Howarth, R.; Swackhamer, D. Forecasting agriculturally driven global environmental change. Science 2001, 292, 281–284. [Google Scholar] [CrossRef]
- Godfray, H.C.J.; Beddington, J.R.; Crute, I.R.; Haddad, L.; Lawrence, D.; Muir, J.F.; Toulmin, C. Food security: The challenge of feeding 9 billion people. Science 2010, 327, 812–818. [Google Scholar] [CrossRef]
- Schanes, K.; Jäger, J.; Drummond, P. Three scenario narratives for a resource-efficient and low-carbon Europe in 2050. Ecol. Econ. 2019, 155, 70–79. [Google Scholar] [CrossRef]
- Butu, A.; Vasiliu, C.D.; Rodino, S.; Brumă, I.-S.; Tanasă, L.; Butu, M. The Process of Ethnocentralizing the Concept of Ecological Agroalimentary Products for the Romanian Urban Consumer. Sustainability 2019, 11, 6226. [Google Scholar] [CrossRef]
- De Morais, L.H.L.; Pinto, D.C.; Cruz-Jesus, F. Circular economy engagement: Altruism, status, and cultural orientation as drivers for sustainable consumption. Sustain. Prod. Consum. 2021, 27, 523–533. [Google Scholar] [CrossRef]
- Brumă, I.S.; Vasiliu, C.D.; Rodino, S.; Butu, M.; Tanasă, L.; Doboș, S.; Butu, A.; Coca, O.; Stefan, G. The Behavior of Dairy Consumers in Short Food Supply Chains during COVID-19 Pandemic in Suceava Area, Romania. Sustainability 2021, 13, 3072. [Google Scholar] [CrossRef]
- Ferreira, J.; Pardini, R.; Metzger, J.P.; Fonseca, C.R.; Pompeu, P.S.; Sparovek, G.; Louzada, J. Towards environmentally sustainable agriculture in Brazil: Challenges and opportunities for applied ecological research. J. Appl. Ecol. 2021, 49, 535–541. [Google Scholar] [CrossRef]
- EMF (Ellen MacArthur Foundation). Towards the Circular Economy Volume 3: Accelerating the Scale up Across Global Supply Chains; Ellen MacArthur Foundation: Cowes, UK, 2014. [Google Scholar]
- EMF (Ellen MacArthur Foundation). Growth Within: A Circular Economy Vision for a Competitive Europe; Ellen MacArthur Foundation: Cowes, UK, 2016; Available online: http://www.ellenmacarthurfoundation.org/assets/downloads/publications/EllenMacArthurFoundation_Growth-Within_July15.pdf (accessed on 17 July 2016).
- European Commission. A new circular economy action plan for a cleaner and more competitive Europe. In Communication from the Commission to the European Parliament, the Council, the European Economic and Social Committee and the Committee of the Regions; European Commission: Brussels, Belgium, 2020. [Google Scholar]
- European Parliament. Circular Economy: Definition, Importance and Benefits. 2023. Available online: https://www.europarl.europa.eu/news/en/headlines/economy/20151201STO05603/circular-economy-definition-importance-and-benefits?&at_campaign=20234-Economy&at_medium=Google_Ads&at_platform=Search&at_creation=RSA&at_goal=TR_G&at_audience=circular%20economy&at_topic=Circular_Economy&at_location=RO&gclid=EAIaIQobChMIxtKYxquCggMVtGGRBR1nmgjDEAAYASAAEgICFPD_BwE (accessed on 28 September 2023).
- Kirchherr, J.; Reike, D.; Hekkert, M. Conceptualizing the circular economy: An analysis of 114 definitions. Resour. Conserv. Recycl. 2017, 127, 221–232. [Google Scholar] [CrossRef]
- Sverko Grdic, Z.; Krstinic Nizic, M.; Rudan, E. Circular economy concept in the context of economic development in EU countries. Sustainability 2020, 12, 3060. [Google Scholar] [CrossRef]
- Circularity Gap Reporting Initiative. Circularity Gap Report 2021; Ruparo: Amsterdam, The Netherlands, 2021. [Google Scholar]
- Kirchherr, J.; Yang, N.H.N.; Schulze-Spüntrup, F.; Heerink, M.J.; Hartley, K. Conceptualizing the Circular Economy (Revisited): An Analysis of 221 Definitions. Resour. Conserv. Recycl. 2023, 194, 107001. [Google Scholar] [CrossRef]
- Everest, B. Farmers’ adaptation to climate-smart agriculture (CSA) in NW Turkey. Environ. Dev. Sustain. 2021, 23, 4215–4235. [Google Scholar] [CrossRef]
- Yıldırım, M.; Everest, B. Adaptation to sustainable energy use: A case study on agricultural cooperatives. Kuwait J. Sci. 2022, 49, 11833. [Google Scholar] [CrossRef]
- Velasco-Muñoz, J.F.; Mendoza, J.M.F.; Aznar-Sánchez, J.A.; Gallego-Schmid, A. Circular economy implementation in the agricultural sector: Definition, strategies and indicators. Resour. Conserv. Recycl. 2021, 170, 105618. [Google Scholar] [CrossRef]
- Gollner, G.; Fedoseyenko, D.; Grausgruber-Groeger, S.; Grausgruber, H.; Friedel, J.K.; Freyer, B. Lucerne in arable cropping systems: Potential of different varieties on biomass production and nitrogen balance. Rom. Agric. Res. 2016, 33, 45–51. [Google Scholar]
- Pagotto, M.; Halog, A. Towards a Circular Economy in Australian Agri-food Industry: An Application of Input-Output Oriented Approaches for Analyzing Resource Efficiency and Competitiveness Potential. J. Ind. Ecol. 2016, 20, 1176–1186. [Google Scholar] [CrossRef]
- Kleinpeter, V.; Alvanitakis, M.; Vigne, M.; Wassenaar, T.; Seen, D.L.; Vayssières, J. Assessing the roles of crops and livestock in nutrient circularity and use efficiency in the agri-food-waste system: A set of indicators applied to an isolated tropical island. Resour. Conserv. Recycl. 2023, 188, 106663. [Google Scholar] [CrossRef]
- Aria, M.; Cuccurullo, C. bibliometrix: An R-tool for comprehensive science mapping analysis. J. Informetr. 2017, 11, 959–975. [Google Scholar] [CrossRef]
- Streimikis, J.; Saraji, M.K. Green productivity and undesirable outputs in agriculture: A systematic review of DEA approach and policy recommendations. Econ. Res. Ekon. Istraživanja 2022, 35, 819–853. [Google Scholar] [CrossRef]
- McDowall, W.; Geng, Y.; Huang, B.; Barteková, E.; Bleischwitz, R.; Türkeli, S.; Doménech, T. Circular economy policies in China and Europe. J. Ind. Ecol. 2017, 21, 651–661. [Google Scholar] [CrossRef]
- Hartley, K.; van Santen, R.; Kirchherr, J. Policies for transitioning towards a circular economy: Expectations from the European Union (EU). Resour. Conserv. Recycl. 2020, 155, 104634. [Google Scholar] [CrossRef]
- Corona, B.; Shen, L.; Reike, D.; Rosales Carreón, J.; Worrell, E. Towards Sustainable Development through the Circular Economy—A Review and Critical Assessment on Current Circularity Metrics. Resour. Conserv. Recycl. 2019, 151, 104498. [Google Scholar] [CrossRef]
- Silvestri, C.; Silvestri, L.; Piccarozzi, M.; Ruggieri, A. Toward a framework for selecting indicators of measuring sustainability and circular economy in the agri-food sector: A systematic literature review. Int. J. Life Cycle Assess. 2022, 2022, 1–39. [Google Scholar]
- Silvestri, L.; Silvestri, C.; Forcina, A.; De Luca, C. A review of energy-based indicators for assessing sustainability and circular economy in the agri-food production. Procedia Comput. Sci. 2022, 200, 1756–1765. [Google Scholar] [CrossRef]
- Priyadarshini, P.; Abhilash, P.C. An empirical analysis of resource efficiency and circularity within the agri-food sector of India. J. Clean. Prod. 2023, 385, 135660. [Google Scholar] [CrossRef]
- Constantinescu, M.; Rodino, S.; Butu, A.; Butu, M.; Todirică, C.; Popa, M.; Chetroiu, R.; Sima, N. Nitrogen management trends for agricultural and environmental science. Rom. Agric. Res. 2023, 40, 417–428. [Google Scholar] [CrossRef]
- Tadesse, S.T.; Oenema, O.; van Beek, C.; Ocho, F.L. Nitrogen allocation and recycling in peri-urban mixed crop–livestock farms in Ethiopia. Nutr. Cycl. Agroecosyst. 2019, 115, 281–294. [Google Scholar] [CrossRef]
- Rukundo, R.; Bergeron, S.; Bocoum, I.; Pelletier, N.; Doyon, M. A Methodological Approach to Designing Circular Economy Indicators for Agriculture: An Application to the Egg Sector. Sustainability 2021, 13, 8656. [Google Scholar] [CrossRef]
- Bentivoglio, D.; Chiaraluce, G.; Finco, A. Economic assessment for vegetable waste valorization through the biogas-biomethane chain in Italy with a circular economy approach. Front. Sustain. Food Syst. 2022, 6, 1035357. [Google Scholar] [CrossRef]
- Alba-Patino, D.; Carabassa, V.; Castro, H.; Gutiérrez-Briceño, I.; García-Llorente, M.; Giagnocavo, C.; Castro, A.J. Social indicators of ecosystem restoration for enhancing human wellbeing. Resour. Conserv. Recycl. 2021, 174, 105782. [Google Scholar] [CrossRef]
- Ulman, S.-R.; Mihai, C.; Cautisanu, C.; Brumă, I.-S.; Coca, O.; Stefan, G. Environmental Performance in EU Countries from the Perspective of Its Relation to Human and Economic Wellbeing. Int. J. Environ. Res. Public Health 2021, 18, 12733. [Google Scholar] [CrossRef]
- Ghisellini, P.; Ncube, A.; Rotolo, G.; Vassillo, C.; Kaiser, S.; Passaro, R.; Ulgiati, S. Evaluating Environmental and Energy Performance Indicators of Food Systems, within Circular Economy and “Farm to Fork” Frameworks. Energies 2023, 16, 1671. [Google Scholar] [CrossRef]
- Barros, M.V.; Salvador, R.; Gallego-Schmid, A.; Piekarski, C.M. Circularity measurement of external resource flows in companies: The circular flow tool. Waste Manag. 2023, 158, 136–145. [Google Scholar] [CrossRef] [PubMed]
- Cayzer, S.; Griffiths, P.; Beghetto, V. Design of indicators for measuring product performance in the circular economy. Int. J. Sustain. Eng. 2017, 10, 289–298. [Google Scholar] [CrossRef]
- Papangelou, A.; Mathijs, E. Assessing agro-food system circularity using nutrient flows and budgets. J. Environ. Manag. 2021, 288, 112383. [Google Scholar] [CrossRef] [PubMed]
- Guo, C.; Zhang, R.; Zou, Y. The Efficiency of China’s Agricultural Circular Economy and Its Influencing Factors under the Rural Revitalization Strategy: A DEA–Malmquist–Tobit Approach. Agriculture 2023, 13, 1454. [Google Scholar] [CrossRef]
- Fan, W.; Zhang, P.; Xu, Z.; Wei, H.; Lu, N.; Wang, X.; Dong, X. Life cycle environmental impact assessment of circular agriculture: A case study in Fuqing, China. Sustainability 2018, 10, 1810. [Google Scholar] [CrossRef]
- Romero-Perdomo, F.; González-Curbelo, M.Á. Integrating Multi-Criteria Techniques in Life-Cycle Tools for the Circular Bioeconomy Transition of Agri-Food Waste Biomass: A Systematic Review. Sustainability 2023, 15, 5026. [Google Scholar] [CrossRef]
- Zhai, X.J.; Shang, J. Integrated Evaluation PPC Model of Agricultural Circular Economy in the Perspective of Ecological Restoration. Adv. Mater. Res. 2010, 113, 750–756. [Google Scholar] [CrossRef]
- Sun, X.; Li, J.; Li, L. Estimating circular agricultural efficiency using dea methods. Agro Food Ind. Hi-Tech 2016, 27, 94–98. [Google Scholar]
- Havrysh, V.; Kalinichenko, A.; Pysarenko, P.; Samojlik, M. Sunflower Residues-Based Biorefinery: Circular Economy Indicators. Processes 2023, 11, 630. [Google Scholar] [CrossRef]
- Li, B.; Feng, Y.; Xia, X.; Feng, M. Evaluation of China’s circular agriculture performance and analysis of the driving factors. Sustainability 2021, 13, 1643. [Google Scholar] [CrossRef]
- Meng, X.; Liu, M.; Wang, M.; Wang, J.; Wu, Q. Fuzzy min-max neural network with fuzzy lattice inclusion measure for agricultural circular economy region division in heilongjiang province in china. IEEE Access 2020, 8, 36120–36130. [Google Scholar] [CrossRef]
- Rodias, E.; Aivazidou, E.; Achillas, C.; Aidonis, D.; Bochtis, D. Water-energy-nutrients synergies in the agrifood sector: A circular economy framework. Energies 2020, 14, 159. [Google Scholar] [CrossRef]
- Zou, F.; Li, T. The Impact of Agricultural Ecological Capital Investment on the Development of Green Circular Economy. Agriculture 2022, 12, 461. [Google Scholar] [CrossRef]
- Passaro, P.; Perchinunno, P.; Rotondo, F. Statistical analysis of the circular economy for the intervention policies of the NRRP. Br. Food J. 2023. [Google Scholar] [CrossRef]
- Liu, Z.; Wang, Y.; Geng, Y.; Li, R.; Dong, H.; Xue, B.; Wang, S. Toward sustainable crop production in China: An emergy-based evaluation. J. Clean. Prod. 2019, 206, 11–26. [Google Scholar] [CrossRef]
- Fassio, F.; Chirilli, C. The Circular Economy and the Food System: A Review of Principal Measuring Tools. Sustainability 2023, 15, 10179. [Google Scholar] [CrossRef]
- Yazdani, M.; Gonzalez, E.D.; Chatterjee, P. A multi-criteria decision-making framework for agriculture supply chain risk management under a circular economy context. Manag. Decis. 2021, 59, 1801–1826. [Google Scholar] [CrossRef]
- Aznar-Sánchez, J.A.; Mendoza, J.M.F.; Ingrao, C.; Failla, S.; Bezama, A.; Nemecek, T.; Gallego-Schmid, A. Indicators for circular economy in the agri-food sector. Resour. Conserv. Recycl. 2020, 163, 105028. [Google Scholar]
- Waas, T.; Hugé, J.; Block, T.; Wright, T.; Benitez-Capistros, F.; Verbruggen, A. Sustainability Assessment and Indicators: Tools in a Decision-Making Strategy for Sustainable Development. Sustainability 2014, 6, 5512–5534. [Google Scholar] [CrossRef]
- Moraga, G.; Huysveld, S.; Mathieux, F.; Blengini, G.A.; Alaerts, L.; Van Acker, K.; de Meester, S.; Dewulf, J. Circular economy indicators: What do they measure? Resour. Conserv. Recycl. 2019, 146, 452–461. [Google Scholar] [CrossRef]
- European Commission. Measuring Progress Towards Circular Economy in the European Union—Key Indicators for a Monitoring Framework—SWD (2018) 17 Final; European Commission: Strasbourg, France, 2018. [Google Scholar]
- Brown, A.; Haas, W.; Laubscher, M.; Philips, R.; Pallecchi, A.; Reh, F.; Tno, E.R.; Soezer, A. The Circularity Gap Report; Circle Economy: Amsterdam, The Netherlands, 2018. [Google Scholar]
- Potting, J.; Hanemaaijer, A.; Delahaye, R.; Ganzevles, J.; Hoekstra, R.; Lijzen, J. Circular Economy: What We Want to Know and Can Measure—System and Baseline Assessment for Monitoring the Progress of the Circular Economy in the Netherlands; PBL Netherlands Environmental Assessment Agency: The Hague, The Netherlands, 2018. [Google Scholar]
- Magnier, C.; Auzanneau, M.; Calatayud, P.; Gauche, M.; Ghewy, X.; Granger, M.; Margontier, S.; Pautard, E. 10 Key Indicators for Monitoring the Circular Economy; The Monitoring and Statistics Directorate: Paris, France, 2017. [Google Scholar]
- Geng, Y.; Sarkis, J.; Ulgiati, S.; Zhang, P. Measuring China’s circular economy. Science 2013, 339, 1526–1527. [Google Scholar] [CrossRef] [PubMed]
- Xing, L.; Lin, T.; Hu, Y.; Lin, M.; Liu, Y.; Zhang, G.; Xue, X. Reducing food-system nitrogen input and emission through circular agriculture in montane and coastal regions. Resour. Conserv. Recycl. 2023, 188, 106726. [Google Scholar] [CrossRef]
- Bastan, M.; Khorshid-Doust, R.R.; Sisi, S.D.; Ahmadvand, A. Sustainable development of agriculture: A system dynamics model. Kybernetes 2017, 47, 142–162. [Google Scholar] [CrossRef]
- Walters, J.P.; Archer, D.W.; Sassenrath, G.F.; Hendrickson, J.R.; Hanson, J.D.; Halloran, J.M.; Alarcon, V.J. Exploring agricultural production systems and their fundamental components with system dynamics modelling. Ecol. Model. 2016, 333, 51–65. [Google Scholar] [CrossRef]
- Zadgaonkar, L.A.; Darwai, V.; Mandavgane, S.A. The circular agricultural system is more sustainable: Emergy analysis. Clean Techn Env. Policy 2022, 24, 1301–1315. [Google Scholar] [CrossRef]
- Rydberg, T.; Haden, A.C. Emergy evaluations of Denmark and Danish agriculture: Assessing the influence of changing resource availability on the organization of agriculture and society. Agric. Ecosyst. Environ. 2006, 117, 145–158. [Google Scholar] [CrossRef]
- Graedel, T.E. Material flow analysis from origin to evolution. Environ. Sci. Technol. 2019, 53, 12188–12196. [Google Scholar] [CrossRef]
- Barros, M.V.; Salvador, R.; de Francisco, A.C.; Piekarski, C.M. Mapping of research lines on circular economy practices in agriculture: From waste to energy. Renew. Sustain. Energy Rev. 2020, 131, 109958. [Google Scholar] [CrossRef]
- Prasad, M.N.V. Sustainable Water Use in Agriculture—Circular Economy Approach. In Water in Circular Economy; Advances in Science, Technology and Innovation; Smol, M., Prasad, M.N.V., Stefanakis, A.I., Eds.; Springer: Cham, Switzerland, 2023. [Google Scholar] [CrossRef]
- Rodríguez-Espinosa, T.; Papamichael, I.; Voukkali, I.; Gimeno, A.P.; Candel, M.B.A.; Navarro-Pedreño, J.; Lucas, I.G. Nitrogen management in farming systems under the use of agricultural wastes and circular economy. Sci. Total Environ. 2023, 876, 162666. [Google Scholar] [CrossRef]
- Lavallais, C.M.; Dunn, J.B. Developing product level indicators to advance the nitrogen circular economy. Resour. Conserv. Recycl. 2023, 198, 107167. [Google Scholar] [CrossRef]
- Rufí-Salís, M.; Petit-Boix, A.; Villalba, G.; Sanjuan-Delmás, D.; Parada, F.; Ercilla-Montserrat, M.; Gabarrell, X. Recirculating water and nutrients in urban agriculture: An opportunity towards environmental sustainability and water use efficiency? J. Clean. Prod. 2020, 261, 121213. [Google Scholar] [CrossRef]
- Yang, Z.; Li, H.Q.; Zhai, J.N.; Zhang, L.H.; Nan, Q. Review on the assessment model of nutrient recycling with agricultural residues treatment technologies. J. Appl. Ecol. 2022, 33, 3213–3219. [Google Scholar]
- Babazadeh, H.; Tabrizi, M.S.; Hoogenboom, G. Crop Production and Water Productivity Simultaneously Optimization of Soybean Plant Using Two Meta-Heuristic Algorithms. Rom. Agric. Res. 2022, 39, 311–325. [Google Scholar] [CrossRef]
- Wang, Y.; Wu, F.; Peng, X.; Tong, X. Analysis of economic efficiency and energy flow characteristics of a circular and integrated agriculture model in the Loess hilly region. Trans. Chin. Soc. Agric. Eng. 2016, 32, 199–206. [Google Scholar]
- Fan, T.L.; Li, S.Z.; Gang, Z.H.A.O.; Wang, S.Y.; Zhang, J.J.; Lei, W.A.N.G.; Cheng, W.L. Response of dryland crops to climate change and drought-resistant and water-suitable planting technology: A case of spring maize. J. Integr. Agric. 2023, 22, 2067–2079. [Google Scholar] [CrossRef]
- Cheruiyot, W.K.; Zhu, S.G.; Indoshi, S.N.; Wang, W.; Ren, A.T.; Cheng, Z.G.; Xiong, Y.C. Shallow-incorporated straw returning further improves rainfed maize productivity, profitability and soil carbon turnover on the basis of plastic film mulching. Agric. Water Manag. 2023, 289, 108535. [Google Scholar] [CrossRef]
- Ojara, M.A.; Yunsheng, L.; Babaousmail, H.; Sempa, A.K.; Ayugi, B.; Ogwang, B.A. Evaluation of drought, wet events, and climate variability impacts on maize crop yields in East Africa during 1981–2017. Int. J. Plant Prod. 2022, 16, 41–62. [Google Scholar] [CrossRef]
- Møller, H.; Lyng, K.A.; Röös, E.; Samsonstuen, S.; Olsen, H.F. Circularity indicators and added value to traditional LCA impact categories: Example of pig production. Int. J. Life Cycle Assess. 2023, 2023, 1–13. [Google Scholar] [CrossRef]
- van Loon, M.P.; Vonk, W.J.; Hijbeek, R.; van Ittersum, M.K.; ten Berge, H.F. Circularity indicators and their relation with nutrient use efficiency in agriculture and food systems. Agric. Syst. 2023, 207, 103610. [Google Scholar] [CrossRef]
Figure 1.
Methodological steps. *—replaces a group of letters that can continue with that word (example: monitor * = monitoring or monitorization).
Figure 1.
Methodological steps. *—replaces a group of letters that can continue with that word (example: monitor * = monitoring or monitorization).

Figure 2.
Dynamics of the number of documents, including “CE framework”, across the years.

Figure 3.
Annual production of documents related to the circular agriculture evaluation.

Figure 4.
Cross-country collaboration regarding the subject of the circular agriculture evaluation.

Figure 5.
Evolution of countries’ interests in the subject across the years.

Figure 6.
Top-20 most prolific authors concerning the topic.

Figure 7.
Most frequent topics (a, left) and the consistency of keywords over the years (b, right).

Figure 8.
Micro-level indicators for circular agriculture.


Table 1.
Main data information.
| Description | Results |
|---|---|
| Timespan | 2006:2023 |
| Sources (journals, books, etc.) | 194 |
| Documents | 425 |
| Annual growth rate % | 29.96 |
| Document average age | 2.03 |
| Average citations per doc | 15.25 |
| References | 29,937 |
| DOCUMENT CONTENTS | |
| Keywords plus (ID) | 1359 |
| Author’s keywords (DE) | 1595 |
| AUTHORS | |
| Authors | 1817 |
| Authors of single-authored docs | 22 |
| AUTHORS COLLABORATION | |
| Single-authored docs | 22 |
| Co-authors per doc | 4.57 |
| International co-authorships % | 36 |
| DOCUMENT TYPES | |
| Article | 325 |
| Article; book chapter | 2 |
| Article; early access | 10 |
| Article; proceedings paper | 2 |
| Proceedings paper | 18 |
| Review | 64 |
| Review; early access | 4 |
Table 2.
Database synthetizing the scientific literature analyzed.
| # | Indicator | Description | Method Used | Geographical Coverage | Sector | Reference |
|---|---|---|---|---|---|---|
| 1 | Composite agri-food efficiency index (CAFEI) | CAFEI includes 38 indicators distributed across environmental, social, economic, and governance categories | DEA | India | Agri-food | [29] |
| 2 | Net present value (NPV), internal rate of return (IRR), discounted payback time (DPBT), and profitability index (PI) | Discounted cash flow | Italy | Vegetables | [33] | |
| 3 | Ecosystem service indicators | Survey, questionnaire, and scatter plots | Spain | Horticulture | [34] | |
| 4 | Midpoint LCA indicators (global warming potential, acidification potential, eutrophication potential, photochemical oxidant formation, abiotic-depletion potential, and water scarcity potential) | Energy and environmental indicators | Life cycle analysis, emergy accounting, and material flow accounting | Italy | Agrifood, organic farming | [36] |
| 5 | Circular flow | Tool for assessment | Online platform for calculations: onlineagrocirclewins.com.br | Brazil | Industrial agriculture production | [37] |
| 6 | Multiple indexes | Indicators for three pillars of sustainability | LCA systematic literature review | n/a | Agri-food | [27] |
| 7 | Energy-related indicators | Literature review | Overall agriculture | [28] | ||
| 8 | Circular economy indicator prototype—CEIP | Environmental performance of products from the CE | Questionnaire with 15 questions in five stages of the life cycle, from the extraction of raw materials to the end of life | n/a | General, all sectors | [38] |
| 9 | Indicators related to: - Closing resource-loops strategy - Regenerating strategy | Literature review | Overall agriculture | [18] | ||
| 10 | Multiple indicators | DEA–Malmquist–Tobit approach | China | Macro-level | [40] | |
| 11 | Reduction in resource input group index Resource recycling group index Ecological environment group index | Projection pursuit classification based on real-coded accelerating genetic algorithm | China | Overall agriculture | [43] | |
| 12 | An input and output evaluation index system | Input evaluation indexes include agricultural employees, chemical fertilizer consumption, energy consumption of agriculture, and sown area of crops, while the output evaluation indexes include total agricultural output, rate of cultivated area output, and output of major agricultural products | DEA | China | Overall agriculture | [44] |
| 13 | 1. Total raw material or resource consumption that consists of ADP elements and ADP fossil fuels 2. The impact of the atmosphere and water resources that consist of the acidification potential (AP), global warming potential (GWP), photochemical ozone-creation potential (POCP), and ozone-layer-depletion potential (ODP), and eutrophication potential (EP) 3. Toxicity, including freshwater aquatic eco-toxicity potential (FAETP), human toxicity potential (HTP), marine aquatic eco-toxicity potential (MAETP), and terrestrial eco-toxicity potential (TETP) | Life cycle assessment (LCA) | China | Pig-farming industry–dragon fruit planting–forage planting–fishery industry–mushroom planting–biogas generation–organic fertilizer production circular agriculture model | [41] | |
| 14 | Renewable energy share Carbon dioxide emissions savings Energy recoverability benefit rate Circular material use rate | Energy and environmental indicators | Statistical data | Ukraine | Sunflower | [45] |
| 15 | Comprehensive evaluation index | Entropy method | China | Overall agriculture sector | [46] | |
| 16 | n/a | MCDA, LCA description | Literature review | Agri-food waste biomass | [42] | |
| 17 | Nutrient flows | Nitrogen (N), phosphorus (P), and potassium (K) flows and soil balances; P circularity: total inputs, phosphorus use efficiency, share of reused to total input, recycling rate, and losses | GRAFS + Food and Feed + Waste | Belgium | Agro-food system, but more targeted towards food | [39] |
| 18 | Multi-criteria index based on resource dosage indexes, economic and social development indexes, area index, and population and labor indexes | Improved fuzzy min–max neural network with fuzzy lattice inclusion measure (FL-IFMM) | China | Grain crops—animal husbandry; rice—animal husbandry; vegetable and edible fungi—melons and fruits—animal husbandry; farming—forestry—animal husbandry | [47] | |
| Water–energy–nutrients synergies | Water resources, energy resources, and nutrients | Literature review | n/a | Overall agriculture | [48] | |
| Agricultural ecological capital investment | Coupling coordination analysis Regression analysis Robustness test Mechanism analysis Heterogeneity analysis | China | Overall agriculture | [49] | ||
| Partial nitrogen balance (PNB), N-use efficiency (NUE), N-recycling index, and net farm income (NFI) | Crop–livestock ratio (CLS) index | Calculation of multi-criteria indices | Ethiopia | [41] | ||
| Statistical indicators from national resilience plan related to the M2C1 component (circular economy and sustainable agriculture) | Statistical methodologies (totally fuzzy and relative methods) | Italy | Circular economy and sustainable agriculture | [50] | ||
| (1) Locally renewable resource (R): sunlight, earth cycle; (2) Local non-renewable resource (N): net loss of the topsoil; (3) Purchased resource (F): mechanical equipment, purchased diesel, chemical fertilizers and pesticides, labor (L), irrigating water, and seeds | Combined emergy and decomposition analyses | China | Overall agriculture | [51] |
Disclaimer/Publisher’s Note: The statements, opinions and data contained in all publications are solely those of the individual author(s) and contributor(s) and not of MDPI and/or the editor(s). MDPI and/or the editor(s) disclaim responsibility for any injury to people or property resulting from any ideas, methods, instructions or products referred to in the content. |
© 2023 by the authors. Licensee MDPI, Basel, Switzerland. This article is an open access article distributed under the terms and conditions of the Creative Commons Attribution (CC BY) license (https://creativecommons.org/licenses/by/4.0/).
Share and Cite
MDPI and ACS Style
Rodino, S.; Pop, R.; Sterie, C.; Giuca, A.; Dumitru, E. Developing an Evaluation Framework for Circular Agriculture: A Pathway to Sustainable Farming. Agriculture 2023, 13, 2047. https://doi.org/10.3390/agriculture13112047
AMA Style
Rodino S, Pop R, Sterie C, Giuca A, Dumitru E. Developing an Evaluation Framework for Circular Agriculture: A Pathway to Sustainable Farming. Agriculture. 2023; 13(11):2047. https://doi.org/10.3390/agriculture13112047
Chicago/Turabian StyleRodino, Steliana, Ruxandra Pop, Cristina Sterie, Andreea Giuca, and Eduard Dumitru. 2023. "Developing an Evaluation Framework for Circular Agriculture: A Pathway to Sustainable Farming" Agriculture 13, no. 11: 2047. https://doi.org/10.3390/agriculture13112047
Note that from the first issue of 2016, this journal uses article numbers instead of page numbers. See further details here.