
Investigation of Optical Properties and Activity of Wheat Stripe Rust Urediospores

1
College of Mechanical and Electronic Engineering, Northwest A&F University, Xianyang 712100, China
2
Key Laboratory of Agricultural Internet of Things, Ministry of Agriculture and Rural Affairs, Xianyang 712100, China
3
Shaanxi Key Laboratory of Agricultural Information Perception and Intelligent Service, Xianyang 712100, China
*
Author to whom correspondence should be addressed.
Agriculture 2023, 13(7), 1316; https://doi.org/10.3390/agriculture13071316
Submission received: 16 March 2023
/
Revised: 13 June 2023
/
Accepted: 19 June 2023
/
Published: 28 June 2023
(This article belongs to the Special Issue Diseases Diagnosis, Prevention and Weeds Control in Crops)
Abstract
:Stripe rust is one of the most common diseases challenging the safe production of wheat. Rapid identification and analysis of urediospores, responsible for disease transmission, are the key to preventing and controlling stripe rust. The current spore detection is time-consuming and requires auxiliary equipment, but many optical detection methods and sensors with high efficiency, sensitivity, and detection ability have been developed and widely used. Thus, the investigation of optical parameters is the prerequisite for optical sensitive detection and is detailed in this study. Firstly, the microscopic images and surface elements of wheat stripe rust urediospores were obtained using a high-resolution electron microscope and an energy spectrum analyzer. The reflectivity and absorptivity spectra in the near-infrared band of active/inactivate urediospores were measured. Further, the optical parameters, such as reflection phase shift, complex refractive index, and dielectric constant, of the urediospores were analyzed based on electromagnetic theory and Kramers–Kronig relation. The results revealed that the urediospores have a strong tolerance to near-infrared light, and the real part of the complex refractive index n was between 1.0 and 1.4. These observations indicate that whether the spores are active or not has little effect on the real part and dielectric constant of the complex refractive index but has a significant impact on the imaginary part and extinction coefficient of the complex refractive index, and the corresponding relationship between the optical properties of urediospores and biological components was established. These findings were verified with HPLC-MS and Near-Infrared Spectroscopy Analysis Technology and lay a theoretical foundation for detecting urediospores of wheat stripe rust by using optical sensors. The study provides a reference for the analysis of optical characteristics of other biological samples.
1. Introduction
Wheat stripe rust is a major air-borne disease worldwide. It relies on the urediospores for long-distance transmission through airflow, which can easily cause a pandemic situation and heavy damage. Therefore, rust has been recognized as a major disease that restricts growth and reduces yield in wheat [1]. Several studies on the occurrence and epidemic characteristics of wheat stripe rust have shown that, in addition to cultivar resistance and pathogen toxicity, the number of urediospores plays a crucial role in the occurrence and incidence degree of wheat stripe rust. A timely and accurate understanding of the number of pathogenic urediospores is important to judge the prevalence of stripe rust and is the key to precise monitoring and early prevention.
Precision and smart agriculture are evolving to improve productivity while maintaining yield and have emerged as a new paradigm with the emergence of new technologies for better productivity in agriculture with the optimal usage of resources. With the emergence of new sensing technologies, the intelligent management of crop growth including soil fertility, disease detection, and growth monitoring is the core of sustainable agriculture to produce food for the ever-increasing human population [2,3]. The novel detection method for wheat stripe rust is an important aspect of smart agriculture; it mostly uses capture devices to catch the spores in the field, and the glass slide adhered with spores or its micro-image is returned to the laboratory. The number of spores is counted with artificial, molecular biology, or image processing methods [4,5,6]. Thus, the occurrence degree of the disease can be judged, providing a theoretical basis for the timely prevention and control of the disease [7]. However, environmental factors, such as temperature, humidity, wind speed, and light, determine the community structure. Moreover, the detection equipment is expensive, the field layout of measuring points is scattered, and the collection performance is unstable; therefore, it is difficult to accurately monitor the real-time changes in the urediospore number in the field [8,9,10].
Many optical detection methods combining spectral analysis, microfluidic technology, and optical metamaterials with high efficiency, sensitivity, and detection ability have been developed and widely used in food, medicinal, and agricultural industries for biological detection and chemical analysis [11,12,13,14]. The optical properties of biological samples are different from the macroscopic optical constants of solids. Determining these optical parameters is the prerequisite for optical sensitive detection and is an important design index for developing new optical sensors. Studies on the optical coefficients of biological samples have shown that the optical properties of such samples generally cannot be measured directly and must be derived via experimental measurement combined with corresponding theories, commonly used prism coupling, spectral measurement, and elliptic polarization methods [15,16,17,18]. Among them, the elliptic polarization method is the most suitable for measuring parameters, such as the thickness, surface roughness, and optical constant of thin-film or block materials. The spectrometric method is used to obtain the optical coefficient of particle samples by using the reflection/transmission/absorption spectrum coupled with mathematical transformations, such as Kramers–Kroing (K–K) relation and Mie scattering theory [19,20]. Tuminello found the optical constants of 0.2–2.5 μm Bacillus subtilis in film, tablet, aqueous solution, and glycerol solution using the measurement combined with reflection and transmission spectroscopy and K–K relation [21]. Meanwhile, Gurton measured the infrared extinction spectrum of 3–13 μm granular Bacillus in a laboratory smoke box. The complex refractive index was calculated based on the Mie scattering theory [22]. Hu et al. built a calculation model for determining the extinction characteristics of biological aerosols and compared it with the experimental data [23,24]. These earlier studies indicated that the method was used to determine natural materials’ optical coefficients, such as biological aerosols, B. subtilis, Aspergillus niger spores, pear pollen, and entomogenous fungal spores, as well as dielectric materials, such as SiO2, Ge, porous silicon, and polar crystals. Moreover, these studies have shown that the K–K relation can be used to solve the complex refractive index of materials in the whole band region, which provides a significant reference, although with a few errors [25,26,27].
Therefore, the present study analyzed the pathogen of wheat stripe rust and the urediospores. The optical parameters of urediospores, such as the complex refractive index and dielectric constant, were solved based on electromagnetic theory and K–K transformation. The experimental flow chart is shown in Figure 1.
From Figure 1, we can see that the main contents are as follows: active and inactive urediospores of wheat stripe rust pathogen were prepared first, the spectral data of reflectivity and absorptivity from a Fourier spectrometer were acquired, and the sensitive bands were screened. Furthermore, the optical coefficients, such as the reflection phase shift, the complex refractive index, and the dielectric constant of urediospores, were solved and combined with theoretical analysis and the spectral data of the biological samples, and the factors influencing the optical constants of different spores were analyzed. Finally, the absorption spectrum of the spores was comprehensively analyzed to determine the vibration corresponding to various effective components in the spores. The findings of the study were verified with HPLC-MS and Near-Infrared Spectroscopy Analysis Technology, and they lay a foundation for detecting and discriminating urediospores of wheat stripe rust and indicate the significance of optical constants of other biological samples.
2. Materials and Methods
2.1. Preparation of Biological Samples
The wheat stripe rust used in this experiment was cultured in the Southeast Kiln low-temperature greenhouse of the Research Center for the Creation and Utilization of Wheat Disease Resistant Germplasm Resources, College of Plant Protection, Northwest A&F University. The spores were collected in tubes after removing the impurities, and these tubes were placed in a dry dish with silica gel and stored under appropriate conditions until future use. The microstructure and morphology of the spores were observed with scanning electron microscopy (TM3000, HITACHI, Tokyo, Japan), and the elements on the spore surface were analyzed using an element analyzer (EA3000, EURO VECTOR, Lombardia, Italy).
2.2. Acquisition of Spectral Data
The urediospores of wheat stripe rust were placed at room temperature for 2 h to balance the moisture and temperature and to eliminate the influence of water and temperature on the measurement before spectral data collection. The reflectivity of a sample aliquot was acquired using a Fourier near-infrared spectrum acquisition instrument (MPA Fourier Near-Infrared Spectrometer, Bruker, Billerica, Germany,). Spectrum was obtained from 4000 to 12,800 cm−1 at a spectral resolution of 8 cm−1; scanning was carried out 64 times. Diffuse reflection was measured with the integrating sphere system. In this model, the samples were evenly placed in a sample cup, and the bottom of the cup was filled with samples and gently pressed with a rotator. The cup was placed into the integrating sphere of the Fourier near-infrared spectrometer to measure the diffuse reflection. Each sample was measured five times, and the average value was calculated to obtain the original near-infrared spectrum of the wheat stripe rust spores. Inactivated spores were obtained by treating the collected fresh spores at high temperatures (80 °C, 60 min), and their spectral data were measured using the same method mentioned above. The background information can be complex due to the nondestructive testing of samples, and the original near-infrared spectrum may contain noise, including high-frequency random noise, baseline drift, and light scattering. Therefore, the original spectral data generated were preprocessed for subsequent analysis and calculation to reduce or eliminate the noise generated in spectrum acquisition.
2.3. Components of Urediospores Detected Using HPLC−MS
A high−resolution ion mobility spectrometry (LC−30A+TripleTOF5600+; AB SCIEX, Framingham, MA, USA) was used in this study to analyze the components of urediospores. Approximately 50 mg of freeze-dried spores were accurately weighed and mixed with 8 mL of 85% methanol in a vortex mixer for 1 min and broken with an ultrasonic wave for 4 h. The extract was centrifuged at 8000 r/min for 15 min. The supernatant obtained was mixed with 24 mL of 85% methanol for 1 min in a vortex mixer and disrupted with an ultrasonic wave for 4 h. The extract was again centrifuged at 8000 r/min for 15 min. The supernatant was dried with nitrogen-blowing for about 4 h to concentrate the content and ensure the measurement accuracy. The same procedure was repeated to obtain a purer form with a higher concentration of urediospores and stored at −80 °C until further analysis. Methanol (Merck−I, Darmstadt, Germany) of chromatographic purity was used in this procedure.
Sample separation was carried out using a HSS T3 chromatographic column (1.8 μm, 2.1 mm × 100 mm, 100 A, WATERS, Framingham, MA, USA), with 5 μL injection volume, 40 °C column temperature, 0.3 mL/min flow rate, and two mobile phases (0.15% formic acid aqueous solution and 0.15% formic acid acetonitrile solution). Stepwise elution was set for 40 min as follows: 0–1.5 min, 98% formic acid aqueous solution and 2% formic acid acetonitrile solution; 1.5–29.9 min, 50% formic acid aqueous solution and 50% formic acid acetonitrile solution; 30–40 min, 98% formic acid acetonitrile solution. Further, mass spectrometry was carried out using the following parameters: atomization pressure 50 psi; auxiliary gas pressure 50 psi; Ion source temperature 550 °C; spray voltage was set as 5500 V for the cation and 4500 V for the anion; mass acquisition ranged from 50 to 1500 Da. Three replicates were analyzed per sample.
Further, the Analyst software was used to detect the peak in the initial LC-MS chromatographic data and deconvoluted; peaks with a signal-to-noise ratio of less than 5 were removed. The three-dimensional data (mass/time/intensity) of each sample were then exported. The mass deviation was 0.4 Da, the purity threshold was 0.05, and the time deviation was 0.5 min.
2.4. Optical Coefficient Calculation Based on K–K Relation
K–K relation reveals the relationship between the real and imaginary parts of the causal optical response function from a mathematical point of view, connecting two physical quantities that need two different measurement methods [26,27,28]. Therefore, K–K is widely used in the analysis and calculation of material optical coefficients and has been gradually applied in the analysis of optical coefficients of biological material in recent years [29,30,31]. The optical coefficient of pathogen spores can be calculated by combining the reflectance spectra of samples with the K–K relation.
According to the K–K relation, for the reflected electromagnetic wave of vertical incidence, the reflected phase shift of the sample can be calculated using the following equation:
where is the near-infrared band reflectance of the sample, is the reflected wavelength, and P is the Cauchy principal value function. Combined with reflectivity and reflection phase shift , the complex refractive index of spores can be determined according to the following formulas:
where is the full band vertical reflectance of the sample, is the reflection phase shift, and and are the real and imaginary parts of the complex refractive index, respectively. The reflectivity of a sample can be measured only in a limited wavelength range, considering the effective utilization range of the electromagnetic wave and the working band of the experimental instrument. The reflectivity of other bands can be obtained by extrapolating the empirical formula, using constant extrapolation or exponential extrapolation, and obtaining the complex refractive index in the complete wave band. The present study used the constant extrapolation method to expand the reflectivity range.
2.5. Discriminant Analysis of Urediospores Activity Based on ANN
Combining the near-infrared spectroscopy technology and Artificial Neural Network (ANN) was the method used to verify the above research. Firstly, the spore samples stored in the refrigerator were placed at room temperature two hours before use. Approximately 0.70 g of stripe rust spores and 0.70 g of inactivated spores at room temperature were weighed, set in a circular container, spread, and used to collect the spectral data.
The portable ocean optics spectrometer STS-NIR (40 mm × 42 mm × 24 mm) was used to measure the reflection spectrum at wavelengths ranging from 650 to 1100 nm, with an integration time of 0.1 s, a signal-to-noise ratio of more than 1500, a resolution of 1024, and a dark noise ≤ 3 counts rms. It also has the grating of 600 g/mm and an optical fiber connector of SMA 905. A tungsten halogen lamp was used as the light source. During the measurements, the optical fiber port rotates slowly on the surface of the spore sample from the center to the outer edge to collect the spectral data; 1000 spectra were collected for each urediospore, and repeated scanning was avoided as far as possible.
Furthermore, the PCA and RF were performed for the near-infrared spectral data to select the characteristic wavelength of the urediospores. The K-S algorithm was used to divide the 2000 data sets into the training set and testing set, and the ratio of the training set and testing set was about 3:1; the training set was used to establish the near-infrared spectral model, and the testing set was used to validate the model’s accuracy. Based on this, three modeling methods—BPNN, PLS-DA, and Support Vector Machine (SVM)—were used to determine the activity of urediospores. BPNN was composed of the input layer, the output layer, and the hidden layer. The input data used were spectral data in the near-infrared band, and the output unit was a neuron, which indicates whether urediospores are active. The SVM used libsvm, with Gaussian kernel function. Meanwhile, c was the penalty parameter; a smaller parameter indicated lower tolerance, and the noise was ignored; g was the degree of smoothness, and the larger the g, the less smooth it was. In the PLS-DA recognition model, the number of Monte Carlo simulation N was set as 500, the number of Monte Carlo sampling Nmcs was 50, and the maximum number of potential variables for cross-validation of PLS was selected as 6.
3. Results
3.1. SEM and Elemental Analysis of Spores
The SEM and elemental features of the urediospores of wheat stripe rust were obtained, as shown in Figure 2.
Figure 2 shows that the urediospores of stripe rust were slightly deformed from external pressure and were clearly visible. Our analysis revealed that the urediospores of wheat stripe rust are spherical-like particles with a size of about 30 µm, and their optical scattering characteristics were closely related to the optical parameters, such as incident wavelength, spore shape, and refractive index. Further analysis identified carbon, oxygen, potassium, and phosphorus as the common elements on the surface of urediospores; the content of surface elements was slightly variable among the different spores, probably because the stripe rust spores belong to Teliomycetes of Basidiomycetes, and the main components of their cell walls are fibronectin, chitin, and glucan. Therefore, the types of elements were basically the same with a different activity; the element content was also slightly different.
3.2. Components of Urediospores Detected Using HPLC-MS
It is difficult to determine all compounds by using one model since the composition of urediospore is not clear; the positive and negative ion scanning modes were used to scan the mixed control sample and test sample solution. In this study, the substances found in all three repeats were identified as spore inclusions to avoid errors. The spore inclusions were analyzed by using the software Analyst TF 1.6, and the steps were conducted as follows: the collected ms data were imported into Peak View software for conversion, the peak areas in the curve were extracted, and the data matrix was obtained including mass charge ratio (m/z), retention time (TR), peak area (intensity), and other information. The substances with high reliability were further used to search against the TCM MS/MS library to identify the properties of the substances. Finally, the position of the substances in the metabolic network was determined. The extracts obtained from the urediospores are shown in the table below.
Table 1 shows that the HPLC-MS extracted and identified 31 components from wheat stripe rust urediospores, including amino acids, nucleotides, esters, and phenols. These components are mainly involved in strengthening the cell wall to achieve self-protection and inhibit the growth of pathogenic bacteria. The electron microscopy results from Figure 1 and the previous literature show that the electron density in the protoplasm of the mature urediospores significantly increased, and a large number of fat particles appeared and accumulated in the protoplasm. Among these components, 14 kinds of these were found in the inactivated urediospores, but the relative levels were different between the two types of spores. Shown in Table 1, the area differences in magnitude of components were more than hundreds of thousands of orders, such as phenprobamate, glutamic acid, betaine, adenosine, histidine, and citric acid. These findings suggested differences in the components of the two types of spores, especially the main content.
3.3. Spectral Data of Stripe Rust Urediospores
The original near-infrared spectra of active/inactivated urediospores of wheat stripe rust were collected, and the reflection spectra were then obtained after pretreatment, as shown in Figure 3.
Figure 3 shows the upward trend of the reflection curve (0.2 to 0.7) after pretreatment in the wavenumber ranging from 3800 cm−1 to 8000 cm−1, but it decreases slowly above 8100 cm−1. For active stripe rust urediospores, the reflectivity increased rapidly from 0.32 to 0.65 at 4000 cm−1–5900 cm−1 with fluctuation at 4200 cm−1, 4450 cm−1, 5100 cm−1, respectively—probably because the spiny verruca on the inverted oval surface of the urediospores that is mainly composed of cellulose and chitin, with the stretching vibration of the N-H functional group, produced the fluctuations. Then, a fluctuation of reflectivity was observed between 5800 cm−1 to 6400 cm−1, and this fluctuation was probably due to the stretching vibration of pyrimidine C=O in the nucleic acid. Subsequently, when the wave number was in the 7900 cm−1–12,000 cm−1 range, the reflectivity became stable and decreased from 0.65 to 0.52 slowly.
Compared with the reflection spectra of active urediospores, the overall trend in the reflection spectra of the spores after inactivation was consistent with those of the above active spores. However, the inactivated spores’ reflectivity was relatively low in the 3300 cm−1–6000 cm−1 wavenumber range, which could be attributed to the structural changes in the C=N of the proteins of the inactivated urediospores. From 7400 cm−1 to 11,000 cm−1, the overall value of the inactivated spores was higher than that of the active spores, which might have resulted from the shrinkage of the cell wall of the inactivated spores due to water loss and concentrations of extracellular matrix increase. The above differences would directly affect the optical coefficient and characteristics of urediospores.
3.4. Optical Coefficient of Stripe Rust Urediospores
Based on the Fourier reflection spectra of the spores (Figure 3) combined with the K–K relation, the value of the real part (n) and imaginary part (k) of the complex refractive index of the sample in the near-infrared band were calculated. The results are shown in Figure 4.
The real part of the complex refractive index n reflects the propagation speed of the lightwave in the medium. The results in Figure 4 show that the n of the active/inactive urediospores calculated from the K–K relation displayed an upward trend, ranging from 1.08 to 1.4, within the wavelength range of 800–2800 nm, which is consistent with the reported basic interval complex refractive index of biological samples. From 800 nm to 1400 nm wavelength, the n of inactive urediospore was lower than that of the active spores. The n of the two spores remained basically unchanged in the 1450–1950 nm range, with only slight fluctuations; the values were maintained from 1.1 to 1.13. The sharp change in the real part of the complex refractive index of spores occurred in the wavelength ranging from 1950 nm to 2750 nm, and the n value increased rapidly from 1.13 to 1.38. The stretching vibration due to the O-H and N-H bonds in chitin and polysaccharide, the main components of the cell wall of urediospores, can explain this increase. Therefore, the real part of the complex refractive index n of the inactivated urediospores has been only slightly distinguished from that of active urediospores, suggesting that whether the urediospores are active has a little effect.
The imaginary part of the complex refractive index k showed an upward trend with a few fluctuations, and the value ranged from −0.02 to 0.12, which reflects the attenuation degree of the lightwave when propagating in the medium. In the 800–1300 nm wavelength range, the value of k is basically 0, and when above 1300 nm, k increased rapidly from 0 to 0.23. In the whole wavelength range, the values of inactive urediospores were significantly higher than those of active ones. The increase may be due to the stretching vibration of the C=O bond in the protein functional group and the N-H bond in dextran. It is worth noting that the imaginary part of the complex refractive index of inactive spores fluctuated from 2350 nm to 2380 nm due to the stretching vibration of the C-H bond in the lipid functional groups. A significant difference in the k value between active and inactive urediospores was probably due to the weakening of stretching vibration of the C=O and C=N bonds in the functional groups after the denaturation of the spore protein.
Finally, the optical coefficient of urediospores was calculated and verified with the Mie scattering theory. The results showed that the activity has little effect on the structural change of urediospores of stripe rust, and thus, the propagation speed of the two samples was basically the same. Meanwhile, inactivation showed an impact on the components of urediospores. Therefore, the difference in the imaginary part of the complex refractive index directly affected the extinction performance of spores in the near-infrared region, and the absorption capacity of active urediospores was greater. These data suggested that the complex refractive index of urediospores can reflect its optical properties and provide a possibility for optical detection; however, the specific differences need to be further analyzed in combination with the absorption characteristics of the urediospores.
3.5. Investigation of Optical Properties of Stripe Rust Urediospores
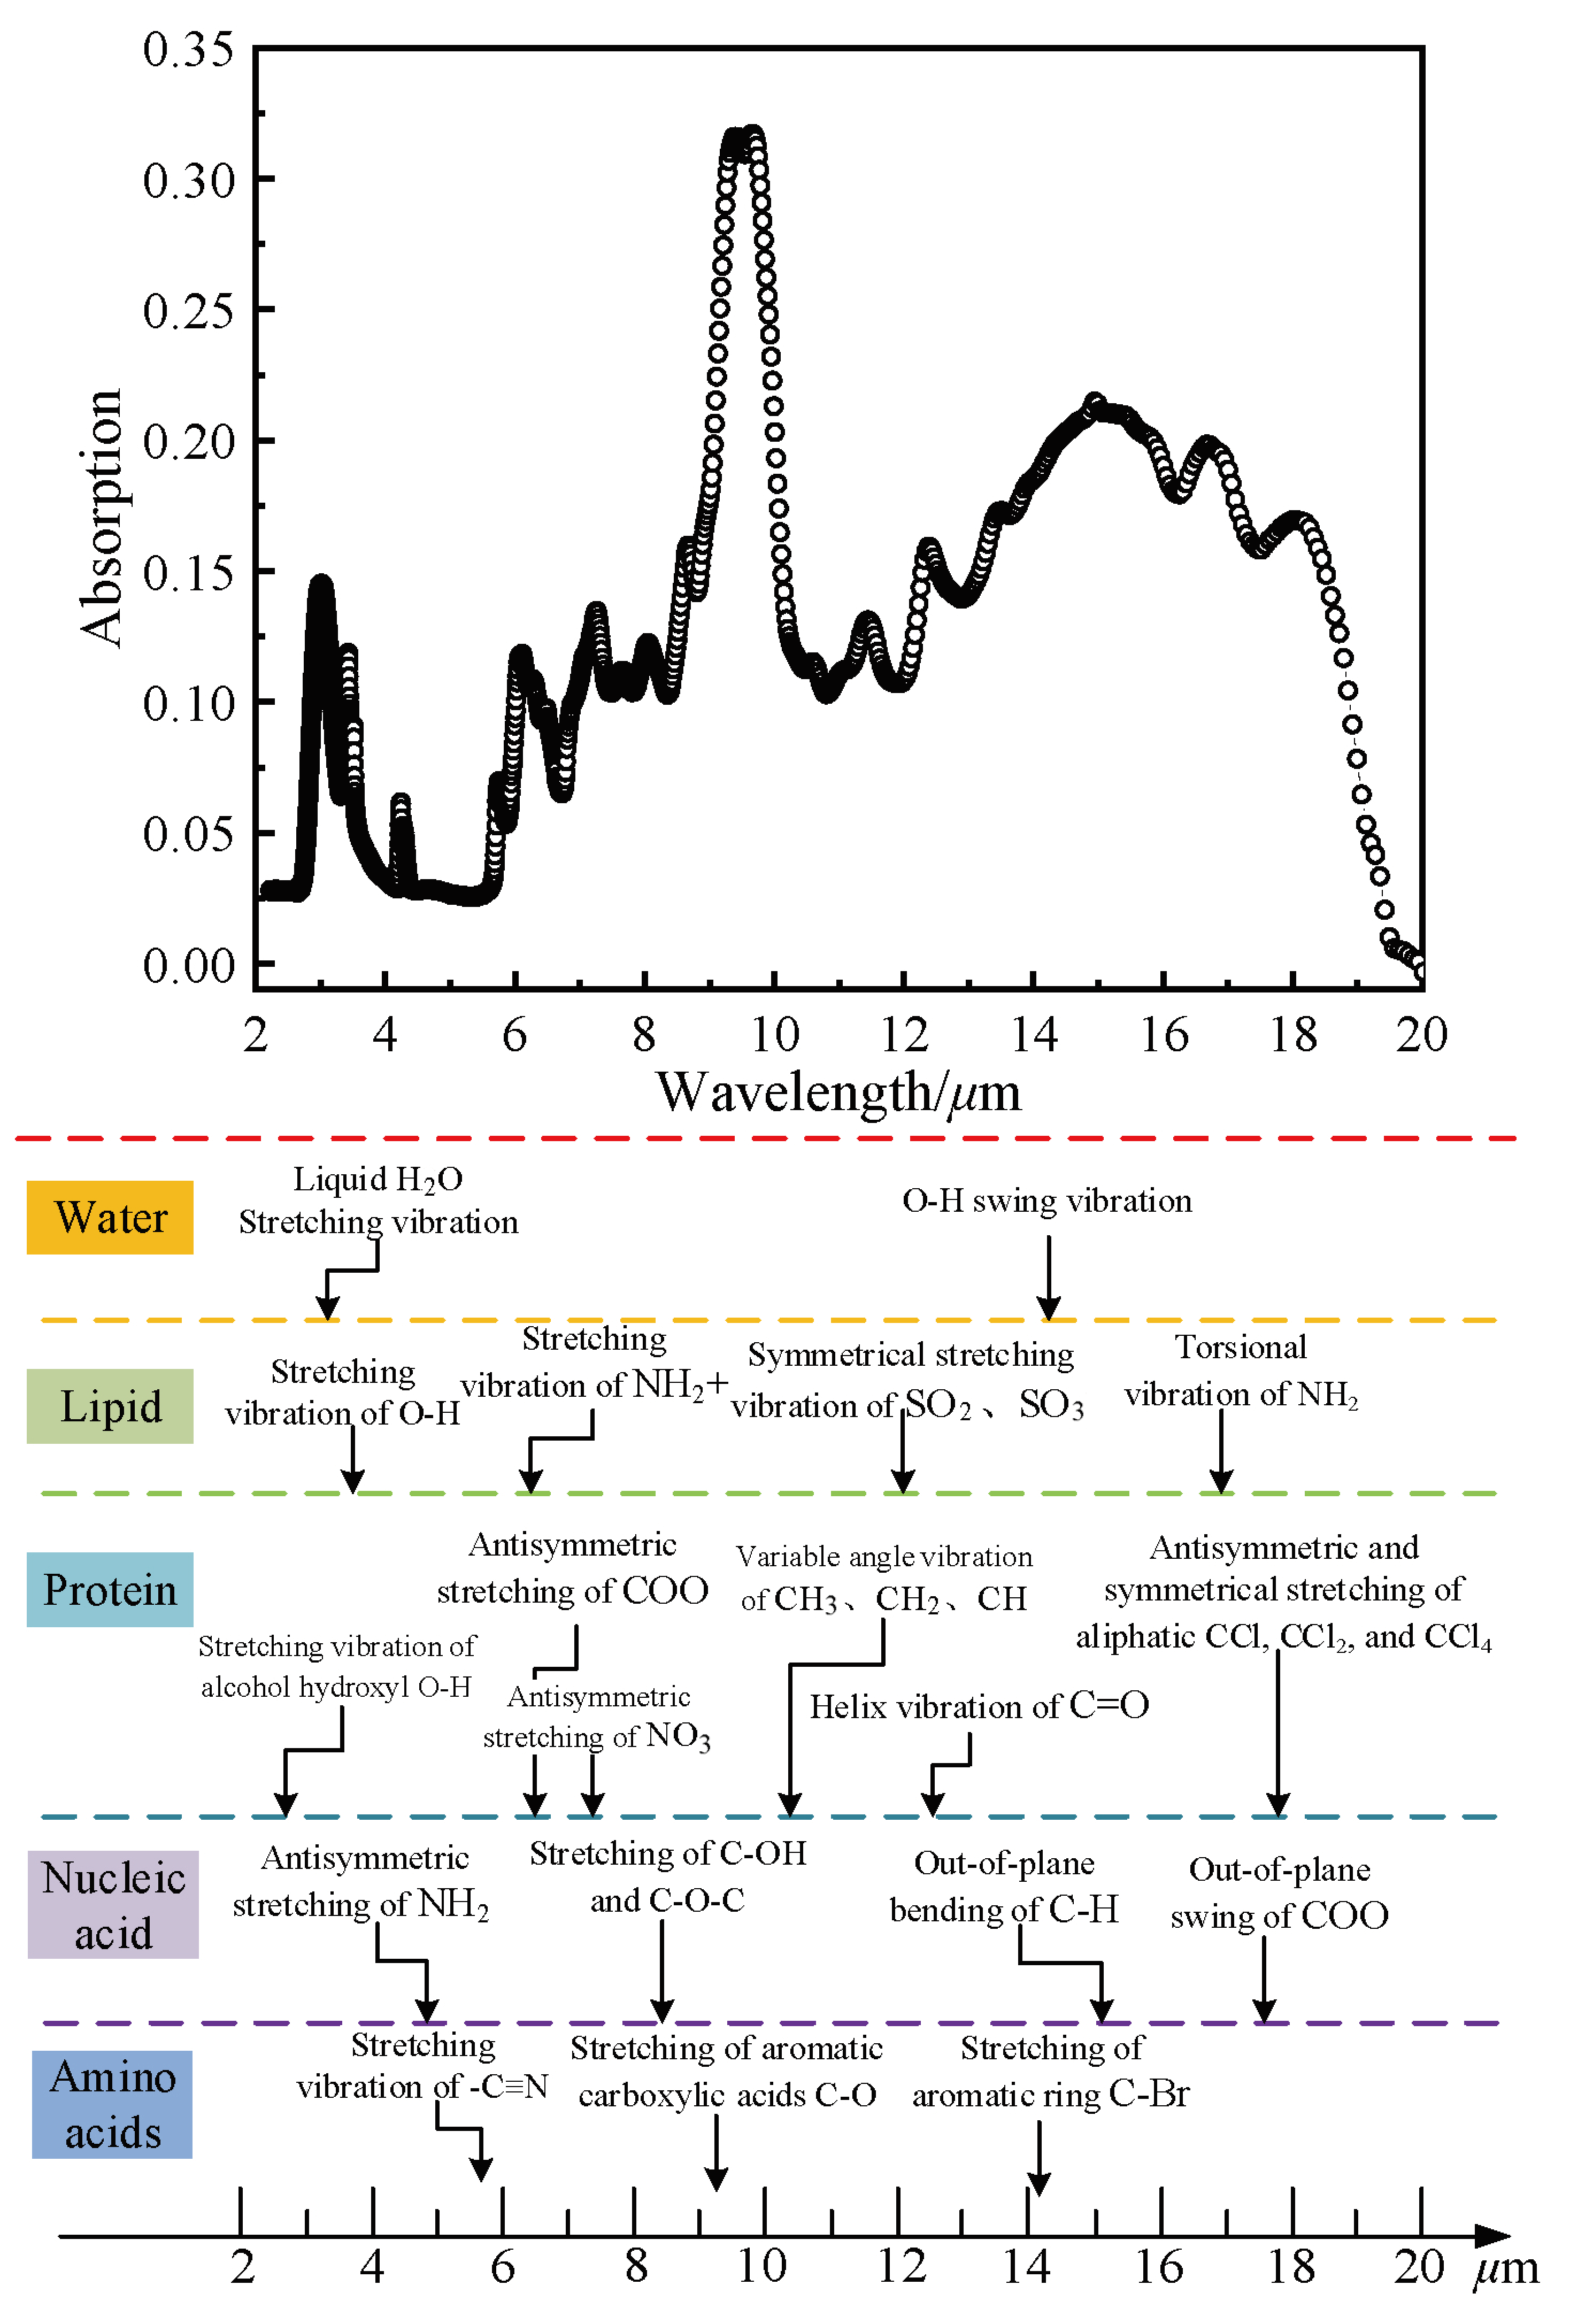
Furthermore, we performed a comprehensive analysis combined with infrared absorption spectra to clarify the difference in the extinction characteristics of the cells of urediospores. The urediospores were mixed with KBr at a ratio of 1:100, the mixed sample was ground, and a slide was prepared using the 769YP-15A powder compressing machine. The absorption spectrum of the compressed sample was acquired with a Fourier infrared spectrometer (Bruker, Vertex70 Fourier infrared spectrometer), with a collection range of 400–4000 cm−1, a spectral resolution of 4 cm−1, and scanning for 64 times. The absorption spectrum of urediospores is shown in Figure 5.
In the infrared range of 2–20 μm, several obvious absorption peaks were detected for the urediospores, which were determined based on the components of the cells. Therefore, we analyzed urediospores with the HPLC-MS, and a comprehensive analysis showed that the basic components of urediospores are water, proteins, amino acids, lipids, and nucleic acids. Multiple absorption peaks were found in the 2.7–3.2 μm range, probably because the electron density of the protoplasts of mature urediospores was enhanced and fat particles accumulated in the protoplast. Fat O-H showed obvious absorption peaks in the 2.7–3.2 μm range; multiple stretching vibrations of O-H of different sugars produced obviously and dispersed strong absorption bands. In addition, in this range, the characteristic peak was formed due to the stretching vibration of liquid H2O, the stretching vibration of alcohol hydroxyl O-H, and the antisymmetric stretching of NH2. Subsequently, a sharp absorption peak was recorded at 4.3 μm, caused due to the stretching vibration of -C≡N and NH2+ in cyanide.
After selecting a section of a stable spectral line, multiple and dense broadband absorption peaks were found in the 6–9 μm range. Urediospores contain different kinds of amino acids and proteins; chitinase in the cell wall contains PR proteins, such as proline-rich protein and glycine-rich protein, in which the antisymmetric stretching of COO and NO3; the variable angle vibration of CH3, CH2, and CH; the stretching of C-OH and C-O-C; and the stretching of aromatic carboxylic acids C-O can form obvious characteristic peaks. The antisymmetric stretching of COO- in amino acids and the helix vibration of C=O in proteins are the strong, distinct absorption peaks in the spectrum. Then, the most obvious absorption peak appeared near 9.5 μm, which may be associated with the conjugate vibration of aromatic ring C-Br stretching and the symmetrical stretching vibration of SO2 and SO3 in the aromatic sulfonic acid of urediospores. A broad but inapparent absorption band appeared in the 11.5–18 μm range, which was challenging to analyze. Analysis of the corresponding components of the urediospore proved the occurrence of out-of-plane bending of many aromatic ring C-H and aldehyde C-H; torsional vibration of NH2; antisymmetric and symmetrical stretching of aliphatic CCl, CCl2, and CCl4; and out-of-plane swing of amino acid COO, which might have led to this observation. Moreover, the wide absorption band produced due to the swing of H2O in the vacuole at 14.3 μm was also concentrated here, which comprehensively led to the emergence of this broadband absorption spectrum.
3.6. Verification of Urediospores Activity Based on NIRS and ANN
To verify the above conclusions, the near-infrared spectroscopy mentioned in Section 2.5 was used to determine the activity of urediospores. The selected characteristic wavelengths of a discriminant model based on PCA and RF were listed as 766 nm, 841 nm, 911 nm, 940 nm, 1011 nm, and 1108 nm, which verified the optical and molecular vibration properties of wheat stripe rust urediospores. The results using different algorithms are shown in Table 2.
From Table 2, we can see that every model attained a near 100% identification rate, indicating that the activity of wheat stripe rust can be determined with near-infrared spectroscopy; moreover, the differences in the optical properties were also verified.
4. Discussion
Through a comprehensive analysis of the above results, it can be concluded that the method proposed in this study can calculate the urediospores’ optical parameters including the real part and imaginary part of the complex refractive index. The real part of the complex refractive index n of urediospores was between 1.06 and 1.4, and the imaginary part k ranged from −0.02 to 0.12, which is consistent with the results of biological samples in the literature [6,23,24]. It indicates that the calculated results are reliable, and the propagation speed of light in cells is difficult to discriminate based on activity at the micron level. The method based on the K–K relation and FTIR shows that the optical characteristics of urediospore samples can be obtained, which lays a theoretical foundation for optical detection sensors. However, there is certain limitation in this research.
First, according to the interaction relationship between matter and light, the real part n and imaginary part k satisfy the condition of n ≥ 1, and k ≤ 0 at any wavelength, respectively. The values of k in this study do not satisfy the above conditions above 2000 nm wavelength because of the weak optical signal of microorganisms and the experimental instrument noise.
Second, due to the skin effect, the penetration thickness of the incident wave to the compressed sample is limited in the near-infrared to infrared band, the transmittance and reflectivity are assumed under ideal conditions, and a simplified K–K relation is presented in this method.
5. Conclusions
The rapid identification and activity detection of urediospores are crucial for the early monitoring and warning of wheat stripe rust, and clarifying the optical characteristics of urediospores is the foundation for detection. Therefore, this study focused on wheat stripe rust, generated the near-infrared reflection spectra of active/inactive urediospores, calculated the optical coefficient, and analyzed the optical characteristics. The specific conclusions are as follows.
First, in the near-infrared region, the real part of the complex refractive index n of urediospores was between 1.06 and 1.4, and the imaginary part k ranged from −0.02 to 0.12; the activity of the spore had an effect on n. This result indicated that at the micron level, the propagation speed of light in cells is difficult to be discriminated based on activity. However, it was quite different for the imaginary part k, which suggested that the change in the component content directly affects the extinction characteristics of cells.
Second, the absorption spectra of the urediospores were analyzed based on the above findings. The study detected amino acids, glucans, vacuoles, proteins, and lipids in the urediospores based on the characteristic peaks in the absorption spectrum.
These findings suggest that the optical characteristics of urediospore samples can be obtained using the K–K relation, which lays a theoretical foundation for optical detection. This method also provides a reference for the analysis, calculation, and rapid identification of optical characteristics of various other biological samples.
Author Contributions
Conceptualization, methodology, investigation and writing—original draft preparation, X.C.; validation, writing—review and editing and formal analysis, Z.Y.; supervision, D.H. All authors have read and agreed to the published version of the manuscript.
Funding
This research was funded by National Natural Science Foundation of China (32201662); Natural Science Basic Research Program of Shaanxi Province (2021JQ-145); China Postdoctoral Science Foundation (2020M673503); Key R&D program of Shaanxi Province (2021NY-169).
Data Availability Statement
No new data were created.
Acknowledgments
The authors would like to thank Guorong Wei of the college of plant protection of NWAFU for the assistance in the preparation of urediospores of wheat stripe rust. The authors would like to thank the instrument shared platform of the college of food science and engineering of NWAFU, for the assistance in the MPA FITR analysis.
Conflicts of Interest
The authors declare no conflict of interest. The funders had no role in the design of the study; in the collection, analyses, or interpretation of data; in the writing of the manuscript; or in the decision to publish the results.
References
- Hu, X.; Cao, S.; Xu, X. Predicting Overwintering of Wheat Stripe Rust in Central and Northwestern China. Plant Dis. 2019, 104, 44–51. [Google Scholar] [CrossRef] [PubMed]
- Khan, A.A.; Faheem, M.; Bashir, R.N.; Wechtaisong, C.; Abbas, M.Z. Internet of Things (IoT) assisted Context Aware Fertilizer Recommendation. IEEE Access 2022, 10, 129505–129519. [Google Scholar] [CrossRef]
- Khan, A.A.; Nauman, M.A.; Bashir, R.N.; Jahangir, R.; Alroobaea, R.; Binmahfoudh, A.; Alsafyani, M.; Wechtaisong, C. Context Aware Evapotranspiration (ETs) for Saline Soils Reclamation. IEEE Access 2022, 10, 110050–110063. [Google Scholar] [CrossRef]
- Zhao, Y.; Jing, X.; Huang, W.J.; Dong, Y.; Li, C. Comparison of Sun-Induced Chlorophyll Fluorescence and Reflectance Data on Estimating Severity of Wheat Stripe Rust. Spectrosc. Spectr. Anal. 2019, 39, 2739–2745. [Google Scholar]
- Atta, B.M.; Saleem, M.; Ali, H.; Bilal, M.; Fayyaz, M. Application of Fluorescence Spectroscopy in Wheat Crop: Early Disease Detection and Associated Molecular Changes. J. Fluoresc. 2020, 30, 801–810. [Google Scholar] [CrossRef]
- Liu, P.Y.; Chin, L.K.; Ser, W.; Chen, H.F.; Hsieh, C.-M.; Lee, C.-H.; Sung, K.-B.; Ayi, T.C.; Yap, P.H.; Liedberg, B.; et al. Cell refractive index for cell biology and disease diagnosis: Past, present and future. Lab Chip 2016, 16, 634–644. [Google Scholar] [CrossRef]
- Pal, V.; Sharma, S.K.; Goel, A. Biological Warfare Agents and their Detection and Monitoring Techniques. Def. Sci. J. 2016, 66, 445–457. [Google Scholar] [CrossRef]
- Skottrup, P.; Hearty, S.; Frøkiær, H.; Leonard, P.; Hejgaard, J.; O’kennedy, R.; Nicolaisen, M.; Justesen, A.F. Detection of fungal spores using a generic surface plasmon resonance immunoassay. Biosens. Bioelectron. 2007, 22, 2724–2729. [Google Scholar] [CrossRef]
- Su, J.; Yi, D.; Su, B.; Mi, Z.; Liu, C.; Hu, X.; Xu, X.; Guo, L.; Chen, W.-H. Aerial Visual Perception in Smart Farming: Field Study of Wheat Yellow Rust Monitoring. IEEE Trans. Ind. Inform. 2020, 17, 2242–2249. [Google Scholar] [CrossRef] [Green Version]
- Van der Heyden, H.; Dutilleul, P.; Charron, J.-B.; Bilodeau, G.J.; Carisse, O. Monitoring airborne inoculum for improved plant disease management. A review. Agron. Sustain. Dev. 2021, 41, 40. [Google Scholar] [CrossRef]
- Matsumoto, N.; Hosokura, T.; Nagashima, T.; Hangyo, M. Measurement of the dielectric constant of thin films by terahertz time-domain spectroscopic ellipsometry. Opt. Lett. 2011, 36, 265–267. [Google Scholar] [CrossRef]
- Xia, Y.; Zhang, M.; Zhu, Y.; Ye, W. Displacement calculation method for homodyne interferometers based on spatial phase delay of beams. Opt. Eng. 2022, 61, 014106. [Google Scholar] [CrossRef]
- Postolache, M.; Dimitriu, D.G.; Nechifor, C.D.; Bota, S.C.; Closca, V.; Dorohoi, D.O. Birefringence of Thin Uniaxial Polymer Films Estimated Using the Light Polarization Ellipse. Polymers 2022, 14, 1063. [Google Scholar] [CrossRef]
- Ge, D.; Zhou, Y.; Shi, J.; Zhang, L.; Zhu, S. Highly sensitive refractive index sensor based on Bloch surface waves with lithium niobate film. Appl. Phys. A Mater. Sci. Process. 2021, 128, 53. [Google Scholar] [CrossRef]
- Demchenko, Y.U.A.; Bilenko, I.A.; Gorodetsky, M.L. Optimisation of the prism coupling of optical whispering-gallery-mode microcavities. Quantum Electron. 2017, 47, 743–747. [Google Scholar] [CrossRef]
- Qi, H.; Zhang, X.; Jiang, M.; Yang, L.; Li, D. Optical constants of polyacrylamide solution in infrared spectral region. Optik 2017, 146, 27–32. [Google Scholar] [CrossRef]
- Shirkavand, A.; Farivar, S.; Mohajerani, E.; Ataie-Fashtami, L.; Msc, M.H.G. Non-invasive Reflectance Spectroscopy for Normal and Cancerous Skin Cells Refractive Index Determination: An In Vitro Study. Lasers Surg. Med. 2019, 51, 742–750. [Google Scholar] [CrossRef]
- Rowley, J.D.; Bas, D.A.; Zawilski, K.T.; Schunemann, P.G.; Bristow, A.D. Terahertz emission from ZnGeP2: Phase-matching, intensity, and length scalability. J. Opt. Soc. Am. B 2013, 30, 2882–2888. [Google Scholar] [CrossRef] [Green Version]
- Wang, M.; Zhong, K.; Liu, C.; Xu, D.; Shi, W.; Yao, J.-Q. Optical coefficients extraction from terahertz time-domain transmission spectra based on multibeam interference principle. Opt. Eng. 2017, 56, 044101. [Google Scholar] [CrossRef]
- Elvira, L.; Tiago, M.M.; Yoza, S.A.N.; Kitano, C.; Higuti, R.T. Determination of Phase Jumps in the Measurement of Phase Velocity of Samples Obeying a Frequency Power-Law Attenuation Coefficient Using Krames-Krong Relations. IEEE Trans. Ultrason. Ferroelectr. Freq. Control 2020, 67, 1438–1447. [Google Scholar] [CrossRef]
- Tuminello, P.S.; Arakawa, E.T.; Khare, B.N. Optical properties of bacillus subtilis spores from 0.2 to 2.5 mm. Appl. Opt. 1997, 36, 2818. [Google Scholar] [PubMed]
- Gurton, K.P.; Ligon, D.; Kvavilashvili, R. Measured infrared spectral extinction for aerosolized bacillus subtilis var. Niger endospores from 3 to 13 mm. Appl. Opt. 2008, 40, 4443–4448. [Google Scholar] [CrossRef] [PubMed]
- Zhao, X.; Hu, Y.; Gu, Y.; Chen, X.; Wang, X.; Wang, P.; Dong, X. Analysis of optical properties of bio-smoke materials in the 0.25–14 μm band. Chin. Phys. B 2019, 28, 034201. [Google Scholar] [CrossRef]
- Gu, Y.; Hu, Y.; Zhao, X.; Chen, X.; Wang, P.; Zheng, Z. Discrimination of viable and dead microbial materials with Fourier transform infrared spectroscopy in 3–5 micrometers. Opt. Express 2018, 26, 15842. [Google Scholar] [CrossRef] [PubMed]
- Thomasz, P.S.; Jacek, G.; Kosmas, T. Analytical Methods for Causality Evaluation of Photonic Materials. Materials 2022, 15, 1536. [Google Scholar]
- Gulgowski, J.; Stefanski, T.P. Generalization of Kramers-Kronig relations for evaluation of causality in power-law media. Commun. Nonlinear Sci. Numer. Simul. 2021, 95, 105664. [Google Scholar] [CrossRef]
- Cao, L.; Yin, Z.Y.; Xia, H.T. Phase retrieval from the FTIR transmittance spectrum of thick materials with anchoring points in THz-TDS measurement. J. Opt. Soc. Am. B Opt. Phys. 2021, 38, 539–543. [Google Scholar] [CrossRef]
- Frezza, F.; Mangini, F.; Tedeschi, N. Introduction to electromagnetic scattering: Tutorial. J. Opt. Soc. Am. A Opt. Image Sci. Vis. 2018, 35, 163–173. [Google Scholar] [CrossRef]
- Suryani, S.; Heryanto, H.; Rusdaeni, R.; Fahri, A.N.; Tahir, D. Quantitative analysis of diffraction and infra-red spectra of composite cement/BaSO4/Fe3O4 for determining correlation between attenuation coefficient, structural and optical properties. Ceram. Int. 2020, 46, 18601–18607. [Google Scholar] [CrossRef]
- Xi, L.; Luo, R. Use of Kramers-Kronig relations to construct the master curves of asphalt materials. Mater. Struct. 2021, 54, 31. [Google Scholar] [CrossRef]
- Darwish, A.; Aboraia, A.; Soldatov, A.V.; Yahia, I. Deposition of Rhodamine B dye on flexible substrates for flexible organic electronic and optoelectronic: Optical spectroscopy by Kramers-Kronig analysis. Opt. Mater. 2019, 95, 109219. [Google Scholar] [CrossRef]
Figure 1.
Flow chart of the experimental procedures.

Figure 2.
Elemental analysis and SEM of urediospores of stripe rust.

Figure 3.
Near-infrared reflection spectra of stripe rust urediospores in the 3800–12,500 cm−1 range.
Figure 3.
Near-infrared reflection spectra of stripe rust urediospores in the 3800–12,500 cm−1 range.

Figure 4.
Real part and imaginary part of the complex refractive index of wheat stripe rust urediospores.
Figure 4.
Real part and imaginary part of the complex refractive index of wheat stripe rust urediospores.

Figure 5.
Infrared absorption spectrum of urediospores in the 2–20 μm range.


Table 1.
Extracts from wheat stripe rust urediospores.
| Compound Name | Formula | Active Urediospore | Inactive Urediospore | Difference | |||||
|---|---|---|---|---|---|---|---|---|---|
| Error (ppm) | RT Delta (min) | Intensity | AREA | Intensity | AREA | Intensity | AREA | ||
| Phenprobamate | C9H11NO2 | 0.2 | 9.66 | 300,586 | 31,922 | 65,576 | 6865 | −235,010 | −25,057 |
| Glutamic acid | C5H9NO4 | −1.5 | 12.8 | 509,206 | 135,232 | 294,410 | 93,303 | −214,796 | −41,929 |
| Leucine | C6H13NO2 | −1.9 | 9.55 | 97,721 | 8940 | 46,756 | 4605 | −50,965 | −4335 |
| Guanosine | C10H13N5O5 | −0.5 | 9.96 | 4098 | 521 | 19,518 | 2533 | 15,420 | 2012 |
| Betaine | C5H11NO2 | −3.4 | 9.59 | 1,215,207 | 184,686 | 1,368,450 | 284,471 | 153,243 | 99,785 |
| Adenosine | C10H13N5O4 | −0.7 | 8.74 | 231,812 | 74,757 | 980,176 | 122,799 | 748,364 | 48,042 |
| Nicotinic acid | C6H5NO2 | −3.6 | 11.86 | 83,469 | 16,829 | 43,974 | 12,546 | −39,495 | −4283 |
| Stachydrine hydrochloride | C7H13NO2 | 0.1 | 7.15 | 9460 | 1301 | 25,080 | 2078 | 15,620 | 777 |
| Isoleucine | C6H13NO2 | −1.9 | 9.55 | 97,721 | 8940 | 46,756 | 4605 | −50,965 | −4335 |
| Isoschaftoside | C26H28O14 | −1.5 | 10.62 | 10,207 | 867 | 14,645 | 1249 | 4438 | 382 |
| Histidine | C6H9N3O2 | −0.7 | 18.67 | 118,705 | 26,866 | 44,663 | 10,459 | −74,042 | −16,407 |
| Adenine | C5H5N5 | 0.7 | 9.41 | 6010 | 1082 | 61,548 | 7341 | 55,538 | 6259 |
| L(+)-Arginine | C6H14N4O2 | −0.8 | 19.64 | 3502 | 1615 | 15,676 | 3497 | 12,174 | 1882 |
| Citric acid | C6H8O7 | 1.4 | 7.64 | 1,397,725 | 397,974 | 725,711 | 254,013 | −672,014 | −143,961 |
Table 2.
Comparison of prediction rate and running time of each method.
| Model | Prediction Accuracy/% | Running Time/s |
|---|---|---|
| Original-PLS-DA | 99.899 | 242.89 |
| RF-PLS-DA | 99.798 | 11.29 |
| PCA-PLS-DA | 99.194 | 8.24 |
| Original-BPNN | 100 | 262 (Ten iterations) |
| RF-BPNN | 100 | 6 (Ten iterations) |
| PCA-BPNN | 100 | 3 (Ten iterations) |
| Original spectrum-SVM | 100 | 235.92 |
| RF-SVM | 100 | 7.26 |
| PCA-SVM | 99.899 | 4.03 |
Disclaimer/Publisher’s Note: The statements, opinions and data contained in all publications are solely those of the individual author(s) and contributor(s) and not of MDPI and/or the editor(s). MDPI and/or the editor(s) disclaim responsibility for any injury to people or property resulting from any ideas, methods, instructions or products referred to in the content. |
© 2023 by the authors. Licensee MDPI, Basel, Switzerland. This article is an open access article distributed under the terms and conditions of the Creative Commons Attribution (CC BY) license (https://creativecommons.org/licenses/by/4.0/).
Share and Cite
MDPI and ACS Style
Chen, X.; Yao, Z.; He, D. Investigation of Optical Properties and Activity of Wheat Stripe Rust Urediospores. Agriculture 2023, 13, 1316. https://doi.org/10.3390/agriculture13071316
AMA Style
Chen X, Yao Z, He D. Investigation of Optical Properties and Activity of Wheat Stripe Rust Urediospores. Agriculture. 2023; 13(7):1316. https://doi.org/10.3390/agriculture13071316
Chicago/Turabian StyleChen, Xu, Zhifeng Yao, and Dongjian He. 2023. "Investigation of Optical Properties and Activity of Wheat Stripe Rust Urediospores" Agriculture 13, no. 7: 1316. https://doi.org/10.3390/agriculture13071316
Note that from the first issue of 2016, this journal uses article numbers instead of page numbers. See further details here.