Spatial and temporal correlations of thermospheric zonal winds from GOCE satellite observations
 Ivana Molina
 Ludger Scherliess
- Center for Atmospheric and Space Sciences, Utah State University, Logan, UT, United States
Winds in the thermosphere play an important role in the transport of momentum and energy in the upper atmosphere and affect the composition, dynamics and morphology of the ionospheric plasma. Although the general morphology of the winds is well understood, we are only starting to understand its variability. During the last decade it has become inherently clear that in addition to solar forcing of the thermosphere, the lower atmosphere also is an important driver of thermospheric variability. Therefore, an understanding of thermospheric variability and its spatial and temporal correlations is critical for an improved understanding of the coupled ionosphere-thermosphere system and the coupling to the lower atmosphere. The Gravity Field and Steady-State Ocean Explorer (GOCE) provided zonal winds near dawn and dusk at an altitude of around 260 km from November 2009 to October 2013. We have used GOCE zonal wind observations from low- to mid-latitudes obtained during geomagnetically quiet times to investigate spatial and temporal correlations in the zonal winds near dawn and dusk. Latitudinal correlations were calculated for the GOCE zonal winds for December solstice separately for each year from 2009 to 2012 and their year-to-year variation was established. Correlations between hemispheric conjugate points were found at mid latitudes during the latter years. Latitudinal correlations for December solstice 2009 and June solstice 2010 were compared and the correlation length was found to be consistently larger in the winter hemisphere during dawn and in the summer hemisphere during dusk. Zonal wind longitudinal/temporal correlations were also determined for December 2009 and 2011 and for June 2010 and found to be periodic in longitude/time. The temporal evolution of the temporal/longitudinal correlations were found to gradually decrease over the course of several days. The maxima in the correlation coefficients were always located in the winter hemisphere during dawn and in the summer hemisphere during dusk. During dawn, the largest contributors to the temporal/longitudinal correlations were found to be nonmigrating tides, whereas during dusk, additional waves appear to play important roles.
1 Introduction
Neutral winds affect the composition in the thermosphere as well as the motion of the charged particles by dragging the plasma up and down magnetic field lines, changing rates of production and recombination (Kelley, 2009) and by creating electric fields via the neutral wind dynamo (Maute and Richmond, 2017). Thermospheric neutral winds are known to be affected by geomagnetic conditions, seasons, local time and atmospheric tides, among others (Wang et al., 2021) and vary over large temporal scales ranging from minutes to years. Understanding their variability becomes critical, as they transfer energy and momentum in the upper atmosphere and directly or indirectly affect the dynamics, morphology and composition of the ionosphere, which can disrupt radio communication and navigation systems (e.g., Calabia et al., 2023).
A powerful approach to quantify the variability in thermospheric winds is to calculate spatial and temporal correlations, which indicate a statistical relationship between variations in the winds at different times and locations on the globe. Spatial and temporal correlations are also important for model validations, which involve comparisons of correlations obtained from observations with those obtained from the models (e.g., Bruinsma et al., 2014). Correlations can also help to gain insight into physical processes that produce variability seen in observations (e.g., Forbes et al., 2005) and provide critical constraints for model error covariances used in various data assimilation schemes.
Correlations of different physical parameters are widely used to study the global morphology and variability in the atmosphere. Alken and Maus (2007) studied correlation lengths in the equatorial electrojet using CHAMP, Ørsted and SAC-C magnetic observations; Shim et al. (2008) studied the spatial correlations of day-to-day GPS Total Electron Content variations; Garcia et al. (2016) used correlations from GOCE density and cross-wind variations for gravity wave detection and characterization; Bruinsma et al. (2021) used density correlations as part of model assessments during geomagnetic storms. Liu (2014) and Liu (2016) investigated the correlation time of the zonal mean zonal wind, as well as the amplitudes of four main tidal components (DW1, SW2, DE3 and SW1) with winter stratospheric temperature anomalies using detrended time series of these quantities from a 20-year model simulation of the Whole Atmosphere Community Climate Model with thermosphere extension (WACCM-X).
In this paper, latitudinal and longitudinal/temporal correlations are presented for the GOCE zonal wind data at low- and mid-latitudes, and the results are discussed. In a companion paper Molina and Scherliess (2023) have used the same GOCE zonal wind observations to determine the zonal wave structures associated with nonmigrating tides.
This paper is organized as follows. Initially, the data and the methodology are described. Next the GOCE zonal wind latitudinal correlations are presented for December solstice 2009–2012 and June solstice 2010 followed by the longitudinal/temporal correlations for December solstice 2009 and June solstice 2010. Finally, the results are summarized and discussed.
2 Data
The Gravity Field and Steady-State Ocean Explorer (GOCE) mission provided cross-track thermospheric (zonal) neutral winds from November 2009 to October 2013. The satellite was launched on 17 March 2009 into a dawn-dusk Sun-synchronous orbit with an inclination of 96.7° (near-polar orbit). The mean altitude of the satellite was near 270 km during the initial years of the mission and gradually decreased to about 250 km during 2012 and 2013, with variations in the height of the satellite within one orbit of about 20 km. Although the main objective of GOCE was to investigate the gravitational field of the Earth, thermospheric parameters, including the densities and winds were also provided in 10-s increments by combining the accelerometer and ion thruster data, together with GPS tracking and star camera data (Doornbos et al., 2013). For the current study we used data set version 2.0.
Due to the very small orbital precession, the local solar time corresponding to the equatorial crossing of the satellite only slightly changed throughout the mission by about 20 min/year from initially 06:15/18:15 LT to 07:30/19:30 LT by the end of the mission. As a result, GOCE produced a large data set of zonal winds in the dawn-dusk sectors.
The errors in the GOCE zonal wind are of the order of ∼10%–20%, with the dominant source of errors being biases due to instrument calibration and external models used in the calculation of the winds (Doornbos et al., 2010).
3 Methodology
To investigate the correlations in the GOCE zonal winds, we focused on geomagnetically quiet 27-day periods (one solar rotation) that were centered as close as possible to the December solstice for the years 2009, 2010, 2011, and 2012 and the June solstice for the year 2010. These periods were chosen due to data availability and geomagnetic activity. The selected windows are:
• December 2009: 12 December 2009 to 07 January 2010
• December 2010: 05 December 2010 to 31 December 2010
• December 2011: 08 December 2011 to 03 January 2012
• December 2012: 08 December 2012 to 03 January 2013
• June 2010: 04 June 2010 to 30 June 2010
• June 2011: 08 June 2011 to 04 July 2011 (in Supplementary Material)
Figure 1 shows the daily F10.7 cm radio flux (1A) and daily Kp index (1B) for the span of the GOCE thermospheric data set. The December and June solstice periods selected for this study are indicated by yellow and purple vertical bars, respectively. During 2009 and 2010 the solar flux was significantly lower than during 2011 and 2012. The average F10.7 value for the selected window in December 2009 was 76 sfu and 81 sfu for the corresponding 2010 period. The average values for the 2011 and 2012 periods, on the other hand, were 132 sfu and 109 sfu, respectively. The average F10.7 value for the June 2010 period was 75 sfu and 95 sfu for the June 2011 window. Geomagnetic activity was generally very low during all selected periods with average Kp values over the individual 27-day periods not exceeding 10 for each of the December solstice periods and below 2- for the June solstice periods. Figure 1B shows that the daily Kp reaches a value of 3 only once during December 2011 and a value of 3.3 once during each June period. The total number of 10-s observations at low- and mid-latitudes for each 27-day time period is about 60,000.
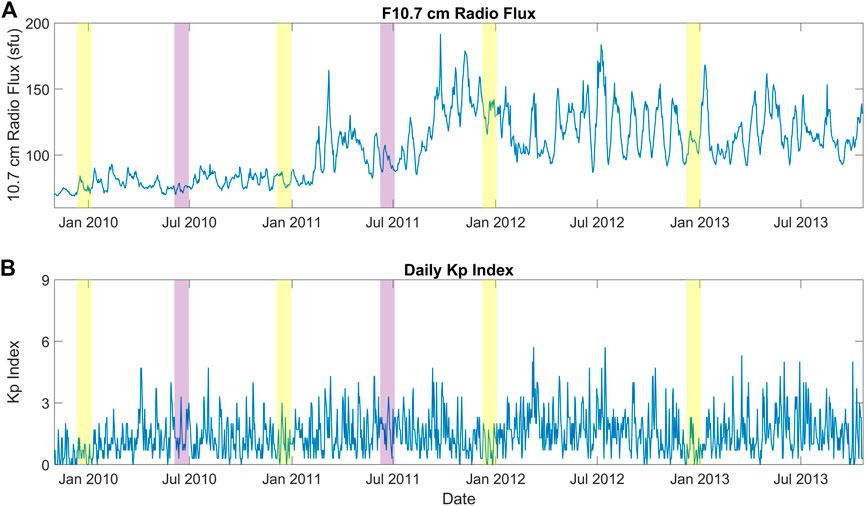
FIGURE 1. F10.7 cm radio flux (A) and daily Kp index (B) for the span of the GOCE thermospheric data set. The December and June solstice periods selected for this study are indicated by yellow and purple vertical bars, respectively.
We employ a methodology similar to Shim et al. (2008) to investigate spatio-temporal variability. The data was first separated according to the local time of the observation into dawn and dusk bins. The data along a given orbit was then binned and averaged in 1°-wide geographic latitude bands from −60° to 60° geographic latitude. Next, the median value was calculated for each latitude band from all orbits in each 27-day period. Finally, the corresponding median value, m, was subtracted from the binned and averaged measurements, u, to calculate the correlation as follows:
Here, i and j correspond to the reference and comparison points, respectively and the summation is executed over all orbits during the given 27-day period (norbit = 16 orbits/day *27 days = 432 orbits). Due to the orbit of the GOCE satellite longitude and time are intimately coupled and longitudinal/temporal correlations cannot be calculated by using pairs of observations along a given orbit. Instead, data pairs obtained from different orbits need to be used. This is accomplished by introducing the index
Latitudinal correlations are calculated by setting
So far, our approach will eliminate correlations associated with deterministic variations in solar cycle, season and local time and focuses on stochastic and tidal variations. The results of this analysis will be shown in Sections 4.1–4.3. To investigate correlations not associated with tides (Section 4.4) we subsequently eliminated their contribution from the zonal winds before calculating the longitude/time correlation coefficients. For this, we have used the results presented in Molina (2022), Molina and Scherliess (2023), who have used the same GOCE zonal wind observations to determine the zonal wave structures associated with nonmigrating tides by applying a longitudinal Fast Fourier Transform to the binned and averaged GOCE zonal wind data. We have used their results by subtracting their deterministic monthly-mean wave-1 to wave-5 structures from the GOCE zonal wind observations before calculating the longitude/time correlation coefficients.
4 Results
4.1 Latitudinal correlations
Figure 2 shows the December solstice latitude correlations in the GOCE zonal winds from mid to low latitudes during dawn. The results are separately shown for each year from 2009 to 2012 (Figures 2A–D) and correspond to correlations in the zonal wind between data pairs along a GOCE orbit characterized by the geographic latitude of a reference point and the geographic latitude of a comparison point. In general, during all four December solstice periods the correlations are larger and more extended in latitude in the northern hemisphere compared to the southern hemisphere. A year-to-year progression can also be observed in the correlations. From 2009 to 2010 the correlation lengths become generally smaller, and some localized correlations start to appear between near-conjugate points near ±40°- ±50° latitude. During 2011 this hemispheric conjugacy is even more evident, reaching correlation values of about 0.5. Finally, in 2012 it becomes weaker, with values of 0.3–0.4. Generally, the observed near-conjugacy is shifted towards the northern hemisphere. We have performed the same analysis using geomagnetic instead of geographic coordinates which resulted in a much cleaner presentation of the conjugacy (see Supplementary Figure S1). Therefore, the observed year-to-year variation in the conjugacy might be related to the variations in the solar flux from year to year with larger values during periods of enhanced solar activity. As mentioned above, the average F10.7 values changes from 76 sfu in 2009 to 81 sfu in 2010, 132 sfu in 2011 and 109 sfu in 2012.
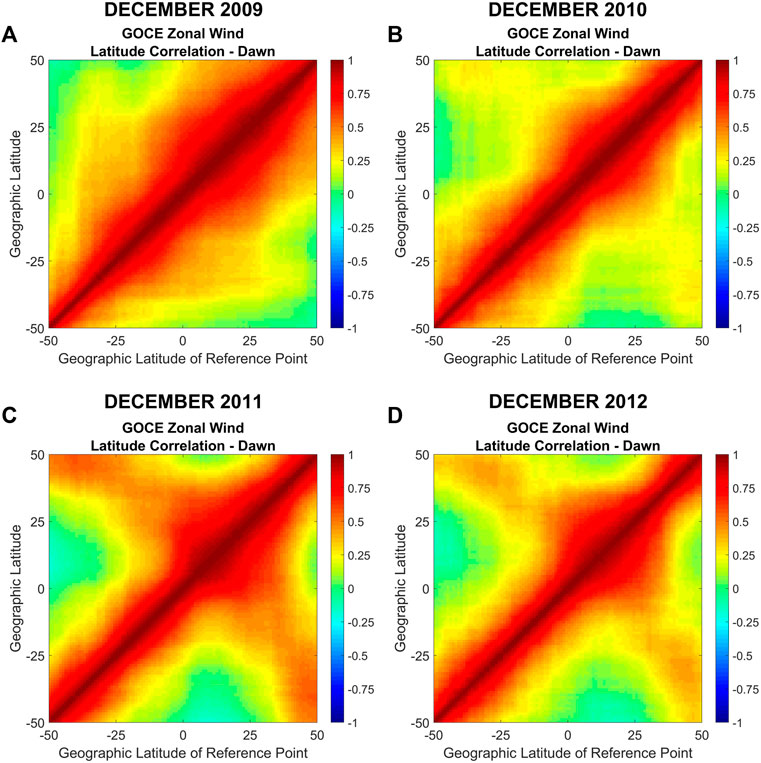
FIGURE 2. GOCE zonal wind latitudinal correlations during dawn for December solstice for years 2009–2012 (A–D). The x-axis corresponds to the latitude of the reference point and the y-axis to the latitude of the comparison point.
Figures 3A–D show the GOCE zonal wind latitude correlations during dusk for December solstice 2009 to 2012. In this case, it is observed that 2009 and 2010 exhibit significantly larger and more extended correlations for reference latitudes located in the southern hemisphere and in the northern hemisphere up to ∼20° latitude. In contrast, during 2011 the latitudinal extension of the correlations is much reduced and then increases again in 2012. This variation might also be related to the aforementioned variation in the solar activity from year to year.
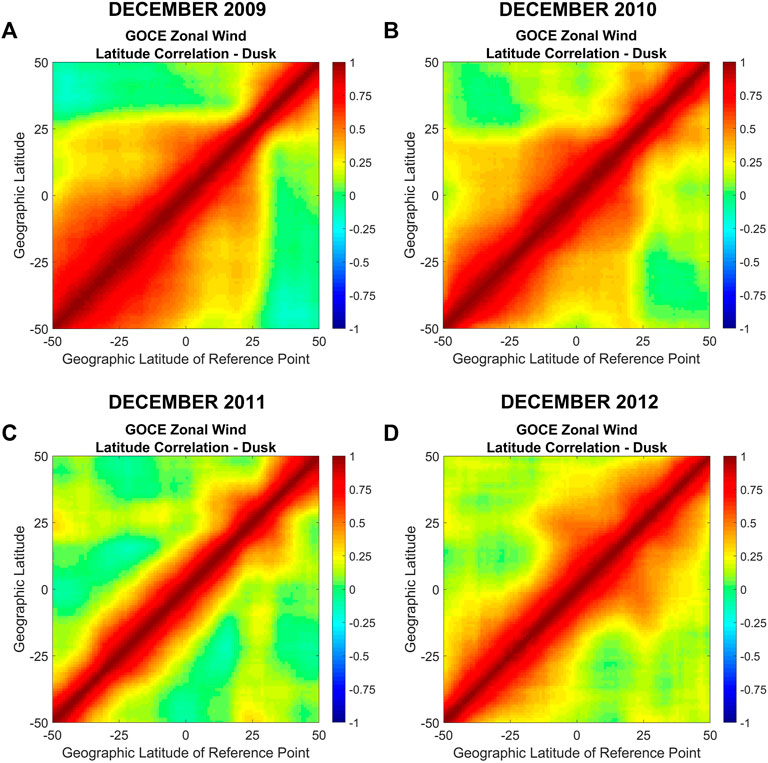
FIGURE 3. Same as Figure 2 but during dusk.
Figure 4 shows the GOCE zonal wind latitude correlations during dawn and dusk for December 2009 (Figures 4A,B) and for June 2010 (Figures 4C,D). The average solar flux during June 2010 was very similar to the corresponding value during December 2009. Figure 4 shows that the extend of the latitudinal correlations during dawn is larger in the winter hemisphere (northern/southern hemisphere during December/June solstice) and larger in the summer hemisphere (southern/northern hemisphere during December/June solstice) during dusk. This is also observed for June 2011 (see Supplementary Figure S2).
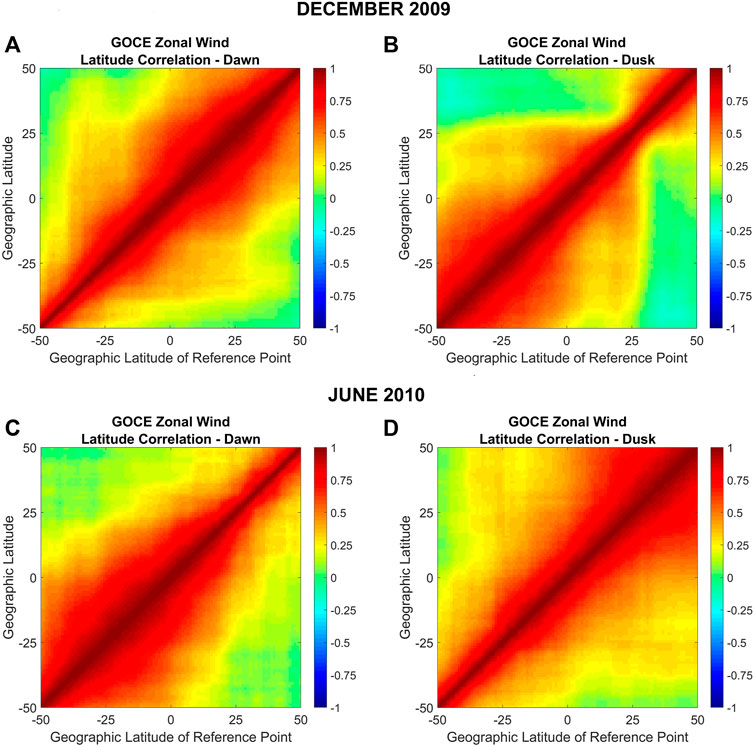
FIGURE 4. GOCE zonal wind latitudinal correlations during dawn and dusk for December solstice 2009 (A,B) and June solstice 2010 (C,D). The x-axis corresponds to the latitude of the reference point and the y-axis to the latitude of the comparison point.
4.2 Latitudinal correlation lengths
Figure 5 shows the correlation lengths for the GOCE zonal wind for December solstice 2009 and June 2010 as a function of the latitude of the reference point for dawn (Figure 5A) and dusk (Figure 5B). Results are shown for reference points extending from −50° to 50° latitude, in steps of 5°. Here, the correlation length for a given reference latitude is defined as the latitudinal separation between that reference and the comparison point at which the correlation coefficient drops to 0.7, indicating that 50% of the variability at the comparison point can be explained by the variability seen at the reference point (the square of the correlation coefficient is ∼0.5). During dawn the correlation lengths for December solstice have their largest values in the northern hemisphere with a maximum of about 18° located at a reference latitude of about 25°. During dusk, the December solstice correlation lengths show larger values in the southern hemisphere and peak near a reference latitude of about −35° with a value of approximately 17°. In contrast, during June 2010, the larger correlation lengths are found in the southern hemisphere during dawn and in the northern hemisphere during dusk. During this season, the maximum correlation lengths during dawn are found near a reference latitude of −20° with a value of about 22° and a broader maximum extending from about 20° to 45° in reference latitude is found during dusk with peak values of 20°–21°. Note that during both solstice periods, the correlation lengths exhibit their largest values consistently in the winter hemisphere during dawn and in the summer hemisphere during dusk.
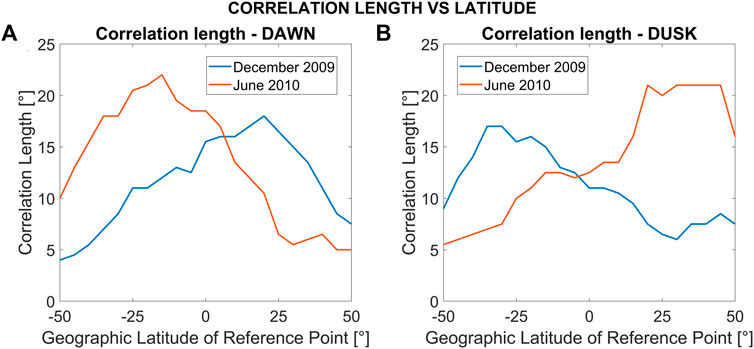
FIGURE 5. Latitudinal correlation lengths vs. latitude for the GOCE zonal wind for December solstice 2009 (blue) and June solstice 2010 (orange) during dawn (A) and dusk (B). The correlation lengths are calculated every 5°.
4.3 Longitudinal/temporal correlations
Figure 6 shows the longitudinal/temporal GOCE zonal wind correlation coefficients for December 2009 (Figures 6A,B) and June 2010 (Figures 6C,D) separately for dawn (top) and dusk (bottom). The correlation coefficients correspond to reference and comparison points with the same latitude (i = j) but separated in longitude/time by a given number of orbits (
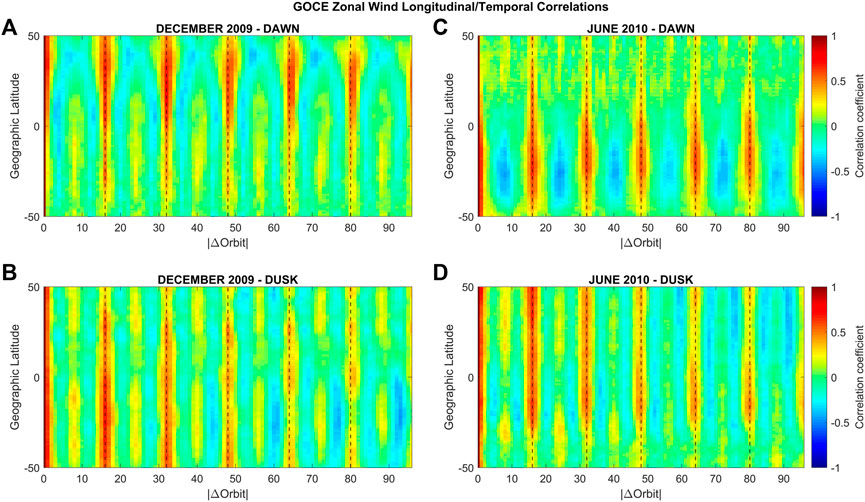
FIGURE 6. Longitudinal/temporal GOCE zonal wind correlation coefficients for December 2009 (A,B) and June 2010 (C,D) during dawn (top) and dusk (bottom). The correlation coefficients correspond to reference and comparison points with the same latitude, but separated in longitude/time by a given number of orbits (
For December solstice 2009, the magnitudes of the correlation coefficients are generally larger in the northern hemisphere during dawn and larger in the southern hemisphere during dusk. Specifically, at dawn, in addition to the positive correlations every 16 orbits, negative correlations are observed poleward of about 40° latitude at
During June solstice 2010 at dawn, a diurnal/wave-1 periodicity is observed in the southern hemisphere, while in the northern hemisphere a semidiurnal/wave-2 structure can be seen, albeit not as clearly. The values in the southern hemisphere (∼-0.4 for peak negative correlations and ∼0.5 to 0.6 for the positive correlations) are significantly higher than in the northern hemisphere (∼-0.1 for peak negative correlations and ∼0.2 to 0.3 for the positive correlations).
During dusk, a semidiurnal/wave-2 structure is present for all latitudes. Higher correlation values (0.4–0.6) are present for
Figure 7 shows the temporal evolution of the correlation coefficients for latitudes from −50° to 50° for December 2009 during dawn (Figure 7A) and dusk (Figure 7B) for
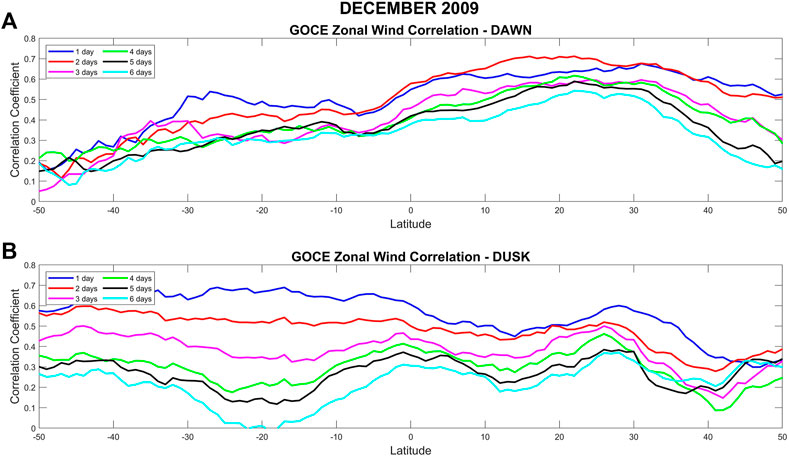
FIGURE 7. Temporal evolution of the longitudinal/temporal correlation coefficients for latitudes from −50° to 50° for December solstice 2009 during dawn (A) and dusk (B) for
Figure 8 shows the same as Figure 7, but for June solstice 2010. During dawn, the correlation coefficients are reduced by ∼0.1 from 1–2 days–6 days for the same location. During dusk, the difference is again larger, with correlation coefficients of about 0.6–0.5 for 1 day later, to 0.2–0.3 for 6 days later.
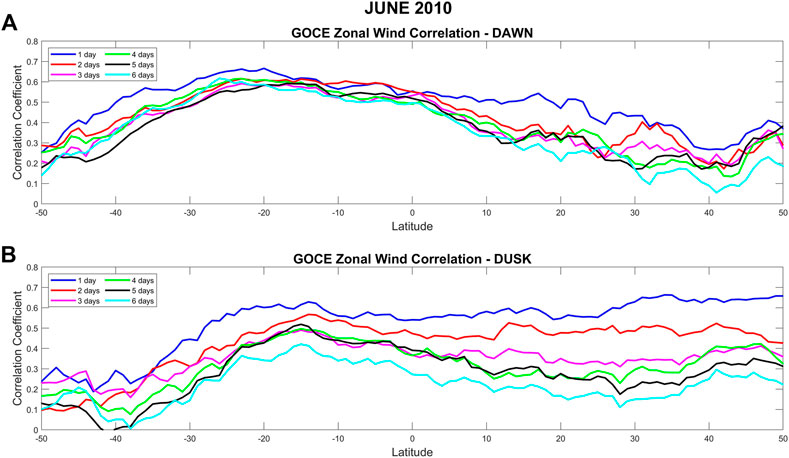
FIGURE 8. Same as Figure 7 but for June solstice 2010.
Comparing the correlation coefficients shown in Figures 7, 8, we observe that during dawn the maxima in the correlation coefficients are always located in the winter hemisphere, i.e., for December 2009, the maximum is located in the northern hemisphere and for June 2010, it is located in the southern hemisphere. This hemispheric “flip” can also be seen during dusk in the summer hemisphere, albeit not as clearly. To evaluate changes in the longitudinal/temporal correlations between different years, Figure 9 shows, similar to Figure 6, longitudinal/temporal GOCE zonal wind correlations, but this time for December 2009 (Figures 9A,B) and December 2011 (Figures 9C,D). These 2 years were chosen as they represent the lowest (76 sfu for December 2009) and highest (132 sfu for December 2011) solar flux values in the data analyzed. During dawn, the general structure observed in the correlations in 2009 can also be seen in 2011, with the exception in the southern mid-latitudes (∼-35° to −45°), where a clear diurnal/wave-1 structure is observed during 2011, with trough values ranging from −0.3 to −0.4. During dusk the differences between the 2 years are more pronounced. While the correlation coefficients at dusk exhibit a clear semidiurnal/wave-2 periodicity at all latitudes during December 2009, this is only the case from about −40° to −50° latitude during 2011. Instead, a terdiurnal/wave-3 structure emerges for latitudes from −5° to 35°, with correlation values at the troughs of ∼-0.3. An additional structure of positive correlations centered around −15° of latitude can also be seen every 16 orbits up to 48 orbits. Supplementary Figure S3 shows the comparison of longitudinal/temporal GOCE zonal wind correlations, for June 2010 (Supplementary Figures S3A, B) and June 2011 (Supplementary Figures S3C, D). These two periods also differ significantly in their average solar flux. During dawn, the same structure can be seen for both years, but with enhanced values during 2011. This is also the case during dusk, but this time the correlation values are diminished during the later year.
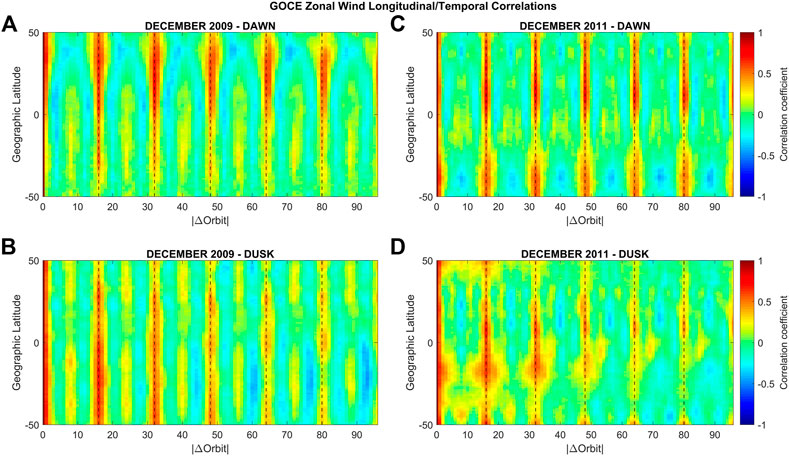
FIGURE 9. Same as Figure 6 but for December 2009 (A,B) and December 2011 (C,D).
The global pattern of the correlation coefficients of GOCE zonal winds for December solstice 2009 at dawn are shown in Figure 10, separately for reference points located at ±40°, ±20° and 0° latitude. In each panel the correlation coefficients correspond to a temporal/longitudinal window of ±96 orbits from the reference orbit and latitudes of the comparison orbit from −50° to 50°. Clearly, the main morphology and longitudinal/temporal structures observed in Figure 6 are present.
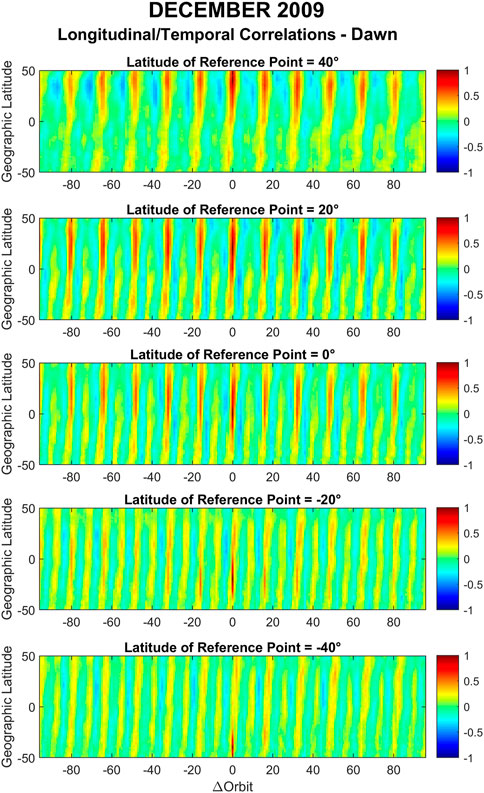
FIGURE 10. Longitudinal/temporal correlation coefficients of GOCE zonal winds for December solstice 2009 during dawn. The x-axis shows the orbit difference between the comparison point and the reference point (
It is interesting to note that the longitudinal structures seen in Figure 10 are slightly slanted and lean towards the right side of the graph. This indicates a phase shift in latitude of the periodic longitudinal/temporal structures and a corresponding north-west orientation. This can be seen by realizing that a positive value of
Figure 11 shows the longitudinal/temporal correlation coefficients of GOCE zonal winds for December 2009 during dusk. Again, the main morphology and longitudinal/temporal structures observed in Figure 6 are present. The slant of the longitudinal structures in this case is leaning towards the left side of the graph corresponding to a north-east orientation.
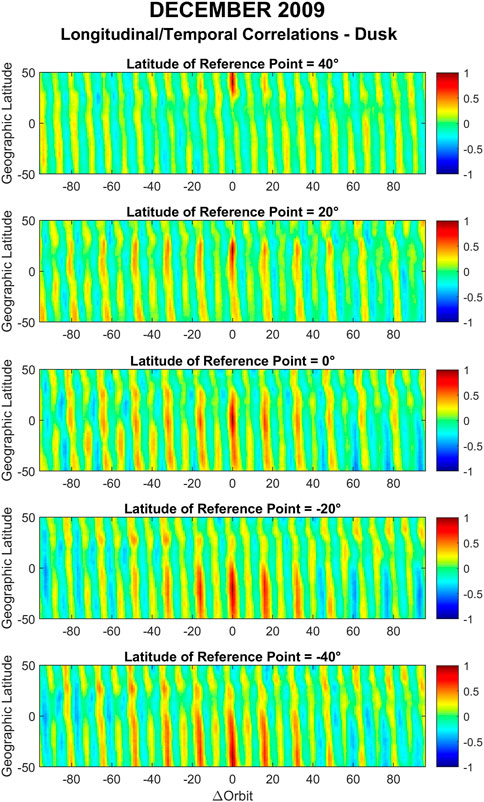
FIGURE 11. Same as Figure 10 but during dusk.
Similar figures were also generated for June solstice 2010 (Supplementary Figures S3, S4). For this season, during dawn, the slant of the longitudinal structures in this case is leaning towards the right side of the graph indicating, as discussed before, a general north-west orientation. During dusk, the slant of the longitudinal structures is leaning towards the left side of the graph indicating a general north-east orientation.
4.4 GOCE zonal wind longitudinal correlations after removal of tides
Figure 12 shows the longitudinal/temporal correlation coefficients of GOCE zonal winds for December solstice 2009 during dawn after the removal of the tides. Most of the correlation coefficients that were presented in Figure 10 are strongly attenuated. The same attenuation can be observed at dawn for December solstice 2011 (see Supplementary Figure S11) and in Figure 13 and in Supplementary Figure S7 for the June 2010 and June 2011 dawn time period, respectively. This might suggest that most of the periodic structures during dawn are indeed the result of nonmigrating tides irrespective of season and solar flux.
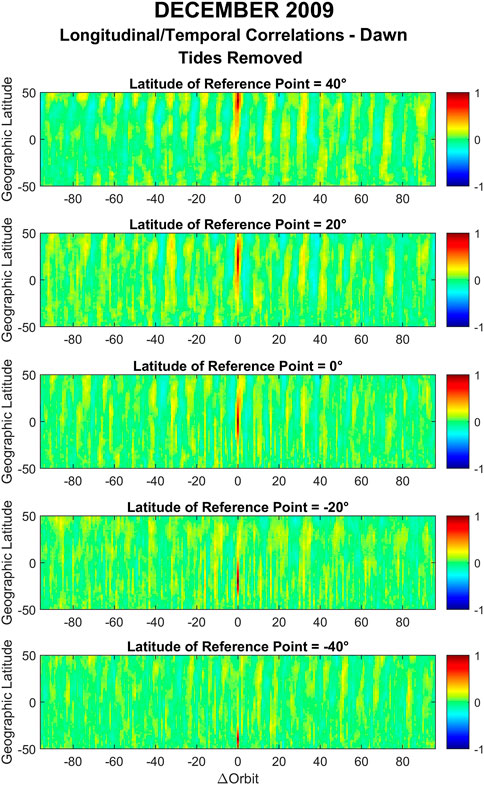
FIGURE 12. Same as Figure 10 but after the removal of tides.
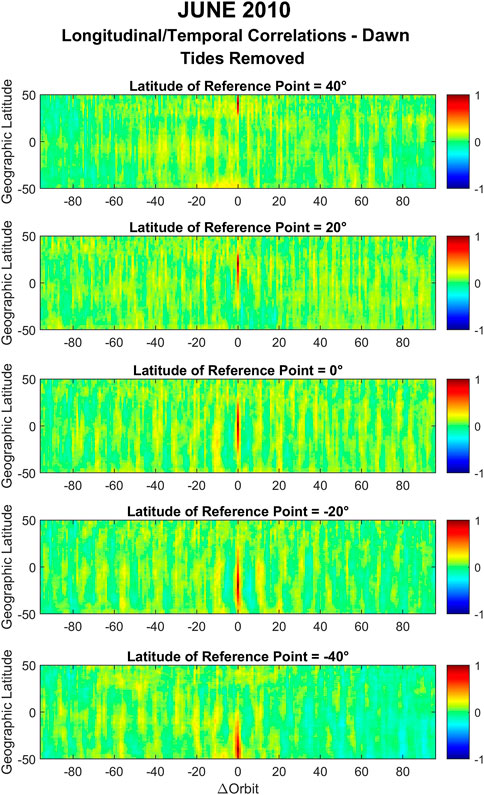
FIGURE 13. Same as Figure 12 but for June solstice 2010.
During dusk, however, clear residual structures can be seen in the correlations after removing the tides. This can be seen in Figure 14 for December solstice 2009 where in the southern hemisphere a periodic structure emerges with positive correlation coefficients of about 0.5 for
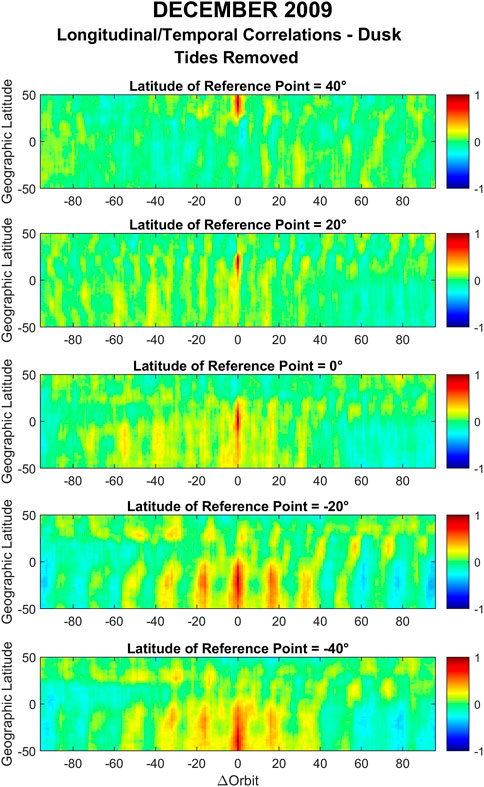
FIGURE 14. Same as Figure 12 but during dusk.
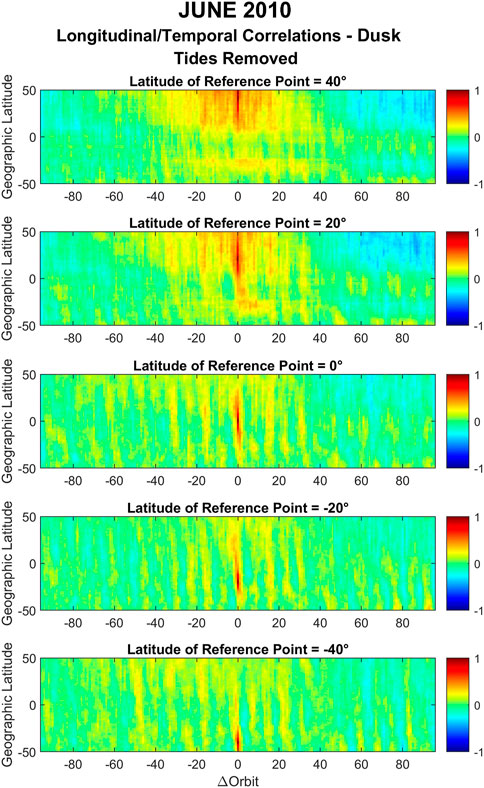
FIGURE 15. Same as Figure 14 but for June solstice 2010.
5 Summary and discussion
We have analyzed GOCE zonal wind observations from low- to mid-latitudes to investigate their spatial and temporal correlations. The year-to-year variations as well as the inter-seasonal differences were established for dawn and dusk. We have focused on geomagnetically quiet 27-day periods (one solar rotation) centered as close as possible to the December solstice for the years 2009, 2010, 2011 and 2012 and the June solstice for the years 2010 and 2011. For the calculation of the latitude and longitude/temporal correlations an approach similar to the one described in Shim et al. (2008) was followed. Our results represent zonally averaged values and do not correspond to a particular location/longitude on the globe. Furthermore, our approach eliminated correlations associated with deterministic variation in solar cycle, season and local time and instead focused on stochastic and tidal variations. Additionally, due to the orbit of GOCE longitudinal/temporal correlations could not be separately analyzed.
We found that for all four December solstice periods the latitude correlations during dawn were larger and more extended in latitude in the northern hemisphere compared to the southern hemisphere.
During dusk for December solstice 2009 and 2010 significantly larger and more extended correlations were found for reference latitudes located in the southern hemisphere and in the northern hemisphere up to ∼20° latitude. During December 2011 the extension of the latitudinal correlations in latitude were seen to be much reduced before increasing again in 2012. The cause of this year-to-year progression is not known at this point but might be related to similar variations, albeit anticorrelated, in the solar activity throughout these years.
We have also evaluated the zonal wind latitudinal correlations for June solstice 2010 and the larger correlation lengths during dawn were found in the southern hemisphere and during dusk in the northern hemisphere. This indicates that during both solstice periods, the latitudinal correlation lengths exhibit their largest values consistently in the winter hemisphere during dawn and in the summer hemisphere during dusk.
Of particular interest are the observed latitudinal correlations at dawn between hemispheric conjugate points observed at mid latitudes during the later December solstice periods. The strength of this conjugacy also appeared to follow similar variations in the solar activity throughout these years, i.e., during December 2009 it was not observed, started to appear in 2010, strengthened in 2011, before weakening again in 2012. This conjugacy was also examined in geomagnetic instead of geographic coordinates which resulted in a much cleaner presentation of the conjugacy. The physical cause for the observed conjugacy, however, is not clear at this point. We speculate that it might be related to midlatitude nighttime MSTIDs, also named electro-buoyancy waves, which map into the opposite hemisphere (Valladares et al., 2016). These waves are found to be magnetically conjugate and preferentially occur during the solstices (Makela et al., 2010; Martinis et al., 2010; Duly et al., 2013). However, Martinis et al. (2010) found that MSTIDs follow an inverse occurrence rate with solar activity conditions in contrast to our observation of the variation of the strength of the conjugate correlation coefficients.
In addition to electro-buoyancy waves, the observed conjugacy at mid-latitudes might also be related to conjugate variations in the high latitude electrodynamics. Wu et al. (2014) reported they observed conjugacy in thermospheric zonal winds in the American sector with varying degrees depending on geomagnetic conditions. They found that conjugacy is highest under moderate geomagnetic conditions, but it is observed for all geomagnetic activity levels, including geomagnetically quiet times. In our case, the average Kp values did not exceed 10 for each of the December solstice periods, but the variation seems to follow the solar activity. Clearly further studies are needed to elucidate the underlying causes of the observed conjugacy.
We have also analyzed the dawn and dusk longitudinal/temporal correlations of zonal wind for December 2009 and 2011 and for June 2010 and found that they exhibit periodic structures with the largest positive correlations every 16 orbits (every 1 day) during all geophysical conditions, albeit with different characteristics. The temporal evolution of the temporal/longitudinal correlations were found to gradually decrease over the course of several days. Based on a 20-model year simulation of WACCM-X, Liu (2016) reported correlation times of zonal mean zonal winds in the thermosphere of the order of days, in agreement with our results. We found that the correlation coefficients for the same location decreased more slowly during dawn and much faster during dusk for both December and June solstice conditions. We also observed that during dawn the maxima in the correlation coefficients were always located in the winter hemisphere. This hemispheric “flip” was also seen during dusk in the summer hemisphere, but not as clearly.
The temporal/longitudinal correlation coefficients for December solstice 2009 were found to be generally larger in the northern hemisphere during dawn and larger in the southern hemisphere during dusk. Specifically, during dawn the temporal/longitudinal correlation for December 2009 displayed a diurnal/wave-1 periodicity in the northern mid-latitudes and a semidiurnal/wave-2 periodicity for lower latitudes and the southern hemisphere. The orientation of these structures was found to be in the north-west direction. During dusk, a semidiurnal/wave-2 structure was observed for all latitudes, with a north-east orientation. The general structure observed during dawn in the correlations in December solstice 2009 could also be seen in December solstice 2011 but larger differences between the 2 years were found during dusk.
The temporal/longitudinal correlation coefficients for June 2010 at dawn displayed a diurnal/wave-1 periodicity in the southern hemisphere and a semidiurnal/wave-2 periodicity in the northern hemisphere. Here, the orientation of the structures was found to be in the north-west direction. During June solstice dusk, a semidiurnal/wave-2 structure was observed for all latitudes, with a north-east orientation. This time, however, the larger correlation values were observed in the northern hemisphere, in contrast to our December solstice results.
Although our study does not allow for a detailed analysis of the underlying causes of the observed periodic structures, we speculate that they are the result of the presence of atmospheric tides, and in particular nonmigrating tides. To investigate correlations not associated with tides we have eliminated their contribution up to zonal wave-5 from the zonal winds before calculating the longitude/time correlation coefficients. The results show that the longitudinal/temporal correlations were strongly attenuated during dawn for both December and June solstices, suggesting that indeed the main structures observed before were the result of nonmigrating tides during this time of the day, irrespective of season and solar flux. Some smaller localized correlations are still apparent in the remaining correlations at dawn, which might be related to the presence of gravity waves that have been reported to be present in GOCE observations (Garcia et al., 2016; Vadas et al., 2019) and/or variations in the phase and amplitude of the tides. A modeling study by Liu (2014), for example, suggests that there is an irregular or stochastic aspect of the day-to-day tidal variability.
In contrast, during dusk, a previously masked structure appears after the removal of the tidal effects that follows a multi-day period for both December (in the southern hemisphere) and June (in the northern hemisphere). Although more investigation is needed, these correlations might be the result of the presence of other waves that we have not included in our analysis. Gasperini et al. (2015), for example, reported the presence of ultra-fast Kelvin waves in the GOCE zonal wind observations with a period of 3.5 days.
Finally, note that our analysis only pertains to geomagnetically quiet conditions at dawn and dusk and an investigation of the correlation coefficients of the zonal winds for other local times and geomagnetically active conditions needs to be performed in the future.
Data availability statement
Publicly available datasets were analyzed in this study. This data can be found here: The GOCE data used in this work are publicly available and provided by the European Space Agency (ESA) and can be found at https://earth.esa.int/eogateway/catalog/goce-thermosphere-data. The F10.7 cm radio flux and Kp index were obtained through NASA/GSFC’s Space Physics Data Facility’s OMNIWeb service, which can be found at https://omniweb.gsfc.nasa.gov/form/dx1.html.
Author contributions
IM and LS contributed to the conception and design of the study. IM conducted the analysis. All authors contributed to the article and approved the submitted version.
Funding
This research was partially supported by NASA Headquarters under the NASA Earth and Space Science Fellowship Program (NESSF/FINESST), GRANT 80NSSC17K0431; National Science Foundation grant AGS-1651461 to Utah State University and NASA grant 80NSSC20K0191 to Utah State University.
Acknowledgments
We acknowledge the use of the GOCE data provided by the European Space Agency (ESA). We acknowledge use of NASA/GSFC’s Space Physics Data Facility’s OMNIWeb service to obtain the F10.7 cm radio flux and Kp index. Part of this work is included in IM’s PhD dissertation, which can be found at https://digitalcommons.usu.edu/etd/8671/.
Conflict of interest
The authors declare that the research was conducted in the absence of any commercial or financial relationships that could be construed as a potential conflict of interest.
Publisher’s note
All claims expressed in this article are solely those of the authors and do not necessarily represent those of their affiliated organizations, or those of the publisher, the editors and the reviewers. Any product that may be evaluated in this article, or claim that may be made by its manufacturer, is not guaranteed or endorsed by the publisher.
Supplementary material
The Supplementary Material for this article can be found online at: https://www.frontiersin.org/articles/10.3389/fspas.2023.1214591/full#supplementary-material
References
Alken, P., and Maus, S. (2007). Spatio-temporal characterization of the equatorial electrojet from CHAMP, Ørsted, and SAC-C satellite magnetic measurements. J. Geophys. Res. Space Phys. 112 (A9). doi:10.1029/2007ja012524
Bruinsma, S. L., Doornbos, E., and Bowman, B. R. (2014). Validation of GOCE densities and evaluation of thermosphere models. Adv. Space Res. 54 (4), 576–585. doi:10.1016/j.asr.2014.04.008
Bruinsma, S., Boniface, C., Sutton, E. K., and Fedrizzi, M. (2021). Thermosphere modeling capabilities assessment: Geomagnetic storms. J. Space Weather Space Clim. 11, 12. doi:10.1051/swsc/2021002
Calabia, A., Lu, G., and Bolaji, O. S. (2023). Advances on upper-atmosphere characterization for geodetic space weather research and applications. Front. Astronomy Space Sci. 10, 141. doi:10.3389/fspas.2023.1211582
Doornbos, E., Bruinsma, S., Fritsche, B., Visser, P. N. A. M., Van Den Ijssel, J., Encarnacao, J. T., et al. (2013). Air density and wind retrieval using GOCE data. In ESA Living Planet Symp. 722, 7.
Doornbos, E., Van Den Ijssel, J., Luhr, H., Forster, M., and Koppenwallner, G. (2010). Neutral density and crosswind determination from arbitrarily oriented multiaxis accelerometers on satellites. J. Spacecr. Rockets 47 (4), 580–589. doi:10.2514/1.48114
Duly, T. M., Chapagain, N. P., and Makela, J. J. (2013). Climatology of nighttime medium-scale traveling ionospheric disturbances (MSTIDs) in the Central Pacific and South American sectors. Ann. Geophys. (Göttingen, Germany: Copernicus Publications), 31 (12), 2229–2237.
Forbes, J. M., Lu, G., Bruinsma, S., Nerem, S., and Zhang, X. (2005). Thermosphere density variations due to the 15–24 April 2002 solar events from CHAMP/STAR accelerometer measurements. J. Geophys. Res. Space Phys. 110 (A12), A12S27. doi:10.1029/2004ja010856
Garcia, R. F., Bruinsma, S., Massarweh, L., and Doornbos, E. (2016). Medium-scale gravity wave activity in the thermosphere inferred from GOCE data. J. Geophys. Res. Space Phys. 121 (8), 8089–8102. doi:10.1002/2016ja022797
Gasperini, F., Forbes, J. M., Doornbos, E. N., and Bruinsma, S. L. (2015). Wave coupling between the lower and middle thermosphere as viewed from TIMED and GOCE. J. Geophys. Res. Space Phys. 120 (7), 5788–5804. doi:10.1002/2015ja021300
Kelley, M. C. (2009). The Earth's ionosphere: Plasma physics and electrodynamics. Cambridge, MA, USA: Academic Press.
Liu, H. L. (2016). Variability and predictability of the space environment as related to lower atmosphere forcing. Space weather. 14 (9), 634–658. doi:10.1002/2016sw001450
Liu, H. L. (2014). “WACCM-X simulation of tidal and planetary wave variability in the upper atmosphere,” in Modeling the ionosphere–thermosphere system (Hoboken, NJ, USA: Wiley), 181–199.
Makela, J. J., Miller, E. S., and Talaat, E. R. (2010). Nighttime medium-scale traveling ionospheric disturbances at low geomagnetic latitudes. Geophys. Res. Lett. 37 (24). doi:10.1029/2010gl045922
Martinis, C., Baumgardner, J., Wroten, J., and Mendillo, M. (2010). Seasonal dependence of MSTIDs obtained from 630.0 nm airglow imaging at Arecibo. Geophys. Res. Lett. 37 (11). doi:10.1029/2010gl043569
Maute, A., and Richmond, A. D. (2017). F-Region dynamo simulations at low and mid-latitude. Space Sci. Rev. 206 (1-4), 471–493. doi:10.1007/s11214-016-0262-3
Molina, I. (2022). Variability of thermospheric zonal winds near Dawn and dusk (PhD dissertation). Logan, Utah: Utah State University.
Molina, I., and Scherliess, L. (2023). Longitudinal variability of thermospheric zonal winds near dawn and dusk. Front. Astron. Space Sci. 10, 1214612. doi:10.3389/fspas.2023.1214612
Shim, J. S., Scherliess, L., Schunk, R. W., and Thompson, D. C. (2008). Spatial correlations of day-to-day ionospheric total electron content variability obtained from ground-based GPS. J. Geophys. Res. Space Phys. 113 (A9). doi:10.1029/2007ja012635
Vadas, S. L., Xu, S., Yue, J., Bossert, K., Becker, E., and Baumgarten, G. (2019). Characteristics of the quiet-time hot spot gravity waves observed by GOCE over the Southern Andes on 5 July 2010. J. Geophys. Res. Space Phys. 124 (8), 7034–7061. doi:10.1029/2019ja026693
Valladares, C. E., and Sheehan, R. (2016). Observations of conjugate MSTIDs using networks of GPS receivers in the American sector. Radio Sci. 51 (9), 1470–1488. doi:10.1002/2016rs005967
Wang, W., Burns, A. G., and Liu, J. (2021). Upper thermospheric winds: Forcing, variability, and effects. Up. Atmos. Dyn. energetics, 41–63. doi:10.1002/9781119815631.ch3
Keywords: neutral wind, thermosphere, ionosphere, tides, upper atmosphere dynamics, GOCE
Citation: Molina I and Scherliess L (2023) Spatial and temporal correlations of thermospheric zonal winds from GOCE satellite observations. Front. Astron. Space Sci. 10:1214591. doi: 10.3389/fspas.2023.1214591
Received: 30 April 2023; Accepted: 21 June 2023;
Published: 14 September 2023.
Edited by:
Han-Li Liu, National Center for Atmospheric Research (UCAR), United StatesReviewed by:
Eelco Doornbos, Royal Netherlands Meteorological Institute, NetherlandsAndrés Calabia, University of Alcalá, Spain
Copyright © 2023 Molina and Scherliess. This is an open-access article distributed under the terms of the Creative Commons Attribution License (CC BY). The use, distribution or reproduction in other forums is permitted, provided the original author(s) and the copyright owner(s) are credited and that the original publication in this journal is cited, in accordance with accepted academic practice. No use, distribution or reproduction is permitted which does not comply with these terms.
*Correspondence: Ludger Scherliess, ludger.scherliess@usu.edu