 Rachel J. Parsons1,2*
 Shuting Liu3,4
 Krista Longnecker5
 Kevin Yongblah1,6Carys Johnson1
 Luis M. Bolaños7
 Jacqueline Comstock3
 Keri Opalk3
 Melissa C. Kido Soule5
 Rebecca Garley1,2
 Craig A. Carlson3
 Ben Temperton7
 Nicholas R. Bates1,2
- 1Microbial Ecology Laboratory, Bermuda Institute of Ocean Sciences, St. George’s, Bermuda
- 2Julie Ann Wrigley Global Futures Laboratory, School of Ocean Futures, Arizona State University, Tempe, AZ, United States
- 3Department of Ecology, Evolution and Marine Biology, Marine Science Institute, University of California, Santa Barbara, California, CA, United States
- 4Department of Environmental and Sustainability Sciences, Kean University, Union, NJ, United States
- 5Department of Marine Chemistry and Geochemistry, Woods Hole Oceanographic Institution, Woods Hole, MA, United States
- 6Department of Biology, University of Syracuse, Syracuse, NY, United States
- 7School of Biosciences, University of Exeter, Exeter, United Kingdom
Oxygen minimum zones (OMZs) are expanding due to increased sea surface temperatures, subsequent increased oxygen demand through respiration, reduced oxygen solubility, and thermal stratification driven in part by anthropogenic climate change. Devil’s Hole, Bermuda is a model ecosystem to study OMZ microbial biogeochemistry because the formation and subsequent overturn of the suboxic zone occur annually. During thermally driven stratification, suboxic conditions develop, with organic matter and nutrients accumulating at depth. In this study, the bioavailability of the accumulated dissolved organic carbon (DOC) and the microbial community response to reoxygenation of suboxic waters was assessed using a simulated overturn experiment. The surface inoculated prokaryotic community responded to the deep (formerly suboxic) 0.2 μm filtrate with cell densities increasing 2.5-fold over 6 days while removing 5 μmol L−1 of DOC. After 12 days, the surface community began to shift, and DOC quality became less diagenetically altered along with an increase in SAR202, a Chloroflexi that can degrade recalcitrant dissolved organic matter (DOM). Labile DOC production after 12 days coincided with an increase of Nitrosopumilales, a chemoautotrophic ammonia oxidizing archaea (AOA) that converts ammonia to nitrite based on the ammonia monooxygenase (amoA) gene copy number and nutrient data. In comparison, the inoculation of the deep anaerobic prokaryotic community into surface 0.2 μm filtrate demonstrated a die-off of 25.5% of the initial inoculum community followed by a 1.5-fold increase in cell densities over 6 days. Within 2 days, the prokaryotic community shifted from a Chlorobiales dominated assemblage to a surface-like heterotrophic community devoid of Chlorobiales. The DOM quality changed to less diagenetically altered material and coincided with an increase in the ribulose-1,5-bisphosphate carboxylase/oxygenase form I (cbbL) gene number followed by an influx of labile DOM. Upon reoxygenation, the deep DOM that accumulated under suboxic conditions is bioavailable to surface prokaryotes that utilize the accumulated DOC initially before switching to a community that can both produce labile DOM via chemoautotrophy and degrade the more recalcitrant DOM.
Introduction
The decline in global oceanic oxygen content has resulted in a four-fold expansion of the oxygen minimum zones (OMZs) (Diaz and Rosenberg, 2008; Stramma et al., 2010; Schmidtko et al., 2017; Stramma and Schmidtko, 2019). Ocean warming and increased upper ocean stratification caused by global climate change will likely lead to ocean deoxygenation with implications for ocean productivity, nutrient cycling, carbon cycling, and marine habitats (Keeling et al., 2010; Stramma and Schmidtko, 2019). In coastal and enclosed seas, oxygen deficiency is often related to eutrophication and high degradation rates of organic matter (Zhang et al., 2010; Maßmig et al., 2019), suggesting that respiration is the main driver of coastal deoxygenation (Diaz et al., 2019; Lønborg et al., 2020). These coastal, semi-enclosed, and enclosed basins such as the Baltic Sea (Berg et al., 2014; Maßmig et al., 2019), Black Sea (Jessen et al., 2017; Suominen et al., 2021), Cariaco Basin (Taylor et al., 2001; Lorenzoni et al., 2013; Rodriguez-Mora et al., 2013), the Chilean Coast (Canfield et al., 2010), and Saanich Inlet (Zaikova et al., 2010) are useful model ecosystems for exploring how ocean deoxygenation influences microbial community responses and organic carbon turnover rates (Wright et al., 2012). However, many of these model OMZs are either permanently stratified or undergo mixing events that are unpredictable.
Devil’s Hole, Bermuda is a seasonal OMZ, with reliable transitions and a suboxic layer that occurs within the euphotic zone, making it different from other OMZs (Parsons et al., 2015). As a result, the Devil’s Hole OMZ is a model coastal ecosystem for the study of microbial processes and community succession associated with the seasonal development of hypoxia and anoxia in its deep waters (Thorstenson and Mackenzie, 1974; Andersson et al., 2007; Parsons et al., 2015; Bates, 2017). Devil’s Hole, a collapsed cave in Harrington Sound, Bermuda, has a depth of 25 m where light remains above the 1% light level to the bottom (Manuel et al., 2013; Parsons et al., 2015). During thermally driven stratification, suboxic conditions develop in the summer months below the base of the seasonal thermocline (>20 m) followed by ventilation and reoxygenation during cooler and stormier periods in late Fall. As oxygen levels are depleted to <20 μmol L−1 below 22 m, the bacterioplankton community becomes dominated by the low light-adapted photolithoautotrophic H2S oxidizer Chlorobiales (Kim and Chang, 1991; Overmann et al., 1992; Parsons et al., 2015). This lineage is capable of fixing CO2 to organic matter under suboxic or anoxic water conditions (Taipale et al., 2009). Members of the Thaumarchaeota and Euryarcheota clades are also present in elevated abundances in the suboxic bottom waters (Parsons et al., 2015). Following convective mixing, the prokaryotic community of the entire oxygenated water column is dominated by members of Synechococcus and SAR11 (Parsons et al., 2015).
Taxonomic surveys of small-subunit ribosomal RNA (SSU rRNA) gene sequences show that there are similar microbial communities when comparing open ocean OMZs to coastal OMZs (Wright et al., 2012). Dominant bacterial groups within OMZs include chemoorganoheterotrophs such as SAR11, SAR324 and Roseobacter that have been shown to assimilate inorganic carbon (Thrash et al., 2010; Swan et al., 2011; Tang et al., 2016; Jing et al., 2022). Other members such as the Roseobacter clade and the Chloroflexi, SAR202 involved with mixotrophic carbon metabolism, methanogenesis and aromatic compound degradation (Moran and Miller, 2007; Swan et al., 2011; Sheik et al., 2014; Cao et al., 2016; Boeuf et al., 2021). In the Bohai Sea (China), transcriptomics demonstrated that in low oxygen concentrations, defined between 2 and 7 mg L−1 of oxygen, the transcripts of RuBisCO shifted from photoautotrophs to chemoautotrophs (Han et al., 2022). In addition, the coastal ecotypes of the ammonia-oxidizing Thaumarchaeota showed resilience to low-oxygen aquatic environments, with populations increasing along with the enhanced expression of core genes representing ammonia oxidation, ammonia transport, and carbon fixation (3-hydroxypropionic acid/4-hydroxybutyric acid cycle) pathways.
The bioavailability of dissolved organic matter (DOM) is important to biogeochemistry cycles with labile compounds being easily degraded and recalcitrant DOM more resistant to degradation by planktonic heterotrophic prokaryotes (Hansell et al., 2012; Hansell, 2013; Carlson and Hansell, 2014). The availability and decomposition of DOM have been studied in several OMZs (Devol and Hartnett, 2001; Keil et al., 2016; Le Moigne et al., 2017; Igarza et al., 2019; Lønborg et al., 2020). However, the bioavailability of DOM preserved in these OMZs has only been studied in a few experiments (Pantoja et al., 2009; Maßmig et al., 2019). Environmental studies in the Arabian Sea and coastal Pacific, have shown decreased organic matter remineralization under anoxic compared to oxic conditions (Devol and Hartnett, 2001; Keil et al., 2016). In contrast, the low organic matter remineralization rate observed in the coastal Chilean OMZ (Pantoja et al., 2009), was hypothesized to be related to the quality of the organic substrates rather than oxygen concentration. Degradation experiments in the Baltic Sea showed that oxygen plays a role in regulating particulate organic carbon degradation (Le Moigne et al., 2017), while a study using multifactorial batch experiments of microbial communities from the central Baltic Sea showed that the bacterial turnover of organic matter was limited by the availability of glucose and ammonium under both oxic and suboxic conditions (Maßmig et al., 2019).
In the present study, a microbial remineralization experiment was conducted to assess the bioavailability of DOC that accumulates under suboxic conditions and to determine how the microbial community responded to the reoxygenation of suboxic waters; thus, experimentally simulating a water column overturn event. Using prokaryotic (bacteria and archaea) abundance, DOC measurements, prokaryotic community changes, nutrient concentrations and DOM composition, these experiments by mimicking mixing emphasize the fate of carbon fixed under suboxic conditions and how the prokaryotic communities shift once water is reoxygenated. Furthermore, the results can be put into the context of the common mechanisms captured in the overturn system sampled in situ at Devil’s Hole.
Methods
Environmental sample collection
Samples were gathered biweekly aboard the R/V Sea Dance at the Devil’s Hole site in Harrington Sound, Bermuda (32°19.399’ N 64°43.08’ W) between May and October 2018. Continuous in situ profiling of dissolved oxygen (DO), salinity, pH, and temperature were conducted with a tethered YSI 556 multiprobe (Yellow Springs, OH, United States). Seawater samples from eight depths (1, 5, 10, 15, 20, 22, 23, and 24 m) were collected using a 5 L Niskin bottles attached to a hydro wire. Samples were collected and analyzed for concentrations of DO, dissolved inorganic carbon (DIC), total alkalinity (TA) and salinity to calibrate the YSI as described previously (Andersson et al., 2007; Bates, 2017). Nutrients, DOC, and prokaryotic abundance sampling was consistent with the best practices guide used for the GO-SHIP and BATS programs (Bates and Johnson, 2020; Halewood et al., 2022). Prokaryotic abundance samples were also used for fluorescent in-situ hybridization (FISH) and catalyzed reporter deposition (CARD)-FISH (Parsons et al., 2015). Bacterial production samples were collected in 40 mL polycarbonate vials, sealed, and placed into small coolers with water from the depth sampled to maintain the in-situ temperature until further processing following 3H-leucine incorporation method (Simon and Azam, 1989). Since suboxic conditions were not maintained, 3H Leu uptake rates maybe higher than actual in-situ rates. Genomic DNA samples consisted of 1 L of seawater being collected into polycarbonate bottles and concentrated onto Supor® PES membrane filters (pore size 0.2 μm, dia. 47 mm, PALL Corporation, Albany, NY, United States). Each filter was preserved with 1 mL of sucrose lysis buffer (10 mM Tris.HCl; 10 mM EDTA; 300 mM NaCl; 0.75 M sucrose), sealed in a 3 mL cryovial, and stored at −80°C until further processing.
Experimental design and seawater collection
Transplant experiments used to mimic mixing were conducted where surface and deep assemblages were inoculated into surface and deep 0.2 μm filtrate (media) to investigate the microbial response from a stratified water column to an overturn (reoxygenation) event. Seawater was collected from the Devil’s Hole site at oxic surface (1 m) and suboxic deep (23–24 m) water on August 9th, 2018, using a 10 L Niskin bottle. The 10 L niskin bottle used to collect water for the experiment was 1 m in length, with sampling depth determined by line payout. Thus, deep water sampling likely included water that spanned 22–24 m. Three experimental treatments were prepared (Table 1) by diluting whole (unfiltered) seawater by 70% with 0.2 μm seawater filtrate (Carlson and Ducklow, 1996) from different depths. The inoculum and filtrate were mixed under oxic conditions within a 12 L polycarbonate carboy and transferred to duplicate 5.5 L polycarbonate biotainer carboys (Nalgene, Rochester NY, United States). The three treatments included surface microbial assemblages mixed with filtrate from the suboxic deep waters or deep filtrate (S/D), deep microbial assemblages mixed with oxic surface filtrate (D/S) and surface assemblages mixed with oxic surface filtrate as a control (S/S). Surface assemblage treatments (S/S and S/D) were placed into a dry incubator (Fisherbrand Isotemp, Thermo Fisher, Waltham, MA, United States) and incubated in the dark at in situ temperature of the inoculum (30.0°C) for 21 days. The deep assemblage treatments (D/S) were incubated in the dark at an in-situ temperature of 21.8°C for 21 days. Samples for prokaryotic abundance and DOC concentration, FISH or CARD-FISH, DNA, total combined dissolved amino acid (TDAA), and DOM composition (high-resolution DOM, HR-DOM) were drawn throughout the incubation. All plasticware was soaked with 10% HCl and flushed with Milli-Q water before use.
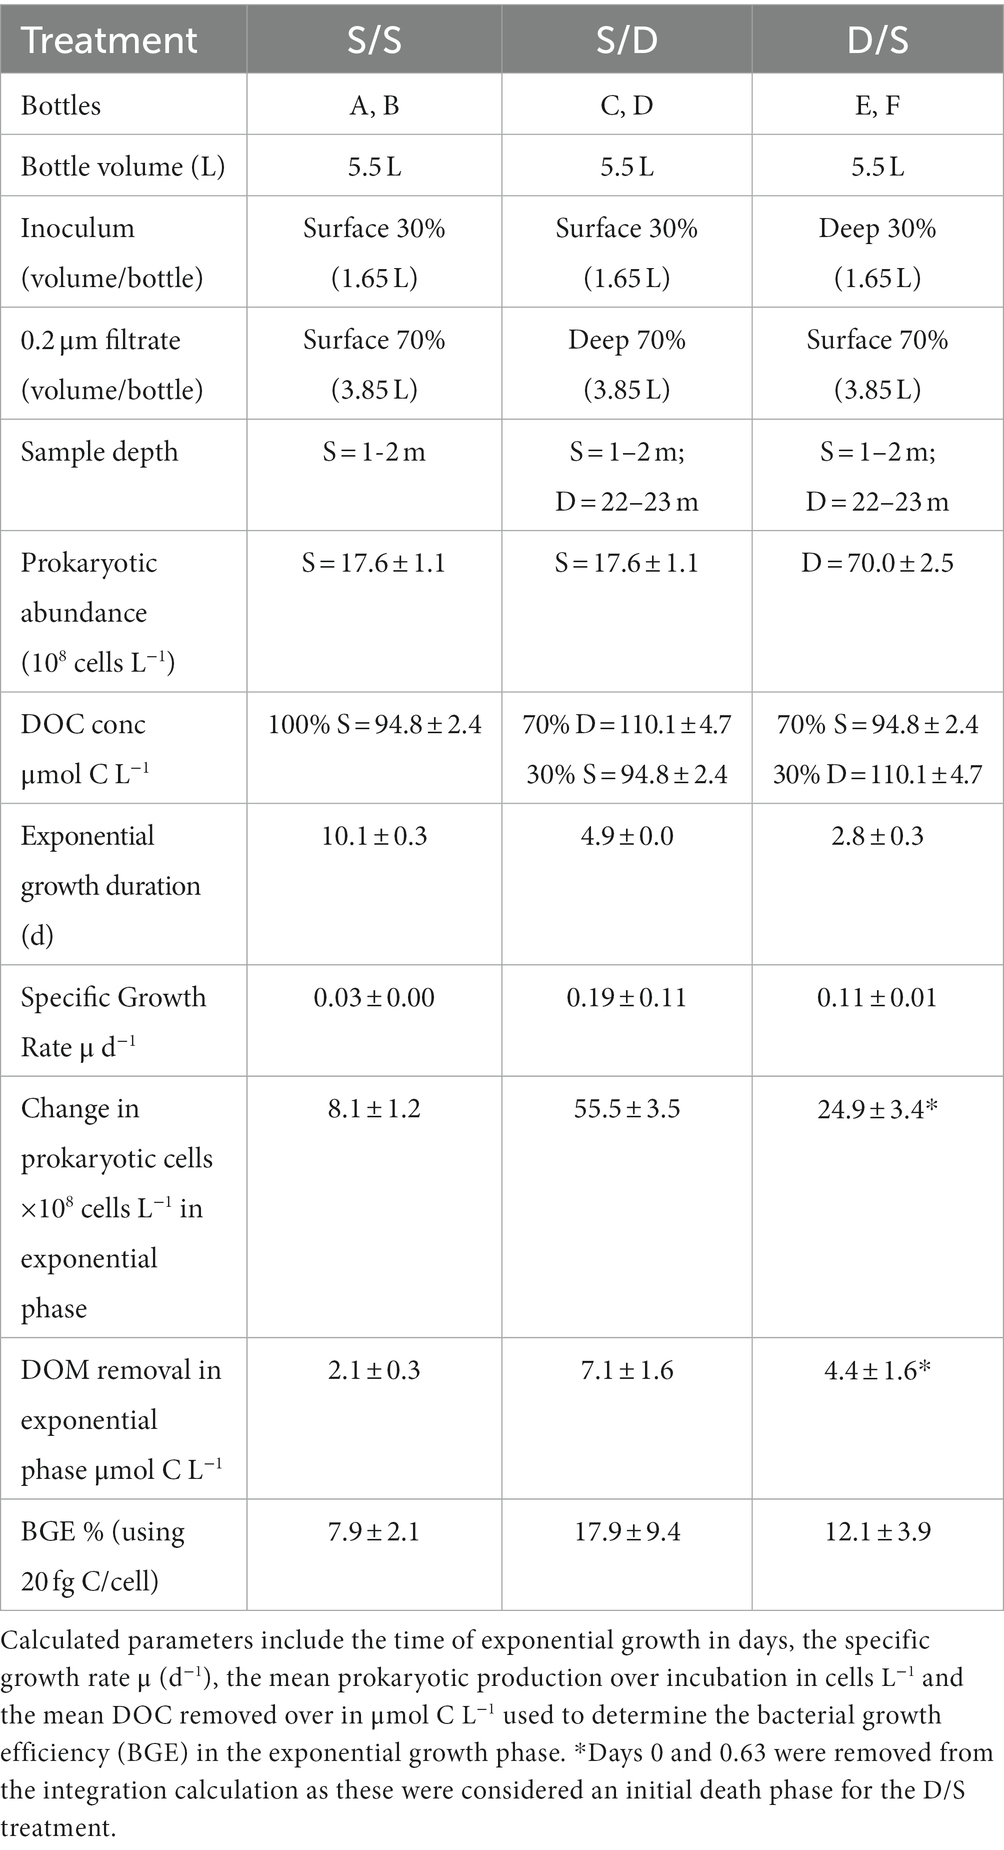
Table 1. Experimental set-up including bottles, mixture volumes in % and liters, water source for microbial inoculum and 0.2 μm filtrate, sample depth, prokaryotic abundance, and DOC concentration at the time of sampling and measured at the start of the experiment.
Experiment sampling was carried out using a custom positive pressure system that enabled subsampling without removing caps from the biotainers in order to reduce DOC contamination (Baetge et al., 2021). An aquarium pump pumped air through a hydrocarbon trap, which pressurized the biotainers and displaced sample water through submerged Teflon tubing into collection bottles to reduce sample handling (Liu et al., 2020). The YSI 556 multiprobe (Yellow Springs, OH, United States) was used to keep track of temperature (°C), salinity (ppt), pH, and dissolved oxygen (mg L−1 converted to μmol L−1) over 24 h and again on day six6 by collection of ~50 mL in a 100 mL polycarbonate beaker. Prokaryotic abundance and FISH or CARD-FISH samples (40 mL) were collected as described by Parsons et al. (2015). Nutrient samples were collected into 60 mL acid-washed high-density polyethylene (HDPE) bottles and stored at −20°C. DOC samples (duplicate 30 mL aliquots) were filtered through 0.2 μm polycarbonate filters (Millipore, Burlington, MA, USA; prewashed in 10% HCl for 1 h and rinsed in sterile water), packed in 25 mm Swinnex filter holders attached directly to sample line with Luer lock adaptor, and collected into 40 mL pre-combusted EPA glass vials with polytetrafluoroethylene (PTFE) coated silicone septa. DOC samples were acidified with 50 μL 4 N HCl to a pH of 3. TDAA samples were filtered through the same filters into 60 mL acid-washed high-density polyethylene (HDPE) bottles and stored at −20°C. The low-volume filters were retained for DNA analysis and were stored at −80°C until DNA extraction. In addition, 1 L of seawater was filtered through an Omnipore PTFE filter (pore size 0.2 μm, dia. 47 mm, Millipore, Burlington MA, United States) housed in a perfluoroalkoxy (PFA) filter holder for the analyses of organic metabolites via ultra-high resolution mass spectrometry at three timepoints during the 21- day experiment corresponding to day 0, day 8, and day 21. The filtrate (1 L) collected into a PFA bottle for organic metabolites was acidified with 1 mL ultrapure HCl (Optima, 35%, Thermofisher Scientific, Waltham, MA, United States) to pH ~3, stored at 4°C and extracted within 24 h for mass spectrometry analysis. The filters were retained for high-volume DNA analysis and were stored at −80°C until DNA extraction.
Chemical analyses (DO, salinity, DIC, TA, and nutrients)
Salinity was analyzed using an auto salinometer according to the Bermuda Atlantic Time-series Study (BATS) methodology (Knap et al., 1997; Bates and Johnson, 2020). Seawater DO was determined by automatic Winkler titrations based on a UV end-point detector system according to the BATS protocol (Knap et al., 1997; Bates and Johnson, 2020). DIC and TA were analyzed according to Andersson et al. (2007). DIC parameters pCO2 and pHTOT (pH defined on a total H+ scale) were calculated at in situ temperature and salinity conditions based on TA and DIC data (Andersson et al., 2007). Nutrient chemistry, including total ammonium (ammonia plus ammonium), nitrite, nitrite plus nitrate, ortho-phosphate, and silicic acid analytes, was performed via flow-injection analysis on a Lachat QuickChem 8,500 Series 2 by the University of California, Santa Barbara Marine Science Institute Analytical Laboratory.1
DOM analyses (DOC, TDAA, HR-DOM)
Replicate DOC samples were analyzed using a high-temperature combustion method (Halewood et al., 2022) on a modified TOC-V or TOC-L analyzer (Shimadzu, Kyoto, Japan) at the University of California, Santa Barbara. All DOC samples were analyzed with a set of “in-house” reference waters that were previously calibrated with DOC Certified Reference Material (CRM) provided by D. Hansell (University of Miami) (Halewood et al., 2022). The precision for DOC analysis is ~1 μmol L−1 or a CV of ~2%. DOC values greater than the 90th percentile were considered contaminated.
Replicate TDAA samples were hydrolyzed by 6 N HCl (with 1% 12 mmol L−1 ascorbic acid to prevent oxidation of amino acids by nitrate) under nitrogen at 110°C for 20 h (Parsons et al., 1984; Henrichs, 1991; Kuznetsova and Lee, 2002). Hydrolysate was filtered through combusted quartz wool and neutralized via evaporation under nitrogen. Nanopore blanks followed the same extraction protocol as samples. Amino acids were analyzed by high-performance liquid chromatography (HPLC, Dionex ICS 5000+) equipped with a fluorescence detector (Dionex RF2000, Ex = 330 nm, Em = 418 nm) after pre-column o-phthaldialdehyde derivatization (Lindroth and Mopper, 1979; Lee et al., 2000; Kaiser and Benner, 2009; Liu et al., 2013).
Acidified 0.2 μm filtered seawater samples were passed through Bond Elut PPL cartridges (1 g/6 mL; Agilent, Santa Clara, CA, United States) to extract extracellular DOM. Extraction followed the protocol (Dittmar et al., 2008) with modifications described in Longnecker (2015). The extraction efficiency for marine DOC using PPL cartridges is 43–62%. Extracted DOM samples were analyzed in negative ion mode using untargeted mass spectrometry methods (Weber et al., 2022) at the Woods Hole Oceanographic Institution. Mass-to-charge (m/z) ratios, retention times, and peak areas were measured for each sample. mzRT features were defined as unique combinations of an m/z ratio and a retention time. Elemental formulas were calculated from m/z ratios using the Compound Identification Algorithm (Kujawinski and Behn, 2006).
Prokaryotic abundance
Fixed seawater (1–5 mL) was filtered onto 0.2 μm polycarbonate filters pre-stained with Irgalan Black (0.2 g in 100mLs of 2% acetic acid). Prokaryotic abundance (bacteria and archaea) was determined by staining with 0.5 mL of 4′,6-diamidino-2-phenylindole dihydrochloride (DAPI; Sigma-Aldrich, St. Louis, MO, United States) (5 μg mL−1) for 3 min (Porter and Feig, 1980). Ultraviolet epifluorescence microscopy (AX70; Olympus, Shinjuku, Japan) excited the stained prokaryotic cells for counting. At least 10 fields of view containing 40–100 prokaryotic cells were enumerated for each sample at a magnification of ×1,000. Narrow green epifluorescence microscopy (AX70; Olympus, Shinjuku, Japan) was used to excite the autotrophic cells (Synechococcus in this study) for counting. At least 10 fields of view containing 0–25 autotrophic cells were enumerated for each sample at a magnification of ×1,000.
Archaeal and bacterial lineage abundance using FISH and CARD-FISH
FISH was used to enumerate Chlorobi and SAR202 using probes Chlorob441-Cy3 and SAR202_103R-Cy3 & 311R-Cy3 with Neg338 as a negative control (Integrated DNA Technologies, Coralville, IA, United States). Ten to forty milliliter of fixed seawater samples were filtered onto 0.2 μm polycarbonate membrane filters (Osmotics, Norfolk, United Kingdom) under gentle vacuum (100 mmHg) and stored at −20°C with desiccant. Filters were divided into eight sections, and each section was washed in 95% ethanol and then probed according to (Parsons et al., 2015; Liu et al., 2020).
CARD-FISH (Teira et al., 2004; Herndl et al., 2005) was used to enumerate Thaumarchaeota using probe Cren537 and NON338 (non-specific) as a negative control (Integrated DNA Technologies, Coralville, IA, United States). For Thaumarchaeota, no embedding step was performed prior to incubation in hydrochloric acid (0.1 N) for 2 min to permeabilize the cell membrane (Parsons et al., 2015). The hybridization and wash conditions with all probe sequences described in (Parsons et al., 2015). A tyramide signal amplification (TSA) kit was used after hybridization to improve fluorescence and probe detection (PerkinElmer, Waltham, MA, United States).
The resulting filters from FISH and CARD-FISH were mounted with 20 μL of 1.67 μg ml−1 4′,6-diamidino-2-phenylindole dihydrochloride (DAPI; SIGMA-Aldrich, St. Louis, MO, United States) in Citiflour solution (Ted Pella Inc., Redding, CA, United States), sealed with nail polish, and stored in the dark at −20°C. Imaging was performed with an Olympus AX70 epifluorescent microscope on FISH and CARD-FISH slides excited with Cy3 (550 nm) and UV wavelengths, as previously described (Parsons et al., 2012, 2015). The image capturing was performed using a Color Retiga Exi (QImaging®, Surrey, BC, Canada) digital camera (1,392 × 1,040 pixels) with Image Pro software (version 7.0; Media Cybernetics, Rockville, MD, USA) (Carlson et al., 2009).
DNA extraction, library preparation, and Illumina sequencing
DNA was extracted using the phenol-chloroform protocol (Giovannoni et al., 1990). After drying, the DNA pellet from the high-volume samples was shipped to the Center for Genome Research and Biocomputing (Oregon State University), Corvallis, Oregon for sequencing. Genomic DNA samples were amplified using the universal primer sets for the 16 s ribosome V4 region 515F (GTGCCAGCMGCCGCGGTAA) and 806RB (GGACTACNVGGGTWTCTAAT) with ‘general’ Illumina overhang adapters (Apprill et al., 2015). Libraries were pooled in equimolar concentrations prior to sequencing. Samples were sequenced using one 2 × 250 Paired-End lane with a MiSeq Reagent Kit v2.
The DNA pellet from low-volume samples was shipped to the University of California, Santa Barbara. Amplification of the V4 region of the 16S rRNA gene was performed using the 515F-Y (5′-GTGYCAGCMGCCGCGGTAA-3′) and 806RB (5′-GGACTACNVGGGTWTCTAAT-3′) primers with custom adapters (Apprill et al., 2015; Parada et al., 2016; Wear et al., 2018). PCR-grade water process blanks and mock communities (BEI Resources mock communities HM-782D and HM-783D) and a custom community from the Santa Barbara Channel (Wear et al., 2018) were included with each 96-well plate of samples as quality control checks. Amplicons were cleaned and normalized using SequalPrep plates (Invitrogen, Waltham, MA, United States), pooled at equal volumes, concentrated using Amicon Ultra 0.5 mL centrifugal tubes (Millipore, Burlington, MA, United States), gel extracted using the QIAquick Gel Extraction Kit to remove non-target DNA (Qiagen, Hilden, Germany) and sequenced on an Illumina MiSeq using PE250 chemistry at University of California (UC), Davis DNA Technologies Core.
Archaeal amoA and prokaryotic cbbL gene quantification using qPCR
Quantitative PCR (qPCR) was performed on an ABI 7300 Real Time PCR machine (Thermo Fisher Scientific, Waltham, MA, USA) using 7300 System SDS Software v1.2 (Applied Biosystems). The cbbL gene abundance was investigated since it encodes for the ribulose-1,5-bisphosphate carboxylase/oxygenase (RuBisCO) form I enzyme responsible for the first step in carbon fixation. The cbbL gene is present within lineages found within Devil’s Hole, including Synechococcus and Chlorobiales (Pichard et al., 1996; Eisen et al., 2002; Parsons et al., 2015). Primers were designed in this study for the cbbL gene as described in Supplementary Table S1. The amoA gene encodes for the ammonia monooxygenase enzyme that converts total ammonium to nitrite. Since Thaumarchaeota, a known ammonia oxidizing archaea (AOA) is found in Devil’s Hole (Parsons et al., 2015) and has a higher affinity for ammonia than competing bacteria, the amoA gene abundance was also quantified in this study using the primer set from (Treusch et al., 2005).
The cbbL and amoA gene abundance was performed in duplicate on the undiluted and diluted (20 ng/μL) samples. Each reaction mixture consisted of 10 μL of Luna Universal qPCR Master Mix (New England Biolabs, Ipswich, MA, United States), 10 mM of each forward and reverse primer, 2 μL of template and 6 μL of sterile water (New England Biolabs, Ipswich, MA, United States). All reactions were performed in optical qPCR tubes with strip caps (USA Scientific, Ocala, FL, United States). Negative controls (containing nuclease-free water in replace of the template DNA) were analyzed with every experiment. Samples of interest were amplified using the thermal conditions outlined in Supplementary Table S2 (PCR efficiency cbbL = 119%; R2 = 0.994; PCR efficiency amoA = 119%; R2 = 0.998). Standards were prepared for the cbbL and amoA genes as described in Supplementary Table S2. The gene copy number (gcn) of the standard was calculated using the following formula (Prediger, 2013):
The gcns of the genes were then divided by the ng concentrations of DNA in the sample to normalize the qPCR data. The standards were diluted from 106 to 101 gene copies in all experiments, and a standard curve was subsequently created.
Data processing and analysis
Ocean Data View version 5.5.2 (Schlitzer, 2021) was used to create contour plots using the DIVA (Data-Interpolating Variational Analysis) gridding algorithm (Barth et al., 2010). Statistical analyses were conducted using base R version 4.1.2 and R Studio 2021–09.1 (Team, 2021). Prokaryotic specific growth rates (μ) were calculated from experimental growth curves as the slope of ln(PA) vs. time during the exponential growth phase of each treatment (Table 1). Stationary phase was reached at different times for each treatment and was determined as 2 × tmid where tmid is the time when PA reached half carrying capacity using a logistic growth model in the growthcurver package in R (Sprouffske, 2018). DOC concentrations at the calculated stationary time point were interpolated if sampling did not coincide with the modeled estimate of stationary phase. Mean prokaryotic abundance growth and DOC drawdown over exponential growth phase were derived from integration under the growth curve or DOC curve and normalized over incubation time (Table 1). Bacterial growth efficiency (BGE) was calculated as the ratio between bacterial carbon (BC) increase and DOC removal from T0 to stationary phase (Liu et al., 2020):
where t is time, is the time normalized integrated prokaryotic growth converted to carbon unit assuming a conversion factor of 20 fg C per cell (Lee and Fuhrman, 1987) and is the time normalized integrated DOC draw down over exponential phase.
TDAA yield was calculated as the sum of TDAA in carbon units normalized by DOC concentration. Degradation index (DI) was calculated based on Dauwe et al. (1999) and Kaiser and Benner (2009):
Where vari is the molar percentage of amino acid i, and AVGvari, STDvari, and fac.coefi are average value, standard deviation, and principal component factor coefficient of amino acid i derived from a variety of DOM samples described in Kaiser and Benner (2009).
The mzRT features were grouped into compound classes based on the elemental formulas and the calculated aromaticity index (Koch and Dittmar, 2016). The following groups were defined: black carbon, carbohydrates, condensed hydrocarbons, highly unsaturated compounds, lignin, lipids, peptides, proteins, protein maya, polyphenols, unsaturated aliphatic compounds, sugars, saturated fatty acids, and carboxyl-rich alicyclic molecules (CRAM) (Martínez-Pérez et al., 2017). From the molecular formula assignments, the magnitude-averaged O/C, H/C, and double bond equivalent (DBE) values for each sample were calculated for each assigned molecular formula based on the relative magnitude of each peak (Sleighter and Hatcher, 2008).
Sequence data were trimmed, dereplicated, checked for chimeras, and assigned to taxonomies using the DADA2 R package, v1.2 (Callahan et al., 2016) and the SILVA SSU Ref database version 138 (Glockner et al., 2017). Illumina sequencing data was filtered to remove amplicon sequence variants (ASVs) in less than four samples and rarefied to a minimum of 10,000 reads. Stacked bar charts were plotted for the most abundant (>0.15%) ASVs using phyloseq and ggplot 2 packages in R.
Results
Stratification, the formation of the Devil’s Hole OMZ, and subsequent overturn in 2018
The water column began to stratify in May 2018 with a 5°C gradient from surface to bottom. Bottom waters (22–24 m) ranged between 20°C and 22°C between May 16th and July 23rdJuly23rd, 2018. By June 11th, 2018, oxygen concentrations in the bottom waters were reduced to 26 μmol L−1, and were within the dysoxic range and reduced to suboxic levels (<20 μmol L−1) by July 12th, 2018 (Wright et al., 2012). The temperatures in the bottom waters started to warm on July 23rd, ranging between 22°C and 24°C until September 19th, 2018. Partial overturn occurred between September 19th and 26th, 2018 (Figure 1). During this time, temperature was uniform at 27.6°C throughout the water column, while oxygen concentrations remained suboxic at 24.5 m (Figure 1), which was just above the sediment layer. Complete overturn occurred by October 18th, 2018, with all parameter profiles returning to uniform distributions.
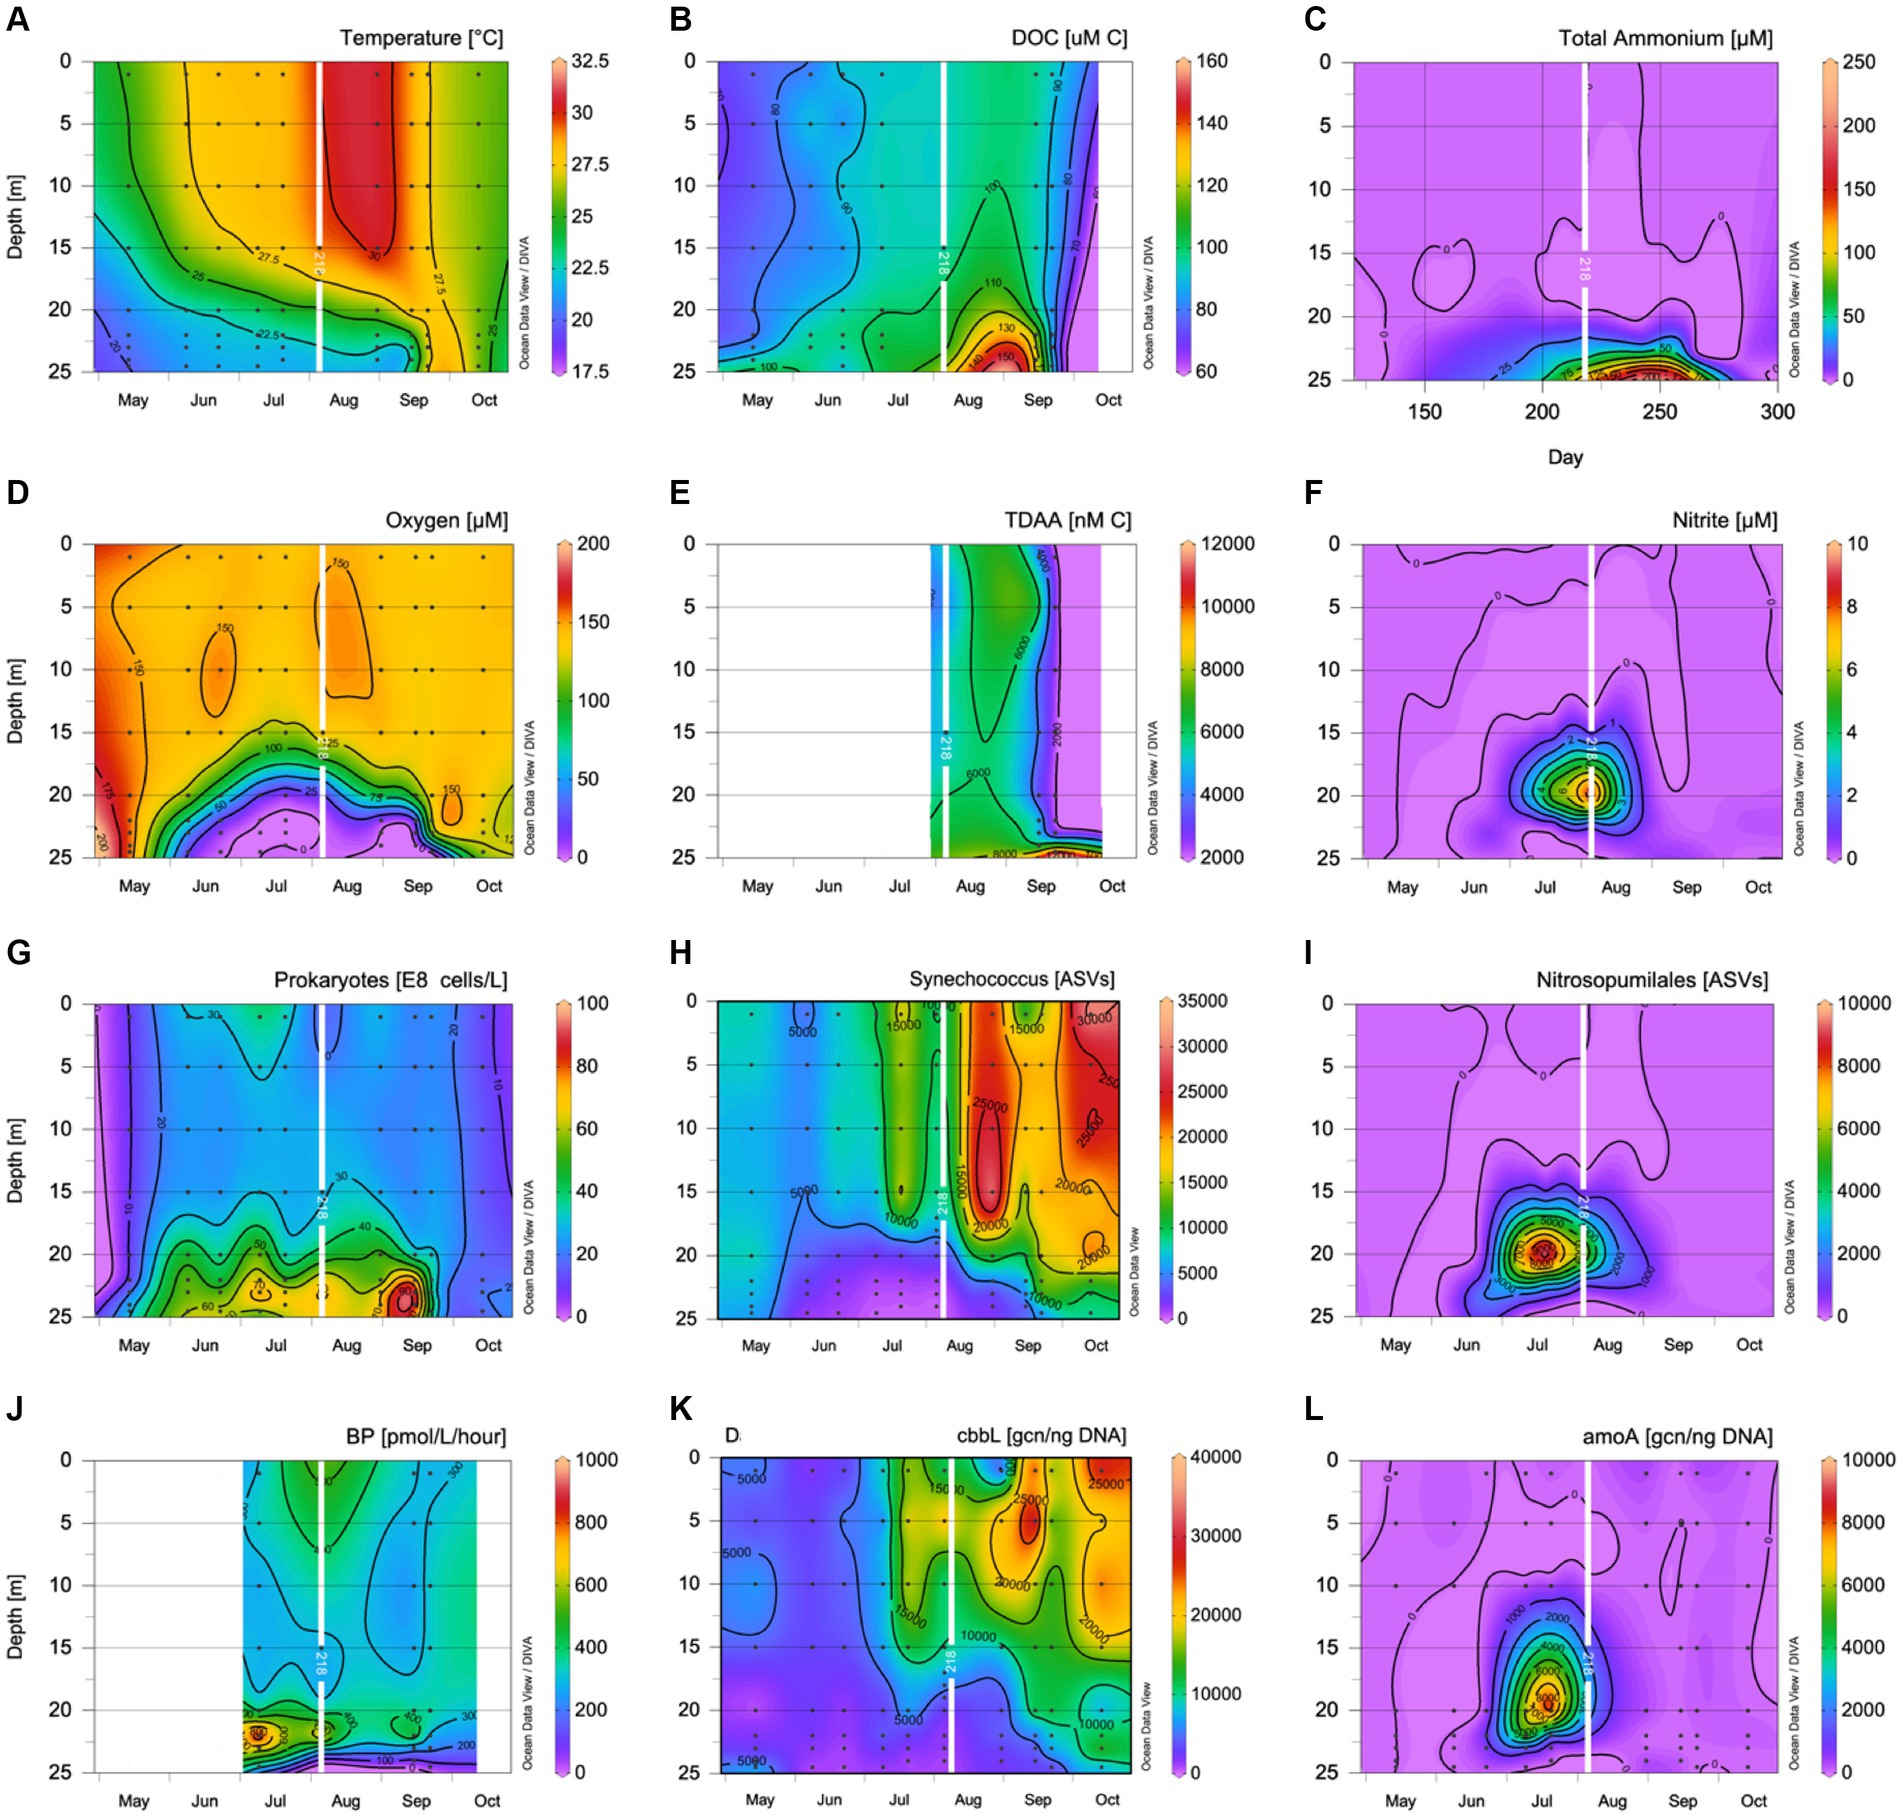
Figure 1. Contour plots showing (A) temperature (°C); (B) dissolved organic carbon concentrations (μmol C L−1); (C) total ammonium concentrations (μmol L−1); (D) dissolved oxygen concentrations (μmol L−1); (E) TDAA concentrations (nmol L−1); (F) nitrite concentrations (μmol L−1); (G) prokaryotic abundance (108 cells L−1); (H) Synechococcus ASV number; (I) Nitrospumillales ASV number; (J) 3H Leu uptake (pmol/L/h); (K) cbbL gene copy number per ng of DNA; and (L) amoA gene copy number per ng of DNA. The day of seawater collection for the experiment in August is overlayed as a white line.
The spatial changes in biogeochemical and microbial variables within devils hole, Bermuda, at the time of experimental sampling
On August 9th, 2018, the temperature difference between surface (30°C) and deep depths (21.8–22.4°C) was 8.2°C. Oxygen concentrations decreased from surface 148 μmol L−1 to suboxic levels of 1–2 μmol L−1 from 22 m through 25 m. The surface prokaryotic abundance was 17.6 ± 1.1 × 10⁸ cells L−1, while the surface DOC concentration was 94.8 ± 2.4 μmol C L−1. From 22 m through 25 m, prokaryotic abundance was elevated ~70 × 108 cells L−1, and DOC concentrations ranged between 105 and 115 μmol C L−1 (Figure 1; Table 1). Bacterial 3H -Leu incorporation rates reached a maximum in the oxycline with rates of >800 pmol L−1 h−1 at 22 m, almost double the 3H -Leu incorporation rate measured at the surface, decreasing to 75 pmol L−1 h−1 at 24 m. TDAA C concentrations reached 6,742 nmol C L−1 at 24 m while degradation indices ranged from 2.1 to 2.4 throughout the water column (Figure 1; Supplementary Table S4). Nitrate levels were below the detection limit for the whole water column, while the other nutrients all increased with depths with concentrations for phosphate, silicate, nitrite, and total ammonium reaching 1.8, 66.3, 0.5, and 79.2 μmol L−1, respectively at 24 m. The gene copy number (gcn) normalized to DNA concentration per ng were 9922.7 ± 314.2 copies for the cbbL gene at the surface and 140.0 ± 58.3 copies between 22 and 24 m (Figure 1). The gene copy number (gcn) normalized to DNA concentration per ng were 14.1 ± 0.4 copies for the amoA gene at the surface, peaked at 20 m with 2.70 ± 0.09 × 10⁴ copies for the amoA gene, and averaged 1363.4 ± 374.9 copies between 22 and 24 m (Figure 1). There were few Nitrospumillales ASVs in the sequencing data at the surface, but Synechococcus ASVs were abundant and coincided with the cbbL gene copy number (Figure 1). Nitrospumillales ASVs peaked at 20 m concurrent with the amoA gene copy number peak, while Synechococcus ASVs were low, decreasing with depth, and followed a similar pattern to the cbbL gene copy number (Figure 1).
Prokaryotic abundance and DOM dynamics in the experimental treatments
In the initial inoculum mixed with filtered water, the prokaryotic assemblages were 50% higher in the S/S and S/D treatments than expected, suggesting smaller cells may have filtered through while the D/S treatment was within the 20% error. Actual DOC concentrations were within 2–5% of the expected DOC concentrations based on conservative mixing calculations (Table 1). The suboxic deep DOM was not kept under suboxic conditions during the experimental set-up and will be referred to as deep DOM during the experimental descriptions. In fact, oxygen levels increased to 98 μmol L−1 in the S/D treatment and 116 μmol L−1 in the D/S treatment within 15 h as determined using YSI 556 multiprobe (Yellow Springs, OH, United States).
The prokaryotic response was distinct for each treatment (Figure 2A), with no significant differences between replicate bottles (p = 0.551, N = 42). The S/S treatment had the lowest specific growth rate and prokaryotic growth during exponential phase (Table 1). The S/D treatment had the highest specific growth rate, more than a sixfold increase from the S/S control, and the highest prokaryotic growth during exponential phase (Figure 2B). The prokaryotic abundance initially decreased in the D/S treatment, followed by rapid exponential growth phase between day 2 and day 5, with a specific growth rate between the other two treatments. Prokaryotic abundance in the two treatments was significantly different from the control (ANOVA and Tukey HSD p < 0.01). The S/D treatment had the highest BGE of all the treatments, with values more than twice that of the control, while the D/S treatment had BGE values 1.5 times that of the control.
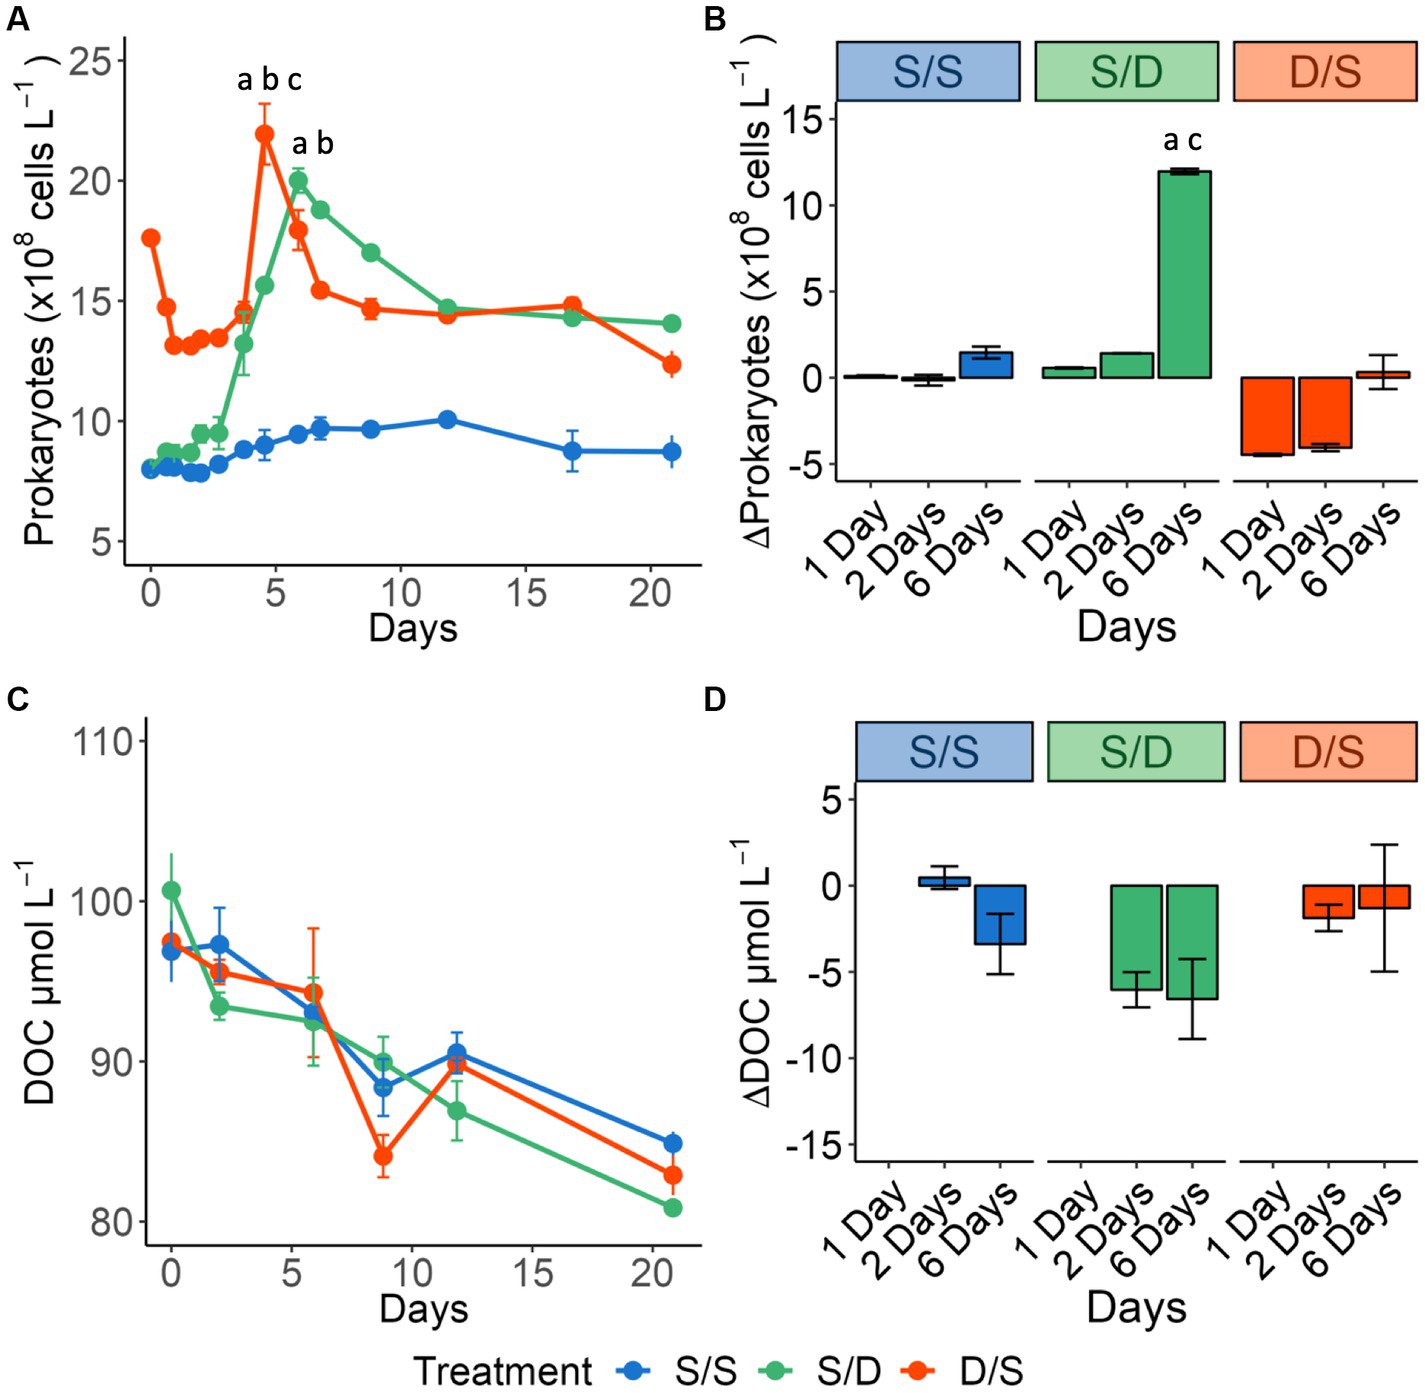
Figure 2. Line graphs showing (A) prokaryotic cell abundance (×108 cells L−1) for all treatments over 21 days. Significant differences between treatments on day 7 and day 8 are indicated by “a” for the S/S vs. S/D treatments, “b” for the S/S vs. D/S treatments and “c” for the S/D vs. D/S treatments. Bar plots showing the change from day 0 for (B) prokaryotic cell abundance (×108 cells L−1) for Days 1, 2, and 6 measured within the exponential growth phase. Significant differences between treatments on day 6 are indicated by “a” for the S/S vs. S/D treatments and “c” for the S/D vs. D/S treatments. Line graphs showing (C) DOC concentrations (μmol C L−1). Bar plots showing the change from day 0 for (D) DOC concentrations (μmol C L−1) for Day 2, and Day 6 measured within the exponential growth phase.
DOC removal had no significant difference between replicate bottles (p = 0.232, N = 18). During the 2-day lag phase, DOC concentrations did not change in the S/S treatment but then decreased at a rate of 0.79 μmol C L−1 d−1 over the remaining 19 days (Figure 2C). In the S/D treatment, DOC was drawn down quickly, with concentrations decreasing by 2.7 μmol C L−1 d−1 over the first 2 days (Figure 2D) and then by 0.64 μmol C L−1 d−1 over the remaining 19 days. In the D/S treatment, DOC concentrations decreased by 0.68 μmol C L−1 d−1 over the 21-day experiment, with a small increase of DOC concentration between day 9 and day 12. Over the 6 days when prokaryotic abundance peaked, S/D had the largest DOC removal among the three treatments; similarly, mean DOC removal over exponential phase in S/D was over 3-fold greater than in the S/S treatment while DOC removal in the D/S treatment was double that in the S/S treatment (Figure 2D; Table 1). From Days 6 to 21, DOC concentration in three treatments became close to each other (Figure 2C) with no significant differences between all treatments throughout the experiment (ANOVA and Tukey HSD p > 0.90).
DOM quality change revealed from TDAA
In addition to changes in bulk DOC concentrations, DOM quality also changed throughout the incubations, as revealed by the TDAA data. The initial TDAA concentrations were greatest in the deep waters compared to the surface during August and reached a maximum in the suboxic layer in September (Supplementary Table S3). For all treatments, the average TDAA-C concentration decreased over time, with the greatest removal rate observed in the D/S treatment (Figure 3A). As a diagenetic index of DOM, TDAA yield in each treatment decreased rapidly over the first 2 days of the incubation, indicating that as DOC was consumed, it became more diagenetically altered (Figure 3B). While TDAA yield in the S/S treatment continued to decrease through Day 12, it curiously increased from Days 6 to 12 in the S/D treatment and after Day 2 in the D/S treatment. Another diagenetic index, DI, is derived from amino acid composition. DI showed lower values of <1 with degraded, more refractory DOM considered to have a degradation index of <1 (Dauwe et al., 1999; Kaiser and Benner, 2005). Consistent with TDAA yield, DI in the S/D treatment decreased at a faster rate than the control, reaching a low after 6 days before increasing again by day 12 (Figure 3D). The decrease in DI in the D/S treatment, reaching the lowest value after only 2 days. After 2 days, the DI increased to its highest level in the D/S treatment, indicating a potential input of fresh DOM.
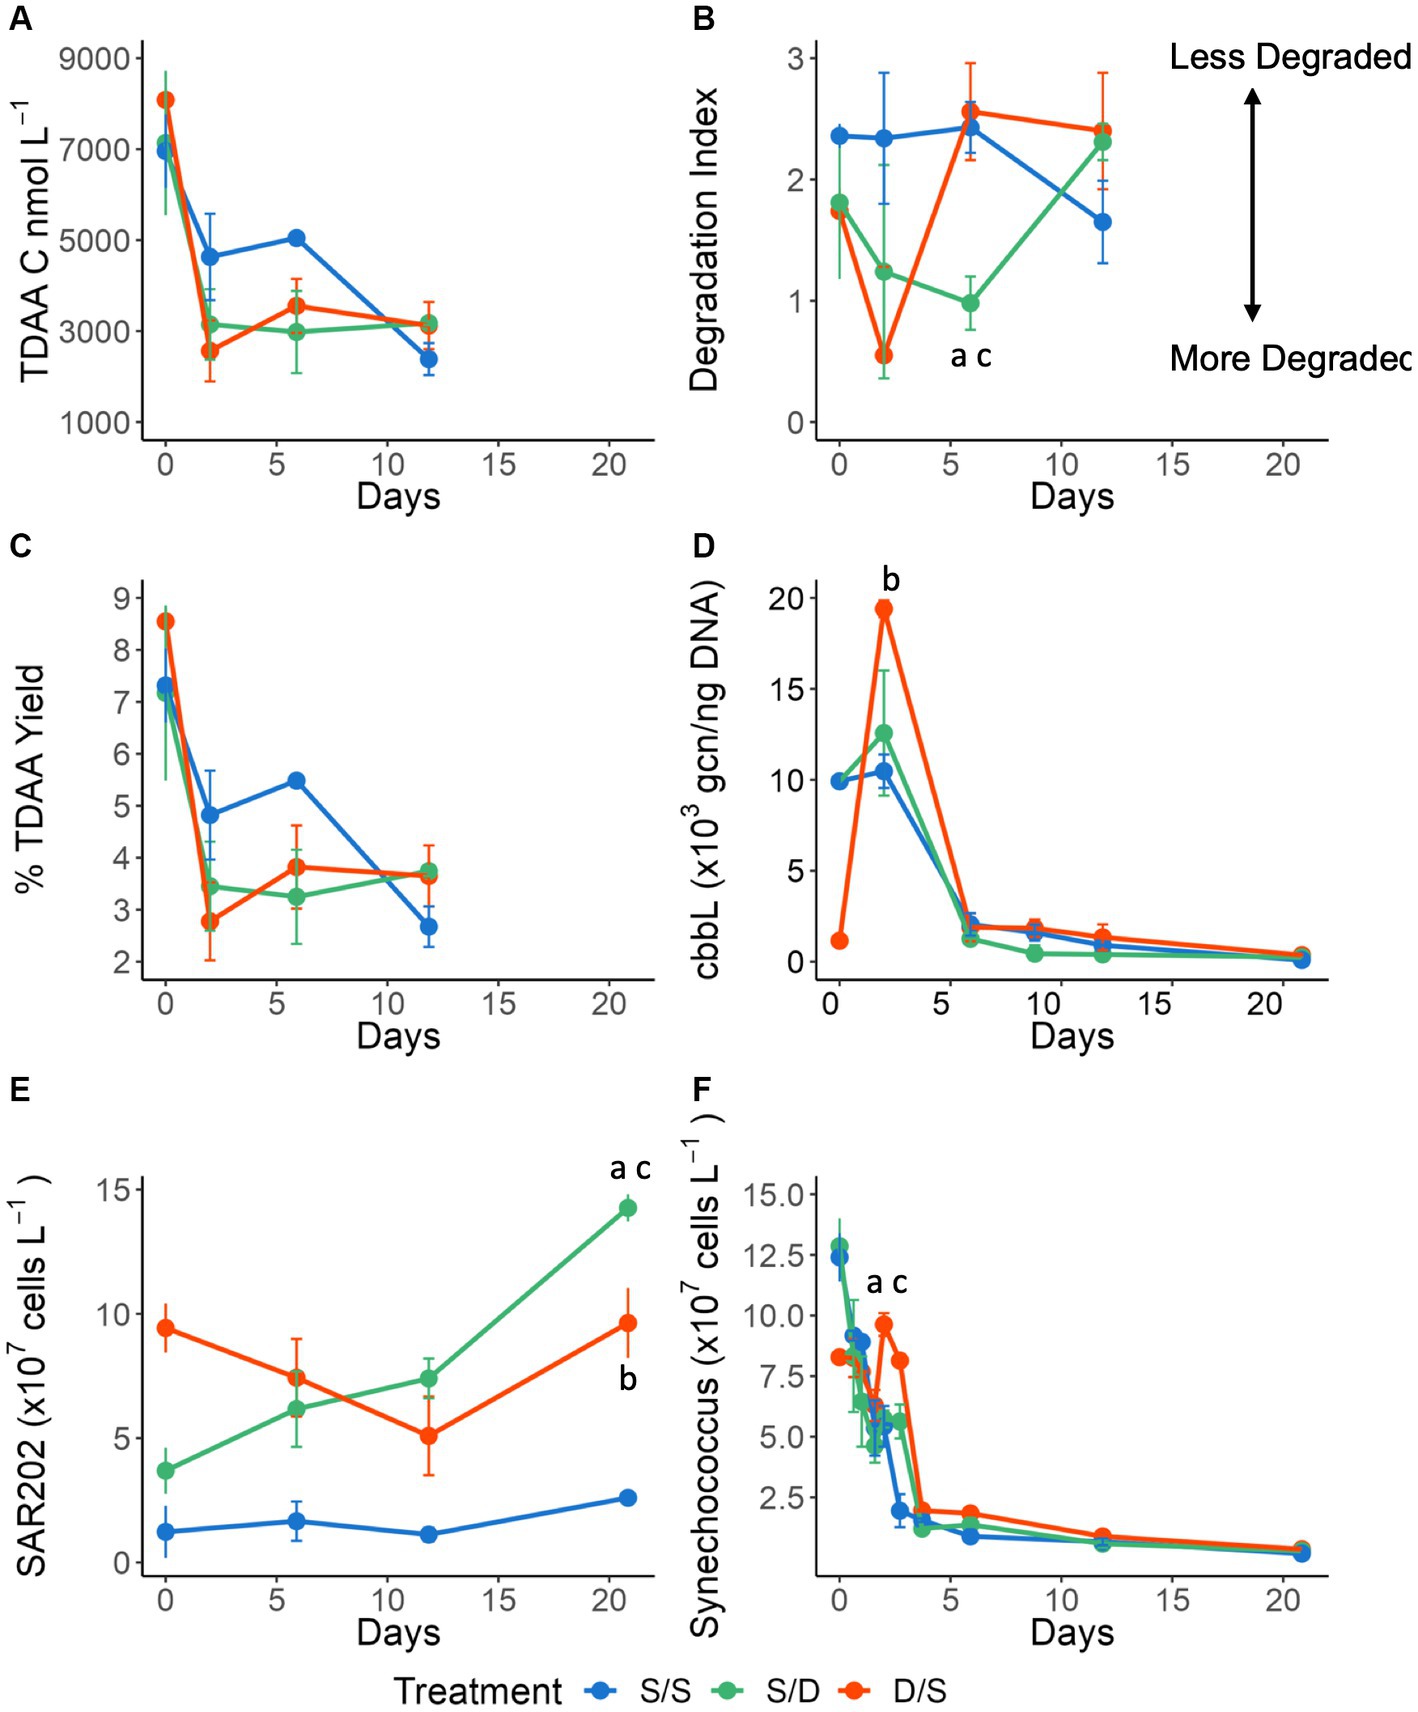
Figure 3. Line graphs showing (A) total dissolved amino acids (TDAA) concentrations in nmol C L−1; (B) the Degradation Index; (C) percent TDAA yield; (D) cbbL gene copy number per ng of DNA; (E) SAR202 cell abundance ×107 cells L−1; and (F) Synechococcus cell abundance ×107 cells L−1 for all treatments over 21 days. Significant differences between treatments on specific timepoints are indicated by “a” for the S/S vs. S/D treatments, “b” for the S/S vs. D/S treatments and “c” for the S/D vs. D/S treatments.
The percent contribution of each amino acid to total amino acid concentrations were plotted as a stacked bar plot for the time series in August and September (Supplementary Figure S2) and for the experiment (Figure 4A). The percent molar concentrations of amino acids did not change much over depth in August. By September, glycine had reduced from 29% of the total amino acid concentrations at the surface to 17% in the suboxic layer, while glutamic acid increased from 8% at the surface to 14% in the suboxic layer (Supplementary Figure S2). The concentration of alanine increased from 86.95 nmol L−1 in the surface to 286.22 nmol L−1 at depth, while the percent contribution to total amino acids decreased from 13% at the surface to 11% at 24 m.
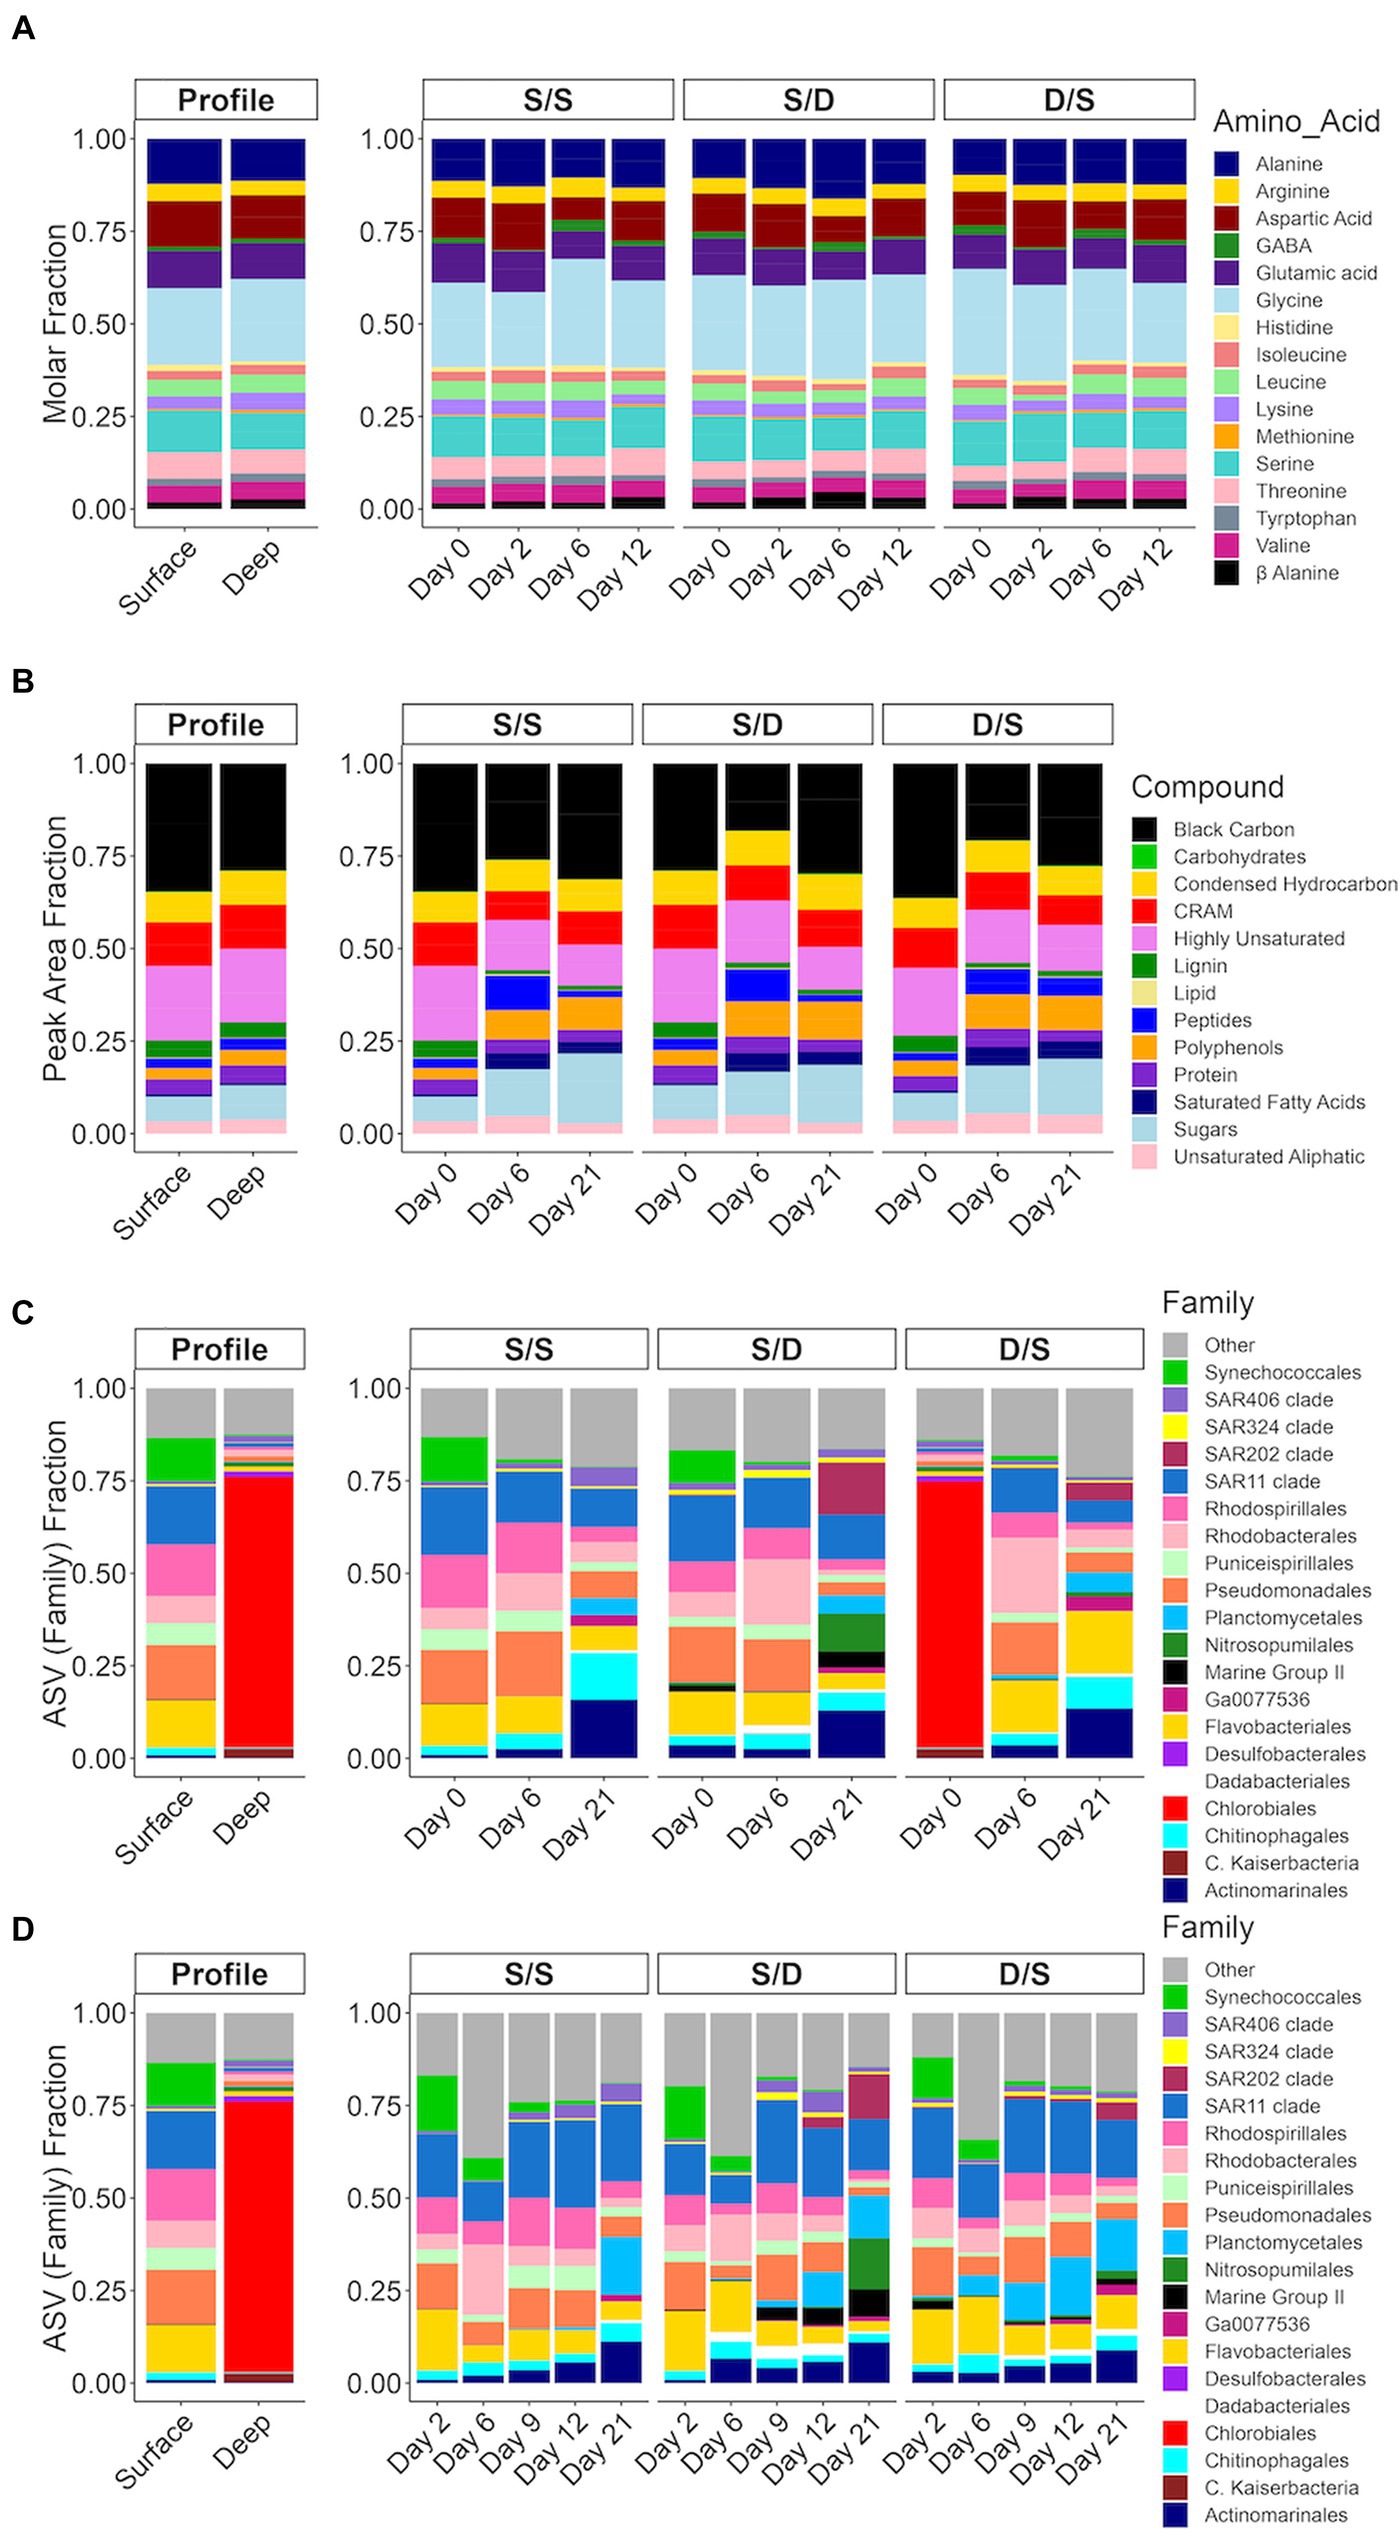
Figure 4. Bar plots for the treatments with (A) molar fraction of each amino acid; (B) the peak area fraction of the mzRT features in each of the defined compound classes (Martínez-Pérez et al., 2017); and the fraction of total Illumina sequencing amplicon sequence variants (ASVs) of the V4 region of the 16S ribosomal RNA gene for each of the dominant family groups divided by the total ASVs for (C) high-volume samples (1 L) filtered onto Omnipore filters and (D) low-volume samples (~200 mL) filtered onto polycarbonate filters. The ASVs belonging to family groups less than 1% of total are combined into “other”. In the mzRT features plot (B) S/S Day 0 and D/S Day 0 represents the surface DOM samples and S/D Day 0 represents the deep DOM samples.
In the experiment, alanine, asparagine, glycine, glutamine, and serine have the highest concentrations representing between 62 and 76% of the total amino acid concentrations, depending on treatment and timepoint. Preferential removal of specific amino acids, such as glutamic acid, aspartic acid, serine, and leucine, occurred in the S/S, S/D and D/S treatments with 63, 45, and 38% of the amino acid composition in the fraction of TDAA removed, respectively over 6 days (Figure 4A). For instance, serine was removed at a rate double that of the control (155 nM compared to 68 nM) (Supplementary Figure S3). While the percent contribution of glycine to total amino acids increased by 8% between days 2 and 6 in the S/S treatment, it remained relatively constant between days 2 and 12 in the S/D treatment, followed by a 5% decrease between days 2 and 12 in the D/S treatment. The molar percentage of alanine was relatively constant in the control and D/S treatments but decreased by 3% from days 6 to 12 in the S/D treatment.
mzRT feature composition in the experimental treatments
The metabolomic data showed similar mzRT feature numbers when comparing the initial surface to the initial deep DOM (Table 2). The magnitude-averaged ratios of H/Cw, a saturation index, increased over 8 days, showing a saturation decrease. This index then decreased slightly, showing increased saturation by day 21. The magnitude-averaged ratios of O/Cw increased over the experiment, indicating an increase in oxidative state. The magnitude-averaged values of DBEw decreased over the experiment. The mzRT features defined by DOM compound class were grouped together and plotted as the corresponding percent peak area for each of the compound classes based on the elemental formulas and the calculated aromaticity index (Koch and Dittmar, 2016). Lignin was seen in both the surface DOM and deep DOM, while the number of black carbon mzRT features was elevated in the surface DOM compared to deep DOM (Figure 4B). In the experiment, peptides, polyphenols, and sugar classes contributed more to the total defined classes in all three treatments by day 6. In contrast, the black carbon class contribution to the total defined classes decreased in all three treatments by day 6. By the end of the experiment, the sugar class had increased by 10% of the total defined classes in all three treatments when compared to the start of the experiment. The fraction of carboxyl-rich alicyclic molecules (CRAM), a major fraction of refractory DOM (Hertkorn et al., 2006), decreased slightly by day 6 in the S/S and S/D treatments and by day 21 in the D/S treatment.
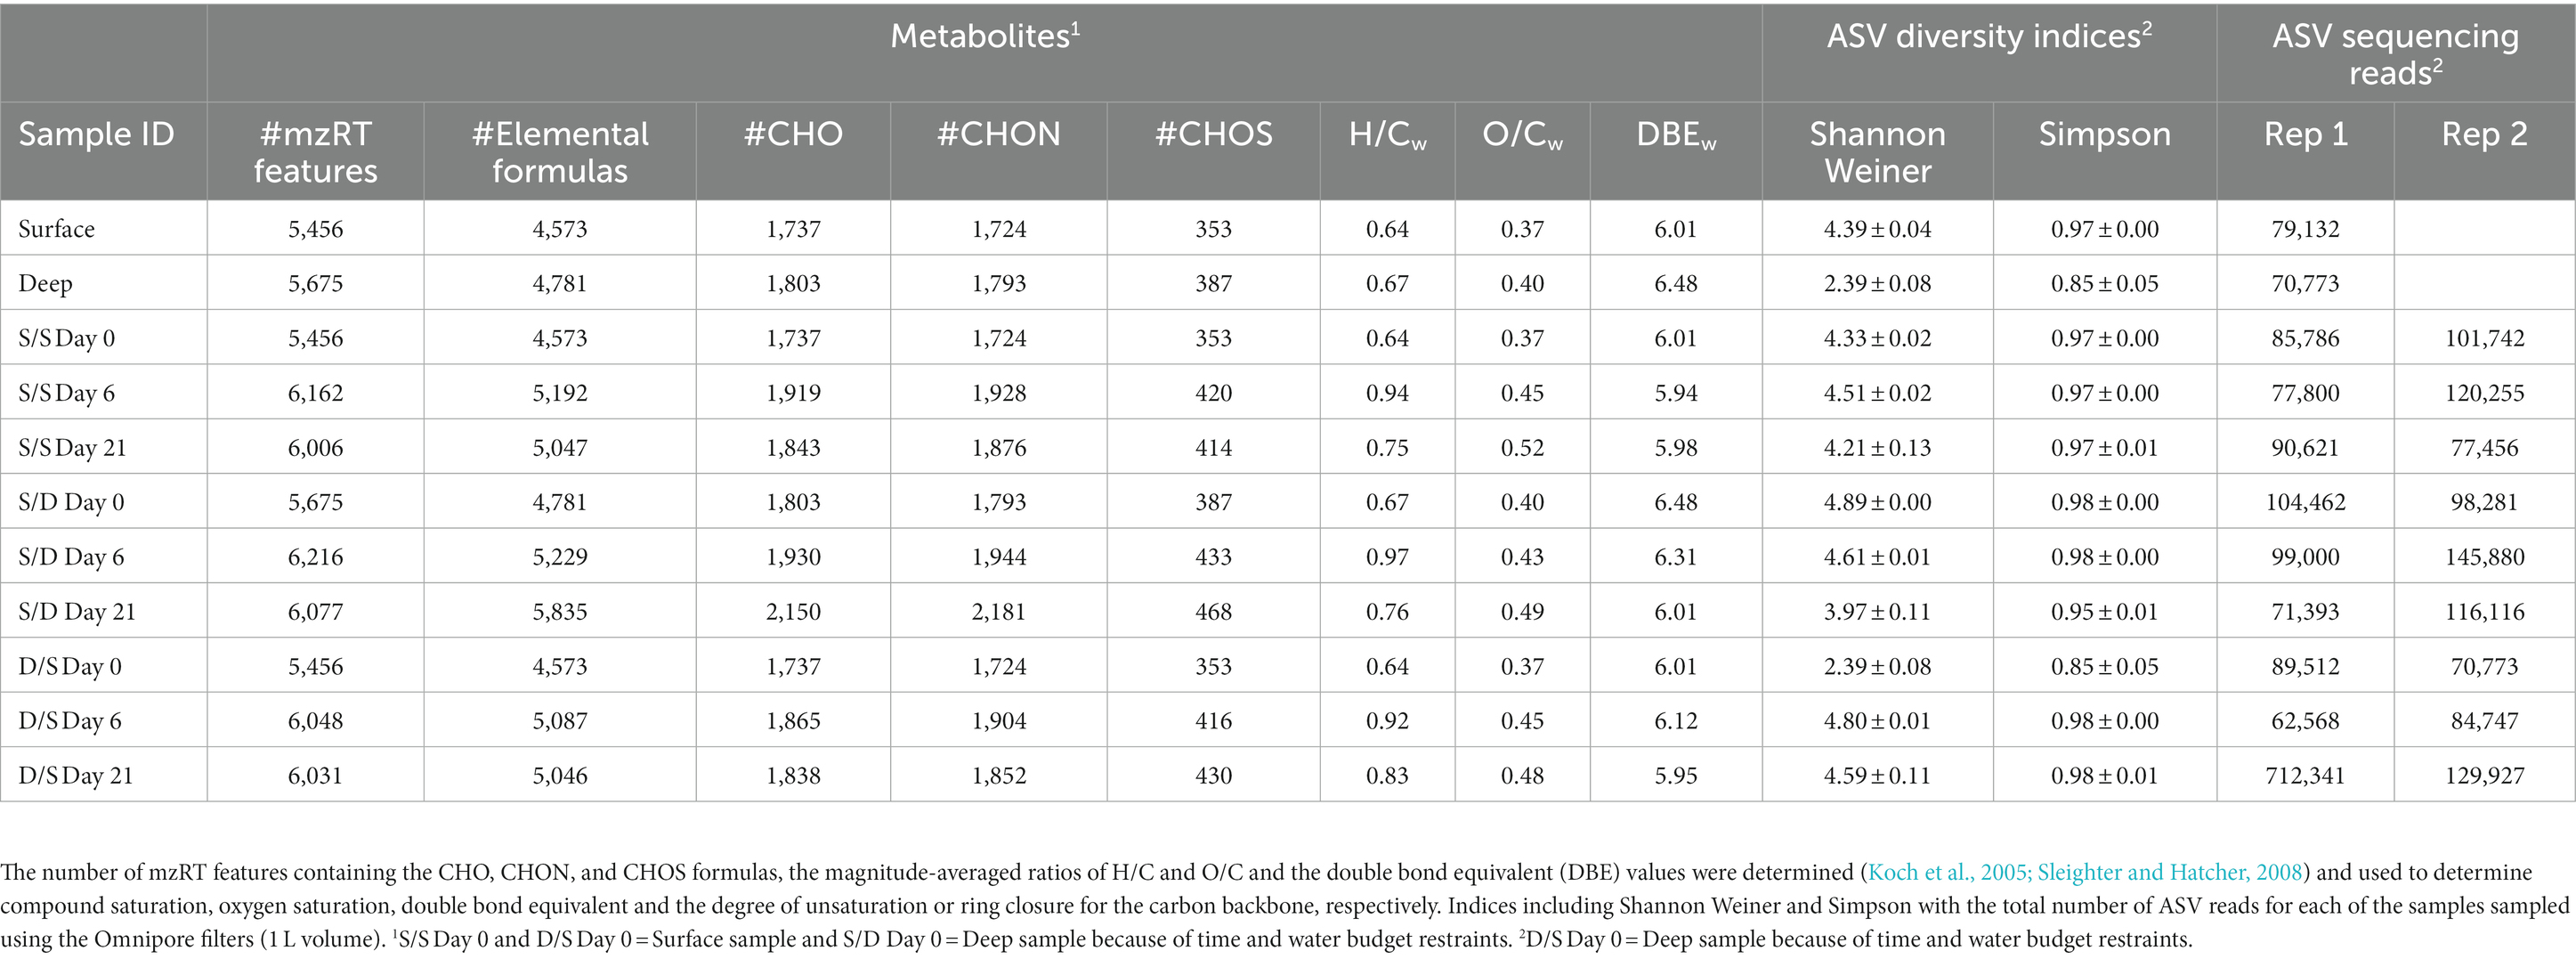
Table 2. Experimental data including metabolite information including the total number of mzRT features, the number of mzRT features with elemental formulas, and the number of mzRT features defined by DOM compound classes.
Nutrient concentrations in the experimental treatments
Total ammonium, nitrite, and silicate concentrations were distinct for each treatment (Figures 5A,B; Supplementary Figure S1D), while nitrate and phosphate concentrations were consistently low and more similar between treatments (Supplementary Figures S1B,D). There were no significant differences between replicate bottles with p values ranging from 0.133 to 0.443 (n = 18). All nutrient concentrations except nitrate were highest in the S/D treatment (Figure 5; Supplementary Figure S1). The total ammonium concentrations increased twice as much in the S/D treatment compared to the other two treatments and then decreased after 12 days while the other two treatments increased (Figure 5A). Total ammonium concentrations were significantly different in the S/D treatment compared to the control (ANOVA and Tukey HSD, p < 0.01). Nitrite concentrations in the S/D treatment and D/S treatment were 3.48 μmol L−1 higher and 2.10 μmol L−1 higher than the control at the initial time point, respectively (Figure 5B). Nitrite concentrations remained constant in the S/S control over 21 days while increasing by 33% in the S/D treatment and 11% in the D/S between days 12 and 21. Nitrite concentrations differed significantly between all treatments (ANOVA and Tukey HSD p < 0.01). Silicate concentrations in the S/D treatment were 2.62 μmol L−1 higher than the control, while the silicate concentrations in the D/S treatment were 1.85 μmol L−1 higher than the control at the initial timepoint, remaining at these concentrations throughout the 21 days (Supplementary Figure S1D). Silicate concentrations were significantly different between all treatments (ANOVA and Tukey HSD p < 0.01).
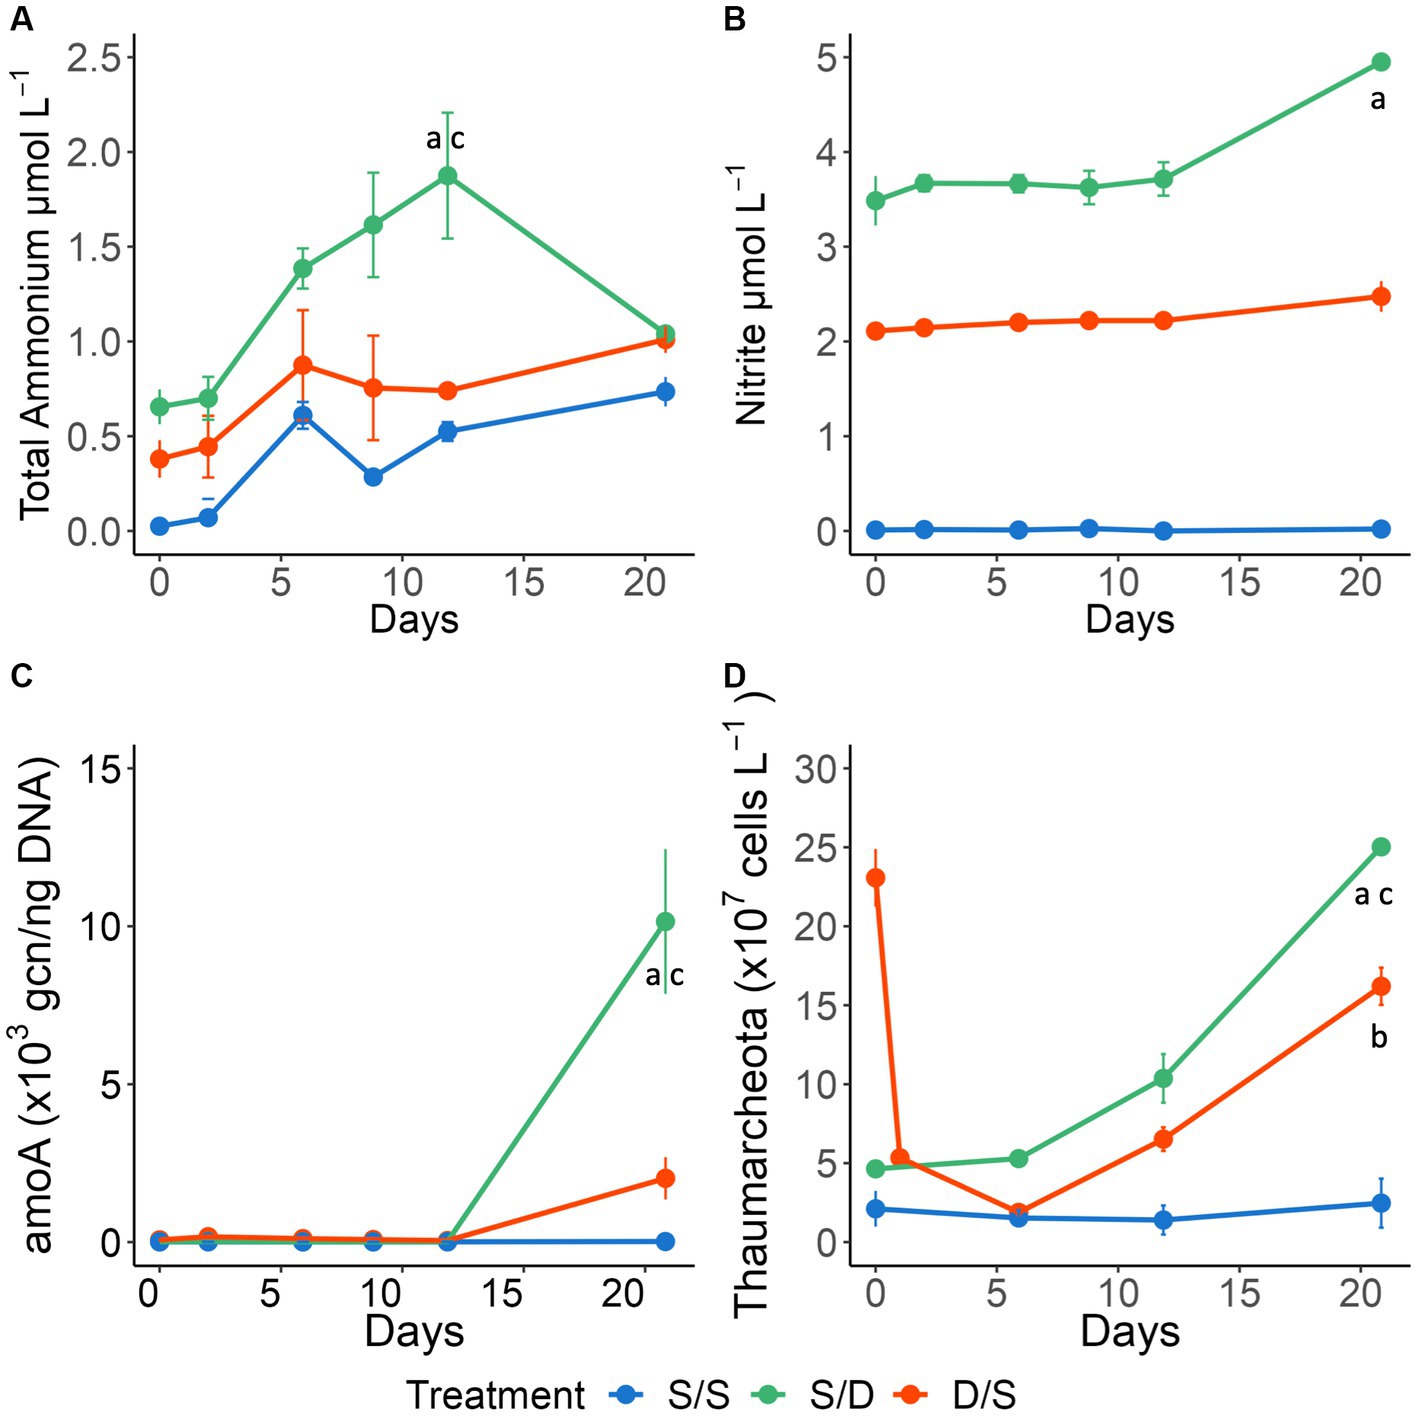
Figure 5. Line graphs showing (A) nitrite concentrations (μmol L−) and (B) total ammonium concentrations (μmol L−1); (C) the cbbL gene copy number normalized to DNA concentrations (ng) and (D) Thaumarcheota cell abundance (×107 cells L−1) for all treatments over 21 days. Significant differences between treatments on specific timepoints are indicated by “a” for the S/S vs. S/D treatments, “b” for the S/S vs. D/S treatments and “c” for the S/D vs. D/S treatments.
Change of prokaryotic lineages over the experiment
Synechococcus cell abundance was determined using microscopy (Figure 3F). At the start of the experiment, there were more Synechococcus cells at the surface when compared to the deep (Figures 1H, 3F). As expected in the dark incubation, Synechococcus cell abundance decreased by a magnitude in the S/S and S/D treatments over 4 days, with cell reduction continuing over the 21-day experiment. However, surprisingly, in the D/S treatment, there was an increase in Synechococcus cells after 1.5 days, corresponding to an increase in the cbbL gcn on day 2 (Figures 3D,E), followed by rapid cell reduction after day 3 with Synechococcus cell numbers continuing to decrease through the experiment. Since Synechococcus cell abundances generally decreased in all treatments throughout the experiment, there were no significant differences seen between the treatments over all timepoints (ANOVA and Tukey HSD p > 0.920).
SAR202 cell abundance was determined using FISH (Figure 3E). There were 7 times more SAR202 cells in the ambient deep community when compared to the ambient surface community at the initial time point. SAR202 numbers remained low in the control treatment throughout the experiment while decreasing in the D/S treatment over 12 days before increasing again by day 21 at a rate of 5.1 × 10⁶ cells L−1 day−1. In the S/D treatment, SAR202 continuously increased in abundance by 1.1 ± 0.1 × 10⁸ cells L−1 over 21 days, with production rates of 3.1 × 10⁶ cells L−1 day−1 for the first 12 days and increasing to 7.6 × 10⁶ cells L−1 day−1 between days 12 and 21. SAR202 cell abundances were significantly different between the two treatments (S/D and D/S) when compared to the control (S/S), meeting the 95% confidence limit (ANOVA and Tukey HSD p = 0.035 for both comparisons).
Thaumarcheota cell abundance was determined using CARD-FISH and included members of the ammonia-oxidizing Nitrospumillales. At the start of the experiment, there were 5 times as many Thaumarcheota cells in the ambient deep community, when compared to the ambient surface community. Thaumarcheota cell abundance remained low in the S/S treatment throughout the experiment but increased in the S/D treatment, reaching a high of 2.5 ± 0.3 × 10⁸ cells L−1 by day 21, ~10 times that of the control treatment (Figure 5D). Thaumarcheota cells initially died off in the D/S treatment as the deep community mixed with surface DOM, low total ammonium levels, and oxic conditions (Figures 1, 5). However, as total ammonium levels increased by Day 6, Thaumarcheota cell abundance increased, reaching 1.6 ± 0.1 × 10⁸ cells L−1 by day 21, ~6 times that of the control treatment. While there were differences in Thaumarcheota cell abundances on day 21, there were no significant differences seen between the treatments over all timepoints (ANOVA and Tukey HSD p > 0.01).
Change of specific genes over the experiment
To assess potential chemoautotrophy at the later stages in the S/D and D/S treatments as indicated from DOM data, the DNA sampled using both the Omnipore and polycarbonate filters was used to determine the gene copy number (gcn) for the cbbL gene and amoA gene using quantitative qPCR. The cbbL gene occurred within Devil’s Hole (Figure 1), where the oxic community consisted of the autotrophic Synechococcus, while the suboxic community contained SAR324, a chemolithoautotroph capable of fixing carbon using the RuBisCo pathway. The amoA gene also occurred within Devil’s Hole (Figure 1), where Thaumarcheota, an AOA, is abundant within the oxycline. The normalized cbbL gcn was high at the start of the experiment in the S/D and control (S/S) treatments where surface autotrophs were abundant (Figure 3D). The S/S control and S/D treatments showed a slight increase of ~550 and ~2,650 gcn, 650 gcn respectively, in the normalized cbbL gcn on day 2 and then decreased throughout the three-week experiment. The D/S treatment showed that the normalized cbbL gcn increased by ~18,250 gcn250 gcn between days 0 and 2 before decreasing to a minimum by day 21. The normalized amoA gene was present at <15 gcn within the surface seawater and at <75 gcn within suboxic water at the start of the experiment (Figure 5C). The control treatments remained low over time at <50 gcn50gcn. Both the S/D and D/S treatments showed increased amoA gene copies from day 12 to day 21, with an increase of ~10,130 gcn in the S/D treatment and ~1,970 gcn970gcn in the D/S treatment between days 12 and day 21.
The prokaryotic community in the experimental treatments
When 1 L of sample was filtered using 0.2 μm Omnipore 47 mm filters, there was an average of 96,466 ± 23,326 ASV reads with a 24% coefficient of variance for 20 samples (Table 2). When ~200 mL of the sample was filtered using 0.2 μm polycarbonate 25 mm filters, there was an average of 44,408 ± 17,405 ASV reads with a 39% coefficient of variance for 30 samples (Supplementary Table S4). The DNA sampled from the polycarbonate filters had lower reads and higher error than the DNA sampled from the Omnipore filters. However, both sets of filters had similar diversity indices (Table 2; Supplementary Table S4).
The diversity of the prokaryotic community based on ASVs was determined using Shannon Weiner and Simpson indices. The deep community was lower in ASV diversity than the surface community (Table 2). The prokaryotic diversity in the S/S treatment was relatively stable over 21 days, while the prokaryotic diversity in the S/D treatment decreased over, time: reaching a minimum by day 21. The prokaryotic diversity in D/S treatment increased over 6 days to similar values to the control and then decreased over the remainder of the incubation.
The initial deep prokaryotic community was dominated by Chlorabiales, making up 75% of the ASVs in this sample (Figure 4C), but became unresolvable by day 2 in the D/S treatment. The microbial assemblages in the surface communities of the S/S and S/D treatments responded similarly, with a small portion of archaea seen in the deep filtrate S/D treatment, suggesting some cells passed through the filters when generating the 0.2 μm deep filtrate. By day 2, all the treatments had similar community structure with a combination of Synechococcus, SAR11, Rhodospirillales, Rhodobacterales, Pseudomonadales, and Flavobacteriales making up between 60 and 70% of total ASVs (Figure 4C). The control treatment community remained similar until day 21 when Actinomarinales, Chitinophagales, and Planctomycetales increased, while Pseudomonadales and Flavobacteriales decreased (Figure 4C). The community changed earlier by day 12 in the S/D treatment with an increase in SAR202, Nitrospumilales, Marine Group II, Actinomarinales, and Planctomycetales, while Pseudomonadales and Flavobacteriales decreased (Figure 4C). By day 21, the community continued to change, with an increasing contribution of SAR202, Nitrospumilales, and Actinomarinales, making up 43% of the total ASVs. The community also changed between day 9 and day 12 in the D/S treatment, with an increase of Planctomycetales coinciding with an increase in DOC concentrations (Figure 2). The community continued to change between days 12 and 21, with an increase in SAR202, Nitrospumilales, Chitinophagales, Actinomarinales, and Flavobacteriales that combined make up 47% of the total ASVs.
Discussion
The accumulation and chemodiversity of suboxic DOM
Interest in the expansion of oxygen minimum zones has increased (Stramma et al., 2008; Schmidtko et al., 2017; Stramma and Schmidtko, 2019), with DOM degradation in anoxic waters becoming a popular topic of recent research (Pantoja et al., 2009; Maßmig et al., 2019; Lau and Del Giorgio, 2020; Engel et al., 2022). The accumulation of organic carbon in anoxic environments has previously been explained by thermodynamic limitations of DOM degradation (Lee, 1992; Lau and Del Giorgio, 2020) where otherwise bioavailable DOM may accumulate as a result of hypoxia. According to the hypoxic barrier hypothesis complete DOM oxidation is inhibited at low oxygen concentrations (Giovannoni et al., 2021). This hypothesis suggests that microbial metabolism of certain types of complex DOM is dependent upon the activity of oxygenase enzymes that require free oxygen levels >25 μmol L−1 to initiate the enzyme. If oxygen levels are too low to meet the requirement of catabolic oxygenase enzymes, DOM degradation will not occur and DOM will accumulate. DOM accumulation can also be partially explained by the production of DOM via chemoautotrophy (Bayer et al., 2022), which is widespread in anoxic waters (Keil et al., 2016). DOM accumulated within the suboxic layer of Devil’s Hole with DOC concentrations 21 μmol C L−1 higher at 24 m compared to surface values at the time of experimental set-up (Figure 1).
As a labile component in the DOC pool, TDAA increased with depth at Devil’s Hole with concentrations 425 nM higher at 24 m than at the surface at the time of experimental set-up (Supplementary Table S3), suggesting its accumulation of less diagenetically altered DOM in the suboxic water. This accumulation might be related to reduced DOM degradation in the suboxic water, as seen in a recent study from the Peruvian upwelling (Maßmig and Engel, 2021). This study showed that carbohydrate concentrations declined in suboxic waters, while amino acids only decreased slightly with compositional changes indicative of bacterial peptide degradation (Maßmig and Engel, 2021). Alternatively, the accumulation of amino acids in the deep could also be explained by labile DOM production, with the amino acids alanine and threonine increasing in suboxic waters, suggesting that there is dissolved organic nitrogen production or release under suboxic conditions (Maßmig and Engel, 2021). In general, the change in the molar fraction of all amino acids was similar over depth within the Devil’s Hole OMZ in August (Supplementary Figure S2; Figure 4B). However, when looking at individual amino acid concentrations, alanine and threonine concentrations increased with depth, with deep suboxic concentrations 40 and 20 nM higher than the surface, respectively (Supplementary Table S3). The deep suboxic DOM also had elevated glycine levels when compared to the other amino acids. In fact, the increase of glycine from surface to deep made up 27.6% of the difference between the surface and deep TDAA concentrations at the time of experimental set-up (Supplementary Table S3). Glycine is considered more resistant to degradation and can accumulate in the cell walls of prokaryotes attached to sinking particles eventually making its way into the DOM pool at depth (Hecky et al., 1973; Dauwe et al., 1999). Glutamic acid is concentrated in the cell plasma and as a result tends to be depleted during degradation (Dauwe et al., 1999). This amino acid, while also higher in the deep DOM from the Devil’s Hole OMZ, only made up 7.5% of the difference between surface and deep TDAA concentration during experimental set-up (Supplementary Table S3).
During the experimental set-up, the degradation index was 2.29 at the surface and 2.47 in the deep (24 m), suggesting that there was little difference in DOM diagenetic status between the two water depths with actual TDAA concentrations higher at depth (Supplementary Table S3). However, with the deepening of the OMZ prior to the physical overturn in October, the amino acid concentrations, including alanine, threonine, glycine, and glutamic acid, increased in the deep suboxic waters at 24.5 m (Supplementary Table S3). The molar percentage of glycine decreased from 29% at the surface to 17% at depth, while the molar percentage of glutamic acid increased from 8% at the surface to 14% at depth (Supplementary Figure S2). All these factors, along with an increase in the degradation index from 0.66 at 23 m to 3.48 at 24.5 m in September (Supplementary Table S3), indicate a source of fresh dissolved organic nitrogen production. The source of this fresh production could include the solubilization of sinking POM, chemolithoautotrophy (Bayer et al., 2022), anoxygenic photoautotrophy, or release from the sediments (Kaiser and Benner, 2009). Coastal marine sediments can be hot spots of microbial dark carbon fixation (Dyksma et al., 2016). In fact, DOM released from sediment metabolic processes can serve as an important source of bioavailable DOM for microbial communities at the sediment–water interface (Loginova et al., 2020). However, since the Devil’s Hole water column is illuminated (Parsons et al., 2015), anoxygenic photoautotrophy by low-light adapted Chlorobiales (Overmann et al., 1992) could also be responsible for this fresh production of DOM.
Oxygen depletion can increase chemodiversity, along with the accumulation of relatively high-molecular-weight compounds enriched with carboxyl-group structures, as shown in a seasonally stratified fjord (Chen et al., 2022). The number of mzRT features increased slightly in suboxic waters, with those defined by DOM compound classes increasing by 288 mzRT features, showing increased chemodiversity in the suboxic waters of Devil’s Hole (Table 2). The DBEw value was slightly elevated in the deep suboxic waters compared to the surface, suggesting increased aromatic compounds under decreased oxygen (Table 2). When comparing the mzRT features defined by DOM compound classes, surface waters contained more black carbon compounds, while deep suboxic waters contained more sugar compounds (Figure 4B). Black carbon compounds are polycyclic aromatics that are often associated with sedimentary organic carbon deposited into the ocean from river deposition (Masiello and Druffel, 1998) and make up a large proportion of total organic carbon in subtropical systems (Chew and Gallagher, 2018). Chemical composition shifts in suboxic waters appear to be influenced by a combination of decreasing oxygen (Lønborg et al., 2020; Chen et al., 2022), chemolithoautotropy (Loginova et al., 2020), DOM release (Loginova et al., 2020), and DOM preservation, with increased chemical complexity in hypoxic sediments (Jessen et al., 2017; Lau and Del Giorgio, 2020). However, the relative contribution of any of these processes remains unresolved.
The prokaryotic community within the suboxic zone of Devil’s Hole
The microbial communities within coastal OMZs are similar to those in open ocean OMZs (Wright et al., 2012). A previous study of the Devil’s Hole OMZ found that the abundance of Chlorobiaceae, a group of anoxygenic photolithoautotrophic green sulfur bacteria (GSB), increased with depth dominating the suboxic community with 59% of total prokaryotic cells (Parsons et al., 2015). In this study, ~75% of ASVs from the suboxic zone were from the family Chlorobiales and genus Chlorobiaceae at the time of experimental set-up (Figure 4C). The GSB is known to have two to three copies of the 16S ribosome (Stoddard et al., 2015), explaining the overabundance of this genus in the sequencing data. This GSB species mainly produce a monocyclic aromatic carotenoid, chlorobactene (Takaichi et al., 1997; Canniffe et al., 2018), a small molecule which may not have been captured on the PPL columns in our metabolite data (Dittmar et al., 2008; Johnson et al., 2017). In addition to ASVs belonging to the family Chlorobiales, other unique prokaryotic members of the suboxic community not present in the surface (summarized in Figure 6) include copiotrophic bacteria such as SAR406, Floavobacteriales, Rhodospirialles, and Rhodobacterales along with the archaea, Euryarcheota from the family Marine group II and Thaumarchaeota from the family Nitrosopumilales, and the bacteria Desulfobacterales, a known sulfate reducer present along with members of Candidatus Kaiserbacteria that belong to the Candidate Phyla Radiation (CPR) bacterial group with diverse metabolisms (Brown et al., 2015).
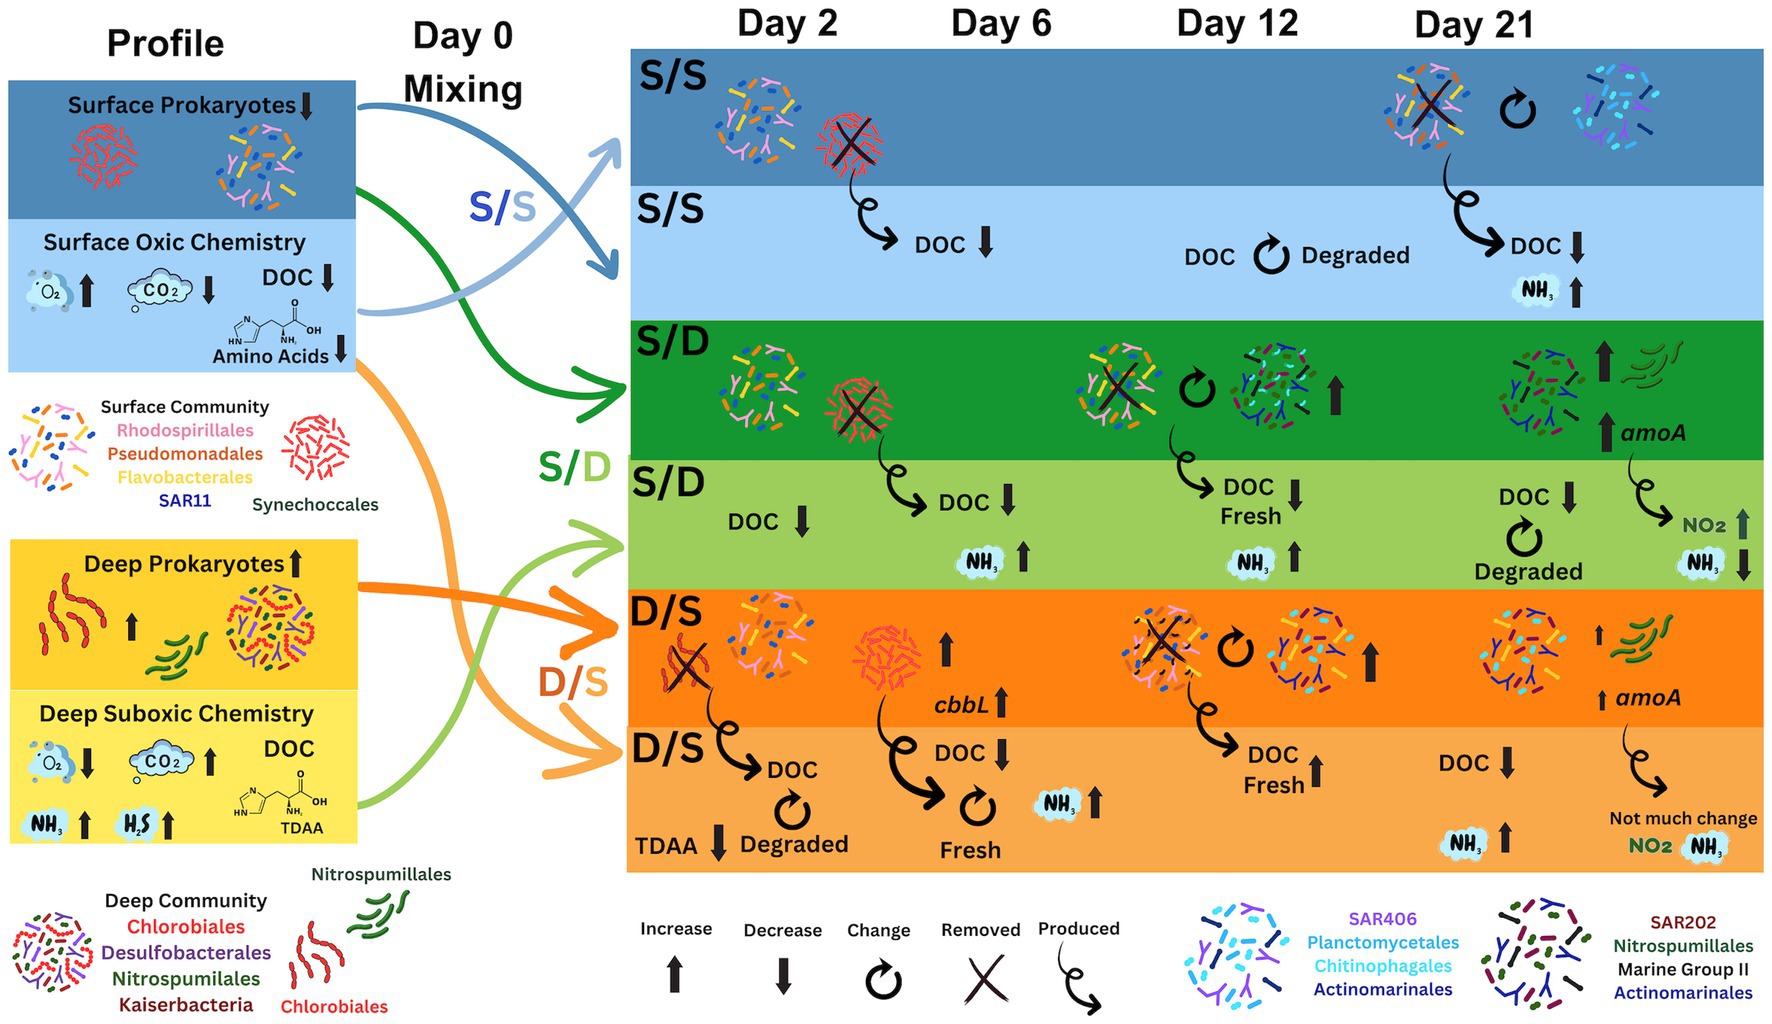
Figure 6. Diagram showing the prokaryotic community change in association with the chemistry changes during the simulated overturn experiment. Prokaryotic community is color coded in the legend and the chemistry includes ammonia (NH3), carbon dioxide (CO2), DOC, hydrogen sulfide (H2S), oxygen (O2), and nitrite (NO2). DOC quality (fresh and degraded) is determined using the amino acid degradation index. Gene copy number for the cbbL (carbon fixation) and amoA (nitrification) gene is also included.
The surface prokaryotic community response to deep DOM during exponential phase growth
The prokaryotic response was distinct for the S/D treatments (Figure 2A), with the highest specific growth rate and the highest prokaryotic growth during exponential phase (Figure 2B). The S/D treatment had the highest BGE of all the treatments (Table 1), suggesting that it assimilated the most carbon, converting it into biomass. BGE estimates in the Red Sea ranged from 2 to 13% depending on the time of year, with summer having the highest growth efficiencies (Silva et al., 2018). The authors suggested that temperature drove the higher BGE values in their study which had similar sea surface temperatures (33°C) when compared to our study (30°C). Since BGE can also be restrained by the quality of the available substrate (Vallino et al., 1996; Farjalla et al., 2009), this high BGE of 17.9% in the S/D treatment suggests that there is enough substrate during exponential phase (Table 1). A mixture of fresh labile and accumulated refractory DOM increased bacterial growth in bacterial batch cultures where nitrogen and phosphorus were added (Farjalla et al., 2009), resulting in BGE of >10%. Since nutrients were not limiting in the present study (Figure 5; Supplementary Figure S1) and the DOM pool consisted of a mixture of labile and refractory DOM (Figures 4A,B), the high BGE is not surprising.
In the S/D treatment, both DOC and TDAA were removed at greater rates than the control over the first 6 days (Figures 2, 3) with little drawdown of nutrients (Figure 5; Supplementary Figure S1). As a result, neither macronutrients nor the concentration or quality of DOM that accumulated under anoxic conditions appeared to be limiting to heterotrophic removal once the water was reoxygenated and mixed with surface microbial assemblages. A study from the Baltic Sea suggested that the bacterial turnover of organic matter was limited by nutrients (total ammonium, phosphate, nitrate) under both oxic and suboxic conditions (Maßmig et al., 2019). Another study in coastal Chilean OMZ showed that the quality of the organic matter rather than oxygen concentration controlled the heterotrophic degradation of DOM (Pantoja et al., 2009). In the present study, compositional changes in amino acids were observed with decreasing molar proportions of glutamic acid, aspartic acid, serine, and leucine over the first 6 days (Figure 4A). These more bioavailable amino acids are considered more labile as inferred from the DI index (Dauwe et al., 1999). Their preferential removal in the S/D treatment is consistent with previous work conducted in the Peruvian OMZ that demonstrated comprehensive and preferential remineralization of these amino acids by microbes within the upper oxycline (Loginova et al., 2019).
Within the first 2 days of the present study, 37% of DOC was removed in the S/D treatment, while between days 2 and 6, DOC removal reduced to only 5% of total DOC removal (Figure 2) with an increase in proportions of Synechococcales and Flavobacteriales (Figure 4C). Members of the Flavobacteriales clade are known to degrade both low and high molecular weight DOM compounds (Cottrell and Kirchman, 2000) but some ASVs specialize in polymer degradation (Fernandez-Gomez et al., 2013). In the Baltic Sea, seawater culture regrowth experiments enriched with labile DOM compounds showed that Flavobacteriales dominated after polypeptide amendments (Pontiller et al., 2020). In this experiment, the prokaryotic community shifted with Synechococcales disappearing and Flavobacteriales persisting after 6 days along with an increased in peptide compounds (Figures 4B,C) suggesting that this family could be responsible for breaking down polypeptides to peptides within the first 6 days of the experiment.
Chemolithoautotrophy as the surface prokaryotic community responds to deep DOM
After day 6, while DOC concentrations decreased further (Figure 2C), TDAA concentrations increased by 14 nM, and the degradation index increased between days 6 and 12 in the S/D treatment (Figures 3A,B), suggesting that the quality of DOM shifted to a less diagenetically altered status. This change is further corroborated by the decreasing molar contribution of alanine and glycine, two amino acids that are more resistant to degradation, when compared to the control during the same time frame (Figure 4A). The labile DOM might come from new production by chemolithoautotrophy during the incubations, as Nitrosopumilus strains have been shown to fix carbon (Könneke et al., 2014; Liu et al., 2021), and produce DOM consisting of labile amino acids such as alanine, leucine, and serine (Bayer et al., 2019). In this study, Thaumarcheaota cell abundances increased from days 6 to 21 in the S/D treatment (Figure 5D). and Nitrosopumilales ASVs increased to 18% of total prokaryotic cells in the S/D treatment by day 21 at the same time as the shift to less diagenetically altered DOM (Figures 3B, 5D, 4C; Supplementary Figure S5).
Thaumarcheaota, including the family Nitrosopumilales, are chemoautotrophic ammonia-oxidizers that play an essential role in nitrogen and carbon cycling (Könneke et al., 2005; Beman et al., 2008; Santoro et al., 2015; Garritano et al., 2022) and can be found in the oxycline of OMZs (Lin et al., 2006; Zaikova et al., 2010; Belmar et al., 2011; Wright et al., 2012) including the oxycline of Devil’s Hole (Parsons et al., 2015). An increase in Thaumarcheota also occurred in the coastal China Sea where Thaumarcheota cells transform ammonia into nitrite via chemoautotrophic ammonia oxidation (Xie et al., 2020; Wang et al., 2022). Since the amoA normalized gcn increased over 124 times within the S/D treatment between days 12 and 21 (Figure 5D), ammonia oxidation could be occurring in this treatment. The occurrence of this pathway was confirmed by a doubling of nitrite concentrations and a coincident decrease in total ammonium concentrations (by half) in the S/D treatment between days 12 and 21, when compared to the control treatment (Figure 5).
Deep DOM degradation and nutrient cycling by specific microbial lineages
Despite the possible fresh DOM production in the later stages of S/D treatment, DOC concentration continued to decrease with recalcitrant components of DOM apparently being removed or transformed, as shown in the metabolite data with a slight decreasing percentage of CRAM contribution over time (Figure 4B). SAR202, a chloroflexi, increased from 3 to 14% of the total prokaryotic ASVs and increased from 3 to 13% of total prokaryotic cells in the S/D treatment between day 12 and 21 (Figures 3E, 4C). At the same time, SAR202 cells also increased by 6.9 × 10⁸ cells L−1 while DOC concentrations decreased by an additional 30% (Figures 2C, 3E). Genomic and metagenomic studies have postulated that SAR202 cells have the enzymatic repertoire capable of oxidizing some forms of recalcitrant DOM (Landry et al., 2017; Mehrshad et al., 2018; Saw et al., 2020), which may be occurring in our study (Figure 6).
Along with SAR202, Planctomycetales ASVs responded to the deep DOM increasing by day 12, along with the Euryarcheota Marine Group II and Actinomarinales in the S/D treatment (Figure 4C). Marine Group II continued to respond to the S/D experimental conditions, contributing to 13% of the total prokaryotic ASVs by day 21 (Figures 4C,D). Planctomycetes, Actinomarinales, Flavobacteriales, and Marine Group II were present on the S/D treatment on day 21 (Figures 4C,D), coinciding with a decrease in proteins and peptides in the metabolites data (Figure 4B), suggesting they may have a role in protein cycling. Other studies showed that members of Planctomycetacia, Flavobacteriales, and Marine Group II actively degraded Synechococcus-derived organic matter in the China Sea, suggesting their important role in the degradation of labile DOM (Xie et al., 2020; Wang et al., 2022). These groups were also involved in the cycling of dissolved proteins and dissolved organic nitrogen within the California Current (Orsi et al., 2016). In addition, Planctomycetales may be critical to changing DOM quality (Tadonleke, 2007) and involved with DOM degradation based on experiments using natural DOM additions in the estuarine Baltic Sea (Traving et al., 2017), suggesting its role in the degradation of the deep formerly suboxic DOM at Devil’s Hole.
The initial response of deep prokaryotes to surface DOM
Since the deep community is adapted to low oxygen conditions, introducing of oxygen to the community would simulate convective overturn that results in both a redistribution of cells and a community shift back to surface communities (Parsons et al., 2015). In fact, total prokaryotes from the suboxic depths had an initial 25% cell die-off when mixed with oxygenated surface DOM (Figure 2A). But afterwards, the D/S treatment has a higher specific growth rate and prokaryotic growth during exponential phase when compared to the control (Table 1; Figure 2B). The BGE in the D/S treatment was also higher than the control, suggesting that the quality of the available substrate was different from the control (Vallino et al., 1996; Farjalla et al., 2009). Since the D/S treatment had 70% of the DOM pool from the surface and 30% from the deep, this suggests that the deep DOM pool provided enough nutrients (Figure 5; Supplementary Figure S1) and the mixture of labile and refractory DOM (Figures 4A,B) that can enhance prokaryotic growth (Farjalla et al., 2009). While DOC concentrations were similar to the control at the start of the experiment, nutrients and TDAA were higher than the control showing the enrichment of these compounds in the unfiltered deep water. Thus, the response of deep prokaryotes to the surface DOM may just be a result of the deep DOM in the whole unfiltered prokaryotic community portion of the D/S treatment. TDAA were removed rapidly in the D/S treatments within the first 2 days, almost triple the removal seen in the control (Figure 3A). By day 2, the degradation index decreased to 0.55 ± 0.73 in the D/S treatment (Figure 3B) suggesting that the surface DOM was rapidly degraded by the changing prokaryotic community. The dominant amino acids, alanine, aspartic acid, glutamic acid, leucine and serine (Figure 4A) all decreased rapidly in the D/S treatment by day 2 (Supplementary Figure S3). Preferential uptake of glutamic acid, serine and leucine by microbes has occurred in the upper oxycline of the Peruvian OMZ (Loginova et al., 2019), this rapid decrease of these amino acids is not surprising given that the prokaryotic community is transitioning early in the incubation.
The deep prokaryotic community response to surface DOM
Chlorobiales initially dominated the deep prokaryotic community in the D/S treatment (Figure 4C). Dividing by the three copies of the 16S ribosome found in Chlorobiales would lower the relative contribution of this family from 75% of total ASVs to 25% of total ASVs at the beginning of incubation, more similar to previous studies (Parsons et al., 2015). Chlorobiales are anoxygenic photoautotrophic GSBs that require reduced sulfur compounds as electron donors (Muyzer and Stams, 2008). During sampling, suboxic seawater was reoxygenated, and gasses that built up in the sediment–water interface, such as ammonia, hydrogen sulfide, and methane, were released into the atmosphere (Thorstenson and Mackenzie, 1974). Since Chlorobiales requires anaerobic conditions and reduced sulfur compounds (Muyzer and Stams, 2008), this family of bacteria would not survive for long in oxygenated conditions and become reduced to below the level of detection in the ASV data over the first 2 days (Figure 4C).
The prokaryotic community continued to change from days 0 to 2, resulting in a community more similar to the other two treatments with retention of the Archaea MGII and an increasing percentage of Flavobacteriales in the D/S treatment (Figures 4C, 6), consistently indicating their role in labile DOM degradation. Different from other two treatments, the contribution of Synechococcales in the D/S treatment increased in the first few days for both the sequencing data (Figure 4C) and cell counts via microscopy (Figure 3F). This corresponds with the 14-fold increase in cbbL gene abundance at day 2, suggesting autotrophy by Synechococcus since low oxygen concentrations can shift RuBisCO transcripts from photoautotrophy to chemoautotrophy in Synechococcus cultures (Han et al., 2022). The specific Synechococcales found in the D/S treatment on day 2 were CC9902 and Cyanobium PCC-6307. Recent studies in the Black Sea have shown that viable Synechococcus strains, including Cyanobium, have adapted to dark conditions (Callieri et al., 2019, 2022).
Between day 2 and day 6, TDAA concentrations, TDAA yield, and the degradation index increased in the D/S treatment (Figure 3B). This suggests an influx of less diagenetically altered DOM that might come from intracellular DOM release after the death of Chlorobiales and Synechococcales cells that disappear in the D/S treatment during this period (Figures 3F, 4C). Leucine concentrations increased five times during this time period (Supplementary Figure S3E), which further supported the explanation of fresh DOM from the dead cells, as leucine serves as an essential component for prokaryotic protein synthesis (Simon and Azam, 1989). By day 6, members of Planctomycetales began to increase in ASV abundance, and Flavobacteriales ASVs increased from day 0 to day 6 and made up 14% of the total ASVs (Figure 4C; Supplementary Figure S5), again showing their role in labile DOM degradation.
Changes in DOM quality and concentrations as the prokaryotic community changes in the D/S treatment
Between days 9 and 12, DOC concentration increased in the D/S treatment by 5 μmol C L−1 (Figures 2C, 6). TDAA yield and DI at day 12 remained high, while the more resistant amino acid, glycine, decreased in its molar percentage during this time period (Figure 4A). This fresh DOM production might be attributed to a community change seen with Planctomycetes responding between days 9 and 12 (Figure 4C). Planctomycetes have been associated with DOM quality changes through degradation (Tadonleke, 2007) and the production of novel small molecules, including polyketides and non-ribosomal peptides (Wiegand et al., 2020). However, this change in DOC concentrations and quality may also involve the chemoautotrophic Thaumarcheaota since cell abundances increased in the D/S treatment by day 21. At the same time, the amoA normalized gene copy number doubled by day 21 (Figures 5C,D). Since Nitrosopumilus strains fix carbon efficiently (Könneke et al., 2014) and have been shown to produce labile DOM in the form of amino acids (Bayer et al., 2019), the growth of Nitrosopumilales from only 2% of the total prokaryotic ASVs on day 12–13% of total prokaryotic cells on day 21 in the D/S treatment could be linked to DOM production (Figures 5D, 4C).
During the later stage in the D/S treatment, the proportion of Planctomycetales and Marine Group II increased between day 6 and day 12, suggesting their potential role in degrading labile DOM (Figures 4C, 6; Supplementary Figure S5). Coinciding with a slight decrease in the CRAM fraction (Figure 4B), SAR202 cell abundance and the SAR202 ASV proportion to total ASVs increased by day 21 in the D/S treatment (Figures 3E, 4C). Since SAR202 cells have the genetic capacity to degrade aromatic compounds like CRAM (Landry et al., 2017; Saw et al., 2020), they might be responsible for this decrease in the CARM fraction. In addition, Ga0077536 ASVs increased from days 9 to 21 in the D/S treatment, and their genomes contain many interesting genes, including those involved in methylamine utilization and several monoxygenases responsible for aromatic, linear, and cyclic aliphatic hydrocarbon degradation (Francis et al., 2021). The presence of this gammaproteobacteria by day 21 suggests that along with SAR202, these families could slowly respond to the recalcitrant DOM present by 21 days.
Conclusion
Devil’s Hole, Bermuda, is a natural laboratory where thermally driven stratification causes the formation of a seasonal OMZ during the summer months. During the summer months, when suboxic conditions develop, organic matter accumulates within the suboxic layer. The bioavailability of this accumulated DOC and the microbial community response to reoxygenation of suboxic waters showed that prokaryotes responded to the deep formerly suboxic DOM with high growth rates coinciding with increased DOC drawdown. The prokaryotic community changed within 2 weeks with increasing contributions of Planctomycetales, SAR202, and the chemoautotrophic ammonia-oxidizing, Nitrospumillales. In contrast, deep prokaryotes had an initial die-off before shifting to a surface-like community devoid of Chlorobiales, the major taxa in the suboxic zone. cbbL gene abundance increased on day 2 followed by a change in DOM quality to less diagenetically altered material by day 6. DOC concentrations increased between days 6 and 12, while the prokaryotic community changed to include Planctomycetales. By the end of the experiment, this treatment also increased in SAR202 and Nitrospumillales. With reoxygenation, the deep DOM that accumulated under suboxic conditions is bioavailable to surface prokaryotes that utilize the accumulated DOC initially before switching to a community that can both produce less diagenetically altered DOM via chemoautotrophic and degrades the more recalcitrant DOM.
Scope
Devil’s Hole, Bermuda is a shallow inland system that experiences seasonal anoxia. Devil’s Hole represents a natural laboratory where microbial-driven processes and community succession can be studied in the illuminated water column. The stratification and the development of anoxia, along with subsequent overturn and the reoxygenation of the water column, has been studied as part of a monthly time-series. As temperature-driven stratification occurs, oxygen levels decrease to suboxic levels and DOM accumulates. Simulated overturn experiments were used to mimic mixing; thereby assessing the bioavailability of the accumulated dissolved organic carbon (DOC) to the surface microbial community. The surface prokaryotic community responded to the deep (formerly suboxic) filtrate within 6 days. The DOM quality changed to less diagenetically altered material and coincided with a community shift to prokaryotes that can both produce labile DOM via chemoautotrophy and degrade the more recalcitrant DOM. For example, nitrification occurred with an increase in Nitrosopumilales, chemoautotrophic ammonia oxidizing archaea (AOA) that converted ammonia to nitrite based on the ammonia monooxygenase (amoA) gene copy number and nutrient data. This study shows that suboxic DOM is bioavailable to surface prokaryotes that in turn, drive key processes that influence the carbon and nitrogen cycles.
Data availability statement
The datasets presented in this study can be found in online repositories. The names of the repository/repositories and accession number(s) can be found in the article/Supplementary material.
Author contributions
RP: Conceptualization, Data curation, Formal analysis, Investigation, Methodology, Project administration, Resources, Validation, Visualization, Writing – original draft. SL: Conceptualization, Data curation, Formal analysis, Supervision, Visualization, Writing – review & editing. KL: Data curation, Formal analysis, Visualization, Writing – review & editing. KY: Data curation, Investigation, Methodology, Writing – review & editing. CJ: Data curation, Investigation, Methodology, Writing – review & editing. LB: Data curation, Methodology, Software, Supervision, Writing – review & editing. JC: Data curation, Methodology, Writing – review & editing. KO: Data curation, Methodology, Writing – review & editing. MK: Data curation, Methodology, Writing – review & editing. RG: Data curation, Investigation, Methodology, Writing – review & editing. CC: Funding acquisition, Conceptualization, Resources, Supervision, Writing – review & editing. BT: Conceptualization, Resources, Supervision, Data curation, Methodology, Software, Writing – review & editing. NB: Funding acquisition, Project administration, Resources, Supervision, Writing – review & editing.
Funding
The author(s) declare financial support was received for the research, authorship, and/or publication of this article. The author(s) were supported by Simons Foundation International for their support through the BIOS-SCOPE program. NB, RG and RP were supported by the BATS Program at BIOS through NSF-OCE awards 1258622 and 1756105. RP, KY and CJ were supported by an internal award from BIOS, the Cawthorn Innovation Fund. RP was also supported by Dr. Desiree Spriggs and Helix Genetic and Scientific Solutions through salary support, donated supplies and assistance with the repair and calibration of the ABI 7300 Real Time PCR machine.
Acknowledgments
We would like to thank Tim Noyes, Christopher Flook and Alexander Hunter for their assistance with sampling the Devil’s Hole time-series on board the R/V Sea Dance. We wish to also thank BIOS interns Lana Fabia, Julia Skrapis and Lakshmi Magon for their assistance in sampling the Devil’s Hole time-series in 2018. We wish to thank Bermuda Program interns Maya Leighton for her help with FISH and CARD-FISH, Kristy Sanchez for her help with running qPCR sample checks, Gretchen Swarr for assistance with sample processing, and Laura Weber Gray for her help with initial metabolomics data analysis and statistics. Additionally, we thank Simon Biggs, Tim Noyes, and Fabian Wittmers for their assistance with R coding and data visualization. Samples for this project were exported for analyses under export permits SP190902 from the Bermuda Government, Department of Environment and Natural Resources.
Conflict of interest
The authors declare that the research was conducted in the absence of any commercial or financial relationships that could be construed as a potential conflict of interest.
Publisher’s note
All claims expressed in this article are solely those of the authors and do not necessarily represent those of their affiliated organizations, or those of the publisher, the editors and the reviewers. Any product that may be evaluated in this article, or claim that may be made by its manufacturer, is not guaranteed or endorsed by the publisher.
Supplementary material
The Supplementary material for this article can be found online at: https://www.frontiersin.org/articles/10.3389/fmicb.2023.1287477/full#supplementary-material
Footnotes
References
Andersson, A. J., Bates, N. R., and Mackenzie, F. T. (2007). Dissolution of carbonate sediments under rising pCO2 and ocean acidification: observations from Devil’s hole, Bermuda. Aquat. Geochem. 13, 237–264. doi: 10.1007/s10498-007-9018-8
Apprill, A., Mcnally, S., Parsons, R., and Weber, L. (2015). Minor revision to V4 region SSU rRNA 806R gene primer greatly increases detection of SAR11 bacterioplankton. Aquat. Microb. Ecol. 75, 129–137. doi: 10.3354/ame01753
Baetge, N., Behrenfeld, M. J., Fox, J., Halsey, K. H., Mojica, K. D. A., Novoa, A., et al. (2021). The seasonal flux and fate of dissolved organic carbon through Bacterioplankton in the Western North Atlantic. Front. Microbiol. 12:669883. doi: 10.3389/fmicb.2021.669883
Barth, A., Alvera-Azcárate, A., Troupin, C., Ouberdous, M., and Beckers, J.-M. (2010). A web interface for griding arbitrarily distributed in situ data based on data-interpolating Variational analysis (DIVA). Adv. Geosci. 28, 29–37. doi: 10.5194/adgeo-28-29-2010
Bates, N. R. (2017). Twenty years of marine carbon cycle observations at devils hole Bermuda provide insights into seasonal hypoxia, coral reef calcification, and ocean acidification. Front. Mar. Sci. 4:36. doi: 10.3389/fmars.2017.00036
Bates, N. R., and Johnson, R. J. (2020). Acceleration of ocean warming, salinification, deoxygenation and acidification in the surface subtropical North Atlantic Ocean. Commun. Earth Environ. 1:33. doi: 10.1038/s43247-020-00030-5
Bayer, B., Hansman, R. L., Bittner, M. J., Noriega-Ortega, B. E., Niggemann, J., Dittmar, T., et al. (2019). Ammonia-oxidizing archaea release a suite of organic compounds potentially fueling prokaryotic heterotrophy in the ocean. Environ. Microbiol. 21, 4062–4075. doi: 10.1111/1462-2920.14755
Bayer, B., Mcbeain, K., Carlson, C. A., and Santoro, A. E. (2022). Carbon content, carbon fixation yield and dissolved organic carbon release from diverse marine nitrifiers. bioRxiv. doi: 10.1101/2022.01.04.474793
Belmar, L., Molina, V., and Ulloa, O. (2011). Abundance and phylogenetic identity of archaeoplankton in the permanent oxygen minimum zone of the eastern tropical South Pacific. FEMS Microbiol. Ecol. 78, 314–326. doi: 10.1111/j.1574-6941.2011.01159.x
Beman, J. M., Popp, B. N., and Francis, C. A. (2008). Molecular and biogeochemical evidence for ammonia oxidation by marine Crenarchaeota in the Gulf of California. ISME J. 2, 429–441. doi: 10.1038/ismej.2007.118
Berg, C., Listmann, L., Vandieken, V., Vogts, A., and Jurgens, K. (2014). Chemoautotrophic growth of ammonia-oxidizing Thaumarchaeota enriched from a pelagic redox gradient in the Baltic Sea. Front. Microbiol. 5:786. doi: 10.3389/fmicb.2014.00786
Boeuf, D., Eppley, J. M., Mende, D. R., Malmstrom, R. R., Woyke, T., and Delong, E. F. (2021). Metapangenomics reveals depth-dependent shifts in metabolic potential for the ubiquitous marine bacterial SAR324 lineage. Microbiome 9:172. doi: 10.1186/s40168-021-01119-5
Brown, C. T., Hug, L. A., Thomas, B. C., Sharon, I., Castelle, C. J., Singh, A., et al. (2015). Unusual biology across a group comprising more than 15% of domain Bacteria. Nature 2015, 208–211. doi: 10.1038/nature14486
Callahan, B. J., Mcmurdie, P. J., Rosen, M. J., Han, A. W., Johnson, A. J. A., and Holmes, S. P. (2016). DADA2: high-resolution sample inference from Illumina amplicon data. Nat. Methods 13:581-+. doi: 10.1038/nmeth.3869
Callieri, C., Cabello-Yeves, P. J., and Bertoni, F. (2022). The "dark side" of Picocyanobacteria: life as we do not know it (yet). Microorganisms 10:546. doi: 10.3390/microorganisms10030546
Callieri, C., Slabakova, V., Dzhembekova, N., Slabakova, N., Peneva, E., Cabello-Yeves, P. J., et al. (2019). The mesopelagic anoxic Black Sea as an unexpected habitat for Synechococcus challenges our understanding of global "deep red fluorescence". ISME J. 13, 1676–1687. doi: 10.1038/s41396-019-0378-z
Canfield, D. E., Stewart, F. J., Thamdrup, B., De Brabandere, L., Dalsgaard, T., Delong, E. F., et al. (2010). A cryptic sulfur cycle in oxygen-minimum–zone waters off the Chilean coast. Science 330, 1375–1378. doi: 10.1126/science.1196889
Canniffe, D. P., Thweatt, J. L., Chew, A. G. M., Hunter, C. N., and Bryant, D. A. (2018). A paralog of a bacteriochlorophyll biosynthesis enzyme catalyzes the formation of 1,2-dihydrocarotenoids in green sulfur bacteria. J. Biol. Chem. 293, 15233–15242. doi: 10.1074/jbc.RA118.004672
Cao, H., Dong, C., Bougouffa, S., Li, J., Zhang, W., Shao, Z., et al. (2016). Delta-proteobacterial SAR324 group in hydrothermal plumes on the south mid-Atlantic ridge. Sci. Rep. 6:22842. doi: 10.1038/srep22842
Carlson, C. A., and Ducklow, H. W. (1996). Growth of bacterioplankton and consumption of dissolved organic carbon in the Sargasso Sea. Aquat. Microb. Ecol. 10, 69–85. doi: 10.3354/ame010069
Carlson, C. A., and Hansell, D. A. (2014). DOM sources, sinks, reactivity, and budgets. Cambridge, Mass, USA: Academic Press.
Carlson, C. A., Morris, R., Parsons, R., Treusch, A. H., Giovannoni, S. J., and Vergin, K. (2009). Seasonal dynamics of SAR11 populations in the euphotic and mesopelagic zones of the northwestern Sargasso Sea. ISME J. 3, 283–295. doi: 10.1038/ismej.2008.117
Chen, X., Liu, J., Chen, J., Wang, J., Xiao, X., He, C., et al. (2022). Oxygen availability driven trends in DOM molecular composition and reactivity in a seasonally stratified fjord. Water Res. 220:118690. doi: 10.1016/j.watres.2022.118690
Chew, S. T., and Gallagher, J. B. (2018). Accounting for black carbon lowers estimates of blue carbon storage services. Sci. Rep. 8:2553. doi: 10.1038/s41598-018-20644-2
Cottrell, M. T., and Kirchman, D. L. (2000). Natural assemblages of marine proteobacteria and members of the Cytophaga-Flovobacter cluster consuming low and high molecular weight dissolved organic matter. Appl. Environ. Microbiol. 66, 1692–1697. doi: 10.1128/AEM.66.4.1692-1697.2000
Dauwe, B., Middelburg, J., Herman, P., and Heip, C. (1999). Linking diagenetic alterations of amino acids and bulk organic matter reactivity. Limnol. Oceanogr. 44, 1809–1814. doi: 10.4319/lo.1999.44.7.1809
Devol, A. H., and Hartnett, H. E. (2001). Role of the oxygen-deficient zone in transfer of organic carbon to the deep ocean. Limnol. Oceanogr. 46, 1684–1690. doi: 10.4319/lo.2001.46.7.1684
Diaz, R. J., and Rosenberg, R. (2008). Spreading dead zones and consequences for marine ecosystems. Science 321, 926–929. doi: 10.1126/science.1156401
Diaz, R. J., Rosenberg, R., and Sturdivant, K. (2019). “Hypoxia in estuaries and semi-enclosed seas” in Ocean deoxygenation: everyone’s problem - causes, impacts, consequences and solutions. eds. D. Laffoley and J. M. Baxter (Gland: IUCN Global Marine and Polar Programme: BSR Imprimeurs SA), 85–102.
Dittmar, T., Koch, B., Hertkorn, N., and Kattner, G. (2008). A simple and efficient method for the solid-phase extraction of dissolved organic matter (SPE-DOM) from seawater. Limnol. Oceanogr. Methods 6, 230–235. doi: 10.4319/lom.2008.6.230
Dyksma, S., Bischof, K., Fuchs, B. M., Hoffmann, K., Meier, D., Meyerdierks, A., et al. (2016). Ubiquitous Gammaproteobacteria dominate dark carbon fixation in coastal sediments. ISME J. 10, 1939–1953. doi: 10.1038/ismej.2015.257
Eisen, J. A., Nelson, K. E., Paulsen, I. T., Heidelberg, J. F., Wu, M., Dodson, R. J., et al. (2002). The complete genome sequence of Chlorobium tepidum TLS, a photosynthetic, anaerobic, green-sulfur bacterium. Proc. Natl. Acad. Sci. U. S. A. 99, 9509–9514. doi: 10.1073/pnas.132181499
Engel, A., Kiko, R., and Dengler, M. (2022). Organic matter supply and utilization in oxygen minimum zones. Annu. Rev. Mar. Sci. 14, 355–378. doi: 10.1146/annurev-marine-041921-090849
Farjalla, V. F., Marinho, C. C., Faria, B. M., Amado, A. M., Esteves, F. D. A., Bozelli, R. L., et al. (2009). Synergy of fresh and accumulated organic matter to bacterial growth. Microb. Ecol. 57, 657–666. doi: 10.1007/s00248-008-9466-8
Fernandez-Gomez, B., Richter, M., Schuler, M., Pinhassi, J., Acinas, S. G., Gonzalez, J. M., et al. (2013). Ecology of marine Bacteroidetes: a comparative genomics approach. ISME J. 7, 1026–1037. doi: 10.1038/ismej.2012.169
Francis, B., Urich, T., Mikolasch, A., Teeling, H., and Amann, R. (2021). North Sea spring bloom-associated Gammaproteobacteria fill diverse heterotrophic niches. Environ. Microbiome 16:15. doi: 10.1186/s40793-021-00385-y
Garritano, A. N., Song, W., and Thomas, T. (2022). Carbon fixation pathways across the bacterial and archaeal tree of life. PNAS Nexus 1:pgac226. doi: 10.1093/pnasnexus/pgac226
Giovannoni, S., Chan, F., and Davis, E., Deutsch, C., and Wolf, S. (2021). Biochemical barriers on the path to Ocean Anoxia? mBio 12:e0133221.
Giovannoni, S. J., Delong, E. F., Schmidt, T. M., and Pace, N. R. (1990). Tangential flow filtration and preliminary phylogenetic analysis of marine picoplankton. Appl. Environ. Microbiol. 56, 2572–2575. doi: 10.1128/aem.56.8.2572-2575.1990
Glockner, F. O., Yilmaz, P., Quast, C., Gerken, J., Beccati, A., Ciuprina, A., et al. (2017). 25 years of serving the community with ribosomal RNA gene reference databases and tools. J. Biotechnol. 261, 169–176. doi: 10.1016/j.jbiotec.2017.06.1198
Halewood, E., Opalk, K., Custals, L., Carey, M., Hansell, D. A., and Carlson, C. A. (2022). Determination of dissolved organic carbon and total dissolved nitrogen in seawater using high temperature combustion analysis. Front. Mar. Sci. 9:1061646. doi: 10.3389/fmars.2022.1061646
Hansell, D. A. (2013). Recalcitrant dissolved organic carbon fractions. Annu. Rev. Mar. Sci. 5, 421–445. doi: 10.1146/annurev-marine-120710-100757
Hansell, D. A., Carlson, C. A., and Schlitzer, R. (2012). Net removal of major marine dissolved organic carbon fractions in the subsurface ocean. Glob. Biogeochem. Cycles 26. doi: 10.1029/2011GB004069
Han, Y., Zhang, M., Chen, X., Zhai, W., Tan, E., and Tang, K. (2022). Transcriptomic evidences for microbial carbon and nitrogen cycles in the deoxygenated seawaters of Bohai Sea. Environ. Int. 158:106889. doi: 10.1016/j.envint.2021.106889
Hecky, R. E., Mopper, K., Kilham, P., and Degens, E. T. (1973). The amino acids and sugar composition of diatom cell-walls. Mar. Biol. 19, 323–331. doi: 10.1007/BF00348902
Henrichs, S. M. (1991). Methods of sample handling and analysis for dissolved and particulate amino-acids and carbohydrates in seawater. Mar. Particl. 63, 139–149. doi: 10.1029/GM063p0139
Herndl, G. J., Reinthaler, T., Teira, E., Van Aken, H., Veth, C., Pernthaler, A., et al. (2005). Contribution of Archaea to total prokaryotic production in the deep Atlantic Ocean. Appl. Environ. Microbiol. 71, 2303–2309. doi: 10.1128/AEM.71.5.2303-2309.2005
Hertkorn, N., Benner, R., Frommberger, M., Schmitt-Kopplin, P., Witt, M., and Kaiser, K.. (2006). Characterization of a major refractory component of marine dissolved organic matter. Geochimica et Cosmochimica Acta 70, 2990–3010.
Igarza, M., Dittmar, T., Graco, M., and Niggemann, J. (2019). Dissolved organic matter cycling in the coastal upwelling system off Central Peru during an “El Niño”, year. Front. Mar. Sci. 6:198. doi: 10.3389/fmars.2019.00198
Jessen, G. L., Lichtschlag, A., Ramette, A., Pantoja, S., Rossel, P. E., Schubert, C. J., et al. (2017). Hypoxia causes preservation of labile organic matter and changes seafloor microbial community composition (Black Sea). Sci. Adv. 3:e1601897. doi: 10.1126/sciadv.1601897
Jing, X., Gong, Y., Xu, T., Davison, P. A., Macgregor-Chatwin, C., Hunter, C. N., et al. (2022). Revealing CO2-fixing SAR11 Bacteria in the ocean by Raman-based single-cell metabolic profiling and genomics. BioDesign Res. 2022:9782712. doi: 10.34133/2022/9782712
Johnson, W. M., Kido Soule, M. C., and Kujawinski, E. B. (2017). Extraction efficiency and quantification of dissolved metabolites in targeted marine metabolomics. Limnol. Oceanogr. Methods 15, 417–428. doi: 10.1002/lom3.10181
Kaiser, K., and Benner, R. (2005). Hydrolysis-induced racemization of amino acids. Limnol. Oceanogr. Methods 3, 318–325. doi: 10.4319/lom.2005.3.318
Kaiser, K., and Benner, R. (2009). Biochemical composition and size distribution of organic matter at the Pacific and Atlantic time-series stations. Mar. Chem. 113, 63–77. doi: 10.1016/j.marchem.2008.12.004
Keeling, R. F., Kortzinger, A., and Gruber, N. (2010). Ocean deoxygenation in a warming world. Annu. Rev. Mar. Sci. 2, 199–229. doi: 10.1146/annurev.marine.010908.163855
Keil, R. G., Neibauer, J. A., Biladeau, C., Van der Elst, K., and Devol, A. H. (2016). A multiproxy approach to understanding the “enhanced” flux of organic matter through the oxygen-deficient waters of the Arabian Sea. Biogeosciences 13, 2077–2092. doi: 10.5194/bg-13-2077-2016
Kim, B., and Chang, H. (1991). Removal of hydrogen sulfide by Chlorobium thiosulfatophilum in immobilized-cell and sulfur-settling free-cell recycle reactors. Biotechnol. Prog. 7, 495–500. doi: 10.1021/bp00012a003
Knap, A. H., Michaels, A. F., Steinberg, D., Bahr, F., Bates, N., Bell, S., et al. (1997). BATS methods manual. U.S. JGOFS Planning Office: Woods Hole.
Koch, B. P., and Dittmar, T. (2016). From mass to structure: an aromaticity index for high-resolution mass data of natural organic matter. Rapid Commun. Mass Spectrom. 30:250. doi: 10.1002/rcm.7433
Koch, B. P., Witt, M., Engbrodt, R., Dittmar, T., and Kattner, G. (2005). Molecular formulae of marine and terrigenous dissolved organic matter detected by electrospray ionization Fourier transform ion cyclotron resonance mass spectrometry. Geochim. Cosmochim. Acta 69, 3299–3308. doi: 10.1016/j.gca.2005.02.027
Könneke, M., Bernhard, A. E., Torre, J. R. D. L., Walker, C. B., Waterbury, J. B., and Stahl, D. A. (2005). Isolation of an autotrophic ammonia-oxidizing marine archaeon. Nature 437, 543–546. doi: 10.1038/nature03911
Könneke, M., Schubert, D. M., Brown, P. C., Hugler, M., Standfest, S., Schwander, T., et al. (2014). Ammonia-oxidizing archaea use the most energy-efficient aerobic pathway for CO2 fixation. Proc. Natl. Acad. Sci. U. S. A. 111, 8239–8244. doi: 10.1073/pnas.1402028111
Kujawinski, E. B., and Behn, M. D. (2006). Automated analysis of electrospray ionization Fourier-transform ion cyclotron resonance mass spectra of natural organic matter. Anal. Chem. 78, 4363–4373. doi: 10.1021/ac0600306
Kuznetsova, M., and Lee, C. (2002). Dissolved free and combined amino acids in nearshore seawater, sea surface microlayers and foams: influence of extracellular hydrolysis. Aquat. Sci. 64, 252–268. doi: 10.1007/s00027-002-8070-0
Landry, Z., Swan, B. K., Herndl, G. J., Stepanauskas, R., and Giovannoni, S. J. (2017). SAR202 genomes from the Dark Ocean predict pathways for the oxidation of recalcitrant dissolved organic matter. MBio 8. doi: 10.1128/mBio.00413-17
Lau, M. P., and Del Giorgio, P. (2020). Reactivity, fate and functional roles of dissolved organic matter in anoxic inland waters. Biol. Lett. 16:20190694. doi: 10.1098/rsbl.2019.0694
Lee, C. (1992). Controls on organic carbon preservation: the use of stratified water bodies to compare intrinsic rates of decomposition in oxic and anoxic systems. Geochim. Cosmochim. Acta 56, 3323–3335. doi: 10.1016/0016-7037(92)90308-6
Lee, C., Wakeham, S. G., and Hedges, J. I. (2000). Composition and flux of particulate amino acids and chloropigments in equatorial Pacific seawater and sediments. Deep Sea Res. I Oceanogr. Res. Pap. 47, 1535–1568. doi: 10.1016/S0967-0637(99)00116-8
Lee, S., and Fuhrman, J. A. (1987). Relationships between biovolume and biomass of naturally derived marine bacterioplankton. Appl. Environ. Microbiol. 53, 1298–1303. doi: 10.1128/aem.53.6.1298-1303.1987
Le Moigne, F. A. C., Cisternas-Novoa, C., Piontek, J., Massmig, M., and Engel, A. (2017). On the effect of low oxygen concentrations on bacterial degradation of sinking particles. Sci. Rep. 7:16722. doi: 10.1038/s41598-017-16903-3
Lindroth, P., and Mopper, K. (1979). High-performance liquid-chromatographic determination of Subpicomole amounts of amino-acids by Precolumn fluorescence derivatization with Ortho-Phthaldialdehyde. Anal. Chem. 51, 1667–1674. doi: 10.1021/ac50047a019
Lin, X., Wakeham, S. G., Putnam, I. F., Astor, Y. M., Scranton, M. I., Chistoserdov, A. Y., et al. (2006). Comparison of vertical distributions of prokaryotic assemblages in the anoxic Cariaco Basin and Black Sea by use of fluorescence in situ hybridization. Appl. Environ. Microbiol. 72, 2679–2690. doi: 10.1128/AEM.72.4.2679-2690.2006
Liu, L., Schubert, D. M., Konneke, M., and Berg, I. A. (2021). (S)-3-Hydroxybutyryl-CoA dehydrogenase from the autotrophic 3-Hydroxypropionate/4-Hydroxybutyrate cycle in Nitrosopumilus maritimus. Front. Microbiol. 12:712030. doi: 10.3389/fmicb.2021.712030
Liu, S., Parsons, R., Opalk, K., Baetge, N., Giovannoni, S., Bolaños, L. M., et al. (2020). Different carboxyl-rich alicyclic molecules proxy compounds select distinct bacterioplankton for oxidation of dissolved organic matter in the mesopelagic Sargasso Sea. Limnol. Oceanogr. 65, 1532–1553. doi: 10.1002/lno.11405
Liu, Z., Liu, S., Liu, J., and Gardner, W. S. (2013). Differences in peptide decomposition rates and pathways in hypoxic and oxic coastal environments. Mar. Chem. 157, 67–77. doi: 10.1016/j.marchem.2013.08.003
Loginova, A. N., Dale, A. W., Le Moigne, F. A. C., Thomsen, S., Sommer, S., Clemens, D., et al. (2020). Sediment release of dissolved organic matter to the oxygen minimum zone off Peru. Biogeosciences 17, 4663–4679. doi: 10.5194/bg-17-4663-2020
Loginova, A. N., Thomsen, S., Dengler, M., Lüdke, J., and Engel, A. (2019). Diapycnal dissolved organic matter supply into the upper Peruvian oxycline. Biogeosciences 16, 2033–2047. doi: 10.5194/bg-16-2033-2019
Lønborg, C., Carreira, C., Jickells, T., and Álvarez-Salgado, X. A. (2020). Impacts of global change on ocean dissolved organic carbon (DOC) cycling. Front. Mar. Sci. 7:466. doi: 10.3389/fmars.2020.00466
Longnecker, K. (2015). Dissolved organic matter in newly formed sea ice and surface seawater. Geochim. Cosmochim. Acta 171, 39–49. doi: 10.1016/j.gca.2015.08.014
Lorenzoni, L., Taylor, G. T., Benitez-Nelson, C., Hansell, D. A., Montes, E., Masserini, R., et al. (2013). Spatial and seasonal variability of dissolved organic matter in the Cariaco Basin. J. Geophys. Res. Biogeosci. 118, 951–962. doi: 10.1002/jgrg.20075
Manuel, S., Coates, K., Kenworthy, W., and Fourqurean, J. (2013). Tropical species at the northern limit of their range: composition and distribution in Bermuda's benthic habitats in relation to depth and light availability. Mar. Environ. Res. 89, 63–75. doi: 10.1016/j.marenvres.2013.05.003
Martínez-Pérez, A. M., Osterholz, H., Nieto-Cid, M., Álvarez, M., Dittmar, T., and Álvarez-Salgado, X. A. (2017). Molecular composition of dissolved organic matter in the Mediterranean Sea. Limnol. Oceanogr. 62, 2699–2712. doi: 10.1002/lno.10600
Masiello, C. A., and Druffel, E. R. M. (1998). Black carbon in Deep-Sea sediments. Science 280, 1911–1913. doi: 10.1126/science.280.5371.1911
Maßmig, M., and Engel, A. (2021). Dissolved organic matter in the upwelling system off Peru: imprints of bacterial activity and water mass characteristics. J. Geophys. Res. Biogeo. 126:e2020JG006048. doi: 10.1029/2020JG006048
Maßmig, M., Piontek, J., Le Moigne, F. A. C., Cisternas-Novoa, C., and Engel, A. (2019). Potential role of oxygen and inorganic nutrients on microbial carbon turnover in the Baltic Sea. Aquat. Microb. Ecol. 83, 95–108. doi: 10.3354/ame01902
Mehrshad, M., Rodriguez-Valera, F., Amoozegar, M. A., Lopez-Garcia, P., and Ghai, R. (2018). The enigmatic SAR202 cluster up close: shedding light on a globally distributed dark ocean lineage involved in sulfur cycling. ISME J. 12, 655–668. doi: 10.1038/s41396-017-0009-5
Moran, M. A., and Miller, W. L. (2007). Resourceful heterotrophs make the most of light in the coastal ocean. Nat. Rev. Microbiol. 5, 792–800. doi: 10.1038/nrmicro1746
Muyzer, G., and Stams, A. J. M. (2008). The ecology and biotechnology of sulphate-reducing bacteria. Nat. Rev. Microbiol. 6, 441–454. doi: 10.1038/nrmicro1892
Orsi, W. D., Smith, J. M., Liu, S., Liu, Z., Sakamoto, C. M., Wilken, S., et al. (2016). Diverse, uncultivated bacteria and archaea underlying the cycling of dissolved protein in the ocean. ISME J. 10, 2158–2173. doi: 10.1038/ismej.2016.20
Overmann, J., Cypionka, H., and Pfennig, N. (1992). An extremely low-light adapted phototrophic sulfur bacterium from the Black Sea. Limnol. Oceanogr. 37, 150–155. doi: 10.4319/lo.1992.37.1.0150
Pantoja, S., Rossel, P., Castro, R., Cuevas, L. A., Daneri, G., and Córdova, C. (2009). Microbial degradation rates of small peptides and amino acids in the oxygen minimum zone of Chilean coastal waters. Deep-Sea Res. II Top. Stud. Oceanogr. 56, 1055–1062. doi: 10.1016/j.dsr2.2008.09.007
Parada, A. E., Needham, D. M., and Fuhrman, J. A. (2016). Every base matters: assessing small subunit rRNA primers for marine microbiomes with mock communities, time series and global field samples. Environ. Microbiol. 18, 1403–1414. doi: 10.1111/1462-2920.13023
Parsons, R. J., Breitbart, M., Lomas, M. W., and Carlson, C. A. (2012). Ocean time-series reveals recurring seasonal patterns of virioplankton dynamics in the northwestern Sargasso Sea. ISME J. 6, 273–284. doi: 10.1038/ismej.2011.101
Parsons, R., Nelson, C., Carlson, C., Demnan, C., Andersson, A., Kledzik, A., et al. (2015). Marine bacterioplankton community turnover within seasonally hypoxic waters of a subtropical sound: Devil's Hole, Bermuda. Environ. Microbiol. 17, 3481–3499. doi: 10.1111/1462-2920.12445
Parsons, T. R., Maita, Y., and Lalli, C. M. (1984). A manual of chemical and biological methods for seawater analysis. New York, NY: Pergamon Press.
Pichard, S. L., Campbell, L., Kang, J. B., Tabita, F. R., and Paul, J. H. (1996). Regulation of ribulose bisphosphate carboxylase gene expression in natural phytoplankton communities. I diel rhythms. Mar. Ecol. Prog. Ser. 139, 257–265. doi: 10.3354/meps139257
Pontiller, B., Martinez-Garcia, S., Lundin, D., and Pinhassi, J. (2020). Labile dissolved organic matter compound characteristics select for divergence in marine bacterial activity and transcription. Front. Microbiol. 11:588778. doi: 10.3389/fmicb.2020.588778
Porter, K. G., and Feig, Y. S. (1980). The use of DAPI for identifying and counting aquatic microflora. Limnol. Oceanogr. 25, 943–948. doi: 10.4319/lo.1980.25.5.0943
Prediger, E. (2013). Calculations: converting from nanograms to copy number Integrated DNA Technologies.
Rodriguez-Mora, M. J., Scranton, M. I., Taylor, G. T., and Chistoserdov, A. Y. (2013). Bacterial community composition in a large marine anoxic basin: a Cariaco Basin time-series survey. FEMS Microbiol. Ecol. 84, 625–639. doi: 10.1111/1574-6941.12094
Santoro, A. E., Dupont, C. L., Richter, R. A., Craig, M. T., Carini, P., Mcilvin, M. R., et al. (2015). Genomic and proteomic characterization of “Candidatus Nitrosopelagicus brevis”: an ammonia-oxidizing archaeon from the open ocean. Proc. Natl. Acad. Sci. U. S. A. 112, 1173–1178. doi: 10.1073/pnas.1416223112
Saw, J. H. W., Nunoura, T., Hirai, M., Takaki, Y., Parsons, R., Michelsen, M., et al. (2020). Pangenomics analysis reveals diversification of enzyme families and niche specialization in globally abundant SAR202 Bacteria. MBio 11:e02975-19. doi: 10.1128/mBio.02975-19
Schlitzer, R. (2021). Ocean data view. Available at: odv.awi.de
Schmidtko, S., Stramma, L., and Visbeck, M. (2017). Decline in global oceanic oxygen content during the past five decades. Nature 542, 335–339. doi: 10.1038/nature21399
Sheik, C. S., Jain, S., and Dick, G. J. (2014). Metabolic flexibility of enigmatic SAR324 revealed through metagenomics and metatranscriptomics. Environ. Microbiol. 16, 304–317. doi: 10.1111/1462-2920.12165
Silva, L., Calleja, M. L., Huete-Stauffer, T. M., Ivetic, S., Ansari, M. I., Viegas, M., et al. (2018). Low abundances but high growth rates of coastal heterotrophic Bacteria in the Red Sea. Front. Microbiol. 9:3244. doi: 10.3389/fmicb.2018.03244
Simon, M., and Azam, F. (1989). Protein content and protein synthesis rates of planktonic marine bacteria. Marine Ecology Progress Series 51, 201–213.
Sleighter, R. L., and Hatcher, P. G. (2008). Molecular characterization of dissolved organic matter (DOM) along a river to ocean transect of the lower Chesapeake Bay by ultrahigh resolution electrospray ionization Fourier transform ion cyclotron resonance mass spectrometry. Mar. Chem. 110, 140–152. doi: 10.1016/j.marchem.2008.04.008
Sprouffske, K. (2018). Package ‘growthcurver’. Available at: https://github.com/sprouffske/growthcurver.
Stoddard, S. F., Smith, B. J., Hein, R., Roller, B. R., and Schmidt, T. M. (2015). rrnDB: improved tools for interpreting rRNA gene abundance in bacteria and archaea and a new foundation for future development. Nucleic Acids Res. 43, D593–D598. doi: 10.1093/nar/gku1201
Stramma, L., Johnson, G. C., Sprintall, J., and Mohrhols, V. (2008). Expanding oxygen minimum zones in the tropical oceans. Science 320, 655–658. doi: 10.1126/science.1153847
Stramma, L., and Schmidtko, S. (2019). “Global evidence of ocean deoxygenation” in Ocean deoxygenation: everyone’s problem. eds. D. Laffoley and J. M. Baxter (Gland, Switzerland: International Union for Conservation of Nature: IUCN Glabal Marine and Polar Programme)
Stramma, L., Schmidtko, S., Levin, L. A., and Johnson, G. C. (2010). Ocean oxygen minima expansions and their biological impacts. Deep-Sea Res. I Oceanogr. Res. Pap. 57, 587–595. doi: 10.1016/j.dsr.2010.01.005
Suominen, S., Gomez-Saez, G. V., Dittmar, T., Sinninghe Damsté, J. S., and Villanueva, L. (2021). Interplay between microbial community composition and chemodiversity of dissolved organic matter throughout the Black Sea water column redox gradient. Limnol. Oceanogr. 67, 329–347. doi: 10.1002/lno.11995
Swan, B. K., Martinez-Garcia, M., Preston, C. M., Sczyrba, A., Woyke, T., Lamy, D., et al. (2011). Potential for chemolithoautotrophy among ubiquitous bacteria lineages in the dark ocean. Science 333, 1296–1300. doi: 10.1126/science.1203690
Tadonleke, R. D. (2007). Strong coupling between natural Planctomycetes and changes in the quality of dissolved organic matter in freshwater samples. FEMS Microbiol. Ecol. 59, 543–555. doi: 10.1111/j.1574-6941.2006.00222.x
Taipale, S., Jones, R. I., and Tiirola, M. (2009). Vertical diversity of bacteria in an oxygen-stratified humic lake, evaluated using DNA and phospholipid analyses. Aquat. Microb. Ecol. 55, 1–16. doi: 10.3354/ame01277
Takaichi, S., Wang, Z. Y., Umetsu, M., Nozawa, T., Shimada, K., and Madigan, M. T. (1997). New carotenoids from the thermophilic green sulfur bacterium Chlorobium tepidum: 1′,2′-dihydro-gamma-carotene, 1′,2′-dihydrochlorobactene, and OH-chlorobactene glucoside ester, and the carotenoid composition of different strains. Arch. Microbiol. 168, 270–276. doi: 10.1007/s002030050498
Tang, K., Yang, Y., Lin, D., Li, S., Zhou, W., Han, Y., et al. (2016). Genomic, physiologic, and proteomic insights into metabolic versatility in Roseobacter clade bacteria isolated from deep-sea water. Sci. Rep. 6:35528. doi: 10.1038/srep35528
Taylor, G. T., Iabichella, M., Ho, T.-Y., Scranton, M. I., Thunell, R. C., Muller-Karger, F., et al. (2001). Chemoautotrophy in the redox transition zone of the Cariaco Basin: a significant midwater source of organic carbon production. Limnol. Oceanogr. 46, 148–163. doi: 10.4319/lo.2001.46.1.0148
Team, R. C. (2021). R: a language and environment for statistical computing. R Foundation for Statistical Computing, Vienna. Available at: https://www.R-project.org/).
Teira, E., Reinthaler, T., Pernthaler, A., Pernthaler, J., and Herndl, G. J. (2004). Combining catalyzed reporter deposition-fluorescence in situ hybridization and microautoradiography to detect substrate utilization by Bacteria and Archaea in the Deep Ocean. Appl. Environ. Microbiol. 70, 4411–4414. doi: 10.1128/AEM.70.7.4411-4414.2004
Thorstenson, D. C., and Mackenzie, F. T. (1974). TIme variability of pore water chemistry in recent corbonate sediments, Devil's Hole, Harrington sound, Bermuda. Geochim. Cosmochim. Acta 38, 1–19. doi: 10.1016/0016-7037(74)90192-6
Thrash, J. C., Cho, J. C., Ferriera, S., Johnson, J., Vergin, K. L., and Giovannoni, S. J. (2010). Genome sequences of Pelagibaca bermudensis HTCC2601T and Maritimibacter alkaliphilus HTCC2654T, the type strains of two marine Roseobacter genera. J. Bacteriol. 192, 5552–5553. doi: 10.1128/JB.00873-10
Traving, S. J., Rowe, O., Jakobsen, N. M., Sorensen, H., Dinasquet, J., Stedmon, C. A., et al. (2017). The effect of increased loads of dissolved organic matter on estuarine microbial community composition and function. Front. Microbiol. 8:351. doi: 10.3389/fmicb.2017.00351
Treusch, A. H., Leininger, S., Kletzin, A., Schuster, S. C., Klenk, H. P., and Schleper, C. (2005). Novel genes for nitrite reductase and Amo-related proteins indicate a role of uncultivated mesophilic crenarchaeota in nitrogen cycling. Environ. Microbiol. 7, 1985–1995. doi: 10.1111/j.1462-2920.2005.00906.x
Vallino, J. J., Hopkinson, C. S., and Hobbie, J. E. (1996). Modeling bacterial utilization of dissolved organic matter: optimization replaces Monod growth kinetics. Limnol. Oceanogr. 41, 1591–1609. doi: 10.4319/lo.1996.41.8.1591
Wang, Y., Xie, R., Cai, R., He, C., Chen, Q., Guo, W., et al. (2022). Linking microbial population succession and DOM molecular changes in Synechococcus-derived organic matter addition incubation. Microbiol. Spectr. 10:e0230821. doi: 10.1128/spectrum.02308-21
Wear, E. K., Wilbanks, E. G., Nelson, C. E., and Carlson, C. A. (2018). Primer selection impacts specific population abundances but not community dynamics in a monthly time-series 16S rRNA gene amplicon analysis of coastal marine bacterioplankton. Environ. Microbiol. 20, 2709–2726. doi: 10.1111/1462-2920.14091
Weber, L., Soule, M. K., Longnecker, K., Becker, C. C., Huntley, N., Kujawinski, E. B., et al. (2022). Benthic exometabolites and their ecological significance on threatened Caribbean coral reefs. ISME Commun. 2:101. doi: 10.1038/s43705-022-00184-7
Wiegand, S., Jogler, M., Boedeker, C., Pinto, D., Vollmers, J., Rivas-Marín, E., et al. (2020). Cultivation and functional characterization of 79 planctomycetes uncovers their unique biology. Nat. Microbiol. 5, 126–140. doi: 10.1038/s41564-019-0588-1
Wright, J. J., Konwar, K. M., and Hallam, S. J. (2012). Microbial ecology of expanding oxygen minimum zones. Nat. Rev. Microbiol. 10, 381–394. doi: 10.1038/nrmicro2778
Xie, R., Wang, Y., Chen, Q., Guo, W., Jiao, N., and Zheng, Q. (2020). Coupling between carbon and nitrogen metabolic processes mediated by coastal microbes in Synechococcus-derived organic matter addition incubations. Front. Microbiol. 11:1041. doi: 10.3389/fmicb.2020.01041
Zaikova, E., Walsh, D. A., Stilwell, C. P., Mohn, W. W., Tortell, P. D., and Hallam, S. J. (2010). Microbial community dynamics in a seasonally anoxic fjord: Saanich inlet, British Columbia. Environ. Microbiol. 12, 172–191. doi: 10.1111/j.1462-2920.2009.02058.x
Keywords: ammonia oxidation, Thaumarcheota, SAR202 clade, carbon fixation, chemoautotrophy, total dissolved amino acids, degradation index
Citation: Parsons RJ, Liu S, Longnecker K, Yongblah K, Johnson C, Bolaños LM, Comstock J, Opalk K, Kido Soule MC, Garley R, Carlson CA, Temperton B and Bates NR (2023) Suboxic DOM is bioavailable to surface prokaryotes in a simulated overturn of an oxygen minimum zone, Devil’s Hole, Bermuda. Front. Microbiol. 14:1287477. doi: 10.3389/fmicb.2023.1287477
Edited by:
Greg Druschel, Indiana University, Purdue University Indianapolis, United StatesReviewed by:
Trinity L. Hamilton, University of Minnesota Twin Cities, United StatesJun Sun, China University of Geosciences Wuhan, China
Copyright © 2023 Parsons, Liu, Longnecker, Yongblah, Johnson, Bolaños, Comstock, Opalk, Kido Soule, Garley, Carlson, Temperton and Bates. This is an open-access article distributed under the terms of the Creative Commons Attribution License (CC BY). The use, distribution or reproduction in other forums is permitted, provided the original author(s) and the copyright owner(s) are credited and that the original publication in this journal is cited, in accordance with accepted academic practice. No use, distribution or reproduction is permitted which does not comply with these terms.
*Correspondence: Rachel J. Parsons, rachel.parsons@bios.edu; rparso11@bios.asu.edu