Biological–physical oceanographic coupling influencing particulate organic matter in the South Yellow Sea
 Congcong Guo
 Shu Yang1
  Weidong Zhai
 Chunli Liu
- 1Institute of Marine Science and Technology, Shandong University, Qingdao, China
- 2Frontier Research Center, Southern Marine Science and Engineering Guangdong Laboratory (Zhuhai), Zhuhai, China
- 3Marine College, Shandong University, Weihai, China
Using total suspended matter (TSM), particulate organic carbon (POC), and particulate nitrogen data, this study investigated the potential vertical POC flux and transport in the South Yellow Sea (SYS). The biogenic production and resuspension fraction (i.e., the proportion of resuspended particles in TSM) were estimated using an ecosystem model and a vertical mixing model. They were verified against reported sediment trap and primary productivity data. The estimates of resuspension fraction showed substantial uncertainty of 50% in summer likely owing to the potential errors of model parameter estimation and the influence of other unexplored biophysical processes such as biological degradation, upwelling, and monsoons; however, the estimates of resuspension fraction showed less uncertainty in other seasons (<20%). Few previous studies have considered the specific influence of resuspension on the dynamics and budget of particulate organic matter (POM) in the SYS. This study proposed a reasonably simple and effective method to address this issue, which was applied to systematic examination of the variation of vertical POM flux with the change of coupled biological–physical oceanographic processes along the Subei coast and in the SYS central basin. The influence of horizontal transport from the Subei coast to the central basin may cause an overestimation of >10% of the resuspension fraction. It will be necessary to acquire additional field data covering a larger spatiotemporal scale to establish an integrated network of the SYS carbon budget.
1 Introduction
The continental shelf and marginal seas receive large amounts of particulate organic matter (POM) and nutrients from terrestrial systems (Walsh, 1991; Brink, 2016), contributing up to 14%–30% of global primary production (Longhurst, 1995; Hedges et al., 1997; Gattuso et al., 1998; Wieder et al., 2015). Terrestrial inputs and primary production provide multiple sources of coastal POM, inducing remarkable spatiotemporal variations (Wassmann, 1990; Trefry et al., 1994; McKee et al., 2004). Such terrestrial and biogenic materials can be transported to the open ocean by alongshore flows and cross-shelf water exchange (Zhou F. et al., 2015; Brink, 2016). The notable biogeochemical dynamics in these shelf regions are important for the production, deposition, degradation, and burial of organic carbon/nitrogen (Ducklow et al., 2001; Volkman and Tanoue, 2002; Oguri et al., 2003; Zhao et al., 2021).
The regional variability in carbon reservoirs from the continental shelf to the open ocean and the preservation/burial of organic carbon are associated with hydrodynamics, sedimentary dynamics, and water column depth (Oguri et al., 2003; Zhou C. et al., 2015; Liénart et al., 2018). For example, large amounts of POM in the water column of shallow shelf systems are derived from tide-induced and/or current-induced sediment resuspension (Bale and Morris, 1998; Hung et al., 2013; Bian et al., 2013a). Therefore, POM dynamics in marginal seas are subject to both vertical (surface–bottom water) and horizontal (inshore–offshore and/or alongshore) transport and exchanges (Schneider et al., 2003; Wang et al., 2008; Ye et al., 2017; Liénart et al., 2018).
The South Yellow Sea (SYS) and the adjacent East China Sea (ECS) are both important marginal seas of the western North Pacific. They receive large amounts of soil-derived and marine-derived particulate matter via the discharge of large rivers and local phytoplankton blooms (Beardsley et al., 1985; Zhu et al., 2009; Milliman and Farnsworth, 2011). Sediment traps and 234Th/238U disequilibrium have been adopted to estimate the carbon fluxes in the SYS and ECS (Sheu et al., 1999; Iseki et al., 2003; Oguri et al., 2003; Guo et al., 2010). In the SYS, the downward particulate organic carbon (POC) flux at the bottom of the euphotic zone and/or at the bottom of the thermocline is in the range of 176–342 mg C m−2 d−1 (Zhang et al., 2004; Guo et al., 2010). In the ECS, the sediment-trap-based POC flux varies from 600 mg C m−2 d−1 on the inner shelf to 52 mg C m−2 d−1 at the shelf break (Iseki et al., 2003), with the averaged 234Th-derived POC flux (based on the 234Th deficit relative to 238U and the POC to 234Th ratio) of 99 mg C m−2 d−1 in the offshore region (Bi et al., 2013). Additionally, the combination of primary production and sediment oxygen consumption and accumulation rates can also provide a perspective of the carbon budget regarding POC production and burial (Song et al., 2016; Qiao et al., 2017). Other than interpretation of direct observations, both hydrodynamic and ecosystem dynamic models have been applied to study POC dynamics in terms of cross-shelf transport, sediment resuspension, and biological production in marginal seas (Schartau et al., 2007; Zhou C. et al., 2015; Zhang and Wu, 2018).
Earlier studies have conducted comprehensive assessment of the carbon fluxes on the continental shelf and at the Okinawa Trough in the ECS, revealing substantial dynamics in cross-shelf transport, deposition, and resuspension under the combined influence of the Changjiang water discharge and the Kuroshio Current (Iseki et al., 2003; Zhu et al., 2006; Li et al., 2016). In the SYS, the fluxes and components of sinking particles have also been studied using sediment trap data (Guo and Zhang, 2005; Guo et al., 2010), but the relationship between the fluxes and biological and physical forcings remains unclear. Wan et al. (2005) used a box model in examining the variability of biomass carbon in the central cold water mass and its correlation with the POC pool, but they overlooked the influence of physical processes. Some other studies have used hydrodynamic models in analyzing the route of suspended sediment transport (Li et al., 2016; Zhong et al., 2020). Unfortunately, such models require complex parameterization, and they aim at understanding physical forcings.
The quantitative estimation of resuspension ratio is challenging, as the resuspension process is highly related to bottom shear stress, sediment grain size, and wind–wave conditions (Bengtsson et al., 1990; Evans, 1994). Previous studies have seldom quantitatively estimated sediment resuspension in the SYS and ECS. Guo and Zhang (2005); Guo et al. (2010); Hung et al. (2013), and Hung et al. (2016) have estimated resuspension ratios and used them in correcting the sediment trap-based sinking flux estimation. However, these resuspension ratios are site-specific and thus highly variable in a given region. An integrated evaluation of the resuspension activity over the SYS/ECS is necessary for better understanding of the framework of sediment resuspension. Additionally, the measurements of radiocarbon (Δ14C) and aluminum contents in sinking particles have suggested that lithogenic particles derived from the adjacent riverine discharges may contribute sinking fluxes over the continental shelves (Hwang et al., 2008; Hwang et al., 2010), indicating that the lateral transport needs to be considered as a potential influencing factor when calculating the resuspension ratio.
The present study addressed this important issue using total suspended matter (TSM), POC, and particulate nitrogen (PN) data and examined the potential vertical POC flux and subsequent transport in the SYS using different models. We combined an ecosystem model and a vertical mixing model to investigate how biogenic processes, resuspension, and potential horizontal cross-shelf transport (i.e., from coastal areas to the central region) might contribute to the carbon budget between the Subei coast and central SYS basin. The ecosystem model was used to estimate the carbon/nitrogen dynamics of phytoplankton, heterotrophs, and detritus, although we had no means of judging the accuracy of the model results because it is difficult for us to precisely divide TSM into contributions of phytoplankton, heterotrophs, and detritus. However, the findings of this study support a comprehensive understanding of how POM dynamics and stoichiometries reflect a coupled response to biological and physical forcings both seasonally and spatially (from the Subei coast to the central SYS basin) in a marginal sea.
2.Materials and methods
2.1. Study area
This study focused on two subregions of the SYS: the Subei coast region and the central basin (Figure 1). The Subei coast region is near the Subei Shoal with a hydrological regime driven by vertical mixing and coastal currents. Its average depth is <20 m, which means robust resuspension due to strong bottom stress and turbulent kinetic energy (Graber et al., 1989; Bian et al., 2013a). The region has been affected by large-scale green macroalgal blooms (i.e., green tides of Ulva prolifera) since 2007 owing to eutrophication (Liu et al., 2009; Liu et al., 2013; Wang et al., 2015). The central basin has an average depth of >70 m. Its variability of biogeochemical dynamics is substantial with moderate mixing in winter, phytoplankton blooms in spring/autumn, and stratification in summer (Lin et al., 2005; Fu et al., 2009).
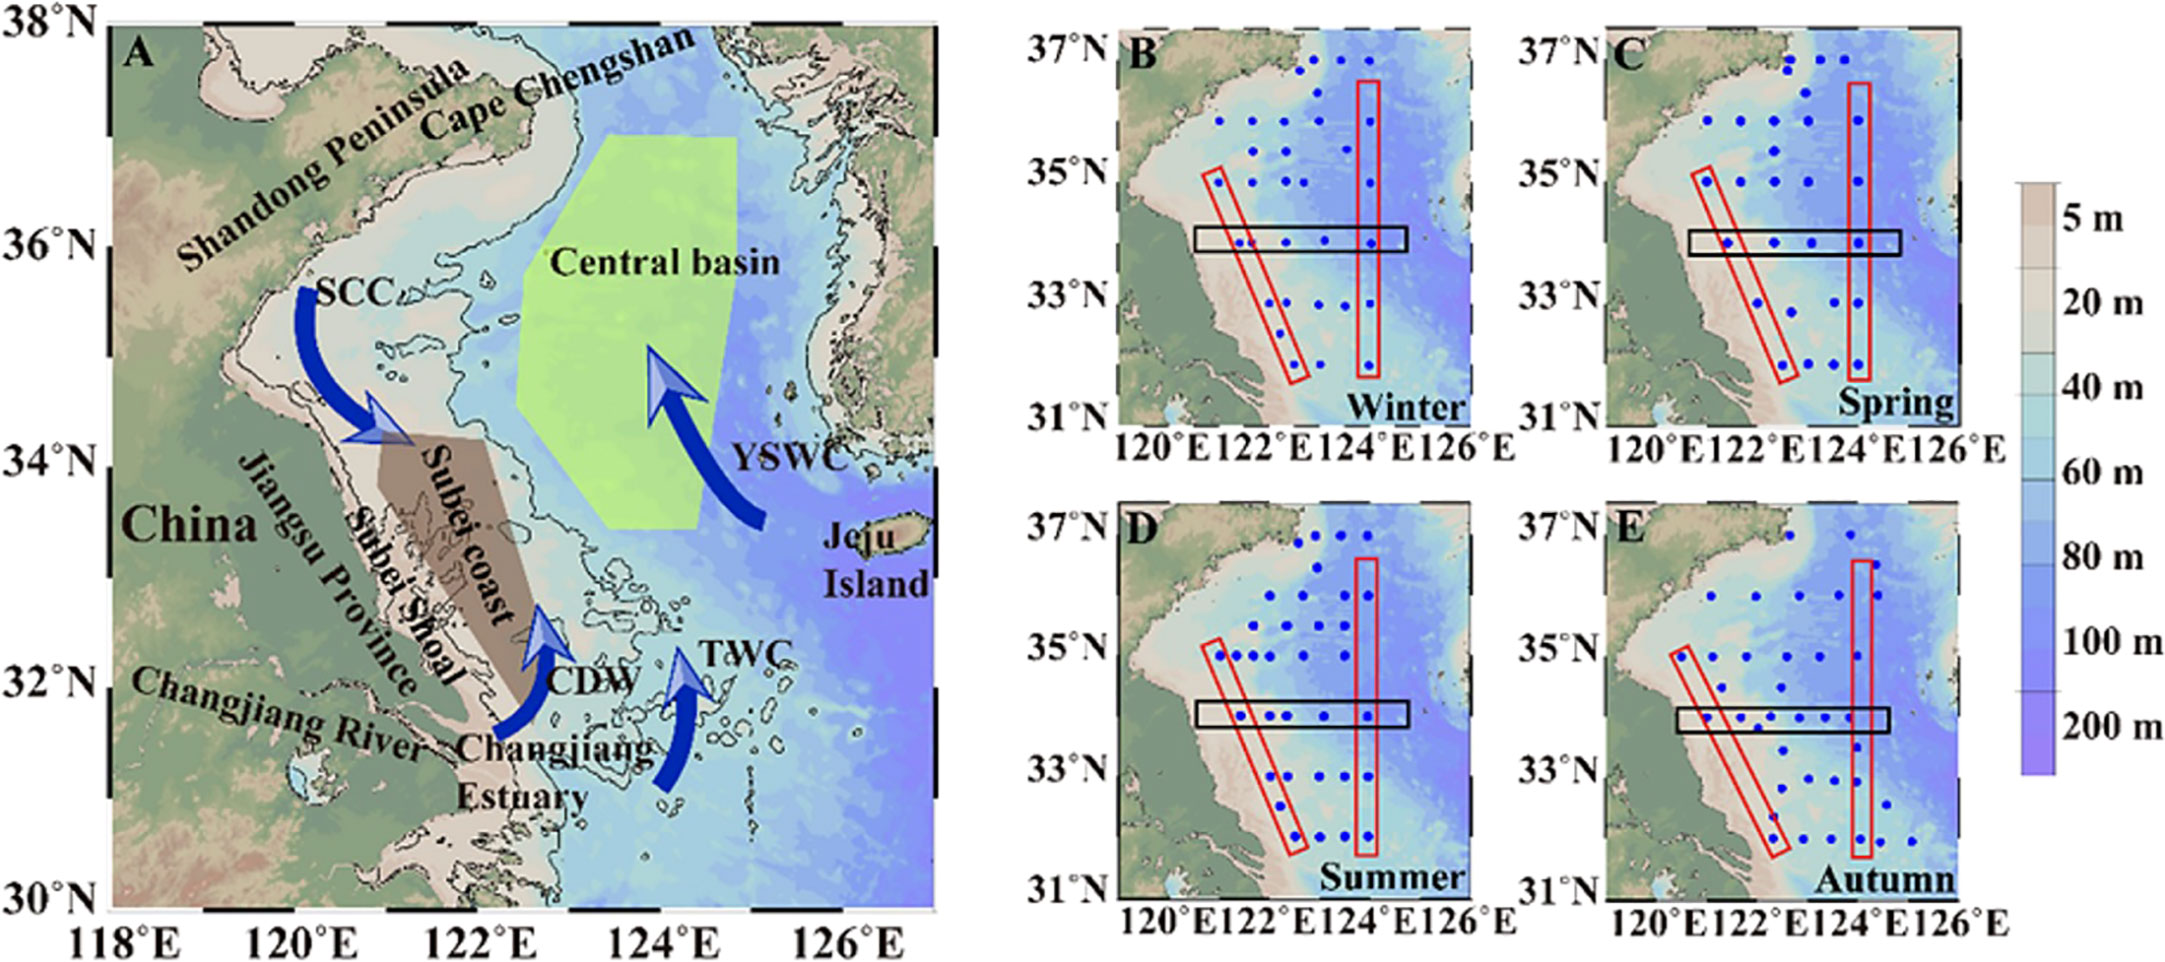
Figure 1 Area map and sampling stations. The Subei coast region and central basin are marked by colored polygons. The arrows in panel (A) denote the main ocean currents: SCC, Subei Coastal Current; CDW, Changjiang Diluted Water; TWC, Taiwan Warm Current; YSWC, Yellow Sea Warm Current. In panels (B–E), red and black rectangles sketch those featured transects, including coastal and central sections (red rectangles) and the 34°N section (black rectangles).
The study area exhibits distinct hydrodynamic patterns in the spatial framework between western coastal waters and offshore waters (Figure 1A). The coastal currents include principally the Subei Coastal Current (SCC) and Changjiang Diluted Water (CDW), which carry large amounts of nutrients and terrestrial material, thereby notably shaping the biogeochemical characteristics of these biogenic elements and thus the phytoplankton community (Shi et al., 2003; Lin et al., 2005; Zhou et al., 2008; Wang et al., 2013). The Subei Shoal near the Jiangsu coast is characterized by sandy and tidal hydrology with a depth of <10 m, presenting a marked pattern of sediment transport dynamics (Wang et al., 2011; Liu et al., 2013b). The central region of the SYS constitutes a stratified and enclosed regime accompanied by seasonal variation of the Yellow Sea Cold Water Mass (YSCWM). Substantial water exchange occurs with the ambient seas on the southern or southeastern side of the SYS, e.g., intrusion of the Taiwan Warm Current through the SYS–ECS boundary (Chen, 2009) and invasion of the Yellow Sea Warm Current (Figure 1A) that originates from the Tsushima Current.
The environmental conditions have distinct seasonal variation in the central basin and the Subei coast region (Figure 2). Temporal variation of sea surface temperature (SST) shows a seasonal cycle from low values in winter (~7°C) to high values in summer (~27°C) (Figure 2A). The SSTs of the central basin and the Subei coast are similar throughout the year, and the seasonal cycle is notable for photosynthetic active radiation (PAR), with maximum and minimum values occurring in spring/summer (49 mol photons m−2 d−1) and winter/autumn (14 mol photons m−2 d−1), respectively (Figure 2B). The mixed layer depth (MLD) in the central basin has marked seasonal contrast, deepening in winter (71 m) and shallowing in summer (12 m), whereas the seasonal variation of MLD is small in the Subei coast region throughout the year (Figure 2C). Dissolved inorganic nitrogen (DIN) in the central basin decreases with seasonal progression from winter to summer (Figure 2D). However, DIN in the Subei coast region exhibits little seasonal change because of the multiple nutrient sources, e.g., the SCC and vertical mixing during winter and autumn and the CDW during spring and summer. The reported DIN concentration in the Subei coast region has an annual average value of ~10 μmol L−1. During summer, the phenomena of high and low DIN concentrations in the Subei coast region and the central basin are correlated with the robust nutrient input from the CDW in the former and the stratified water column in the latter, respectively.
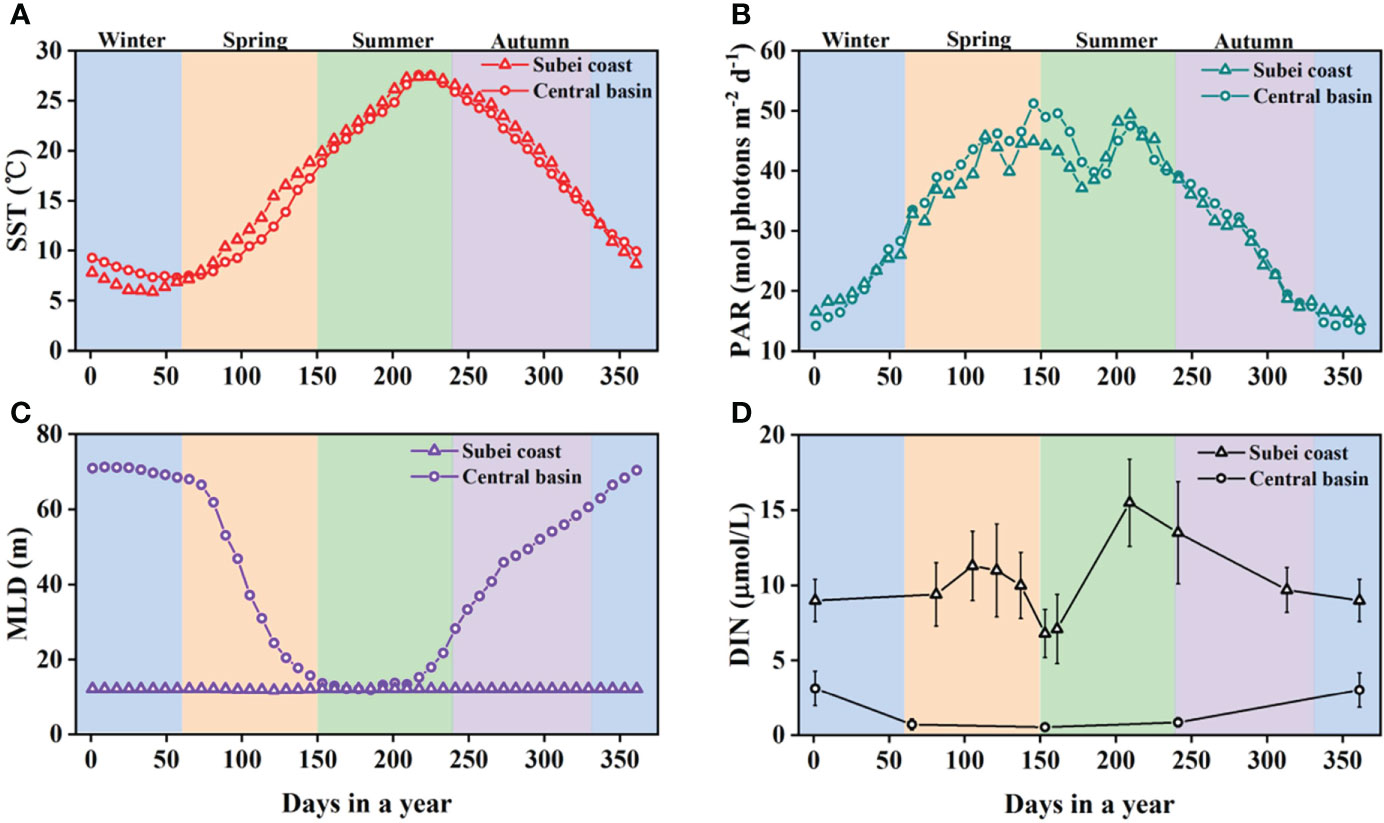
Figure 2 Temporal variations of sea surface temperature (SST, A), photosynthetic active radiation (PAR, B), mixed layer depth (MLD, C), and dissolved inorganic nitrogen (DIN, D) in the central basin of the South Yellow Sea (SYS) and the Subei coast region. Remote sensing data of 8-day SST, PAR, and MLD with 4-km spatial resolution were used to present their temporal variations throughout the year (https://oceancolor.gsfc.nasa.gov/). The SST, PAR, and MLD data are displayed as mean climatological data from the previous two decades, as reported by Niu et al. (2021). Observational DIN data are obtained from those seasonal sampling surveys at the surface or above the mixed layer (Shi et al., 2015; Guo et al., 2020; Wang et al., 2020). The continuous change of DIN throughout a year was derived by linearly interpolating the seasonal average.
2.2. Sampling and analyses
Four field surveys were conducted in the SYS between late 2017 and 2019, covering the four seasons (Figures 1B–E). The winter, spring, and summer cruises were conducted by the R/V “Dongfanghong 2” during 18 December 2017 to 18 January 2018, 28 March to 16 April 2018, and 24 July to 8 August 2018, respectively. The autumn survey was performed by the R/V “Lanhai 101” during 10–19 October 2019. Three water depth samples were collected at each station in the coastal region (surface layer, 2–4 m; middle layer, 7–10 m; bottom layer, 13–25 m), and three or four water depth samples were collected in the central region (surface layer, 2–5 m; subsurface layer, 15–20 m; middle layer, 30–45 m; bottom layer, 55–75 m). Water samples were collected using an onboard Rosette sample system equipped with a conductivity–temperature–depth (CTD) instrument (Seabird 19 Plus). Additional hydrological parameters including temperature, salinity, turbidity, and depth were also measured simultaneously via the CTD sensors. High-resolution CTD data were not acquired during autumn. Turbidity data were corrected using the measured TSM (Figure S1) and presented with the unit of milligrams of TSM per liter (mg TSM L-1). Water turbidity values of the middle/bottom layers in the coastal SYS during summer were above the measurement range of the CTD probe when TSM was >10 mg L−1 (Figure S1B). Therefore, the CTD turbidity data were available for the central SYS only during summer. The MLD was defined as the depth at which the temperature changed by 0.2°C relative to that at the reference depth of 3 m (Chu et al., 1997). The total number of samples obtained in this study were 108 (9 in the Subei coast region and 47 in the central basin), 84 (9 in the Subei coast region and 33 in the central basin), 116 (8 in the Subei coast region and 41 in the central basin), and 124 (9 in the Subei coast region and 39 in the central basin) in winter, spring, summer, and autumn, respectively.
A certain volume of each sample, extracted for particulate matter analysis (depending on the site: 0.5–2 L in the coastal region; 3–5 L in the central region), was filtered through glass fiber filters (GF/F, 47-mm diameter, Whatman). These filters were preweighed and precombusted in a muffle furnace at 450°C for 5 h. After filtration, these filters were rinsed three times with ultrapure water. Subsequently, they were folded and wrapped in precombusted aluminum foil and then preserved at −20°C until required for analysis in the laboratory. Prior to analysis, filters were fully dried in a vacuum freeze dryer for at least 24 h. Each dried filter was weighed and then quantitatively divided into two parts. The first part was used to determine particulate carbon and nitrogen; the second part was fumed with 15 ml of 36% HCl for removal of carbonate and then redried for POC measurement. Determination of these elements was performed using a Costech ECS4024 Elemental Analyzer following the standard CHN analysis method by combusting the filters at high temperature (Sharp, 1991). The standard curve was obtained using standard methionine (NC Technologies). The detection limit for carbon was 0.002 mg C (R2 > 0.99) and that for nitrogen was 0.005 mg N (R2 > 0.99). A methodological problem is that the protocol for removing carbonate is inefficient for the removal of inorganic N, which means that the residual N after fuming is actually the total nitrogen consisting of both organic and inorganic parts (Meyers, 2003; Bianchi and Bauer, 2011). Hence, the N composition of the suspended POM is hereafter represented by PN. The mass of TSM was taken as the dry weight difference of the filters before and after filtration.
2.3. Model construction and parameter selection
We combined a simplified ecosystem model and vertical mixing model to estimate how biological processes and resuspension might shape the distributions of POM. We assumed that POC and PN in the water column were dominated by biogenic and resuspension sources. Additionally, the biogenic part of POM was considered principally influenced by biological production, respiration, and aggregation (phytoplankton and heterotrophs), as well as by the formation and decay of detritus; the resuspension part was considered to originate from surface sediments when they were suspended by turbulence and thus reentered the water column.
The ecosystem model includes those state variables, parameters, and kinetics related to important biological production of POC and PN in the water column. The associated pools of POC and PN were modeled in carbon and nitrogen units, respectively. The set of model equations showing the dynamics of the biogenic state variables ( PhyC, N , phytoplankton carbon and nitrogen; HetC, N , heterotrophs carbon and nitrogen; DetC, N , detritus carbon and nitrogen) can be expressed as follows:
where Cphot is the carbon-specific photosynthesis rate (d−1); Rphy is the phytoplankton respiration rate (d−1); EC, N is the carbon and nitrogen loss rate of phytoplankton due to exudation (d−1); Rhet is the heterotrophic respiration rate (d−1); Ehet is the loss rate of heterotrophs (d−1); Tf is the temperature-response function; NC is the carbon-specific nitrogen assimilation of phytoplankton (d−1); ωC, N is the remineralization of detrital carbon or nitrogen (d−1); AC, N is the carbon or nitrogen loss due to aggregation of phytoplankton cells (mmol C m−3 d−1/mmol N m−3 d−1); and GC, N is the carbon or nitrogen loss due to heterotroph grazing (mmol C m−3 d−1/mmol N m−3 d−1). The detailed parameterizations for biological growth and kinetics are shown in Text S1 in Supplementary Materials. The model was started running in winter with the initial value of the state variables prescribed as follows: 1 mmol PhyC m−3; 1 mmol HetC m−3; 2 mmol DetC m−3; 0.2 mmol PhyN m−3; 0.1 mmol HetN m−3; and 0.1 mmol DetN m−3.
Some model parameters were estimated from earlier studies, e.g., Schartau et al. (2007) and Geider et al. (1998), and fixed values were assigned to these parameters (Table S1). The values of certain parameters that are difficult to measure directly were estimated via optimization (Table S1). In the ecosystem model, SST, PAR, and DIN are important factors that affect biological production. The mean climatological data (8-day remote sensing data with 4-km spatial resolution, https://oceancolor.gsfc.nasa.gov/) of SST and PAR over the previous two decades (Figure 2) were reported by Niu et al. (2021). Observational data of DIN (Figure 2D) were taken from those seasonal sampling surveys at sea surface or above the mixed layer (Shi et al., 2015; Guo et al., 2020; Wang et al., 2020). These parameters were input as a forcing function to constrain the model output.
The vertical mixing model, based on a statistical result of observational data, provides a macroscopic perspective from which to estimate the proportion of particles resuspended from the surface sediment and reintroduced into the water column. It is a two end-member mixing model based on an assumption that suspended particles are from a mixture of materials from upper-layer phytoplankton and surface sediment (Bloesch, 1994; Hung et al., 2013). The POC concentration (%, mg mg−1) in the mixture is expressed as follows:
where Sp is the upper-layer phytoplankton concentration (mg L−1), fp is the POC fraction of phytoplankton (%), and fs is the POC fraction of surface sediment (%).
By plotting POC (%) against 1/TSM, we can obtain related information of the two endmember values ( fp and fs ). The ratio of resuspended particles to total sinking particles can be determined as follows:
where ft is the POC fraction of sinking particles (%). Therefore, fR was used to estimate the POC pools from the benthic system to the water column due to vertical mixing. This model is based on the assumption that particles have unchanged chemical components during/after sinking and resuspension, and it also neglects the potential influence of horizontal transport.
3.Results
3.1. Data overview
Generally, concentrations of TSM, POC, and PN all peaked in the Subei coast region and decreased seaward (Figure 3). The distinct geographical location of the Subei coast makes it the most POM-rich region in the SYS. Apart from the transport of the sandy sediment, the Subei Shoal is also a region of origin of green tides, and these floating algal mats can drift further offshore into the SYS and the open ocean (Liu et al., 2009; Wang et al., 2015). The propagation of both the muddy and turbid waters and the suspended sediments of this region is robust along the shoreline and toward the offshore sea owing to the wind-driven coastal currents (Wang et al., 2011). We found seaward propagation of high-value patches of POC and PN during summer (Figures 3G, K); however, the lowest concentrations all occurred in the central basin, where weak physical and biological processes make it a POM-poor region.
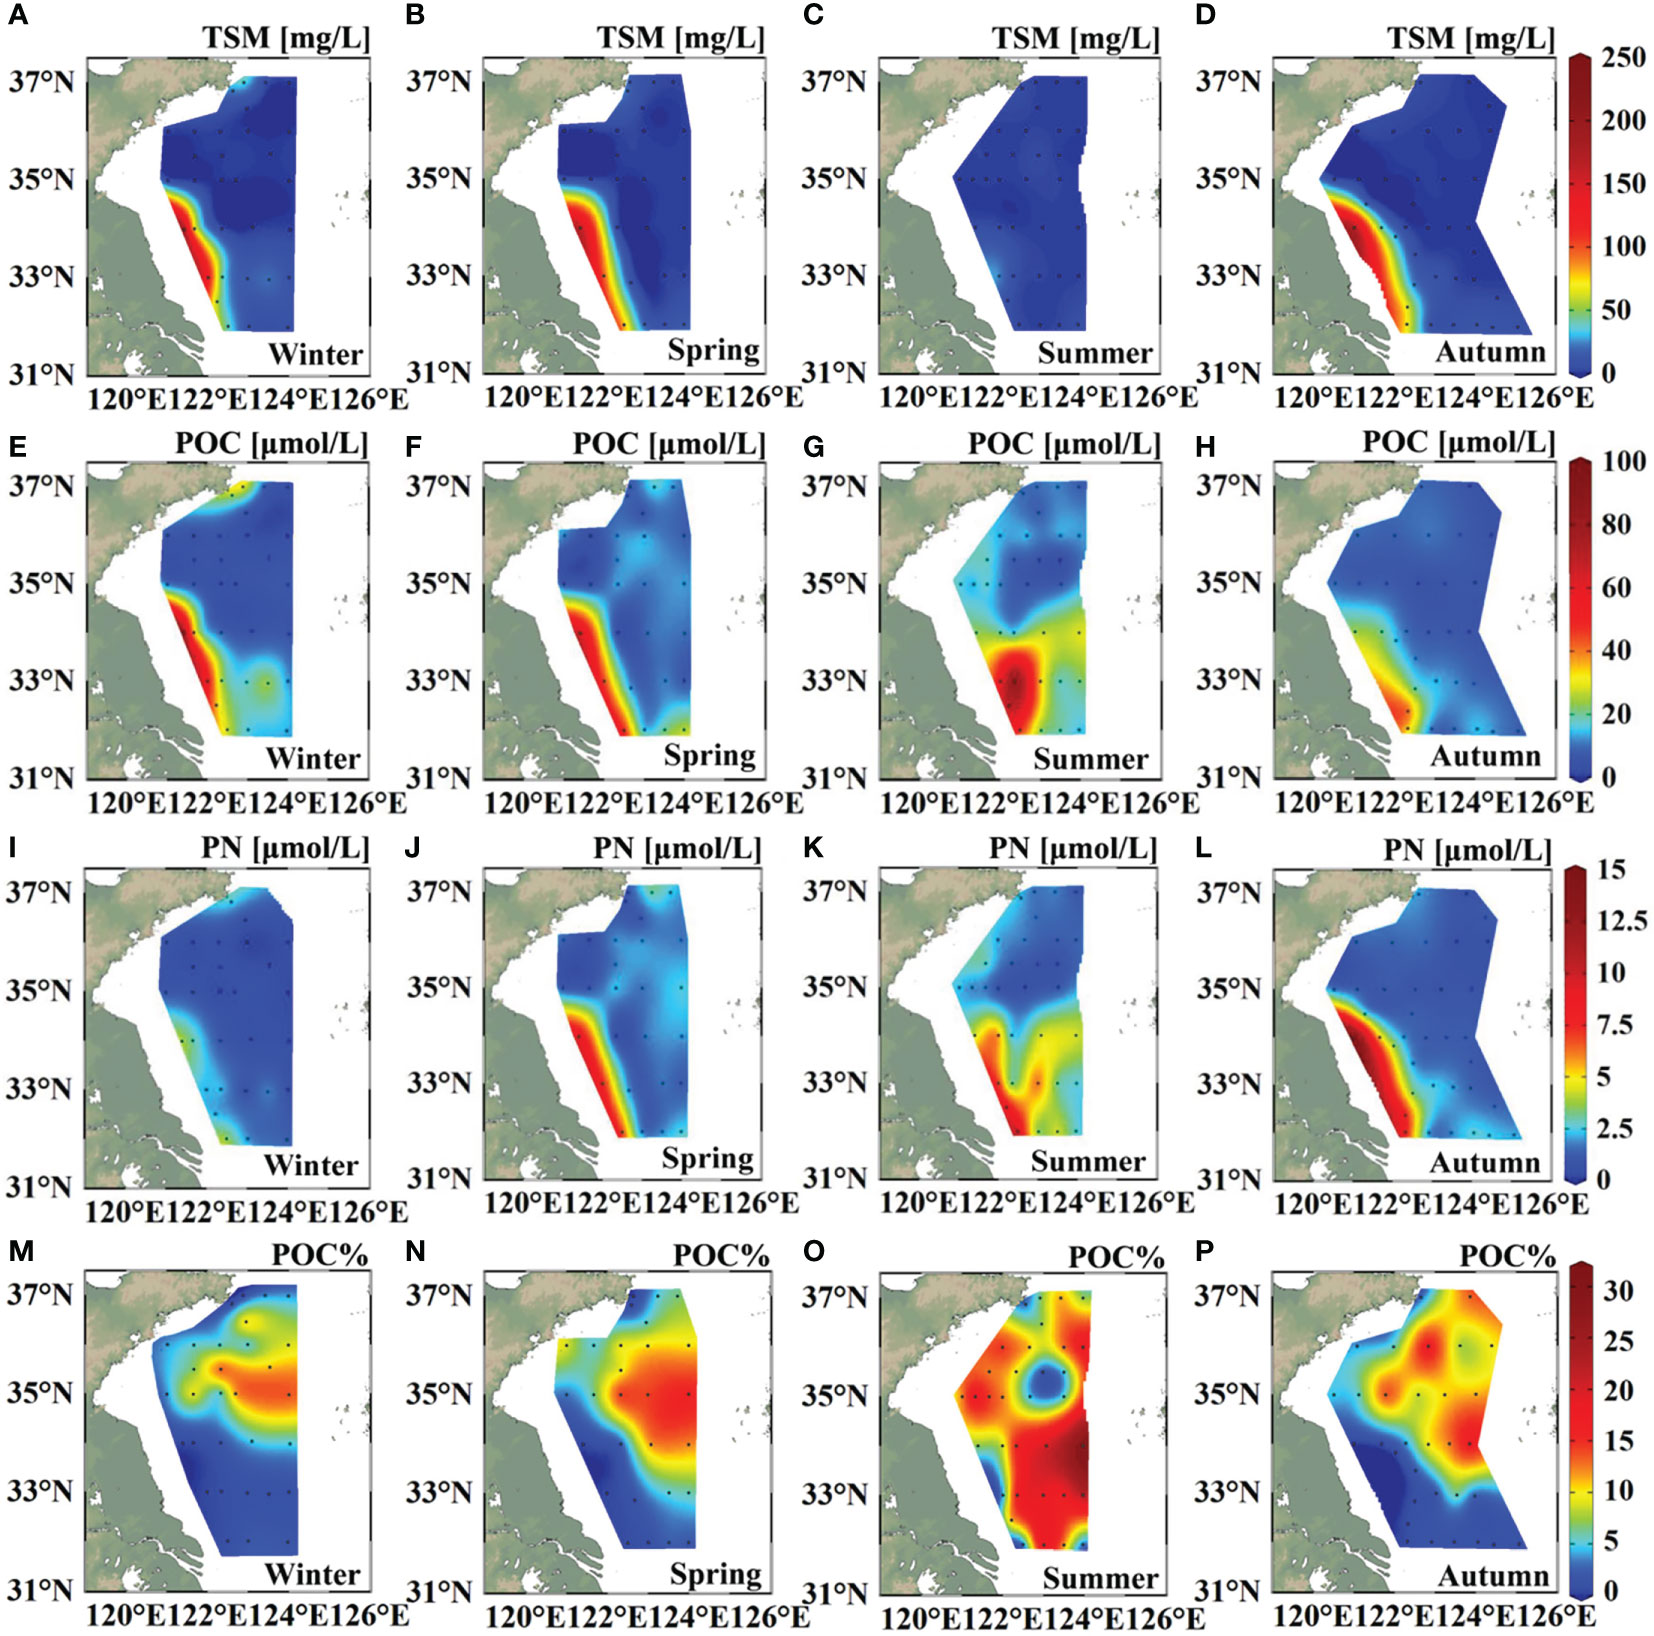
Figure 3 Sea surface distributions of total suspended matter (TSM) concentration (A–D), particulate organic carbon (POC) concentration (E–H), particulate nitrogen concentration (I–L), and percentage content of POC in the TSM (M–P) in the four seasons.
The lowest upper-layer percentage content of POC in the TSM (POC%) was observed in the Subei coast region (Figures 3M–P). A notable gradient of upper-layer POC% was observed in winter, spring, and autumn from the coastal region to the central SYS. By contrast, low-POC% patches occurred both in the central basin and in the Subei coast region in summer (Figure 3O). The central basin had lower POC% in summer than those in spring and autumn, which could be expected because the upper-layer high-POC% POM provided by biological processes decreased in the nutrient-depleted condition during summer.
For the central section, the signal of warm and saline water was evident in winter to the south of 34°N (Figures 4A, E), indicating invasion of the Taiwan Warm Current from the ECS. The input of saline water south of 34°N remained notable during spring, although the temperature was low (Figures 4B, F). Stratification was robust during summer, with the depth of the thermocline in the range of 30–40 m and the depth of the halocline in the range of 20–30 m (Figures 4C, G). The highest turbidity occurred at the bottom between 32°N and 34°N and decreased from 50–80 mg TSM L−1 during spring and winter to <10 mg TSM L−1 during summer (Figure S2). The MLD was shallow during spring (11–19 m) and summer (5–16 m) in the central section of 33°N–36°N (Figure S3A). During winter, the MLD deepened to the near-bottom layer (50–60 m) to the north of 34°N, and the water column was uniformly mixed vertically to the south of 34°N (Figure S3B).
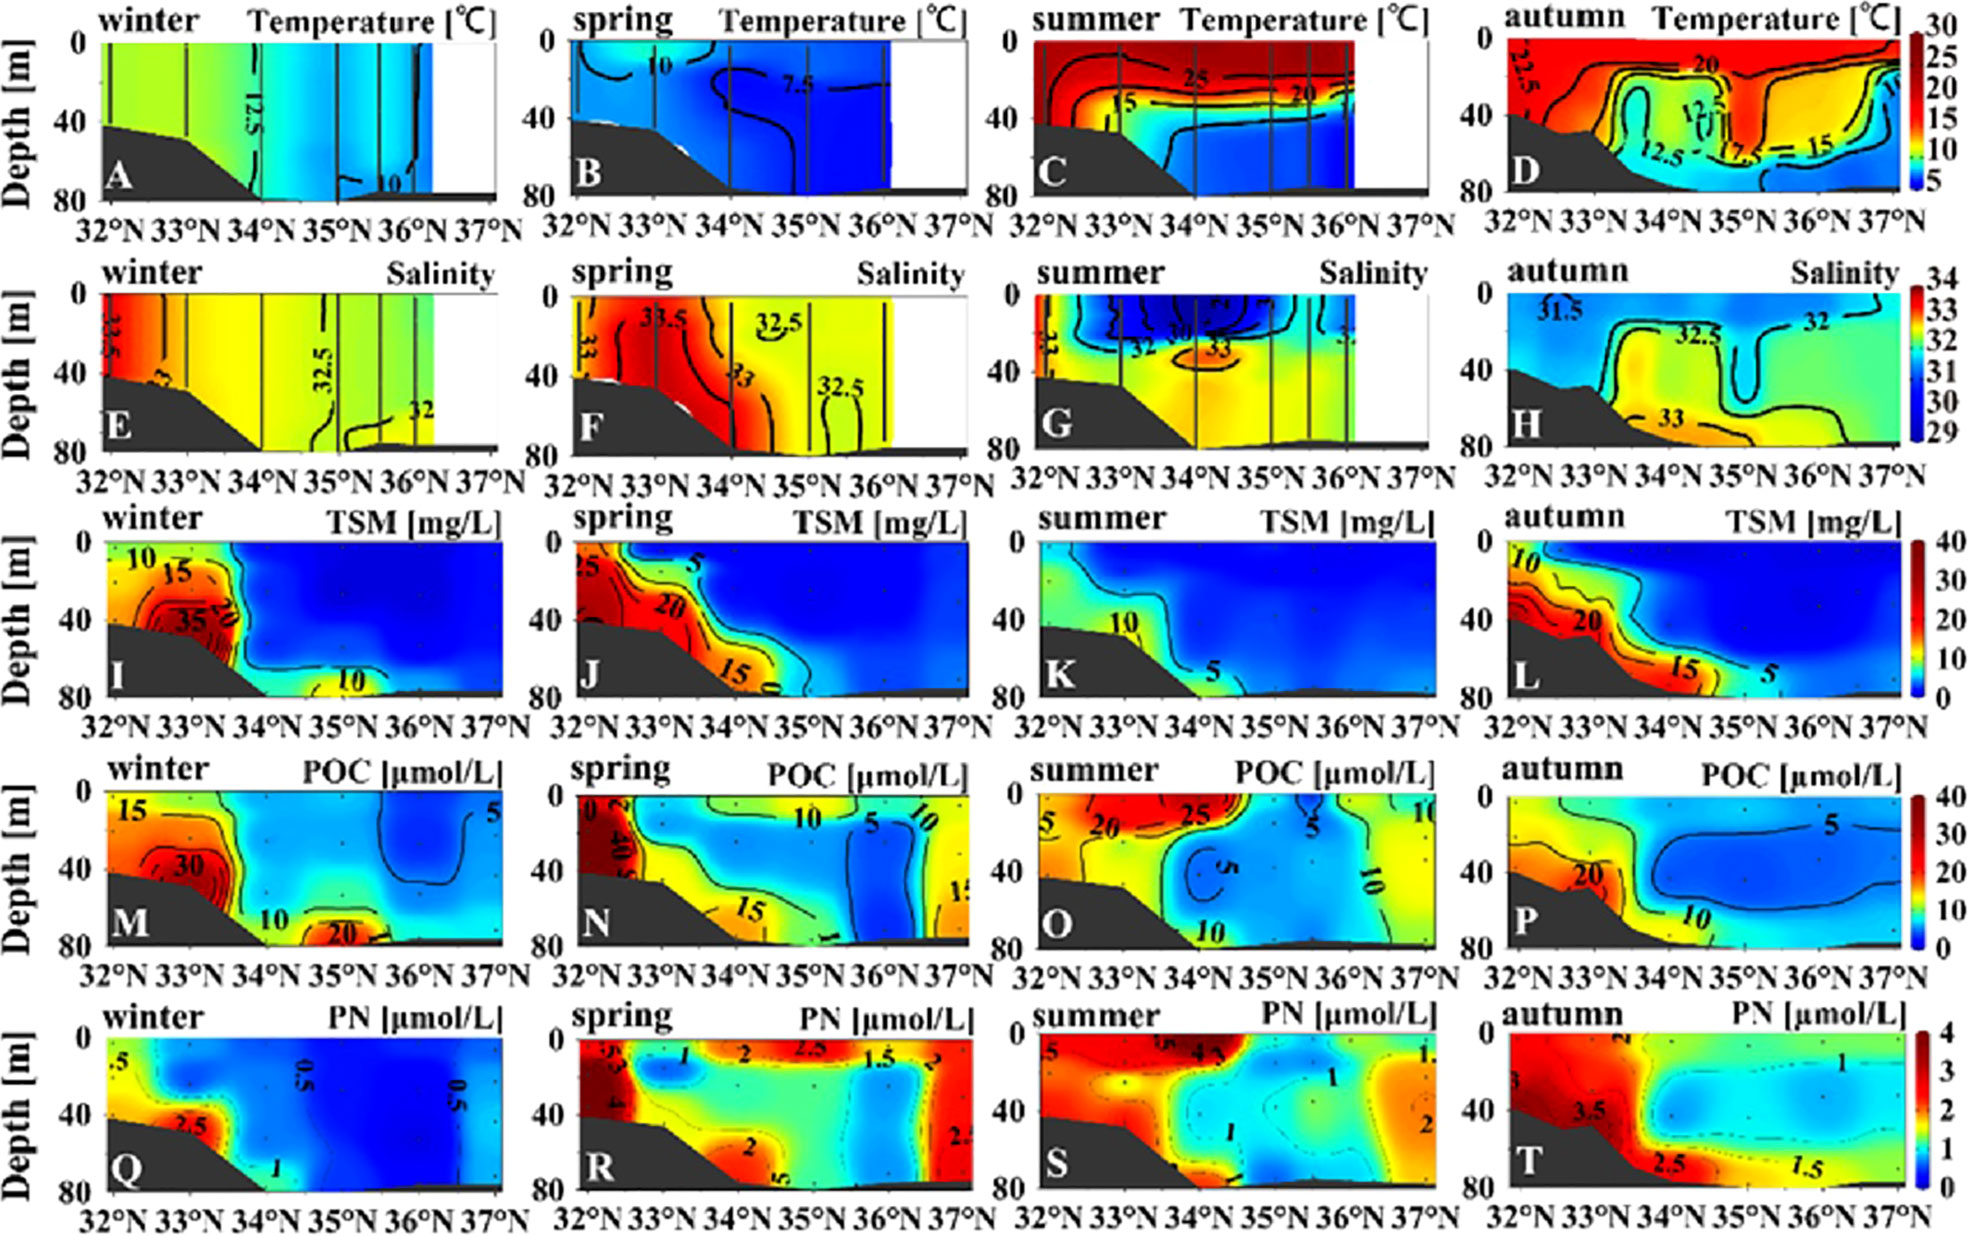
Figure 4 Vertical distribution of temperature (A–D), salinity (E–H), total suspended matter (I–L), particulate organic carbon (M–P), and particulate nitrogen (Q–T) concentrations in the central section (Figure 1) in the four seasons.
For the coastal section, we found no marked vertical variability of temperature and salinity in winter, spring, and autumn (Figure 5). The surface warm and less-saline water was notable at stations between 32°N and 33°N during summer, demonstrating the potential influence of the SCC (Figures 5C, G). The turbidity was considerably high (150–200 mg TSM L−1) throughout the water column between 33°N and 34°N (Figures S2D, S2E). The pattern of uniform mixing was marked for the entire coastal section during winter and spring (Figure S3B). The water column in the area of shallow topography (33°N–34°N) could still be mixed vertically during summer (Figure S3B). The high turbidity and deep mixed layer demonstrated the robust resuspension in the area of shallow topography (<20 m) throughout the year.
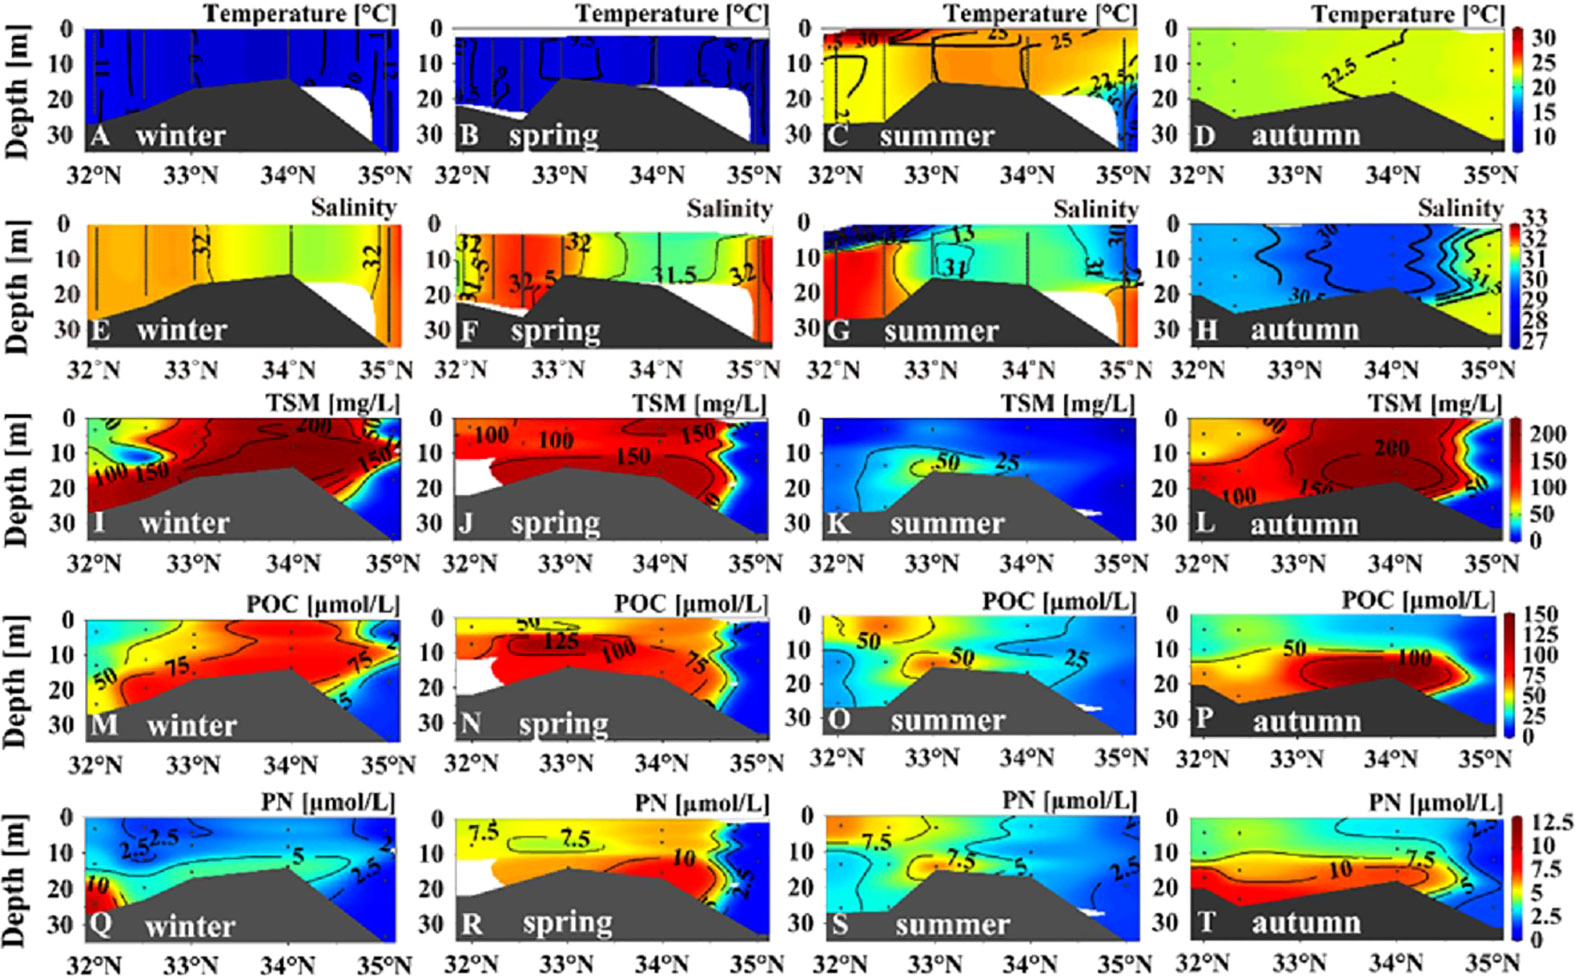
Figure 5 Vertical distribution of temperature (A–D), salinity (E–H), total suspended matter (I–L), particulate organic carbon (M–P), and particulate nitrogen (Q–T) concentrations in the coastal section (Figure 1) in the four seasons.
Figure 6 shows the vertical distributions of temperature, salinity, and TSM/turbidity along the 34°N to elucidate the potential influence of horizontal cross-shelf transport. In winter, seaward invasion of cold and less-saline coastal waters was notable, with the temperature contour of 10.5°C spreading to the area of 122.3°E (Figures 6A, E). By contrast, seaward invasion of warm and low-salinity coastal waters was observed in summer (Figures 6C, G). Additionally, the low-salinity signal was notable to the east of 123.5°E in summer (Figure 6G).
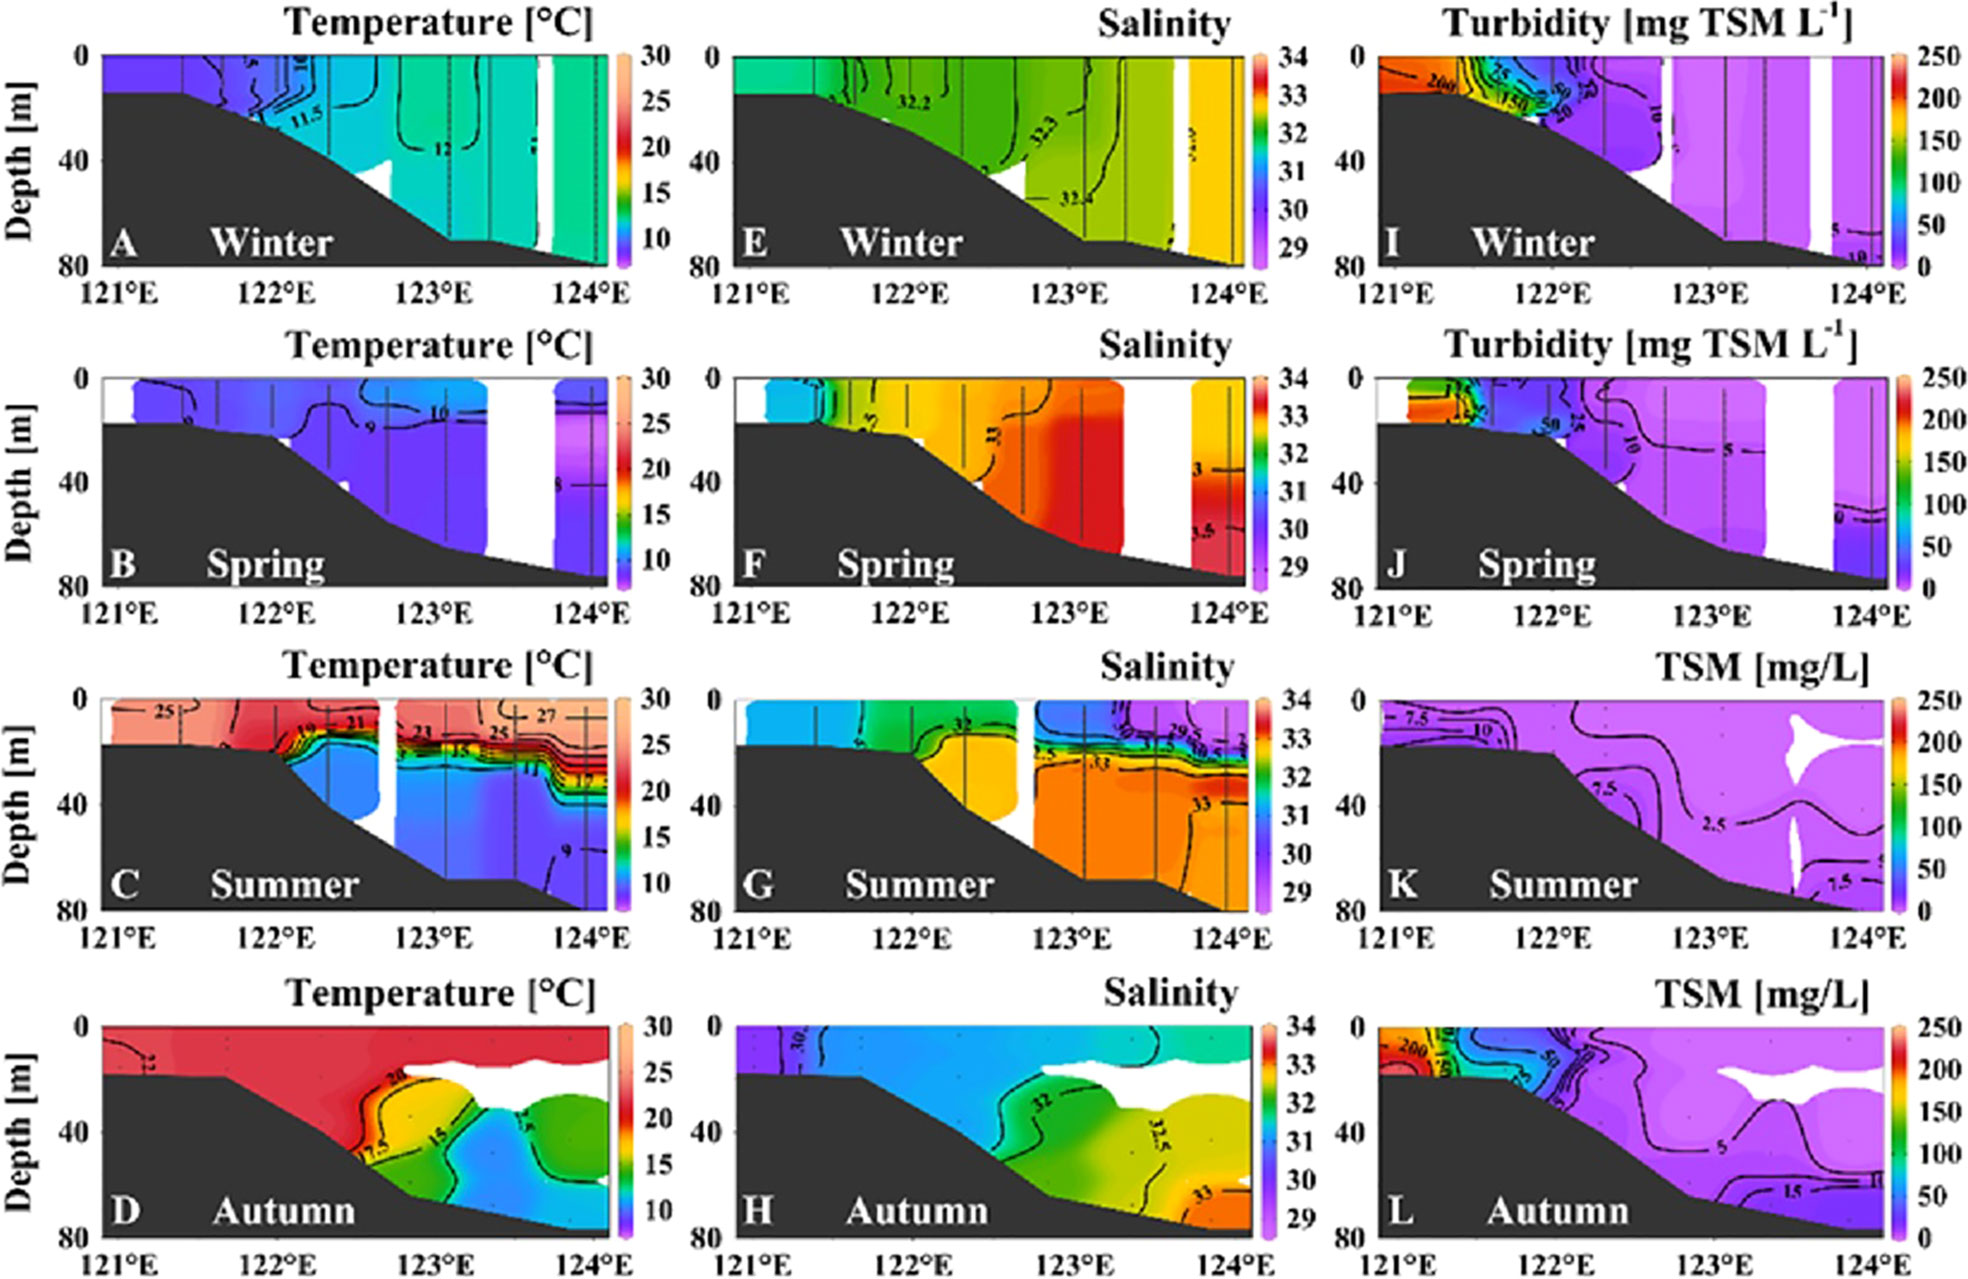
Figure 6 Vertical distributions of temperature (A–D), salinity (E–H), and total suspended matter (TSM) concentration (I–L) along the 34°N section (Figure 1) in different seasons. In winter and spring, high-resolution turbidity data were used instead of discrete TSM to better show the vertical variations.
3.2. Characteristics of particulate organic matter dynamics
To the south of 34°N along the central section, the concentrations of TSM, POC, and PN all peaked at the bottom during winter, spring, and autumn (Figure 4). The concentrations of POC and PN peaked at the sea surface during summer (Figures 4O, S), demonstrating substantial biological production in summer. By contrast, the concentration differences between the sea surface and the bottom water were small to the north of 34°N along the central section. High values of TSM and POC occurred in the bottom water at 35°N during winter (Figures 4I, M), indicating moderate influence of resuspension. High values of POC and PN occurred at the sea surface in the region 34°N–36°N during spring (Figures 4N, R), indicating increased biological production (Jin et al., 2013).
In comparison with the central section, the coastal section had higher concentrations of TSM, POC, and PN. The vertical distribution of TSM was similar to that of turbidity, showing a relatively high value across the water column between 33°N and 34°N in winter, spring, and autumn (Figures 5I, J, L). High values of TSM occurred only at the bottom in summer (Figure 5K), demonstrating weakened resuspension. Generally, the coastal section showed higher POC and TSM in winter and spring, and the lowest values occurred in summer. The turbulent water column in seasons other than summer contributed to higher supplies of POM from the bottom. In summer, high values of POC and PN were present at both the sea surface and the bottom water (Figures 5O, S), which means joint influence of biological processes and resuspension on POM dynamics. The increase of upper-layer biogenic elements in the Subei coast region and the central basin coincided with the rises in temperature and PAR during spring and summer (Figures 2A, B).
Along the 34°N section, the turbidity contours of 15–50 mg TSM L−1 spread out from the high-turbidity region (west of 122°E) at depth of >15 m in winter (Figure 6I). This phenomenon corresponded to seaward invasion of cold coastal waters (Figure 6A). Thus, the horizontal transport of POM was related to freshwater movement driven by hydrodynamic processes. In spring, the seaward-spreading turbidity contours were not notable (Figure 6J). Specifically, the 50 mg TSM L−1 contour occurred only at the bottom at 122°E (~20 m) during spring, whereas it spread seaward to the area near 122.2°E at a depth of ~14 m during winter (Figures 6I, J). Thus, horizontal transport in winter was more substantial than that in spring. In summer, the resuspension and seaward spread were not important (Figure 6K). In autumn, seaward-spreading TSM contours (<50 mg/L) were observed at 122°E (Figure 6L), although the spreading range was less than that in winter.
The Subei coast region showed extremely low POC% in winter, spring, and autumn (<1%, Figure 7), indicating robust resuspension across the water column. The POC fractions of surface sediments reported in the Yellow Sea (Hu et al., 2013), Changjiang Estuary (Zhang et al., 2007), and ECS (Kao et al., 2003) were usually <1%. This phenomenon corresponded to the high TSM (Figures 5I, J) and deepened MLD (Figure S3B) during winter and spring. Bottom stress and turbulent kinetic energy have been reported to be strong in the continental shelf areas west of 125.5°E, demonstrating robust vertical mixing (Bian et al., 2013a).
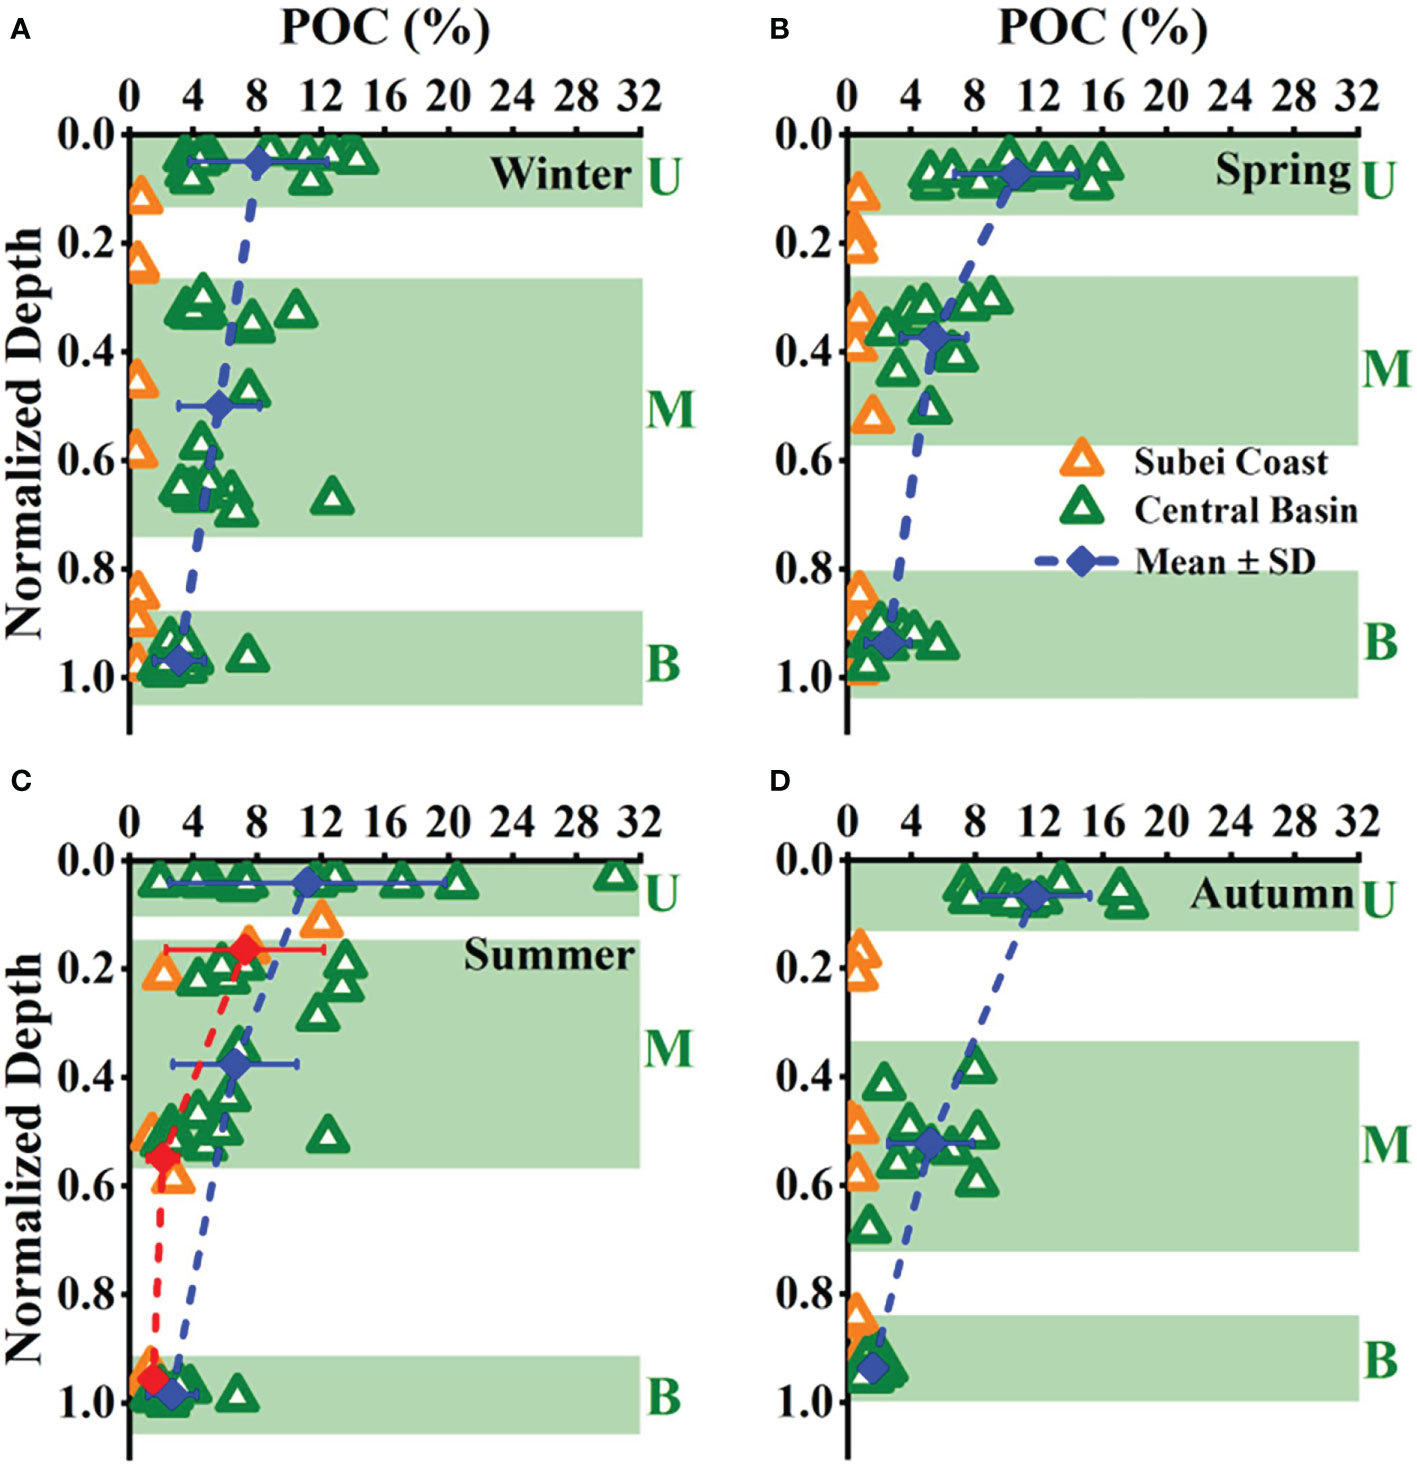
Figure 7 Vertical patterns of percentage content of particulate organic carbon (POC%) in the total suspended matters with normalized depth among seasons (A–D). Triangles with different colors represent different areas (orange, Subei coast; olive, central basin). The vertical distribution in the central basin showed a three-layer structure, as marked by the light green frames. U, upper layer; M, middle layer; B, bottom layer. Blue points connected by a dashed line show the change of the mean values in each layer of the central basin. Red points connected by a dashed line in panel C show the change of the mean values in each layer of the Subei coast region during summer.
Biogenic particles have markedly high POC% (approximately 10%–16%) compared with that of surface sediments (Hung et al., 2013). In summer, upper-layer POC% in the Subei coast region reached up to ~12% (Figure 7C), indicating the increased contribution of upper-layer biogenic POM in the shallow coastal regime. The warm and slightly stratified water column was conducive to the development of phytoplankton blooms when additional nutrients were supplied from CDW in the Subei coast region in summer (Figure 2), demonstrating the increased contribution of biogenic production to the POC pool. However, the robust mixing resulted in a large fraction of resuspended particles in the other seasons, i.e., low POC%, even though the phytoplankton abundance could increase in the Subei coast region. In the central basin, the maximum POC% occurred in the upper layer (average: 10%–12% in spring, summer, and autumn and 8% in winter) and then decreased with depth. Less sediment-dominated POM was mixed in the middle layer during summer because it had higher average POC% (6.6%) than in the other seasons (5.6% in winter, 5.4% in spring, and 5.5% in autumn).
3.3. Variations of particulate organic matter stoichiometries
The C/N ratio based on the data at all sampling depths also showed notable spatial and seasonal variations (Figure 8), indicating that these particles might differ in composition.
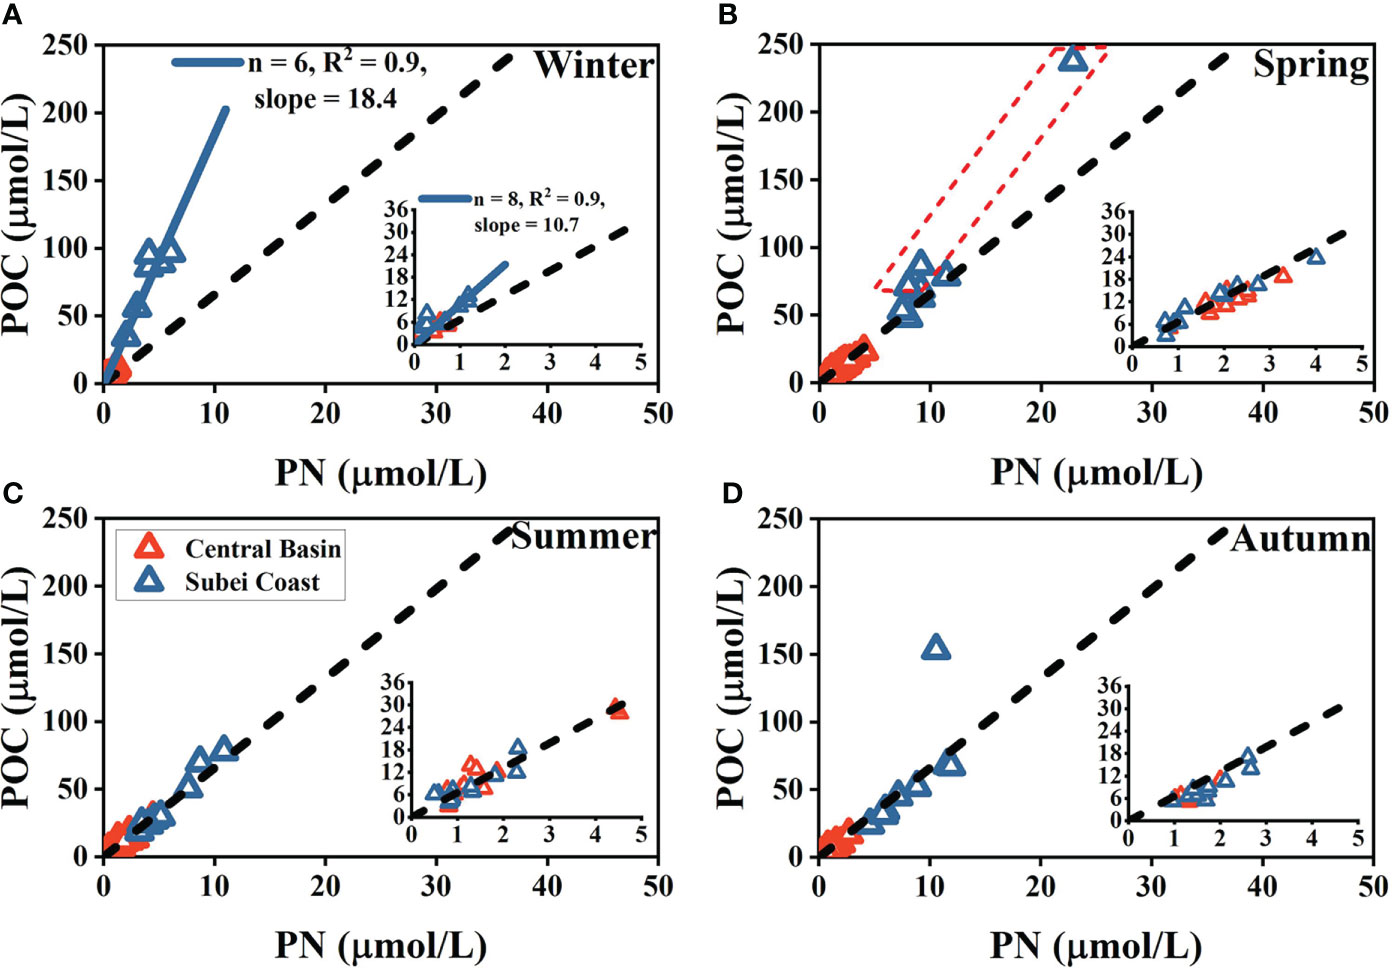
Figure 8 Particulate organic carbon (POC) vs. particulate nitrogen (PN) in the Subei coast region and the central basin in the four seasons (A–D). The inset view in each panel shows an enlarged version for POC vs. PN in the central basin between the surface and bottom layers. Orange/blue triangles in the inset views denote surface/bottom data. The slope of the blue fitted line denotes the corresponding mean elemental ratio. The black dashed lines represent the Redfield ratio of POC: PN (6.6). Three outliers marked by a red dashed frame in panel B are from the bottom layers in the Subei coast region.
The C/N ratio in the Subei coast region displayed the highest value in winter (18.4), which then decreased slightly in spring, deviating by three points from the Redfield ratio (Figures 8A, B). During winter, robust mixing in the Subei coast region could resuspend more sediment carbon into the water column. The three points were in the bottom layers, indicating that bottom resuspension could be notable in spring.
The detritus-rich POM further resulted in a regime with a C/N ratio higher than the Redfield ratio. For example, the extracellular mucilage of these primary producers, known as transparent exopolymer particles, has a high carbon content (on average: C:N >20) and high concentration in productive estuaries and coastal waters (Engel and Passow, 2001; Taylor et al., 2014; Zäncker et al., 2017). Detritus-rich POM was verified by Guo et al. (2010), who identified that settling particles trapped within the SYS and the ECS consisted of substantial particle aggregates (e.g., diatom aggregates, fecal pellets, and tintinnids) that showed a mean C/N ratio of >12. It has been reported that turbulent mixing in coastal systems facilitates the formation of these particle aggregates by increasing the collision and coagulation rates (Kiorboe, 1998).
In summer and autumn, however, the C/N ratio in the Subei coast region did not deviate markedly from the Redfield ratio (Figures 8C, D), demonstrating weakened physical mixing. The increased SST and freshwater inputs by the CDW and Subei local rivers were responsible for the increased stratification in summer and early autumn (Zhu and Wu, 2018). The shallowed MLD in the Subei coast region during summer might indicate the increased stratification (Figure S3A). The occurrence of increased sea surface POC% in the Subei coast region during summer corresponded to the weakened physical mixing (Figure 7C). Similarly, the C/N ratio of the central basin was close to the Redfield ratio in all seasons, demonstrating the notable contribution of biogenic sources to POM pools in the stratified central basin. Furthermore, the C/N ratios in the central basin between the surface and bottom layers are shown in Figure 8 (inset views). Only the bottom C/N ratio showed notable deviation from the Redfield ratio during winter (10.7; Figure 8A), indicating that the influence of resuspended particles (responsible for the increased C/N ratio) might be important in bottom waters in the central basin in winter.
3.4. Modeling results
3.4.1. Results of the ecosystem model
The modeled biogenic POC and PN were contributed by three components: phytoplankton ( PhyC and PhyN ), heterotrophs (HetC and HetN ), and detritus ( DetC and DetN ). By considering resuspension, we were able to calculate the total POC or PN (biogenic + resuspension, shown as dashed curves in Figure 9) and then perform a comparison with the linear interpolation of the observed values (shown as points in Figure 9) according to Eq. S9 in Supplementary Materials. The calculated Cf is 3.1 (R2 = 0.96) and 0.6 (R2 = 0.83) for POC and PN, respectively, in the Subei coast region and 1.5 (R2 = 0.81) and 0.2 (R2 = 0.92) for POC and PN, respectively, in the central basin. The low Cf and high R2 values indicate that the model results matched the observed values.
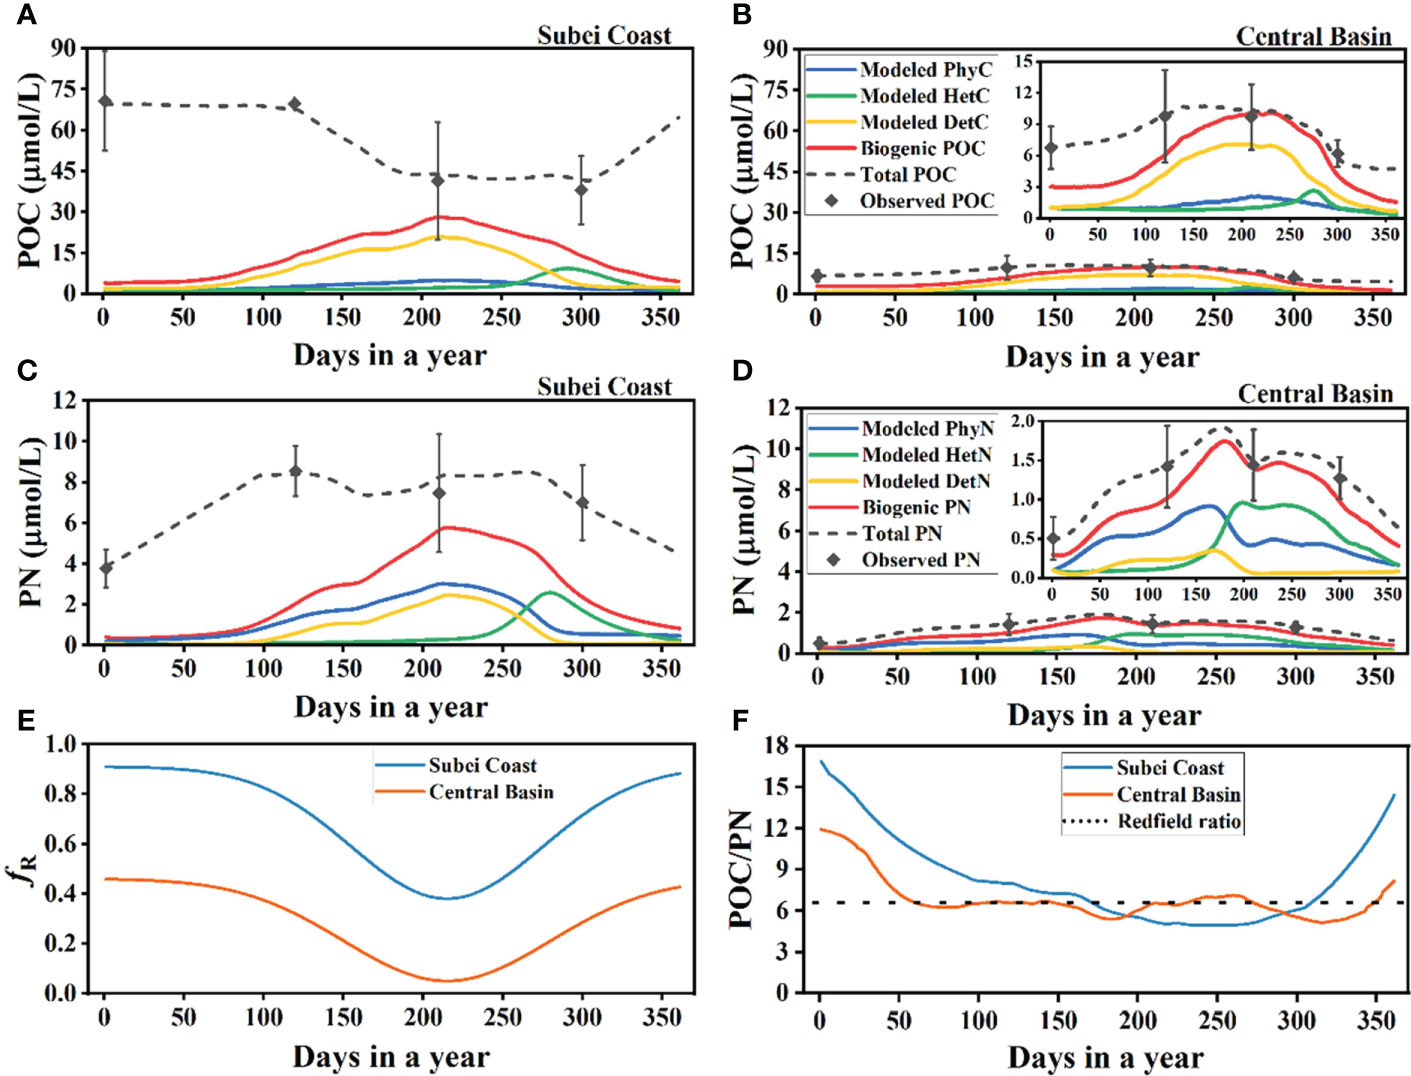
Figure 9 Results of the ecosystem model. (A, B) Modeling results of particulate organic carbon (POC) in the Subei coast region and central basin. (C, D) Modeling results of particulate nitrogen (PN) in the Subei coast region and central basin. The inset view in panels (B) or (D) shows a related enlarged version. (E) Modeling results of fR after optimization in the Subei coast region and central basin. (F) Modeling results of the POC/PN ratio in the Subei coast region and central basin. PhyC and PhyN , phytoplankton carbon and nitrogen; HetC and HetN , heterotrophs carbon and nitrogen; DetC and DetN , detritus carbon and nitrogen; Biogenic POC (PN) = modeled PhyC + modeled HetC + modeled DetC (modeled PhyN + modeled HetN + modeled DetN ); Total POC or PN, the sum of biogenic and resuspended POC or PN; Observed POC and PN, observed value of POC and PN in situ (means ± SD of all stations in a given region after depth-weighted averaging for each station); fR , the ratio of resuspended particles to total suspended particles.
The modeling was based on some idealized assumptions such as no horizontal transport. The influence of horizontal transport (mainly from terrestrial input) will be analyzed in Section 4.3 the biogenic POC of the Subei coast region was approximately 26% higher than that in the central basin. Because resuspended particles contributed more POC than PN (PN is more easily degraded during sedimentation) in the Subei coast region, PN dynamics tended to be determined by biogenic inputs, whereas POC dynamics tended to be determined by resuspended inputs. This resulted in a different trend of the seasonal variation between the total POC and PN (dashed black lines in Figures 9A, C), i.e., the variation of total POC had a reversed trend in comparison with that of biogenic POC, whereas the variation of total PN was in accord with that of biogenic PN. The influence of biogenic input could be more important in the central basin because the variations of the total POC and PN were comparable to those of biogenic POC and PN, respectively (Figures 9B, D). In terms of PN dynamics, biogenic PN contributed more than 56% of the total PN in winter and almost all of the total PN in summer (Figure 9D). The sediments might have less PN content in the central basin because sinking particles have longer residence time in comparison with those in the coastal regions (Guo and Zhang, 2005; Guo et al., 2010), which means that most organic nitrogen will be degraded before particles settle to the seabed.
The model also showed seasonal variation of fR by optimization (Figure 9E). In the Subei coast region, approximately 90% of the total POM was provided by resuspension during winter, but the resuspension fraction decreased to 38% during late summer. By contrast, resuspension contributed less to the total POM in the central basin, and it decreased from 45% in winter to 5% in late summer. The variation of fR was largely consistent with the change of MLD in the central basin (Figure S3A). The difference in the resuspension fraction between the Subei coast region (38%) and the central basin (5%) in summer could be the result of different hydrological characteristics. First, stratification in the Subei coast region during summer was not as strong as that in the central basin, which is dominated by the YSCWM. This can be demonstrated by the lower sea surface POC% in the Subei coast region than that in the central basin in summer (Figure 7C). Second, the shallow topography and tidal currents make surface sediment resuspension easier in the Subei coast region than that in the central basin, which has deeper topography (Song et al., 2018; Zhu and Wu, 2018). The modeled POC/PN ratio also showed notable seasonal variation (Figure 9F), which corresponded to the variations of the observed values (Figure 8). The modeled POC/PN ratio in the Subei coast region was markedly higher than the Redfield ratio during winter and spring. The central basin had a lower POC/PN ratio in comparison with that of the Subei coast region, and it presented a ratio close to the Redfield ratio in most seasons.
The influences of environmental factors and model parameters were estimated based on the sensitivity analysis. The detailed information is presented in Text S3 in Supplementary Materials.
3.4.2. Results of the vertical mixing model
According to Eq. 7, the slope of the linear fitting for POC (%) vs. 1/TSM equals to Sp×(fp−fs), and the intercept equals to fs. The variable slopes of the linear fitting showed regional and seasonal variations (Figure 10). The Subei coast region showed notably larger slopes (19.4–25.1) than those of the central basin (5.1–9.4) principally because the Subei coast region had more upper-layer phytoplankton (Sp) than the central basin. The central basin showed sharp seasonal contrast, whereas the seasonal difference was small in the Subei coast region. The linear fitting also showed a larger intercept in the central basin (0.7–1.1) than that in the Subei coast region (0.3–0.6), indicating that the surface sediments of the central basin had a higher POC content. The mud area in the central SYS largely consists of organic-rich fine-grained sediments originating from the Huanghe River, whereas the Subei coast region is characterized by coarse sediments or transitional sediments (between coarse and fine types) (Lee and Chough, 1989; Yang and Youn, 2007; Qiao et al., 2017).
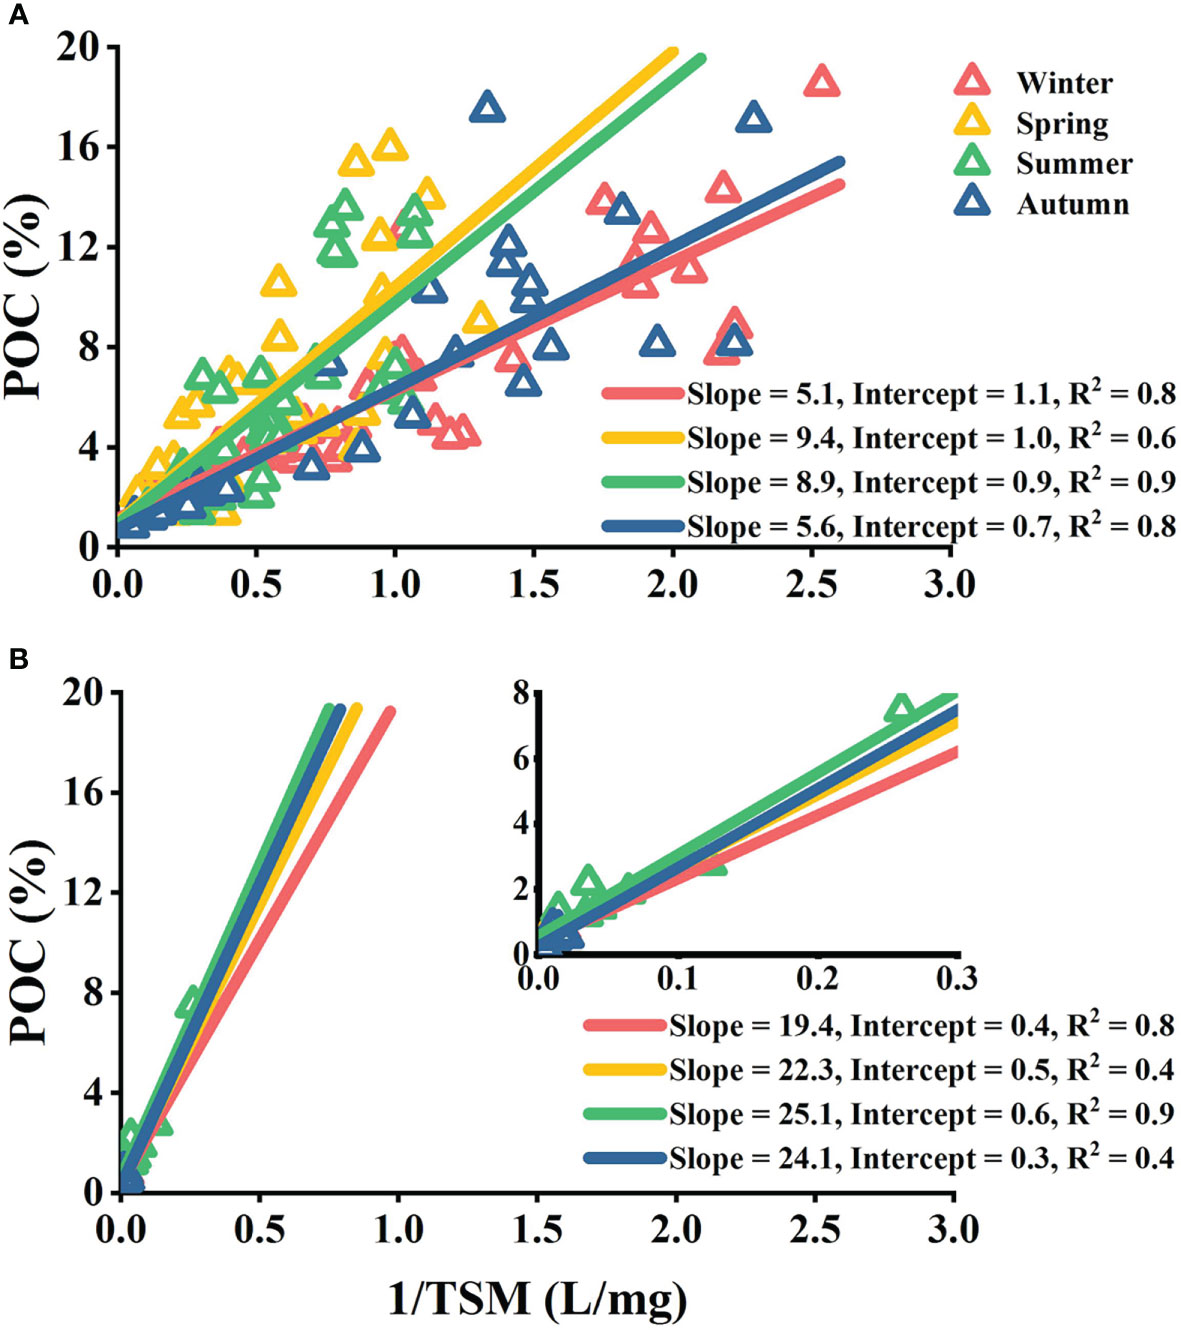
Figure 10 Fitting results of POC (%) vs. 1/TSM in the central basin (A) and the Subei coast region (B). According to Eq. 7, the slope of the linear fitting for POC (%) vs. 1/TSM is equal to Spx(fp−fs) , and the intercept of that is equal to fs , where Sp is the upper-layer phytoplankton concentration (mg L−1), fp is the POC fraction of phytoplankton (%), and fs is the POC fraction of surface sediment (%). Seasons are distinguished by different colors. The inset view in panel (B) shows a related enlarged version.
The parameters used to calculate the resuspension fraction using Eq. 8 are shown in Table 1. It is difficult to measure Sp in situ because we have no means to separate phytoplankton from the suspended POM and then to weigh each fraction. For the central basin, we assumed that the upper-layer phytoplankton accounted for a substantial proportion of sea surface TSM, expressed as follows: Sp=TSMs×(1−fR), where TSMs is the averaged sea surface TSM in the central basin. The values of TSMs were taken as 0.96 mg L−1 in winter, 1.58 mg L−1 in spring and summer, and 0.74 mg L−1 in autumn. This assumption is based on recent studies suggesting that living planktonic cells account for most of the POM pools in unproductive regions (Martiny et al., 2013a; Martiny et al., 2013b). For the Subei coast region, we assumed Sp to be directly proportional to the modeled PhyC . This is based on the fact that the growth of the upper-layer phytoplankton is largely controlled by photosynthesis (i.e., controlled by SST and PAR) in nutrient-rich coastal regions.
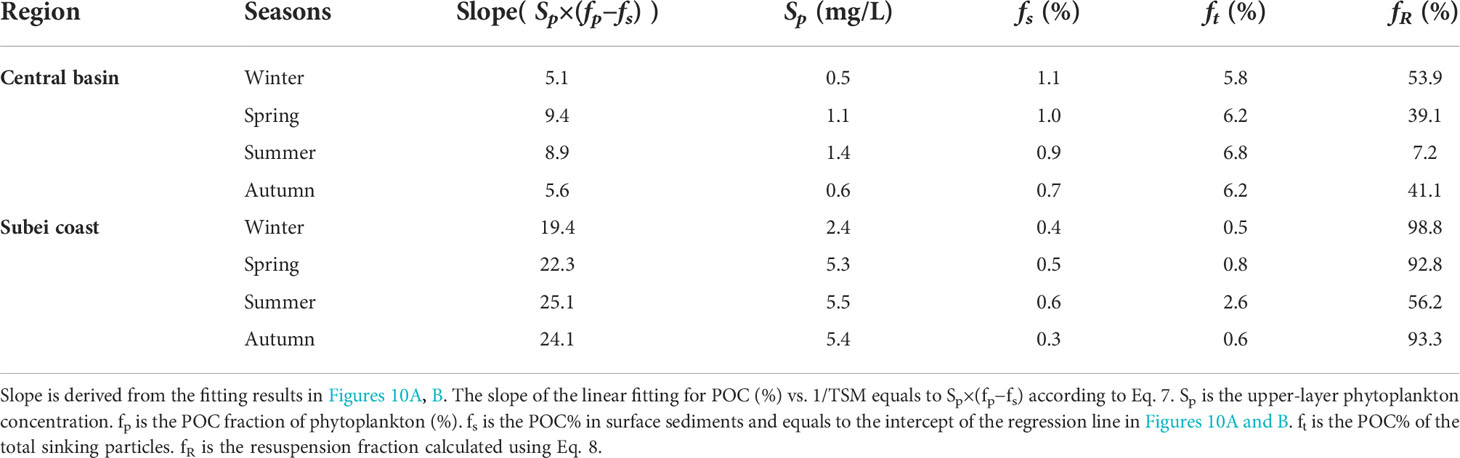
Table 1 Parameters used in the vertical mixing model.
The calculated Sp for the central basin (Table 1) was close to the range of 0.25–0.75 mg L−1 given by Hung et al. (2013) for the offshore region of the ECS. We have no observed values of the POC% of the total sinking particles (ft) and no reported data to indicate their seasonal variation in the SYS. We assumed that the sinking particles collected by sediment traps comprised a mixture from three layers (upper, middle, and bottom layers in Figures 7A–D). The depth-weighted average POC% across the water column in a given region was calculated to represent ft (Table 1). Sinking particles in the offshore waters of the ECS showed a POC fraction of 4.2%–7.3% (Hung et al., 2013). Guo et al. (2010) collected sinking particles in a sediment trap in the central SYS during September and showed that sinking particles had POC contents of 7.9% (at 28 m), 4.1% (at 45 m), and 1.3% (at 69 m). These reported data coincided with the presented vertical distribution of POC% (Figure 7) and the calculated ft (Table 1) in this study. Generally, the resuspension fraction (fR in Table 1) calculated using the vertical mixing model matched well with the fR obtained from ecosystem model optimization (Figure 9E).
4. Discussion
4.1. Model validation
The modeled results are based on certain assumptions that might potentially introduce errors and uncertainties. Because no measured vertical flux datasets were available in this study, we compared our modeled results with those of previous studies that used other methods (modeling and observation) to estimate POC fluxes.
It is difficult to demonstrate the accuracy of the result of ecosystem model because we cannot precisely divide TSM into contributions from phytoplankton, heterotrophs, or detritus. Thus, we can only compare the model result with other reported data derived from field observation or modeling. Wan et al. (2005) used a coupled pelagic–benthic ecosystem model to estimate phytoplankton biomass carbon in the central SYS and showed that the modeled biomass was highest in summer and spring (1.1–3.4 mmol C m−3) and lowest in winter (~1.0 mmol C m−3). The results conformed to the variation range of modeled PhyC in the central basin from winter to late summer (1–3 mmol C m−3). Additionally, the carbon content of phytoplankton can be estimated using a carbon-to-chlorophyll a ratio (C:Chl a), which varies from 10 to 100 g g−1 in different marine systems (Geider, 1993; Taylor et al., 1997). Chang et al. (2003) estimated that the values of C:Chl a were 18.0 and 67.4 g g−1 for coastal and offshore waters in the ECS during summer. We assumed that these values were applicable to the SYS. The average Chl a concentrations during summer, taken from Fu et al. (2009), were 0.4 mg m−3 (in the central SYS) and 2.5 mg m−3 (in the coastal SYS), and the calculated biomass carbon values were 2.2 mmol C m−3 (in the central SYS) and 3.8 mmol C m−3 (in the coastal SYS), which were also comparable with the model results. Using the ratio of POC/Chl a in the northern ECS in summer and winter, i.e., ~70 and 16, respectively (Hung et al. (2009), we calculated similar values of phytoplankton biomass carbon, i.e., 2.3 and 3.3 mmol C m−3.
The reported sediment trap data and depth-integrated primary productivity (PP) were used to estimate the potential resuspension fraction and POC export ratio (Table 2). The POC export ratio is equal to the ratio of net POC flux/PP. Guo and Zhang (2005) estimated a net POC flux (NPOC) of 172–342 mg C m−2 d−1 in a section across the SYS (from the Shandong Peninsula to Jeju Island) by calculating the difference between the total settling flux and the resuspension flux. This range of NPOC corresponded to the POC fluxes estimated by 234Th/238U disequilibrium and rare earth elements in the offshore ECS (Bi et al., 2013; Hung et al., 2016). The NPOC can fluctuate in the SYS. As analyzed by Guo and Zhang (2005), the high flux (342 mg C m−2 d−1) in the central SYS is associated with the potential influence of YSCWM upwelling. Thus, we used a range (172–342 mg C m−2 d−1) instead of a specific value to represent the NPOC in the SYS. Similarly, the NPOC in the coastal ECS was reported as 486–785 mg C m−2 d−1 by Hung et al. (2013). Actually, the PP (unit: mg C m−2 d−1) is a depth-integrated value of the measured PP (unit: mg C m−3 d−1) across the water column. Thus, the depth-integrated PP ( PPi ) at a certain depth (i) can be calculated as follows:
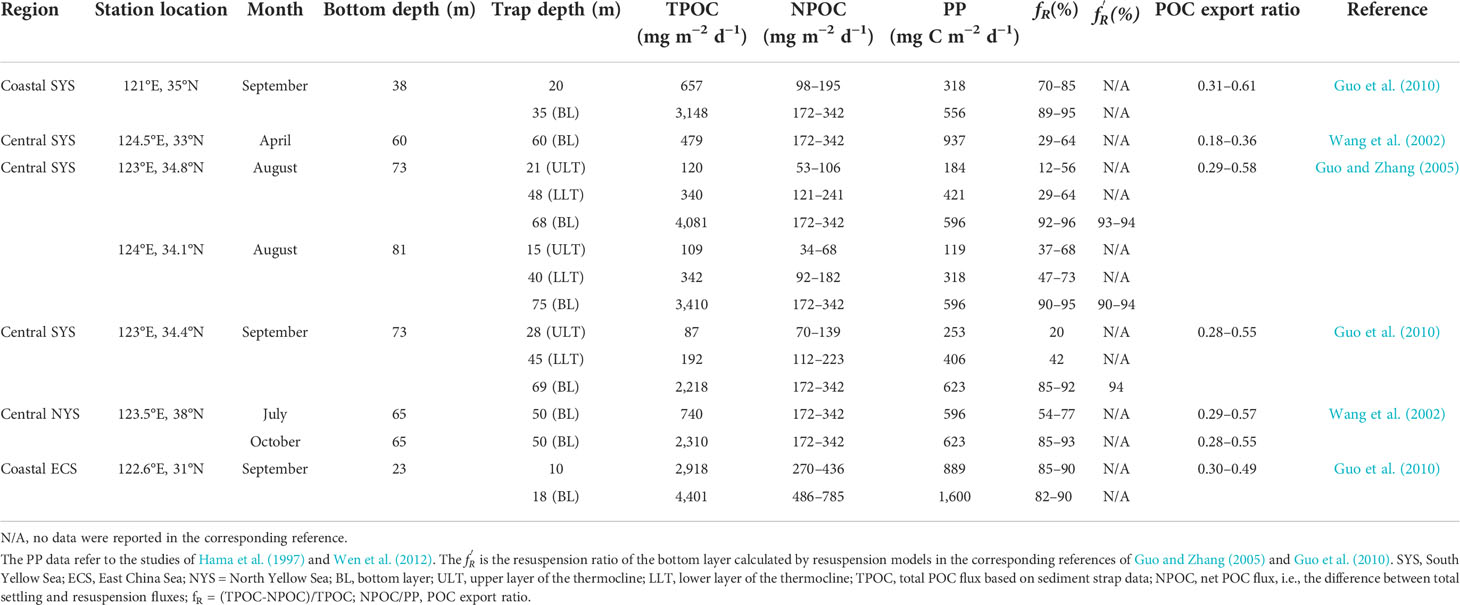
Table 2 Estimated resuspension ratio ( fR ) and particulate organic carbon (POC) export ratio based on reported sediment trap data and depth-integrated primary productivity (PP).
where PPb is the depth-integrated PP at the bottom (i.e., across the water column), and b is the bottom depth (m). Based on Eq. 9, the PPi at both the upper layer and the lower layer of the thermocline (ULT and LLT, respectively) was calculated, as shown in Table 2. Similarly, the net POC fluxes estimated by Guo and Zhang (2005) and by Hung et al. (2013) are actually the net fluxes at the bottom (where the influence of resuspension is largest). Thus, we calculated the net fluxes of the ULT or LLT according to Eq. 9 (Table 2).
As shown in Table 2, the estimated fR varied in the different layers. The lowest fR occurred in the ULT in the central SYS (12% in summer, 20% in autumn). The fR increased in the LLT, with a range of 29%–73%. The fR was high in the ULT in the coastal SYS and the ECS (70%–85% at 20 m, 85%–90% at 10 m) and showed only a slight difference with that at the bottom. Generally, the fR was considerably high at the bottom in both the coastal and the central regions (82%–96%), even in the central SYS during summer. Similarly, the resuspension flux was estimated to account for more than 90% of the total flux using sediment trap data and 234Th/238U disequilibrium in the central SYS during summer (Guo and Zhang, 2005).
Generally, the fR estimated using the vertical mixing model in this study can better represent the variations of the resuspension fraction in the ULT or the LLT. For example, the estimated fR was 7.2% in the central basin during summer (Table 1), which was close to the lowest value (12%) shown in Table 2. The fR in the central SYS during autumn was 20% and 42% at the ULT and LLT, respectively (Table 2), which was comparable to that shown in Table 1 (41.1%). Because reported flux data were unavailable for the Subei coast region, we used data from the coastal ECS as an alternative. The high fR (92.8%–98.8%) shown in Table 1 demonstrated that the influence of resuspension was important throughout the entire water column, which corresponded to the high fR and slight difference between the upper layer (10 m) and bottom layer (18 m) in the coastal ECS shown in Table 2. Additionally, the high turbidity and/or TSM and deepened MLD supported this conclusion (Figure 5; Figures S2, S3).
The residence time (τ) of suspended POM can be used to evaluate resuspension. The standing stocks per unit area divided by flux can provide the residence time in a given layer. The standing stocks were calculated from the depth-integrated POC concentrations (mg m−2) over a given depth. No significant thermocline occurred in the Subei coast region (Figures 5A–D). Generally, the water column can be divided into two categories: the nepheloid layer and non-nepheloid layer. The nepheloid layer shows a near-bottom maximum of TSM reflecting direct disturbance driven by resuspension. The criterion for partitioning the two layers was based on the study of Guo et al. (2010). The nepheloid depth in the coastal SYS and ECS can account for ~47% and 57% of the total water depth, respectively. The shallowest water depth in the Subei coast region was <20 m. This means that the nepheloid layer in the Subei coast region can account for ~60% of the total water depth, and that this fraction might increase further during winter. Accordingly, we assumed that our sampling depths at the subsurface/middle layer and the bottom layer in the Subei coast region were broadly within the estimated non-nepheloid depth and nepheloid depth, respectively. Considering that the Subei coast region is between the two stations in the coastal SYS and ECS (Table 2), we took the average of the values from the two stations to obtain the TPOC and NPOC in the Subei coast region, i.e., 1,788 (TPOC) and 184–316 (NPOC) mg m−2 d−1 in the non-nepheloid depth; 3,775 (TPOC) and 329–564 (NPOC) mg m−2 d−1 in the nepheloid depth. In the central basin, the water column can be divided into the mixing layer (above the MLD) and the bottom layer (below the MLD). Our sampling depths at the subsurface or middle layers in the central basin are broadly within or close to the MLD (Figure S3).
Similarly, we calculated the mixed- and bottom-layer residence times in the central basin (Table S3). Data from the central North Yellow Sea, shown in Table 2, were used for the central SYS because the two regions exhibit similar hydrological characteristics. Because of limited observational data, we estimated the residence time only for summer and autumn. To better constrain the estimation, both the TPOC and NPOC were used to calculate the τ in Table S3 (expressed as τa and τb, respectively).
The calculated τ showed a larger difference between layers in the central basin in comparison with that of the Subei coast region (Table S3). The τ estimated by the TPOC and NPOC in the mixing layer of the central basin (21.3–27.1 and 12.2–75.3 d, respectively) was markedly higher than that in the non-nepheloid layer of the Subei coast region (1.5 and 8.7–15.1 d, respectively). By contrast, the τ in the bottom layer in the central basin was notably diminished (1.1–1.3 d) and equal to that in the Subei coast region (1.1 d). The τ estimated by the NPOC increased substantially, especially in the bottom layer (an increase of 1–3 times that in the mixing layer and of 6–25 times that in the bottom layer). The large increase of τ in the bottom layer was because the NPOC was potentially unaffected by resuspension. Generally, biogenic particles have fluffy and ductile states and relatively light density and thus show a larger τ than resuspended sediment (Simon et al., 2002; Wurl et al., 2009; Verdugo, 2012). The higher resuspension flux could result in a lower residence time. The estimated average residence time in the mixing layer of the central basin (~1–2 months) matched the reported particle residence time obtained via the 210Po/210Pb disequilibria method for the SYS (Zhong et al., 2019) and the offshore ECS (Hung et al., 2000) but was shorter than that reported for the South China Sea (Yang et al., 2006), Southern California Bight (Eppley et al., 1983), and Western North Pacific Ocean (Zhong et al., 2021). Although the potential error could be large (>50%) because the estimated results were based on different datasets, such notable regional variability still indicated the potential influence of resuspension and biological production.
We further compared the estimated results in this study with observed (or measured) datasets in other regions (Table 3). It is noted that these reported resuspension ratios are estimated by sediment trap data in the bottom layer, which can be site-specific and thus variable in a given region (Table 3). For example, the resuspension ratio varies from 27% to 58% as estimated by Hung et al. (2013) to 87%/82% as estimated by Hung et al. (2016) in the offshore ECS (Table 3); however, the corrected POC fluxes reported by Hung et al. (2013) and Hung et al. (2016) are similar (58–63 mg m-2 d-1 vs. 46/47 mg m-2 d-1, Table 3), which indicate that the estimation of resuspension ratio is necessary in correcting trap flux when using sediment trap data. Additionally, the corrected POC fluxes in the offshore ECS are less than the value estimated by Guo and Zhang (2005) in the central SYS (172–342 mg m-2 d-1, Table 2). Bengtsson et al. (1990) found that resuspension occurred only a few times in the entire Swedish lake but more frequently in some specific smaller areas. However, we estimated the integrated resuspension activity across the entire subregions (Subei coast region and central basin) in the SYS. The estimated results in this study can only represent the resuspension episode that occurred during the field surveys. It has been suggested that sediment entrainment rates are highly variable on a short timescale (days to weeks) (Chung et al., 2009). Given the highly variable resuspension rate, the estimated fR in the bottom layer (Table 2) matched the observed datasets (Table 3). The considerably high resuspension rate (300 g m-2 d-1) observed in Lake Arresø is because of the shallow water depth (mean depth 3 m) and the influence of storm events (Kristensen et al., 1992). The estimated fR in the ULT and LLT (Table 2) was lower than those in the bottom layer of coastal ECS, Faeroe–Shetland Channel, and most lakes (Table 3), which was expected because the resuspended material might decrease with the increase of distance above the seafloor, e.g., Kerfoot et al. (2004) found that the log-transformed abundance of Daphnia ephippia in resuspension assemblages correlated negatively with the water column depth. It has been suggested that the pulses of resuspension occurring above the thermocline are governed by thermal conditions and wind events (Evans, 1994). The entrance of the Gulf of Lions (1,000-m trap depth) and Lake Ontario (125-m trap depth) also shows relatively low resuspension ratios (Table 3).
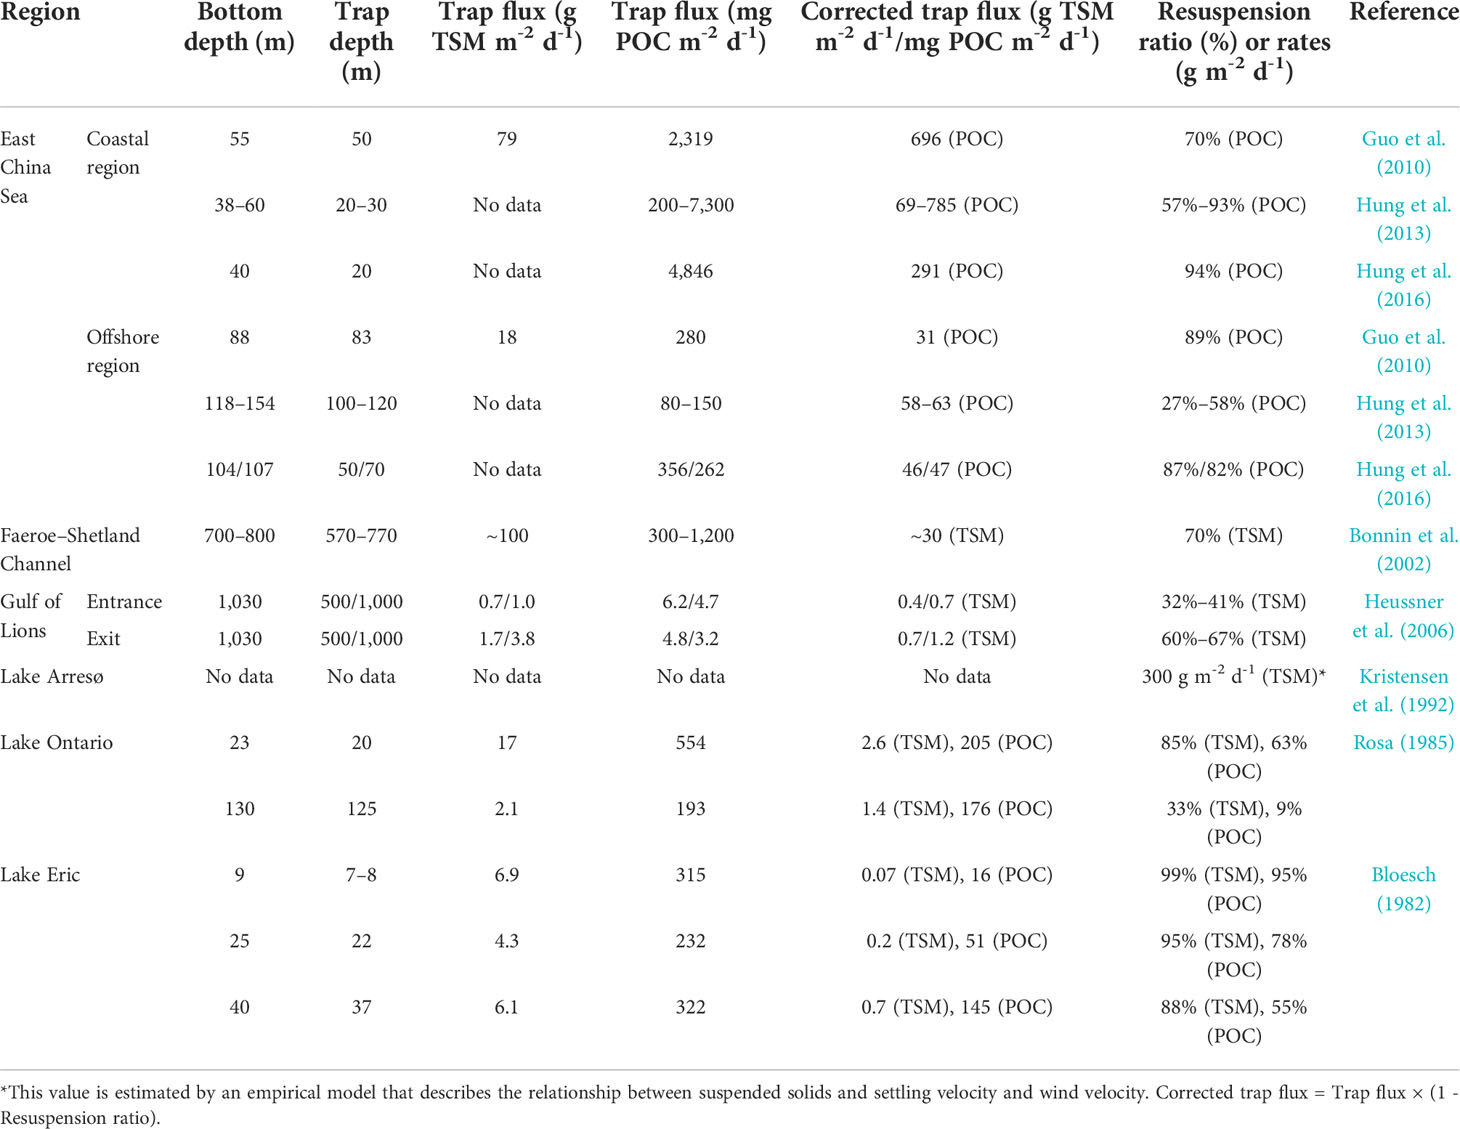
Table 3 Literature trap fluxes and resuspension ratios estimated by total suspended matter (TSM) or particulate organic carbon (POC) data in different regions.
4.2. Uncertainty and potential factors influencing the estimated particulate organic matter flux
It is difficult to obtain an accurate value of Sp , and the uncertainty in estimating the value of Sp is approximately 50% according to Hung et al. (2013). Additionally, the uncertainty is derived from the estimation of POC content of phytoplankton. For example, the estimated Sp in the Subei coast region in summer (5.5 mg L−1 phytoplankton) might be overestimated. If the POC content of phytoplankton is 10%–17%, then the phytoplankton contribution will be 0.6–0.9 mg L−1 POC, whereas the highest POC concentration was ~70 μmol L−1 (i.e., 0.84 mg L−1). However, from the perspective of TSM, the Sp accounted for 43% of sea surface TSM (average: 12.9 mg L−1 in summer), i.e., with a resuspension fraction of 57%. The results of the two estimation methods showed a deviation of ~50% (all contributed by phytoplankton vs. 43% contributed by phytoplankton), which is close to the 50% uncertainty estimated by Hung et al. (2013). Actually, this mixing model did not consider the influence of degradation of biogenic materials. Biological degradation can be substantial in coastal systems, which means that a certain proportion of phytoplankton-derived POC might be degraded after entering the water column. Hence, the 0.6–0.9 mg L−1 POC contributed by phytoplankton was potentially overestimated. Generally, the potential errors in estimating Sp and the POC content of phytoplankton and the influence of biological degradation can result in uncertainty of >50%.
Comparison of the results shown in Tables 1, 2 revealed that the largest difference occurred in summer. For example, the lowest fR was 12%–37% in the ULT in the central basin (Table 2), which was 67%–414% higher than the value in Table 1 (7.2%). By contrast, the difference in estimated fR in autumn was lower, i.e., 41.1% (Table 1) vs. 20% and 42% in the ULT and LLT, respectively (Table 2). The estimated fR was more sensitive to Sp in summer than in other seasons, which demonstrated that the large uncertainty potentially resulted from the variability of Sp . For example, a 14% decrease of Sp (from 1.4 to 1.2 in Table 1) in the central basin in summer resulted in a 183% increase of fR (from 7.2% to 20.4%). The value of 20.4% seemed to match better the estimated value in Table 2. However, in the other seasons, a 20% change of Sp resulted in only a <20% change of fR in the central basin and a <5% change of fR in the Subei coast region. Thus, we speculated that the uncertainty of the estimated fR was <20% in the other seasons; however, accurate estimation of Sp in the central basin during summer is necessary.
The important role of Sp in the central basin demonstrated that biogenic inputs have an important influence on POM dynamics. Thus, the community composition of phytoplankton and the category of biogenic materials could be important factors influencing the estimated fluxes. Guo et al. (2010) found that diatom aggregates, fecal pellets, and tintinnids contributed most of the trapped particles in both the ULT and the LLT in the central SYS and that the fraction of mineral particles increased substantially at the bottom layer. Additionally, Hung et al. (2009) found that the concentrations of particulate carbohydrates (PCHOs) and uronic acids (PURAs) in the northern ECS were associated with phytoplankton abundance and bacterial biomass and that they were higher in summer than in winter. We assumed that the same situation might exist in the Yellow Sea. Because PCHO and PURA show roles similar to that of transparent exopolymer particles, the increased PCHO and PURA potentially increased the coagulation kernel ( β ), as shown in Eq. S7 in Supplementary Materials, which could have further promoted the formation of DetC according to Eq. 3. Further details can be found in Text S3 in Supplementary Materials. This explains why a large amount of biogenic POC existed in the form of detritus carbon (Figures 9A, C). The diatom- or dinoflagellate-dominated phytoplankton community is a potential factor controlling detritus flux, e.g., diatom aggregates act as an important means of transporting carbon and other nutrients from the euphotic zone to the seabed (Hung et al., 2009; Liu et al., 2015; Turner, 2015). The salinity gradient and turbulence can also influence aggregation dynamics (Beauvais et al., 2006; Mari et al., 2012). Hence, the diatom-dominated phytoplankton community and the turbulent hydrology in the coastal regime meant that more detritus carbon formed and sank in the Subei coast region than in the central basin.
The assumption that resuspension was weakest in summer under robust influence of stratification also resulted in potential errors. Although the model results indicated that strong stratification restricted upward diffusion of sediment (Luo et al., 2017) and that the thermal front around the YSCWM affected sediment resuspension by reducing bottom shear stresses (Zhong et al., 2020), the POC sinking flux and resuspension fraction were still high at the bottom layer in the central SYS during summer (Table 2). This meant that other hydrodynamic processes could result in increased resuspension at the bottom, e.g., the southwestern monsoon in summer and the typhoon season in summer and autumn, which might cause strong vertical mixing in these shallow waters (Lee and Chao, 2003; Hung et al., 2010). Bian et al. (2010) found that typhoon-induced waves deepened the thermocline and caused notable resuspension of sediment. Hoshika et al. (2003) found that the monsoon-derived bottom current was highly correlated with the suspended particle flux in the ECS. The decreased resuspension in the ULT and LLT (Table 2) demonstrated that robust stratification might influence the resuspension flux above the thermocline but not at the bottom. It has been suggested that suspended sediments in the shelf areas of the SYS and the ECS are driven by tidal currents (Yuan et al., 2008; Bian et al., 2013b). Moreover, sedimentary conditions such as bedforms and mixed sediment classes might be important in driving the resuspension of sediment (Graber et al., 1989). To better understand the complex processes of resuspension and transport of sediment in this coastal ocean under investigation, additional detailed observations and enhanced modeling methodology are still needed in future comprehensive studies.
4.3. Potential impact of horizontal transport on particulate organic matter dynamics
In addition to vertical processes, cross-shelf horizontal transport related to suspended POM and sediments in the SYS can be important, e.g., terrigenous materials transported from the Yellow River to Cape Chengshan and the Shandong subaqueous delta (Cai et al., 2003; Xing et al., 2014) and nutrients and POM carried by the northeastward branch of the CDW (Beardsley et al., 1985; Chen et al., 2008; Wei et al., 2017). Sediment transport processes can be influenced by many physical forcings, such as the East Asian Monsoon, tides and river discharges, and there is no consensus regarding their relative importance in the shelf areas of the SYS and the ECS (Bian et al., 2013b). Traditionally, suspended sediment in the Changjiang Estuary is thought to be transported by the wind-induced coastal current of the ECS to the coast of Zhejiang Province and/or to the Okinawa Trough mud area in winter (Milliman et al., 1985; Peng and Hu, 1997). However, studies based on stable organic carbon isotopes and rare earth elements showed that the Changjiang Estuary sediment is transported to the central SYS (Cai et al., 2003; Lan et al., 2009). The model result showed that the tidal residual current can drive the Changjiang River Plume to flow northward and then turn offshore, thus transporting freshwater into the interior SYS during winter (Li et al., 2016; Zhu and Wu, 2018). Additionally, it is suggested that wind-driven downwelling in combination with lateral Ekman transport could probably cause sediment dispersion and transport to the shelf (Liu et al., 2007; Dong et al., 2011). The notable seaward-spreading turbidity contours and cold/low-salinity water demonstrated the potential horizontal transport driven by physical forcing in winter (Figures 6A, E, I).
Wei et al. (2020) observed a northeast/southeast transport route of suspended particles in the 10-m layer from the Subei coast to the offshore SYS during spring–autumn; however, the range of spread might be limited owing to the evolution of the YSCWM. The YSCWM thermal front, observed from spring–autumn, potentially affects the distribution and transport of suspended sediment (Zhong et al., 2020). The temperature contour of 9°C and the contours of 11°C–21°C spread from the central SYS to the area near 122°E in spring and summer, respectively (Figures 6B, C). The observed turbidity/TSM fronts (50 mg L−1) were also located in the area near 122°E (Figures 6J,L). Therefore, the YSCWM thermal front might prevent seaward extension of suspended particles. Dong et al. (2011) also observed that suspended sediments appeared trapped on the shallow water side of the YSCWM front when transported from the Subei coast to the central SYS.
The resuspension and horizontal transport were reasonably weak in summer (Figure 6K); however, the high-POC/high-PN and high-POC% sea surface patches spreading from the southwest SYS to the central SYS were notable (Figures 3G, K, O). These patches matched the northeastward route of extension of CDW from the Changjiang Estuary to Jeju Island (Beardsley et al., 1985; Lie et al., 2003). The detached CDW can be verified by the low-salinity water to the east of 123.5°E (Figure 6G). Wind, tide-induced mixing, and Changjiang water discharge play important roles in detaching low-salinity water from the CDW plume toward the SYS and Jeju Island (Chen et al., 2008; Moon et al., 2009). The detached CDW creates a condition with moderate nutrients and adequate light, resulting in high primary production and Chl a in surrounding offshore regions. Therefore, the observed high-POC% sea surface patches might result from enhanced local biological production that provides large amounts of biogenic materials.
Generally, we considered that cross-shelf horizontal transport (from the Subei coast to the central basin) principally influenced POM dynamics in the area to the west of 122°E (deeper than 20 m) during spring and autumn and that this area extended to 122.5°E during winter. The horizontal transport can result in potential overestimation of the resuspension fraction. For example, if the turbidity contours were vertical lines (i.e., no seaward spread) at the location of 122°E, the TSM would be 50–75 mg L−1 and 20–25 mg L−1 in the bottom (~20 m) and upper (<14 m) layers, respectively (Figure 6A), similar to the situation in spring (i.e., ~50 mg L−1 and 20–25 mg L−1 in the bottom and upper layers, respectively). This indicates that the increased TSM flux in the upper layer at the location of 122°E might be contributed by the flux of horizontal transport rather than by resuspension flux. The model results showed that the fR was 98.8% in winter and 92.8% in spring (Table 1). By assuming that the increased fR was contributed totally by horizontal transport, the calculated contribution of resuspension might be overestimated by 6%. The particle deposition rate from the water column and the horizontal transportation rate were estimated as 0.33 and 0.02 g cm−2 year−1 in the shelf edge of the ECS (Iseki et al., 2003), i.e., ~6% of depositing particles were transported to the offshore area, which matched our estimation. Additionally, it is estimated that cross-boundary transport contributes ~5% of the organic carbon transported to the continental slope (Chen, 2010; Song et al., 2016). The location at 122°E was somewhat distant from the shallowest area (~15 m) in the Subei coast region. Therefore, the influence of tidal currents should be considerable, inducing substantial vertical fluxes after the horizontal transport. Ignoring the potential influence of horizontal transport, the resuspension ratio may have been overestimated by >10% in the Subei coast region.
This is a rough estimation because we have no detailed hydrodynamic parameters and methods with which to make a quantitative assessment. Horizontal transport includes sediment transport from land to the ocean and sediment deposition and remobilization in the marine environment (Anderson et al., 2018). The sediment class influences deposition because coarse-grained sediments will deposit quickly, while only fine-grained types will be transported to reach the central SYS (Dong et al., 2011). The composition and age of organic carbon in sediments reflect the potential sediment transport from land to the ocean (Li et al., 2012). The benthic organic carbon mineralization is also an important factor in driving sediment storage/remobilization, and a higher rate of mineralization means that more POM can be decomposed during transportation (Zhao et al., 2018). More comprehensive assessment of these related processes is necessary to constrain the potential influence of horizontal transport.
4.4. Comparison with other marginal seas
The source and fate of POM in the SYS reflect substantial cross-shelf transport and vertical export, which help elucidate the roles of marginal seas as a sink for continental inputs and biological production and a source for offshore open regions (Heussner et al., 2006). The Subei coast, as a shallow coastal area, is an important sink of POM received via large depositions of sediment from the Changjiang River and the Old Yellow River (Liu et al., 2013b; Qiao et al., 2017), freshwater inputs from the Subei local rivers (Zhu and Wu, 2018), and biogenic materials from algal blooms (Fan et al., 2015; Wang et al., 2015). The sandy and tidal hydrological characteristics of the region result in intensive vertical and lateral transport of sediments and biogenic elements and make it a substantial source of POM for the central basin (Song et al., 2018; Wei et al., 2020).
The role and function of the Subei coast are similar to those of the typical estuaries and banks in the other marginal seas. The substantial sediment plume formed in the Changjiang Estuary and the adjacent Changjiang bank can extend southeastward to the open sea driven by the cross-shelf circulation (Lie et al., 2003; Luo et al., 2017). The high-nutrient inputs from the CDW are highly correlated with the high primary production, which contributes to the large amounts of biogenic POM in the Changjiang Estuary and adjacent offshore area (Zhou et al., 2008; Zhu et al., 2009). This off-shelf transport and seasonal variability of riverine and marine-derived POM can be considerable in the other river-dominated ocean margins, e.g., the Mississippi River delta and the Gulf of Mexico (Trefry et al., 1994; Wang et al., 2004; Corbett et al., 2006), U.S. West Coast (Hwang et al., 2005; Mollenhauer and Eglinton, 2007), Chesapeake Bay (Fisher et al., 1998; Zhang and Blomquist, 2018), and Baltic Sea (Winogradow et al., 2019; Nilsson et al., 2021).
From a global perspective, the carbon budgets in the SYS and ECS are under the influence of western boundary currents. Another typical marginal sea in a western boundary current system is the South Atlantic Bight. The robust freshwater discharge and tidal dynamics facilitate vertical mixing and resuspension of fine-grained particles in the shelf region of the South Atlantic Bight (Lee et al., 1989). The increased nutrient loads via river discharge are reasonable for the high PP in the inner-shelf areas [1,698 mg C m−2 d−1 (Chen, 2010)], which matches the value in the coastal ECS (Table 2). By contrast, eastern boundary current systems, which are usually zones of upwelling, exhibit very high potential productivity of >3,000 mg C m−2 day−1 (Carr, 2001), i.e., twice that of the coastal ECS and five times that of the SYS (Table 2).
Most river-dominated ocean margins show seasonal hypoxia/deoxygenation in adjacent offshore stratified zones, which means that large amounts of terrigenous and marine POM can be decomposed to fuel oxygen depletion. However, seasonal hypoxia is not evident in the stratified central SYS. The estimated sediment oxygen consumption in the central SYS was significantly lower than that of typical hypoxia zones (Song et al., 2016), which demonstrates that the remineralization of biogenic POM provided by spring blooms might be limited. Additionally, cross-shelf transport between the Subei coast and the central basin could be restricted by the thermal front around the YSCWM (Wei et al., 2016; Zhong et al., 2020). Therefore, systematic evaluation of the sources and sinks of POM in the SYS could provide a reference for the biogeochemical cycle of organic carbon and oxygen consumption in shelf waters. Further efforts should be dedicated to clarifying the influence of coupled biological–physical oceanographic processes on the POM budgets in these marginal seas.
5. Summary and implications
Based on field observations and modeling, we estimated the influence of coupled biological–physical oceanographic processes on potential POM dynamics, fluxes, and horizontal transport in the SYS. The Subei coast region had considerably higher POM than that found in other subregions of the SYS. The C/N ratio in the Subei coast region deviated more or less from the Redfield ratio during winter and spring, indicating the potential impact of robust physical forcing. The effect of biological processes was notable in the central basin with the C/N ratio broadly matching the Redfield ratio, which can also be proven by the vertical distribution of POC%.
The modeled biogenic POC and PN showed substantial temporal variations, which all peaked in spring and summer. Detritus carbon contributed the most biogenic POC (up to 78%) and phytoplankton nitrogen contributed the most biogenic PN (31%–78%) during spring and summer. The sensitivity analysis results indicated that biological production was affected by environmental factors (temperature, light, and DIN) and key kinetics (nutrient uptake rate, aggregation, and grazing rate). The production of PN was more sensitive to the change of DIN in the nutrient-depleted central basin than in the nutrient-rich Subei coast region. The production of POC was principally controlled by temperature and light. With greater aggregation and a higher grazing rate, the Subei coast region exhibited more detritus and heterotroph carbon than those found in the central basin. The modeled C/N ratio also showed substantial seasonal variability, which deviated from the Redfield ratio in winter and then approached it with the progression of the seasons.
The fR estimated by ecosystem model optimization matched well with the result calculated by the statistical approach in the vertical mixing model. The resuspension fraction peaked in winter and decreased to a minimum in summer, with the range varying between the seasons from >90% to ~50% in the Subei coast region and from ~50% to <10% in the central basin. Through comparison with reported sediment trap and PP data, we found that the estimated resuspension fraction showed large uncertainty (>50%) in summer because of potential errors in model parameter estimation and the influence of other unexplored biophysical processes (e.g., biological degradation, upwelling, and monsoons); however, the degree of uncertainty was lower in the other seasons (<20%).
Cross-shelf horizontal transport principally influenced POM dynamics in the area to the west of 122°E (deeper than 20 m) during spring and autumn, and this area extended to the west of 122.5°E during winter. We estimated that the contribution of resuspension was potentially overestimated by >10% in the Subei coast region because of the influence of horizontal transport. Given the complex characteristics of resuspension and horizontal transport, acquisition of additional observational data over a larger spatiotemporal scale will be necessary to establish an integrated network of the carbon budget in the SYS.
Data availability statement
The raw data of particulate parameters reported in this study is available at figshare.com via https://doi.org/10.6084/m9.figshare.20486022.
Author contributions
WZ designed the field surveys and supervised the research. SY maintained the operation of instrument. CG finalized the data set, designed the modeling and drafted an early version of the manuscript. YN contributed to the autumn data collection. YN and CL supported the satellite-derived data. All authors contributed to discussion and revision of the manuscript.
Funding
This research was jointly funded by the National Key Research and Development Program of China (contract no. 2020YFA0608301) and the National Natural Science Foundation of China (grant nos. 42141001 and 91751207).
Acknowledgments
Sampling surveys were supported by the National Natural Science Foundation of China (grant nos. 41649901, 41749901, and 41849901) through ship-time sharing projects via Open Research Cruises conducted in the Bohai and Yellow seas onboard R/V Dongfanghong 2 in 2017–2018 (cruise nos. NORC2017-01 and NORC2018-01) and onboard R/V Lanhai 101 in October 2019 (cruise no. NORC2019-01). Jing Lang is appreciated for field sampling and most laboratory determination. We thank James Buxton for editing the English text of a draft of this paper and the reviewers for their thoughtful and constructive comments, which improved the quality of this paper.
Conflict of interest
The authors declare that the research was conducted in the absence of any commercial or financial relationships that could be construed as a potential conflict of interest.
Publisher’s note
All claims expressed in this article are solely those of the authors and do not necessarily represent those of their affiliated organizations, or those of the publisher, the editors and the reviewers. Any product that may be evaluated in this article, or claim that may be made by its manufacturer, is not guaranteed or endorsed by the publisher.
Supplementary material
The Supplementary Material for this article can be found online at: https://www.frontiersin.org/articles/10.3389/fmars.2022.919423/full#supplementary-material
References
Anderson C., Murray R., Dunlea A., Giosan L., Kinsley C., McGee D., et al. (2018). Climatically driven changes in the supply of terrigenous sediment to the East China Sea. Geochem. Geophys. Geosyst. 19, 2463–2477. doi: 10.1029/2017GC007339
Bale A. J., Morris A. W. (1998). Organic carbon in suspended particulate material in the North Sea: Effect of mixing resuspended and background particles. Continent. Shelf Res. 18, 1333–1345. doi: 10.1016/S0278-4343(98)00046-6
Beardsley R., Limeburner R., Yu H., Cannon G. (1985). Discharge of the Changjiang (Yangtze River) into the East China sea. Continent. Shelf Res. 4, 57–76. doi: 10.1016/0278-4343(85)90022-6
Beauvais S., Pedrotti M. L., Egge J., Iversen K., Marrasé C. (2006). Effects of turbulence on TEP dynamics under contrasting nutrient conditions: implications for aggregation and sedimentation processes. Mar. Ecol. Prog. Ser. 323, 47–57. doi: 10.3354/meps323047
Bengtsson L., Hellström T., Rakoczi L. (1990). Redistribution of sediments in three Swedish lakes. Hydrobiologia 192, 167–181. doi: 10.1007/BF00006012
Bianchi T. S., Bauer J. E. (2011). “Particulate organic carbon cycling and transformation,” in Treatise on estuarine and coastal science volume 5: Biogeochemistry. Eds. Wolanski E., McLusky D. (Waltham:Academic Press), 69–117. doi: 10.1016/B978-0-12-374711-2.00503-9
Bian C., Jiang W., Greatbatch R. J., Ding H. (2013a). The suspended sediment concentration distribution in the Bohai Sea, Yellow Sea and East China Sea. J. Ocean Univ. China 12, 345–354. doi: 10.1007/s11802-013-1916-3
Bian C., Jiang W., Quan Q., Wang T., Greatbatch R. J., Li W. (2013b). Distributions of suspended sediment concentration in the Yellow Sea and the East China Sea based on field surveys during the four seasons of 2011. J. Mar. Syst. 121, 24–35. doi: 10.1016/j.jmarsys.2013.03.013
Bian C., Jiang W., Song D. (2010). Terrigenous transportation to the Okinawa Trough and the influence of typhoons on suspended sediment concentration. Continent. Shelf Res. 30, 1189–1199. doi: 10.1016/j.csr.2010.03.008
Bi Q., Du J., Wu Y., Zhou J., Zhang J. (2013). Particulate organic carbon export flux by 234Th/238U disequilibrium in the continental slope of the East China Sea. Acta Oceanol. Sin. 32 (10), 67–73. doi: 10.1007/s13131-013-0303-7
Bloesch J. (1982). Inshore–offshore sedimentation differences resulting from resuspension in the eastern basin of Lake Erie. Can. J. Fish. Aquat. Sci. 39, 748–759. doi: 10.1139/f82-103
Bloesch J. (1994). A review of methods used to measure sediment resuspension. Hydrobiologia 284, 13–18. doi: 10.1007/BF00005728
Bonnin J., Van Raaphorst W., Brummer G.-J., van Haren H., Malschaert H. (2002). Intense mid-slope resuspension of particulate matter in the Faeroe–Shetland channel: short-term deployment of near-bottom sediment traps. Deep Sea Res. Part I: Oceanogr. Res. Pap. 49, 1485–1505. doi: 10.1016/S0967-0637(02)00030-4
Brink K. H. (2016). Cross-shelf exchange. Annu. Rev. Mar. Sci. 8, 59–78. doi: 10.1146/annurev-marine-010814-015717
Cai D., Shi X., Zhou W., Liu W., Zhang S., Cao Y., et al. (2003). Sources and transportation of suspended matter and sediment in the southern Yellow Sea: Evidence from stable carbon isotopes. Chin. Sci. Bull. 48 (S1), 21–29. doi: 10.1007/BF02900936
Carr M.-E. (2001). Estimation of potential productivity in Eastern boundary currents using remote sensing. Deep Sea Res. Part II: Topical Stud. Oceanogr. 49, 59–80. doi: 10.1016/S0967-0645(01)00094-7
Chang J., Shiah F.-K., Gong G.-C., Chiang K. P. (2003). Cross-shelf variation in carbon-to-chlorophyll a ratios in the East China Sea, summer 1998. Deep Sea Res. Part II: Topical Stud. Oceanogr. 50, 1237–1247. doi: 10.1016/S0967-0645(03)00020-1
Chen C. A. (2009). Chemical and physical fronts in the Bohai, Yellow and East China seas. J. Mar. Syst. 78, 394–410. doi: 10.1016/j.jmarsys.2008.11.016
Chen C.-T. A. (2010). “Cross-boundary exchanges of carbon and nitrogen in continental margins,” in Carbon and nutrient fluxes in continental margins: A global synthesis. global change – the IGBP series. Eds. Liu K.-K., Atkinson L., Quiñones R., Talaue-McManus L. (Berlin, Heidelberg: Springer Berlin Heidelberg), 561–574. doi: 10.1007/978-3-540-92735-8_13
Chen C., Xue P., Ding P., Beardsley R. C., Xu Q., Mao X., et al. (2008). Physical mechanisms for the offshore detachment of the Changjiang diluted water in the East China Sea. J. Geophys. Res. 113 (C2), C02002. doi: 10.1029/2006JC003994
Chu P. C., Fralick C. R., Haeger S. D., Carron M. J. (1997). A parametric model for the Yellow Sea thermal variability. J. Geophys. Res. 102 (C5), 10499–10507. doi: 10.1029/97JC00444
Chung E. G., Bombardelli F. A., Schladow S. G. (2009). Sediment resuspension in a shallow lake. Water Resour. Res. 45, W05422. doi: 10.1029/2007WR006585
Corbett D. R., McKee B., Allison M. (2006). Nature of decadal-scale sediment accumulation on the western shelf of the Mississippi River delta. Continent. Shelf Res. 26, 2125–2140. doi: 10.1016/j.csr.2006.07.012
Dong L., Guan W., Chen Q., Li X., Liu X., Zeng X. (2011). Sediment transport in the Yellow Sea and East China Sea. Estuarine Coast. Shelf Sci. 93, 248–258. doi: 10.1016/j.ecss.2011.04.003
Ducklow H. W., Steinberg D. K., Buesseler K. O. (2001). Upper ocean carbon export and the biological pump. Oceanography 14 (4), 50–58. doi: 10.5670/oceanog.2001.06
Engel A., Passow U. (2001). Carbon and nitrogen content of transparent exopolymer particles (TEP) in relation to their alcian blue adsorption. Mar. Ecol. Prog. Ser. 219, 1–10. doi: 10.3354/meps219001
Eppley R. W., Renger E. H., Betzer P. R. (1983). The residence time of particulate organic carbon in the surface layer of the ocean. Deep Sea Res part A. Oceanogr. Res. Pap. 30, 311–323. doi: 10.1016/0198-0149(83)90013-4
Evans R. D. (1994). Empirical evidence of the importance of sediment resuspension in lakes. Hydrobiologia 284, 5–12. doi: 10.1007/BF00005727
Fan S., Fu M., Wang Z., Zhang X., Song W., Li Y., et al. (2015). Temporal variation of green macroalgal assemblage on Porphyra aquaculture rafts in the Subei Shoal, China. Estuarine Coast. Shelf Sci. 163, 23–28. doi: 10.1016/j.ecss.2015.03.016
Fisher T. R., Hagy J. D., Rochelle-Newall E. (1998). Dissolved and particulate organic carbon in Chesapeake Bay. Estuaries 21, 215–229. doi: 10.2307/1352470
Fu M., Wang Z., Li Y., Li R., Sun P., Wei X., et al. (2009). Phytoplankton biomass size structure and its regulation in the southern Yellow Sea (China): Seasonal variability. Continent. Shelf Res. 29, 2178–2194. doi: 10.1016/j.csr.2009.08.010
Gattuso J.-P., Frankignoulle M., Wollast R. (1998). Carbon and carbonate metabolism in coastal aquatic ecosystems. Annu. Rev. Ecol. Syst. 29, 405–434. doi: 10.1146/annurev.ecolsys.29.1.405
Geider R. J. (1993). Quantitative phytoplankton physiology: implications for primary production and phytoplankton growth. ICES Mar. Sci. Symp. 197, 52–62.
Geider R. J., Maclntyre H. L., Kana T. M. (1998). A dynamic regulatory model of phytoplanktonic acclimation to light, nutrients, and temperature. Limnol. Oceanogr. 43, 679–694. doi: 10.4319/lo.1998.43.4.0679
Graber H. C., Beardsley R. C., Grant W. D. (1989). Storm-generated surface waves and sediment resuspension in the East China and Yellow seas. J. Phys. Oceanogr. 19, 1039–1059. doi: 10.1175/1520-0485(1989)0192.0.CO;2
Guo X., Zhang Y. (2005). Particle flux through the Huanghai Sea cold water mass. Acta Oceanol. Sin. 24 (5), 78–88.
Guo C., Zhang G., Sun J., Leng X., Xu W., Wu C., et al. (2020). Seasonal responses of nutrient to hydrology and biology in the southern Yellow Sea. Continent. Shelf Res. 206, 104207. doi: 10.1016/j.csr.2020.104207
Guo X., Zhang Y., Zhang F., Cao Q. (2010). Characteristics and flux of settling particulate matter in neritic waters: The southern Yellow Sea and the East China Sea. Deep Sea Res. Part II: Topical Stud. Oceanogr. 57, 1058–1063. doi: 10.1016/j.dsr2.2010.02.007
Hama T., Shin K., Handa N. (1997). Spatial variability in the primary productivity in the East China Sea and its adjacent waters. J. Oceanogr. 53, 41–51. doi: 10.1007/BF02700748
Hedges J. I., Keil R. G., Benner R. (1997). What happens to terrestrial organic matter in the ocean? Organic Geochem. 27, 195–212. doi: 10.1016/S0146-6380(97)00066-1
Heussner S., de Madron X. D., Calafat A., Canals M., Carbonne J., Delsaut N., et al. (2006). Spatial and temporal variability of downward particle fluxes on a continental slope: Lessons from an 8-yr experiment in the Gulf of Lions (NW Mediterranean). Mar. Geol. 234, 63–92. doi: 10.1016/j.margeo.2006.09.003
Hoshika A., Tanimoto T., Mishima Y., Iseki K., Okamura K. (2003). Variation of turbidity and particle transport in the bottom layer of the East China Sea. Deep Sea Res. Part II: Topical Stud. Oceanogr. 50, 443–455. doi: 10.1016/S0967-0645(02)00462-9
Hung C.-C., Chen Y.-F., Hsu S.-C., Wang K., Chen J., Burdige D. J. (2016). Using rare earth elements to constrain particulate organic carbon flux in the East China Sea. Sci. Rep. 6, 33880. doi: 10.1038/srep33880
Hung C.-C., Gong G.-C., Chiang K.-P., Chen H.-Y., Yeager K. M. (2009). Particulate carbohydrates and uronic acids in the northern East China Sea. Estuarine Coast. Shelf Sci. 84, 565–572. doi: 10.1016/j.ecss.2009.07.025
Hung C.-C., Gong G.-C., Chou W.-C., Chung C.-C., Lee M.-A., Chang Y., et al. (2010). The effect of typhoon on particulate organic carbon flux in the southern East China Sea. Biogeosciences 7, 3007–3018. doi: 10.5194/bg-7-3007-2010
Hung J.-J., Lin P.-L., Liu K.-K. (2000). Dissolved and particulate organic carbon in the southern East China Sea. Continent. Shelf Res. 20, 545–569. doi: 10.1016/S0278-4343(99)00085-0
Hung C.-C., Tseng C.-W., Gong G.-C., Chen K.-S., Chen M.-H., Hsu S.-C. (2013). Fluxes of particulate organic carbon in the East China Sea in summer. Biogeosciences 10, 6469–6484. doi: 10.5194/bg-10-6469-2013
Hu L., Shi X., Guo Z., Wang H., Yang Z. (2013). Sources, dispersal and preservation of sedimentary organic matter in the Yellow Sea: The importance of depositional hydrodynamic forcing. Mar. Geol. 335, 52–63. doi: 10.1016/j.margeo.2012.10.008
Hwang J., Druffel E. R., Eglinton T. I. (2010). Widespread influence of resuspended sediments on oceanic particulate organic carbon: Insights from radiocarbon and aluminum contents in sinking particles. Global Biogeochem. Cycles 24, GB4016. doi: 10.1029/2010GB003802
Hwang J., Druffel E. R., Komada T. (2005). Transport of organic carbon from the California coast to the slope region: A study of Δ14C and δ13C signatures of organic compound classes. Global Biogeochem. Cycles 19, GB2018. doi: 10.1029/2004GB002422
Hwang J., Eglinton T. I., Krishfield R. A., Manganini S. J., Honjo S. (2008). Lateral organic carbon supply to the deep Canada basin. Geophys. Res. Lett. 35, L11607. doi: 10.1029/2008GL034271
Iseki K., Okamura K., Kiyomoto Y. (2003). Seasonality and composition of downward particulate fluxes at the continental shelf and Okinawa Trough in the East China Sea. Deep Sea Res. Part II: Topical Stud. Oceanogr. 50, 457–473. doi: 10.1016/S0967-0645(02)00468-X
Jin J., Liu S. M., Ren J. L., Liu C. G., Zhang J., Zhang G. L. (2013). Nutrient dynamics and coupling with phytoplankton species composition during the spring blooms in the Yellow Sea. Deep Sea Res. Part II: Topical Stud. Oceanogr. 97, 16–32. doi: 10.1016/j.dsr2.2013.05.002
Kao S., Lin F., Liu K. (2003). Organic carbon and nitrogen contents and their isotopic compositions in surficial sediments from the East China Sea shelf and the southern Okinawa Trough. Deep Sea Res. Part II: Topical Stud. Oceanogr. 50, 1203–1217. doi: 10.1016/S0967-0645(03)00018-3
Kerfoot W. C., Budd J. W., Eadie B. J., Vanderploeg H. A., Agy M. (2004). Winter storms: Sequential sediment traps record Daphnia ephippial production, resuspension, and sediment interactions. Limnol. Oceanogr. 49, 1365–1381. doi: 10.4319/lo.2004.49.4_part_2.1365
Kiorboe T. (1998). Small-scale turbulence, marine snow formation, and planktivorous feeding. Sci. Marina 61, 141–158. doi: 10.1023/A:1018427509311
Kristensen P., Søndergaard M., Jeppesen E. (1992). Resuspension in a shallow eutrophic lake. Hydrobiologia 228, 101–109. doi: 10.1007/BF00006481
Lan X., Zhang X., Zhao G., Zhang Z. (2009). Distributions of rare earth elements in sediments from core NT1 of the South Yellow Sea and their provenance discrimination. Geochimica 38, 123–132. doi: 10.1016/S1874-8651(10)60080-4
Lee H.-J., Chao S.-Y. (2003). A climatological description of circulation in and around the East China Sea. Deep Sea Res. Part II: Topical Stud. Oceanogr. 50, 1065–1084. doi: 10.1016/S0967-0645(03)00010-9
Lee H. J., Chough S. K. (1989). Sediment distribution, dispersal and budget in the Yellow Sea. Mar. Geol. 87, 195–205. doi: 10.1016/0025-3227(89)90061-3
Lee T. N., Williams E., Wang J., Evans R., Atkinson L. (1989). Response of South Carolina continental shelf waters to wind and Gulf Stream forcing during winter of 1986. J. Geophys. Res. 94 (C8), 10715–10754. doi: 10.1029/JC094iC08p10715
Li X., Bianchi T. S., Allison M. A., Chapman P., Mitra S., Zhang Z., et al. (2012). Composition, abundance and age of total organic carbon in surface sediments from the inner shelf of the East China Sea. Mar. Chem. 145, 37–52. doi: 10.1016/j.marchem.2012.10.001
Lie H.-J., Cho C.-H., Lee J.-H., Lee S. (2003). Structure and eastward extension of the Changjiang River plume in the East China Sea. J. Geophys. Res. 108 (C3), 3077. doi: 10.1029/2001JC001194
Liénart C., Savoye N., David V., Ramond P., Tress P. R., Hanquiez V., et al. (2018). Dynamics of particulate organic matter composition in coastal systems: Forcing of spatio-temporal variability at multi-systems scale. Prog. Oceanogr. 162, 271–289. doi: 10.1016/j.pocean.2018.02.026
Lin C., Ning X., Su J., Lin Y., Xu B. (2005). Environmental changes and the responses of the ecosystems of the Yellow Sea during 1976–2000. J. Mar. Syst. 55, 223–234. doi: 10.1016/j.jmarsys.2004.08.001
Li G., Qiao L., Dong P., Ma Y., Xu J., Liu S., et al. (2016). Hydrodynamic condition and suspended sediment diffusion in the Yellow Sea and East China Sea. J. Geophys. Res.: Oceans 121, 6204–6222. doi: 10.1002/2015JC011442
Liu H., Huang Y., Zhai W., Guo S., Jin H., Sun J. (2015). Phytoplankton communities and its controlling factors in summer and autumn in the southern Yellow Sea, China. Acta Oceanol. Sin. 34 (2), 114–123. doi: 10.1007/s13131-015-0620-0
Liu D., Keesing J. K., He P., Wang Z., Shi Y., Wang Y. (2013). The world's largest macroalgal bloom in the Yellow Sea, China: formation and implications. Estuarine Coast. Shelf Sci. 129, 2–10. doi: 10.1016/j.ecss.2013.05.021
Liu D., Keesing J. K., Xing Q., Shi P. (2009). World’s largest macroalgal bloom caused by expansion of seaweed aquaculture in China. Mar. Pollut. Bull. 58, 888–895. doi: 10.1016/j.marpolbul.2009.01.013
Liu J., Kong X., Saito Y., Liu J. P., Yang Z., Wen C. (2013b). Subaqueous deltaic formation of the Old Yellow River (AD 1128–1855) on the western South Yellow Sea. Mar. Geol. 344, 19–33. doi: 10.1016/j.margeo.2013.07.003
Liu J., Xu K., Li A., Milliman J., Velozzi D., Xiao S., et al. (2007). Flux and fate of Yangtze River sediment delivered to the East China Sea. Geomorphology 85, 208–224. doi: 10.1016/j.geomorph.2006.03.023
Longhurst A. (1995). Seasonal cycles of pelagic production and consumption. Prog. Oceanogr. 36, 77–167. doi: 10.1016/0079-6611(95)00015-1
Luo Z., Zhu J., Wu H., Li X. (2017). Dynamics of the sediment plume over the Yangtze bank in the Yellow and East China seas. J. Geophys. Res.: Oceans 122, 10073–10090. doi: 10.1002/2017JC013215
Mari X., Torreton J. P., Claire B. T. T., Bouvier T., Thuoc C. V., Lefebvre J. P., et al. (2012). Aggregation dynamics along a salinity gradient in the Bach Dang Estuary, north Vietnam. Estuarine Coast. Shelf Sci. 96, 151–158. doi: 10.1016/j.ecss.2011.10.028
Martiny A. C., Pham C. T., Primeau F. W., Vrugt J. A., Moore J. K., Levin S. A., et al. (2013b). Strong latitudinal patterns in the elemental ratios of marine plankton and organic matter. Nat. Geosci. 6, 279–283. doi: 10.1038/NGEO1757
Martiny A., Vrugt J. A., Primeau F. W., Lomas M. W. (2013a). Regional variation in the particulate organic carbon to nitrogen ratio in the surface ocean. Global Biogeochem. Cycles 27, 723–731. doi: 10.1002/gbc.20061
McKee B. A., Aller R., Allison M., Bianchi T., Kineke G. (2004). Transport and transformation of dissolved and particulate materials on continental margins influenced by major Rivers: benthic boundary layer and seabed processes. Continent. Shelf Res. 24, 899–926. doi: 10.1016/j.csr.2004.02.009
Meyers P. A. (2003). Applications of organic geochemistry to paleolimnological reconstructions: a summary of examples from the Laurentian Great Lakes. Organic Geochem. 34, 261–289. doi: 10.1016/S0146-6380(02)00168-7
Milliman J. D., Farnsworth K. L. (2011). River discharge to the coastal ocean: A global synthesis (UK: Cambridge University Press), 394pp. doi: 10.1017/CBO9780511781247
Milliman J. D., Huang-ting S., Zuo-sheng Y., Mead R. H. (1985). Transport and deposition of river sediment in the Changjiang estuary and adjacent continental shelf. Continent. Shelf Res. 4, 37–45. doi: 10.1016/0278-4343(85)90020-2
Mollenhauer G., Eglinton T. I. (2007). Diagenetic and sedimentological controls on the composition of organic matter preserved in California borderland basin sediments. Limnol. Oceanogr. 52, 558–576. doi: 10.2307/40006106
Moon J.-H., Pang I.-C., Yoon J.-H. (2009). Response of the Changjiang diluted water around Jeju Island to external forcings: A modeling study of 2002 and 2006. Continent. Shelf Res. 29, 1549–1564. doi: 10.1016/j.csr.2009.04.007
Nilsson M. M., Hylén A., Ekeroth N., Kononets M. Y., Viktorsson L., Almroth-Rosell E., et al. (2021). Particle shuttling and oxidation capacity of sedimentary organic carbon on the Baltic Sea system scale. Mar. Chem. 232, 103963. doi: 10.1016/j.marchem.2021.103963
Niu Y., Liu C., Lu X., Zhu L., Sun Q., Wang S. (2021). Phytoplankton blooms and its influencing environmental factors in the southern Yellow Sea. Regional Stud. Mar. Sci. 47, 101916. doi: 10.1016/j.rsma.2021.101916
Oguri K., Matsumoto E., Yamada M., Saito Y., Iseki K. (2003). Sediment accumulation rates and budgets of depositing particles of the East China Sea. Deep Sea Res. Part II: Topical Stud. Oceanogr. 50, 513–528. doi: 10.1016/S0967-0645(02)00465-4
Peleg M., Normand M. D., Corradini M. G. (2012). ). The Arrhenius Equation revisited. Crit. Rev. Food Sci. Nutr. 52, 830–851. doi: 10.1080/10408398.2012.667460
Peng M.-C., Hu D.-X. (1997). Outflow of suspended materials from the Changjiang River mouth. Chin. J. Oceanol. Limnol. 15, 258–263. doi: 10.1007/BF02850882
Qiao S., Shi X., Wang G., Zhou L., Hu B., Hu L., et al. (2017). Sediment accumulation and budget in the Bohai Sea, Yellow Sea and East China Sea. Mar. Geol. 390, 270–281. doi: 10.1016/j.margeo.2017.06.004
Rosa F. (1985). Sedimentation and sediment resuspension in Lake Ontario. J. Great Lakes Res. 11, 13–25. doi: 10.1016/S0380-1330(85)71738-8
Schartau M., Engel A., Schröter J., Thoms S., Völker C., Wolf-Gladrow D. (2007). Modelling carbon overconsumption and the formation of extracellular particulate organic carbon. Biogeosciences 4, 433–454. doi: 10.5194/bg-4-433-2007
Schneider B., Schlitzer R., Fischer G., Nöthig E. M. (2003). Depth-dependent elemental compositions of particulate organic matter (POM) in the ocean. Global Biogeochem. Cycles 17, 1032. doi: 10.1029/2002GB001871
Sharp J. H. (1991). “Total mass and particulate carbon, nitrogen and phosphorus,” in Marine particles: Analysis and characterization, vol. 63 . Eds. Hurd D. C., Spencer D. W., (Washington, D.C.:American Geophysical Union)87–90. doi: 10.1029/GM063p0087
Sheu D., Jou W., Chung Y., Tang T., Hung J. (1999). Geochemical and carbon isotopic characterization of particles collected in sediment traps from the East China Sea continental slope and the Okinawa Trough northeast of Taiwan. Continent. Shelf Res. 19, 183–203. doi: 10.1016/S0278-4343(98)00081-8
Shi X., Qi M., Tang H., Han X. (2015). Spatial and temporal nutrient variations in the Yellow Sea and their effects on Ulva prolifera blooms. Estuarine Coast. Shelf Sci. 163, 36–43. doi: 10.1016/j.ecss.2015.02.007
Shi X., Wang X., Han X., Zhu C., Sun X., Zhang C. (2003). Nutrient distribution and its controlling mechanism in the adjacent area of Changjiang River Estuary. J. Appl. Ecol. 14, 1086–1092. doi: 10.1007/BF02860423
Simon M., Grossart H.-P., Schweitzer B., Ploug H. (2002). Microbial ecology of organic aggregates in aquatic ecosystems. Aquat. Microbial. Ecol. 28, 175–211. doi: 10.3354/ame028175
Song Z., Li J., Meng F., Tang W., Yuan X. (2018). Seasonal distribution of suspended particulate matter off China's Subei coast. Polish J. Environ. Stud. 27, 845–852. doi: 10.15244/pjoes/75826
Song G., Liu S., Zhu Z., Zhai W., Zhu C., Zhang J. (2016). Sediment oxygen consumption and benthic organic carbon mineralization on the continental shelves of the East China Sea and the Yellow Sea. Deep Sea Res. Part II: Topical Stud. Oceanogr. 124, 53–63. doi: 10.1016/j.dsr2.2015.04.012
Taylor J., Cottingham S., Billinge J., Cunliffe M. (2014). Seasonal microbial community dynamics correlate with phytoplankton-derived polysaccharides in surface coastal waters. ISME J. 8, 245–248. doi: 10.1038/ismej.2013.178
Taylor A. H., Geider R. J., Gilbert F. J. (1997). Seasonal and latitudinal dependencies of phytoplankton carbon-to-chlorophyll a ratios: results of a modelling study. Mar. Ecol. Prog. Ser. 152, 51–66. doi: 10.3354/meps152051
Trefry J. H., Metz S., Nelsen T. A., Trocine R. P., Eadie B. J. (1994). Transport of particulate organic carbon by the Mississippi River and its fate in the Gulf of Mexico. Estuaries 17, 839–849. doi: 10.2307/1352752
Turner J. T. (2015). Zooplankton fecal pellets, marine snow, phytodetritus and the ocean’s biological pump. Prog. Oceanogr. 130, 205–248. doi: 10.1016/j.pocean.2014.08.005
Verdugo P. (2012). Marine microgels. Annu. Rev. Mar. Sci. 4, 375–400. doi: 10.1146/annurev-marine-120709-142759
Volkman J. K., Tanoue E. (2002). Chemical and biological studies of particulate organic matter in the ocean. J. Oceanogr. 58, 265–279. doi: 10.1023/A:1015809708632
Walsh J. J. (1991). Importance of continental margins in the marine biogeochemical cycling of carbon and nitrogen. Nature 350, 53–55. doi: 10.1038/350053a0
Wang X., Borgne R. L., Murtugudde R., Busalacchi A., Behrenfeld M. (2008). Spatial and temporal variations in dissolved and particulate organic nitrogen in the equatorial Pacific: Biological and physical influences. Biogeosciences 5, 1705–1721. doi: 10.5194/bg-5-1705-2008
Wang X.-C., Chen R. F., Gardner G. B. (2004). Sources and transport of dissolved and particulate organic carbon in the Mississippi River estuary and adjacent coastal waters of the northern Gulf of Mexico. Mar. Chem. 89, 241–256. doi: 10.1016/j.marchem.2004.02.014
Wang Y., Liu D., Richard P., Li X. (2013). A geochemical record of environmental changes in sediments from Sishili Bay, northern Yellow Sea, China: Anthropogenic influence on organic matter sources and composition over the last 100 years. Mar. Pollut. Bull. 77, 227–236. doi: 10.1016/j.marpolbul.2013.10.001
Wang X. H., Qiao F., Lu J., Gong F. (2011). The turbidity maxima of the northern Jiangsu shoal-water in the Yellow Sea, China. Estuarine Coast. Shelf Sci. 93, 202–211. doi: 10.1016/j.ecss.2010.10.020
Wang Z., Xiao J., Fan S., Li Y., Liu X., Liu D. (2015). Who made the world's largest green tide in China?–an integrated study on the initiation and early development of the green tide in Yellow Sea. Limnol. Oceanogr. 60, 1105–1117. doi: 10.1002/lno.10083
Wang J., Yu Z., Wei Q., Yang F., Dong M., Li D., et al. (2020). Intra- and inter-seasonal variations in the hydrological characteristics and nutrient conditions in the southwestern Yellow Sea during spring to summer. Mar. Pollut. Bull. 156, 111139. doi: 10.1016/j.marpolbul.2020.111139
Wang B.-D., Zhan R., Xu M.-D. (2002). Molar ratios of C, N, P of particulate matter and their vertical fluxes in the Yellow Sea. Chin. J. Oceanol. Limnol. 20 (1), 91–96. doi: 10.1007/BF02846617
Wan X., Wu Z., Zhang Z., Li J. (2005). Simulation of coupled pelagic-benthic ecosystem of the Yellow Sea cold water mass. Chin. J. Oceanol. Limnol. 23, 393–399. doi: 10.1007/BF02842682
Wassmann P. (1990). Calculating the load of organic carbon to the aphotic zone in eutrophicated coastal waters. Mar. Pollut. Bull. 21, 183–187. doi: 10.1016/0025-326X(90)90499-X
Wei Q., Wang B., Fu M., Sun J., Yao Q., Xin M., et al. (2020). Spatiotemporal variability of physical-biogeochemical processes and intrinsic correlations in the semi-enclosed South Yellow Sea. Acta Oceanol. Sin. 39 (10), 11–26. doi: 10.1007/s13131-020-1656-3
Wei Q., Yu Z., Wang B., Fu M., Xia C., Liu L., et al. (2016). Coupling of the spatial–temporal distributions of nutrients and physical conditions in the southern Yellow Sea. J. Mar. Syst. 156, 30–45. doi: 10.1016/j.jmarsys.2015.12.001
Wei Q., Yu Z., Wang B., Wu H., Sun J., Zhang X., et al. (2017). Offshore detachment of the Changjiang River plume and its ecological impacts in summer. J. Oceanogr. 73, 277–294. doi: 10.1007/s10872-016-0402-0
Wen F., Sun X., Zheng S., Luo X., Feng Q., Sun S. (2012). Spatial and seasonal variations of chlorophyll a and primary productivity in spring and summer in the yelow Sea and East China Sea (in Chinese). Oceanol. Limnol. Sin. 43 (3), 438–444.
Wieder W. R., Cleveland C. C., Smith W. K., Todd-Brown K. (2015). Future productivity and carbon storage limited by terrestrial nutrient availability. Nat. Geosci. 8, 441–444. doi: 10.1038/NGEO2413
Winogradow A., Mackiewicz A., Pempkowiak J. (2019). Seasonal changes in particulate organic matter (POM) concentrations and properties measured from deep areas of the Baltic Sea. Oceanologia 61, 505–521. doi: 10.1016/j.oceano.2019.05.004
Wurl O., Miller L., Röttgers R., Vagle S. (2009). The distribution and fate of surface-active substances in the sea-surface microlayer and water column. Mar. Chem. 115, 1–9. doi: 10.1016/j.marchem.2009.04.007
Xing L., Zhao M., Gao W., Wang F., Zhang H., Li L., et al. (2014). Multiple proxy estimates of source and spatial variation in organic matter in surface sediments from the southern Yellow Sea. Organic Geochem. 76, 72–81. doi: 10.1016/j.orggeochem.2014.07.005
Yang W., Huang Y., Chen M., Zhang L., Li H., Liu G., et al. (2006). Disequilibria between 210Po and 210Pb in surface waters of the southern South China Sea and their implications. Sci. China Ser. D 49, 103–112. doi: 10.1007/s11430-004-5233-y
Yang S., Youn J.-S. (2007). Geochemical compositions and provenance discrimination of the central South Yellow Sea sediments. Mar. Geol. 243, 229–241. doi: 10.1016/j.margeo.2007.05.001
Ye F., Guo W., Shi Z., Jia G., Wei G. (2017). Seasonal dynamics of particulate organic matter and its response to flooding in the Peal River Estuary, China, revealed by stable isotope (δ13 c and δ15 n) analyses. J. Geophys. Res.: Oceans 122, 6835–6856. doi: 10.1002/2017JC012931
Yuan D., Zhu J., Li C., Hu D. (2008). Cross-shelf circulation in the Yellow and East China seas indicated by MODIS satellite observations. J. Mar. Syst. 70, 134–149. doi: 10.1016/j.jmarsys.2007.04.002
Zäncker B., Bracher A., Röttgers R., Engel A. (2017). Variations of the organic matter composition in the sea surface microlayer: A comparison between open ocean, coastal, and upwelling sites off the Peruvian coast. Front. Microbiol. 8. doi: 10.3389/fmicb.2017.02369
Zhang Q., Blomquist J. D. (2018). Watershed export of fine sediment, organic carbon, and chlorophyll-a to Chesapeake Bay: Spatial and temporal patterns in 1984–2016. Sci. Total Environ. 619-620, 1066–1078. doi: 10.1016/j.scitotenv.2017.10.279
Zhang Q., Wu J. (2018). Sediment suspension by straining-induced convection at the head of salinity intrusion. J. Geophys. Res.: Oceans 123, 656–671. doi: 10.1002/2017JC013192
Zhang J., Wu Y., Jennerjahn T. C., Ittekkot V., He Q. (2007). Distribution of organic matter in the Changjiang (Yangtze River) Estuary and their stable carbon and nitrogen isotopic ratios: Implications for source discrimination and sedimentary dynamics. Mar. Chem. 106, 111–126. doi: 10.1016/j.marchem.2007.02.003
Zhang Y.-S., Zhang F.-J., Guo X.-W., Zhang M.-P. (2004). Vertical flux of the settling particulate matter in the water column of the Yellow Sea in summer. Oceanol. Limnol. Sin. 35 (3), 230–38.
Zhao B., Yao P., Bianchi T. S., Arellano A. R., Wang X., Yang J., et al. (2018). The remineralization of sedimentary organic carbon in different sedimentary regimes of the Yellow and East China seas. Chem. Geol. 495, 104–117. doi: 10.1016/j.chemgeo.2018.08.012
Zhao B., Yao P., Bianchi T., Yu Z. (2021). Controls on organic carbon burial in the Eastern China marginal seas: A regional synthesis. Global Biogeochem. Cycles 35, e2020GB006608. doi: 10.1029/2020GB006608
Zhong Y., Qiao L., Song D., Ding Y., Xu J., Xue W., et al. (2020). Impact of cold water mass on suspended sediment transport in the South Yellow Sea. Mar. Geol. 428, 106244. doi: 10.1016/j.margeo.2020.106244
Zhong Q., Wang J., Du J., Bi Q., Zhao F. (2019). The 210Po/210Pb disequilibrium in a spring-blooming marginal sea, the southern Yellow Sea. J. Environ. Radioact. 207, 15–26. doi: 10.1016/j.jenvrad.2019.05.017
Zhong Q., Yu T., Lin H., Lin J., Ji J., Ni J., et al. (2021). 210Po-210Pb disequilibrium in the western North Pacific Ocean: particle cycling and POC export. Front. Mar. Sci. 8. doi: 10.3389/fmars.2021.700524
Zhou C., Dong P., Li G. (2015). Hydrodynamic processes and their impacts on the mud deposit in the southern Yellow Sea. Mar. Geol. 360, 1–16. doi: 10.1016/j.margeo.2014.11.012
Zhou M., Shen Z., Yu R. (2008). Responses of a coastal phytoplankton community to increased nutrient input from the Changjiang (Yangtze) River. Continent. Shelf Res. 28, 1483–1489. doi: 10.1016/j.csr.2007.02.009
Zhou F., Xue H., Huang D., Xuan J., Ni X., Xiu P., et al. (2015). Cross-shelf exchange in the shelf of the East China Sea. J. Geophys. Res.: Oceans 120, 1545–1572. doi: 10.1002/2014JC010567
Zhu Z.-Y., Ng W.-M., Liu S.-M., Zhang J., Chen J.-C., Wu Y. (2009). Estuarine phytoplankton dynamics and shift of limiting factors: A study in the Changjiang (Yangtze River) Estuary and adjacent area. Estuarine Coast. Shelf Sci. 84, 393–401. doi: 10.1016/j.ecss.2009.07.005
Zhu P., Wu H. (2018). Origins and transports of the low-salinity coastal water in the southwestern Yellow Sea. Acta Oceanol. Sin. 37 (4), 1–11. doi: 10.1007/s13131-018-1200-x
Keywords: particulate organic matter, biogeochemical modeling, biophysical processes, South Yellow Sea, particle flux, horizontal transport
Citation: Guo C, Yang S, Zhai W, Niu Y and Liu C (2022) Biological–physical oceanographic coupling influencing particulate organic matter in the South Yellow Sea. Front. Mar. Sci. 9:919423. doi: 10.3389/fmars.2022.919423
Received: 13 April 2022; Accepted: 01 August 2022;
Published: 24 August 2022.
Edited by:
Meilin Wu, South China Sea Institute of Oceanology (CAS), ChinaReviewed by:
Guangzhe Jin, Guangdong Ocean University, ChinaRui Bao, Ocean University of China, China
Yongquan Yuan, Institute of Oceanology (CAS), China
Chin-Chang Hung, National Sun Yat-sen University, Taiwan
Copyright © 2022 Guo, Yang, Zhai, Niu and Liu. This is an open-access article distributed under the terms of the Creative Commons Attribution License (CC BY). The use, distribution or reproduction in other forums is permitted, provided the original author(s) and the copyright owner(s) are credited and that the original publication in this journal is cited, in accordance with accepted academic practice. No use, distribution or reproduction is permitted which does not comply with these terms.
*Correspondence: Weidong Zhai, wdzhai@126.com