210Po-210Pb Disequilibrium in the Western North Pacific Ocean: Particle Cycling and POC Export
 Qiangqiang Zhong
 Tao Yu
 Hui Lin1
  Jianda Ji
 Jialin Ni
 Jinzhou Du
 Dekun Huang
- 1Third Institute of Oceanography, Ministry of Natural Resource, Xiamen, China
- 2State Key Laboratory of Estuarine and Coastal Research, East China Normal University, Shanghai, China
Estimating the particulate organic carbon (POC) export flux from the upper ocean is fundamental for understanding the efficiency of the biological carbon pump driven by sinking particles in the oceans. The downward POC flux from the surface ocean based on 210Po-210Pb disequilibria in seawater samples from the western North Pacific Ocean (w-NPO) was measured in the early summer (May-June) of 2018. All the profiles showed a large 210Po deficiency relative to 210Pb in the euphotic zone (0–150 m), while this 210Po deficiency vanished below ∼500 m (with 210Po/210Pb ∼1 or > 1). A one-dimensional steady-state irreversible scavenging model was used to quantify the scavenging and removal fluxes of 210Po and 210Pb in the euphotic zone of the w-NPO. In the upper ocean (0–150 m), dissolved 210Po (D-Po) was scavenged into particles with a residence time of 0.6–5.5 year, and the 210Po export flux out of the euphotic zone was estimated as (0.33–3.49) × 104 dpm/m2/year, resulting in a wide range of particulate 210Po (P-Po) residence times (83–921 days). However, in the deep ocean (150–1,000 m), 210Po was transferred from the particulate phase to the dissolved phase. Using an integrated POC inventory and the P-Po residence times (Eppley model) in the w-NPO euphotic zone, the POC export fluxes (mmol C/m2/d) varied from 0.6 ± 0.2 to 8.8 ± 0.4. In comparison, applying the POC/210Po ratio of all (>0.45 μm) particles to 210Po export flux (Buesseler model), the obtained POC export fluxes (mmol C/m2/d) ranged from 0.7 ± 0.1 to 8.6 ± 0.8. Both Buesseler and Eppley methods showed enhanced POC export fluxes at stations near the continental shelf (i.e., Luzon Strait and the Oyashio-Kuroshio mixing region). The Eppley model-based 210Po-derived POC fluxes agreed well with the Buesseler model-based fluxes, indicating that both models are suitable for assessing POC fluxes in the w-NPO. The POC export efficiency was < 15%, suggesting a moderate biological carbon pump efficiency in the w-NPO. These low export efficiencies may be associated with the dominance of smaller particles and the processes of degradation and subsequent remineralization of these small particles in the euphotic zone of oligotrophic regions in the w-NPO.
Introduction
As the Earth’s largest carbon reservoir (IPCC in Climate Change, 2013), the marine ecosystem plays a fundamental role in regulating the atmospheric CO2 concentration and buffering the effects of global climate change (Sabine, 2004) by assimilating carbon from the atmosphere via dissolution and photosynthesis in the upper ocean. Even small changes in the magnitude of the downward transport of carbon in the upper ocean can have serious impacts on oceanic carbon sequestration and atmospheric CO2 concentration (Kwon et al., 2009) and thus on global climate change (including global warming). It has been predicted that without the marine biological carbon pump (BCP), the atmospheric CO2 concentration could be approximately 50% higher than its current value (Sanders et al., 2014).
To fully understand how the oceans regulate the atmospheric CO2 concentration, detailed knowledge of the marine carbon cycle is needed. The well-known BCP is one of three major mechanisms by which the ocean takes up atmospheric CO2 (Liu et al., 2018). The BCP is described by these major processes: Phytoplankton convert CO2 into fixed carbon, e.g., carbohydrates or calcium carbonate through photosynthesis in the euphotic zone; Part of the CO2 fixed is transferred to the ocean interior of the ocean, mainly by gravitational sinking of particulate organic carbon (POC); Diffusion, advection and vertical mixing of dissolved organic carbon (DOC) and active bio-transport of organic and inorganic carbon by diel vertical migrating zooplankton are also important carbon removal pathways; Finally very few percentage of fixed carbon will be sequestered in the deep ocean (Buesseler et al., 2007). All these biologically mediated processes constitute the BCP. Thus, sinking particles play an important role in driving the BCP (Falkowski et al., 1998; Ducklow et al., 2001; Wei et al., 2011; Liu et al., 2018).
The ratio of export production (or the POC export flux) to total primary production, known as the “f-ratio” is defined as the export efficiency of the BCP and is used to quantity the strength of the pump (Buesseler and Boyd, 2009). Hence, an investigation of the sinking POC export flux from the upper ocean would provide fundamental parameters for predicting future changes in the marine carbon cycle. To constrain the POC export flux from the upper ocean, two traditional approaches are frequently applied: sediment traps (Honjo et al., 2008; Hayes et al., 2018) and the disequilibrium of the natural radionuclide pair, 234Th-238U (Charette et al., 1999; Benitez-Nelson et al., 2001; Buesseler et al., 2009, 2020; Zhou et al., 2020).
In recent years, another pair of natural radionuclide tracers, 210Po (T1/2 = 138.4 days) and its progenitor 210Pb (T1/2 = 22.4 year), has been shown to be effective at predicting the POC export flux (Murray et al., 2005; Stewart et al., 2007, 2010; Verdeny et al., 2009; Wei et al., 2011; Le Moigne et al., 2013; Roca-Martí et al., 2016; Hayes et al., 2018; Subha Anand et al., 2018; Tang et al., 2019; Horowitz et al., 2020); however, this tracer pair has not been applied frequently. The 210Po/210Pb ratio exhibits different behavior from the 234Th/238U ratio in terms of particle-binding properties in the ocean. 234Th is particle reactive and is scavenged from surface waters when particles sink into the deep sea, while naturally occurring 238U is conserved and remains dissolved in well-oxygenated seawater. In contrast, both 210Po and 210Pb are particle reactive. In addition, 210Pb and 234Th are only adsorbed onto the particle surface, whereas 210Po is both adsorbed onto surfaces and biologically assimilated into cells by some species of phytoplankton and bacteria (Fisher et al., 1983; Cherrier et al., 1995; LaRock et al., 1996; Stewart and Fisher, 2003a,b). As a result, phytoplankton cells accumulating 210Po are further ingested by zooplankton, while sinking particles excreted as fecal pellets and biogenic detritus are depleted in 210Po (Heyraud et al., 1976). This biogeochemical behavior leads to the distribution coefficient of 210Po being higher than that of 210Pb (Tang et al., 2017; Zhong et al., 2019). Thus, when particles sink from the upper ocean, the large difference in particle affinity leads to secular disequilibrium between 210Po and 210Pb, which can be used to estimate particulate material export in a manner similar to the use of 234Th-238U disequilibrium (Friedrich and Rutgers van der Loeff, 2002; Cochran and Masqué, 2003; Verdeny et al., 2009; Wei et al., 2011; Hayes et al., 2018; Subha Anand et al., 2018; Horowitz et al., 2020). However, relatively few studies have used the 210Po-210Pb disequilibrium method to quantify the POC export flux at a basin wide scale (Ceballos-Romero et al., 2016; Roca-Martí et al., 2016; Tang and Stewart, 2019; Tang et al., 2019).
Oligotrophic open waters compose a major proportion (∼75%) of the surface ocean and account for over 30% of global marine carbon fixation (Shih et al., 2015). The NPO is an important atmospheric carbon sink, it can contribute to ∼25% of the total ocean CO2 uptake per year (Takahashi et al., 2009). By assessing the carbon export in the NPO, the goal of peak carbon dioxide emissions and carbon neutrality for humanity can be achieved more scientifically, and the pace of global climate change can be gradually showed down. As a part of the “Marine Environment Monitoring and Early Warning System Construction in the West Pacific Ocean (MEMEWSC)” project, we took advantage of a unique opportunity to obtain measurements of 210Po and 210Pb activity over a large tract of the w-NPO (from 117°E to 146°E and from 20°N to 40°N). In this study, we describe the activity profiles (1,000 m) of 210Po and 210Pb at 7 stations spanning different oceanographic regions with different aeolian inputs, distances from the nearest coast and rates of primary production. The goals of this study are listed as follows: (1) To investigate the spatial variability of particle scavenging and removal processes in the water column of each oceanographic region; and (2) to estimate the magnitude and efficiency of the POC export flux derived from the 210Po-210Pb disequilibrium in the euphotic layer of the w-NPO.
Materials and Methods
Sampling and Preparation
The study area located in the western part of the NPO, covering an area of 20–40°N and 118–153°E. The main surface ocean currents in this region are shown in Figure 1. The Kuroshio Current (KC) is the most important western boundary current in the w-NPO, it originates from the North Equatorial Current and subsequently intrudes from the western Philippine Sea into the northern South China Sea (SCS) in the Luzon Strait. The main KC enters the East China Sea (ECS) through a channel in east of Taiwan Island and then passes through Tokara Strait at around 30°N. After the current has passed the Shikoku Basin, the northeastward KC merges with the southwestward subarctic Oyashio Current (OC) before leaving the coast of Japan to form the KC Extension in the NPO, resulting in a system known as the Oyashio-Kuroshio boundary region (Figure 1).
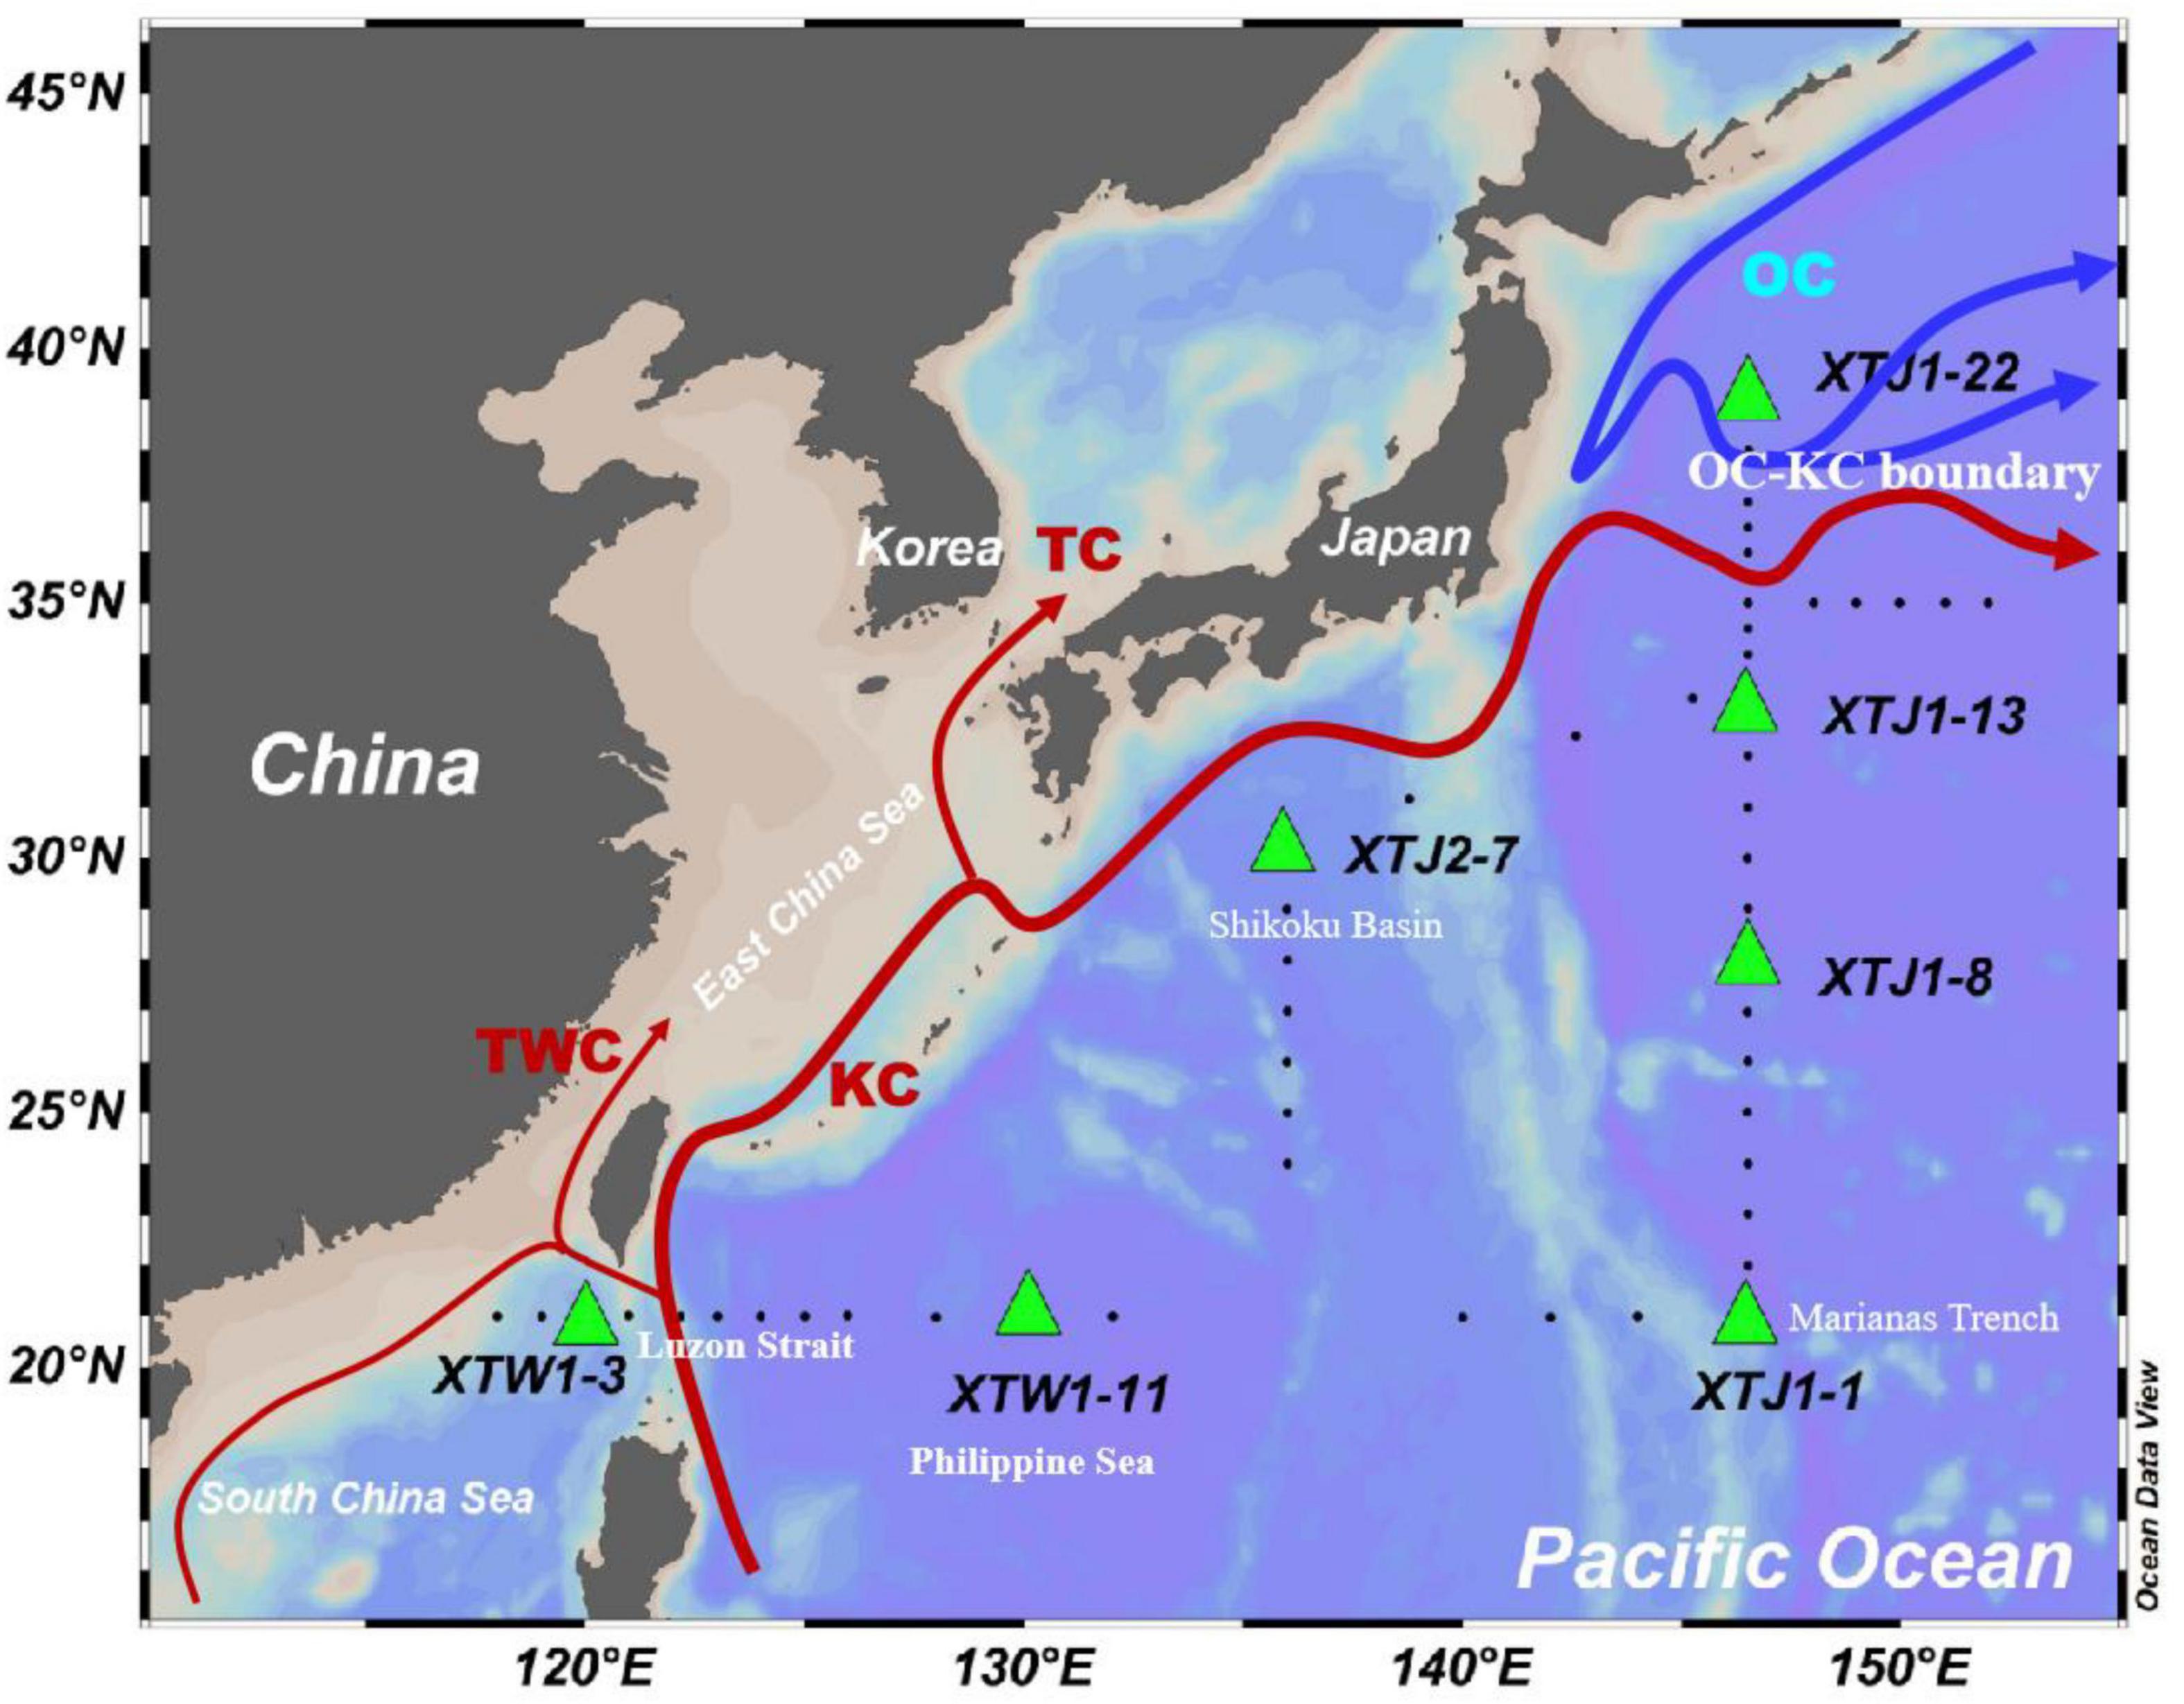
Figure 1. Map of the bathymetry and the locations of the sampling stations (black dots) studied during the cruise in the w-NPO. The green triangles indicate the stations where 210Po and 210Pb activities were measured. The arrows represent the surface circulation systems of the w-NPO (Yasuda, 2003; Gallagher et al., 2015; Hu et al., 2015). TWC, Taiwan Warm Current; KC, Kuroshio Current; TC, Tsushima Current; OC, Oyashio Current.
The MEMEWSC cruise was carried out in May-June 2018 on board RV Xiangyanghong III from the SCS to the Oyashio-Kuroshio mixing region of the western subarctic NPO (Figure 1). Dissolved and particulate samples for 210Po and 210Pb activity analysis were collected from the water column at 7 stations during the ∼1 month duration of the cruise. Discrete seawater samples were collected using a stainless steel sampling rosette equipped with 24 × 12 L Niskin bottles and a CTD Seabird sensor package. Seawater samples (∼20 L each) were taken from 9 depths from 0 to 1,000 m, with higher resolution in the upper 200 m of the water column. Salinity and temperature were obtained from these sensors (Seabird SBE 9/11plus CTD deployed with two Sea-Bird SBE 3P temperature sensors and two Sea-Bird SBE 4C conductivity sensors). To evaluate the POC export flux, 150 m is chosen as the integration depth according to estimated depth for the base of the euphotic zone on the ship from the Chl-a profiles.
210Po and 210Pb Determination
Analysis for 210Pb and 210Po was described in Zhong et al. (2019). In brief, seawater samples (18–24 L each) were rapidly filtered through 142-mm diameter Nucleopore filters (0.45 μm pore size) to separate the particulate and dissolved 210Po and 210Pb. The filtered (dissolved) seawater was then acidified to pH 1–2 with concentrated HCl immediately after collection and spiked with a known amount of 209Po (No. 7299, Eckert and Ziegler Isotope Products) and stable Pb2+ to quantify any subsequent losses of Po and Pb. After equilibration for 6–12 h, 100 mg of Fe3+ was added to the solution, the pH was adjusted to approximately 8–9, using concentrated NH4OH to co-precipitate Po and Pb with Fe(OH)3 precipitate. After settling for 8–12 h, the precipitate was transferred into a 1.5-L polyethylene bottle, and stored on board for processing upon arrival on land. In the laboratory, the precipitate was centrifuged and dissolved in 6 M HCl solution in a clean Teflon beaker, and the pH was neutralized to 1–2. Both 210Po and 209Po were auto-plated onto a nickel disc (Zhong et al., 2020) after adding 0.3 g of ascorbic acid, 1 mL of 25% sodium citrate, and 1 mL of 20% hydroxylamine hydrochloride to the solution. The particulate filters were spiked with known quantities of 209Po and stable Pb2+ and totally dissolved in a mixture of HF, HNO3 and HClO4. After evaporating to nearly dryness several times to ensure that all the radionuclides were in dissolved form, the residue was then picked up in dilute HCl (0.1 M) for plating of Po onto a nickel disc. The plating procedure was similar to that utilized for dissolved samples. 210Po and 209Po activities were determined by alpha spectrometry (Canberra series 7200-08).
For 210Pb determination, any remaining Po isotopes in the plating solution was removed by resuspending another nickel disc, and the purified sample solution was re-spiked with additional 209Po and stored for ∼12 months to allow ingrowth of 210Po from 210Pb, and then polonium isotopes were again auto-deposited, and counted. The recoveries of 210Pb were determined through the added stable Pb and the measured Pb, using atomic absorption spectrometry (AAS). The in-situ activities of 210Po and 210Pb at the sampling date were determined by correcting for decay, ingrowth, chemical recoveries, detector backgrounds, and reagent blanks (210Pb and 210Po present in the stable lead) (Church et al., 2012; Baskaran et al., 2013; Rigaud et al., 2013).
Particulate Organic Carbon Analysis
POC samples were obtained by filtering 4–6 L seawater through pre-combusted and pre-weighted 25 mm QMA filters (with a pore size of 0.45 μm, Whatman) immediately after sampling, and the filters were then washed 3 times with Milli-Q water to remove salt before frozen storage prior to laboratory analysis. Before the POC content was measured, the sample was oven-dried at 55°C to a constant weight. Then, the inorganic carbon was removed from the filter by using acid vapor (concentrated HCl) in desiccators for 48 h. The POC was then determined using a Vario ELIII CHNOS Elemental Analyzer. The analytical precision of the method was estimated to be around ± 4%, using triple measurement of the same sample.
Results
Hydrographic Characteristics and Particulate Organic Carbon Concentrations During the MEMEWSC Cruise
Vertical profiles of the temperature and salinity in the w-NPO are shown in Figure 2. Among the 7 stations, the sea surface temperature (SST) ranged from 15.5 to 28.9°C. The SST was high (27.6–28.9°C) at the low-latitude (21°N) stations (XTW1-3, XTW1-11 and XTJ1-1) but decreased gradually with increasing latitude from station XTJ1-1 (28.4°C) to station XTJ1-22 (15.5°C). Influenced by the OC, station XTJ1-22 showed the lowest SST. Furthermore, the water temperature decreased with increasing depth and did not differ appreciably between stations at 1,000 m (Figure 2A).
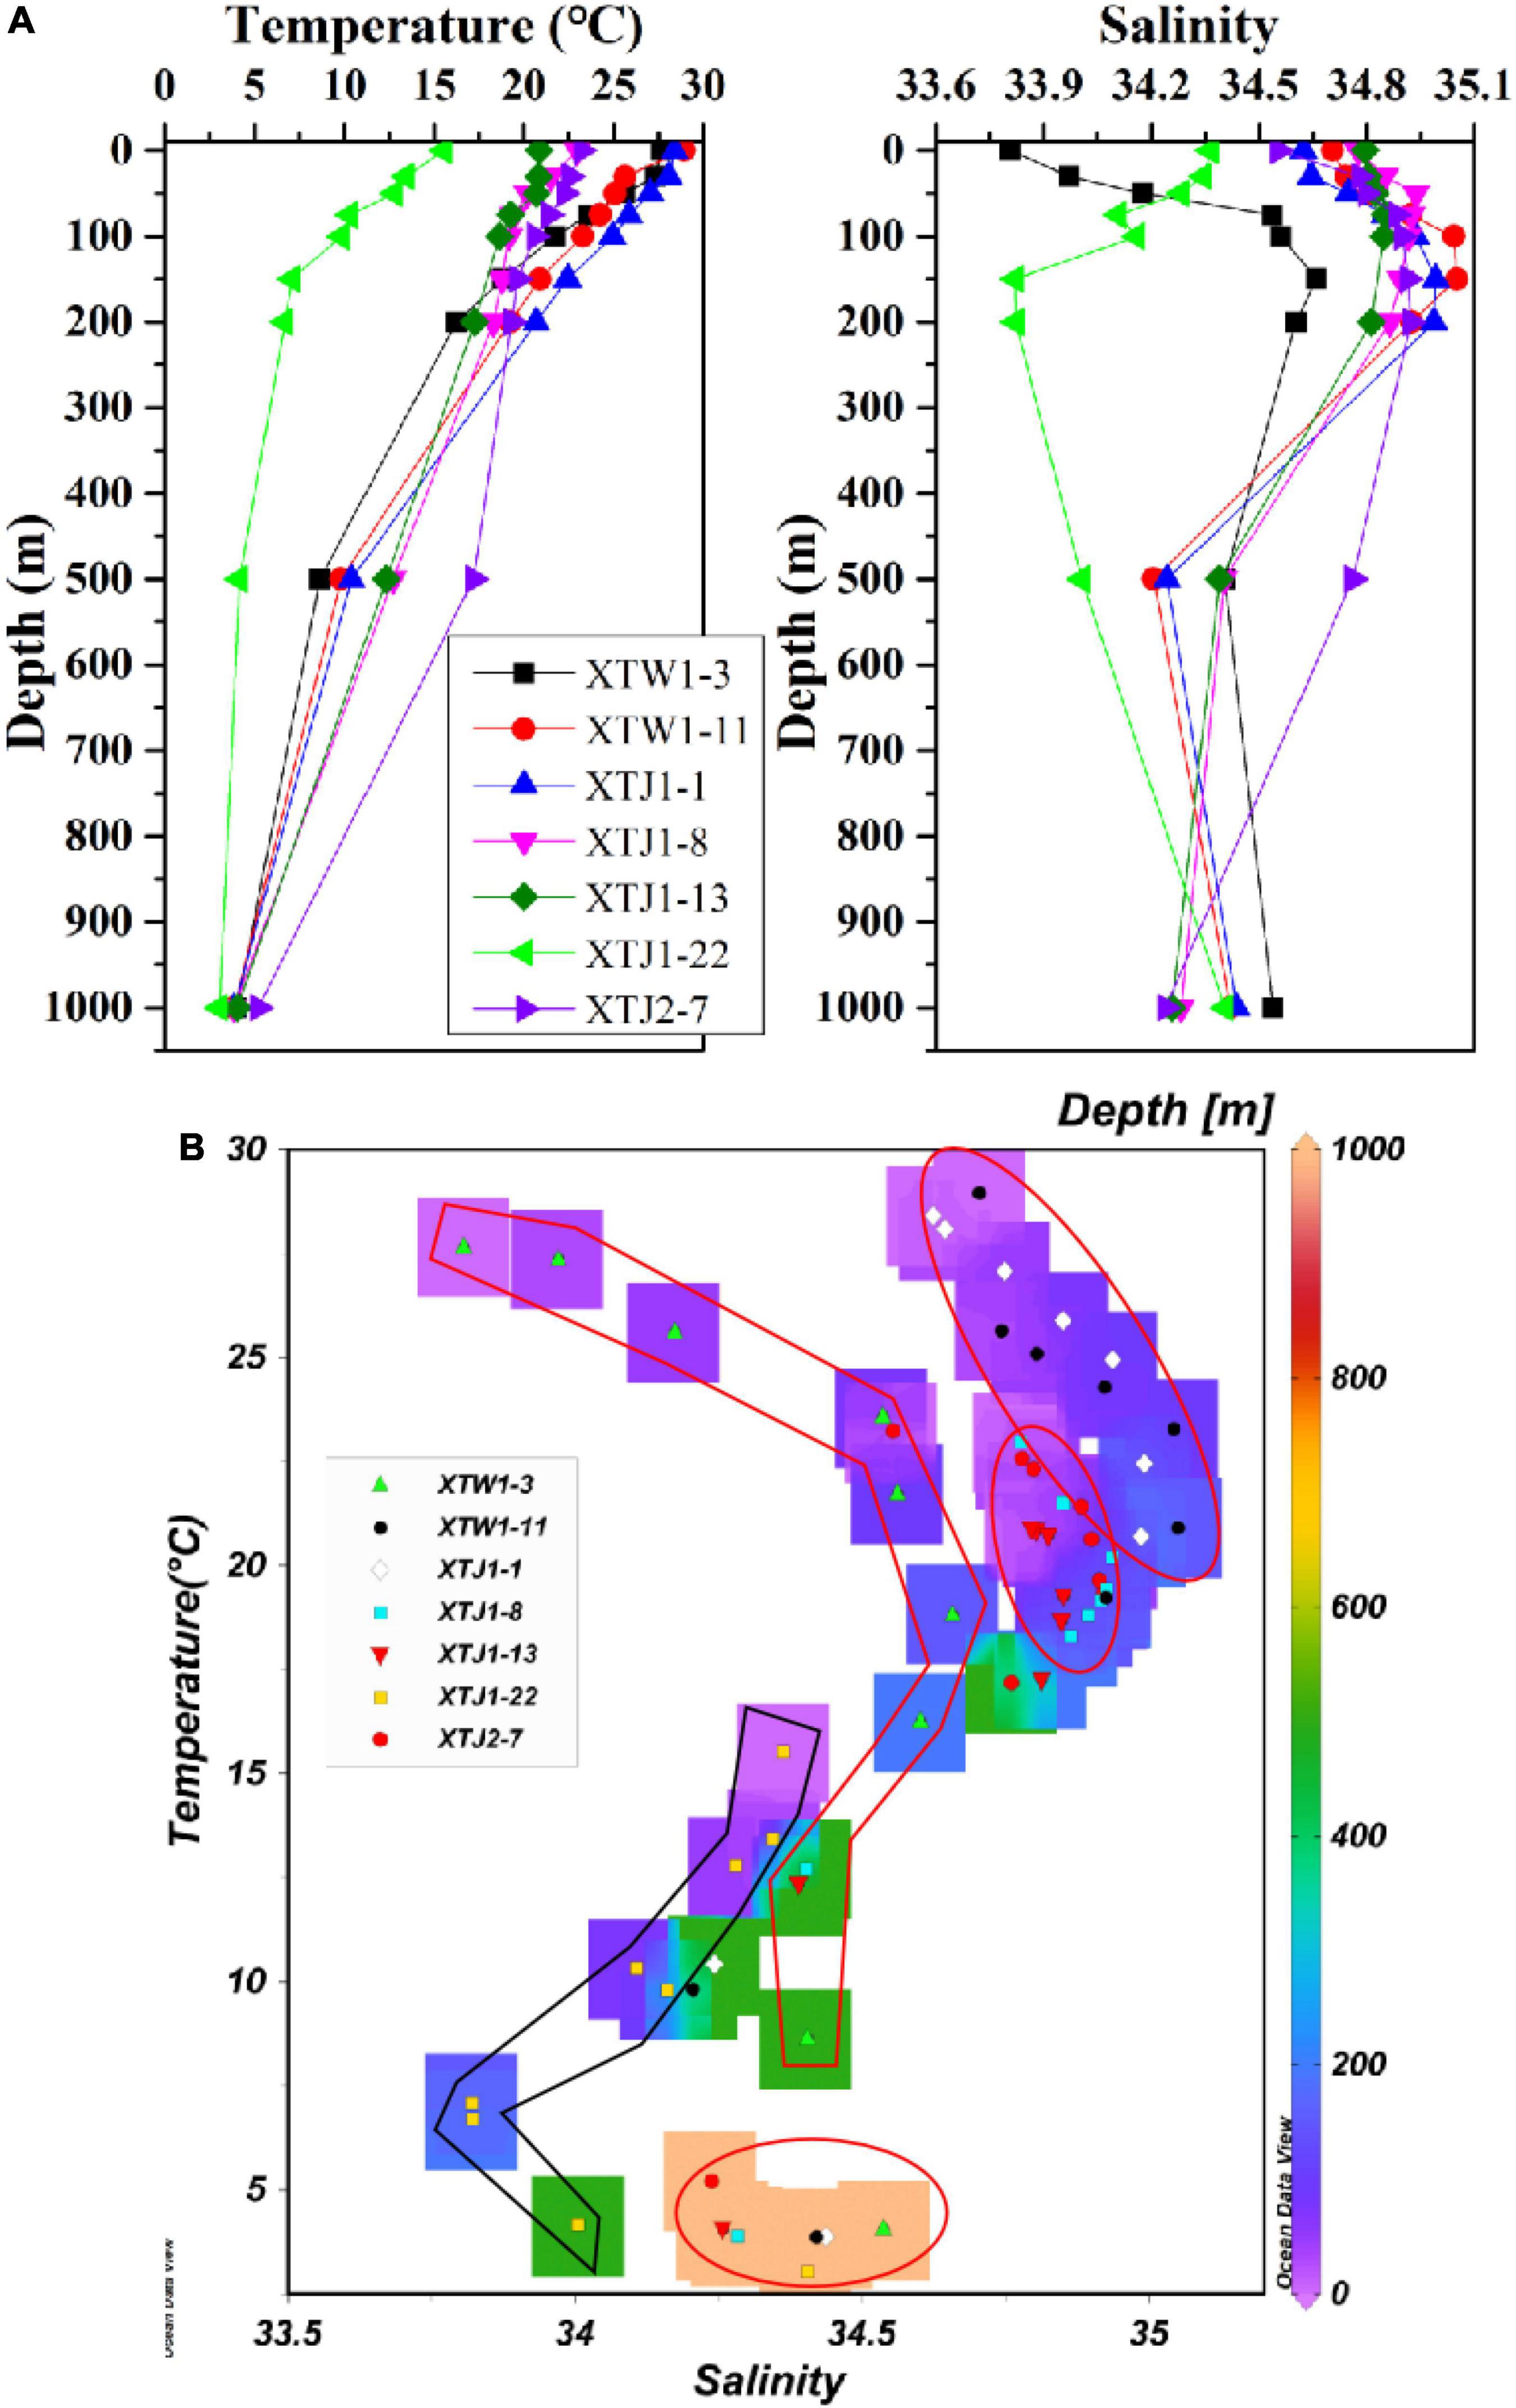
Figure 2. Profiles of temperature and salinity (A) and temperature-salinity-depth diagram (B) for the samples collected in the study area.
The salinity profiles spatially differed among the 7 stations (Figure 2A). At station XTJ1-22, the salinity decreased rapidly with increasing depth and exhibited a subsurface minimum (33.82) at 150 m, displaying the features of low-salinity subarctic waters (OC), and then the salinity increased gradually to 1,000 m. In contrast to station XTJ1-22, the other six stations exhibited similar salinity distributions, with the maximum values occurring at depths of approximately 150–200 m (Figure 2A), indicating the existence of stratification in the water column at each station. However, the salinity in the top 150 m of the water column at station XTW1-3 (located in Luzon Strait) was lower (from 33.80 to 34.66) than that at the station in the NPO basin (from 34.55 to 35.05) (Figure 2A). From the temperature-salinity-depth diagram (Figure 2B), the water masses can be clearly discriminated for the study area. Station XTJ1-22 showed a signature of OC, and station XTW1-3 might represent the South China Sea water. From the Figure 2B, the remaining five stations (XTJ1-1, XTW1-1, XTJ1-8, XTJ2-7, and XTJ1-13) could be divided into two groups with different hydrographic features for the surficial water mass (upper 200 m). One group includes stations XTJ1-1 and XTW1-11, and the other group contains stations XTJ1-8, XTJ1-13, and XTJ2-7, showing a much narrower ranges of salinity and temperature (Figure 2B). In 1,000 m, all the stations displayed a similar temperature-salinity feature, with low temperatures of < 5°C and a salinity range of 34.3–34.5. Based on the salinity and temperature profiles, the thermocline was observed between 100 and 200 m. To determine the euphotic zone depth, we use information for the base of the euphotic zone according to the subsurface chlorophyll-a maximums (SCMs) features. The profiles of chlorophyll-a concentrations showed that SCMs could occur between 120 and 150 m for most of the stations (33 out of 43 stations) during the cruise (unpublished data, personal communication with Dr. Jianhua Kang). Hence the euphotic zone could be delimited from 0 to 150 m. Overall, the water column could be divided into two boxes: 0–150 m box (the euphotic zone) and 150–1,000 m box (the mesopelagic zone).
All POC concentration data can be found in Supplementary Table 1. In total, the POC concentrations ranged from 1.85 to 14.35 μmol C/L, with an average of 4.15 ± 2.15 μmol C/L in the w-NPO (Figure 3). Station XTJ1-22 at the Kuroshio Current-Oyashio Current boundary had the highest POC concentration (mean: 6.23 ± 4.12 μmol C/L) in the upper 150 m, followed by station XTW1-3 (mean: 5.44 ± 1.28 μmol C/L) in the Luzon Strait, while the other five stations had similar POC concentrations with a mean value of 3.12–3.81 μmol C/L (Table 1). Almost all POC profiles showed a decrease with increasing water column depth from 0 to 500 m, and remained relatively constant from 500 to 1,000 m except at two stations (XTJ1-8 and XTJ1-13) (Figure 3).
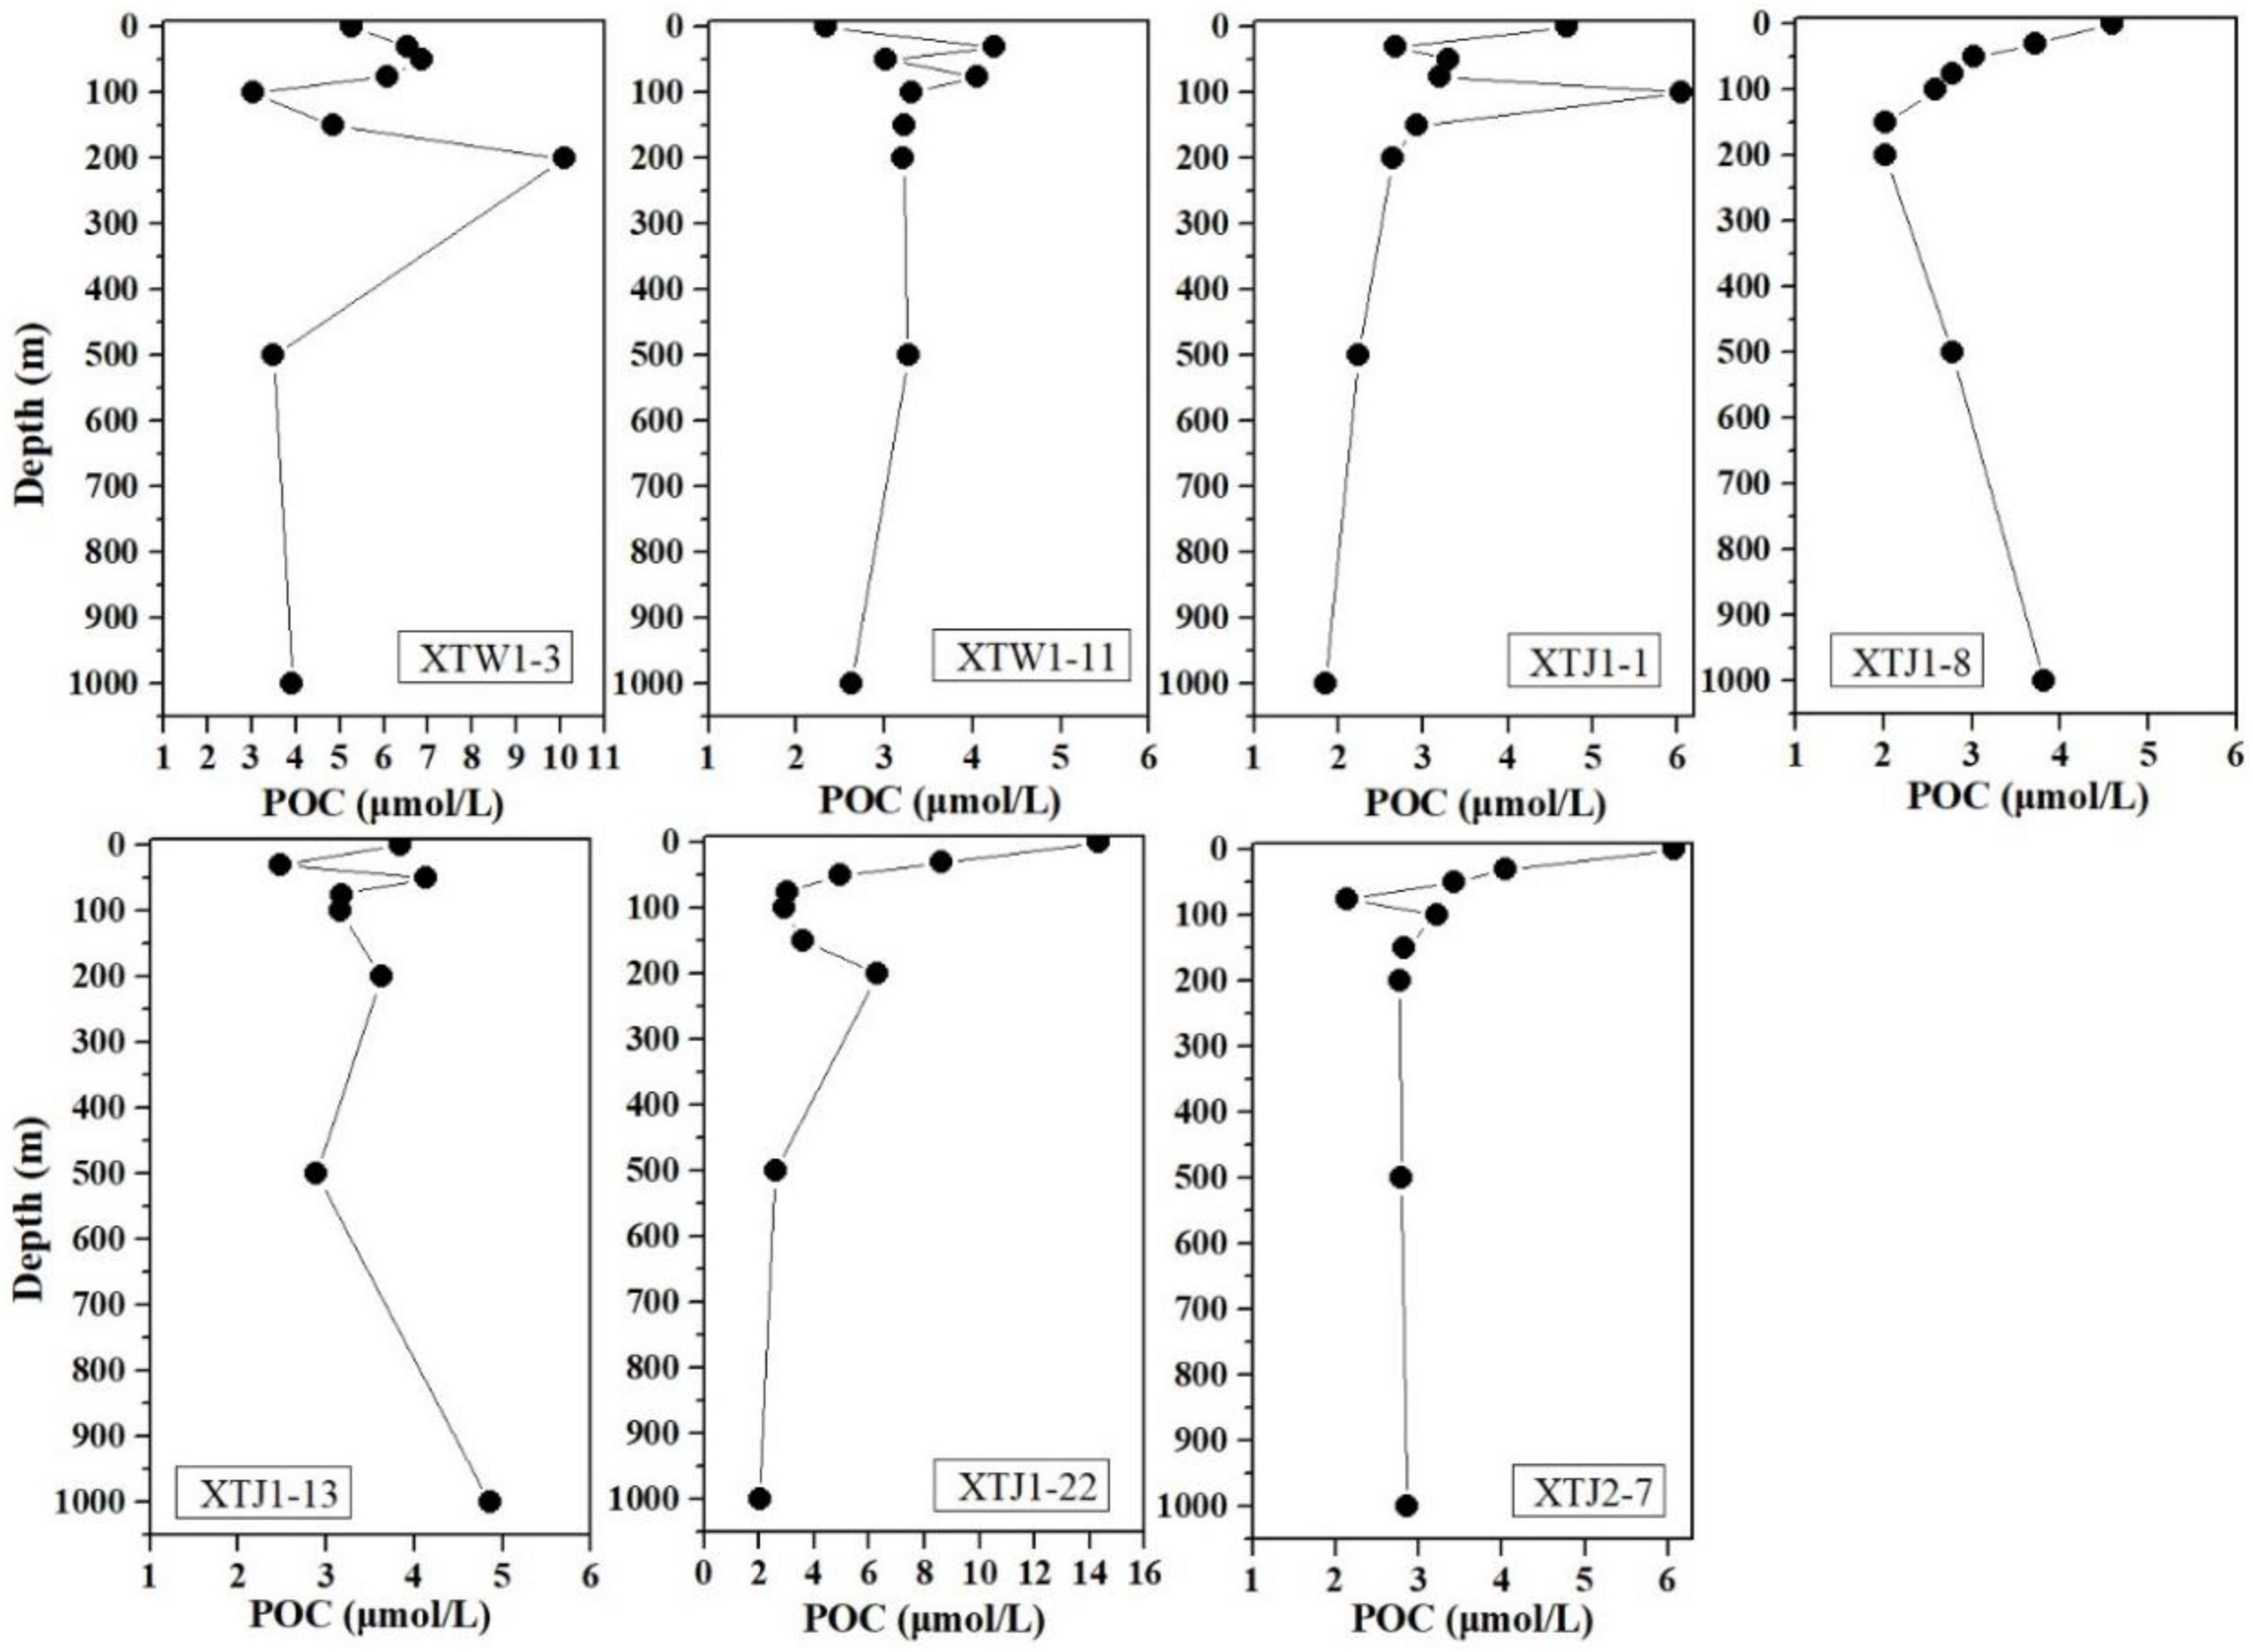
Figure 3. Vertical profiles of the POC concentration at 7 stations in the w-NPO during May-June 2018.
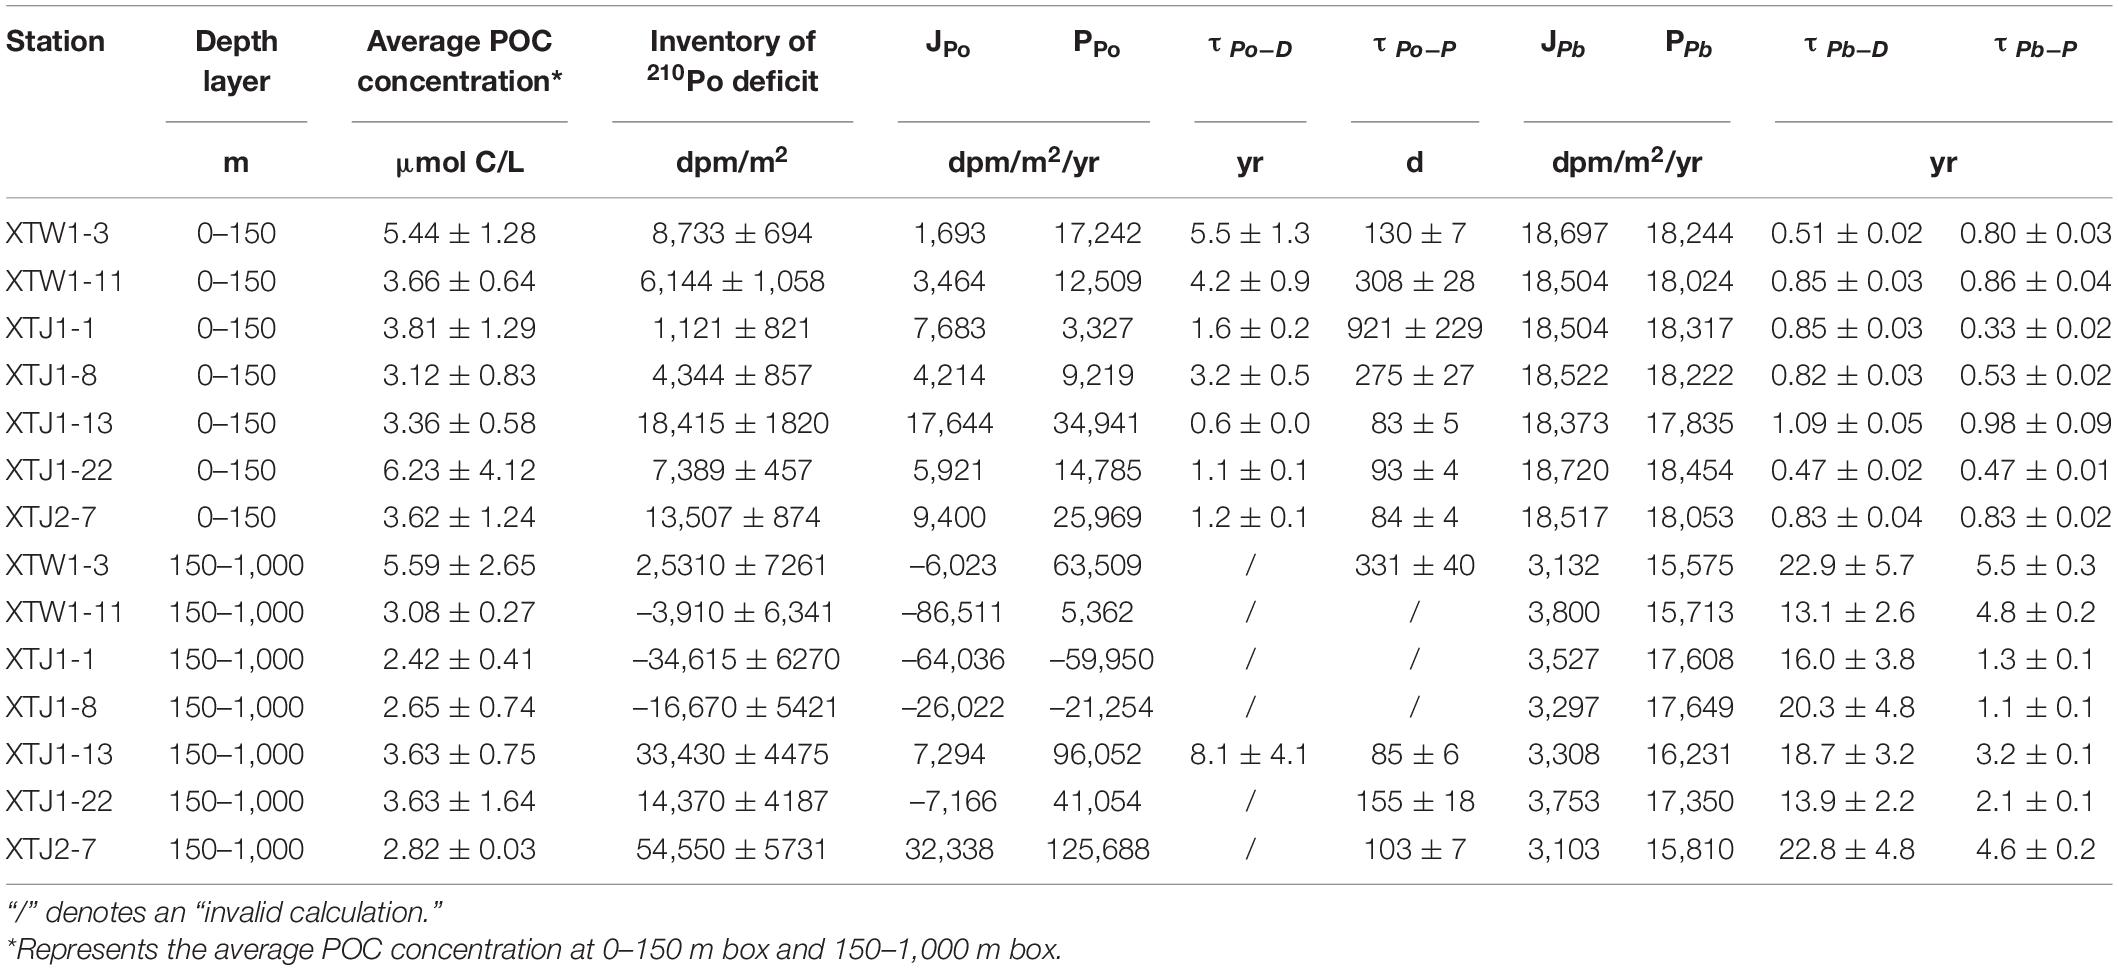
Table 1. Model calculations of the scavenging rates (J) and removal fluxes (P) for 210Po and 210Pb, together with the particulate and dissolved residence times in the surface and deeper layers in the w-NPO.
210Po and 210Pb Profiles
Profiles of dissolved 210Po (D-Po), particulate 210Po (P-Po), total 210Po (T-Po), dissolved 210Pb (D-Pb), particulate 210Pb (P-Pb) and total 210Pb (T-Pb) were displayed in Figures 4, 5, respectively. From Figures 4, 5, overall, P-Po and P-Pb showed a similar variation trend, but D-Po showed a little bit of difference comparing with the D-Pb. The activity concentrations of particulate 210Po (P-Po) ranged from 1.4 to 10.4 dpm/100 L (Figure 4), which are comparable to the reported values in the upper Sargasso Sea (>500 m, 0.5–8.2 dpm/100 L) (Kim and Church, 2001), and slightly higher than those in the Aleutian Basin (negligible to 6.0 dpm/100 L) (Hu et al., 2014) and in the North Atlantic Ocean (0.1–7.0 dpm/100 L) (Horowitz et al., 2020). All stations showed a systematic decrease in P-Po activity with depth in the upper 1,000 m, except for station XTW1-3 in the Luzon Strait, which exhibited a subsurface maximum between 200 and 500 m (Figure 4).
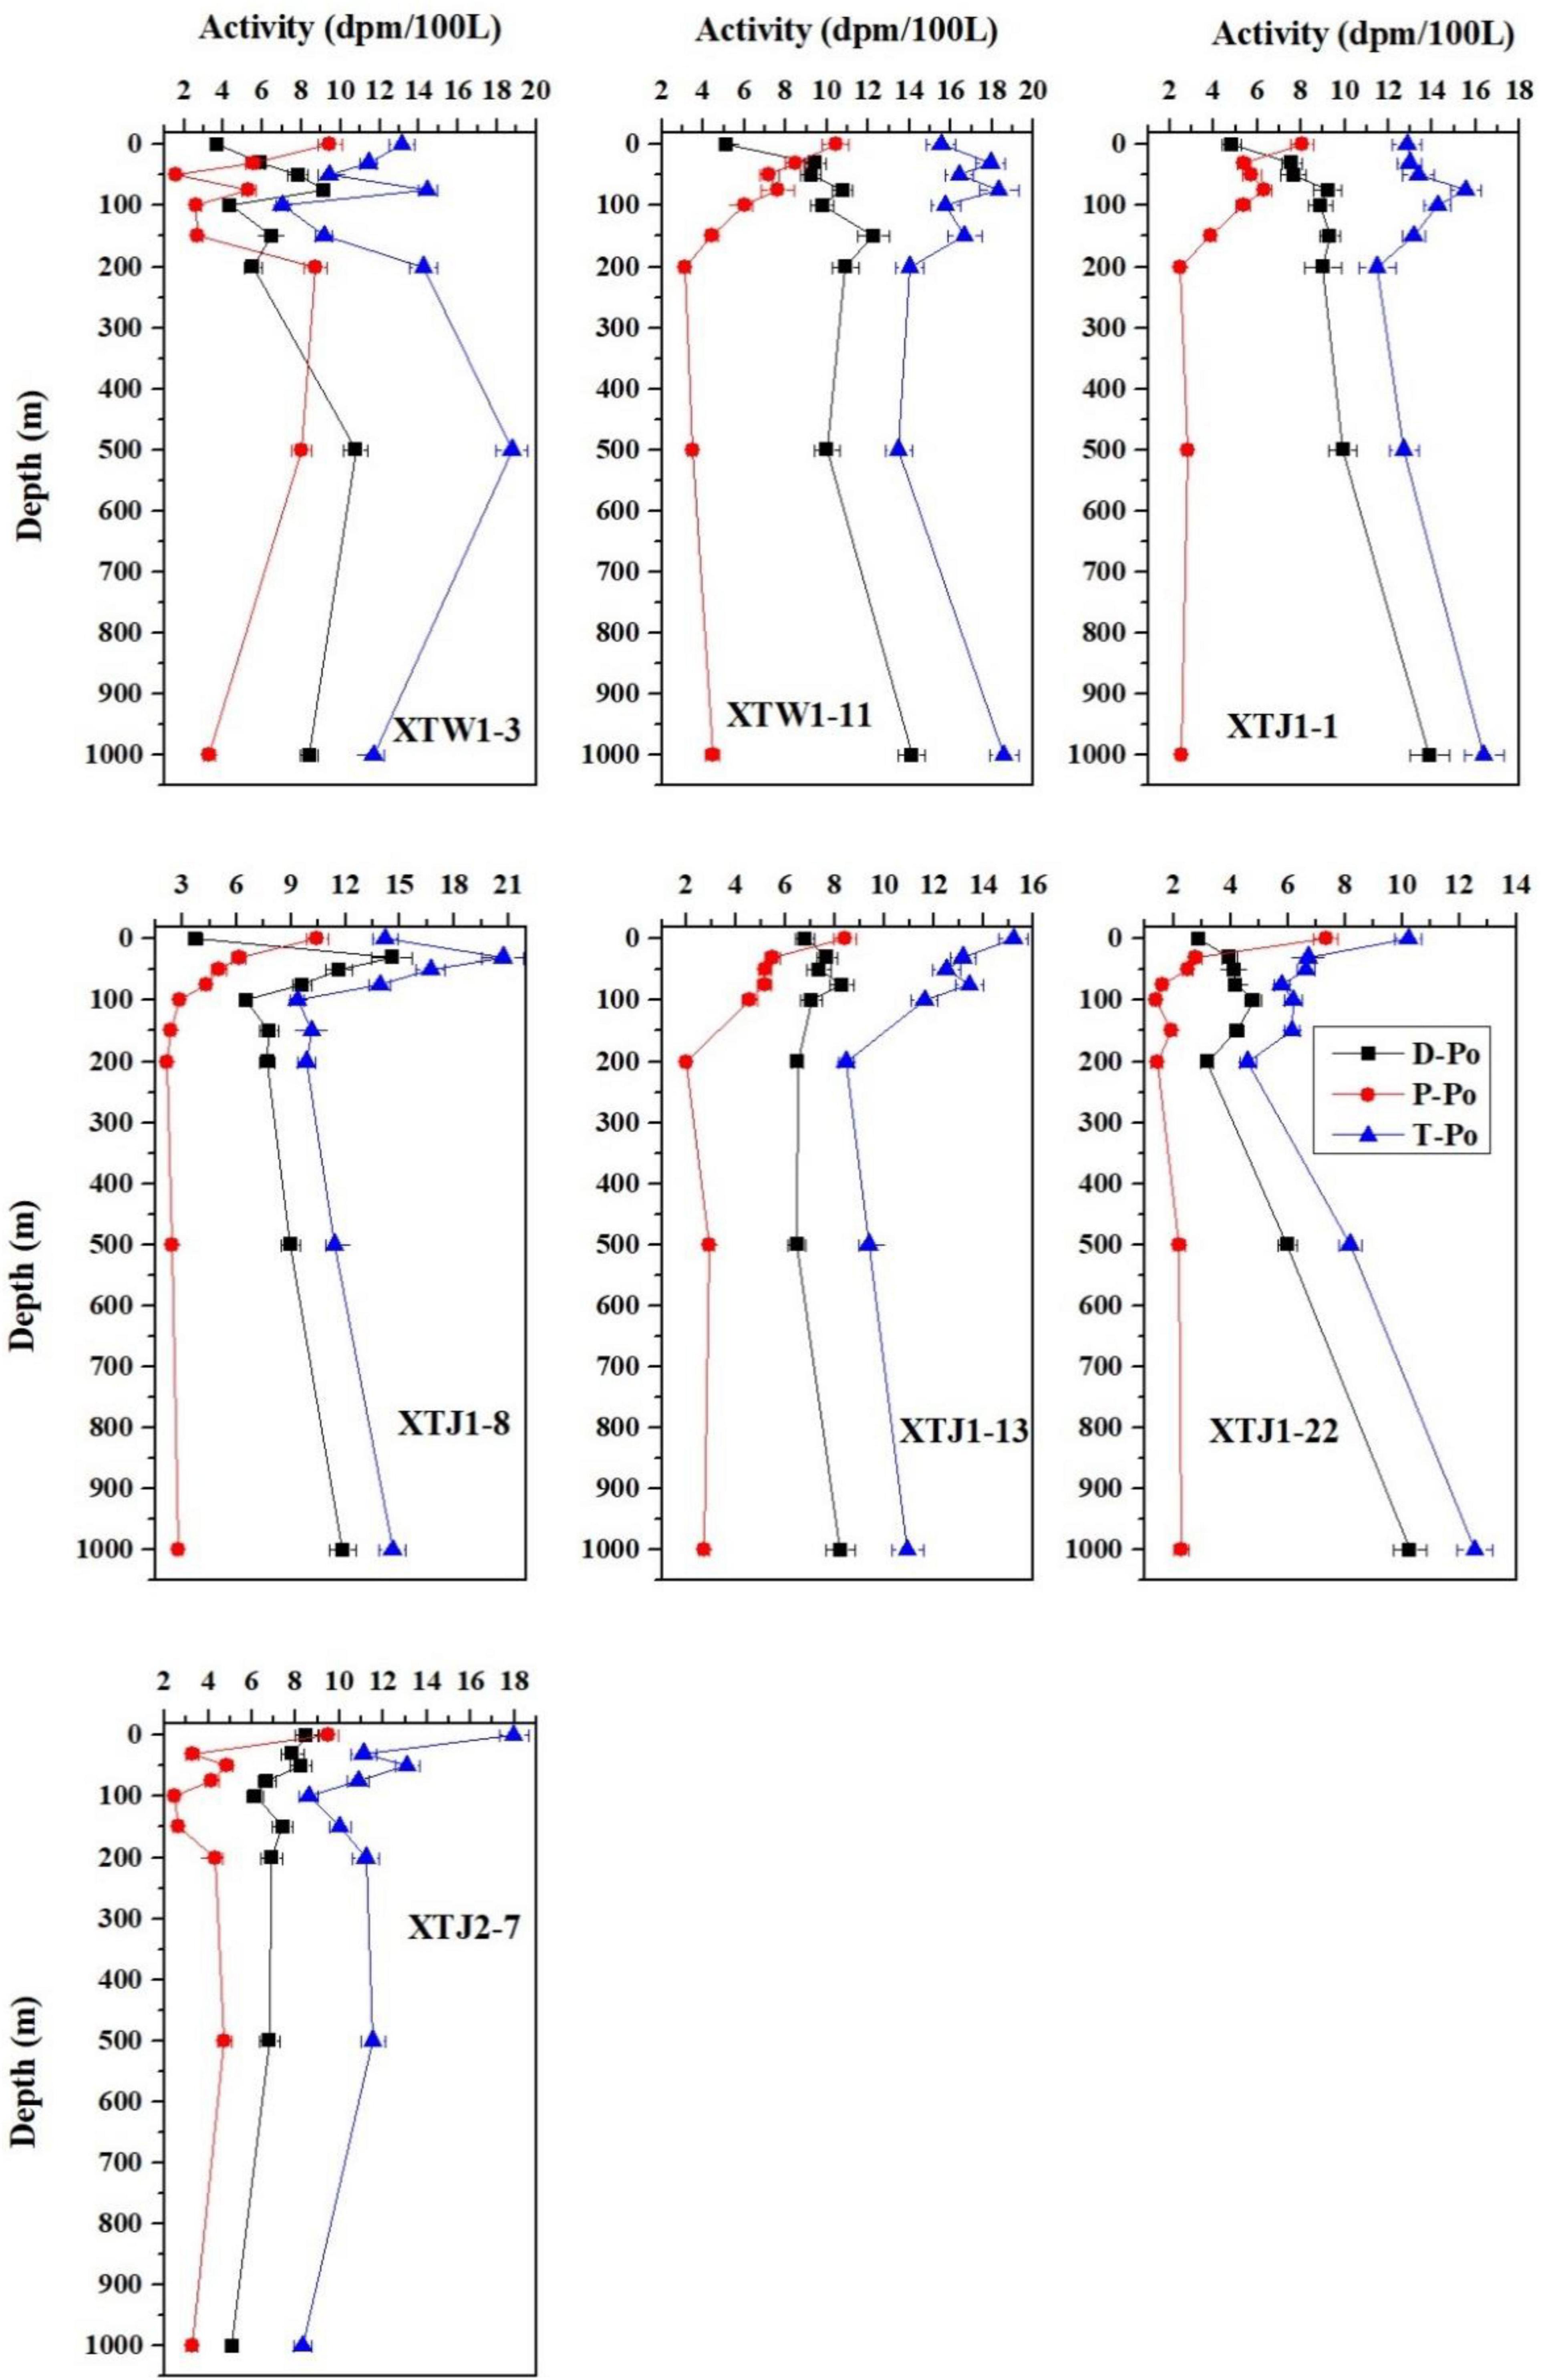
Figure 4. Vertical distributions of particulate (P), dissolved (D), and total (T) 210Po in the water column at each station in the w-NPO.
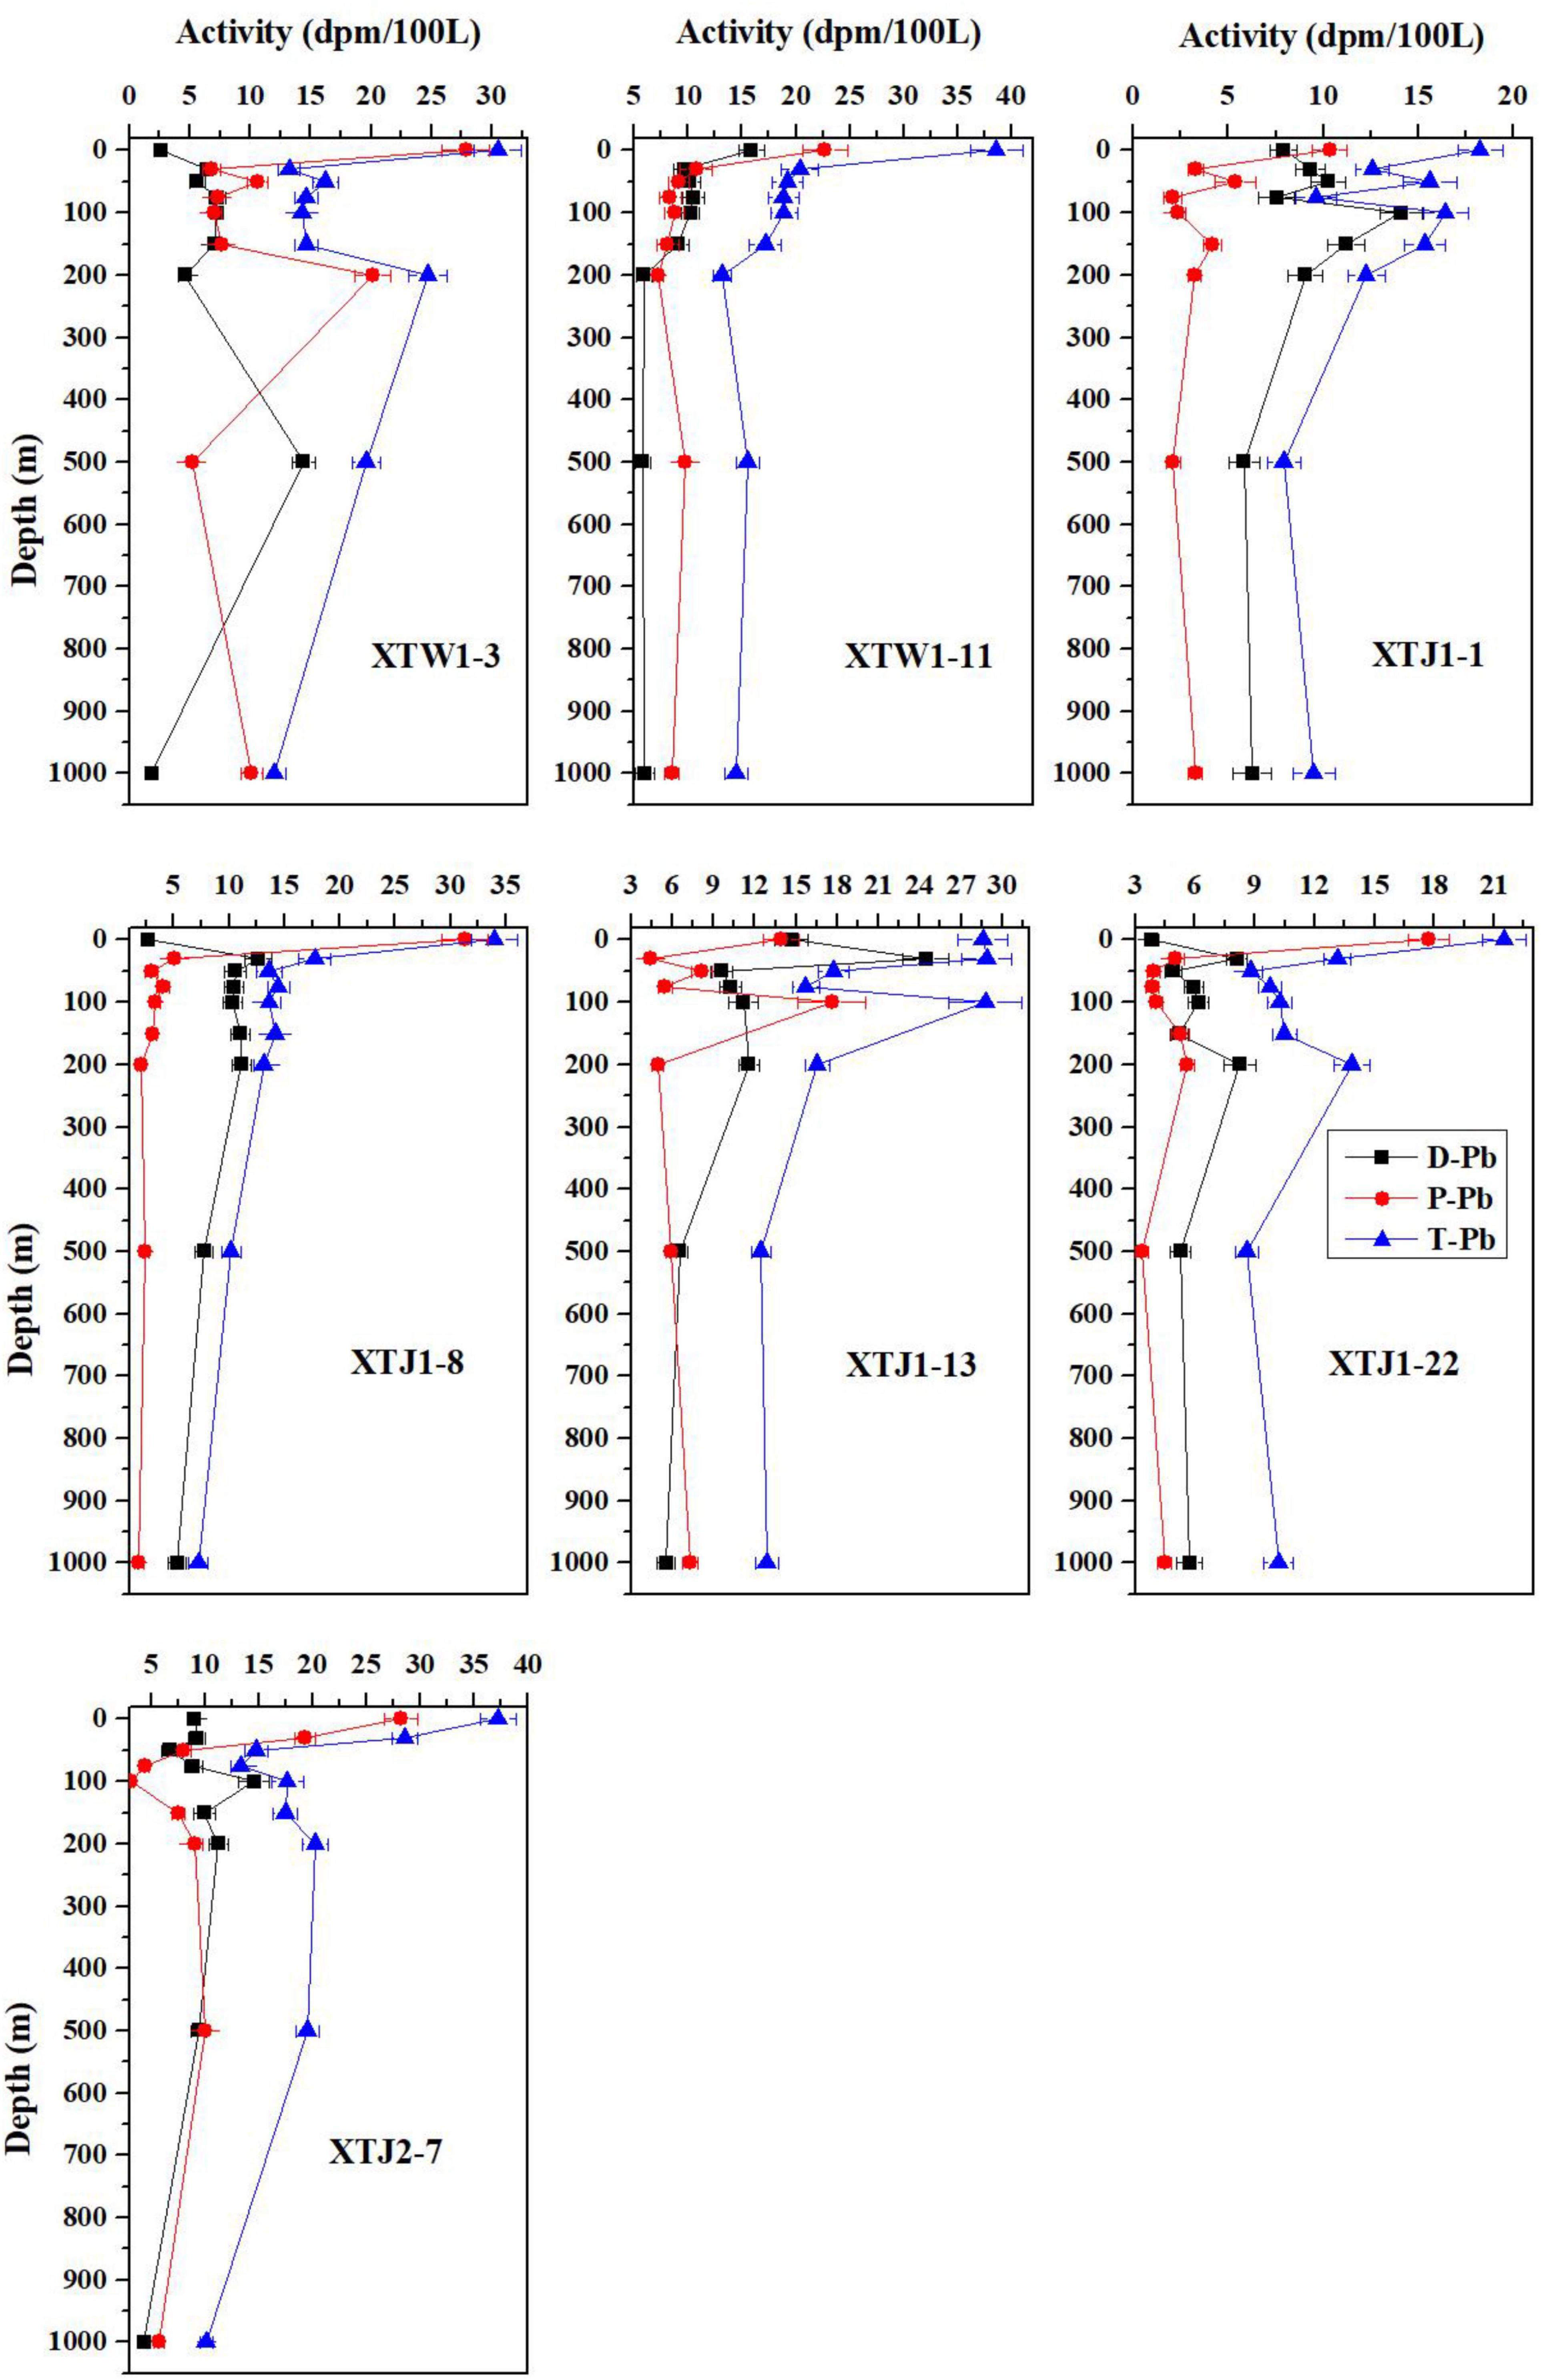
Figure 5. Vertical distributions of particulate (P), dissolved (D), and total (T) 210Pb activities in the water column at each station in the w-NPO.
The activities of dissolved 210Po (D-Po) varied from 2.87 to 14.57 dpm/100 L (Figure 4), which are comparable to other results previously measured in the w-NPO (5.28–14.02 dpm/100 L) (Nozaki and Tsunogai, 1976), the North Atlantic Ocean (0.6–13.1 dpm/100 L) (Horowitz et al., 2020) and the western equatorial Pacific Ocean (4.26–14.82 dpm/100 L) (Peck and Smith, 2000), although these regions might correspond to very different biogeochemical conditions. The D-Po concentration was lowest in surface seawater and gradually increased with depth; the subsurface D-Po peak was observed within approximately 50–150 m at all stations (Figure 4). This increase in the D-Po concentration with depth is consistent with the rapid scavenging of 210Po near the surface and the remineralization of particulate 210Po at depth. The profiles of total 210Po (T-Po) showed vertical variations similar to those of P-Po, with a range of 4.61–20.69 dpm/100 L.
The activity concentrations of dissolved 210Pb (D-Pb) and particulate 210Pb (P-Pb) ranged from 1.86 to 24.45 dpm/100 L and from 1.88 to 31.33 dpm/100 L, respectively (Figure 5). The P-Pb activity was highest in the near-surface seawaters at all stations; thus, 210Pb activity was predominantly in the particulate phase (P-Pb/T-Pb > 50%) in the upper 50 m (Figure 6). Below 50 m, P-Pb showed a systematic downward trend with depth. However, the activity of D-Pb was lowest in the surface seawater; then, D-Pb increased with depth from 50 to 200 m and finally decreased below 200 m. All stations had the highest total 210Pb (T-Pb) concentration at the surface, and T-Pb decreased with depth from the surface to 1,000 m, suggesting a surface source of 210Pb due to atmospheric input, as indicated by the 210Pb activity (7.22–38.61 dpm/100 L) being greater than the 226Ra activity (6.0–14.4 dpm/100 L, Kawakami and Kusakabe, 2008) in the upper water column.

Figure 6. Vertical profiles of percentage of particulate 210Po and 210Pb in water columns of the w-NPO.
At all stations, the percentages of P-Po in the w-NPO surface seawater (0–50 m) were higher than 50%, showing that P-Po often exceeded D-Po and dominated T-Po. The high fraction of particulate 210Pb indicated a signature of atmospheric input. Moreover, the P-Po/T-Po percentages decreased slowly to constant values of 20–30% as the water depth increased up to 500 m (Figure 6). P-Pb was generally 20–50% of the T-Pb at depths below the mixed layer, demonstrating that T-Pb was dominated by D-Pb in most layers of the water column at all stations in the w-NPO (Figure 6). Overall, these findings reveal that both 210Po and 210Pb were predominantly present in the dissolved phase below 50 m at all stations (Figure 6), as is commonly the case in other oceans.
210Po/210Pb Activity Ratio
Vertical profiles of the 210Po/210Pb activity ratios in the particulate, dissolved and total fractions are plotted in Figure 7. Particulate matter was enriched in 210Po (particulate 210Po/210Pb activity ratios > 1) at the subsurface (50–100 m) at all stations, especially in the particulate sample from a depth of 75 m at station XTJ1-1, where the P-Po/P-Pb ratio reached 3.04 ± 0.73 (Figure 7). These data indicates that there was an excess of P-Po relative to P-Pb. The dissolved 210Po/210Pb activity ratios (D-Po/D-Pb) increased with depth, with values < 1 at the surface and increasing toward 1 or even > 1 below the euphotic zone, which complemented the elevated P-Po/P-Pb ratio. All stations showed similar vertical distributions of T-Po/T-Pb with a significant deficiency of 210Po relative to 210Pb from the surface to 200 m. The deficit of 210Po relative to 210Pb declined with depth and then approached equilibrium or shifted to an excess (210Po/210Pb≈1 or > 1) at different depths for different stations, except for stations XTJ1-1 and XTJ1-8, which displayed an excess of T-Po relative to T-Pb (T-Po/T-Pb ratio > 1) at 50–75 m and at 500–1,000 m. Interestingly, 210Po excess (T-Po/T-Pb ratios > 1.2) was observed in seawater at 500 and 1,000 m of station XTJ1-1 and in seawater at 1,000 m of station XTJ1-8 (Figure 7). From Figure 7, we can find that this 210Po excess is caused by the high dissolved 210Po activity concentration in the deep layers (500–1,000 m), because D-Po/D-Pb ratios at deep layers (500–1,000 m) were much higher than unity (Figure 7). And this high dissolved 210Po activity concentration implied the occurrence of a strong 210Po dissolution in the deep ocean.
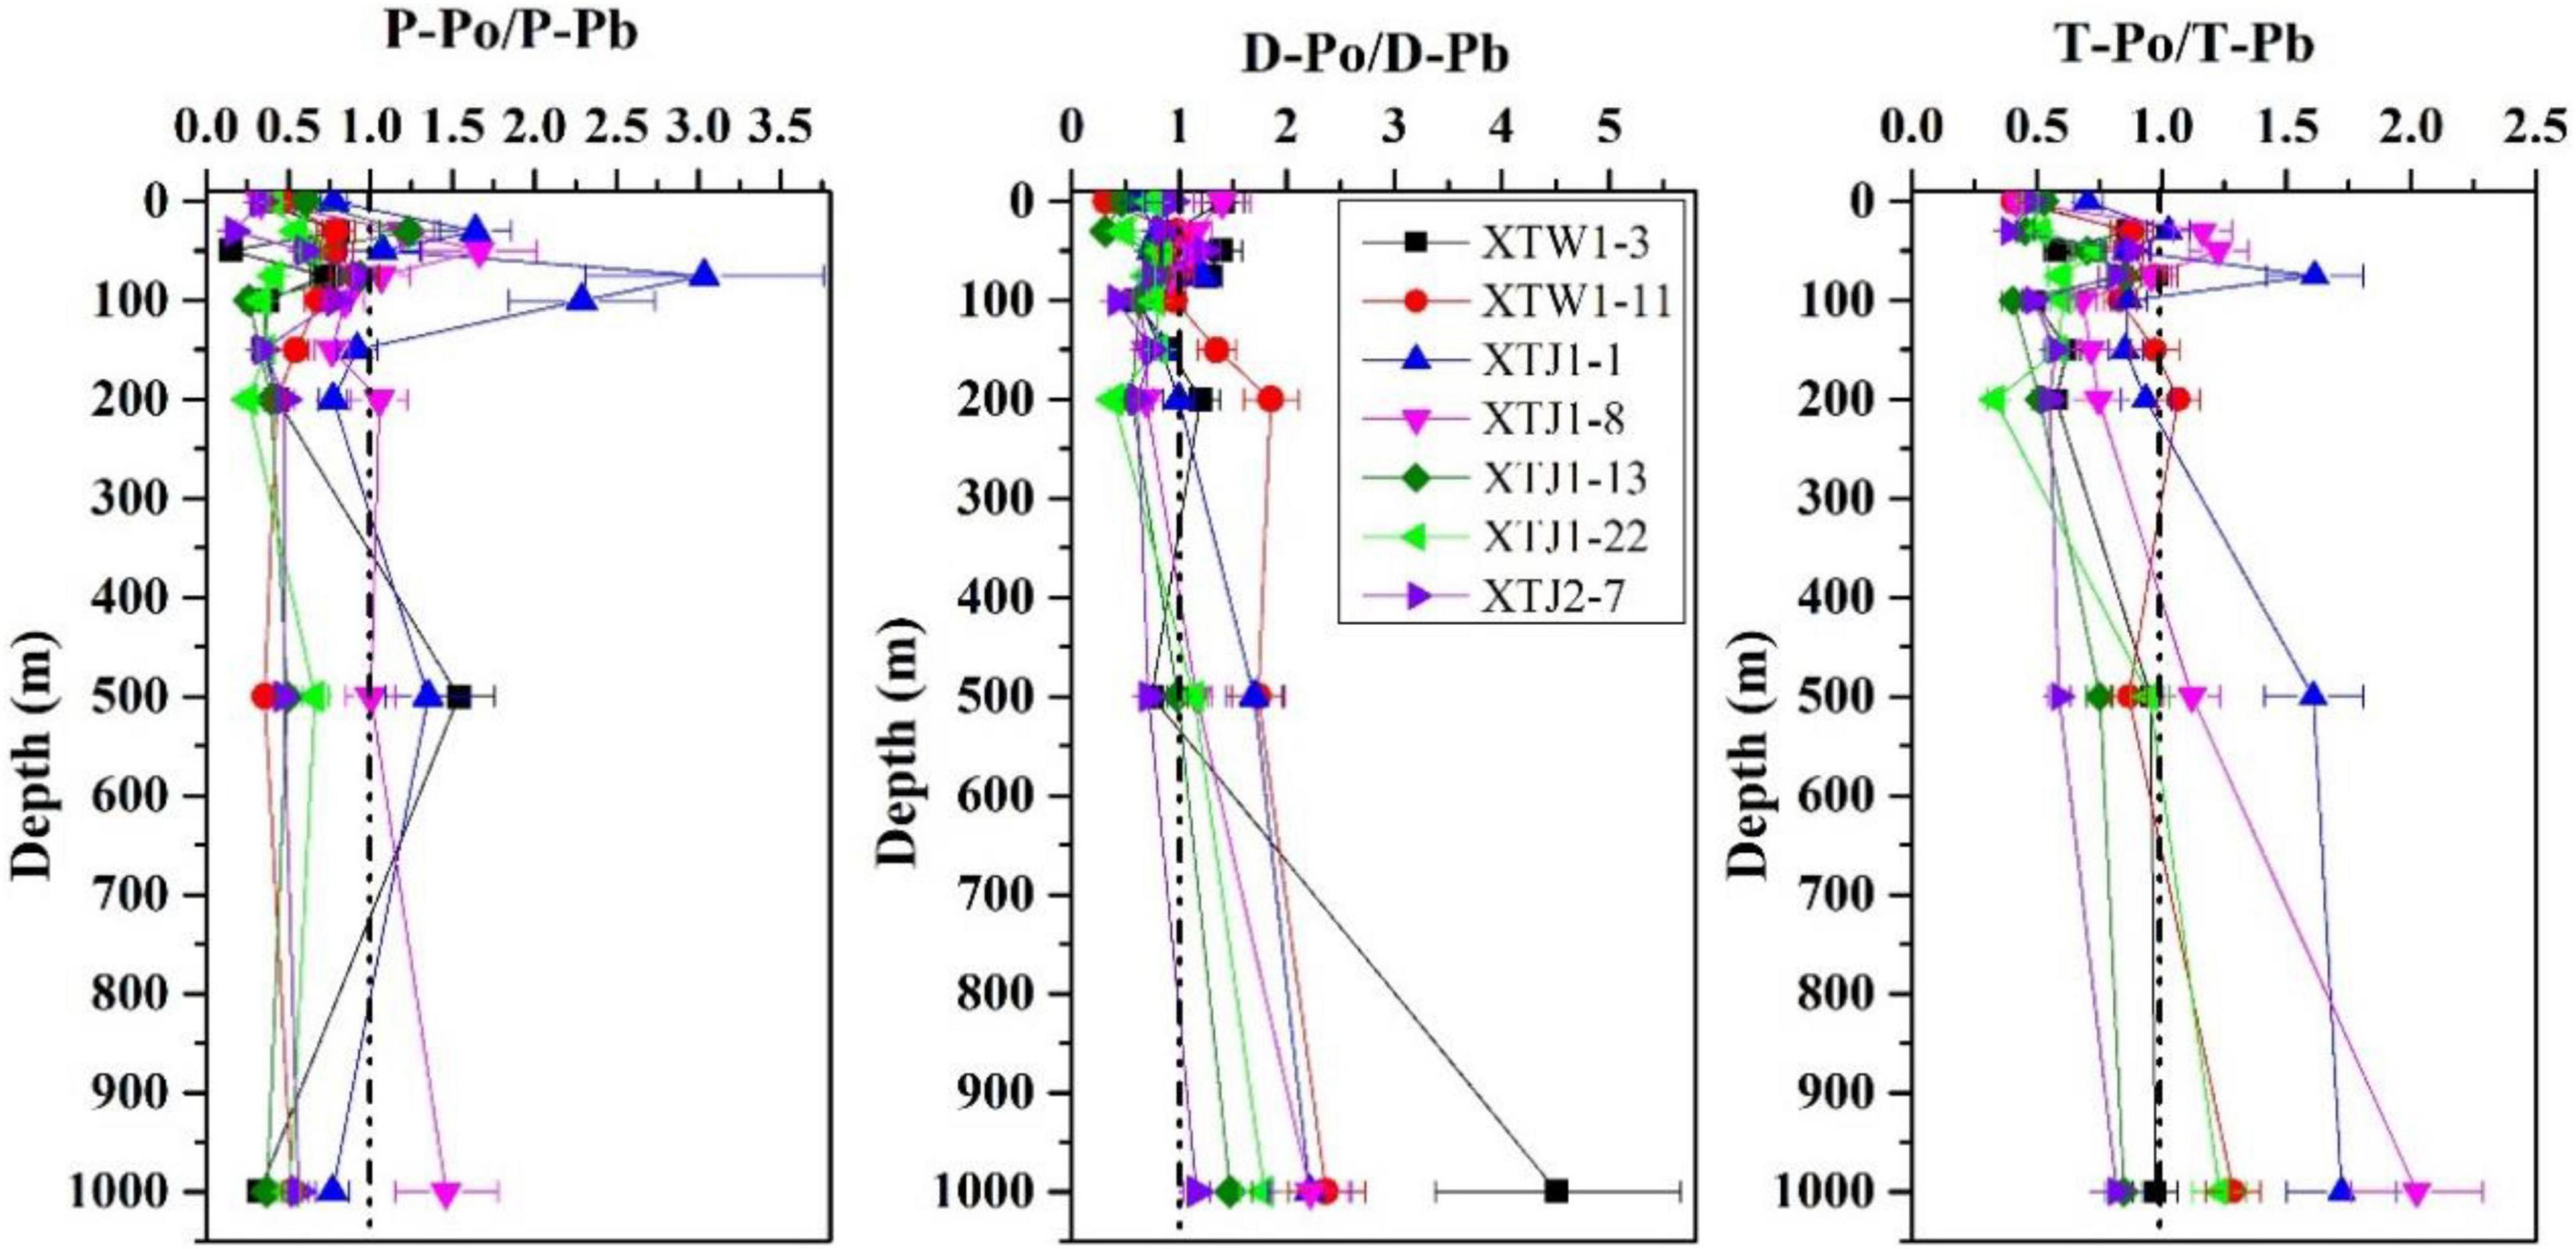
Figure 7. Profiles of the activity ratios of 210Po/210Pb in the particulate, dissolved and total fractions in w-NPO.
Discussion
Enhanced Particle Scavenging of 210Po and 210Pb and Deficiency of 210Po in the Western North Pacific Ocean
Both Pb and Po are particle-reactive elements that can be scavenged effectively from the water column by lithogenic and biogenic particles. Figure 4 reveals that both the P-Po and the P-Pb activity concentrations were highest in the near-surface (0–30 m) layers at all stations; additionally, at most stations, the highest POC concentrations were similarly detected in the upper water column (>100 m), as shown in Figure 3, which resulted in higher percentages of P-Po/T-Po and P-Pb/T-Pb ratios (>50%) in the near-surface (30–50 m) seawater. The high fraction (30–60%) of particulate 210Pb for most stations was related to atmospheric deposition of 210Pb. In the open ocean, the most important input of 210Pb is the atmospheric deposition, and the 210Pb is mainly in dissolved phase in the atmospheric deposition samples. 210Pb is particle-reactive, therefore, in the upper layer with higher primary productivity, some 210Pb sourced from the atmosphere would be absorbed and enriched by the biogenic particles. In addition, our study area is under the cover of dust deposition from the East Asia (Hayes et al., 2013); during every spring (especially in April-May), the prevailing dust storms from the East Asia would possibly increase the particulate 210Pb activity.
Furthermore, the P-Po/P-Pb ratios were nearly 1 or higher than 1 within 30–75 m at all stations (Figure 7), supporting the previously findings that 210Po was preferentially scavenged over 210Pb (Bacon et al., 1976; Murray et al., 2005; Tang and Stewart, 2019). In addition, on all profiles, both P-Po and P-Pb decreased with depth in the upper 100 m, which is consistent with the increases in D-Po and D-Pb (Figures 4, 5). The highest P-Po activity concentrations were presented at the surface for all stations (Figure 4), which could be related to particle concentration, since particle concentration is usually higher than in the twilight zone or deeper layers. D-Po increased from the surface to 1,000 m (Figure 4), especially at stations XTW1-11 and XTJ1-8, which showed subsurface D-Po maxima at 150 and 50 m, respectively. This phenomenon implies that sinking particulate matter is re-mineralized at depth in the w-NPO, which is supported by an excess of D-Po relative to 210Pb, with the D-Po/D-Pb activity ratios often > 1 below 200 m (Figure 7). Specifically, at station XTW1-11, the feature of D-Po/D-Pb > 1 appeared between 150 and 1,000 m, while at station XTJ1-1, D-Po/D-Pb > 1 only appeared between 500 and 1,000 m. Except for station XTJ2-7, the feature of D-Po/D-Pb > 1 appeared at 1,000 m for all stations (Figure 7). Based on the above discussion, it can be concluded that enhanced particle scavenging of both 210Po and 210Pb occurred in the upper ocean and that 210Po adsorbed onto particles from the upper ocean was released in the deeper ocean due to the remineralization of particulate organic matter below the mixed layer.
The minimum activity concentration of 210Po appeared at the 100 m layer at XTW1-3, XTJ1-8 and XTJ2-7, while the minimum 210Po activity concentration appeared at the 200 m layer at station XTW1-11, XTJ1-1, XTJ1-13, and XTJ1-22 (Figure 4). As shown in Figure 7, T-Po was largely deficient relative to T-Pb in the upper 200 m of the w-NPO, with the T-Po/T-Pb ratios as low as 0.4. This phenomenon is similar to the general pattern in which T-Po is usually deficient with respect to T-Pb (T-Po/T-Pb ratio = 0.5) in the euphotic zone due to the rapid removal of Po caused by the sinking of biogenic particles (Bacon et al., 1976; Nozaki et al., 1998; Stewart et al., 2010; Roca-Martí et al., 2016; Subha Anand et al., 2018). In contrast, 210Po gradually reached secular equilibrium with 210Pb or even an excess relative to 210Pb (Figure 7) at the bottom of the euphotic zone (∼150 m) or in the mesopelagic waters (500 or 1,000 m) due to the regeneration of 210Po from sinking particles during particle remineralization. For example, at stations XTJ1-1 and XTJ1-8, T-Po/T-Pb ratios were high up to 1.61–2.02 at 500–1,000 m layers. From Figures 4, 5, we can clearly find that the D-Po activity concentration increased significantly, but at the same layers, both D-Pb and P-Pb activity concentration decreased significantly. The explanation for this increased D-Po activity at the deep layer may be related to strong particle export events. We believe that a strong particle export event occurred in the upper ocean before our sampling, and subsequently sinking particles dissolved at the deep layers. This ultimately increased the activity concentration of dissolved 210Po in the mesopelagic zone. Similar research cases have also been reported in a review paper published by Verdeny et al. (2009). Such disequilibrium between 210Po and 210Pb in the water column could help depict the scavenging rates of 210Po and 210Pb and to estimate the removal flux of particulate matter in the w-NPO.
Scavenging and Removal Fluxes of 210Po and 210Pb in the Western North Pacific Ocean
210Pb and 210Po in the upper ocean come from both atmospheric deposition and in situ production via parent radionuclide decay. Generally, residence times of 210Po and 210Pb in the atmosphere are only several days to several weeks. Hence, 210Po deposition fluxes to the surface ocean are only approximately 10–20% of those of 210Pb (Masqué et al., 2002; Baskaran, 2011). Many previous researchers have applied the 210Po/210Pb disequilibrium method to trace the POC export fluxes in the open ocean, polar sea or remote sea areas, but the 210Po and 210Pb deposition fluxes have consistently been neglected due to a lack of relevant data (Friedrich and Rutgers van der Loeff, 2002; Murray et al., 2005; Le Moigne et al., 2013; Roca-Martí et al., 2016; Subha Anand et al., 2018; Tang et al., 2019; Horowitz et al., 2020). According to a compilation of global 210Pb fallout data by Du (2019), among all the observation stations worldwide, Taiwan, Shanghai and Tatsunokuchi recorded the highest annual 210Pb deposition fluxes, indicating that East Asia exhibits the highest 210Pb deposition flux in the world. Thus, when applying 210Po-210Pb disequilibrium to study particle dynamics and to estimate the POC export fluxes in the seas of East Asia, the atmospheric inputs of 210Po and 210Pb and their impacts on the POC export flux should be considered.
The 210Po and 210Pb activities in the ocean are the result of a balance among atmospheric inputs, continuous production from the decay of mother nuclides (210Pb or 226Ra) in seawater, the radioactive decay of 210Po and 210Pb, removal onto sinking particles, and transport into or out of the system by advection and diffusion. Generally, the general form of the mass balance equation in the upper ocean for 210Po and 210Pb between sources and sinks can be designed as follows:
where ∂Pb/∂t and ∂Pb/∂t are the changes in the 210Pb and 210Po activities with time, respectively; FPb and FPo (dpm/m2/d) are the atmospheric deposition fluxes of 210Pb and 210Po to the sea surface, respectively; λPb and λPo are the decay constants of 210Pb and 210Po (d–1), respectively; IRa, IPb and IPo (dpm/m2/year) are the inventories of 226Ra, 210Pb, and 210Po, respectively; kPb and kPo are the scavenging (from dissolved to particulate) rate constants of 210Pb and 210Po, respectively; and V (dpm/m2/d) is the sum of the advection and diffusion fluxes.
The advection-diffusion term is relatively important only in the case of algal blooms, mesoscale eddies, and upwelling regions (Tang et al., 2019; Horowitz et al., 2020). Generally, a steady-state model can be adopted by ignoring advection and diffusion (V≈0). Figure 8 displays the one-dimensional irreversible scavenging conceptual model for 210Po and 210Pb in surface and deep waters. Thus, Eqs. (1) and (2) can be rearranged as follows. For the upper ocean (0–150 m), we obtain:
where Eqs. (3) and (4) are mass-balance equations for D-Pb and P-Pb, and Eqs (5) and (6) are mass-balance equations for D-Po and P-Po.
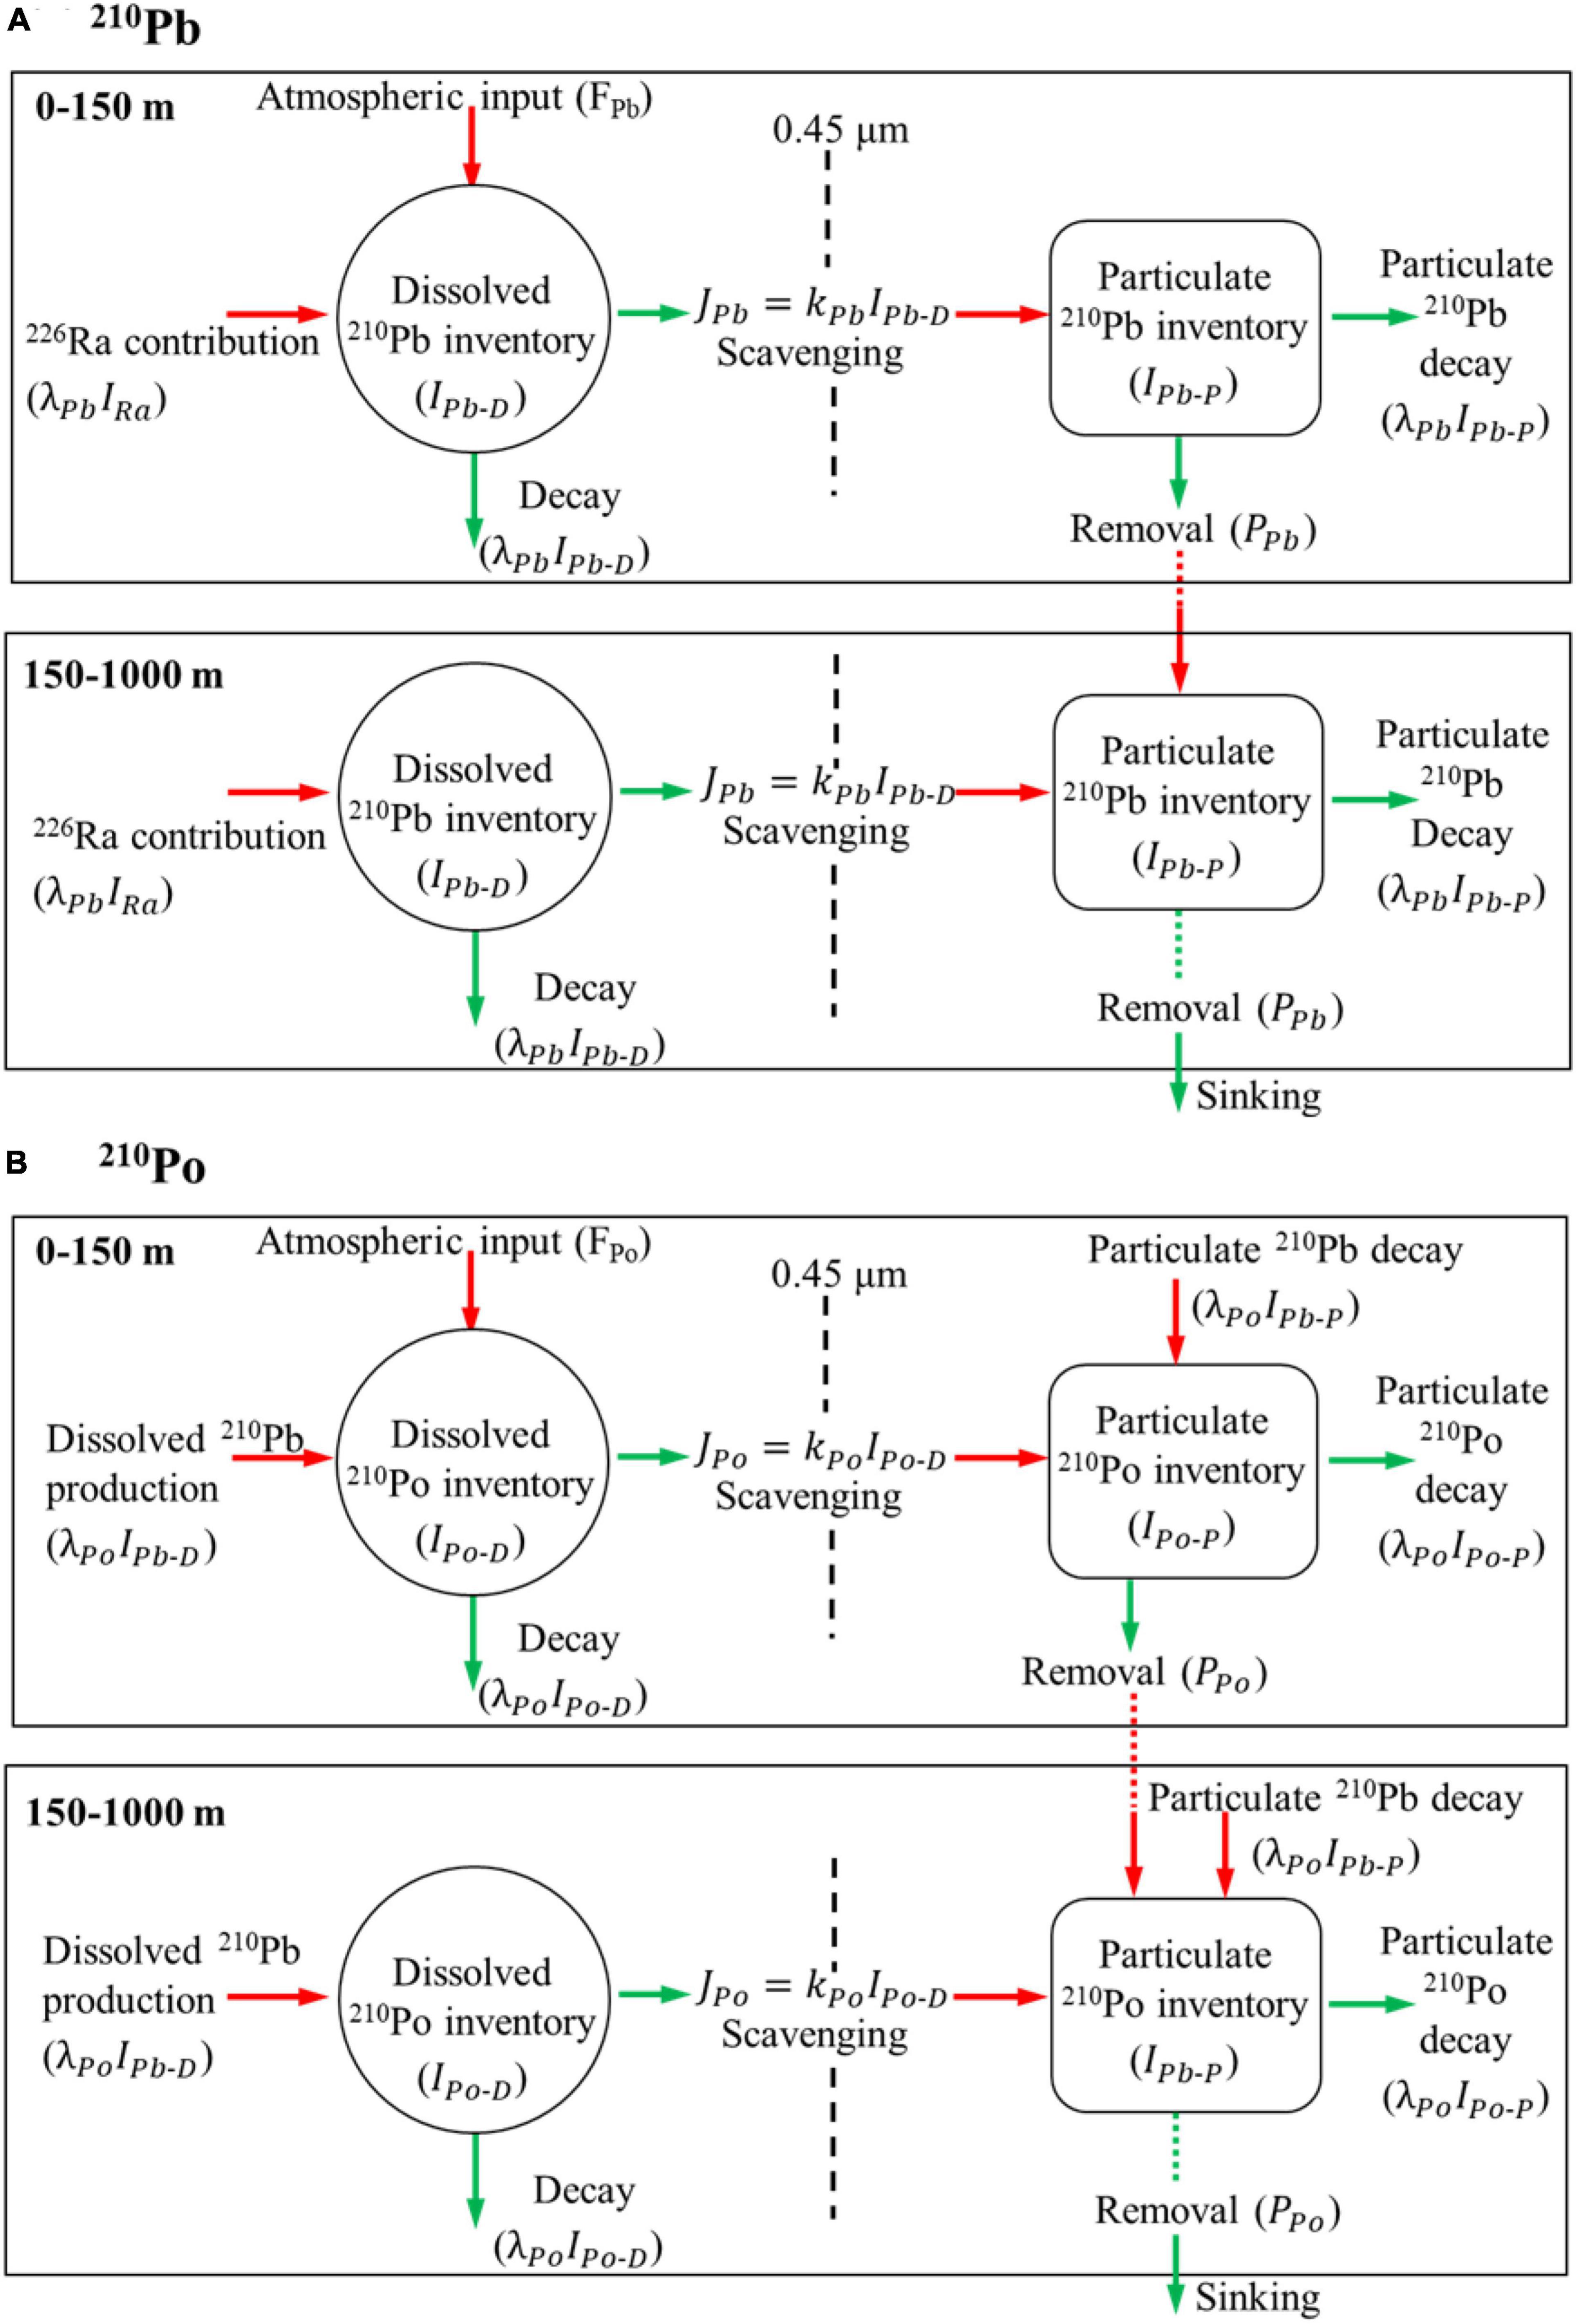
Figure 8. Conceptual diagram describing the one-dimensional steady-state irreversible scavenging model for 210Pb (A) and 210Po (B) in the upper ocean and the deeper ocean (modified from Bacon et al., 1976; Shimmield et al., 1995).
The residence times of 210Po and 210Pb in the upper ocean can therefore be written as:
Similarly, for the deeper ocean (150–1,000 m), we obtain:
The residence times of 210Po and 210Pb in the deeper ocean can therefore be written as:
In the above equations, IPb and IPo are the inventories of 210Pb and 210Po, respectively, in the different boxes; PPb and PPo are the removal fluxes of P-Pb and P-Po, respectively, by particles sinking out of the box; JPb and JPo are the rates of scavenging of 210Pb and 210Po, respectively (if a radionuclide is transferred from solution to the particulate phase by particle scavenging, then J is positive, while J is negative for opposite); and τP and τD are the residence times of the radionuclides in the particulate and dissolved phases, respectively.
The average annual atmospheric 210Pb deposition flux (FPb) in East Asian is 18540 dpm/m2/yr (n = 25, Zhong, 2020), while the atmospheric flux of 210Po (FPo) is usually assumed to be only 10% of FPb (Turekian et al., 1977; Masqué et al., 2002; Baskaran, 2011). Table 1 shows the scavenging rates, removal fluxes and residence times of 210Po and 210Pb in the near-surface and deeper ocean. Inventories of 226Ra were calculated based on published data from station KH-71-3-S (which is very close to station XTJ1-8) in the w-NPO (Nozaki and Tsunogai, 1976), the 226Ra inventories in the 0–150 m and 150-1,000 m boxes were calculated to be 14,625 dpm/m2 and 172,530 dpm/m2, respectively (see Table 2).
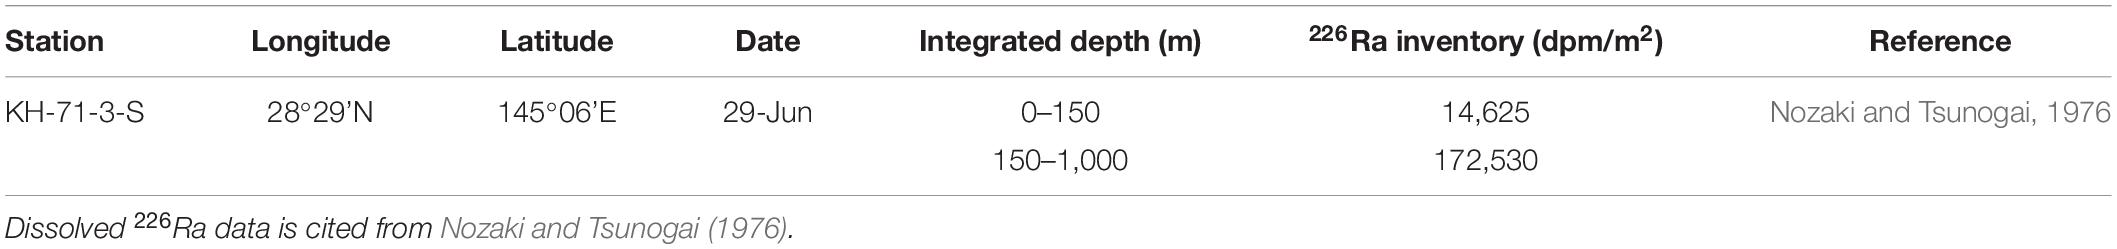
Table 2. 226Ra inventories integrated from 0 to 150 m and from 150 to 1,000 m in the w-NPO.
Within the 0–150 m surface layer, JPo ranged from 1,693 to 17,644 dpm/m2/yr; these positive values confirm that 210Po was transferred from the dissolved phase to the particulate phase due to the scavenging of sinking particles in the upper ocean. Correspondingly, the removal flux of 210Po ranged from 3,327 to 34,941 dpm/m2/year, showing a large spatial variation in the w-NPO. The residence times of D-Po (τPo–D) and P-Po (τPo–P) in the upper 0–150 m layer ranged from 0.6 to 5.5 year and from 83 to 921 days, respectively. Interestingly, the values of τPo–D (0.6–1.2 year) and τPo–P (83–93 days) at the three more northerly stations (XTJ1-13, XTJ1-22, and XTJ2-7) were much lower than the values of τPo–D (1.6–5.5 year) and τPo–P (130–921 days) of the more southerly stations (XTW1-3, XTW1-11, XTJ1-1, and XTJ1-8). Generally, the residence time of 0.6 years was common for dissolved 210Po under more biologically productive conditions in the ocean (Shimmield et al., 1995). The τPo–D at stations XTJ1-13, XTJ1-22, and XTJ2-7 were much shorter than the other four stations, and correspondently, the average POC concentration at 0–150 m box were higher than the other four stations (Table 1), which supports that the residence time of dissolved 210Po was shorter when the biological activity was higher. In addition, longer particulate residence times are related to inefficient vertical removal processes (low export fluxes), which can be confirmed from the removal flux of 210Po (PPo). As seen from Table 1, the PPo values of the three more northerly stations (3,327–17,242 dpm/m2/year) were much lower than those of the four more southerly stations (14,785–34,941 dpm/m2/year). The above phenomena suggest that the upper waters of the southern part of the w-NPO are characterized by inefficient vertical removal processes and high turnover rates, while strong particle export occurred in the northern part of the w-NPO.
At greater depths (150–1,000 m), the JPo values were negative at all stations except stations XTJ1-13 and XTJ2-7 (Table 1), further demonstrating the occurrence of 210Po remineralization in the deeper ocean. However, due to the release of 210Po, τPo–D could not be calculated at almost all stations in the deeper layer (150–1,000 m) except at station XTJ1-13. The PPo values were negative at stations XTJ1-1 and XTJ1-8, implying that 210Po could not be removed from the 150–1,000 m layer to the much deeper (>1,000 m) ocean at these two sampling sites. In addition, the τPo–P in the 150–1,000 m layer ranged from 85 to 331 d at the remaining four stations (XTW1-3, XTJ1-13, XTJ 1-22, and XTJ2-7).
In the upper 0–150 m, the scavenging rates of 210Pb (JPb) varied between 18,373 and 18,720 dpm/m2/yr and the removal fluxes of 210Pb (PPb) ranged from 17,835 to 18,454 dpm/m2/year (Table 1). As atmospheric input is the dominant source term for 210Pb in the upper ocean, the removal flux of 210Pb was close to the constant atmospheric 210Pb deposition flux of 18,540 dpm/m2/year. The values of τPb–D and τPb–P in the upper ocean (0–150 m) were nearly on the same level, ranging from 0.47 to 1.09 year and from 0.33 to 0.98 year, respectively. However, in the deeper ocean (150–1,000 m), the scavenging rate of 210Pb decreased significantly to a low level of 3,103–3,800 dpm/m2/year, whereas the removal flux of 210Pb remained at a high level (15,575–17,649 dpm/m2/year). Moreover, the residence times of D-Pb and P-Pb below 150 m were calculated to be 13.1–22.9 and 1.1–5.5 year, respectively.
Particulate Organic Carbon Export Flux Estimated From 210Po Deficiency
The scavenging of particle-reactive nuclides produces a deficiency of the daughter nuclides with respect to their parents in the water column. From these daughter deficiencies, Buesseler et al. (1992) developed a method to estimate the POC export flux (FPOC) from the upper ocean by using 234Th-238U disequilibrium, and this method has been applied extensively. FPOC can be derived by multiplying the daughter nuclide removal flux from the euphotic zone by the ratio of the POC concentration to the daughter nuclide activity of the total particulate material. Similarly, based on the 210Po deficiency, the POC export flux is expressed as follows:
where denotes the measured POC/210Po ratio in particulate matter, and PPo denotes the removal flux of 210Po at the output interface of 150 m.
Similarly, Coale and Bruland (1987) showed that the profile of 234Th was closely linked to the profiles of nutrients and chlorophyll, implying that the cycling of 234Th was linked to the cycling of organic matter. This led Eppley (1989) to assume that, if the residence times of POC and 234Th in surface waters are similar, the 234Th flux can be used to calculate FPOC. Because 210Po has stronger particle affinity in organic matter than 234Th, 210Po could be superior to 234Th as a tracer for POC; hence, based on Eppley’s assumption, the 210Po-based POC flux can also be derived as follows:
where IPOC stands for the integral inventory of POC in the upper ocean and τPo–P is the residence time of 210Po in the particulate phase.
The POC fluxes estimated by the Eppley and Buesseler models in the upper layer of the w-NPO (0–150 m) are displayed in Table 3 and Figure 9. From Figure 9A, we can divide these seven stations into two groups. One group (Group I) includes the station XTW1-3 in the Luzon Strait, station XTJ2-7 in the northern Shikoku Basin, and station XTJ1-22 located in the Oyashio Current -Kuroshio Current boundary near the main island of Japan, which showed a higher estimated FPOC level of 6–9 mmol C/m2/d (see Table 3 and Figure 9A). The common characteristic of Group I was that all of them were located near the continental shelf of East Asia. However, station XTJ1-22 was also affected by the cold and nutrient-rich Oyashio Current, which appears to promote high primary production and subsequently high POC export flux. Therefore, the FPOC of station XTJ1-22 was the highest among all stations (Figure 9A).
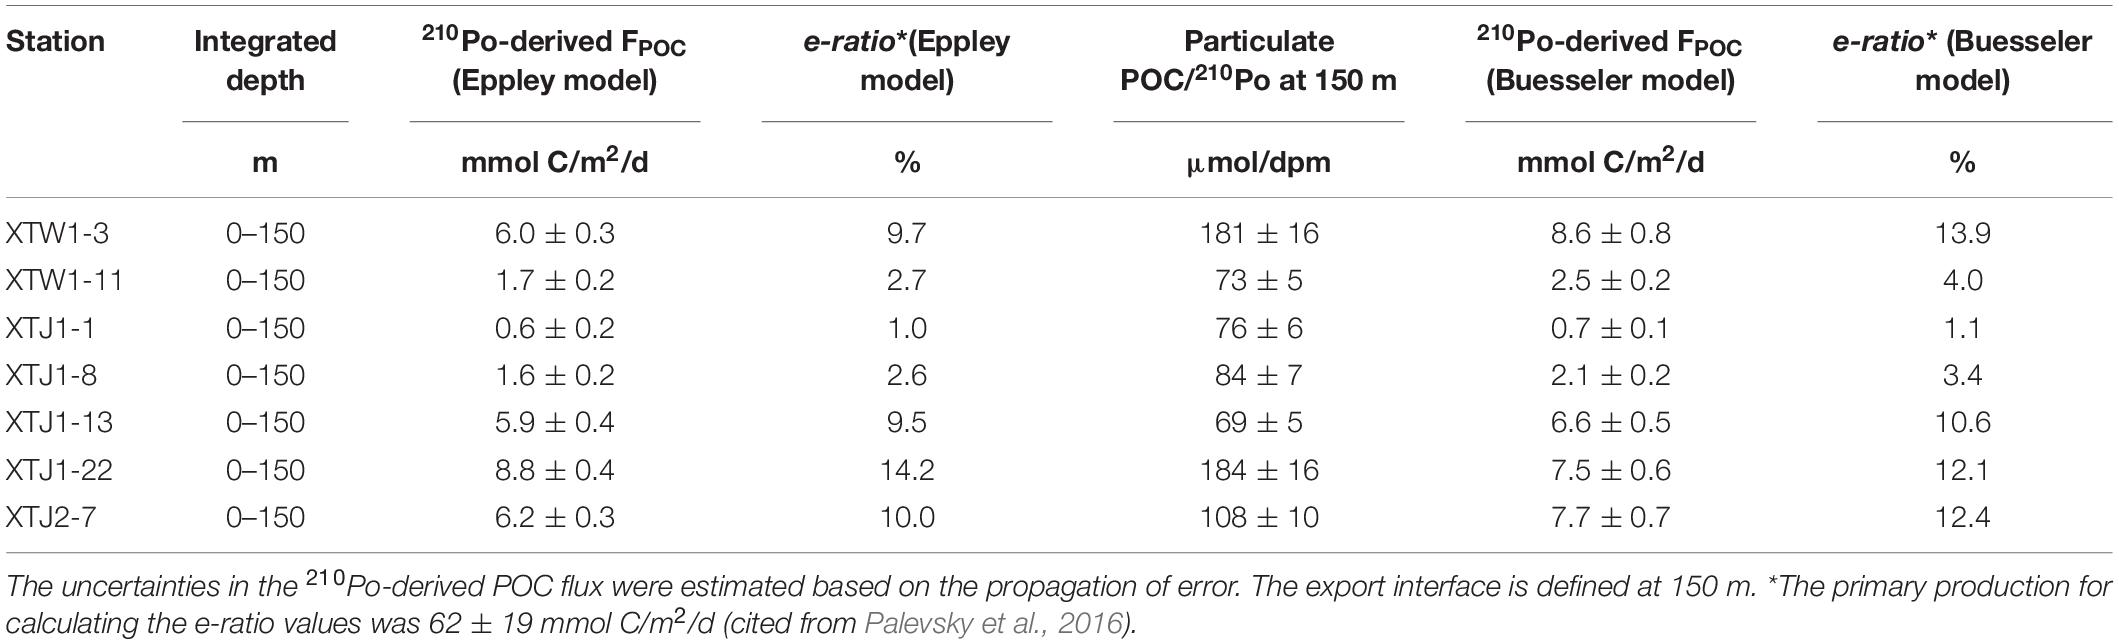
Table 3. POC fluxes and e-ratios derived from 210Po tracer by the Eppley and Buesseler models.
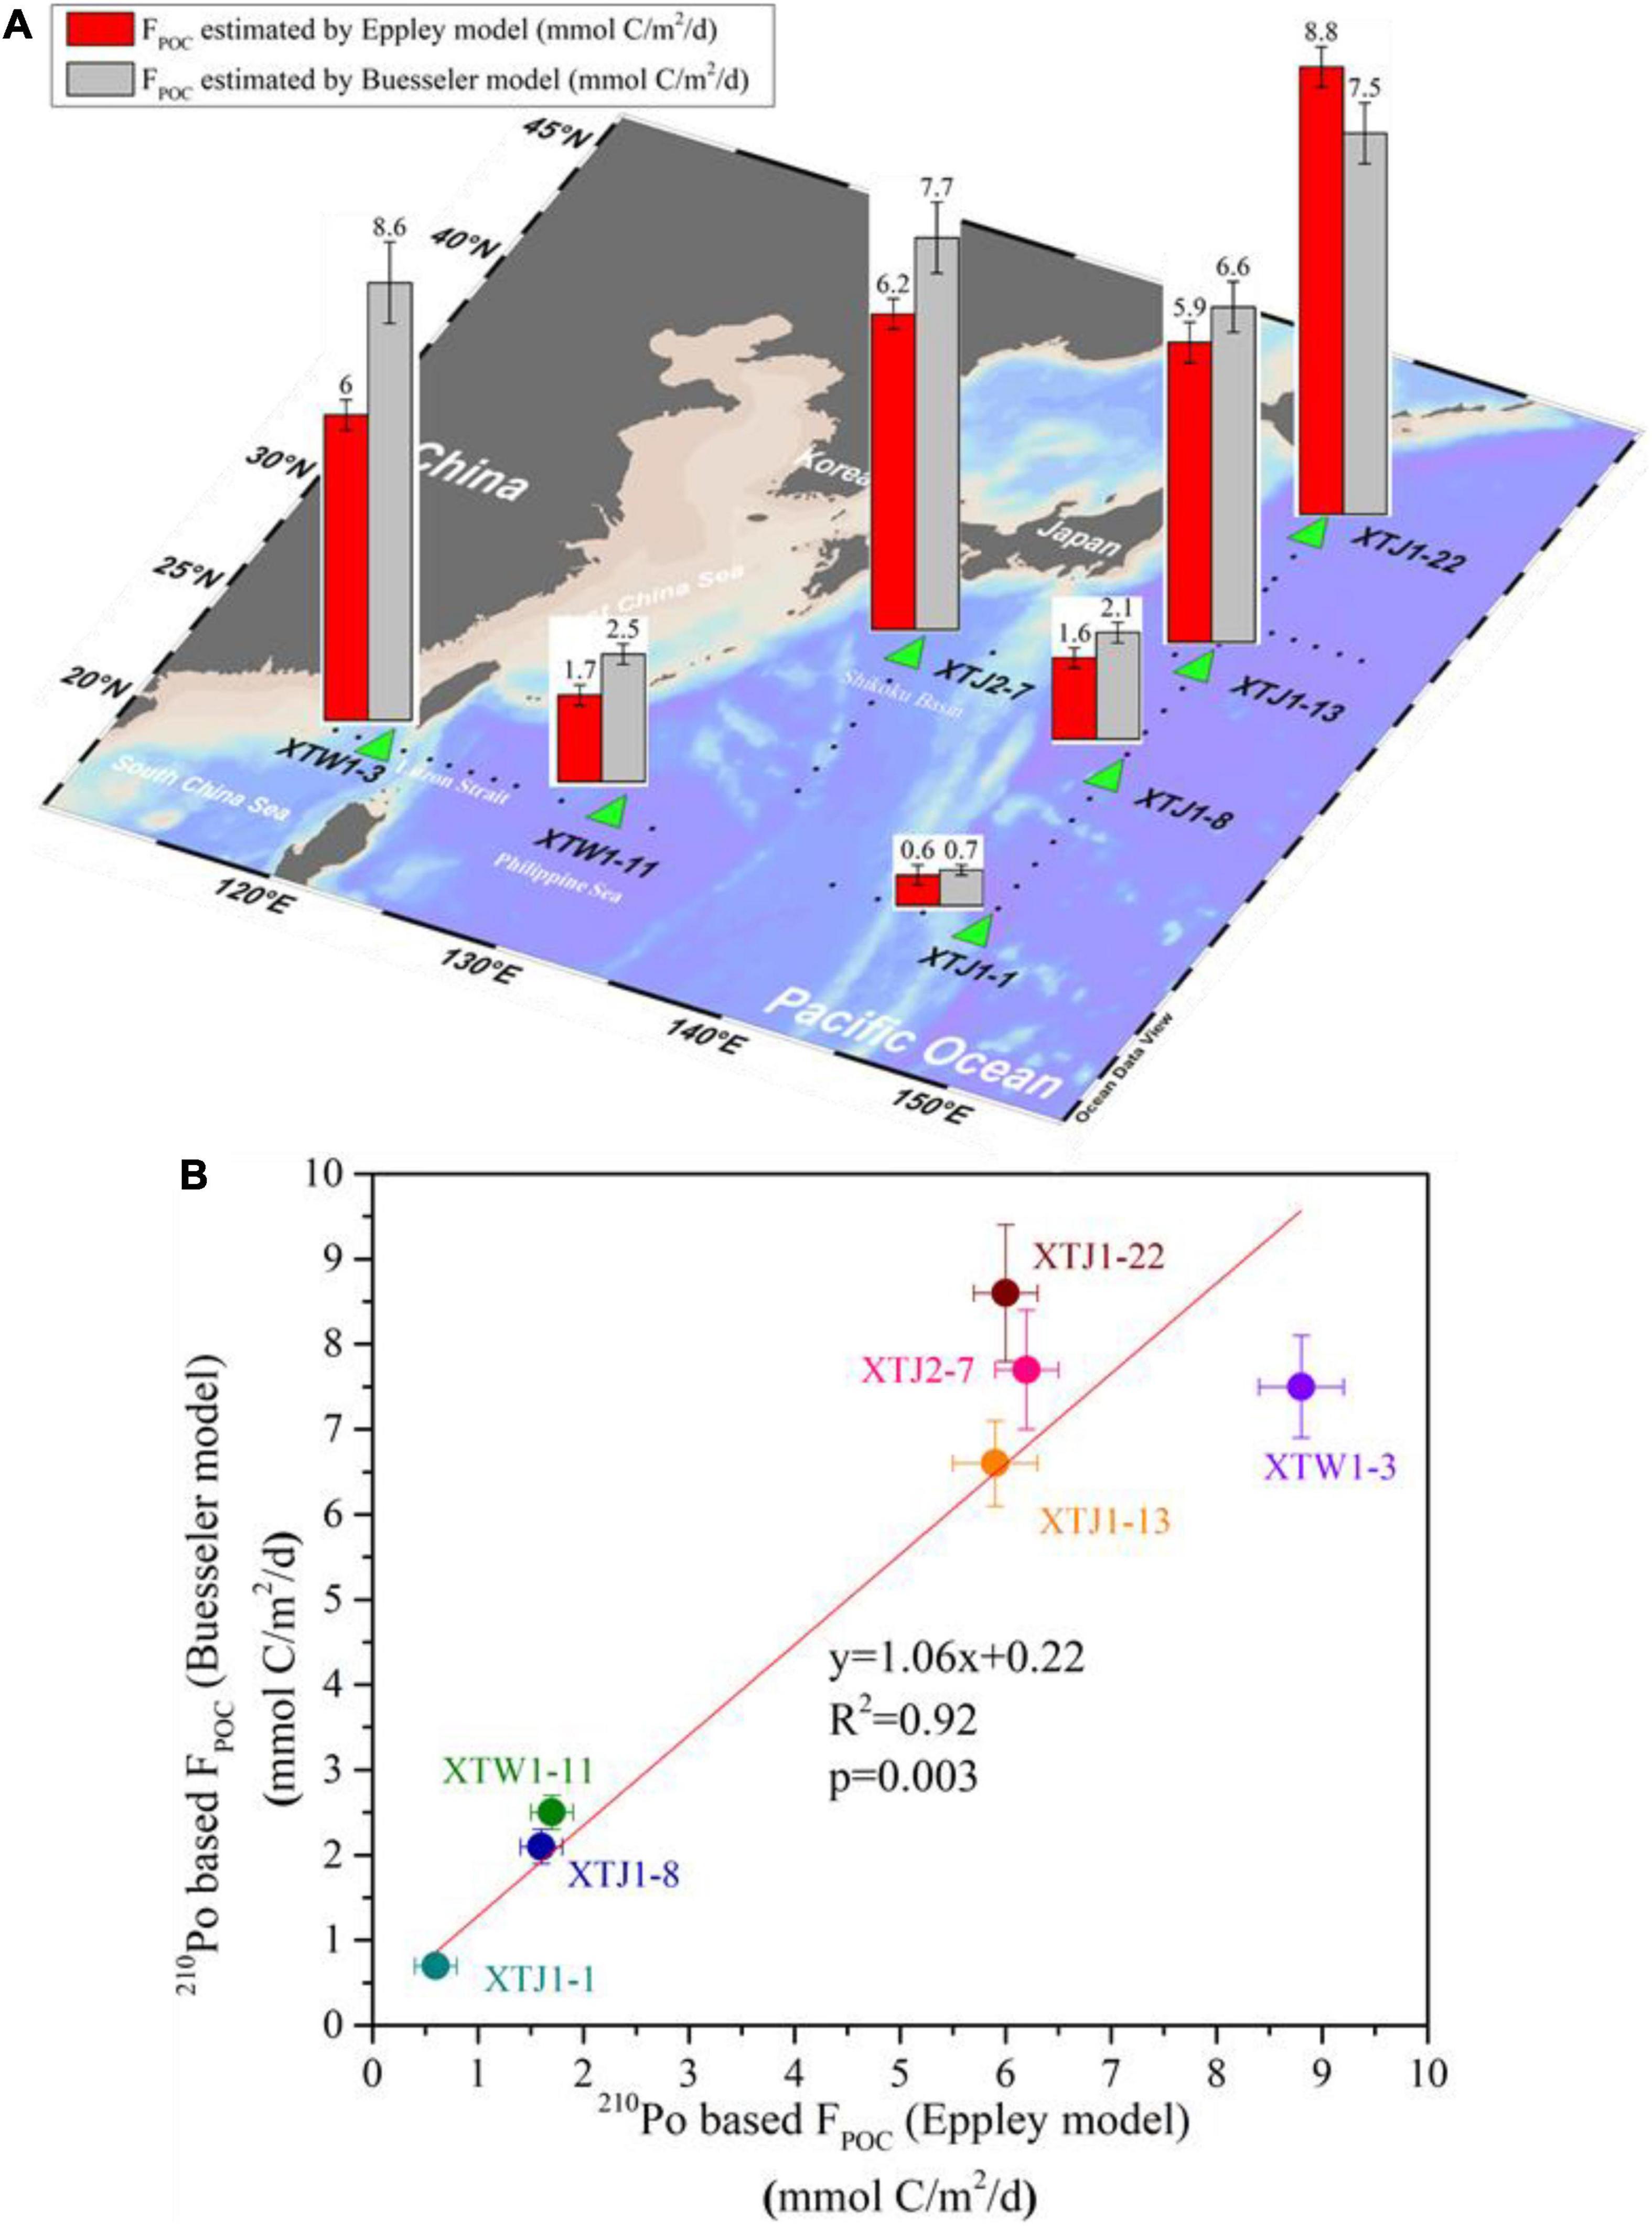
Figure 9. (A) Spatial distribution of POC export fluxes derived from 210Po for the upper w-NPO. (B) Relation between the Eppley and Buesseler model-calculated POC export fluxes.
By contrast, the other four stations (XTJ1-1, XTW1-11, XTJ1-8, and XTJ1-13 station) can form another group (Group II), which denoted a lower POC export flux level in the w-NPO (Figure 9A). Concretely, the lowest POC export (<1 mmol C/m2/day) was found at station XTJ1-1 in the Marianas Trench, at which the negligible sinking flux of 210Po (3,327 dpm/m2/year, Table 1) was the most obvious feature. The relatively lower POC export fluxes (1–2 mmol C/m2/day) at stations XTW1-11 and XTJ1-8 were derived from the relatively low sinking fluxes of 210Po (Table 1) and relatively low particulate POC/210Po ratios (Table 3). Geographically, these four stations of Group II (XTW1-11, XTJ1-1, XTJ1-8, and XTJ1-13) were located in the central gyre of the w-NPO, which had the lower particulate POC/210Po ratios in total suspended matters comparing with values of the stations (XTW1-3, XTJ1-22, and XTJ2-7) in Group I close to the East Asian continent (Table 3). FPOC of stations in Group II were much lower than those of Group I, which may be related to the dominated phytoplankton. The central gyre of the w-NPO (stations of Group II) is an oligotrophic area where the phytoplankton community is dominated by picoplankton (such as smaller diatoms or coccolithophores), and these small size phytoplankton produce a low POC flux due to the oligotrophic living conditions in this region. Interestingly, in these areas, stations in Group II had much higher particulate POC/210Po ratios than those of stations in the central gyre of the w-NPO (Group I). For example, the stations XTW1-3, XTJ1-22, and XTJ2-7, located at the margins of the Chinese mainland and the main island of Japan, have higher particulate POC/210Po ratios of 181 ± 16, 184 ± 16, and 108 ± 10 μmol/dpm, respectively. And the other four stations XTW1-11, XTJ1-1, XTJ1-8, and XTJ1-13, located in the central gyre of the w-NPO, have much lower particulate POC/210Po ratios of 73 ± 5, 76 ± 6, 84 ± 7, and 69 ± 5 μmol/dpm, respectively (Table 2). Generally, smaller phytoplankton cells can scavenge more 210Po (smaller particles dominate higher particulate 210Po activity relative to larger particles in the non-oligotrophic area) due to their larger surface area per unit of volume, lowering their particulate POC/210Po ratios (Tang et al., 2019).
Overall, the POC fluxes calculated by the Eppley method and Buesseler method ranged from 0.6 to 8.8 mmol C/m2/d and from 0.7 to 8.6 mmol C/m2/d, respectively (Figure 9A). These values are in good agreement with the estimated POC fluxes derived via the steady-state 210Po-210Pb method in other open oceans with similar latitudes (negligible to 8.5 mmol C/m2/day) (Kim and Church, 2001; Stewart et al., 2007; Verdeny et al., 2009; Roca-Martí et al., 2016; Tang et al., 2019; Horowitz et al., 2020). From Figure 9A, although there are some differences, Eppley model and Buesseler model-derived FPOC, are very similar within uncertainties. Buesseler model estimated FPOC were 24 and 43% higher than that of Eppley model for stations XTW1-3 and XTJ2-7, respectively. However, Eppley model-derived FPOC was 17% higher than that of Buesseler model for station XTJ1-22. The difference of FPOC results given by different models may be related to the assumptions of the models. For example, the Eppley model’s assumption that the residence times of POC and particulate daughter radionuclides (234Th or 210Po) should be the same within the upper ocean is possibly too demanding in the real ocean and therefore is often difficult to achieve. Murray et al. (1989) compared the residence times of 234Th and POC in the euphotic zone of the eastern equatorial Pacific and found that the residence time of 234Th was approximately three times less than that of POC. In contrast, the Buesseler model needs to assume only that the same particulate matter serves as the carrier of POC and 234Th (or 210Po), which is relatively easy to achieve in the actual sea. For some specific stations, the difference between two models may be significant, hence, more care should be taken when selecting the model. But on a larger spatial scale in our study area, Eppley model can also provide reasonable estimation results. For example, Figure 9B shows that Eppley model-derived FPOC was well correlated with the Buesseler model-derived FPOC in the w-NPO (n = 7, slope = 1.06, R2 = 0.92, p = 0.003); additionally, the 210Po-POC export fluxes based on the Eppley and Buesseler models had very similar spatial distribution features (Figure 9A). These evidences suggest that the hypothesis of the Eppley model is also valid in the w-NPO and this agreement of Eppley model-derived FPOC and Buesseler model-derived FPOC in the w-NPO probably suggest the residence times of 210Po and POC were similar in the upper ocean.
Comparison of Particulate Organic Carbon Export Fluxes Among Different Regions of the Western North Pacific Ocean and Its Surrounding Marginal Seas
The 210Po-derived POC export fluxes from the upper ocean (5.9–8.8 mmol C/m2/day) at the stations along the edges of the w-NPO (close to the East Asian land masses) were significantly higher (by a factor of 2∼14) than the fluxes determined from the interior (oligotrophic) seawater in the w-NPO (i.e., XTW1-11, XTJ1-1, and XTJ1-8: 0.6–2.5 mmol C/m2/d) (Table 3 and Figure 9). Comparing our POC fluxes with other fluxes in different regions of the Pacific Ocean and its surrounding marginal seas (Table 4, in which the POC fluxes were estimated either by sediment traps or by the 234Th-238U and 210Po-210Pb disequilibrium methods), reveals systematic higher POC fluxes occurring in the marginal seas surrounding the w-NPO (Figure 10). For example, the POC export fluxes in the Pacific Ocean were much smaller than those reported for the SCS (2.0–16.7 mmol C/m2/day, 234Th-238U disequilibrium, Zhou et al., 2020), inner shelf of the ECS (4.8–65.4 mmol C/m2/day, trap, Hung et al., 2013), and the Sea of Japan (3.2–26.3 mmol C/m2/day, 234Th-238U disequilibrium, Kawakami et al., 2015).
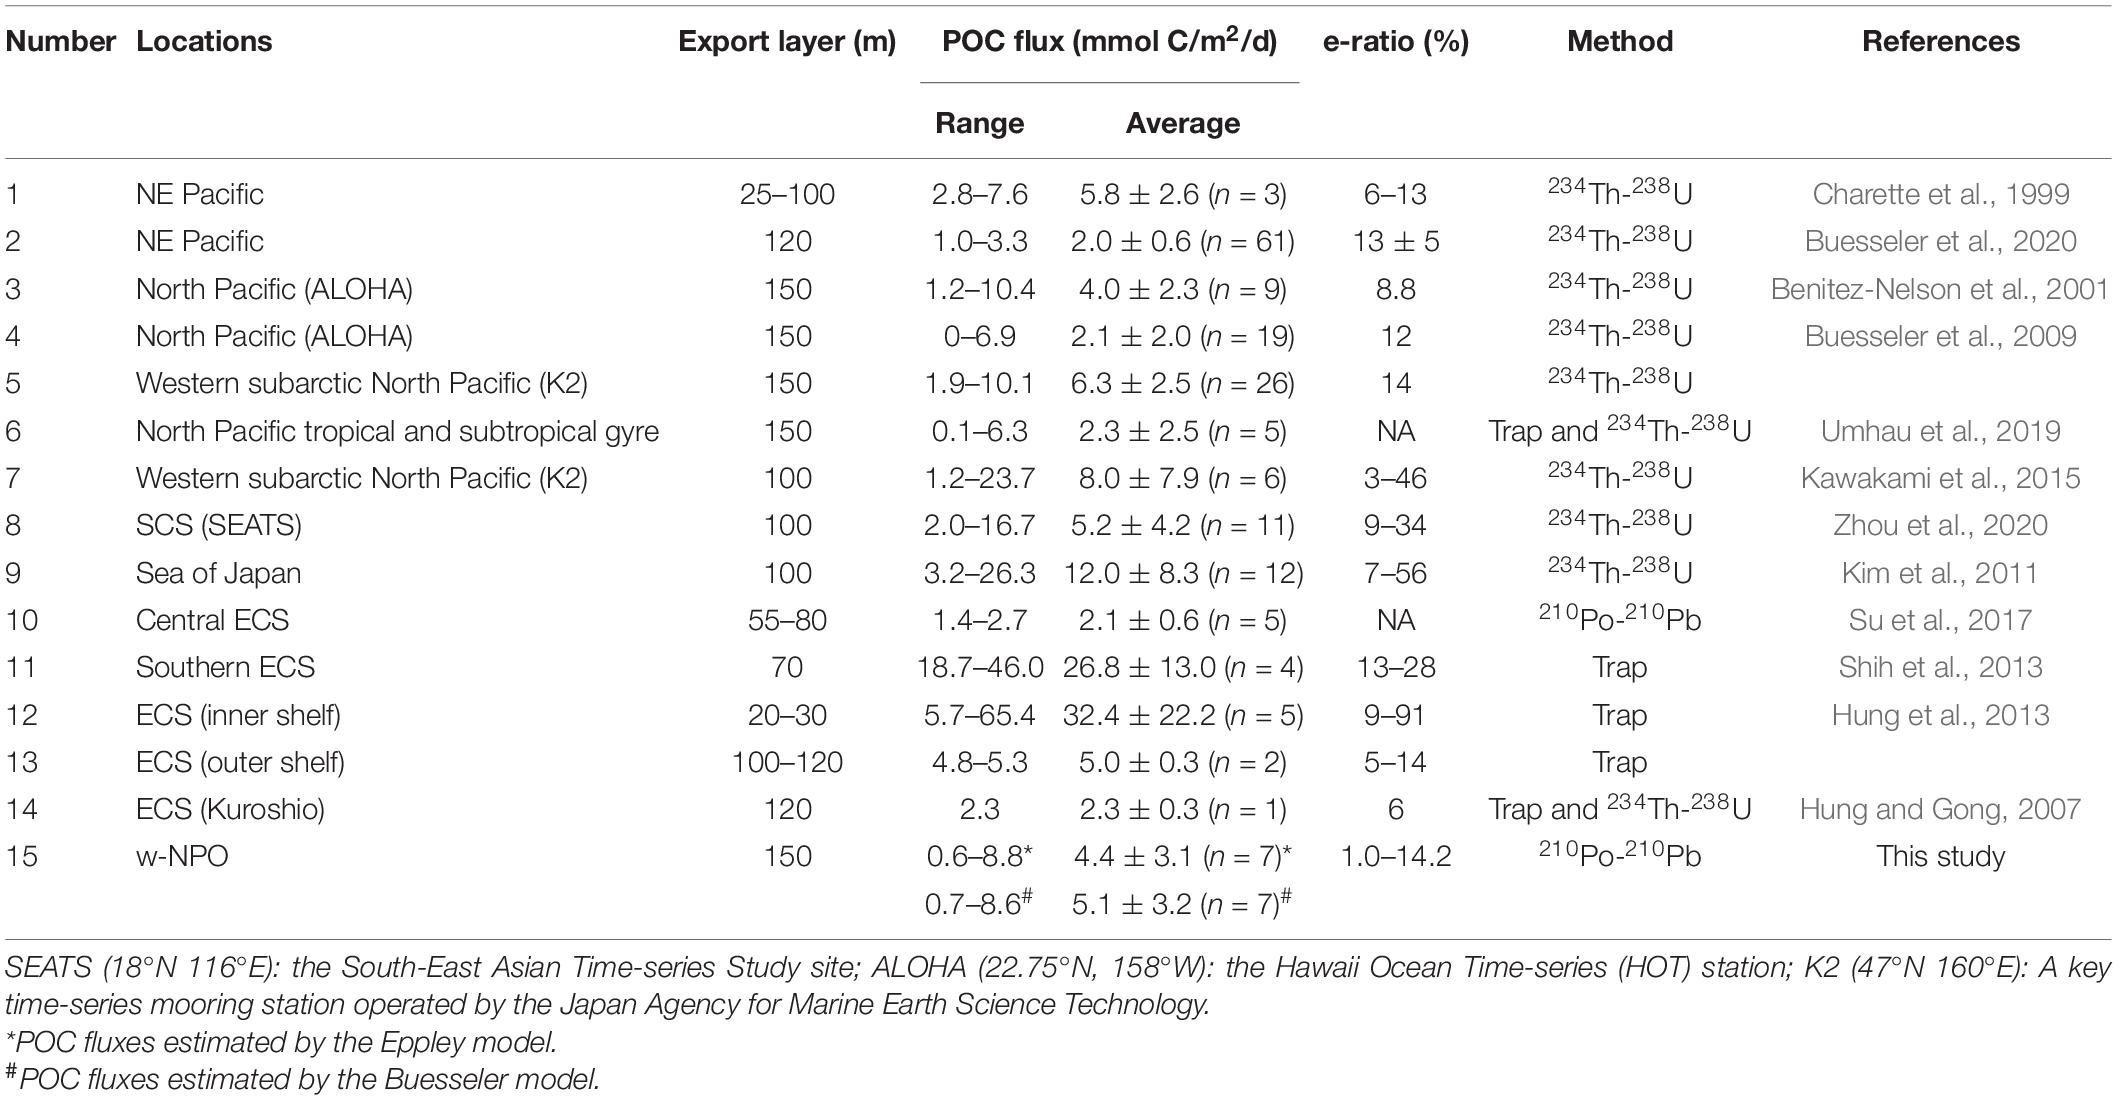
Table 4. Comparison of the POC export fluxes estimated in different regions throughout the w-NPO and its surrounding marginal seas.
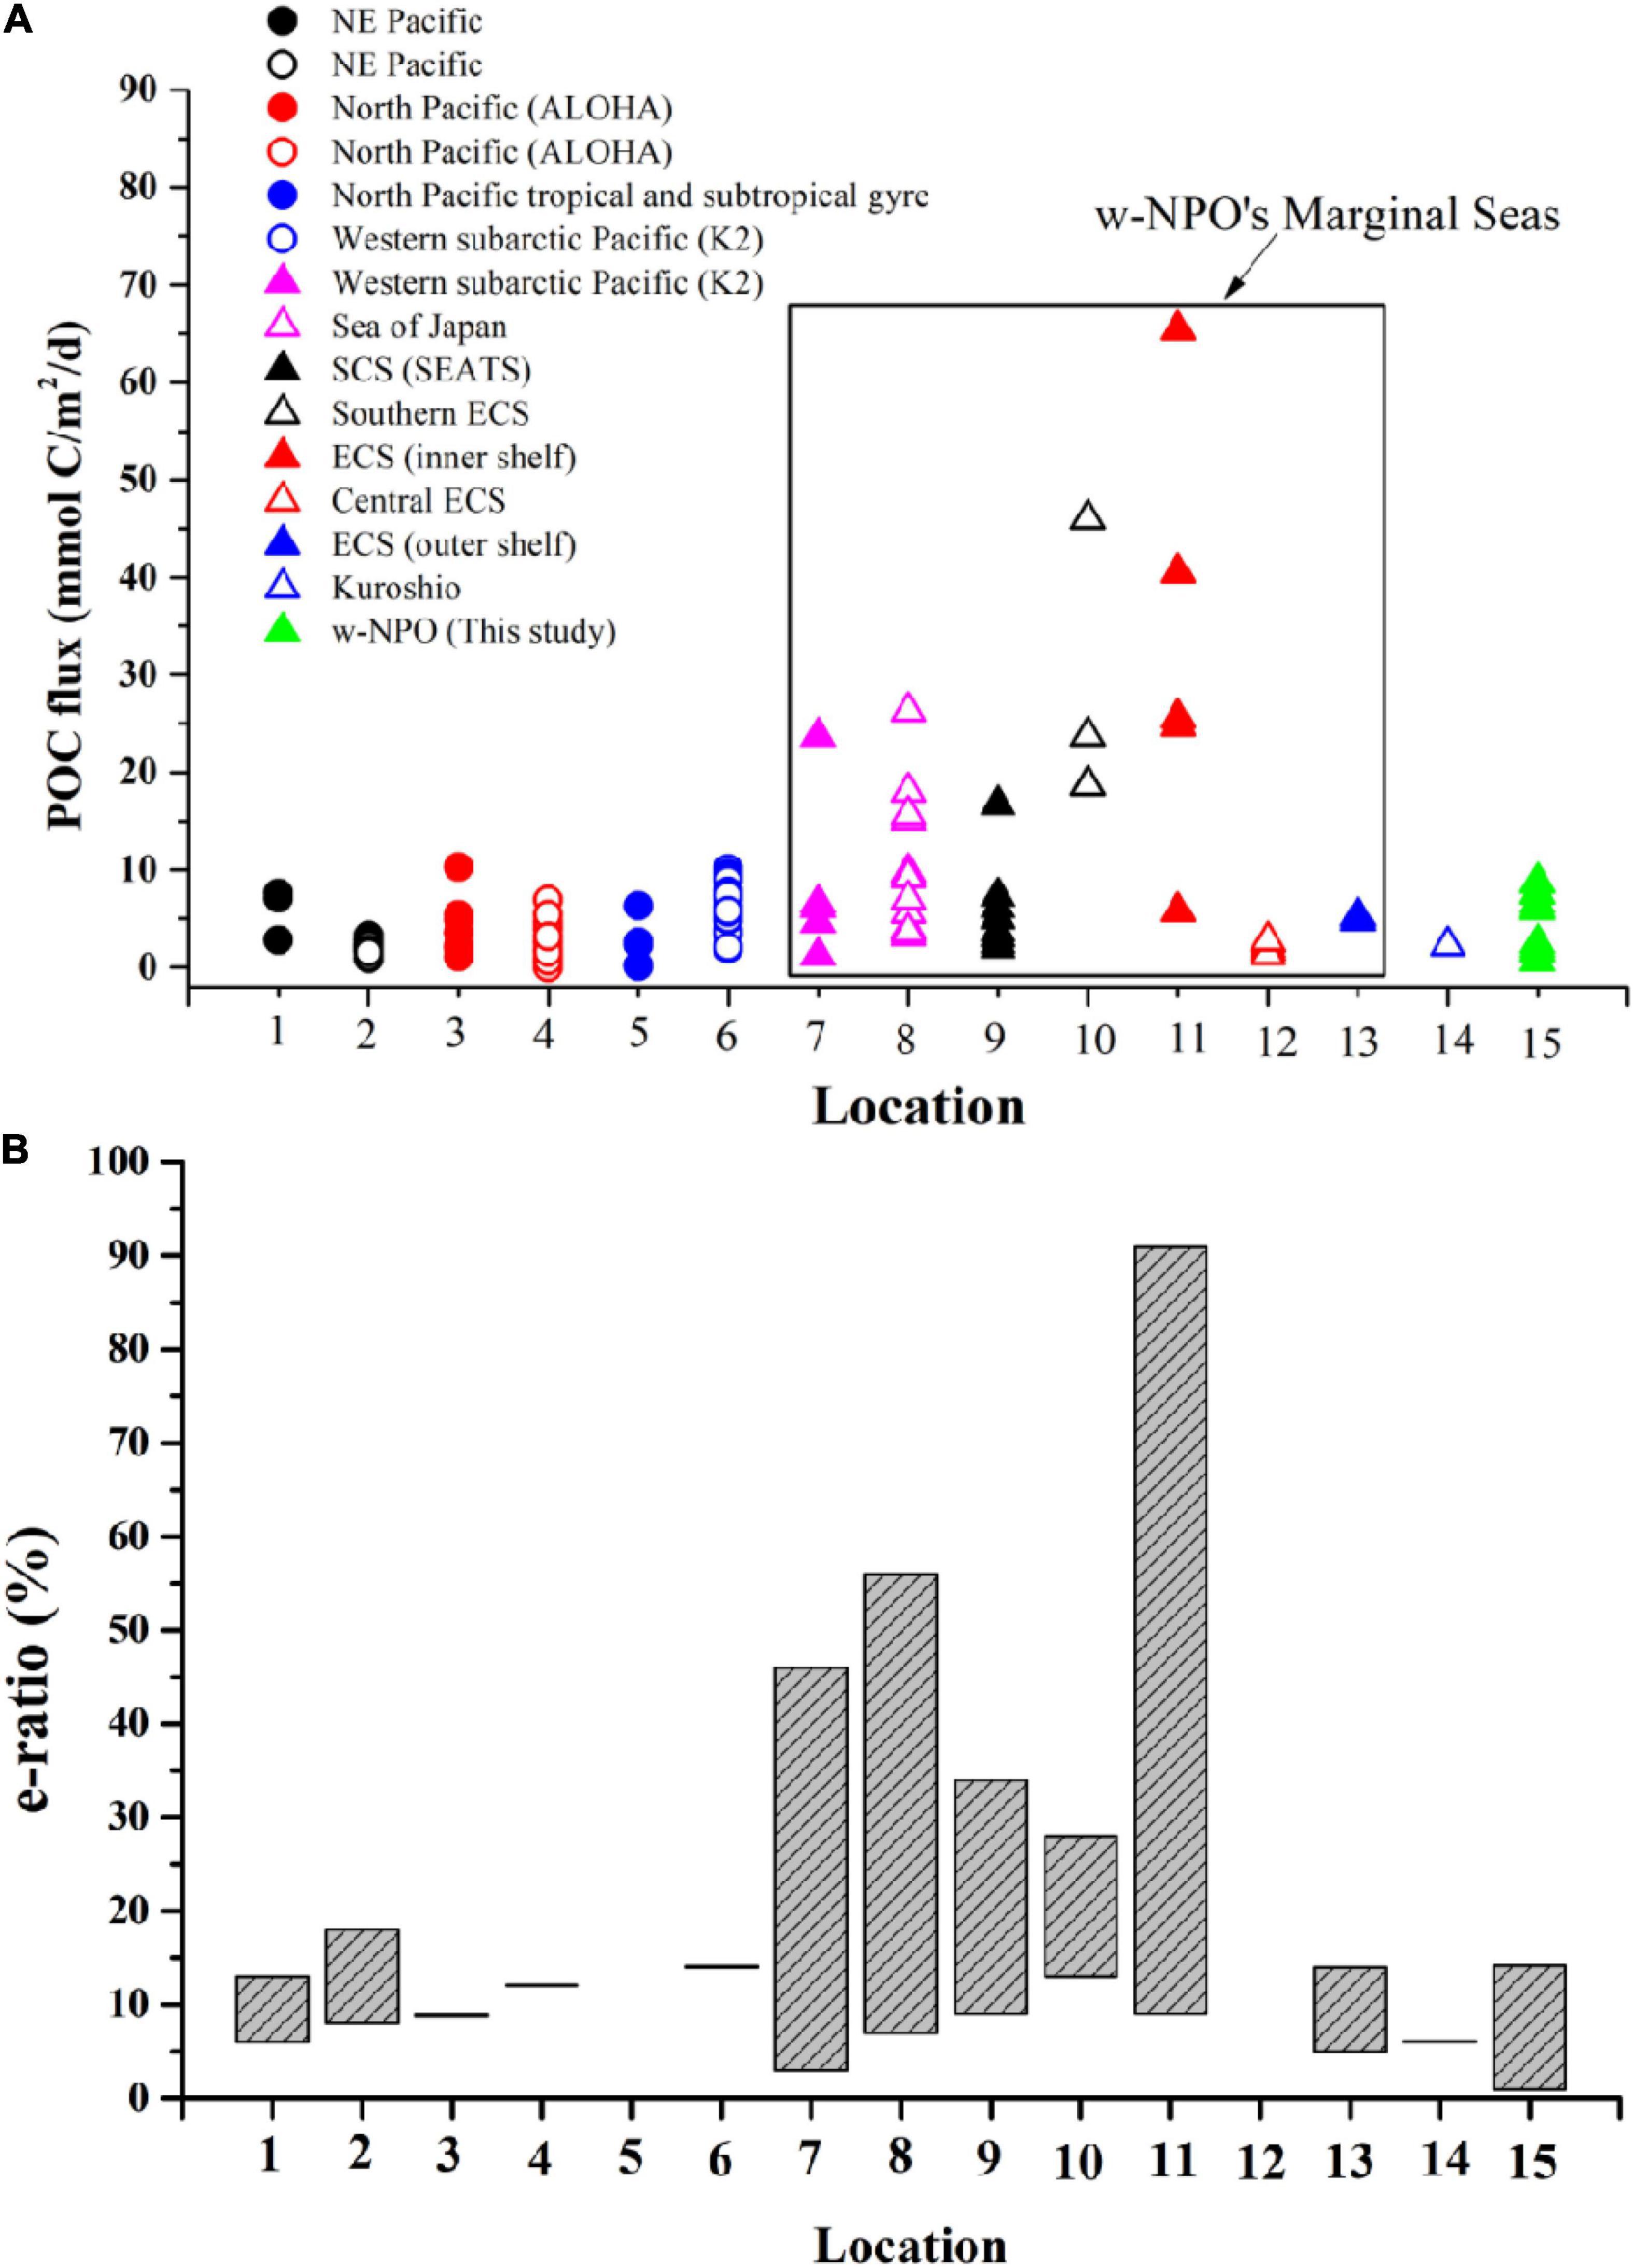
Figure 10. Comparison of the POC export fluxes (A) and export efficiency (B) in different sea areas of the Pacific Ocean and its marginal seas. Data are derived from the references in Table 4 and this study.
The NPO is a region of particular interest for quantifying the rate and efficiency of the BCP, as this region is a major sink for atmospheric CO2, absorbing 0.5 Pg C/year, ∼25% of the total ocean CO2 uptake (Takahashi et al., 2009). As an important part of the NPO, the subtropical oligotrophic w-NPO is a typical nitrate-deficient water region and is characterized by low chlorophyll-a (Chl a) concentrations (Chen et al., 2013), and this region occurs a band of strong CO2 uptake between 30 and 40°N, overlapping with the transition zone between the subtropical and subarctic gyres (Shih et al., 2015). Researchers stated the importance of the contributions of biological carbon export to the NPO sink (Ayers and Lozier, 2012). However, the characteristics of the POC export flux in the w-NPO region are not well understood (Kawakami et al., 2015; Shih et al., 2015). Using the information available, based on the summary of the published POC export fluxes in the North Pacific Ocean (Table 4 and Figure 10), we can obtain a preliminary general view for the distribution feature of POC export flux. Although there were spatial differences, the overall mean level of POC export flux was below 10 mmol C/m2/day. Specifically, the POC fluxes in our study area of the w-NPO (0.6–8.8 mmol C/m2/day) are comparable to the results of other published studies obtained with the 234Th-238U method in other Pacific Ocean regions under general production condition (Figure 10A), such as the subarctic northeastern Pacific Ocean (2.8–7.6 mmol C/m2/d, from February 1996 to February 1997, Charette et al., 1999; 2.01 ± 0.56 (n = 61) mmol C/m2/d in August/September 2018 with no bloom, Buesseler et al., 2020), station ALOHA in the North Pacific Subtropical Gyre (0.4–4.0 mmol C/m2/d, from April 1999 to March 2000, Benitez-Nelson et al., 2001; neiligible-7.0 mmol C/m2/day, in June/July 2004 with no bloom, Buesseler et al., 2009), station K2 in the western subarctic North Pacific (1.9–10.1 mmol C/m2/day, in July/August 2005 with no bloom, Buesseler et al., 2009) and the North Pacific tropical and subtropical gyre (0.1–6.3 mmol C/m2/day, in August/September 2015 with no bloom, Umhau et al., 2019).
Export efficiency can be defined as the ratio of POC export to primary production (the e-ratio, Buesseler, 1998). Although primary productivity levels were not available for the studied sampling stations, Palevsky et al. (2016) summarized the annual and seasonal net primary productivity (NPP) estimates for the western North Pacific. Since our sampling activities took place from late May to late June 2018, we preliminarily evaluated the e-ratios of the BCP in the w-NPO by using the summer NPP estimates for the regions of the North Pacific (62 ± 19 mmol C/m2/day), hence, the e-ratio values were calculated to be in the range of 1.0–14.2% (Table 3), which are similar to the previously reported values in the North Pacific (Table 4 and Figure 10B; Charette et al., 1999; Benitez-Nelson et al., 2001; Buesseler et al., 2009, 2020). As can be seen from Figure 10B, the e-ratios of biological carbon pump were more variable in the marginal seas than that in the Pacific Ocean. For example, the e-ratios were very consistent (in a level of < 20%) in the NE Pacific, North Pacific, and w-NPO. However, in the marginal seas, the POC fluxes and e-ratios changed over a very wide range (Figure 10B). One extreme case reported in the inner shelf of ECS showed that the e-ratios ranged from 10 to 90% (Hung et al., 2013). The e-ratios in our study were below 15%, suggesting a moderate BCP efficiency in the w-NPO. By comparison, it can be found that the BCP strengths in some marginal seas of the Pacific Ocean [for example, e-ratio = 9–91% in the inner shelf of ECS (Hung et al., 2013), 13–28% in the Southern ECS (Shih et al., 2013), and 7–56% in the Sea of Japan (Kim et al., 2011)] is stronger than that in the interior of the Pacific Ocean (for example, e-ratio = ∼10% at station XTJ2-7 in the Shikoku Basin, 3–4% at station XTW1-11 in the Philippine Basin, and ∼1% at station XTJ1-1 in the Mariana Trench).
We compiled a table for comparing the export efficiencies of BCP in other open seas, as shown in the Table 5. It is worth noting that the e-ratios are similar in such different areas. For example, the e-ratios < 15% observed in our study are similar to those found in the North Atlantic (Iberian Basin, 0.5–2.5%; Irminger Basin, 3 ± 3%; western European Basin, 5 ± 5%; Iceland Basin, 6 ± 6%; and Labrador Basin, 10 ± 3%, see Tang et al., 2019). The similarity between our study and Tang et al. (2019) is that both sampling activities were carried out in May-June, however, the difference is that our study area was in an oligotrophic subtropical region (medium-low latitudes) and the study area of Tang et al. (2019) was in a temperate system (medium-high latitudes). In addition, Tang et al. (2019) started sampling when the bloom was starting, hence, the POC fluxes and e-ratios were still low. Ceballos-Romero et al. (2016) pointed that export efficiency was significantly discrepant in different stages of the bloom and the export efficiency also showed a strong seasonal variability in the North Atlantic. By comparison with study case of Ceballos-Romero et al. (2016) in the North Atlantic Ocean, we can find that algal blooming has a significant influence on BCP efficiency. Ceballos-Romero et al. (2016) reported two sampling campaigns: one sampling was carried out in the pre-bloom stage (April-May 2010), and the export efficiency was high at that moment (∼50%); another sampling was carried out in the decline of the bloom and post-bloom stage (July–August 2010), and the export efficiency was very low (3%). Obviously, our study displayed results from medium-low latitudes with no bloom, therefore, the low e-ratios of 1.0–14.2% were reasonable.
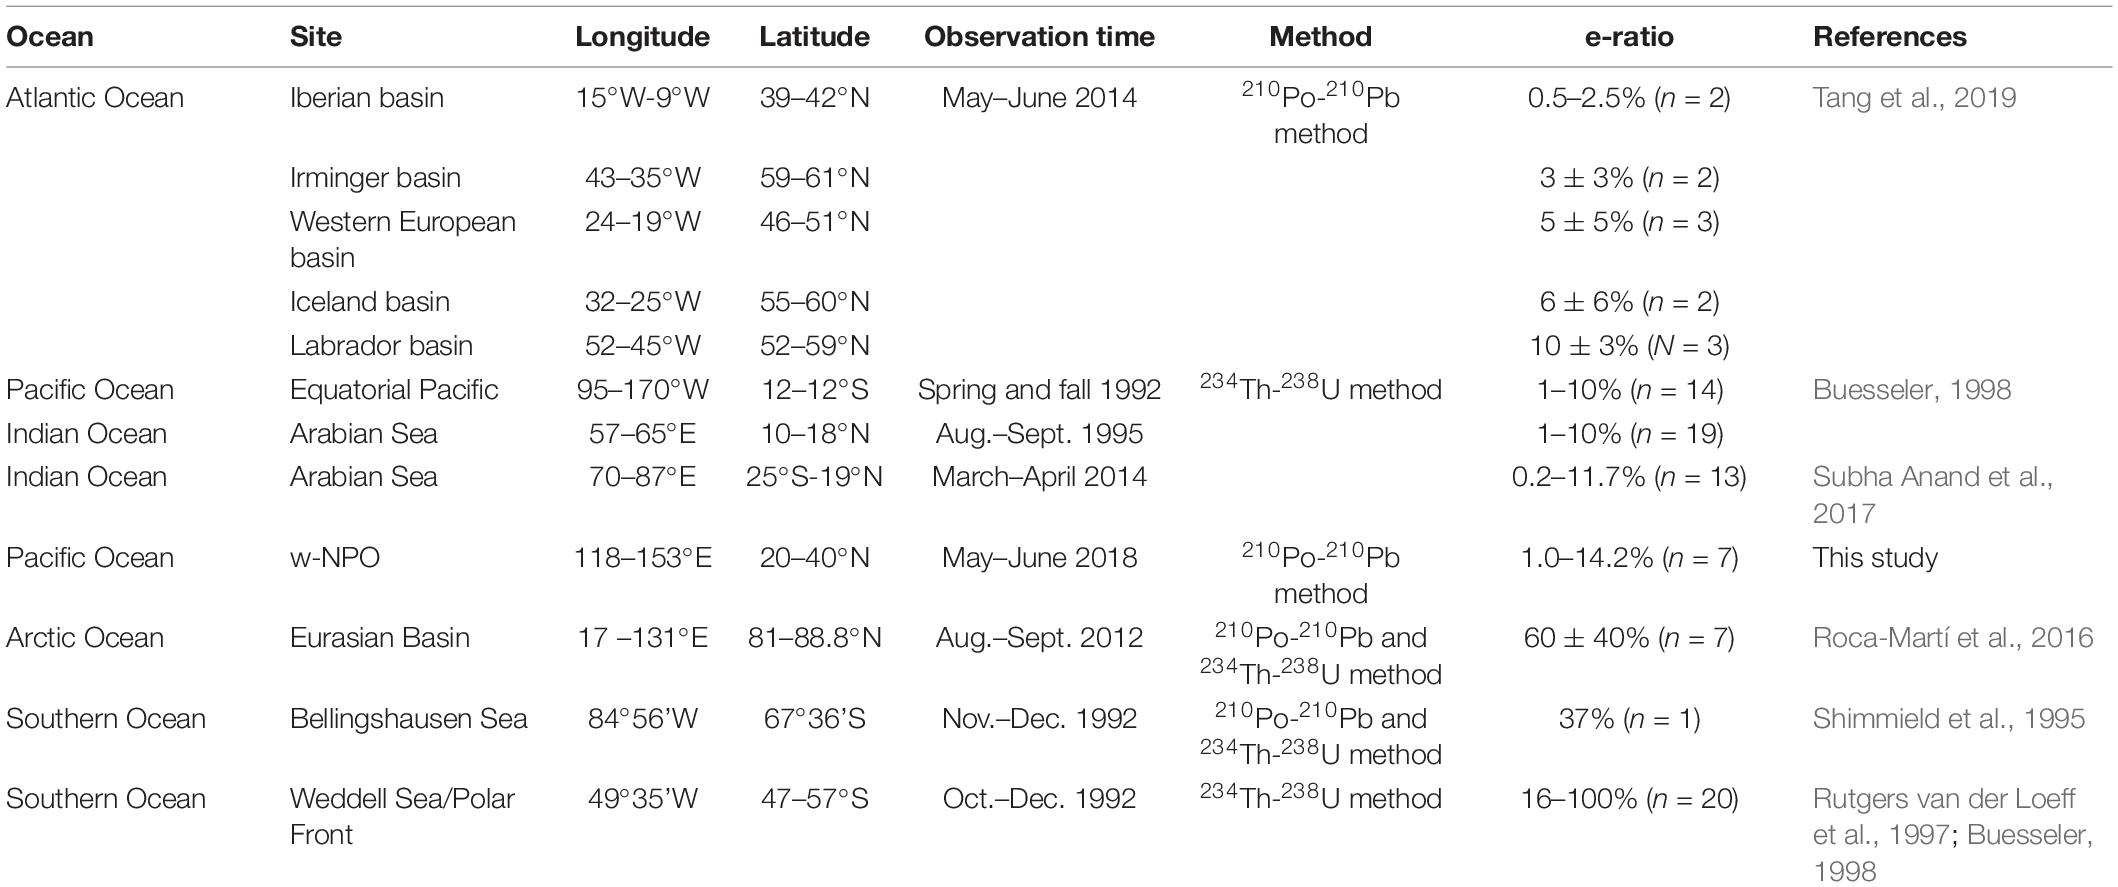
Table 5. Summary of carbon export efficiencies (e-ratios) based upon 210Po or 234Th approach in global open oceans.
In addition, the e-ratios in the w-NPO (1.0–14.2%, this study) are close to or slightly higher than that in the low-latitude tropical seas and oceans, for example, the equatorial Pacific (1–10%, Buesseler, 1998) and the Arabian Sea (1–10%, Buesseler, 1998; 0.2–11.7%, Subha Anand et al., 2017). This low e-ratios of < 10% might represent the values of BCP efficiency under general condition for tropical ocean, considering the weak seasonal variation of tropical oceans and the oligotrophic features. However, the e-ratios in the w-NPO are much lower than those reported at high-latitude sites (>25%), such as the Eurasian Basin of the Arctic Ocean (60 ± 40%, Roca-Martí et al., 2016), the Bellingshausen Sea (37% at station K, Shimmield et al., 1995) and the Weddell Sea and the Antarctic Polar Front (16–100%, Rutgers van der Loeff et al., 1997), since most of these study cases in the high-latitude seas were related to the bloom situation or the increase of chlorophyll-a, POC and plankton biomass concentrations (Shimmield et al., 1995; Rutgers van der Loeff et al., 1997). The lower export efficiencies observed in the w-NPO may be consistent with the predominance of smaller phytoplankton in the oligotrophic seawater. The oligotrophic feature might weaken the export strength of the BCP in the w-NPO. Indeed, small particles are usually slow-sinking particles that are more likely to be degraded during their descent (Villa-Alfageme et al., 2016), leading to lower export efficiencies. In our study, we also observed negative scavenging rates (J) of 210Po (negative J values mean that radionuclides are transferred from particles to the dissolved phase) below 150 m in the w-NPO (Table 1), which supports the occurrence of particle degradation, leading to a low export efficiency. For example, the lowest JPo values in the 150–1,000 m segment were observed at stations XTW1-11 (JPo = –86,511 dpm/m2/year), XTJ1-1 (JPo = –64,036 dpm/m2/year) and XTJ1-8 (JPo = –26,022 dpm/m2/year), and correspondingly, these three stations have the lowest e-ratios (based on Eppley model: 1.0–2.7%; based on Buesseler model: 1.1–4.0% Table 3).
Conclusion
In this study, we reported the vertical distributions of D-Po, P-Po, D-Pb, and P-Pb activities in the w-NPO during late spring and early summer to constrain the particle dynamics (scavenging rates and removal fluxes of 210Po and 210Pb), and to estimate the carbon export production (POC export flux). More than 50% of the radionuclides were found in the dissolved phase below a depth of 50 m, while a small proportion was associated with the particulate phase. However, the percentages of P-Po and P-Pb were higher than 50% (even up to 90%) in the surface seawater (0–50 m). 210Po deficits relative to 210Pb were observed in the upper 150 m at all the stations, however such 210Po deficiencies can even extend to deeper ocean (such as 500 m) at some stations. In the interior of the w-NPO, the excess 210Po (total 210Po/210Pb > 1) activities in the deeper ocean (500–1,000 m) at stations XTJ1-1 and XTJ1-8 were attributed to the release of 210Po due to biogenic particle release during sinking. Based on a conceptual one-dimensional irreversible scavenging model, the residence times of 210Po and 210Pb in the w-NPO were obtained. In the upper ocean (0–150 m), the residence times of D-Po (τPo–D, 0.6–5.5 year) were much higher than those of P-Po (τPo–P, 83–921 days), while in the deep ocean (below 150 m), the residence times of D-Pb were calculated to be 13.1–22.9 year, 2–10 times longer than those of P-Pb (1.1–5.5 year).
Based on 210Po-210Pb disequilibrium, we found that the Eppley model-derived POC export fluxes agreed well with those derived from the Buesseler model in the upper ocean of the w-NPO, suggesting that particulate 210Po and POC may have similar residence time in the water column. Overall, the 210Po-derived POC fluxes varied spatially, ranging from 0.6 to < 9 mmol C/m2/day, with the highest export fluxes at stations close to the East Asian continental shelf and the lowest export fluxes at stations in the ocean basin. We concluded that POC export fluxes tended to increase with decreasing distance from the continental margins. The POC export efficiencies also showed regional differences even within the same basin, with e-ratio values ranging from 1.0 to 14.2%, suggesting a moderate BCP efficiency in the w-NPO. The low export efficiencies may be associated with the dominance of smaller particles and particle release below the euphotic zone. The negative scavenging rates of 210Po (-JPo) below 150 m at stations in the central basin of the w-NPO supports the occurrence of particle dissolution. Comparing with the reported e-ratios in other open seas, relatively higher carbon export efficiencies occurred at high-latitude sites.
Data Availability Statement
The original contributions presented in the study are included in the article/Supplementary Material, further inquiries can be directed to the corresponding author/s.
Author Contributions
QZ was responsible for conceptualization, methodology, sample analysis, data processing, writing original draft, writing–review, and revising. DH, TY, and JD provided a financial support and helped in article reviewing. JL, JJ, and JN contributed to the review of the manuscript. All authors contributed to the article and approved the submitted version.
Funding
This study was funded by the China Postdoctoral Science Foundation (2021M693780), the Scientific Research Foundation of Third Institute of Oceanography, MNR (2019004), the Science and Technology Plan Projects of Guangxi Zhuang Autonomous Region (2017AB30024) and the Science Foundation of the Fujian Province (2018Y0059 and 2019Y0073).
Conflict of Interest
The authors declare that the research was conducted in the absence of any commercial or financial relationships that could be construed as a potential conflict of interest.
Publisher’s Note
All claims expressed in this article are solely those of the authors and do not necessarily represent those of their affiliated organizations, or those of the publisher, the editors and the reviewers. Any product that may be evaluated in this article, or claim that may be made by its manufacturer, is not guaranteed or endorsed by the publisher.
Acknowledgments
We are grateful to the captain and crew of the R/V Xiangyanghong III for their support at sea. Many thanks to members of RIC group in ECNU (especially Lady Langlin) for their assistance with expedition preparation.
Supplementary Material
The Supplementary Material for this article can be found online at: https://www.frontiersin.org/articles/10.3389/fmars.2021.700524/full#supplementary-material
References
Ayers, J. M., and Lozier, M. S. (2012). Unraveling dynamical controls on the North Pacific carbon sink. J. Geophys. Res. Oceans 117:C01017. doi: 10.1029/2011JC007368
Bacon, M. P., Spencer, D. W., and Brewer, P. G. (1976). 210Pb/226Ra and 210Po/210Pb disequilibria in seawater and suspended particulate matter. Earth Planet. Sci. Lett. 32, 277–296. doi: 10.1016/0012-821x(76)90068-6
Baskaran, M. (2011). Po-210 and Pb-210 as atmospheric tracers and global atmospheric Pb-210 fallout: a review. J. Environ. Radioact. 102, 500–513. doi: 10.1016/j.jenvrad.2010.10.007
Baskaran, M., Church, T., Hong, G., Kumar, A., Ma, Q., Choi, H., et al. (2013). Effects of flow rates and composition of the filter, and decay/ingrowth correction factors involved with the determination of in situ particulate 210Po and 210Pb in seawater. Limnol. Oceanogr. Methods 11, 126–138. doi: 10.4319/lom.2013.11.126
Benitez-Nelson, C. R., Buesseler, K. O., Karl, D. M., and Andrews, J. (2001). A time-series study of particulate matter export in the north pacific subtropical gyre based on 234Th:238U disequilibrium. Deep Sea Res. Part I Oceanogr. Res. Pap. 48, 2595–2611. doi: 10.1016/s0967-0637(01)00032-2
Buesseler, K. O. (1998). The decoupling of production and particulate export in the surface ocean. Glob. Biogeochem. Cycles 12, 297–310. doi: 10.1038/nature02631
Buesseler, K. O., and Boyd, P. (2009). Shedding light on processes that control particle export and flux attenuation in the twilight zone of the open ocean. Limnol. Oceanogr. 54, 1210–1232. doi: 10.4319/lo.2009.54.4.1210
Buesseler, K. O., Antia, A. N., Chen, M., Fowler, S. W., Gardner, W. D., Gustafsson, O., et al. (2007). An assessment of the use of sediment traps for estimating upper ocean particle fluxes. J. Mar. Res. 65, 345–416.
Buesseler, K. O., Bacon, M. P., Cochran, J. K., and Livingston, H. D. (1992). Carbon and nitrogen export during the JGOFS North Atlantic Bloom experiment estimated from 234Th:238U disequilibria. Deep Sea Res. Part A Oceanogr. Res. Pap. 39, 1115–1137. doi: 10.1016/0198-0149(92)90060-7
Buesseler, K. O., Benitez-Nelson, C. R., Roca-Marti, M., Wyatt, A. M., Resplandy, L., Clevenger, S. J., et al. (2020). High-resolution spatial and temporal measurements of particulate organic carbon flux using thorium-234 in the northeast Pacific Ocean during the EXport processes in the ocean from remote sensing field campaign. Elem. Sci. Anth. 8, 30. doi: 10.1525/elementa.030
Buesseler, K. O., Pike, S., Maiti, K., Lamborg, C. H., Siegel, D. A., and Trull, T. W. (2009). Thorium-234 as a tracer of spatial, temporal and vertical variability in particle flux in the north pacific. Deep Sea Res. Part I Oceanogr. Res. Pap. 56, 1143–1167. doi: 10.1016/j.dsr.2009.04.001
Ceballos-Romero, E., Le Moigne, F. A. C., Henson, S., Marsay, C. M., Sanders, R. J., García-Tenorio, R., et al. (2016). Influence of bloom dynamics on particle export efficiency in the North Atlantic: a comparative study of radioanalytical techniques and sediment traps. Mar. Chem. 186, 198–210. doi: 10.1016/j.marchem.2016.10.001
Charette, M. A., Moran, S. B., and Bishop, J. K. B. (1999). 234Th as a tracer of particulate organic carbon export in the subarctic northeast Pacific Ocean. Deep Sea Res. Part II Top. Stud. Oceanogr. 46, 2833–2861. doi: 10.1016/s0967-0645(99)00085-5
Chen, K. S., Hung, C. C., Gong, G. C., Chou, W. C., Chung, C. C., Shih, Y. Y., et al. (2013). Enhanced POC export in the oligotrophic northwest Pacific Ocean after extreme weather events. Geophys. Res. Lett. 40, 5728–5734. doi: 10.1002/2013gl058300
Cherrier, J., Burnett, W. C., and LaRock, P. A. (1995). Uptake of polonium and sulfur by bacteria. Geomicrobiol. J. 13, 103–115.
Church, T., Rigaud, S., Baskran, M., Kumar, A., Friedrich, J., Masqué, P., et al. (2012). Intercalibration studies of 210Po and 210Pb in dissolved and particulate seawater samples. Limnol. Oceanogr. Methods 10, 776–789. doi: 10.4319/lom.2012.10.776
Coale, K. H., and Bruland, K. W. (1987). Oceanic stratified euphotic zone as elucidated by 234Th:238U disequilibria. Limnol. Oceanogr. 32, 189–200. doi: 10.4319/lo.1987.32.1.0189
Cochran, J. K., and Masqué, P. (2003). Short-lived U/Th series radionuclides in the ocean: tracers for scavenging rates, export fluxes and particle dynamics. Rev. Mineral. Geochem. 52, 461–492. doi: 10.2113/0520461
Du, J. (2019). Study on the Depositional Processes of the Atmospheric Fallout Radionuclides and their Application on Tracing Modern Sedimentation Processes at the East China Sea. Ph.D thesis. Shanghai: East China Normal University.
Ducklow, H., Steinberg, D., and Buesseler, K. (2001). Upper ocean carbon export and the biological pump. Oceanography 14, 50–58. doi: 10.5670/oceanog.2001.06
Eppley, R. W. (1989). “New production: history, methods, problems,” in Productivity of the Ocean: Present and Past, eds W. Berger, V. Smetacek, and G. Wefer (New York, NY: John Wiley), 85–97.
Falkowski, P. G., Barber, R. T., and Smetacek, V. (1998). Biogeochemical controls and feedbacks on ocean primary production. Science 281, 200–206.
Fisher, N. S., Burns, K. A., Cherry, R. D., and Heyraud, M. (1983). Accumulation and cellular distribution of 241Am, 210Po, and 210Pb in two marine algae. Mar. Ecol. Prog. Ser. 11, 233–237.
Friedrich, J., and Rutgers van der Loeff, M. (2002). A two-tracer (210Po-234Th) approach to distinguish organic carbon and biogenic silica export flux in the Antarctic Circumpolar Current. Deep Sea Res. Part I Oceanogr. Res. Pap. 49, 101–120. doi: 10.1016/s0967-0637(01)00045-0
Gallagher, S. J., Kitamura, A., Iryu, Y., Itaki, T., and Hoiles, P. W. (2015). The Pliocene to recent history of the Kuroshio and Tsushima Currents: a multi-proxy approach. Prog. Earth Planet. Sci. 2, 1–23.
Hayes, C. T., Anderson, R. F., Fleisher, M. Q., Serno, S., Winckler, G., and Gersonde, R. (2013). Quantifying lithogenic inputs to the North Pacific Ocean using the long-lived thorium isotopes. Earth Planet. Sci. Lett. 383, 16–25. doi: 10.1016/j.epsl.2013.09.025
Hayes, C. T., Black, E. E., Anderson, R. F., Baskaran, M., Buesseler, K. O., Charette, M. A., et al. (2018). Flux of particulate elements in the North Atlantic Ocean constrained by multiple radionuclides. Glob. Biogeochem. Cycles 32, 1738–1758. doi: 10.1029/2018GB005994
Heyraud, M., Fowler, S. W., Beasley, T. M., and Cherry, R. D. (1976). Polonium-210 in euphausiids: a detailed study. Mar. Biol. 34, 127–136. doi: 10.1007/bf00390754
Honjo, S., Manganini, S. J., Krishfield, R. A., and Francois, R. (2008). Particulate organic carbon fluxes to the ocean interior and factors controlling the biological pump: a synthesis of global sediment trap programs since 1983. Prog. Oceanogr. 76, 217–285.
Horowitz, E. J., Cochran, J. K., Bacon, M. P., and Hirschberg, D. J. (2020). 210Po and 210Pb distributions during a phytoplankton bloom in the North Atlantic: implications for POC export. Deep See Res. Part I Oceanogr. Res. Pap. 164:103339. doi: 10.1016/j.dsr.2020.103339
Hu, D., Wu, L., Cai, W., Gupta, A. S., Ganachaud, A., Qiu, B., et al. (2015). Pacific western boundary currents and their roles in climate. Nature 522, 299–308.
Hu, W., Chen, M., Yang, W., Zhang, R., Qiu, Y., and Zheng, M. (2014). Enhanced particle scavenging in deep water of the Aleutian Basin revealed by 210Po-210Pb disequilibria. J. Geophys. Res. Oceans 119, 3235–3248. doi: 10.1002/2014JC009819
Hung, C. C., and Gong, G. C. (2007). Export flux of POC in the main stream of the Kuroshio. Geophys. Res. Lett. 34:L18606. doi: 10.1029/2007GL030236
Hung, C.-C., Tseng, C.-W., Gong, G. C., Chen, K. S., Chen, M. H., and Hsu, S.-C. (2013). Fluxes of particulate organic carbon in the East China Sea in summer. Biogeosciences 10, 6469–6484. doi: 10.1016/j.envpol.2018.11.059
IPCC in Climate Change (2013). “Chapter 6: Carbon and other biogeochemical cycle,” in The Physical Science Basis. Contribution of Working Group I to the Fifth Assessment Report of the Intergovernmental Panel on Climate Change, Vol. 2013, eds T. F. Stocker, D. Qin, G.-K. Plattner, M. Tignor, S. K. Allen, J. Boschung, et al. (Cambridge: Cambridge University Press), 471.
Kawakami, H., and Kusakabe, M. (2008). Surface water mixing estimated from 228Ra and 226Ra in the northwestern North Pacific. J. Environ. Radioact. 99, 1335–1340. doi: 10.1016/j.jenvrad.2008.04.011
Kawakami, H., Honda, M. C., Matsumoto, K., Wakita, M., Kitamura, M., Fujiki, T., et al. (2015). POC fluxes estimated from 234Th in late spring-early summer in the western subarctic North Pacific. J. Oceanogr. 71, 311–324.
Kim, D., Choi, M. S., Oh, H. Y., Song, Y. H., Noh, J. H., and Kim, K. H. (2011). Seasonal export fluxes of particulate organic carbon from 234Th/238U disequilibrium measurements in the Ulleung basin (Tsushima Basin) of the East Sea (Sea of Japan). J. Oceanogr. 67, 577–588. doi: 10.1007/s10872-011-0058-8
Kim, G., and Church, T. M. (2001). Seasonal biogeochemical fluxes of 234Th and 210Po in the upper Sargasso Sea: influence from atmospheric iron deposition. Glob. Biogeochem. Cycles 15, 651–661. doi: 10.1029/2000gb001313
Kwon, E. Y., Primeau, F., and Sarmiento, J. L. (2009). The impact of remineralization depth on the air-sea carbon balance. Nat. Geosci. 2, 630–635. doi: 10.1029/2020GL091746
LaRock, P., Hyun, J. H., Boutelle, S., Burnett, W. C., and Hull, C. D. (1996). Bacterial mobilization of polonium. Geochim. Cosmochim. Acta 60, 4321–4328. doi: 10.1016/s0016-7037(96)00255-4
Le Moigne, F. A. C., Villa-Alfageme, M., Sanders, R. J., Marsay, C., Henson, S., and García-Tenorio, R. (2013). Export of organic carbon and biominerals derived from 234Th and 210Po at the Porcupine Abyssal Plain. Deep Sea Res. Part I Oceanogr. Res. Pap. 72, 88–101.
Liu, Q., Guo, X., Yin, Z., Zhou, K., Roberts, E. G., and Dai, M. (2018). Carbon fluxes in the China Seas: an overview and perspective. Sci. China Earth Sci. 61, 1564–1582. doi: 10.1007/s11430-017-9267-4
Masqué, P., Sanchez-Cabeza, J. A., Bruach, J. M., Palacios, E., and Canals, M. (2002). Balance and residence times of 210Pb and 210Po in surface waters of the northwestern Mediterranean Sea. Cont. Shelf Res. 22, 2127–2146. doi: 10.1016/s0278-4343(02)00074-2
Murray, J. W., Downs, J. N., Strom, S., Wei, C.-L., and Jannasch, H. W. (1989). Nutrient assimilation, export production and 234Th scavenging in the eastern equatorial Pacific. Deep Sea Res. Part I Oceanogr. Res. Pap. 36, 1471–1489.
Murray, J. W., Paul, B., Dunne, J. P., and Chapin, T. (2005). 234Th, 210Pb, 210Po and stable Pb in the central equatorial Pacific: tracers for particle cycling. Deep Sea Res. Part I Oceanogr. Res. Pap. 52, 2109–2139. doi: 10.1016/j.dsr.2005.06.016
Nozaki, Y., and Tsunogai, S. (1976). 226Ra, 210Pb and 210Po disequilibria in the western North Pacific. Earth Planet. Sci. Lett. 32, 313–321.
Nozaki, Y., Dobashi, F., Kato, Y., and Yamamoto, Y. (1998). Distribution of Ra isotopes and the 210Pb and 210Po balance in surface seawaters of the mid Northern Hemisphere. Deep Sea Res. Part I Oceanogr. Res. Pap. 45, 1263–1284. doi: 10.1016/s0967-0637(98)00016-8
Palevsky, H. I., Quay, P. D., Lockwood, D. E., and Nicholson, D. P. (2016). The annual cycle of gross primary production, net community production, and export efficiency across the North Pacific Ocean. Glob. Biogeochem. Cycles 30, 361–380.
Peck, G. A., and Smith, J. D. (2000). Distribution of dissolved and particulate 226Ra, 210Pb and 210Po in the Bismarck Sea and western equatorial Pacific Ocean. Mar. Freshwater Res. 51, 647–658.
Rigaud, S., Puigcorbé, V., Cámara-Mor, P., Casacuberta, N., Roca-Martí, M., Garcia-Orellana, J., et al. (2013). A methods assessment and recommendations for improving calculations and reducing uncertainties in the determination of 210Po and 210Pb activities in seawater. Limnol. Oceanogr. Methods 11, 561–571. doi: 10.4319/lom.2013.11.561
Roca-Martí, M., Puigcorbé, V., Rutgers van der Loeff, M. M., Katlein, C., Fernández-Méndez, M., Peeken, I., et al. (2016). Carbon export fluxes and export efficiency in the central Arctic during the record sea-ice minimum in 2012: a joint 234Th/238U and 210Po/210Pb study. J. Geophys. Res. Oceans 121, 5030–5049. doi: 10.1002/2016jc011816
Rutgers van der Loeff, M. M., Friedrich, J., and Bathmann, U. V. (1997). Carbon export during the Spring Bloom at the Antarctic Polar Front, determined with the natural tracer 234Th. Deep Sea Res. Part II Top. Stud. Oceanogr. 44, 457–478.
Sabine, C. L. (2004). The oceanic sink for anthropogenic CO2. Science 305, 367–371. doi: 10.1126/science.1097403
Sanders, R., Henson, S. A., Koski, M., De La Rocha, C. L., Painter, S. C., Poulton, A. J., et al. (2014). The biological carbon pump in the North Atlantic. Prog. Oceanogr. 129, 200–218. doi: 10.1016/j.pocean.2014.05.005
Shih, Y. Y., Hsieh, J. S., Gong, G. C., Hung, C. C., Chou, W. C., Lee, M. A., et al. (2013). Field observations of changes in SST, chlorophyll and POC flux in the southern East China Sea before and after the passage of Typhoon Jangmi. Terr. Atmos. Ocean. Sci. 24, 899–910. doi: 10.3319/tao.2013.05.23.01(oc)
Shih, Y. Y., Hung, C. C., Gong, G. C., Chung, W. C., Wang, Y. H., Lee, I. H., et al. (2015). Enhanced particulate organic carbon export at eddy edges in the oligotrophic Western North Pacific Ocean. PLoS One 10:e0131538. doi: 10.1371/journal.pone.0131538
Shimmield, G. B., Ritchie, G. D., and Fileman, T. W. (1995). The impact of marginal ice zone processes on the distribution of 210Pb, 210Po and 234Th and implications for new production in the Bellingshausen Sea, Antarctica. Deep Sea Res. Part II Top. Stud. Oceanogr. 42, 1313–1335. doi: 10.1016/0967-0645(95)00071-w
Stewart, G. M., and Fisher, N. S. (2003a). Experimental studies on the accumulation of polonium-210 by marine phytoplankton. Limnol. Oceanogr. 48, 1193–1201. doi: 10.4319/lo.2003.48.3.1193
Stewart, G. M., and Fisher, N. S. (2003b). Bioaccumulation of polonium-210 in marine copepods. Limnol. Oceanogr. 48, 2011–2019.
Stewart, G. M., Moran, S. B., and Lomas, M. W. (2010). Seasonal POC fluxes at BATS estimated from 210Po deficits. Deep Sea Res. Part I Oceanogr. Res. Pap. 57, 113–124. doi: 10.1016/j.dsr.2009.09.007
Stewart, G., Cochran, J. K., Miquel, J. C., Masqué, P., Szlosek, J., Rodriguez y Baena, A. M., et al. (2007). Comparing POC export from 234Th/238U and 210Po/210Pb disequilibria with estimates from sediment traps in the northwest Mediterranean. Deep Sea Res. Part I Oceanogr. Res. Pap. 54, 1549–1570. doi: 10.1016/j.dsr.2007.06.005
Su, K., Du, J., Baskaran, M., and Zhang, J. (2017). 210Po and 210Pb disequilibrium at the PN section in the East China Sea. J. Environ. Radioact. 174, 54–65. doi: 10.1016/j.jenvrad.2016.07.031
Subha Anand, S. S., Rengarajan, R., Shenoy, D., Gauns, M., and Naqvi, S. W. A. (2018). POC export fluxes in the Arabian Sea and the Bay of Bengal: a simultaneous 234Th/238U and 210Po/210Pb study. Mar. Chem. 198, 70–87.
Subha Anand, S., Rengarajan, R., Sarma, V. V. S. S., Sudheer, A. K., Bhushan, R., and Singh, S. K. (2017). Spatial variability of upper ocean POC export in the Bay of Bengal and the Indian Ocean determined using particle-reactive 234Th. J. Geophys. Res. Oceans 122, 3753–3770. doi: 10.1002/2016JC012639
Takahashi, T., Sutherland, S. C., Wanninkhof, R., Sweeney, C., Feely, R. A., Chipman, D. W., et al. (2009). Climatological mean and decadal change in surface ocean pCO2, and net sea-air CO2 flux over the global oceans. Deep Sea Res. Part II Top. Stud. Oceanogr. 56, 554–577. doi: 10.1016/j.dsr2.2008.12.009
Tang, Y., and Stewart, G. (2019). The 210Po/210Pb method to calculate particle export: lessons learned from the results of three GEOTRACES transects. Mar. Chem. 217:103692. doi: 10.1016/j.marchem.2019.103692
Tang, Y., Lemaitre, N., Castrillejo, M., Roca-Martí, M., Masqué, P., and Stewart, G. (2019). The export flux of particulate organic carbon derived from 210Po/210Pb disequilibria along the North Atlantic GEOTRACES GA01 transect: GEOVIDE cruise. Biogeosciences 16, 309–327. doi: 10.5194/bg-16-309-2019
Tang, Y., Stewart, G., Lam, P. J., Riguad, S., and Church, T. (2017). The influence of particle concentration and composition on the fractionation of 210Po and 210Pb along the North Atlantic GEOTRACES transect GA03. Deep Sea Res. Part I Oceanogr. Res. Pap. 128, 42–54. doi: 10.1016/j.dsr.2017.09.001
Turekian, K. K., Nozaki, Y., and Benninger, L. K. (1977). Geochemistry of atmospheric radon and radon products. Annu. Rev. Earth Planet. Sci. 5, 227–255. doi: 10.1146/annurev.ea.05.050177.001303
Umhau, B. P., Benitez-Nelson, C. R., Close, H. G., Hannides, C., Motta, L., Popp, B. N., et al. (2019). Seasonal and spatial changes in carbon and nitrogen fluxes estimated using 234Th:238U disequilibria in the North Pacific tropical and subtropical gyre. Mar. Chem. 217:103705. doi: 10.1016/j.marchem.2019.103705
Verdeny, E., Masqué, P., Garcia-Orellana, J., Hanfland, C., Cochran, J. K., and Stewart, G. (2009). POC export from ocean surface waters by means of 234Th/238U and 210Po/210Pb disequilibria: a review of the use of two radiotracer pairs. Deep Sea Res. Part II Top. Stud. Oceanogr. 56, 1502–1518. doi: 10.1016/j.dsr2.2008.12.018
Villa-Alfageme, M., de Soto, F. C., Ceballos, E., Giering, S. L. C., Le Moigne, F. A. C., Henson, S., et al. (2016). Geographical, seasonal, and depth variation in sinking particle speeds in the North Atlantic. Geophys. Res. Lett. 43, 8609–8616. doi: 10.1002/2016GL069233
Wei, C. L., Lin, S. Y., Sheu, D. D., Chou, W. C., Yi, M. C., Santschi, P. H., et al. (2011). Particle-reactive radionuclides (234Th, 210Pb, 210Po) as tracers for the estimation of export production in the South China Sea. Biogeosciences 8, 3793–3808.
Yasuda, I. (2003). Hydrographic structure and variability in the Kuroshio-Oyashio transition area. J. Oceanogr. 59, 389–402.
Zhong, Q. (2020). Atmospheric Deposition of Radionuclides and its Application in POC Export Fluxes of the Upper Sea. Ph.D thesis. Shanghai: East China Normal University. (In Chinese with English Abstract).
Zhong, Q., Puigcorbé, V., Sanders, C., and Du, J. (2020). Analysis of 210Po, 210Bi, and 210Pb in atmospheric and oceanic samples by simultaneously auto-plating 210Po and 210Bi onto a nickel disc. J. Environ. Radioact. 220–221:106301. doi: 10.1016/j.jenvrad.2020.106301
Zhong, Q., Wang, J., Du, J., Bi, Q., and Zhao, F. (2019). The 210Po/210Pb disequilibrium in a spring-blooming marginal sea, the Southern Yellow Sea. J. Environ. Radioact. 207, 15–26. doi: 10.1016/j.jenvrad.2019.05.017
Keywords: 210Po deficiency, POC export flux, marine biological carbon pump, Western North Pacific Ocean, euphotic zone
Citation: Zhong Q, Yu T, Lin H, Lin J, Ji J, Ni J, Du J and Huang D (2021) 210Po-210Pb Disequilibrium in the Western North Pacific Ocean: Particle Cycling and POC Export. Front. Mar. Sci. 8:700524. doi: 10.3389/fmars.2021.700524
Received: 26 April 2021; Accepted: 11 November 2021;
Published: 02 December 2021.
Edited by:
Pere Masque, IAEA International Atomic Energy Agency, MonacoReviewed by:
María Villa-Alfageme, Seville University, SpainJ. Kirk Cochran, Stony Brook University, United States
Copyright © 2021 Zhong, Yu, Lin, Lin, Ji, Ni, Du and Huang. This is an open-access article distributed under the terms of the Creative Commons Attribution License (CC BY). The use, distribution or reproduction in other forums is permitted, provided the original author(s) and the copyright owner(s) are credited and that the original publication in this journal is cited, in accordance with accepted academic practice. No use, distribution or reproduction is permitted which does not comply with these terms.
*Correspondence: Dekun Huang, dkhuang@tio.org.cn