Cold-Water Corals and Other Vulnerable Biological Structures on a North Pacific Seamount After Half a Century of Fishing
 Cherisse Du Preez
 Kelly D. Swan
 Janelle M. R. Curtis
- 1Institute of Ocean Sciences, Fisheries and Oceans Canada, Sidney, BC, Canada
- 2Pacific Biological Station, Fisheries and Oceans Canada, Nanaimo, BC, Canada
Addressing growing threats of overexploitation to the world’s oceans is especially challenging in the High Seas, where limited data and international jurisdiction make it difficult to determine where and when conservation measures are necessary. Of particular concern are vulnerable marine ecosystems (VMEs)—special habitats on the seafloor that are highly sensitive to disturbance and slow to recover. To ensure the long-term conservation and sustainable use of marine resources, regional fisheries management organizations are committed to identifying the locations of VMEs and responding to prevent significant adverse impacts (SAIs). For over 50 years, Cobb Seamount—a shallow underwater volcanic mountain in the Northeast Pacific Ocean—has been commercially fished by multiple nations using various types of gear. Here we have assimilated data from fisheries records and a recent visual survey on the seamount. Our findings show a variety of habitat-forming emergent biological structures widely distributed on Cobb Seamount and generally depth-stratified into high-density assemblages (≥1 m–2). Our spatial analyses show that fishing has also been widely distributed, overlapping the habitat of the biological structures. We found fewer cold-water corals, sponges, and other biological structures in areas with higher recent fishing effort and documented evidence of fishing impacts, such as extensive mats of coral rubble and a high abundance of derelict fishing gear entangled with dead or damaged organisms. Based on the average density of “lost” gear (2,785 ± 1,003 km–2), we can confidently estimate that hundreds of thousands of items of derelict fishing gear are currently entangled with the seafloor of Cobb Seamount and that these pose an ongoing threat to biological structures, the biogenic habitats they create, and the species they support. Such impacts can persist for decades or centuries to come. This study contributes and discusses new information on the condition and distribution of biological structures, VME indicator taxa, physically complex biogenic ecosystems, and human impacts on Cobb Seamount. These data will be necessary to identify the location(s) of potential VMEs and SAIs on this heavily fished seamount in the High Seas.
Introduction
Impacts of human-induced stressors are often readily visible in terrestrial and coastal ecosystems, but the same cannot be said for species and ecosystems in the deep sea. The majority of the deep sea remains unexplored (Ramirez-Llodra et al., 2010), and though much of these vast areas were once thought safe from human exploitation, technological advancements have made it steadily easier for fishing fleets to catch species far offshore and safely store them for the journey back to land (Cullis-Suzuki and Pauly, 2010). Bottom trawling and other deep-sea fishing methods have effects on the seafloor that resemble forest clearcutting and are widely regarded as a significant threat to biological diversity and economic sustainability (Watling and Norse, 1998). The threat of increased fishing pressure is compounded by climate change (Hoegh-Guldberg and Bruno, 2010), growing deep-sea mining interests (Merrie et al., 2014), and the accumulation of anthropogenic debris (Woodall et al., 2014; Gall and Thompson, 2015), such as abandoned, lost or otherwise discarded fishing gear (Macfadyen et al., 2009); hereafter, “derelict fishing gear” or DFG.
Increasing attention is being paid to these anthropogenic threats in Areas Beyond National Jurisdiction (ABNJs), which include the “High Seas” and “the Area” (i.e., the water column outside of State-managed Exclusive Economic Zones or the Territorial Sea where no EEZ has been declared, and the seabed beyond the limits of the continental shelf, respectively; Popova et al., 2019). The High Seas cover nearly 60% of the world’s oceans (Cullis-Suzuki and Pauly, 2010), comprise the largest habitat for life on the planet (Verity et al., 2002; Blasiak et al., 2016), and are overseen by intergovernmental regional fisheries management organizations (RFMOs) which provide a mechanism for managing shared resources and meeting international obligations (Cullis-Suzuki and Pauly, 2010; Gilman et al., 2014). Although they are critical to the protection of marine ecosystems, many RFMOs are relatively young and still in the process of implementing the United Nations General Assembly (UNGA) Resolutions on the management of bottom fisheries in ABNJs (Gianni et al., 2016; Bell et al., 2019). Of particular concern is Resolution 61/105, which calls on individual States and RFMOs to sustainably manage fish stocks and protect vulnerable marine ecosystems (VMEs), including seamounts, hydrothermal vents, and cold-water corals and sponges, from destructive fishing practices (UNGA, 2006). Recognizing the immense value of deep-sea ecosystems and the biodiversity they contain, Resolution 61/105 further requires that RFMOs adopt conservation and management measures to prevent significant adverse impacts (SAIs) to VMEs. The Food and Agriculture Organization (FAO) has published International Guidelines for the Management of Deepsea Fisheries in the High Seas (FAO, 2009) which define a VME as an ecosystem that is easily disturbed and slow to recover (if at all), and SAIs as those that compromise ecosystem integrity in a manner that: (i) impairs the ability of affected populations to replace themselves, (ii) degrades the long-term natural productivity of habitats, or (iii) causes, on more than a temporary basis, significant loss of species richness, habitat or community type.
Vulnerable marine ecosystem identification has nonetheless proven challenging because of limited data on the response of ecosystems to fishing and their trajectory of recovery. Many RFMOs have therefore identified a suite of taxa as indicators of VMEs. For example, in its implementation of Resolution 61/105, the long-running Northwest Atlantic Fisheries Organization developed a set of physiographic and biological indicators as a proxy for VME identification (NAFO, 2018). Physiographic indicators included seamounts, canyons, knolls, shoals and steep flanks, while indicator taxa were identified on the basis of biological traits analysis (Bremner et al., 2006) and include a comprehensive list of structure-forming sponges, corals, sea pens, anemones, bryozoans, crinoids and sea squirts (NAFO, 2018). These taxa meet the FAO (2009) criteria regarding uniqueness or rarity, the functional significance of the habitat, life-history traits that make recovery difficult, and structural complexity.
The identification of potential VMEs in the North Pacific Ocean is the responsibility of a relatively newly formed RFMO: the North Pacific Fisheries Commission (founded in July 2015). To that end, the NPFC has adopted four groups of structure-forming cold-water corals as interim VME indicators: sea fans and true soft corals (both order Alcyonacea; sea fans prior epithet Gorgonacea), black corals (order Antipatharia), and stony corals (order Scleractinia) (North Pacific Fisheries Commission [NPFC], 2017, 2018).
Cobb Seamount is a shallow submarine volcanic mountain in the NPFC convention area (Figure 1) that was discovered in the 1950s by the commercial fisheries research vessel John N. Cobb (National Technical Information Service, 1971). Starting in the mid-1960s, Cobb Seamount was intermittently fished by Japan, United States, the Soviet Union, Canada, (Sasaki, 1985; Pearson et al., 1993; Clark et al., 2007; Douglas, 2011; Curtis et al., 2015), and likely other nations by way of unreported, unregulated, or illegal fishing (UN, 2019). Unlike the majority of North Pacific seamount fisheries, which expanded to catch North Pacific armorhead and splendid alfonsino (Pentaceros wheeleri and Beryx splendens), fisheries on Cobb Seamount have targeted sablefish (Anoplopoma fimbria), rockfish (Sebastes spp.), flatfish (Pleuronectiformes), thornyheads (Sebastolobus spp.), and other groundfish (Uchida and Tagami, 1984; Clark et al., 2007; Curtis et al., 2015). Over the decades, fishers have removed thousands of metric tons of fish from Cobb Seamount, at times in short bursts of heavy exploitation (Sasaki, 1985; Pearson et al., 1993; Clark et al., 2007) from which there is evidence of overfishing of at least one rockfish species (Douglas, 2011). Fishing on Cobb Seamount was ceased by the Soviet Union in the late 1960s, by Japan in the early 1990s, and by the United States in the early 2000s (Clark et al., 2007; Curtis et al., 2015). Canada is the only nation to report fishing on Cobb Seamount at present (North Pacific Fisheries Commission [NPFC], 2017); sporadic trips by Canadian vessels began in 1983 and continue to date (Curtis et al., 2015; North Pacific Fisheries Commission [NPFC], 2017) as part of the country’s southern seamount fishery for sablefish (North Pacific Fisheries Commission [NPFC], 2017). The current fishing effort on Cobb Seamount is limited to one vessel per month for a 6 months season with the use of longline trap or longline hook gear (Fisheries and Oceans Canada [DFO], 2013).
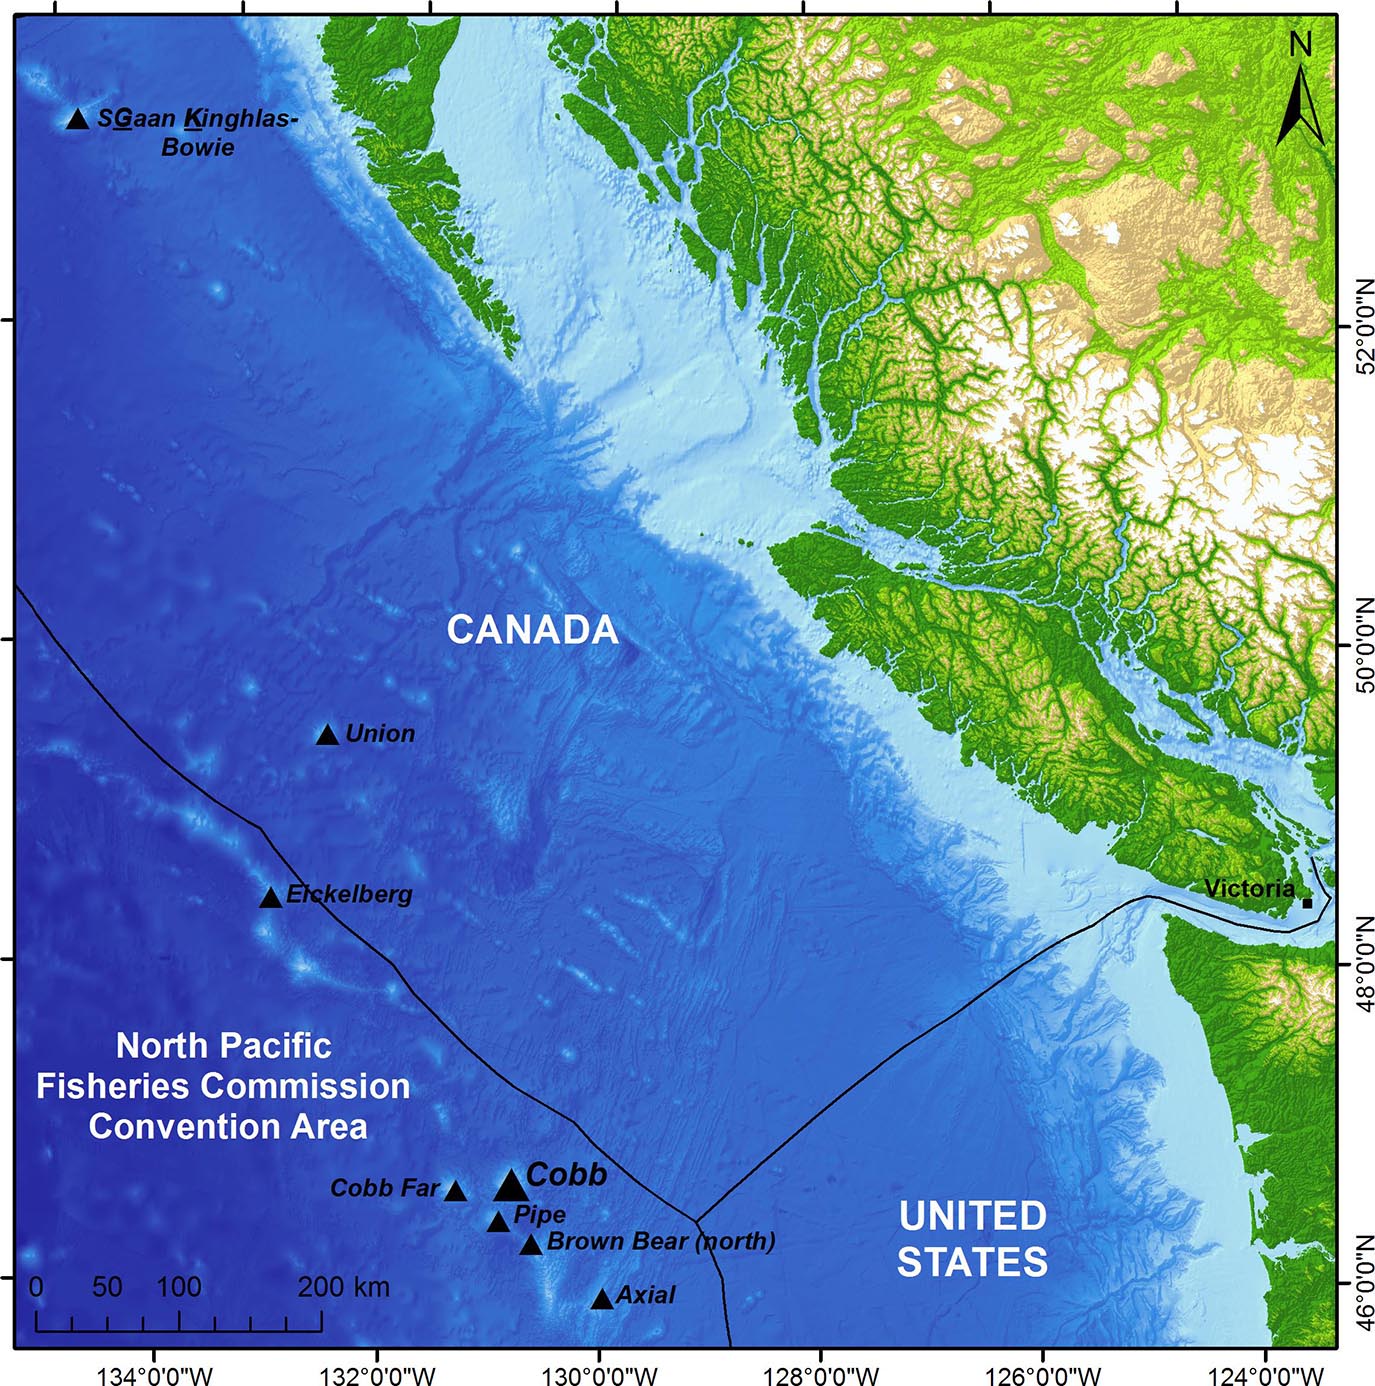
Figure 1. The location of Cobb Seamount (46° 44′ 24′′ N, 130° 48′ 0′′ W), approximately 450 km off the west coast of Canada and the United States, within the North Pacific Fisheries Commission (NPFC) Convention Area of the High Seas. Also shown, seven notable seamounts, including SGaan Kinghlas-Bowie, the only other shallow-water seamount in the region (within the photic zone). The Exclusive Economic Zones are outlined.
Although the present fishing effort on Cobb Seamount is relatively modest, it has been fished for over half a century via bottom longline trap and hook gear, stern and heavy-duty tire bottom trawl nets, gill nets, and mid-water trawls (reviewed in Curtis et al., 2015). Physical contact by such fishing gear can damage, remove, and/or kill structure-forming organisms, including VME indicator taxa (Watling and Norse, 1998; Krieger, 2001; Fosså et al., 2002; Waller et al., 2007; Salgado et al., 2018). Not all fishing gear is equally destructive, but all of the gear types used on Cobb Seamount are capable of impacting VMEs. Current fishing activity on the seamount is limited to bottom longline sets; while these are intended to be stationary, with a relatively small footprint, they nonetheless move across the seafloor during deployment and retrieval, in the event of equipment failure, bad weather, strong tides and currents, operator error, entanglement with DFG, or when fishers grapple to retrieve lost gear (see NOAA Marine Debris Program, 2015 for review). Gauthier (2017) observed 81% of bottom longline sets on SGaan-Kinghlas Bowie Seamount (Figure 1) dragged, rolled, or bounced on the seafloor when in normal use. Historical fishing on Cobb Seamount will also have impacted the seafloor. Bottom trawling is hundreds to thousands of times more destructive than longline gear (Pham et al., 2014) and its impacts can last years to centuries (Watling, 2005). Even gear types that are not intended to make contact with the seafloor, such as gill nets and mid-water trawls, can and often do (e.g., Tingley, 2014; Salgado et al., 2018). Additionally, any gear that has been abandoned, lost, or otherwise discarded on Cobb Seamount over its long fishing history could be inflicting ongoing damage to the seafloor and its inhabitants. This includes trapping, entangling, or killing target and non-target organisms, such as VME indicator taxa (NOAA Marine Debris Program, 2015).
Our understanding of the ecological, cultural, and economic value of seamounts is growing, but so too are the threats they currently face (Pitcher et al., 2007). To adequately mitigate those threats, we must first document the diversity, distribution, and abundance of species on seamounts and assess the historical and potential footprint of anthropogenic impacts. To that end, in July 2012, Fisheries and Oceans Canada [DFO] and the National Oceanic and Atmospheric Administration (NOAA) embarked on a joint expedition to visually survey the communities, as well as fishing impacts, on Cobb Seamount at greater depths and in greater detail than ever before (Curtis et al., 2015; Du Preez et al., 2015, 2016). Here, we utilize the 2012 survey data to examine the spatial distribution of biological structures (i.e., habitat-forming organisms, such as cold-water corals, sponges, and other invertebrates; Buhl-Mortensen et al., 2010) adopted by the NPFC and other RFMOs as VME indicator taxa. We then investigate the recent footprint and effort of bottom longline fishing on Cobb Seamount and report on the prevalence of DFG and its associated impacts. Ultimately, we aim to support international commitments to Resolution 61/105 to identify VMEs and prevent SAIs by bringing together the best available data from a heavily fished seamount in the High Seas of the North Pacific Ocean.
Materials and Methods
Study Area
Cobb Seamount is located in international waters, approximately 450 km southwest of Victoria, Vancouver Island, British Columbia (Figure 1). As one of many seamounts in the Cobb-Eickelberg chain (Chaytor et al., 2007), Cobb Seamount is far offshore, but not isolated. Its nearest neighbor is Pipe Seamount (also known as Cobb South), just 30 km southwest. Cobb Seamount, an ancient volcano, was formed by a hot spot that is currently active at Axial Seamount (Chaytor et al., 2007), 150 km southeast. It stands out among the Northeast Pacific Ocean’s many seamounts because it is a shallow guyot. There is evidence that its last eruption was aerial and that 300 m of the summit plateau was once above sea level (Budinger, 1967; Farrow and Durant, 1985; Chaytor et al., 2007). Today, its flat-topped pinnacle rises to within 34 m of the surface, reaching well within the photic zone, while its base extends to ∼2750 m depth (Figure 2) (Birkeland, 1971; Parker and Tunnicliffe, 1994; Chaytor et al., 2007). The seamount has a two-dimensional (2D) area of approximately 824 km2, and its terraced flanks average 12 degrees in slope (Budinger, 1967).
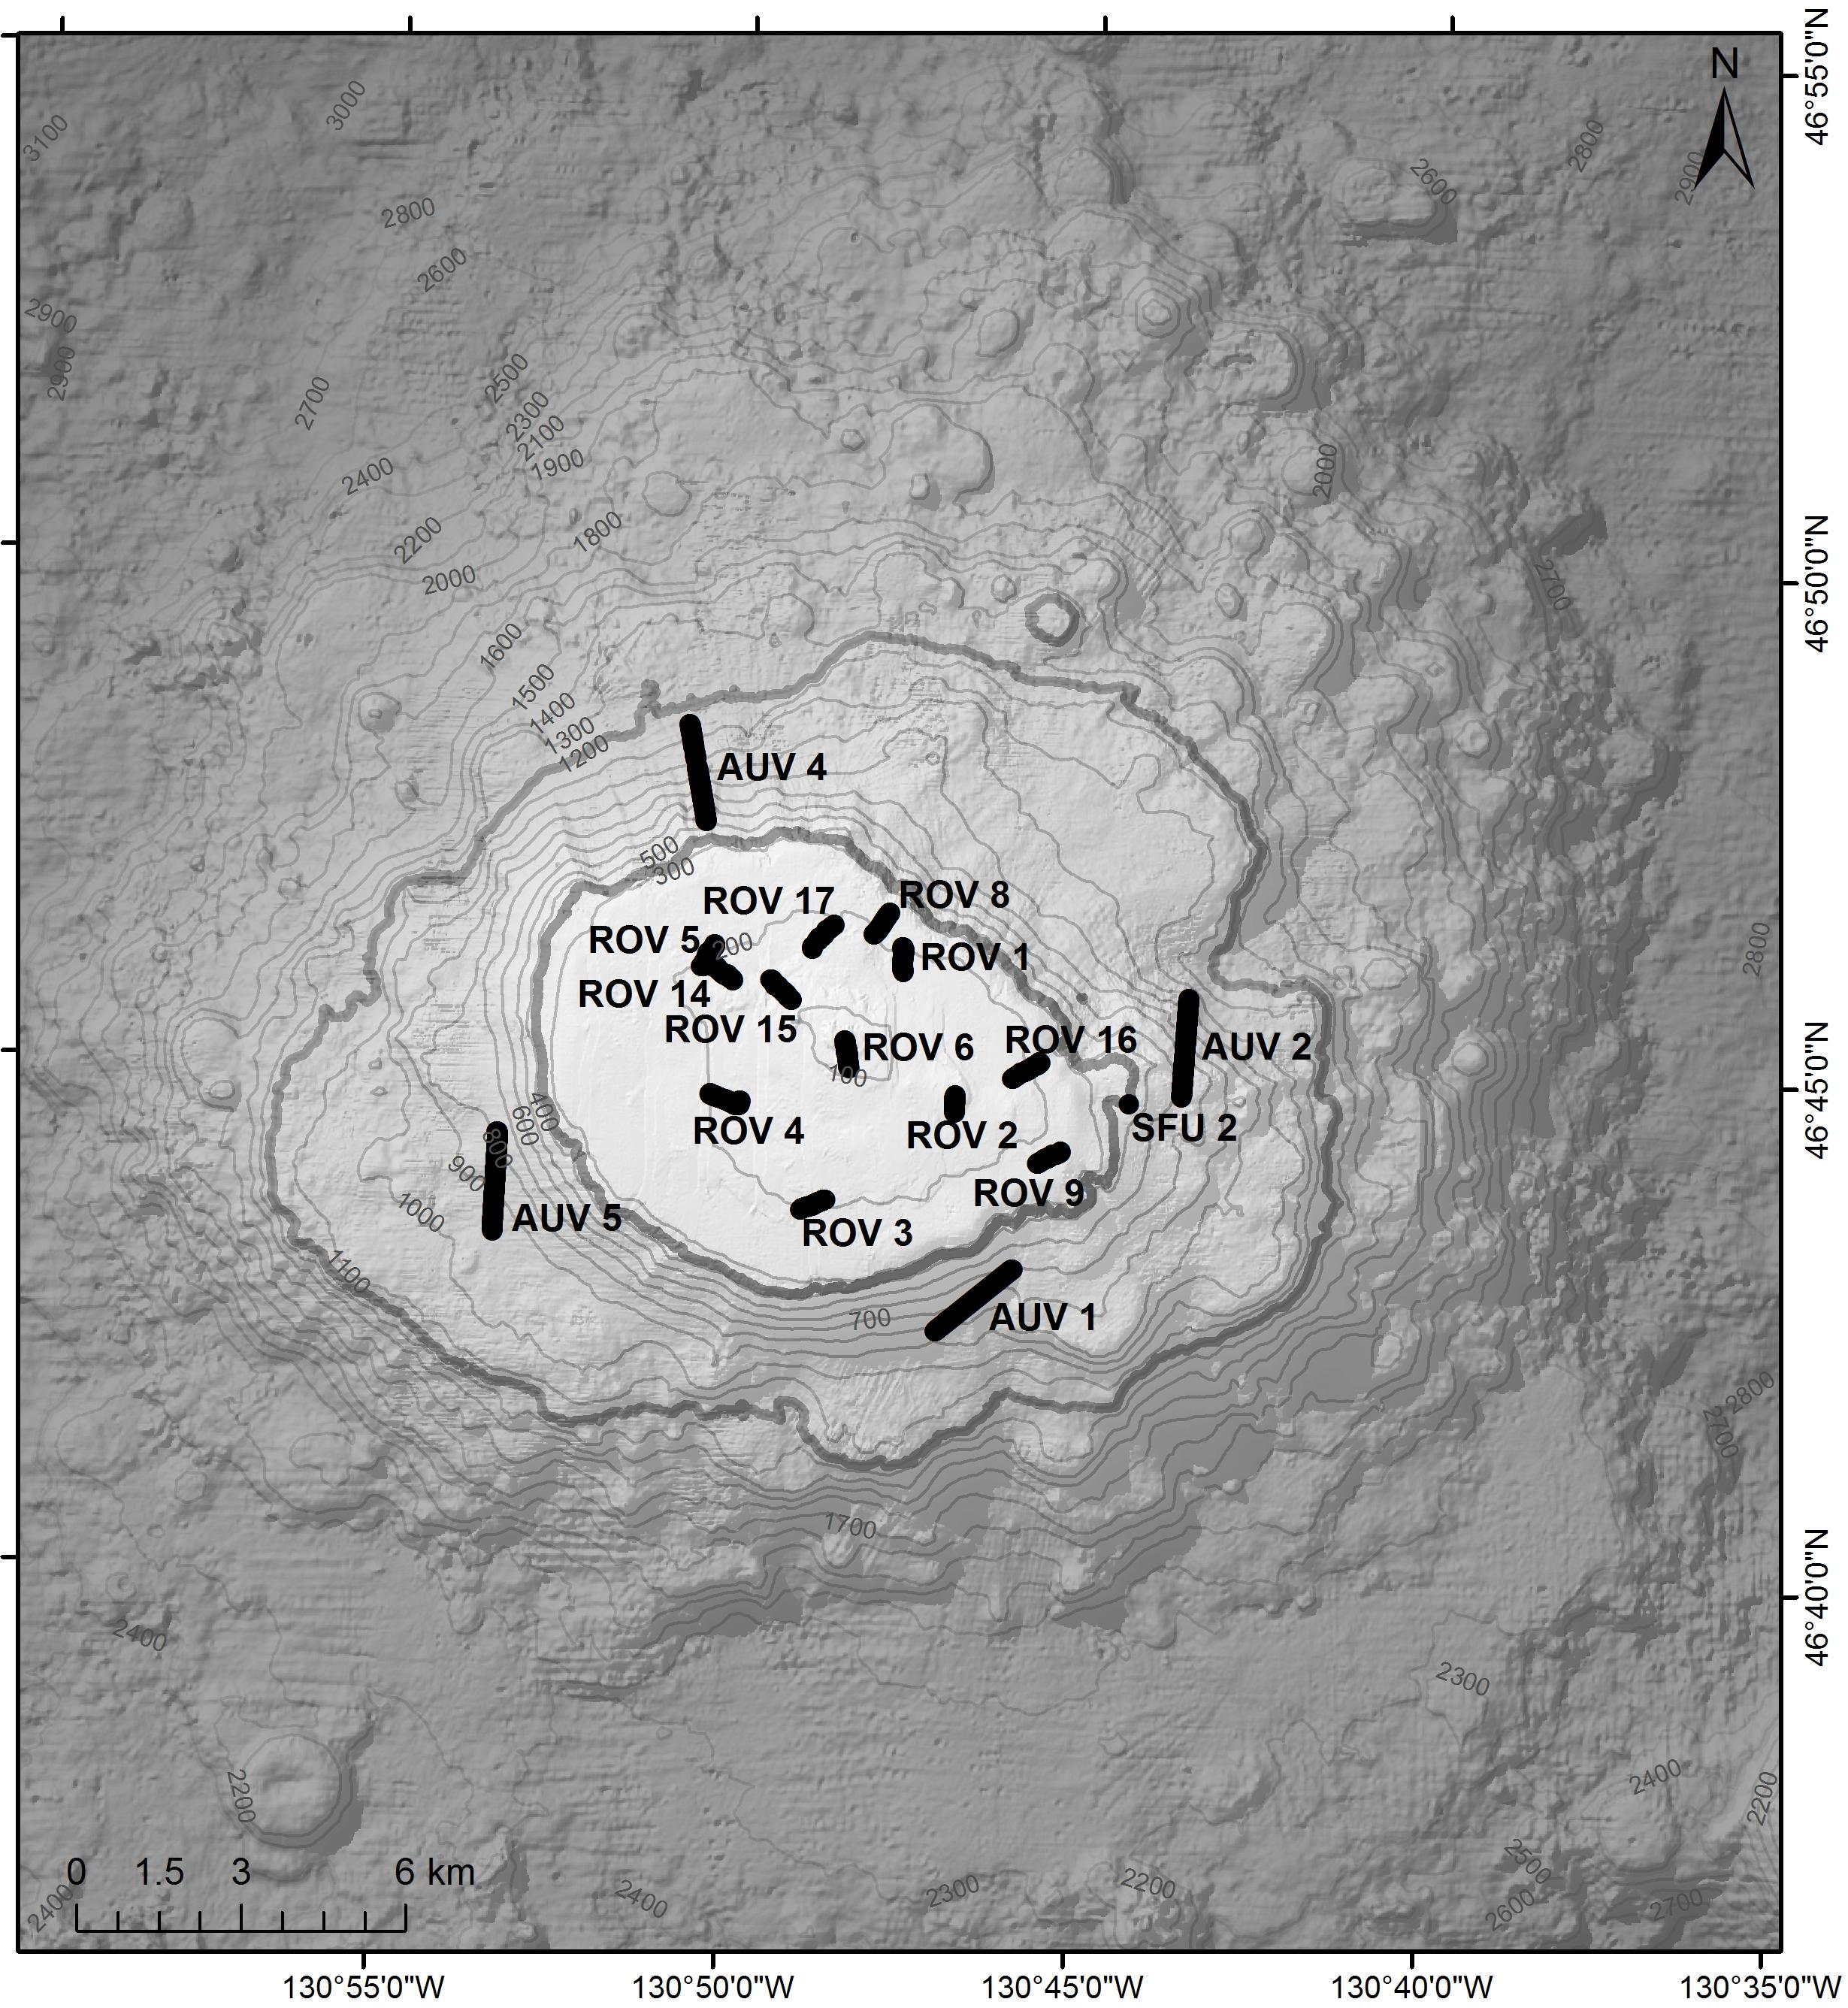
Figure 2. The study area, topography, and transects. Black lines show the locations of the 17 visual survey dives in 2012 on Cobb Seamount, an unusually shallow guyot rising from ∼2750 m depth (∼map boundary) to within 24 m of the surface. The imagery of the pinnacle and shallow seamount summit plateau was collected using a remotely operated vehicle (ROV), imagery at the summit ridge was collected using a ROV during a single short, aborted dive (SFU), and the imagery of the upper flanks was collected using an autonomous underwater vehicle (AUV). The maximum depth for the ROV dives was ∼225 m, the SFU dive was at ∼350 m (bold contour), and the maximum depth for the AUV dives was ∼1200 m (bold contour). Contour lines = 100 m depth intervals.
Biological surveys indicate that Cobb Seamount supports abundant, diverse, and unusual communities of organisms (Birkeland, 1971; Dower et al., 1992; Parker and Tunnicliffe, 1994; Du Preez et al., 2016). This hotspot of marine life is fueled by upwelling of nutrient-rich deep water and a Taylor cone (Dower et al., 1992), enhanced phytoplankton production (Comeau et al., 1995), trapping of diurnally migrating deep scattering layers (Curtis et al., 2015), and in situ primary productivity (kelp forests on the pinnacle and encrusting algae to ∼200 m depth; Parker and Tunnicliffe, 1994; Du Preez et al., 2015). The 267 taxa identified to date (historical and recent records reviewed in Du Preez et al., 2015) cluster into at least ten distinct depth-stratified benthic communities: one on the narrow pinnacle (<90 m), six on the broad summit plateau (90–350 m), and three on the steep upper flanks (350 to at least 1200 m) (Du Preez et al., 2016). The biological communities of the deeper flanks and base of Cobb Seamount have not yet been studied.
Visual Survey
Video and still imagery of the seafloor was collected along seventeen line transect surveys of Cobb Seamount from 21–26 July 2012 (Figure 2). Transects ranging from 350 to 1800 m in length were randomly assigned using ArcMap Generate Random Point tool (start location) and the Excel RANDBETWEEN function (bearing) to strata of varying depths, aspects, and recent fishing effort (avoiding potential hazards, e.g., slope > 30°; Curtis et al., 2015). The survey was conducted with a customized Deep Ocean Engineering Phantom HD2 + 2 remotely operated vehicle (ROV) and a SeaBED-class autonomous underwater vehicle (AUV).
The ROV was equipped with one 8 megapixel Cyclops digital still camera (C-Map Systems, Inc.), one high definition (HD) Mini Zeus video camera (1080i, Insite Pacific Inc.), and 10 cm parallel lasers to allow calculation of the field of view (and therefore densities from counts). It was piloted 0.5–1.5 m above the seafloor at a speed of approximately 0.1–0.25 m/s (0.2–0.5 knots) and completed 12 transects on the summit plateau at depths of 34–225 m (Figure 2). The AUV (Clarke et al., 2010) was equipped with three Prosilica GigE 14 cameras which collected digital still photographs every 10 s from a height of approximately 3 m above the seafloor. It possessed an altimeter to allow calculation of the field of view and completed four transects on the flanks of the seamount at depths of 465–1154 m (Figure 2).
Although the intention was to survey the entire depth range above 1200 m using the shallow-water ROV and deep-water AUV, dives between 225 and 465 m were aborted because of technical issues. One short pseudo-transect (Figure 2: SFU 2) was completed within the depth gap before the dive ended (Curtis et al., 2015), but data from this transect was only useful for the DFG analyses because the imagery was too poor to resolve the benthos. A total of 13.5 km or 29,364 m2 was surveyed, including 8.3 km or 12,262 m2 covered by the ROV and 5.2 km or 17,102 m2 covered by the AUV (Curtis et al., 2015). Additional details on the survey design and configuration of the submersibles are provided by Clarke et al. (2010) and Curtis et al. (2015).
Imagery Annotation
During post-expedition video and photograph annotation in Video Miner (versions 2.1.3 and 2.1.4; a custom DFO image annotation software), we counted organisms using the methodologies outlined in Du Preez et al. (2016). The ROV-collected videos were annotated in 10-s intervals (approximately 5 m2; supplemented with stills) and the non-overlapping AUV-collected still photographs were annotated in their entirety (approximately 5 m2). We calculated the average densities per 10-s ROV video interval or high-altitude AUV photograph (where each interval or photo is one record and density is reported as per square meter) for a comprehensive list of organisms that meet the FAO criteria outlined for VME indicator taxa (FAO, 2009) and have been adopted by one or more RFMOs (Table 1). The taxonomic groups were soft corals (order Alcyonacea), black corals (order Antipatharia), stony corals (order Scleractinia), hydrocorals (family Stylasteridae), sea pens (order Pennatulacea), the crinoid Florometra serratissima, the giant scallop Crassadoma gigantea (presence only; individuals could not be confidently resolved from the continuous and encrusted mats of this taxon), and glass sponges (class Hexactinellida) (example images in Figure 3). The VME indicator taxa were grouped at the lowest level of taxonomic resolution possible based on morphotype (Du Preez et al., 2015). VME indicator taxa that were too rare for inclusion in our analyses and were grouped at higher levels include Isididae (Keratoisis sp. A and B, and Isidella tentaculum), Primnoidae (Plumarella superba and Primnoa pacifica), and Rossellidae (cf Acanthascus spp., Rhabdocalyptus spp., Staurocalyptus spp., and Bathydorous sp.).
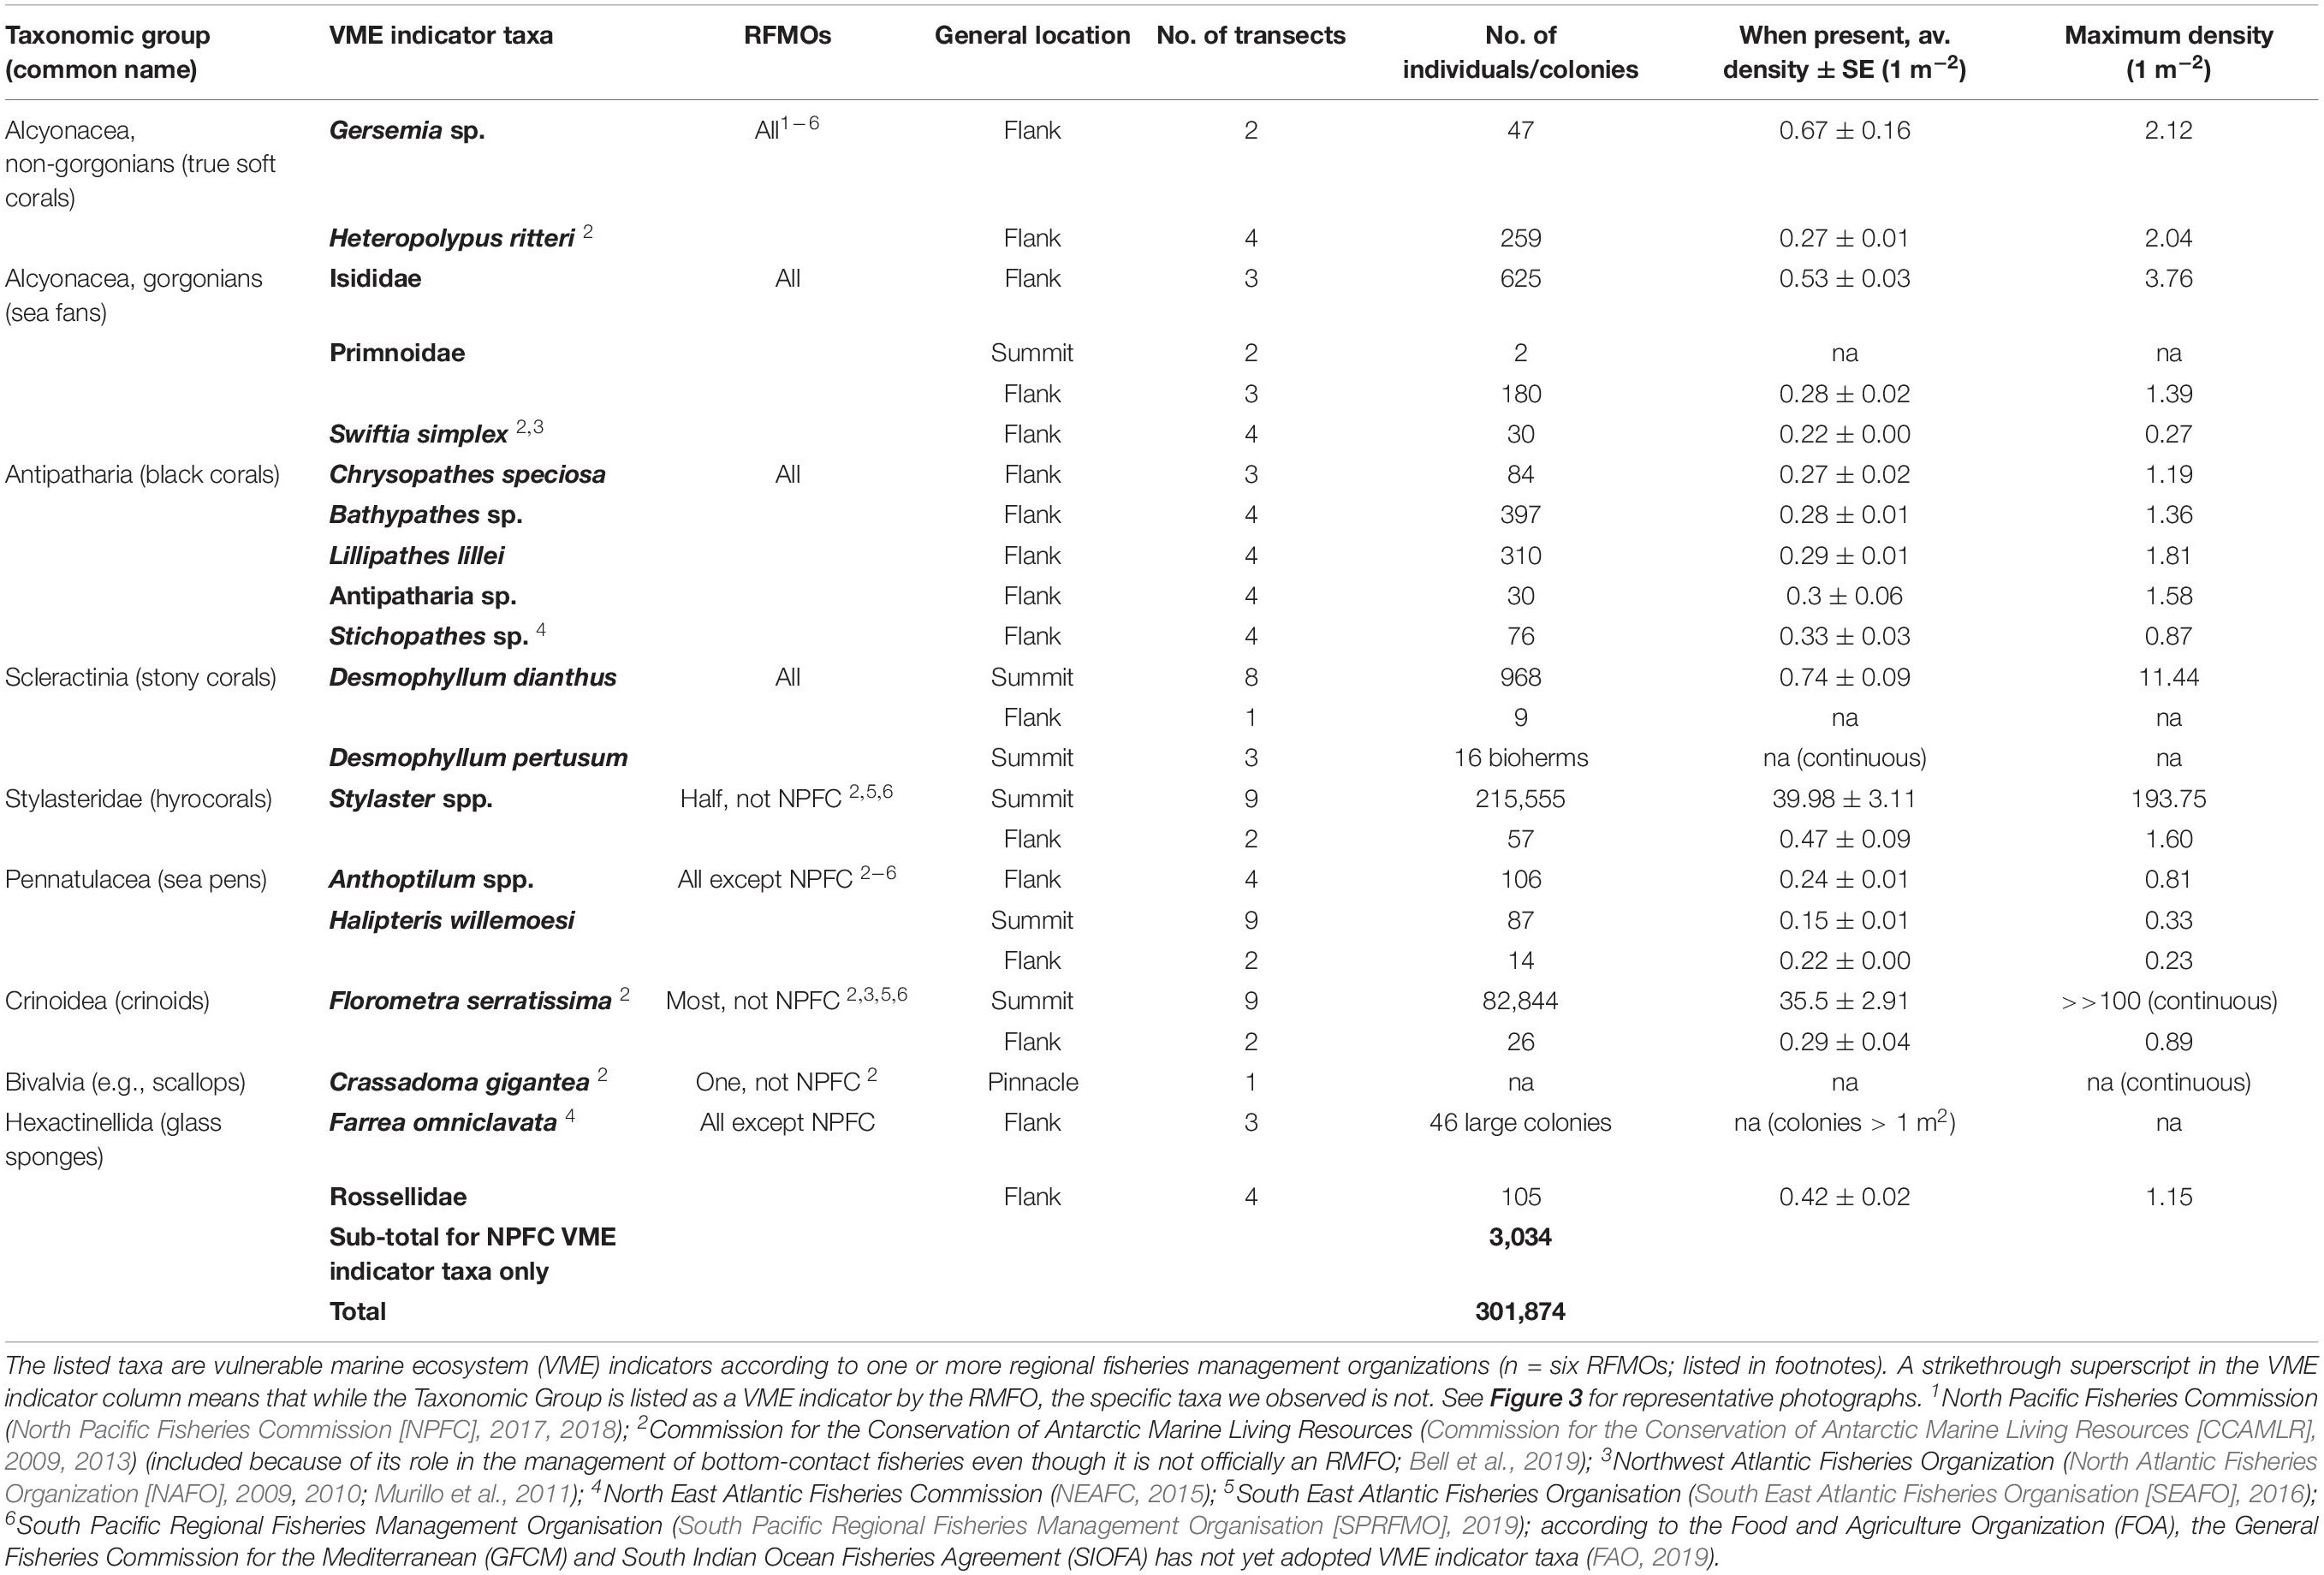
Table 1. The occurrences of 19 groupings of habitat-forming biological structures on Cobb Seamount, observed during a 2012 visual survey.
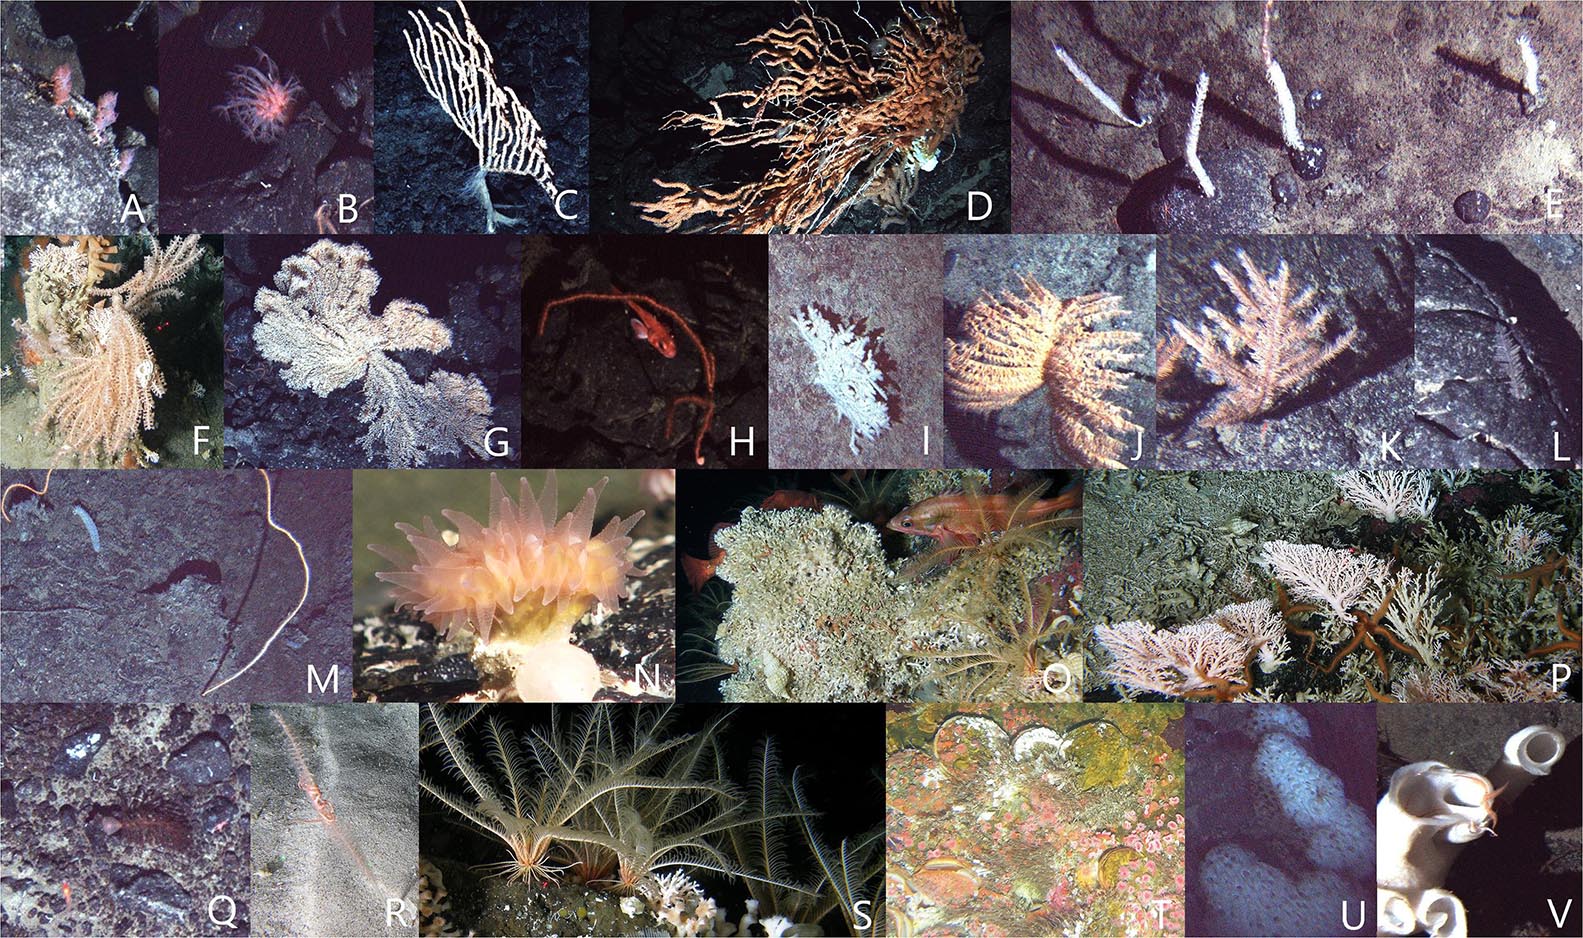
Figure 3. Representative photographs of the 19 groupings of habitat-forming biological structures on Cobb Seamount, observed during the 2012 visual survey. The listed taxa are vulnerable marine ecosystem (VME) indicators according to one or more regional fisheries management organizations (RFMOs; see Table 1). The Alcyonacea soft corals (A) Gersemia sp., (B) Heteropolypus ritteri, (C) Isidella tentaculum, (D) Keratoisis sp. A, (E) Keratoisis sp. B, (F) Primnoa pacifica, (G) Plumarella superba, and (H) Swiftia simplex. The Antipatharia black corals (I) Chrysopathes speciosa, (J) Bathypathes sp., (K) Lillipathes lillei, (L) Antipatharia sp., and (M) Stichopathes sp. The Scleractinia stony corals (N) Desmophyllum dianthus and (O) D. pertusum (prior epithet Lophelia pertusa). The hydrocorals, Stylaster spp. (P), the two Pennatulacea sea pens, (Q) Anthoptilum spp. and (R) Halipteris willemoesi, (S) the crinoid Florometra serratissima, (T) the giant scallop, Crassadoma gigantean, and the two Hexactinellida glass sponges, (U) Farrea omniclavata and (V) Rossellidae.
We also recorded all DFG and noted instances where this gear was entangled in damaged, broken, toppled, or dead biological structures. Gear type identification was made by comparing close-up imagery to published descriptions and photographs of DFG (e.g., Donaldson et al., 2010; Ragnarsson et al., 2017; Salgado et al., 2018; Baco et al., 2019). We distinguished between longline groundlines stretched across the seafloor (continuing beyond the field of view in both directions), clumps of rope in large piles, and pieces of rope which could have originated from longline groundlines but were short (i.e., ends were visible in the field of view). Putative drag marks were also noted; an incident equated to any observations of one or more drag marks across the substrate but not associated with the presence of DFG. The observed DFG was standardized to both km–1 and 2D km–2 for each transect (for ease of reference and comparability with our studies). We also annotated any other observable evidence of damage to VME indicators caused by physical contact.
Geospatial and Statistical Analyses
All annotated data was georeferenced (with latitude, longitude, and depth) using the navigational data of the ROVs and AUV. Mapping and geospatial analyses were executed in ArcMap 10.4. We used locations of seamounts in Canada, the United States, and adjacent ABNJ (e.g., DFO, 2019a) to measure the distance between seamounts and the continental slope and thus quantify the isolation of habitats on Cobb Seamount. For depth data (and as the base layer for our maps), we used the published 20 m × 20 m bathymetric raster data obtained by NOAA in 2000 using a SeaBeam2112 onboard the NOAA Ship RV Ronald Brown (survey RB0002). Statistical analyses were run in RStudio 1.1.442 starting with Shapiro Normality Tests and reporting averages ± standard error and a significant p-value ≤ 0.05.
Recent Fishing Footprint and Effort Analysis
The recent Canadian longline fishing effort does not represent the full fishing footprint, given the extended duration and nature of historical fishing on Cobb Seamount. We nonetheless included it in our study to examine the most recent impacts of fishing. We obtained DFO fisheries records for commercial sablefish bottom longline fishing on Cobb Seamount over 22 years, from 1996 to 2017, inclusive. There is no comparable data for earlier trips (i.e., 1983–1995). The fisheries records included the start and end set locations, gear used (trap or hooks), and trap size from each fishing event (n = 466) over 87 trips.
We used the Wilcoxon Test to test for a change in fishing depth over time by calculating the average deepest and shallowest point of each longline set and comparing the averages for two equal time periods (1996–2005 and 2006–2017). For our spatial analyses, we used a conservative assumption that longlines were set straight across from the start to the end of set locations. We generated grid cells of 500 m by 500 m to cover the seamount and mapped fishing effort as the number of sets transecting each cell. We do not display cells fished by two or fewer vessels (applies to 40% of cells) to comply with DFO’s “three-party rule” to respect the privacy of commercial fishers. This results in an underrepresentation of the depth limits and spatial coverage of fishing in our maps. We executed a spatial (Spearman) correlation of VME indicator densities and fishing effort by averaging the density of VME indicators within each cell.
Area Affected by the Recent Fishing
During bottom longline fishing, at a minimum, the anchors, longline, branch lines, and ±60 traps make contact with the seafloor, impacting biological structures within the footprint through entanglement, crushing, and by shearing (Doherty and Cox, 2017). For a range of conservative estimates of the area affected by the bottom longlines and traps, we calculated different scenarios: one assuming little to no gear movement and one incorporating a modest amount of movement (as documented in Gauthier, 2017). For each scenario, 2D area affected was calculated using ArcMap tools Buffer (with dissolve) and Clip to generate a footprint for each 50 m depth bin. We measured the longline string length for each set and used the average trap width of 137 cm (DFO fisheries records).
The two scenarios calculated:
Scenario 1: area affected = longline string length × trap width
Scenario 2: area affected = longline string length × 100 m moderate swept area of gear-drag during the deployment and retrieval (calculation from DFO, 2018; aligns with the nature of the trap movement documented by Gauthier, 2017).
For example, using scenario 1 and an average longline string length of 2,915 ± 25 m (DFO fisheries records), we estimate the average set’s bottom footprint was 3,994 ± 34 m2. This footprint is comparable to the estimate of 3,200 m2, made using in situ video, accelerometer, and depth sensor data from sablefish bottom longline trap gear on SGaan-Kinghlas Bowie Seamount (Doherty and Cox, 2017) but is very conservative in comparison to scenario 2, which is over 72 times larger, assuming a 100 m lateral movement (sweep) of the gear, based on expert opinion (DFO, 2018) (i.e., almost 300,000 m2 for an average longline set). While the range of these scenarios may seem large, they do not account for the broader area affected by secondary impacts (e.g., the sediment resuspension from gear movement; DFO, 2018).
Derelict Fishing Gear
To estimate the amount of DFG within the fishable depths of Cobb Seamount, we extrapolated the average density of DFG (km–2) we observed to the 2D surface area above 1200 m (220 km2) (n = 16 transects; data from Curtis et al., 2015). Although SFU 2 appeared to have one of the highest densities of DFG, it was excluded from the estimate because we could not confidently calculate area (i.e., poor visual quality).
Results
Biological Structures and Their Biogenic Habitats
We generated 5,143 spatial records (each ∼5 m2) which contain the identification, abundance, and location of 301,874 individual biological structures belonging to one of 19 groupings of VME indicator taxa (26 individual resolvable taxa) (Table 1 and Figure 3). Of the 19 taxonomic groupings, 12 are recognized as VME indicators by all RFMOs (those with published lists of VME indicator taxa; Table 1) and are relatively well studied. However, these soft, black, and stony corals comprised just ∼1% of colonies/individuals recorded during the survey (Table 1). The remaining 99% of individuals recorded during the survey were comprised of seven taxa which are presently adopted as VME indicators by one or more RFMOs, but not by the NPFC. These include the hydrocorals (Stylaster spp.), crinoids (F. serratissima), sea pens (order Pennatulacea), scallops (C. gigantea), and glass sponges (Table 1). Overall, hydrocorals and crinoids were the most numerically abundant VME taxa we observed, comprising 71% and 27% of all individuals, respectively. These taxa both formed the densest aggregations, with maximum counts of over one hundred individuals/colonies⋅m–2 attained before individuals blended into broad continuous fields (Table 1).
While in relatively low abundances, there was diversity in the cold-water coral biological structures. Of the soft coral taxa, the majority were large, erect, branching corals. The most abundant soft corals, the Isididae species, included individuals up to ∼2 m tall. Two large Paragorgia sp. colonies were also observed, but the species was too rare to include in this study. We observed two taxa of low-relief true soft corals: Gersemia sp. and Heteropolypus ritteri. The black coral taxa recorded included one whip-like coral (Stichopathes sp.) and four branching, bush-like corals (e.g., Bathypathes sp.). Soft and black corals aggregated in high-density forest-like patches, whereas the stony corals aggregated in low-relief clusters, with the exception of the stony coral Desmophyllum pertusum (prior epithet Lophelia pertusa; Addamo et al., 2016) which formed large erect, complex bioherms.
Hydrocorals
Hard hydrocoral colonies ∼20 cm tall covered the boulders and bedrock along entire transects and did not generally co-occur in high abundances with other biological structures (i.e., soft corals, black corals, sponges, or scallops). However, they were often associated with dense and diverse assemblages of other mobile, sedentary and/or sessile animals. The most conspicuous associates were small rockfish species (e.g., rosethorn rockfish, Sebastes helvomaculatus; Figure 4A), white-spined sea cucumbers (Apostichopus leukothele), nudibranchs (order Nudibranchia), and hermit crabs (Elassochirus cavimanus). While these large mobile animals were tucked between and against hydrocoral colonies, small sedentary and sessile animals were observed attached to the live coral branches, such as brittle stars (class Ophiuroidea; Figure 4B), zoanthids (order Zoantharia), pale urchins (Strongylocentrotus pallidus), California lamp shells (Laqueus californianus), hydroids (class Hydrozoa), caprellids (family Caprellidae), sea stars (class Asteroidea), and tubeworms (order Sabellida). Transects typified by fields of hydrocorals also supported abundant large rockfish, including large blackspotted and rougheye rockfish (Sebastes melanostictus and S. aleutianus).
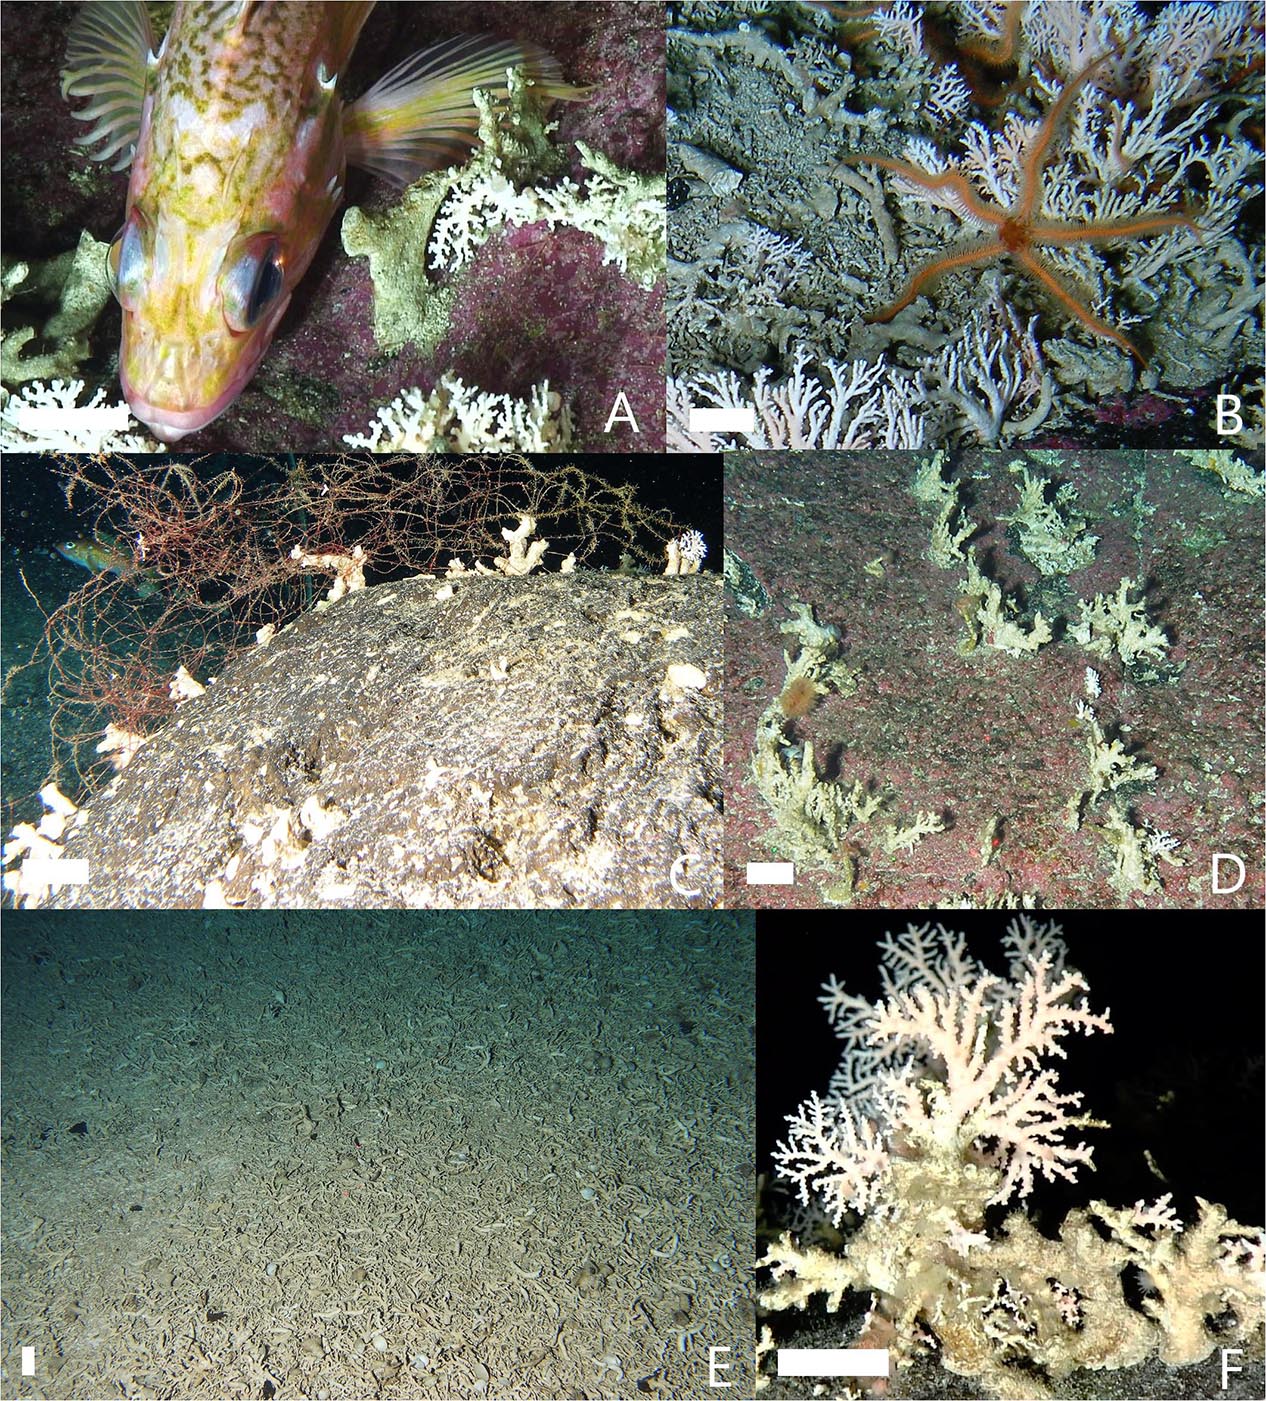
Figure 4. Examples of associations and conditions of hydrocorals (Stylaster spp.). Common associates with hydrocorals were (A) small rockfish species (e.g., rosethorn rockfish, Sebastes helvomaculatus) tucked against colonies and (B) ophiuroids (class Ophiuroidea) perched on colonies. Colonies of hydrocorals (C) entangled in derelict fishing gear (DFG) and (D) on flat surfaces were most often reduced to dead branchless stumps. (E) Detached corals covered the sediment in continuous mats of rubble. (F) There were signs of new growth, some large stumps supported small live branches. White scale bars = 2 cm.
Many of the attached hydrocorals we observed on the summit of Cobb Seamount were dead (i.e., skeleton exposed with no living tissue). For over half of the colonies we observed, only the base stump remained (with or without some severely reduced branches). All colonies entangled in, or directly adjacent to, DFG were reduced to dead stumps (Figure 4C). Hydrocorals on flat surfaces, such as low-lying boulders and smooth bedrock, were also dead and stripped of branches (Figure 4D). These dead corals hosted caprellids, hydroids, and other fouling epifauna. Detached coral rubble carpeted the sediment between boulders or in pockets on bedrock, forming nearly continuous mats of dead corals and branch fragments (Figure 4F). Live colonies were patchy and most often associated with substrate of higher physical complexity. Some large stumps showed signs of new growth, such as small, live branches (Figure 4E).
Crinoids
Crinoids attached to bedrock created dense, continuous fields along current-swept transects (10–100 s of individuals⋅m–2; Table 1). Similar to hydrocoral fields, crinoids were usually the dominant or the only distinguishable biological structures when present. While many epifauna co-occurred with crinoids (e.g., tubeworms, demosponges, hydroids, anemones), they were attached to the rocks and not on the crinoids themselves. During close visual investigations, we observed small rockfish (including juveniles; species list in Du Preez et al., 2015) tucked under the arms of the crinoids and remaining stationary despite strong currents.
Giant Scallops
Giant scallops may have been present in even higher densities than the hydrocorals and crinoids, but we could not confidently resolve individuals within their almost completely encrusted, continuous mats. These bivalves were the foundation of complex living carpets of various encrusting sponges, strawberry anemones (Corynactis californica), coralline algae (Lithothamnoin spp. and Lithophyllum spp.), bushes of unidentified tube worms, and encrusting bryozoans (Reginella hippocrepis). During the shallowest transect of the survey, we observed schools of widow and rosy rockfish (S. entomelas and S. rosaceus) above the scallop biogenic habitat.
Other Biological Structures
Not all biological structures occurred in high abundances or were photographed equally well. Close-up imagery from the AUV was rare, so we were not able to resolve the taxa for all biological structures —specifically those present on deeper transects. Of the sea pens, Halipteris willemoesi was present in low densities over the shallow sandy bottom and was usually home to a single Asteronyx loveni brittle star (as reported in Du Preez et al., 2016). In comparison, Anthoptilum spp. rock pens were twice as abundant but inhabited deep, hard substratum. When present, the glass sponges were often the largest biological structures, especially in the case of the reef-forming species Farrea omniclavata, which formed complex, emergent mounds. Rare or small VME indicator taxa that could not be confidently resolved or counted—and therefore were not included in the analyses of this study—include anemones, tubeworms, and demosponges (order Actiniaria, family Sabellidae, class Demospongiae).
Distribution of Biogenic Habitats
Nearly 80% of the spatial records contain one or more VME indicators (79.5 ± 5.8% of records per transect; Figure 5), and almost half contain dense (≥1 individual/colony⋅m–2) assemblages of VME indicators (45.6 ± 9.6%; Figure 5). VME indicators were present at all depths, but density decreased as depth increased. Only one section of a single transect at depths below 465 m supported dense assemblages of VME indicators- the deepest end of AUV 4 (just 2.0 ± 2.0% of records per transect on the seamount flanks; Figure 5). Along the summit plateau, 60% (±9.5) of records per transect supported dense assemblages. The two shallowest transects, on or adjacent to the pinnacle (ROV 2 and 6; between 35 and 138 m depth), supported dense assemblages over their entire lengths (671 and 352 m). Records containing no VME indicators (0 individuals/colonies⋅m–2) occurred most often on transects over sand.
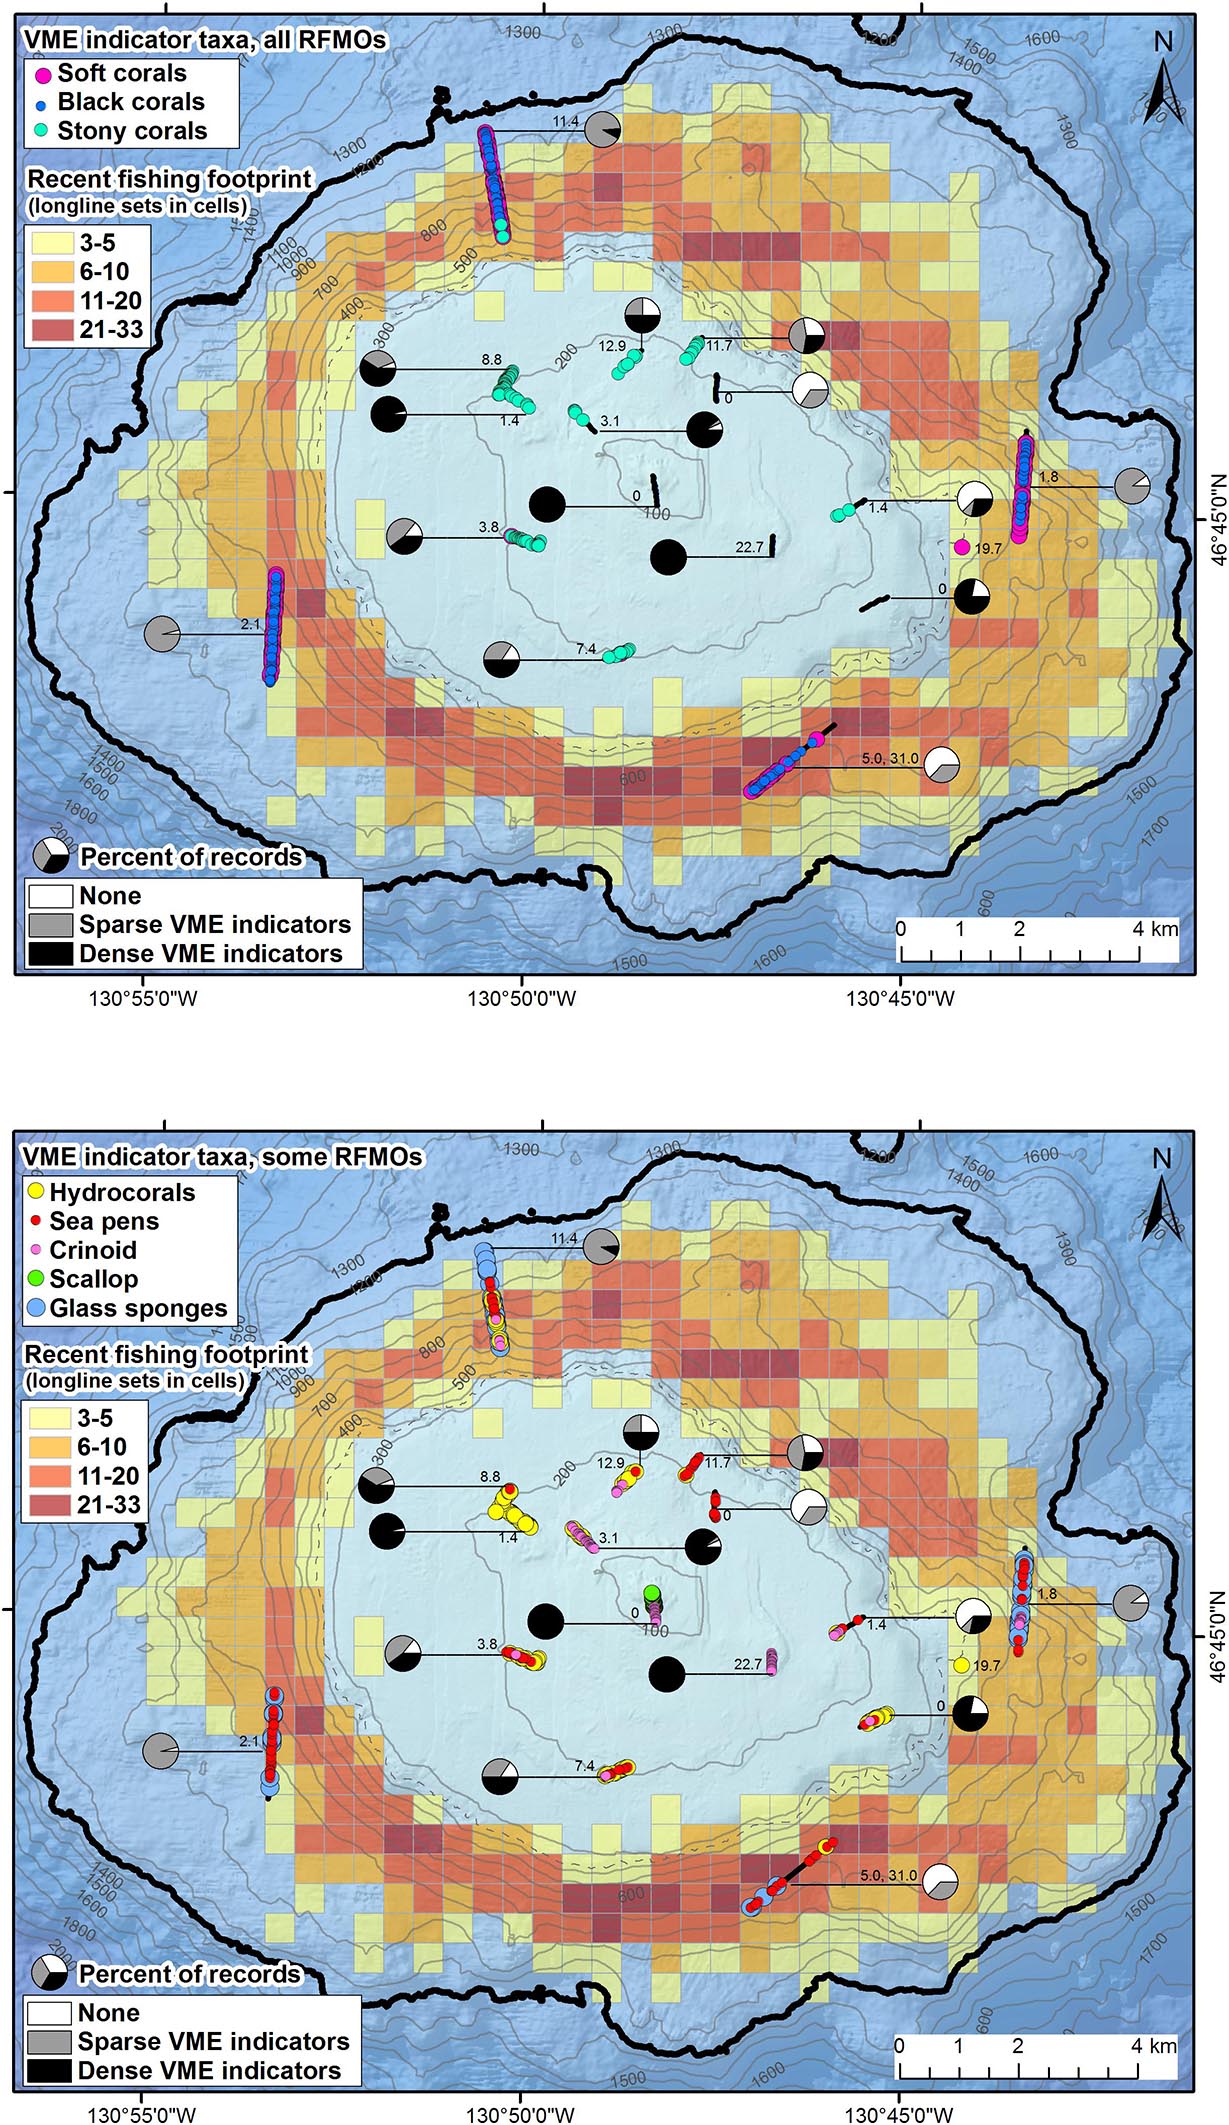
Figure 5. Maps showing the densities and distributions of vulnerable marine ecosystem (VME) indicators, the recent longline fishing footprint and effort (1996–2017), and density of derelict fishing gear on Cobb Seamount. Pie charts show the percent of records per transect with no VME indicators (0 m–2), sparse VME indicators (>0 and <1 m–2), and dense VME indicators (≥1 m–2). The distributions of VME indicators are shown for taxa recognized by (A) all regional fisheries management organizations (RFMOs) and (B) those only recognized by some (not the North Pacific Fisheries Commission). The colored grid cells (500 m by 500 m) indicate the number of longline sets transecting each cell (cells with < 3 vessel removed to comply with “three-party rule”). The number adjacent to the transect is the density (km–1) of derelict fishing gear observed (DFG; AUV 5 includes a second number, the density of drag mark incidents). Contour lines, 100 m depth intervals (350 and 1200 m in gray dashed and black bold, respectively).
Only three biological structures listed as NPFC VME indicator taxa (Primnoidae, D. dianthus, D. pertususum) were present on the summit plateau (Figure 5A); the rest of the NPFC VME indicators were concentrated below 225 m depth (Figure 6). Between ∼160 and 200 m depth, low-density patches or built-up bioherms of D. pertusum were observed (Figure 6) but were rare (only 16 locations; Table 1). This stony coral occasionally co-occurred with hydrocorals and crinoids (e.g., Figure 7A). The small solitary stony cup coral (D. dianthus) had a similar depth distribution (Figure 6) but occurred more frequently (Table 1). From the small amount of imagery at 370 m (SFU 2, aborted dive), it is evident that we likely failed to detect dense aggregations of Primnoa pacifica that exist within the narrow sampling depth gap (Figure 6). These large Primnoidae corals co-occurred with sparsely distributed hydrocorals (Figure 7B). Within the deeper range of the survey, we observed forests of live soft corals and black corals (Figures 7C,D) concentrated on the flanks (Figure 6).
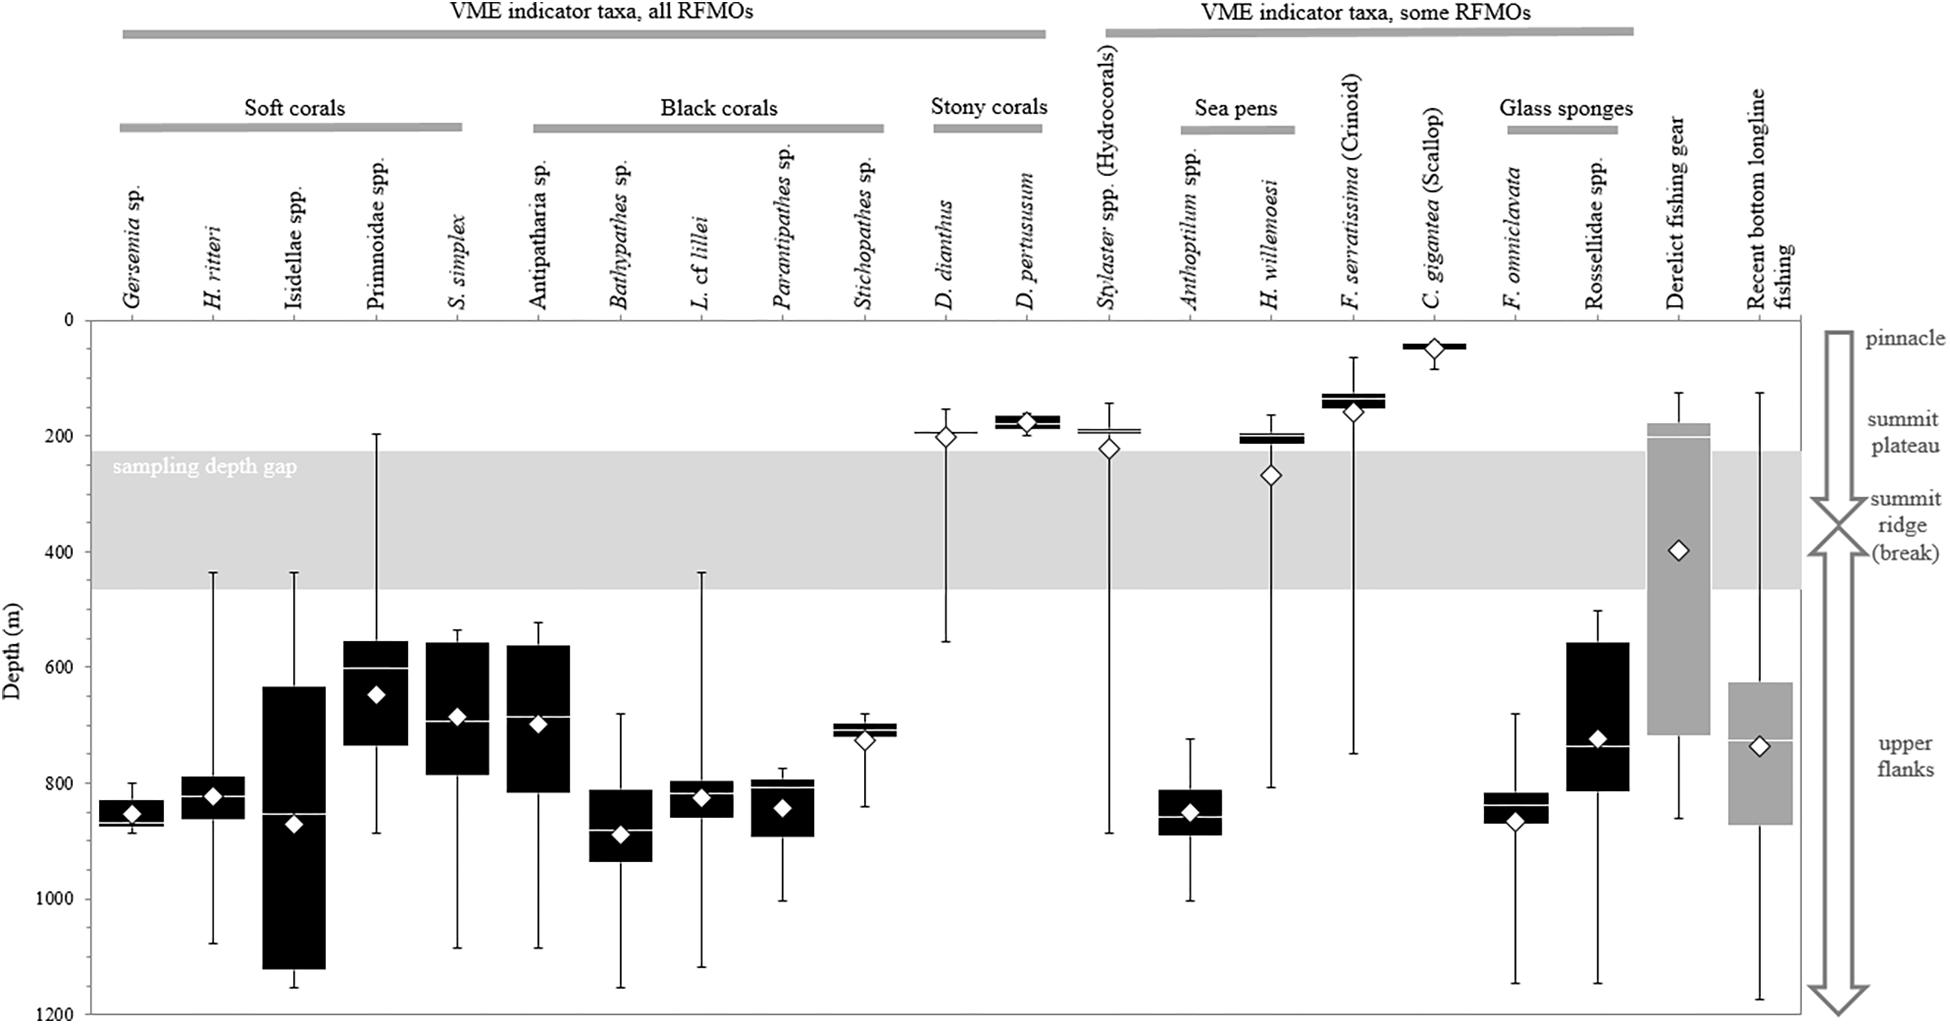
Figure 6. Depth ranges of 19 groupings of habitat-forming biological structures and derelict fishing gear (DFG) on Cobb Seamount, observed during the 2012 visual survey, as well as the recent longline fishing effort. The listed taxa are vulnerable marine ecosystem (VME) indicators according to one or more regional fisheries management organizations (RFMOs; see Table 1). Boxes represent the 1st and 3rd quartile intervals, the white band represents the median (2nd quartile), the whiskers represent the minimum and maximum, and the diamonds represent the mean. There was a survey sampling depth gap between 225 and 465 m (shaded area).
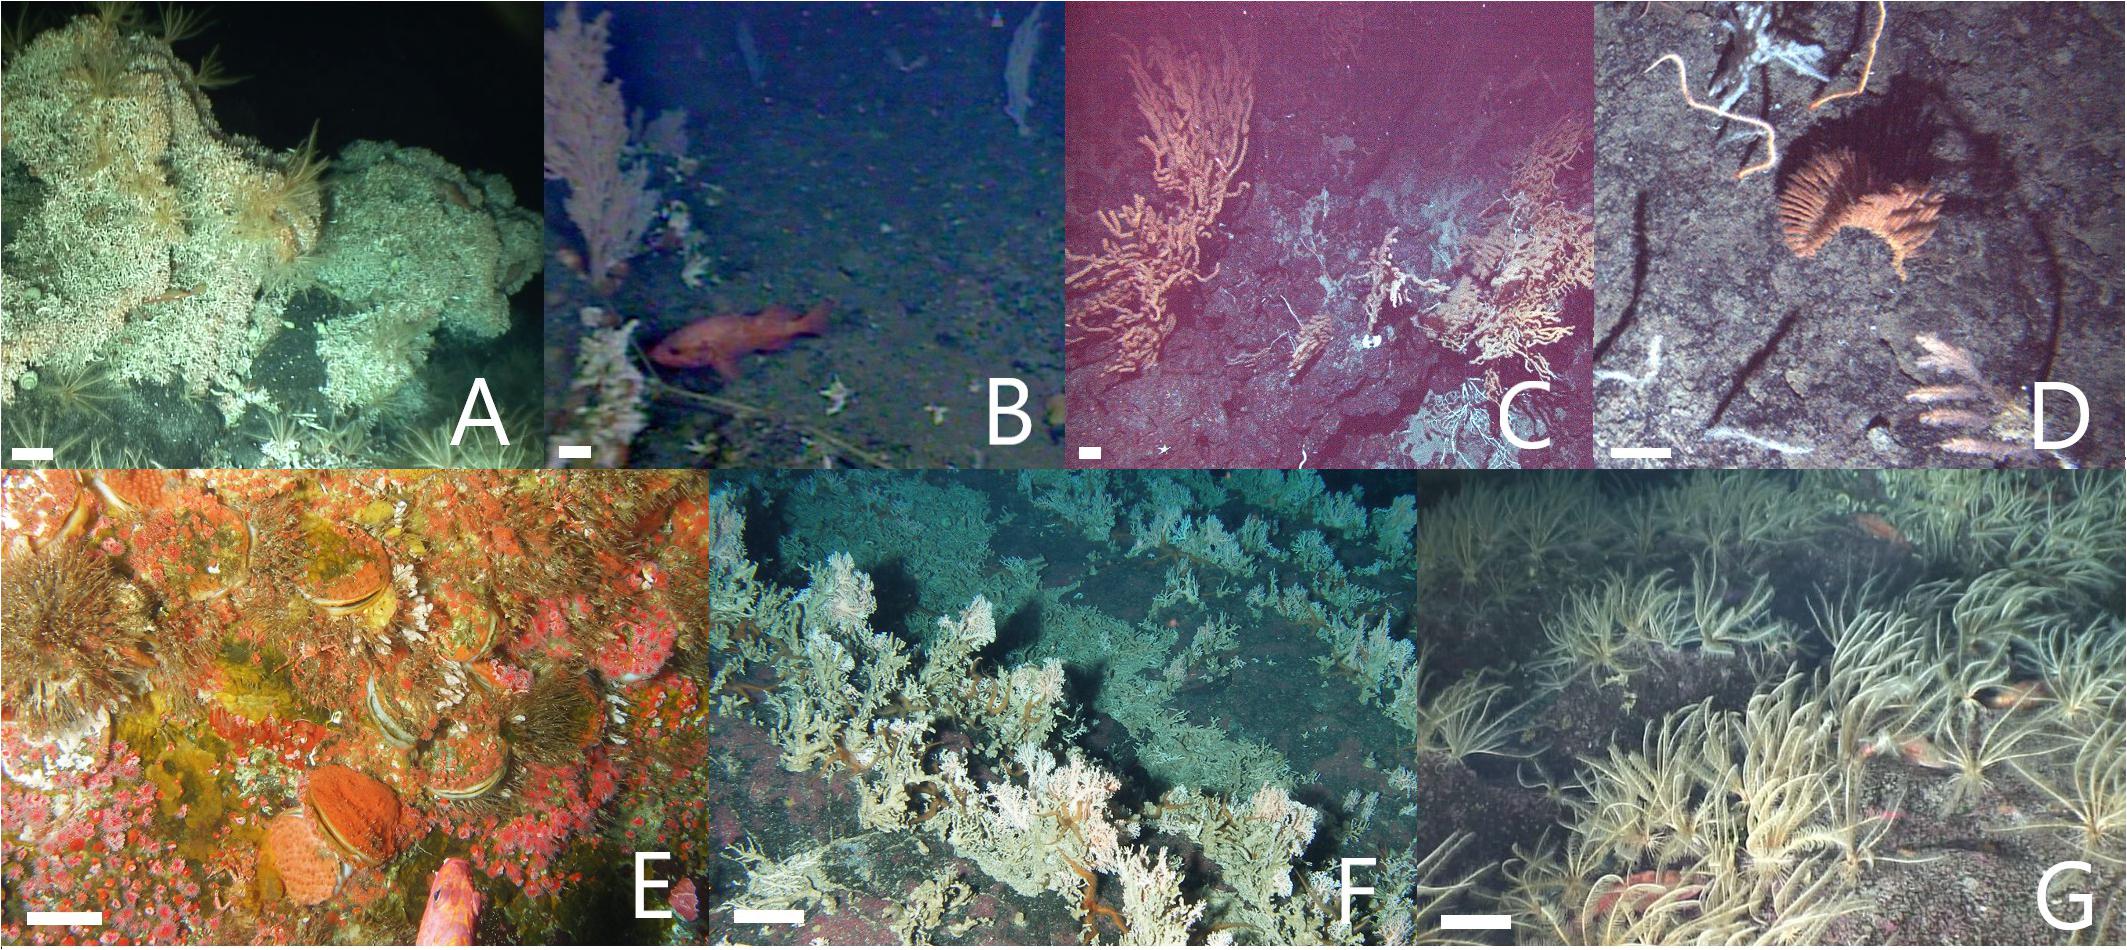
Figure 7. Examples of potential vulnerable marine ecosystems (VMEs): biogenic habitats typified by a variety of biological structures, all of which are VME indicator taxa adopted by one or more regional fisheries management organizations (RMFOs; see Table 1) and within the fishing footprint. (A) Mixed gardens including stony coral bioherms (Desmophyllum pertusum). (B) Diverse forests including soft corals and others (Primnoa pacifica, Desmophyllum dianthus, Stylaster spp.). (C) Aggregations of soft corals (Keratoisis spp. A). (D) Diverse clusters of soft and black corals (Heteropolypus ritteri, Keratoisis sp. B, Bathypathes sp., Lillipathes lillei, Chrysopathes speciosa). (E) Epifauna-encrusted mats of giant scallops (Crassadoma gigantean). (F) Vast fields of hydrocorals (Stylaster spp.). (G) Dense aggregations of crinoids (Florometra serratissima) hiding barely visible small rockfish (Sebastes spp.). Most images are side-view (from the ROV on the pinnacle or summit plateau) with the exceptions of (C,D), which are downward-facing (from the AUV on the flanks). (B) Is a lower quality side-view (from the aborted dive SFU 2 at the summit ridge). White scale bars = 10 cm.
In comparison, the other VME indicator taxa (adopted by one or more RMFOs but not by the NPFC) were observed across the seamount (Figure 5B) and over the entire depth range surveyed in 2012 (Figure 6). The majority of these taxa were strongly depth-stratified (Figure 6), with the continuous living carpets of epifaunal-encrusted giant scallops (Figure 7E) found only on the vertical wall of the pinnacle, vast fields of hydrocorals (Figure 7F) and dense aggregations of crinoids (Figure 7G) mainly on the summit plateau, scattered sea pens on both the summit and flanks, and glass sponges on the flanks. It is likely that soft corals can inhabit shallower depths than we observed (i.e., above 225 m), given that we came across many dead Primnoidae remains on the summit plateau in the form of large stumps attached to the tops of boulders (Figure 8).
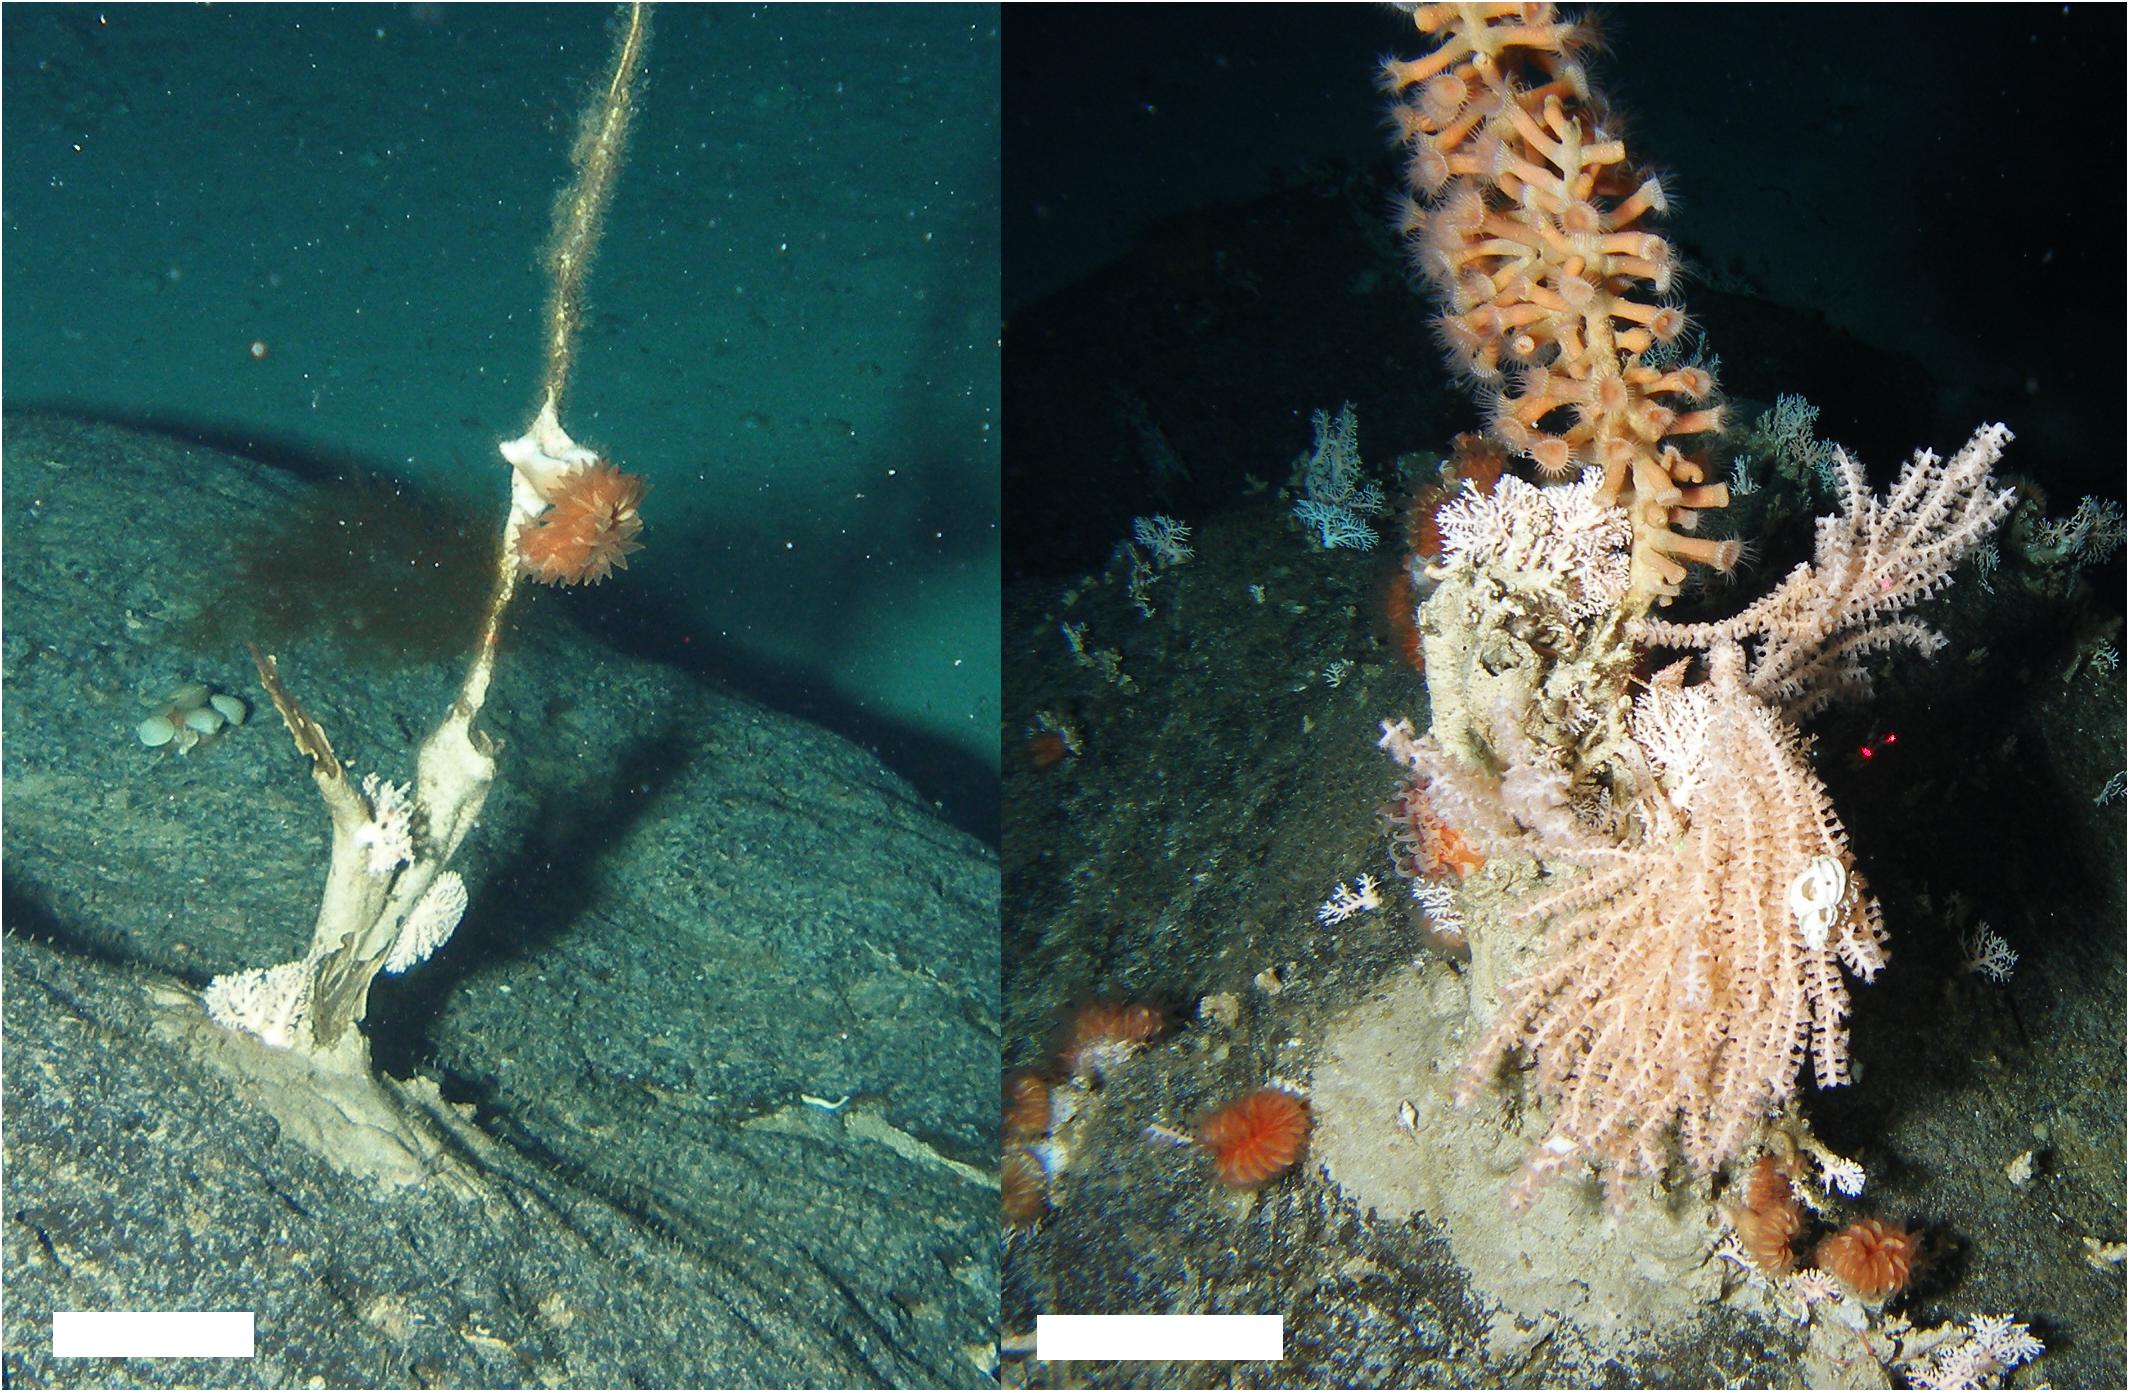
Figure 8. Large stumps attached to the tops of boulders constituted the majority of “soft coral” observations on the summit plateau (cf Primnoidae). Scale bars, 10 cm.
Geospatial analyses of Cobb Seamount in the context of the Northeast Pacific Ocean revealed that the 64 km2 summit plateau (2D area; Figure 9A) is regionally unique habitat. The nearest seafloor to Cobb Seamount above 350 m depth is 340–400 km away, either on the small summit of Union Seamount or the top of the Canadian continental shelf (Figure 1). In comparison, approximately 70 km2 of the seamount is between 350 and 900 m depth (2D area; Figure 9A)—the seafloor within this depth range occurs on three seamounts within 100 km of Cobb Seamount (Pipe, Cobb Far, Brown Bear; Figure 1).
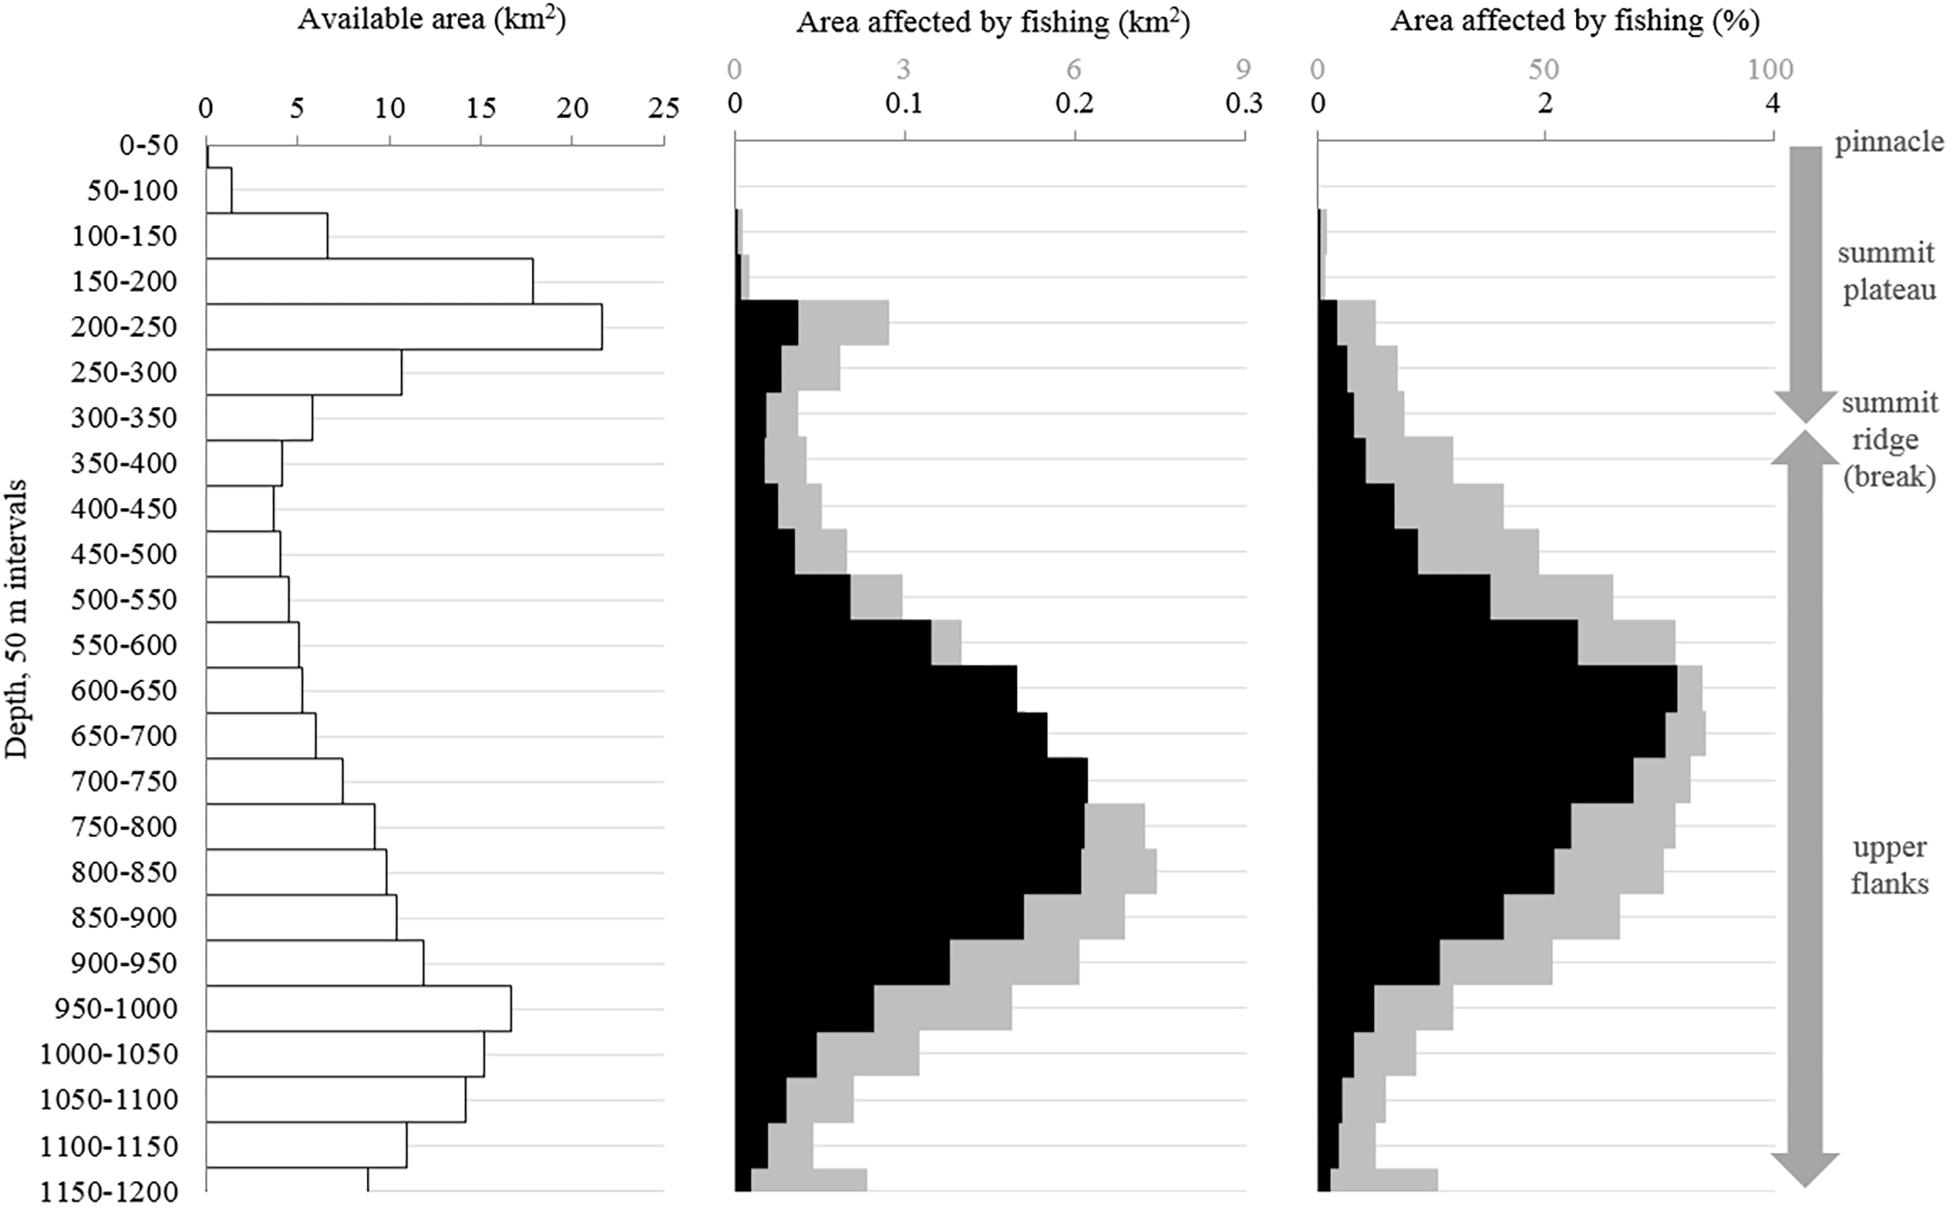
Figure 9. The distribution of (A) the available area of each 50 m depth-interval, (B) the area affected by the 1996–2017 bottom longline fishing using two scenarios, and (C) the percentage of the available area affected by the fishing. Scenario 1 assumes there is little to no movement of traps on the seafloor (black). Scenario 2 assumes there is moderate movement (100 m lateral sweep; gray).
Distribution of Recent Fishing
We obtained information on the fishing activity of 12 Canadian-registered vessels operating on Cobb Seamount between January 1996 and December 2017. Over this period, Canadian vessels deployed 466 bottom longline sets on the seamount: 95% longline traps and 5% fixed hook. Sablefish were landed during nearly every set (99%), while rockfish, other groundfish, and crabs were also landed with some frequency (e.g., 22% of fishing events landed rougheye rockfish).
Over the 22 years, Canadian fishing efforts spanned depths from 96 to 1253 m on Cobb Seamount, with an average fishing depth of 736 ± 1.39 m (Figure 6). The majority of fishing occurred between 625 and 875 m depth (1st and 3rd quantiles; Figure 6) with only two sets extending below 1200 m. These intensively fished depths overlap with the observed depth distribution of multiple VME indicator taxa, including all of the soft and black corals, as well as the rock pen and glass sponges (1st and 3rd quantiles; Figure 6).
From the survey transects that occurred within the fishing footprint (Figure 5), we recorded a significant, negative correlation between the number of longline sets and the average density of VME indicators (Spearman test r −0.650, n 20, p 0.002; Figure 10). We observed an average of approximately one individual/colony⋅m–2 in a cell (500 m by 500 m) fished once, and almost no VME indicators in cells fished 20 or more times. Our dataset included up to 25 longline sets in a single cell (Figure 10). Contrary to the trend of lower VME indicator density at greater depths, the only dense assemblages of VME indicators (≥1 individual/colony⋅m–2) were observed at some of the deepest depths surveyed (960–1154 m depth), on the northern AUV 4 transect below the fishing footprint (Figure 5B).
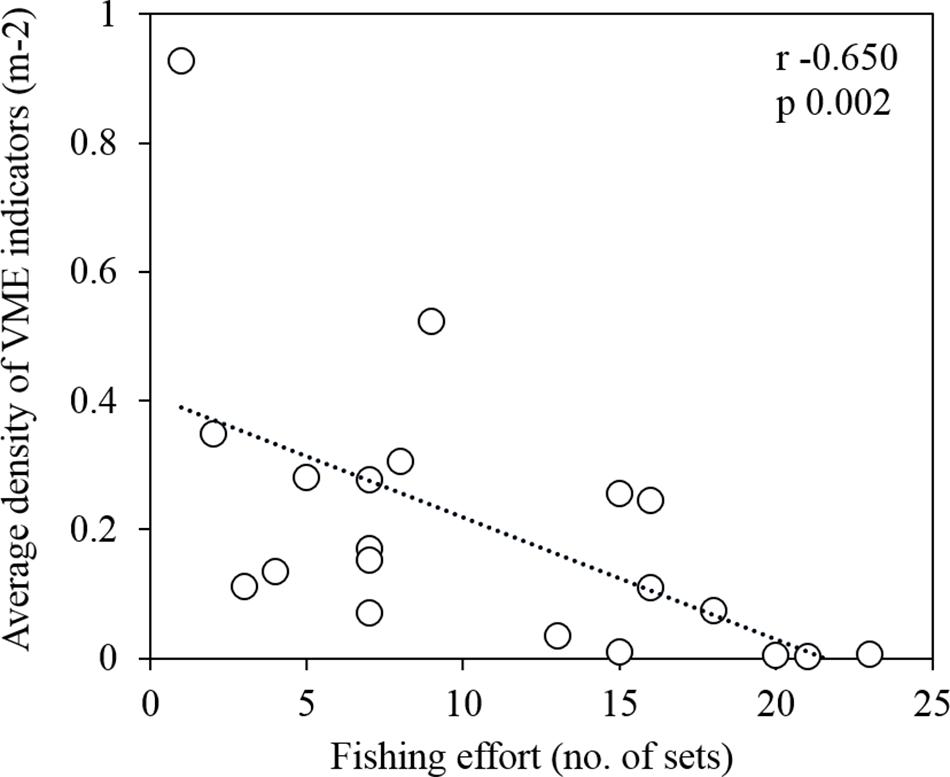
Figure 10. A significant negative correlation between the average density of vulnerable marine ecosystem (VME) indicators (m–2) and the fishing effort (number of transecting longline sets) within grid cells of 500 m by 500 m (Spearman test r –0.650, n 20, p 0.002).
The recent bottom longline fishing footprint provides a conservative estimate of the VME indicator habitat impacted by fishing. In total, we estimate the area affected by direct physical contact with recent bottom longline gear (above 1200 m depth) is 1.8 km2 (0.8%) assuming little to no gear movement (scenario 1) or 74.4 km2 (33.8%) assuming moderate gear movement (scenario 2; Figure 9B). This fishing intensity (and therefore potential for impact) was not evenly distributed, with some areas fished multiple times (i.e., several overlapping sets; Figure 5). The intensity of fishing impact was also interpreted in light of the bathymetry. Each depth interval has a different total area (Figure 9A). Thus, while 800–850 m is the most fished depth-interval, if we account for the area of each depth band, the relatively thin 650–700 m depth interval had the highest relative impact from fishing under scenario 2 (7.4 km2, or 84.9% of the depth band; Figures 9B,C). Based on only this one fishing dataset, we estimate ≥75% of the seafloor between 550 and 850 m depth has been impacted (under scenario 2; Figure 9C).
While the intensity of fishing was not even among all depths, the general distribution of fishing shows only slight spatial patterns related to aspect: there were 20% fewer sets on the western flank compared to the eastern flank, but no notable difference in fishing effort on the northern and southern flanks (Figure 5). There was also no difference in the distribution of fishing effort in relation to traps or hooks.
While this recent fishery has mainly focused on the upper flanks of Cobb Seamount, Canada’s sablefish fishing has shoaled slightly over time: the average shallowest and deepest points of longline sets changed from 689 ± 14 to 599 ± 16 m depth and 866 ± 13 to 826 ± 14 m depth (Wilcox Test p 0.002 and << 0.001) between 1996 to 2005 (n = 246) and 2006 to 2017 (n = 220). The reason for the shift by tens of meters is unknown, but could be the result of a change in the orientation of the sets. Earlier sets were mostly orientated with-slope (crossing a large depth range), whereas latter sets were orientated more across-slope just below the summit ridge (crossing a narrower depth range). This spatial data is not shown to respect privacy considerations for commercial fishers.
Distribution and Impacts of DFG
As is typical of deep-sea benthic visual surveys, the 13.5 km of annotated transects cover just 0.0001% of the seafloor above 1200 m depth on Cobb Seamount (i.e., 0.029364 km2 of the 220 km2 fishable 2D area). Yet, within that small area, we observed 102 incidents of DFG (n = 72) or putative drag marks (n = 30) (Table 2). We distinguished eight categories of gear (Table 2): longline groundlines (36% of gear incidents; Figure 11A), pieces of rope (26%), monofilament gill netting (21%; Figures 11B,C), rope netting (7%; Figure 11D), clumps of rope or netting (4%), anchors (2%), anchored float lines (1%), and trawl netting (1%). We observed some DFG outside of the recent fishing footprint (Figure 5) and depth distribution (Figure 6), suggesting that it was lost many years to decades ago by historical fishing. We also noted some gear was lost so long ago that there was coral growth on it (e.g., on lines extending into the water column; Figure 11E). Other types of anthropogenic litter were also observed, such as fabrics, plastics, and aluminum cans.
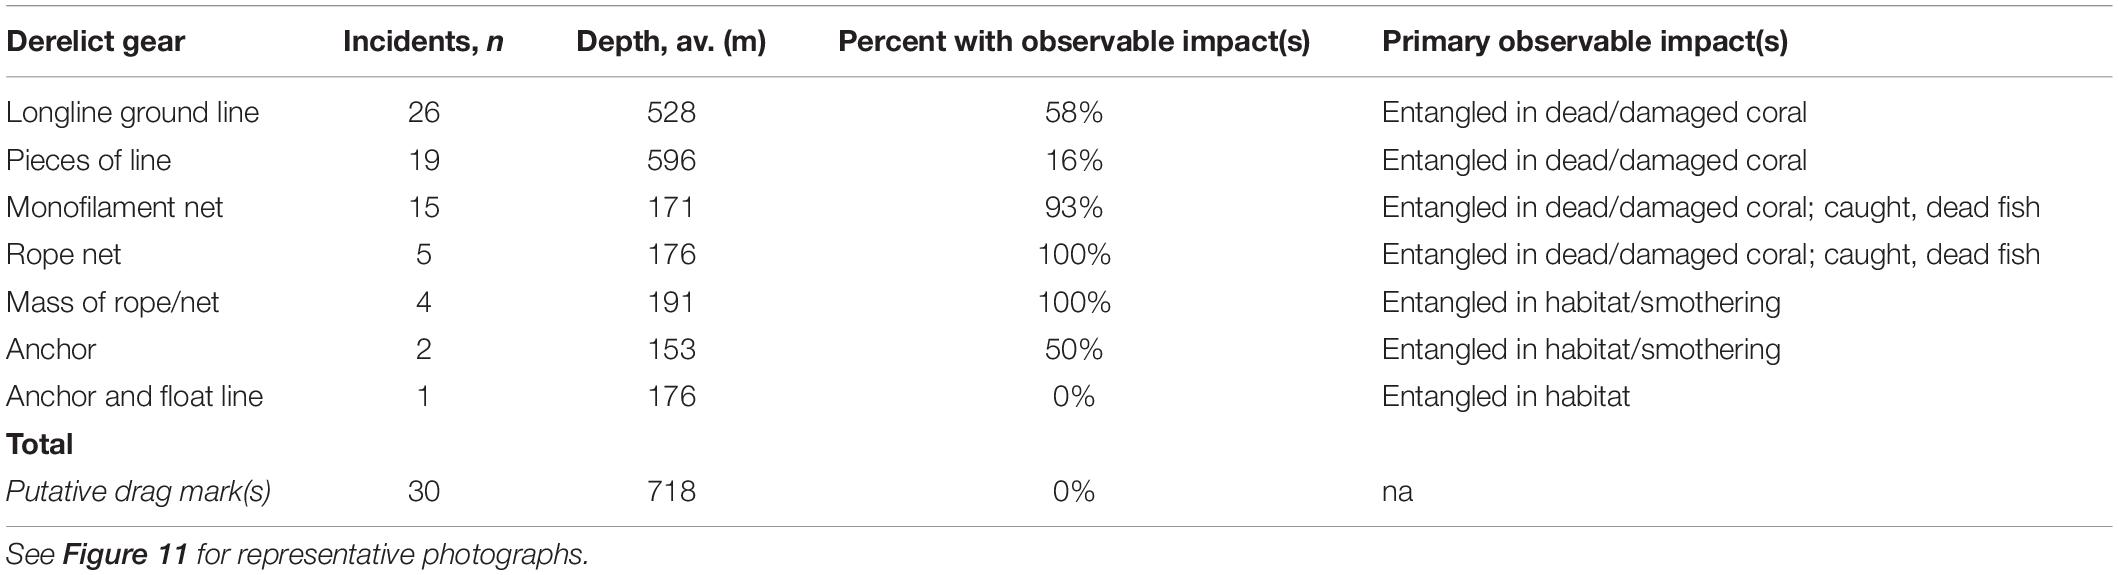
Table 2. Documentation of derelict fishing gear (DFG) abandoned, lost, or otherwise discarded, and observable impacts during 2012 visual survey.
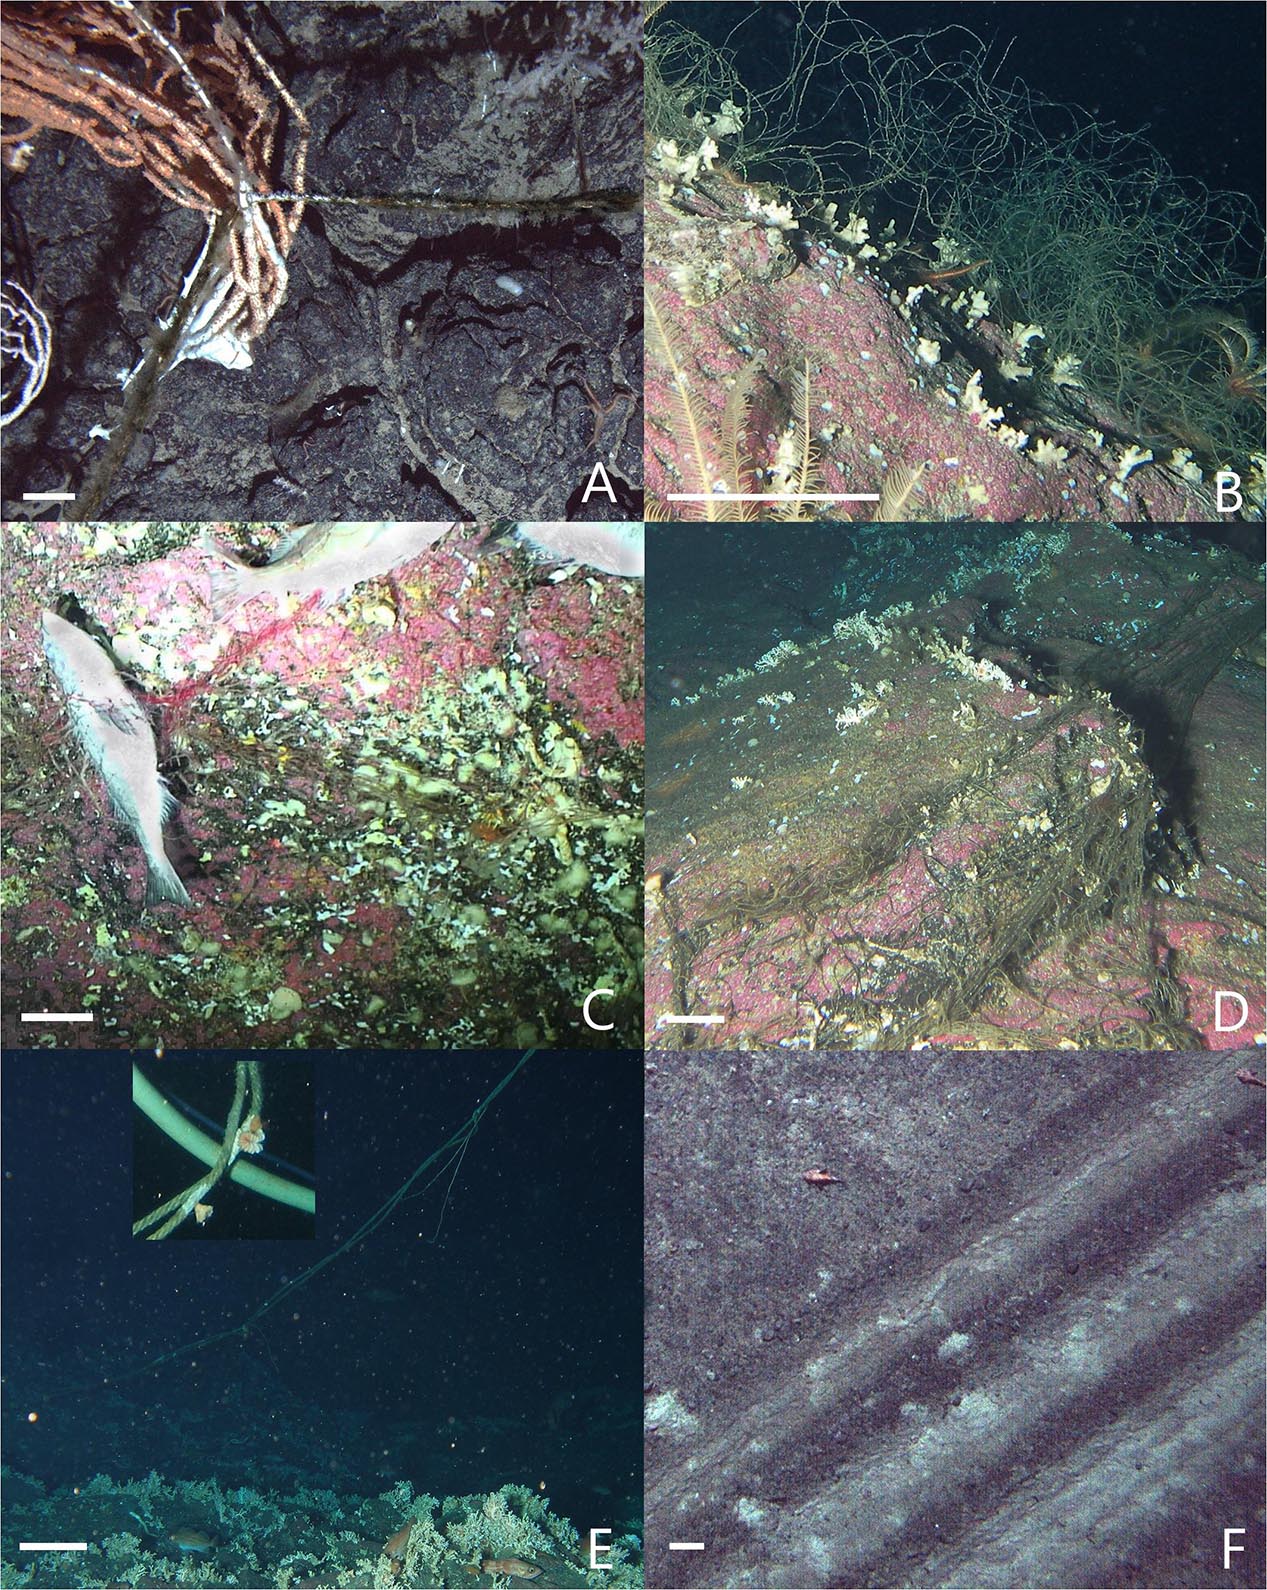
Figure 11. Examples of observable impacts caused by derelict fishing gear (DFG) abandoned, lost, or otherwise discarded on Cobb Seamount, from the 2012 visual survey. (A) A fouled longline passing through a toppled and damaged large sea fan (Keratoisis sp. A), surrounded by fragments of broken corals. (B) Monofilament net entangled in the stumps of dead and broken hydrocorals (Stylaster spp.) and (C) the carcasses of dead rockfish (Sebastes spp.). (D) A rope net spread across coral habitat, overlaying stumps of dead and broken corals. (E) An anchored longline groundline with dangling branch lines, attatched to floating gear, ascending into the water column. Cup coral growth on the gear is evidence it was lost years to decades ago (shown in inset image). (F) Putative drag marks in soft sediment with no associated DFG. Most images are side-on view, but the first and last images are downward-facing (from AUV). White scale bars = 10 cm.
Derelict fishing gear was identified on 82% of transects, for an average frequency of 7 incidents⋅km–1 (Figure 5). The highest density of gear on a single transect was 22.7 incidents⋅km–1 (ROV 5; Figure 5). The majority of gear was observed between 176 and 718 m depth (1st and 3rd quantiles; Figure 6). While a mix of gear was observed on the summit plateau and ridge (≤350 m depth), the gear most frequently observed on the flanks was longline groundlines (Table 2). Over half of these observations were from a single transect on the northern flank, AUV 4 (Figure 5). Drag marks in the absence of DFG were only observed on one deep transect (AUV 1, between 620 and 820 m depth), on the southeast flank, at a frequency of 31 incidents⋅km–1 (Figure 5). It is impossible to say for certain whether each photo of drag marks represents its own fishing event (Figure 11F) or whether some of the spatially distinct photos documented drag marks created by the same fishing event, but it is likely most were separate events since the drag marks did not run parallel to the transect line (we assumed straight line sets), and the drag marks were within one of the heaviest recently fished areas (Figure 5).
For 58% of DFG we detected, there was an associated observable ongoing impact, such as habitat alteration and ghost fishing (Table 2). Gear entangled in corals was the most frequently observed form of habitat alteration (49%). Entangled corals, such as tall stands of branching soft corals (Figure 11A) or large clusters of short hydrocorals (Figure 11B), were either dead, damaged, or toppled. Within the limited field of view (∼2 m across on average), we observed almost 60% of derelict longline ground lines entangled in dead or damaged corals. Almost all nets were entangled in corals, dead fish, or both (Figures 11B–D). Although it was not possible to resolve all dead fauna, the fresh carcasses of widow rockfish were readily visible (Figure 11C).
DFG was observed at an average density of 2,785 ± 1,003 observations⋅km–2. At this rate, we estimate a comprehensive survey of the seamount would encounter DFG 612,651 ± 220,565 times. If we err on the conservative side by omitting DFG that would likely be encountered numerous times on such a survey (i.e., the expansive longline ground lines, which accounted for 26 or ∼1/3 of our DFG observations; e.g., Figure 11E), an estimated 408,434 ± 147,043 separate observations of DFG might still be recorded on Cobb Seamount, based solely on the frequency of relatively confined clumps of net or lines we identified. Given that the 2012 survey overlapped a small fraction of the recently fished areas, excluding the areas of highest intensities (Figures 5: dark red cells), we should consider this extrapolation to be a conservative one.
Discussion
VME Indicator Taxa
Like some other RMFOs, the NPFC has a descriptive definition of VMEs but is still in the process of identifying the minimum density, abundance, and/or spatial footprint at which certain biological structures would constitute a VME. Thus we cannot identify locations of VMEs from our data at this point, but we can describe the distribution and nature of habitat-forming organisms regarded as indicators of VMEs.
We found VME indicator taxa widely distributed on Cobb Seamount and forming biogenic habitats that meet the descriptive VME criteria defined by FAO (e.g., summits and flanks of seamounts with cold-water corals and sponges and communities of dense emergent fauna that form an important structural component of the habitat; FAO, 2009). The majority of the seafloor surveyed supported at least sparsely distributed VME indicators, and nearly half of the surveyed area supported dense assemblages with at least one VME indicator per square meter. In a first pass consensus of experts from around the world, 0.1 colonies per square meter for soft or black corals was commonly considered to constitute a VME (data from three oceans, including the Pacific Ocean; Baco-Taylor et al., 2019). The most densely aggregated VME indicators occurred on the shallow summit plateau and pinnacle, while a small patch occurred much deeper, below the recent fishing footprint.
Our observations of close associations between VME indicators and a variety of other taxa align with the documented role of these biological structures as substrates for attachment, nursery grounds, feeding grounds, and refugia that generally support higher levels of biodiversity and productivity than surrounding habitats (cf Hart and Chute, 2004; Buhl-Mortensen et al., 2010). Hydrocorals and crinoids, in particular, were observed in association with commercially important fish (also documented on the adjacent continental slope; Stone, 2006; Tissot et al., 2006). Areas with the highest densities of biological structures (hydrocorals and crinoids) also supported the highest density and richness of rockfish (cf Du Preez et al., 2016). Similar usage of coral structures by rockfish to seemingly station-hold has also been documented on the adjacent coast (Du Preez and Tunnicliffe, 2011).
The composition and density of biological structures were strongly depth-stratified (cf Du Preez et al., 2016). Two major bathymetric boundaries between the biogenic habitats were evident, with continuous mats of giant scallops on the pinnacle above 90 m depth, fields of hydrocorals and fields of crinoids on the summit plateau between 90 and 350 m, and sparser forests of soft and black corals on the upper flanks below 350 m. Above the summit plateau ridge, on the shallower section of the seamount, biological structures tended to occur as single-taxon dominated assemblages in high densities over large areas. Below the ridge, biological structures were distributed in patches of mixed assemblages. There are likely other biogenic habitat types that merit conservation and management considerations in deeper waters of Cobb Seamount; our observations are limited to the biological structures above 1200 m depth. Ideally, future surveys of Cobb Seamount would include the deeper regions of the flanks, as well as the depth range “missed” by the 2012 expedition.
Fishing
Cobb Seamount has been impacted by historical fishing, which included heavy-duty bottom tire trawls, a recent bottom longline fishery for sablefish, which focuses predominantly on the upper flanks of the seamount but is showing evidence of moving shallower and close to the summit ridge, and widely distributed DFG resulting from these activities. These past and present fisheries represent over 50 years of (known) fishing on the summit plateau and upper flanks above 1200 m depth of the seamount, a relatively small area of less than ∼20 km by 15 km or ∼220 km2.
Our impacted area estimates highlight the critical value of spatial fishing data and the importance of comprehensive fishing records when mapping fishing effort. Our impacted area estimates of 1.8–74.4 km2 (0.8–33.8% of the seamount surface; scenario 1 and 2) include just 87 trips by Canadian vessels over 22 years. While we don’t have data on the historical fishing effort of other nations bordering the North Pacific Ocean, US fishing vessels made twice as many trips to Cobb Seamount in almost half the time with mid-water trawl and bottom longline gear (1991–2003; Douglas, 2011). Presumably, the collective footprint of Japanese, Russian, American, and Canadian fisheries (using a variety of gear types) is an order of magnitude larger than we have documented for the Canadian Sablefish fishery alone. The longline fishery is considered to have a lower impact on VMEs than bottom trawls (Pham et al., 2014). While traps have a small footprint and are intended to be stationary, bottom trawls can be 75–150 times as wide (100–200 m; Clark and Koslow, 2007) and are specifically engineered to drag across the seafloor (∼footprint = tow distance × door or beam spread; DFO, 2018). In addition, undocumented (illegal, unreported, and unregulated) fishing is a major issue to ocean sustainable development, recently identified as such by the United Nations goal to conserve and sustainably use the oceans, sea and marine resources (no. 14; UN, 2019). The combined historical and undocumented fishing footprints would undoubtedly show that the proportion of each impacted habitat type (i.e., depth band) is more substantial than our estimates.
Based on the consolidation of the best available information and the recent Canadian fishing effort, it is reasonable to infer the bottom-contact fishing footprint on Cobb Seamount extends from its pinnacle to at least 1200 m depth, inclusive of the summit plateau, summit ridge, and the upper flanks. Since fisheries target the summits of seamounts and bottom trawl gear is at least landed on the summit to stabilize before towing down the flank (Clark and Dunn, 2012), it is highly likely the summit plateau and ridge were at least fished by bottom trawling. Use of this gear on the summit plateau could explain the large scale hydrocoral rubble fields. The depth distributions of the dominant rockfish species caught by the bottom-contact and mid-water fisheries (summarized in Curtis et al., 2015) further support the inference that the summit plateau was historically fished: rougheye and widow rockfish were observed on Cobb Seamount confined between 107 and 373 and 37 and 198 m depth, respectively (Du Preez et al., 2015). Moving deeper, the main commercial depth range for sablefish in the region covers the upper flanks of Cobb Seamount, from 500 to 1000 m depth (Clark et al., 2015). That said, the recent Canadian sablefish fishing effort extends from approximately 100 to beyond 1200 m depth (Fisheries and Oceans Canada [DFO], 2013).
Spatial Overlap of Fishing and VME Indicators
All the VME indicators we observed on the 2012 survey (living or dead) overlap with the known fishing footprint on Cobb Seamount. We also documented a negative correlation between the density of VME indicators and the intensity of the known fishing effort. Ideally, we would have compared Cobb Seamount as a whole to a similar but unfished neighboring seamount, but Cobb Seamount is unique and no such site exists. Further research is necessary to determine if and how fishing influences VME indicator densities; however, we noted that every hydrocoral field we surveyed (n = 9 transects) showed signs of physical damage. While colonies of Stylaster spp. are relatively short (<20 cm) in comparison to some of the soft corals and glass sponges (meters tall), they are the densest and most abundant coral observed on Cobb Seamount. Kaiser et al. (2006) recognized that even a low-level impact that occurs on a relatively large spatial or temporal scale can result in serious ecological consequences. Du Preez et al. (2015) estimated that over half the substrate in the hydrocoral communities on Cobb Seamount was comprised of mixed mats of dead hydrocoral rubble. We observed live corals in areas that could be regarded as natural refuges from gear (i.e., areas of higher physical complexity). The hydrocoral fields were observed in a small, rare depth-interval (between ∼150 and 250 m depth, an area of only 40 km2); beyond Cobb Seamount, the nearest seafloor at this depth interval is 340–400 km away.
We recognize that our visual observations represent the minimal damage experienced as some evidence of impacts would have been removed as bycatch (entire organisms or colonies), washed away by currents (fragments), decomposed, degraded, or consumed. This is especially true for fishing events that occurred in previous years and decades. On Cobb Seamount, we did not observe enduring evidence of physical damage to many of the VME indicator taxa. For instance, even though F. serratissima is semi-mobile and able to swim short distances when disturbed (Lambert and Austin, 2007), such crinoids are known to be easily destroyed by physical contact with mobile fishing gear (Smith et al., 2000). Similarly, the brittle tissue of glass sponges cannot withstand the mechanical impact of fishing gear and readily crumbles into fragments (Krautter et al., 2001). The persistent signs of physical damage to VME indicator taxa on Cobb Seamount were largely limited to the robust calcium carbonate skeletons of corals that remain on the seafloor and also the punitive drag marks, which can persist for years to decades on deep soft-sediment (Clark et al., 2015; De Leo et al., 2017).
DFG, Impacts and Potential Consequences for VME Taxa
It is expected the full impact of DFG is more extensive than what we observed in our snapshot of Cobb Seamount. The longline groundlines extended beyond our visual field of view. If entire longline sets were lost or abandoned, these incidents could represent, on average, almost 3 km of longline groundline, plus the associated traps or hooks, and the anchors, float lines, etc. While the majority of DFG was anchored or entangled and had spatial footprints on the order of meters-squared or less, this does not necessarily equate to a small impact. For instance, we observed “fresh” fish carcasses entangled in small clumps of gill nets. The last reported use of gill nets on Cobb Seamount is in 1989 (Douglas, 2011), meaning that it is possible this DFG has continued to ghost fish and self-bait for at least 30 years. In addition to the impact of DFG potentially having a large temporal scale, the spatial scale is magnified when the entangled biogenic structures (e.g., coral skeletons) eventually breakdown, freeing the gear to be mobile once again.
The spatial frequency of the DFG observations was, in general, a magnitude greater than reports from similar ROV surveys on offshore fishing grounds. We observed an average of 7 items⋅km–1 and up to 29 items⋅km–1 of DFG. In comparison, the litter density on Condor Seamount (Azores) was estimated as 3 items⋅km–1 (DFG and other types of litter; Pham et al., 2013) while the maximum observed on the seamounts of Gorringe Bank (Southwest of Portugal, in ABNJ) was up to 4 items⋅km–1 (Vieira et al., 2015). Our densities are more comparable to observations of litter or derelict commercial gear in nearshore deep-water systems (e.g., litter in Saint Vicente canyon: av. 16.7 ± 14.4 items⋅km–1; litter in Lisbon canyon: 13.2 items⋅km–1; commercial fishing gear off central California: 5-7 ± 1-2 items⋅km–1; Watters et al., 2010; Mordecai et al., 2011; Oliveira et al., 2015). Considering the seamount’s remote location, and given findings from other fishing grounds, the density of DFG observed on Cobb Seamount in 2012 is unexpectedly high.
We propose the high density of DFG on Cobb Seamount is the result of a combination of factors and also not the result of the recent fishing alone. For instance, the majority of DFG observations did not overlap with the recent fishing footprint and over 27% of DFG were nets (not bottom longlines). The seamount is an attractive fishing ground due to its unusually shallow, flat top and in situ primary production by kelp and other algae, but fishers report very rugged terrain and gear hazards (Pearson et al., 1993; Douglas, 2011), which may convey a greater risk of entanglement and gear loss. Cobb Seamount was also heavily fished by multiple nations using multiple gear types for over half a century before the cooperative management and oversight of the NPFC came into force in July 2015 (North Pacific Fisheries Commission [NPFC], 2017, 2018). Not all of the DFG on Cobb Seamount would include items that could harm vulnerable species, and not all types of lost gear are equally damaging, but we can confidently estimate that tens to hundreds of thousands of items of DFG currently exist on Cobb Seamount. This DFG poses an ongoing threat to biological structures, the biogenic habitats they create, and the species they support.
Conservation and Management Applicability
Identification of VMEs
The NPFC is authorized to adopt conservation and management measures to prevent SAIs to VMEs in its convention area (North Pacific Fisheries Commission [NPFC], 2017, 2018). The presence of an indicator alone is not sufficient to identify a VME (FAO, 2009); however, the distribution, density, and nature of structure-forming species is highly relevant to the definition and identification of VMEs. Thus our survey data, along with surveys of other North Pacific seamounts (e.g., Miyamoto et al., 2017; Baco et al., 2019), can provide scientific guidance. Once the crucial VME definitions are established for application in the North Pacific Ocean, these data may be useful to identify VMEs in the NPFC convention area (North Pacific Fisheries Commission [NPFC], 2017, 2018). Presently, there are two potential VMEs identified in the NPFC convention area on C-H and Koko seamounts. Both are part of the Hawaiian-Emperor seamount chain in the Northwest Pacific Ocean (North Pacific Fisheries Commission [NPFC], 2018); but there are none yet identified in the Northeast Pacific Ocean (North Pacific Fisheries Commission [NPFC], 2017).
Like most RFMOs, the NPFC presently employs a move-on rule to limit damage to potential VMEs (North Pacific Fisheries Commission [NPFC], 2017, 2018); this rule establishes a 50 kg bycatch limit/threshold for soft, black, and stony coral taxa. When this threshold is reached, a >2 nautical mile fishing buffer is required to prevent SAIs, and the encounter would then be reported to the NPFC Secretariat so appropriate measures can be adopted in respect of the potential VME (North Pacific Fisheries Commission [NPFC], 2017, 2018). While this move-on rule is an important measure, it is subject to the catchability bias of different types of gear and organisms (Auster et al., 2010). For instance, while trawl nets are more likely to retain large durable intact organisms as bycatch, light, brittle, and flexible organisms, such as abundant hydrocorals on Cobb Seamount, readily pass through the mesh (Auster et al., 2010). Other types of gear with the potential to shear and entangle organisms (e.g., the longlines, traps, and hooks currently used on Cobb Seamount) do a poor job at retaining most types of VME indicator taxa (Auster et al., 2010). Using the combination of data from the 2012 visual survey and previous collections, we can estimate that a relatively small ∼30 m2 patch of a hydrocoral field supports the equivalent of the bycatch limit, ∼50 kg of hydrocorals. This relationship between the bycatch limit and in situ images is based on the average height and density of colonies from the visual survey (conservatively 10 cm and 40.0 colonies⋅m2) and unpublished wet weight data for 53 specimens from the Royal BC Museum collection (average height-weight ratio 44.8 g for 10 cm tall hydrocoral colonies/fragments; Merlin Best, personal communication). In comparison, the footprint of a single bottom-contact fishing event is several orders of magnitude larger than the area estimated to support 50 kg of this VME indicator taxa.
Non-invasive identification of VMEs, such as visual surveys and predictive models, and spatial management, such as fishing closures, are likely to be more effective at protecting potential or established VMEs than bycatch move-on rules (Clark and Dunn, 2012). Efforts to standardize methods for VME identification from image-based data are ongoing (Morato et al., 2018; Baco-Taylor et al., 2019; Deep-Ocean Stewardship Initiative [DOSI], 2019) and will be necessary to reduce the overlap between fishing effort and VMEs.
While image-based surveys for VME-indicators are promising, the data are not without limitations. The VME indicator taxa found on Cobb Seamount may tolerate wider depth ranges than those we documented, but we did not survey the distribution, density, or composition of benthic ecosystems pre-disturbance or post-recovery. Our observations are a snapshot of only those taxa that have persisted at detectable levels after over half a century of bottom-contact fishing activity. Because non-detection alone is not evidence of species absence, the results we present are a conservative estimate of where VME indicator taxa may be found. For future work, it would be highly valuable to obtain estimates of detection probability for VME indicator taxa when using ROVs and AUVs.
Identification of SAIs
Once VMEs are defined and identified, determining whether the impacts of fishing gear to biological structures and the biogenic habitats they create qualify as an SAI—therefore requiring actions be taken to prevent these impacts—requires consideration of six factors identified by FAO (2009) and the North Pacific Fisheries Commission [NPFC] (2017, 2018). Our findings provide new scientific information for many of these factors, such as the intensity of the impact at the specific site and the impact relative to the availability of the habitat type affected. While many questions remain concerning the severity of the ecosystem-level impacts of bottom-contact fishing, it is prudent to respond quickly to the best available scientific information to establish appropriate and effective conservation measures that protect vulnerable biological structures persisting on Cobb Seamount, such as on its unique summit plateau, and elsewhere in ABNJ. Once the long-term consequences to benthic communities are readily apparent and repeatedly documented, the opportunity to conserve these unique offshore oases may no longer exist, especially if fishing activity shifts in location (e.g., shoaling on Cobb Seamount) or intensity increases over time.
Potential for Recovery
While our study did not attempt to quantify ecosystem-level consequences or SAIs of bottom-contact fishing on Cobb Seamount, we anticipate that the degradation or complete removal of the vulnerable biological structures has and will continue to negatively impact the functional significance of these ecosystems. These impacts may be exacerbated by larger-scale threats to deep-sea environments, such as the ongoing expansion of the Northeast Pacific Ocean oxygen minimum zone attributed to global climate change (Whitney et al., 2007; Cummins and Ross, in review). Further, the ability of the unique ecosystems on Cobb Seamount to recover from historical and ongoing harm may be hampered by a low probability of rescue from adjacent (but distant) populations by immigration or dispersal of new recruits. However, to determine if rescue events are possible, further research is required to examine the endemism and connectivity of populations on submarine features in the Northeast Pacific Ocean (Shank, 2010), potentially building on dispersal strategy research by Parker and Tunnicliffe (1994).
Even after recolonization, the rate of ecosystem recovery is likely to be on the order of decades to centuries for many of the slow-growing biological structures we observed on Cobb Seamount (Roberts and Hirshfield, 2004; Murillo et al., 2011; Clark et al., 2019). Some scallops and crinoids are estimated to live decades (MacDonald et al., 1991; Murillo et al., 2011), glass sponges can live hundreds of years (Samadi et al., 2007), and sea fans can grow as little as a centimeter or two per year (Andrews et al., 2002, 2009) and live thousands of years (Roark et al., 2006; Rogers et al., 2007). That said, in 2012, we observed signs that damaged hydrocoral fields on Cobb Seamount might be starting to recover from large-scale physical impacts, 30 years after the last documented trawling events occurred in the area. These observations were limited to some branch regrowth on dead hydrocoral stumps and small live colonies amid the rubble of dead colonies and are similar to findings on previously heavily fished seamounts within the Northwest Pacific Ocean (Baco et al., 2019).
NPFC VME Indicator Taxa List
Most of the dense aggregations of biological structures we documented on Cobb Seamount are considered to be VME indicators by other RFMOs and commissions (Commission for the Conservation of Antarctic Marine Living Resources, Northwest Atlantic Fisheries Organization, North East Atlantic Fisheries Commission, South East Atlantic Fisheries Organisation, South Pacific Regional Fisheries Management Organisation), but are not currently listed as such by the NPFC (Table 1). These include hydrocorals, sea pens, crinoids, giant scallops, and sponges. These taxa are equally fragile and vulnerable to SAIs from bottom-contact fishing damage as those on the interim list of NPFC VME indicators (already assessed by other RFMOs; Table 1). They are also a hundred times more abundant on Cobb Seamount and typify the largest biogenic habitats. We documented further evidence of their functional significance and regional uniqueness, and have reviewed obstacles to their recovery (criteria of VMEs; North Pacific Fisheries Commission [NPFC], 2017, 2018).
The current interim NPFC VME indicator taxa were based on the analysis of bottom-trawling bycatch that landed on deck (Miyamoto and Kiyota, 2017). Ideally, VME indicator taxa would be identified by fishery-independent means, given that trawl nets, longlines, and other bottom-fishing gear have low catchability for most sessile benthic organisms (Ardron et al., 2014) and are therefore heavily biased against sponges, fragments of hydrocorals, and other fragile animals. If Cobb Seamount is an indicator of the North Pacific Ocean in general, the exclusion of hydrocorals, crinoids, and sponges from the NPFC’s interim VME indicator list creates a depth- and spatial-related bias in potential VME protection, given that these species form extensive biogenic habitats on the historically heavily fished summit plateau of Cobb Seamount, rather than in the deeper waters inhabited by the NPFC’s interim VME indicator taxa.
One systematic approach considers a high ranking in just one VME criterion to be sufficient for a taxon to be considered a potential VME indicator (Ardron et al., 2014). Given that hydrocorals and sponges meet multiple FAO VME criteria and occur throughout the North Pacific Ocean (e.g., Miyamoto and Kiyota, 2017), a resolution to include them among the NPFC VME-indicator taxa was recently proposed at the 2018 NPFC/FAO Workshop on the Protection of VMEs in Yokohama, Japan (Rooper and Kiyota, 2018). This resolution has not yet passed, but capacity and precedence to do so exists—the NPFC ranks relatively high among RFMOs for its management resources (Bell et al., 2019) and other RFMOs have adopted additional VME indicators in light of new information (e.g., North Atlantic Fisheries Organization [NAFO], 2009; Murillo et al., 2011). Not all of the VME indicator taxa included in this study are adopted by every RFMO, but the survey of biogenic habitats on Cobb Seamount supports the inclusion of these taxa as VME indicators within the North Pacific Ocean.
Protection of Northeast Pacific Seamounts
If partial protection for Cobb Seamount was to be considered (similar to the two existing Northwest Pacific Ocean closures; North Pacific Fisheries Commission [NPFC], 2018), our data could be useful to managers seeking to maximize ecological benefits and minimize economic impacts. That said, partial protection of marine features can be problematic, given the minimal operational area requirements for fishing activities, the tendency for the most productive and most fished areas to overlap, and because the spatial scales functionally meaningful to organisms may be large or difficult to determine (Clark and Dunn, 2012). While the current fishing effort on Cobb Seamount is relatively modest, it has fluctuated over time and could increase again, should existing or future Members of the NPFC request to fish the same footprint or new areas of the seamount (North Pacific Fisheries Commission [NPFC], 2017, 2018).
Any historical or future bottom-contact fishing impacts on Cobb Seamount are likely to be exacerbated due to the volcano’s conical shape and steep flanks, which support a high-turnover of habitats associated with narrow depth bands (cf McClain et al., 2010; Du Preez et al., 2016; Victorero et al., 2018). In other words, each depth-stratified biogenic habitat on this seamount exists in a naturally fragmented and finite area and is relatively rare—rarer still considering the surrounding deep seafloor and open ocean. According to ecological niche and island biogeography theories, rarity and isolation increase the vulnerability of these habitats to an unnatural increase in disturbance regime (MacArthur and Wilson, 2001; Gallagher et al., 2015), such as that caused by bottom-contact fishing.
Cobb Seamount is already classified by the Convention on Biological Diversity as an Ecologically and Biologically Significant Area (EBSA) that supports ocean health and ecological services, predominantly because of its benthic ecosystems (Convention on Biological Diversity [CBD], 2016) and a high threat of human impact (considering the history of bottom trawling; Taranto et al., 2012). It is notable that the EBSA criteria encompass the FAO VME criteria (Ardron et al., 2014). Under the language within the United Nations General Assembly Resolution 61/105 (FAO, 2009), Cobb Seamount may also be considered a VME in its entirety, given that seamounts are among their physiographic indicators (FAO, 2009; Watling and Auster, 2017; NAFO, 2018).
Within the Northeast Pacific Ocean there are hundreds of known seamounts in the Exclusive Economic Zones of Canada and the United States (US)—all of which have been assessed and are now protected from bottom-contact gear. In 2006, seamounts in the Gulf of Alaska and off the US West Coast were recognized for their unique ecological characteristics and protected from all bottom-contact gear (Hourigan, 2009). In 2016, Canadian seamounts were identified as EBSAs (Ban et al., 2016), and in 2017, bottom-contact fishing was prohibited on all known seamounts within fishable depths within the Canadian Pacific Ocean (DFO, 2019a,b,c). Of the hundreds of seamounts in the region, only one falls in the same biophysical class as Cobb Seamount, but it is 800 km away (Figure 1) and supports different species assemblages (SGaan Kinghlas-Bowie Seamount; Canessa et al., 2003; Gauthier et al., 2018a,b,c; DFO, 2019a). At present, seamounts in the Northeast Pacific ABNJ, including the regionally unique Cobb Seamount, are the only ones known to be fished with bottom-contact gear.
Summary
• Cobb Seamount is inhabited by a diverse assemblage of habitat-forming emergent biological structures adopted as VME indicator taxa. Dense aggregations of these taxa create depth-distributed biogenic habitats, such as the living carpets of epifauna-encrusted scallops on the pinnacle, extensive fields of hydrocorals and crinoids with patches of coral bioherms and forests on the summit plateau and ridge, and diverse gardens of large soft corals, black corals, and glass sponges on the upper flanks. Almost half of the seafloor surveyed in 2012 supported dense assemblages of VME indicators, at one or more individuals or colonies per square meter.
• The two most abundant biogenic habitats were formed by hydrocorals and crinoids—both of which supported dense and diverse assemblages of other animals, including commercially-important fishes. Therefore, the present NPFC VME indicator list of soft, black, and stony corals does not represent the majority of biogenic habitats observed on Cobb Seamount.
• Several of the shallow (<350 m) depth-distributed biogenic habitats are regionally unique or rare, isolated by hundreds of kilometers, potentially inhibiting recolonization and as such recovery.
• All the VME indicators we observed on the 2012 survey (living or dead) overlap with the known fishing footprint on Cobb Seamount.
• We estimate that hundreds of thousands of items of derelict fishing gear currently exist on Cobb Seamount and that these pose an ongoing threat to biological structures, the biogenic habitats they create, and the associated species they support, which could persist for decades or centuries to come.
• Historical bottom-contact fishing impacts (e.g., fields of coral rubble, ghost fishing) appear to have persisted decades after the fishing activity occurred. Therefore, to assess VMEs and SAIs, it is imperative management organizations collect the best available spatial information for historical fisheries, especially in the case of bottom trawling. Such information is also required to identify and assess signs of potential recovery (coral growth).
• While life on Cobb Seamount continues to experience impacts outside our current realm of control (e.g., DFG), relief from future direct stressors, including future bottom-contact fishing, is possible through management organizations. This study aims to contribute information to potentially help identify some of the first VMEs and SAIs in the High Seas of the North Pacific Ocean.
Data Availability Statement
The raw data supporting the conclusions of this article will be made available by the authors without undue reservation, to any qualified researcher, except for the fisheries data. The Fisheries and Oceans Canada fisheries datasets for this manuscript are not publicly available to respect the privacy of commercial fishers. Requests to access the datasets should be directed to CD (cherisse.dupreez@dfo-mpo.gc.ca).
Author Contributions
JC conceived and planned the visual survey. CD and JC performed the visual survey. CD, KS, and JC contributed to the design of the research and to the writing of the manuscript. CD performed the image annotation and analysis of the results. All authors provided critical feedback and helped shape the research, analysis and manuscript.
Funding
This research was supported by a grant from DFO’s International Governance Strategy to JC.
Conflict of Interest
CD and JC have acted as part of the Canadian delegation at North Pacific Fishery Commission (NPFC) scientific committee meetings and workshops. JC is presently the Chair of the scientific committee.
The remaining author declares that the research was conducted in the absence of any commercial or financial relationships that could be construed as a potential conflict of interest.
Acknowledgments
This research was supported by Fisheries and Oceans Canada, with field support from the United States National Oceanic and Atmospheric Administration (NOAA). This article benefited from reviews by Chris Rooper, Stephanie Archer, Candice St Germain, and Eddy Kennedy. We thank Wolfgang Carolsfeld, Sarah Davies, James Pegg, and Jonathan Martin for their assistance in collecting data from the ROV transects. Species and habitat data from the AUV transects were kindly provided by M. Elizabeth Clarke, Erica Fruh, Jeremy Taylor and Curt Whitmire. We thank Katie Gale for her assistance with extracting the sablefish bottom longline data from DFO databases. Merlin Best and Heidi Gartner kindly provided unpublished Stylaster spp. data from their analyses of the Royal British Colombia Museum collection. Bathymetry data were obtained from NOAA. We appreciated our discussions with Tammy Norgard and Miriam O, and gratefully acknowledge constructive comments on previous drafts of our analyses and manuscript from Jim Boutillier, Lisa Lacko, M. Elizabeth Clarke, and Verena Tunnicliffe.
References
Addamo, A. M., Vertino, A., Stolarski, J., García-Jiménez, R., Taviani, M., and Machordom, A. (2016). Merging Scleractinian genera: the overwhelming genetic similarity between solitary Desmophyllum and colonial Lophelia. BMC Evol. Biol. 16:108. doi: 10.1186/s12862-016-0654-8
Andrews, A. H., Cordes, E. E., Mahoney, M. M., Munk, K., Coale, K. H., Cailliet, G. M., et al. (2002). Age, growth and radiometric age validation of a deep-sea, habitat-forming gorgonian (Primnoa resedaeformis) from the Gulf of Alaska. Hydrobiologia 471, 101–110.
Andrews, A. H., Stone, R. P., Lundstrom, C. C., and De Vogelaere, A. P. (2009). Growth rate and age determination of bamboo corals from the northeastern Pacific Ocean using refined 210Pb dating. Mar. Ecol. Prog. Ser. 397, 173–185. doi: 10.3354/meps08193
Ardron, J. A., Clark, M. R., Penney, A. J., Hourigan, T. F., Rowden, A. A., Dunstan, P. K., et al. (2014). A systematic approach towards the identification and protection of vulnerable marine ecosystems. Mar. Policy 49, 146–154. doi: 10.1016/j.marpol.2013.11.017
Auster, P. J., Gjerde, K., Heupel, E., Watling, L., Grehan, A., and Rogers, A. D. (2010). Definition and detection of vulnerable marine ecosystems on the high seas: problems with the “move-on” rule. ICES J. Mar. Sci. 68, 254–264. doi: 10.1093/icesjms/fsq074
Baco, A. R., Roark, E. B., and Morgan, N. B. (2019). Amid fields of rubble, scars, and lost gear, signs of recovery observed on seamounts on 30-to 40-year time scales. Sci. Adv. 5:eaaw4513. doi: 10.1126/sciadv.aaw4513
Baco-Taylor, A. R., Ross, R., Althaus, F., Bridges, A., Brix, S., Colaço, A., et al. (2019). A Community Consensus on Designating Vulnerable Marine Ecosystems From Imagery. San Diego, CA: Ocean Sciences Meeting.
Ban, S., Curtis, J. M. R., St. Germain, C., Perry, R. I., and Therriault, T. W. (2016). Identification of ecologically and biologically significant areas (EBSAs) in Canada’s offshore pacific bioregion. DFO Can. Sci. Advis. Sec. Res. Doc. 2016/034. x + 152 p.
Bell, J., Guijarro, E., and Kenny, A. (2019). Demersal fishing in areas beyond national jurisdiction: a comparative analysis of regional fisheries management organisations. Front. Mar. Sci. 6:596. doi: 10.3389/fmars.2019.00596
Blasiak, R., Pittman, J., Yagi, N., and Sugino, H. (2016). Negotiating the use of biodiversity in marine areas beyond national jurisdiction. Front. Mar. Sci. 3:224. doi: 10.1016/j.marpol.2017.03.004
Bremner, J., Rogers, S., and Frid, C. (2006). Methods for describing ecological functioning of marine benthic assemblages using biological traits analysis (BTA). Ecol. Indic. 6, 609–622. doi: 10.1016/j.ecolind.2005.08.026
Buhl-Mortensen, L., Vanreusel, A., Gooday, A. J., Levin, L. A., Priede, I. G., Buhl-Mortensen, P., et al. (2010). Biological structures as a source of habitat heterogeneity and biodiversity on the deep ocean margins. Mar. Ecol. 31, 21–50. doi: 10.1111/j.1439-0485.2010.00359.x
Canessa, R. R., Conley, K., and Smiley, B. D. (2003). Bowie seamount pilot marine protected area: an ecosystem overview report. Can. Tech. Rep. Fish. Aquat. Sci. 2461: xi + 85 p.
Chaytor, J. D., Keller, R. A., Duncan, R. A., and Dziak, R. P. (2007). Seamount morphology in the bowie and cobb hot spot trails Gulf of Alaska. Geochem. Geophy. Geosy. 8:Q09016.
Clark, M. R., Althaus, F., Schlacher, T. A., Williams, A., Bowden, D. A., and Rowden, A. A. (2015). The impacts of deep-sea fisheries on benthic communities: a review. ICES J. Mar. Sci. 73(Suppl. 1), i51–i69. doi: 10.1093/icesjms/fsv123
Clark, M. R., Bowden, D. A., Rowden, A. A., and Stewart, R. (2019). Little evidence of benthic community resilience to bottom trawling on seamounts after 15 years. Front. Mar. Sci. 6:63. doi: 10.3389/fmars.2019.00063
Clark, M. R., and Dunn, M. R. (2012). Spatial management of deep-sea seamount fisheries: balancing sustainable exploitation and habitat conservation. Environ. Conserv. 39, 204–214. doi: 10.1017/s0376892912000021
Clark, M. R., and Koslow, J. A. (2007). “Impacts of fisheries on seamounts,” in Seamounts: Ecology, Fisheries, and Conservation, eds T. J. Pitcher, P. J. B. Hart, M. R. Clark, N. Haggan, and R. S. Santos, (Wiley-Blackwell), 413–441. doi: 10.1002/9780470691953.ch19
Clark, M. R., Vinnichenko, V. I., Gordon, J. D., Beck-Bulat, G. Z., Kukharev, N. N., and Kakora, A. F. (2007). “Large-scale distant-water trawl fisheries on seamounts,” in Seamounts: Ecology, Fisheries, and Conservation, eds T. J. Pitcher, P. J. B. Hart, M. R. Clark, N. Haggan, and R. S. Santos, (Wiley-Blackwell), 361–399. doi: 10.1002/9780470691953.ch17
Clarke, M. E., Whitmire, C., Fruh, E., Anderson, J., Taylor, J., Rooney, J., et al. (2010). “Developing the SeaBED AUV as a tool for conducting routine surveys of fish and their habitat in the Pacific,” in Proceedings of the 2010 IEEE/OES Autonomous Underwater Vehicles conference proceedings, Monterey, CA.
Comeau, L. A., Vézina, A. F., Bourgeois, M., and Juniper, S. K. (1995). Relationship between phytoplankton production and the physical structure of the water column near Cobb Seamount, northeast Pacific. Deep Sea Res. 42, 993–1005. doi: 10.1016/0967-0637(95)00050-g
Commission for the Conservation of Antarctic Marine Living Resources [CCAMLR] (2009). CCAMLR VME Taxa Classification Guide 2009. Hobart: CCAMLR.
Commission for the Conservation of Antarctic Marine Living Resources [CCAMLR] (2013). Interim Measure for Bottom Fishing Activities Subject to Conservation Measure 22-06 Encountering Potential Vulnerable Marine Ecosystems in the Convention Area. CM 22-07. Hobart: CCAMLR.
Convention on Biological Diversity [CBD] (2016). Ecologically or Biologically Significant Areas (EBSAs) North-East Pacific Ocean Seamounts. 204132-2. New York, NY: Convention on Biological Diversity.
Cullis-Suzuki, S., and Pauly, D. (2010). Failing the high seas: a global evaluation of regional fisheries management organizations. Mar. Policy 34, 1036–1042.
Curtis, J. M. R., Du Preez, C., Davis, S. C., Pegg, J., Clarke, M. E., Fruh, E. L., et al. (2015). 2012 Expedition to Cobb Seamount: survey methods, data collections, and species observations. Can. Tech. Rep. Fish. Aquat. Sci. 3124: xii + 145.
De Leo, F. C., Gauthier, M., Nephin, J., Mihaly, S., and Juniper, S. K. (2017). Bottom trawling and oxygen minimum zone influences on continental slope benthic community structure off Vancouver Island (NE Pacific). Deep Sea Res. Pt II 137, 404–419. doi: 10.1016/j.dsr2.2016.11.014
Deep-Ocean Stewardship Initiative [DOSI] (2019). New Technologies for Environmental Impact Assessments in the Deep Sea. New York, NY: DOSI.
DFO (2018). Framework to Support Decisions on Authorizing Scientific Surveys with Bottom Contacting Gears in Protected Areas with Defined Benthic Conservation Objectives. Can. Sci. Adv. Sec. Sci. Res. 043. Available at: https://waves-vagues.dfo-mpo.gc.ca/Library/40726277.pdf (accessed October 1, 2019).
DFO (2019a). Biophysical and ecological overview of the offshore Pacific Area of interest (AOI). Can. Sci. Adv. Sec. Sci. Res. 011. Available at: http://publications.gc.ca/collections/collection_2019/mpo-dfo/fs70-7/Fs70-7-2019-011-eng.pdf (accessed October 1, 2019).
DFO (2019b). Offshore Pacific Seamounts and Vents Closure [Online]. Available at: http://www.dfo-mpo.gc.ca/oceans/oeabcm-amcepz/refuges/offshore-hauturiere-eng.html (accessed September 9, 2019).
DFO (2019c). SGaan Kinghlas- Bowie Seamount 2019 Marine Protected Area Management Plan. Minato: DFO.
Doherty, B., and Cox, S. (2017). Data summary of trap camera video obtained during sablefish bottom longline fishing at SGaan Kinghlas-Bowie Seamount, 2014-2015. Can. Dat. Rep. Fish. Aquat. Sci. 1276. Available at: http://publications.gc.ca/collections/collection_2017/mpo-dfo/Fs97-13-1276-eng.pdf (accessed October 1, 2019).
Donaldson, A. B., Gabriel, C., Harvey, B., and Carolsfeld, J. (2010). Impacts of fishing gears other than bottom trawls, dredges, gillnets and longlines on aquatic biodiversity and vulnerable marine ecosystems. DFO Can. Sci. Adv. Sec. Sci. Res. 2010/011. vi + 84 p.
Douglas, D. A. (2011). The Oregon Shore-Based Cobb Seamount Fishery, 1991-2003: Catch Summaries and Biological Observations. Newport, OR: Marine Resources Program.
Dower, J., Freeland, H., and Juniper, K. (1992). A strong biological response to oceanic flow past cobb seamount. Deep Sea Res. Pt A. 39, 1139–1145. doi: 10.1016/0198-0149(92)90061-w
Du Preez, C., Curtis, J. M. R., Davies, S. C., Clarke, M. E., and Fruh, E. L. (2015). Cobb seamount species inventory. Can. Tech. Rep. Fish. Aquat. Sci. 3122: viii + 108 p.
Du Preez, C., Curtis, J. M., and Clarke, M. E. (2016). The structure and distribution of benthic communities on a shallow seamount (Cobb Seamount, Northeast Pacific Ocean). PLoS One 11:e0165513. doi: 10.1371/journal.pone.0165513
Du Preez, C., and Tunnicliffe, V. (2011). Shortspine thornyhead and rockfish (Scorpaenidae) distribution in response to substratum, biogenic structures and trawling. Mar. Ecol. Prog. Ser. 425, 217–231. doi: 10.3354/meps09005
FAO (2009). International Guidelines for the Management of Deep-Sea Fisheries in the High Seas. Rome: Food and Agriculture Organization.
Farrow, G. E., and Durant, G. P. (1985). Carbonate-basaltic sediments from Cobb Seamount, northeast Pacific: zonation, bioerosion and petrology. Mar. Geol. 65, 73–102. doi: 10.1016/0025-3227(85)90047-7
Fisheries and Oceans Canada [DFO] (2013). A Review of Sablefish Population Structure in the Northeast Pacific Ocean and Implications for Canadian Seamount Fisheries. Can. Tech. Rep. Fish. Aquat. Sci. 017. Available at: https://waves-vagues.dfo-mpo.gc.ca/Library/349898.pdf (accessed October 1, 2019).
Fosså, J. H., Mortensen, P., and Furevik, D. M. (2002). The deep-water coral Lophelia pertusa in Norwegian waters: distribution and fishery impacts. Hydrobiologia. 471, 1–12.
Gall, S. C., and Thompson, R. C. (2015). The impact of debris on marine life. Mar. Pollut. Bull. 92, 170–179. doi: 10.1016/j.marpolbul.2014.12.041
Gallagher, A. J., Hammerschlag, N., Cooke, S. J., Costa, D. P., and Irschick, D. J. (2015). Evolutionary theory as a tool for predicting extinction risk. Trends Ecol. Evol. 30, 61–65. doi: 10.1016/j.tree.2014.12.001
Gauthier, M. (2017). Trap Camera Videos From Sgaan Kinghlas-Bowie Seamount: Overview of Data Obtained During Sablefish Bottom Longline Trap Fishing in 2016. Can. Dat. Rep. Fish. Aquat. Sci. 1279. Available at: http://publications.gc.ca/collections/collection_2017/mpo-dfo/Fs97-13-1279-eng.pdf (accessed October 1, 2019).
Gauthier, M., Curtis, J., Gale, K., Archer, S., and Haggarty, D. (2018c). SGaan Kinghlas-Bowie Seamount Marine Protected Area Species Inventory: Invertebrates (Annelida, Arthropoda, Brachiopoda, Ctenophora, Echinodermata and Mollusca). Can. Tech. Rep. Fish. Aquat. Sci. 3198. Available at: http://publications.gc.ca/collections/collection_2018/mpo-dfo/Fs97-6-3198-eng.pdf (accessed October 1, 2019).
Gauthier, M., Curtis, J. M. R., Gale, K. S. P., Archer, S. K., and Haggarty, D. R. (2018a). SGaan Kinghlas-Bowie Seamount marine protected area species inventory: Algae, Cnidaria, Bryozoa and Porifera. Can. Tech. Rep. Fish. Aquat. Sci. 3196: vi + 56 p.
Gauthier, M., Curtis, J. M. R., Gale, K. S. P., and Haggarty, D. (2018b). SGaan Kinghlas-Bowie Seamount marine protected area species inventory: Chordata. Can. Tech. Rep. Fish. Aquat. Sci. 3197: vi + 48 p.
Gianni, M., Fuller, S., Currie, D., Schleit, K., Goldsworthy, L., Pike, B., et al. (2016). How Much Longer Will It Take? A Ten-Year Review Of The Implementation of United Nations General Assembly Resolutions 61/105, 64/72 and 66/68 On The Management of Bottom Fisheries In Areas Beyond National Jurisdiction. Deep Sea Conservation Coalition. Available at: http://www.savethehighseas.org/wp-content/uploads/2016/07/DSCC-Review-2016_Launch-29-July.pdf (accessed October 1, 2019).
Gilman, E., Passfield, K., and Nakamura, K. (2014). Performance of regional fisheries management organizations: ecosystem-based governance of bycatch and discards. Fish. Fish. 15, 327–351. doi: 10.1111/faf.12021
Hart, D. R., and Chute, A. S. (2004). Essential Fish Habitat Source Document. Sea Scallop, Placopecten Magellanicus, Life History And Habitat Characteristics. Silver Spring, MD: NOAA.
Hoegh-Guldberg, O., and Bruno, J. F. (2010). The impact of climate change on the world’s marine ecosystems. Science 328, 1523–1528. doi: 10.1126/science.1189930
Hourigan, T. (2009). Managing fishery impacts on deep-water coral ecosystems of the USA: emerging best practices. Mar. Ecol. Prog. Ser. 397, 333–340. doi: 10.3354/meps08278
Kaiser, M., Clarke, K., Hinz, H., Austen, M. C., Somerfield, P. J., and Karakassis, I. (2006). Global analysis of response and recovery of benthic biota to fishing. Mar. Ecol. Prog. Ser. 311, 1–14. doi: 10.3354/meps311001
Krautter, M., Conway, K. W., Barrie, J. V., and Neuweiler, M. (2001). Discovery of a “living dinosaur”: globally unique modern hexactinellid sponge reefs off British Columbia, Canada. Facies 44, 265–282. doi: 10.1007/bf02668178
Krieger, K. J. (2001). “Coral (Primnoa) impacted by fishing gear in the gulf of alaska,” in Proceedings of the First International Symposium on Deep-Sea Corals, Nova Scotia.
Lambert, P., and Austin, W. C. (2007). Brittle Stars, Sea Urchins and Feather Stars Of British Columbia, Southeast Alaska and Puget Sound. Victoria, BC: Royal British Columbia Museum.
MacArthur, R. H., and Wilson, E. O. (2001). The Theory of Island Biogeography. Princeton, NJ: Princeton university press.
MacDonald, B., Thompson, R., and Bourne, N. (1991). Growth and reproductive energetics of three scallop species from British Columbia (Chlamys hastata, Chlamys rubida, and Crassadoma gigantea). Can. J. Fish. Aquat. Sci. 48, 215–221. doi: 10.1139/f91-029
Macfadyen, G., Huntington, T., and Cappell, R. (2009). Abandoned, Lost Or Otherwise Discarded Fishing Gear. UNEP Regional Seas Reports and Studies No.185, FAO Fisheries and Aquaculture Technical Paper, No. 523. Rome: UNEP.
McClain, C. R., Lundsten, L., Barry, J., and DeVogelaere, A. (2010). Assemblage structure, but not diversity or density, change with depth on a northeast Pacific seamount. Mar. Ecol. 31, 14–25. doi: 10.1111/j.1439-0485.2010.00367.x
Merrie, A., Dunn, D. C., Metian, M., Boustany, A. M., Takei, Y., Elferink, A. O., et al. (2014). An ocean of surprises–trends in human use, unexpected dynamics and governance challenges in areas beyond national jurisdiction. Global Environ. Chang. 27, 19–31. doi: 10.1016/j.gloenvcha.2014.04.012
Miyamoto, M., and Kiyota, M. (2017). Application of association analysis for identifing indicator taxa of vulnerable marine ecosystems in the Emperor Seamounts area, North Pacific Ocean. Ecol. Indic. 78, 301–310. doi: 10.1016/j.ecolind.2017.03.028
Miyamoto, M., Kiyota, M., Hayashibara, T., Nonaka, M., Imahara, Y., and Tachikawa, H. (2017). Megafaunal composition of cold-water corals and other deep-sea benthos in the southern Emperor Seamounts area, North Pacific Ocean. Galaxea. J. Coral Reef Stud. 19, 19–30. doi: 10.3755/galaxea.19.1_19
Morato, T., Pham, C. K., Pinto, C., Golding, N., Ardron, J. A., Muñoz, P. D., et al. (2018). A multi criteria assessment method for identifying vulnerable marine ecosystems in the North-East Atlantic. Front. Mar. Sci. 5:460. doi: 10.3389/fmars.2018.00460
Mordecai, G., Tyler, P. A., Masson, D. G., and Huvenne, V. A. (2011). Litter in submarine canyons off the west coast of Portugal. Deep Sea Res. Pt II 58, 2489–2496. doi: 10.1016/j.dsr2.2011.08.009
Murillo, F. J., Kenchington, E., Sacau-Cuadrado, M. D. M., Piper, D., Wareham, V., and Muñoz, A. (2011). New VME Indicator Species (Excluding Corals and Sponges) and Some Potential VME Elements of the NAFO (North Atlantic Fisheries Organization) SCR Doc. 11/73. Available at: https://archive.nafo.int/open/sc/2011/scr11-073.pdf (accessed October 1, 2019).
NAFO (2010). Sponge Identification Guide NAFO Area. Northwest Atlantic Fisheries Organization Scientific Council Studies. Dartmouth: NAFO.
NAFO (2018). Northwest Atlantic Fisheries Organization conservation and Enforcement Measures. NAFO/FC Doc 18-01. Dartmouth: NAFO.
National Technical Information Service (1971). Development of a Fixed, Permanent Mooring System on the Pinnacle of Cobb Seamount. Springfield, VA: National Technical Information Service.
NEAFC (2015). Recommendation on the Protection of Vulnerable Marine Ecosystems in the NEAFC Regulatory Area. North East Atlantic Fisheries Commission. Available at: http://extwprlegs1.fao.org/docs/pdf/mul165665.pdf (accessed October 1, 2019).
NOAA Marine Debris Program (2015). Report on the Impacts of “Ghost Fishing” Via Derelict Fishing Gear. Silver Spring, MD: NOAA Marine Debris Program.
North Atlantic Fisheries Organization [NAFO] (2009). Coral Identification Guide NAFO Area. Northwest Atlantic Fisheries Organization Scientific Council Studies. Dartmouth: NAFO.
North Pacific Fisheries Commission [NPFC] (2017). Conservation and Management Measure for Bottom Fisheries and Protection of Vulnerable Marine Ecosystems in the Northeastern Pacific Ocean. North Pacific Fisheries Commission. CMM 2017-16. Available at: https://www.npfc.int/system/files/2017-09/CMM%202017-06%20FOR%20BOTTOM%20FISHERIES%20AND%20PROTECTION%20OF%20VULNERABLE%20MARINE%20ECOSYSTEMS%20IN%20THE%20NORTHEASTERN%20PACIFIC%20OCEAN.pdf (accessed October 1, 2019).
North Pacific Fisheries Commission [NPFC] (2018). Conservation and Management Measure for bottom fisheries and Protection of Vulnerable Marine Ecosystems in the Northeastern Pacific Ocean. North Pacific Fisheries Commission. CMM 2018–2015. New York, NY: NPFC.
Oliveira, F., Monteiro, P., Bentes, L., Henriques, N. S., Aguilar, R., and Gonçalves, J. M. (2015). Marine litter in the upper São Vicente submarine canyon (SW Portugal): Abundance, distribution, composition and fauna interactions. Mar. Pollut. Bull. 97, 401–407. doi: 10.1016/j.marpolbul.2015.05.060
Parker, T., and Tunnicliffe, V. (1994). Dispersal strategies of the biota on an oceanic seamount: implications for ecology and biogeography. Biol. Bull. 187, 336–345. doi: 10.2307/1542290
Pearson, D. E., Douglas, D. A., and Barss, B. (1993). Biological observations from the Cobb Seamount rockfish fishery. Fish. Bull. 91, 573–576.
Pham, C., Gomes-Pereira, J., Isidro, E., Santos, R., and Morato, T. (2013). Abundance of litter on condor seamount (Azores, Portugal, Northeast Atlantic). Deep Sea Res. Pt II 98, 204–208. doi: 10.1016/j.dsr2.2013.01.011
Pham, C. K., Diogo, H., Menezes, G., Porteiro, F., Braga-Henriques, A., Vandeperre, F., et al. (2014). Deep-water longline fishing has reduced impact on vulnerable marine ecosystems. Sci. Rep. 4:4837. doi: 10.1038/srep04837
Pitcher, T. J., Morato, T., Hart, P. J. B., Clark, M. R., Haggan, N., and Santos, R. S. (2007). “The depths of ignorance: an ecosystem evaluation framework for seamount ecology, fisheries and conservation,” in Seamounts: Ecology, Fisheries & Conservation, eds T. J. Pitcher, T. Morato, P. J. B. Hart, M. R. Clark, N. Haggan, and R. S. Santos, (Hoboken, NJ: Blackwell Publishing), 476–488. doi: 10.1002/9780470691953.ch21
Popova, E., Vousden, D., Sauer, W. H., Mohammed, E. Y., Allain, V., Downey-Breedt, N., et al. (2019). Ecological connectivity between the areas beyond national jurisdiction and coastal waters: Safeguarding interests of coastal communities in developing countries. Mar. Policy 104, 90–102. doi: 10.1016/j.marpol.2019.02.050
Ragnarsson, S. A., Burgos, J. M., Kutti, T., van den Beld, I., Egilsdóttir, H., Arnaud-Haond, S., et al. (2017). “The impact of anthropogenic activity on cold-water corals,” in Marine Animal Forests: The Ecology of Benthic Biodiversity Hotspots, eds S. Rossi, L. Bramanti, A. Gori, and C. Orejas, (Berlin: Springer), 1–35. doi: 10.1007/978-3-319-17001-5_27-1
Ramirez-Llodra, E., Brandt, A., Danovaro, R., De Mol, B., Escobar, E., German, C., et al. (2010). Deep, diverse and definitely different: unique attributes of the world’s largest ecosystem. Biogeosciences 7, 2851–2899. doi: 10.5194/bg-7-2851-2010
Roark, E. B., Guilderson, T. P., Dunbar, R. B., and Ingram, B. L. (2006). Radiocarbon-based ages and growth rates of Hawaiian deep-sea corals. Mar. Ecol. Prog. Ser. 327, 1–14. doi: 10.3354/meps327001
Roberts, S., and Hirshfield, M. (2004). Deep-sea corals: out of sight, but no longer out of mind. Front. Ecol. Environ. 2, 123–130. doi: 10.2307/3868237
Rogers, A. D., Baco, A., Griffiths, H., Hart, T., and Hall-Spencer, J. M. (2007). “Corals on seamounts,” in Seamounts: Ecology, Fisheries and Conservation, eds N. Haggan, T. Morato, R. S. Santos, P. J. B. Hart, and M. R. Clark, (Blackwell), 141–169. doi: 10.1002/9780470691953.ch8
Rooper, C., and Kiyota, M. (2018). Applying global experiences to regional assessments: A workshop on the Protection of Vulnerable Marine Ecosystems in the North Pacific Fisheries Commission Area. PICES Press 26, 8–12.
Salgado, E. J., Nehasil, S. E., and Etnoyer, P. J. (2018). Distribution of deep-water corals, sponges, and demersal fisheries landings in Southern California, USA: implications for conservation priorities. PeerJ 6:e5697. doi: 10.7717/peerj.5697
Samadi, S., Schlacher, T., Richer and de Forges, B. (2007). “Seamount benthos,” in Seamounts: Ecology, Fisheries And Conservation, eds N. Haggan, T. Morato, R. S. Santos, P. J. B. Hart, and M. R. Clark, (Blackwell), 119–140.
Sasaki, T. (1985). Development and present status of Japanese trawl fisheries in the vicinity of seamounts. Bull. JPN Soc. Fish. Oceanogr. 47, 161–166.
Shank, T. M. (2010). Seamounts: deep-ocean laboratories of faunal connectivity, evolution, and endemism. Oceanography 23, 108–122. doi: 10.5670/oceanog.2010.65
Smith, C., Papadopoulou, K., and Diliberto, S. (2000). Impact of otter trawling on an eastern Mediterranean commercial trawl fishing ground. ICES J. Mar. Sci. 57, 1340–1351. doi: 10.1006/jmsc.2000.0927
South East Atlantic Fisheries Organisation [SEAFO] (2016). Report of the 12th SEAFO Scientific Committee. Available at: http://www.seafo.org/media/4ca98f5f-c111-4bcf-875b-36ac3213b8b7/SEAFOweb/pdf/SC/open/eng/SC%20Report%202016_pdf (accessed October 1, 2019).
South Pacific Regional Fisheries Management Organisation [SPRFMO] (2019). Conservation and Management Measure For The Management Of Bottom Fishing in the SPRFMO Convention Area. South Pacific Regional Fisheries Management Organisation. CMM-03-2019. Available at: https://www.sprfmo.int/assets/Fisheries/Conservation-and-Management-Measures/2019-CMMs/CMM-03-2019-5Mar2019.pdf (accessed October 1, 2019).
Stone, R. (2006). Coral habitat in the Aleutian Islands of Alaska: depth distribution, fine-scale species associations, and fisheries interactions. Coral Reefs 25, 229–238. doi: 10.1007/s00338-006-0091-z
Taranto, G. H., Kvile, K. O., Pitcher, T. J., and Morato, T. (2012). An ecosystem evaluation framework for global seamount conservation and management. PLoS One 7:e42950. doi: 10.1371/journal.pone.0042950
Tingley, G. (2014). An Assessment of the Potential for Near-Seabed Midwater Trawling to Contact the Seabed and to Impact Benthic Habitat and Vulnerable Marine Ecosystems (VMEs). SPRFMO Technical Paper. SC-02-10. Available at: https://www.sprfmo.int/assets/Meetings/Meetings-2013-plus/SC-Meetings/2nd-SC-Meeting-2014/Papers/SC-02-10-Midwater-trawls-potential-for-benthic-impacts.pdf (accessed October 1, 2019).
Tissot, B. N., Yoklavich, M. M., Love, M. S., York, K., and Amend, M. (2006). Benthic invertebrates that form habitat on deep banks off southern California, with special reference to deep sea coral. Fish. Bull. 104, 167–181.
Uchida, R. N., and Tagami, D. T. (1984). Groundfish fisheries and research in the vicinity of seamounts in the North Pacific Ocean. Mar. Fish. Rev. 46, 1–17.
UN (2019). The Sustainable Development Goals Report. Available at: https://unstats.un.org/sdgs/report/2019/The-Sustainable-Development-Goals-Report-2019.pdf (accessed November 14, 2019).
UNGA (2006). United Nations General Assembly Resolution 61/105 (UNGA 61/105). Sustainable Fisheries, Including Through The 1995 Agreement for the Implementation of the Provisions of the United Nations Convention on the Law of the Sea of 10 December 1982 relating to the Conservation and Management of Straddling Fish Stocks and Highly Migratory Fish Stocks, And Related Instruments. Available at: https://documents-dds-ny.un.org/doc/UNDOC/GEN/N06/500/73/PDF/N0650073.pdf?OpenElement (accessed October 1, 2019).
Verity, P. G., Smetacek, V., and Smayda, T. J. (2002). Status, trends and the future of the marine pelagic ecosystem. Environ. Conserv. 29, 207–237. doi: 10.1111/jfb.12759
Victorero, L., Robert, K., Robinson, L. F., Taylor, M. L., and Huvenne, V. A. (2018). Species replacement dominates megabenthos beta diversity in a remote seamount setting. Sci. Rep. 8:4152.
Vieira, R. P., Raposo, I. P., Sobral, P., Gonçalves, J. M., Bell, K. L., and Cunha, M. R. (2015). Lost fishing gear and litter at Gorringe Bank (NE Atlantic). J. Sea Res. 100, 91–98. doi: 10.1016/j.seares.2014.10.005
Waller, R., Watling, L., Auster, P., and Shank, T. (2007). Anthropogenic impacts on the Corner Rise seamounts, north-west Atlantic Ocean. J. Mar. Biol. Assoc. U.K. 87, 1075–1076. doi: 10.1017/s0025315407057785
Watling, L. (2005). “The global destruction of bottom habitats by mobile fishing gear,” in Marine Conservation Biology: The Science Of Maintaining The Sea’s Biodiversity, eds L. B. Crowder and E. A. Norse, (Washington, DC: Island Press), 198–210.
Watling, L., and Auster, P. J. (2017). Seamounts on the high seas should be managed as vulnerable marine ecosystems. Front. Mar. Sci. 4:14. doi: 10.3389/fmars.2017.00014
Watling, L., and Norse, E. A. (1998). Disturbance of the seabed by mobile fishing gear: a comparison to forest clearcutting. Conserv. Biol. 12, 1180–1197. doi: 10.1046/j.1523-1739.1998.0120061180.x
Watters, D. L., Yoklavich, M. M., Love, M. S., and Schroeder, D. M. (2010). Assessing marine debris in deep seafloor habitats off California. Mar. Pollut. Bull. 60, 131–138. doi: 10.1016/j.marpolbul.2009.08.019
Whitney, F. A., Freeland, H. J., and Robert, M. (2007). Persistently declining oxygen levels in the interior waters of the eastern subarctic Pacific. Prog. Oceanogr. 75, 179–199. doi: 10.1016/j.pocean.2007.08.007
Keywords: vulnerable marine ecosystem, bottom-contact fishing, derelict fishing gear, deep sea, biological structures, biogenic habitats, cold-water corals, indicator taxa
Citation: Du Preez C, Swan KD and Curtis JMR (2020) Cold-Water Corals and Other Vulnerable Biological Structures on a North Pacific Seamount After Half a Century of Fishing. Front. Mar. Sci. 7:17. doi: 10.3389/fmars.2020.00017
Received: 02 October 2019; Accepted: 10 January 2020;
Published: 05 February 2020.
Edited by:
Christopher Kim Pham, University of the Azores, PortugalReviewed by:
Chris Yesson, Zoological Society of London, United KingdomLucia Bongiorni, Istituto di Scienze Marine (ISMAR), Italy
Jerry R. Hoff, National Oceanic and Atmospheric Administration (NOAA), United States
Copyright © 2020 Du Preez, Swan and Curtis. This is an open-access article distributed under the terms of the Creative Commons Attribution License (CC BY). The use, distribution or reproduction in other forums is permitted, provided the original author(s) and the copyright owner(s) are credited and that the original publication in this journal is cited, in accordance with accepted academic practice. No use, distribution or reproduction is permitted which does not comply with these terms.
*Correspondence: Cherisse Du Preez, cherisse.dupreez@dfo-mpo.gc.ca