Understory vegetation supports more abundant and diverse butterfly communities in oil palm plantations
 Valentine Joy Reiss-Woolever1*
  Andreas Dwi Advento2
  Anak Agung Ketut Aryawan2
  Jean-Pierre Caliman2
  William A. Foster1
  Mohammad Naim2
  Pujianto2 Dedi Purnomo2 Soeprapto2 Suhardi2
  Ribka Sionita Tarigan2
  Resti Wahyuningsih2
  Tuani Dzulfikar Siguga Rambe2 Sudharto Ps2 Rudy Harto Widodo2
  Sarah H. Luke1,3
  Jake L. Snaddon4,5
  Edgar C. Turner1
- 1Insect Ecology Group, Department of Zoology, University of Cambridge, Cambridge, United Kingdom
- 2Sinar Mas Agro Resources Technology Research Institute (SMARTRI), Libo Estate, Kandis, Pekanbaru, Riau, Indonesia
- 3School of Biosciences, University of Nottingham, Nottingham, United Kingdom
- 4Geography and Environmental Science, University of Southampton, Southampton, United Kingdom
- 5University of Belize Environmental Research Institute, Belmopan, Belize
Introduction: The cultivation of oil palm, from which palm oil, the world’s most widely traded vegetable oil, is processed, has had marked effects on ecosystems and native species across the tropics. While declines in biodiversity due to conversion to oil palm have been well recorded across plant and animal taxa, less work has been done to identify approaches to plantation management which will enable producers to satisfy growing global demand while limiting environmental damage.
Methods: Through a large-scale understory management experiment, we investigated the long- and short-term effects of varying vegetation management regimes on the abundance, richness, and diversity of day-flying Lepidoptera.
Results: Over the long-term, the lowest levels of vegetation complexity resulted in significantly lower Lepidoptera abundance, species richness and evenness. Less intensive understory clearing resulted in healthier communities, with limited differences between removal by herbicide application or chemical-free removal. Over the short-term, biodiversity was not directly affected by vegetation complexity, suggesting that manual removal of vegetation may be equally damaging to butterfly or moth communities as removal by intermediate levels of herbicide spraying.
Discussion: These findings substantiate calls to limit vegetation clearing and maintain habitat heterogeneity on both a local and landscape scale, while also suggesting that a hard “no-spray” guideline may not be the only option to support butterfly friendly plantations.
Introduction
Agricultural expansion threatens natural ecosystems worldwide through initial biodiversity loss due to conversion of natural habitats, as well as through the continued effects of cultivation practices and associated chemical inputs (Bonhommeau et al., 2013; Dislich et al., 2017). Currently, these effects are most marked in the tropics, where growing populations and agricultural demand have resulted in a rapid expansion of agricultural systems that encroach on areas of high biodiversity and species endemism (Laurance et al., 2014). Southeast Asia, with some of the world’s highest deforestation rates, is a clear example of the conflict between production and conservation (Wilcove et al., 2013). For example, in Indonesia approximately 33% of land is now under agriculture and nearly 30% of the population is involved in agricultural production (World Bank, 2019), while the country also contains some of the world’s most threatened ecosystems and species (Kwatrina et al., 2018).
In Indonesia, no crop has more rapidly expanded in recent years than oil palm (Scharlemann and Laurance, 2008). Global demand for palm oil has increased fourfold in the past 20 years (FAO, 2020), and it is now the world’s most traded vegetable oil, ubiquitous in cosmetics, processed foods, and biofuels (Wahid et al., 2005; USDA, 2020). To meet this demand, oil palm is currently grown on 21.3 million hectares of tropical land (FAO, 2019), with Indonesia, containing over 14 million hectares of oil palm plantations (FAO, 2020). This expansion has caused widespread deforestation (Koh and Wilcove, 2008; Vijay et al., 2016), declines in a wide range of taxa (Fitzherbert et al., 2008; Foster et al., 2011; Ashton-Butt et al., 2018), and impacts on associated ecosystem services, such as carbon sequestration, decomposition, and water and nutrient cycling (Dislich et al., 2017). However, oil palm also produces five-to-nine times more vegetable oil per area than other vegetable oil crops, making its cultivation a key component of meeting global vegetable oil demand without exacerbating further transformation of natural habitats (Zimmer, 2010).
While preservation of large-scale forest habitats is vital for conservation of global biodiversity, it is also necessary to investigate management methods that sustain biodiversity within established agricultural areas, including oil palm plantations. This is not only important for wider biodiversity but may also support productive yields, as some species in agricultural systems deliver important ecosystem services for crop health and production. Due to its perennial nature and 25-year commercial lifespan, oil palm can develop a relatively diverse environment, including a complex three-dimensional habitat, a diverse understory, and abundant epiphyte community (Luskin and Potts, 2011). Mature plantations also develop a closed canopy and stable microclimates, which can support robust arthropod communities (Pashkevich et al., 2021). Therefore, oil palm has the potential to support higher levels of biodiversity than many other agricultural crops. In light of this, sustainability certification schemes, such as the Roundtable on Sustainable Palm Oil (RSPO), have discouraged destructive management practices such as vegetation clearance and excessive herbicide use in oil palm (Roundtable of Sustainable Palm Oil [RSPO], 2018) to reduce negative impacts on the wider environment and support beneficial species within plantations. While previous studies have examined the biodiversity effects of maintaining landscape-scale habitat heterogeneity within oil palm (e.g., Azhar et al., 2015; Teuscher et al., 2016), less information is known about the effects of more targeted practices within oil palm itself. As local-scale changes are more easily implemented by plantation managers, and therefore more practical to include in certification guidelines, this information is key. One particularly promising approach is to allow understory plant complexity and diversity to develop by reducing herbicide spraying around palms. For example, previous studies have found that higher levels of understory complexity can support more diverse bird communities (Nájera and Simonetti, 2010), mammal activity (Hood et al., 2019), abundant ground ant communities (Hood et al., 2020), and higher levels of litter decomposition by macrofauna (Ashton-Butt et al., 2018).
Among arthropods, Lepidoptera (butterflies and moths) are one of the most well-recorded and charismatic orders (Thomas, 2005). Lepidoptera can play a dual role in plantations as pollinators (Hahn and Brühl, 2016) and crop pests (Saravanan et al., 2020), as well as being an important link in larger food chains, as a prey species for birds, reptiles, amphibians, and some mammals (Thomas, 2005). Due to their responsiveness to environmental changes, butterflies and moths are commonly used as indicators of broader ecosystem health (Öckinger and Smith, 2006). Within communities, response to environmental change varies by habitats, species, and life-cycle phase, and has been seen to be impacted by landscape-level (Koh and Wilcove, 2008), and local-level factors (Öckinger and Smith, 2006). While reductions in Lepidoptera due to land conversion to oil palm have been recorded (Kwatrina et al., 2018), as has the effect of small-scale changes in plantation layout on density and behavior (Reiss-Woolever et al., 2023), the long- and short- term impact of oil palm understory management on butterfly communities has yet to be investigated.
In this article we investigate the impacts of varying understory management on day-flying Lepidoptera, using a large-scale and long-term understory Before After Control Impact (BACI) management experiment, forming part of the Biodiversity and Ecosystem Function in Tropical Agriculture (BEFTA) Program (Foster et al., 2014). Varying understory management treatments applied in oil palm plantations could affect Lepidoptera communities at both long-term and short-term time scales. In the long-term, as seen across seasons and years, management practices may reduce understory cover and alter habitat heterogeneity, microclimate, and the presence of the non-crop vegetation upon which arthropods can rely (Foster et al., 2011). In the short-term, clearance via herbicide application or manual cutting may directly harm Lepidoptera, as food sources or resting sites are removed. We determine if there are such long-term and short-term effects, asking the following questions:
(1) What are the long-term effects of varying understory vegetation management on day-flying Lepidoptera abundance, richness, and diversity?
(2) What are the short-term effects of varying understory vegetation management on day-flying Lepidoptera abundance, richness, and diversity?
Materials and methods
Sites
Data were collected in oil palm plantations in Riau Province, central Sumatra, Indonesia (Supplementary Information 1). The plantations are owned and managed by PT Ivo Mas Tunggal (a subsidiary company of Golden Agri Resources, GAR), with technical input from Sinar Mas Agro Resources and Technology Research Institute (SMARTRI) (the research and development center of GAR). The region has a tropical climate, with average annual rainfall of 2,350 mm (Tao et al., 2016). The study sites are part of the Biodiversity and Ecosystem Function in Tropical Agriculture Understory Vegetation (BEFTA UV) Project (Luke et al., 2020). The BEFTA UV Project tests the effects of varying understory vegetation management practices on the oil palm ecosystem through common management practices. The study was conducted across two neighboring plantation estates (Ujung Tanjung, ∼40 km2 in area and Kandista, ∼35 km2 in area) that had comparable management practices, with mature oil palm divided into 1,000 × 300 m plantation blocks, edged by plantation roads.
Experimental plots were organized into six triplets with three 150 × 150 m plots in each (Supplementary Information 2). All plots were on flat ground, containing mature oil palms planted between 1988 and 1993. Each plot was bordered on one end by an unpaved road and drainage ditch, and by neighboring oil palm on the other sides. Therefore, each plot contained habitat that is within the plantation (at least 50 m from a road, hereafter referred to as “Core” habitat), and habitat at an open road edge and drainage ditch (hereafter referred to as “Edge” habitat). The “Core” and “Edge” habitats were at least 50 m apart from each other within each plot, and between neighboring plots. The term “Edge” is used throughout the BEFTA UV Project and refers to the areas bordered by plantation roads and ditches. “Edge” and “Core” habitats had different exposure, water occurrence, and vegetation structure (Luke et al., 2019). Small streams ran through several of the plots: one reduced, two normal, and one enhanced. Refer to Luke et al. (2020) for full details.
Data collection for the BEFTA UV Project followed a BACI design, with data being collected from all plots both before and after understory management was altered. Plots were established in October 2012, and one of three alternative management treatments were implemented in February 2014, assigned at random to each plot within a triplet. These represent the range of common vegetation management strategies used within industrial oil palm plantations:
1. Reduced complexity: this is the most intense level of standard industry practice and involves removal of all understory vegetation. Herbicides are applied three-to-five times annually to maintain a clear understory throughout the plots, and included Glyphosate (Rollup 480 SL), metsulfuron-methyl (Erkafuron 20 WG), Fluroxypyr (Starane 290 EC), and Paraquat Dichloride (Rolixone 276 SL). Hereafter referred to as “Reduced.”
2. Normal complexity: this is the standard practice used in the wider plantations in our study area, both surrounding our plots and in all plots prior to implementation of alternative experimental treatments. While some vegetation is allowed to grow, woody vegetation is removed manually. Herbicides are applied three-to-five times annually to maintain clear harvest paths and circles around palms. Hereafter referred to as “Normal.”
3. Enhanced complexity: this is the lowest intensity vegetation management and involves no spraying of herbicides. There is only hand-cutting of woody vegetation along harvesting paths and in the 1.5 m circle around palms, with other vegetation left undisturbed. Manual cutting is carried out three-to-five times annually to maintain harvest paths and palm circles. Hereafter referred to as “Enhanced.”
Pre-treatment data were collected in March and September 2013 and post-treatment data in March and September 2015. March and September data were combined for each year, resulting in 2013-Pre and 2015-Post data, which was analyzed separately for Core and Edge habitats. The habitats were kept separate, as these were visually distinct habitats with distinct microclimatic and resource conditions (Luke et al., 2020) and known to differ in butterfly density from a previous study (Reiss-Woolever et al., 2021). We also collected data in 2014 immediately before, and immediately after herbicide application in Reduced and Normal treatment plots, allowing an assessment of the immediate impacts of vegetation removal. The surveys immediately before spaying are hereafter referred to as 2014-Pre, and the surveys immediately after as 2014-Post. Monthly rainfall in the two estates was 163 mm in March and 239 mm in September 2013, consistent with historically high variation in monthly and annual rainfall in the area. While 2013 experienced higher average rainfall than the following 2 years (2013–2015 monthly average: 152 mm), it was not an El Niño year (see Luke et al., 2020 for full analysis of rainfall patterns at SMARTRI sites). The most common non-crop vegetation species (by contribution to biomass) were the same across the three treatments: ferns Nephrolepis biserrata and Asplenium longissimum, herbs Borreria latifolia, and Asystasia micrantha, together making up nearly 80% of total biomass. A. micrantha is the only one of these species considered a weed in oil palm plantations. Full information on plant species composition can be found in Luke et al. (2019).
Butterfly surveys
We surveyed adult day-flying Lepidoptera along transects in both the Core and Edge habitats for each plot. We followed standard transect methods (Pollard and Yates, 1993) in both habitat types. In brief, a recorder walked slowly along the transect and recorded any butterflies and day-flying moths seen within a 5 m-sided cube in front of them. The transect shape and volume differed between Core and Edge sites (Supplementary Information 2), with the roadside Edge transects represented as a straight line of 150 m (survey volume 3,750 m3) and Core transects represented in the shape of a picture frame (survey volume 4,969 m3, with the area at the beginning and end of the transect only being surveyed once to avoid double counting). We acknowledge that this difference means the distance between furthest points within transects is higher in the Edge than Core areas, and that there could be a higher chance of resurveying individual butterflies in the Core than the Edge transects. However, as we only specifically compare Edge with Edge and Core with Core surveys in this article, this difference in survey design between areas should not impact our results. Abundance data were standardized between 200-m Core and 150-m Edge transects to allow easy visual comparison between plots by multiplying Core abundance values by 0.75. Species were recorded by eye where possible, or specimens were caught and photographed for later identification. Transects were walked between 9:00 and 17:00 when it was not raining, with surveys taking place before or after midday (between approximately 8:30–10, and 14:30–17), to avoid peak temperatures when butterflies were sometimes inactive, with no bias in time of recording between treatments (Supplementary Information 3). Weather conditions (sunny or cloudy) were logged at the time of recording, and did not change significantly between treatments (Supplementary Information 3). An average of 52% of all surveys done were conducted under sunny conditions. Counts for each plot and season include two surveys at different times of day, with the exception of 2014-Pre and 2014-Post, when time constraints meant that only one transect walk was possible. For analyses, total counts were summed for each transect for analyses, reducing the chance that weather conditions during any particular survey could impact results. Butterflies were seen to be active during all surveys.
Identification followed Corbet et al. (1978) with cross-referencing with region-specific photographs and information, based on photographs after surveys (iNaturalist, 2020). Identification was carried out to family and species level, where possible. There were six cases where we were only able to accurately identify to genus level (Mycalesis spp., Amathusia spp., Erionota spp., Graphium spp., Telicota spp., Macroglossum spp., and Ypthima spp.). There were also two species which we were unable to identify reliably as we could not catch them in the field, which were therefore excluded from species and family counts, but were included in overall abundance analyses.
Statistical analysis
All statistical analyses were performed in R version 4.0.2 (R Core Team, 2020) within R Studio version 1.4.456 (R Studio Team, 2020). We used tidyverse (Wickham et al., 2019), data.table (Dowle et al., 2021), plyr (Wickham, 2011), dplyr (Wickham et al., 2021), and reshape2 (Wickham, 2007) for data management, exploration, and visualization. Unless otherwise stated, all figures were plotted using ggplot2 (Wickham, 2016).
All analysis was conducted separately for Core and Edge habitats, as previous research found significant differences in Lepidoptera density and behavior, as well as interaction with season, in different habitats, and because transect design varied between core and edge areas (Reiss-Woolever et al., 2021). Total species diversity estimates for 2013-Pre and 2015-Post treatment and treatment type (Reduced, Normal, and Enhanced) by transect were determined using Chao incidence frequency estimates and visualized with rarefaction curves with the package iNEXT (Hsieh et al., 2020). We used Rank Abundance Curves by transect to visualize variation in species abundance and evenness across years and treatments, produced using BiodiversityR (Kindt, 2021).
To determine the effects of 2013-Pre and 2015-Post treatment and treatment type (Reduced Normal, and Enhanced) on abundance, richness, and the Inverse Simpson Index (a measure of diversity which considers both species richness and evenness of abundance among the species present, and where higher values indicate higher evenness in the community), we fitted generalized linear mixed-effect models (GLMMs) using mvabund (Wang et al., 2012) and lme4 (Bates et al., 2015). We chose to include Simpson’s Index to quantify the effects of altered management practices on evenness of Lepidoptera communities per transect, complementing our measures of species richness. All linear models were fitted to negative binomial distributions using log links, with pre- or post- treatment (levels: 2013-Pre and 2015-Post), treatment type (levels: Reduced, Normal, and Enhanced), and the interaction between pre- and post- treatment and treatment type as fixed effects, and triplet as a random intercept effect. We validated GLMM models by plotting Pearson residuals against fitted values and covariates and verifying that no patterns were present. We further validated models by simulating eight datasets for frequency, residuals, and residuals against variables using the identical effects, and were unable to differentiate the observed data set from the simulated data sets, indicating that there were no issues in model fit.
Differences in Lepidoptera community composition across treatment year (2013 or 2015) and treatment type (Reduced, Normal, and Enhanced) were visualized using Non-metric Multidimensional Scaling (NMDS) with the package “vegan” (Oksanen et al., 2020) at both species and family level. We tested for significant differences in species and family-level composition using ANOSIM with a Bray–Curtis dissimilarity matrix with 999 permutations, again using “vegan.”
We also tested the short-term effects of vegetation clearing using 2014 data only, with all analysis conducted separately for Core and Edge habitats as before. For the 2014 data, only “Reduced” and “Normal” treatments were used, as there had not yet been time for any changes to develop under the “Enhanced” regime and they were therefore still operating under a “Normal” regime at the time of sampling. We again ran GLMMs using negative binomial distributions using log links, with pre- or post- treatment (levels: 2014-Pre and 2014-Post), treatment type (levels: Reduced and Normal), and the interaction between pre- and post- treatment and treatment type as fixed effects and triplet as a random intercept effect. Models were validated in the same way as the 2013/2015 long-term data. We conducted the same Chao incidence frequency, rarefaction, Rank abundance, and NMDS analysis for the 2014-Pre and 2014-Post data as we did for the 2013-Pre and 2015-Post, as detailed above.
Results
We observed a total of 3,637 individual butterflies and moths, from 55 different species within eight different families (Callidulidae, Erebidae, Hesperiidae, Lycaenidae, Nymphalidae, Papilionidae, Pieridae, Satyridae, Sphingidae) (Supplementary Information 4) across all surveys. Overall, the most common morphospecies were Ypthima spp. (19% of total observed), Elymnias hypermnestra (16% of total observed), and Leptosia nina (10% of total observed). We did not record any species endemic to Sumatra or species classified within the literature as forest specialists, which is not uncommon for studies in oil palm plantations (Estalita, 2012; Chahyadi and Bibas, 2016).
Long-term effects of treatment on abundance, richness, and evenness (2013-Pre and 2015-Post)
A total of 2,590 individuals were found in the 2013 and 2015 surveys. Species accumulation curves were approaching an asymptote in both the 2013 pre-treatment surveys and the 2015 post-treatment surveys (Figures 1A, C), with the exception of Edge habitat post-treatment reduced plots. Similarly, in both habitat types, certainty of richness estimates was lowest in 2015-Post Reduced treatment sites (Core: observed: estimate ratio = 8: 12, SE = 6.9; Edge: observed: estimate ratio = 18: 56.6, SE = 46.8). The rank-abundance curves showed communities dominated by a few species in all cases, but this was most marked in the Edge 2015-Post Reduced treatment sites (Figures 1B, D).
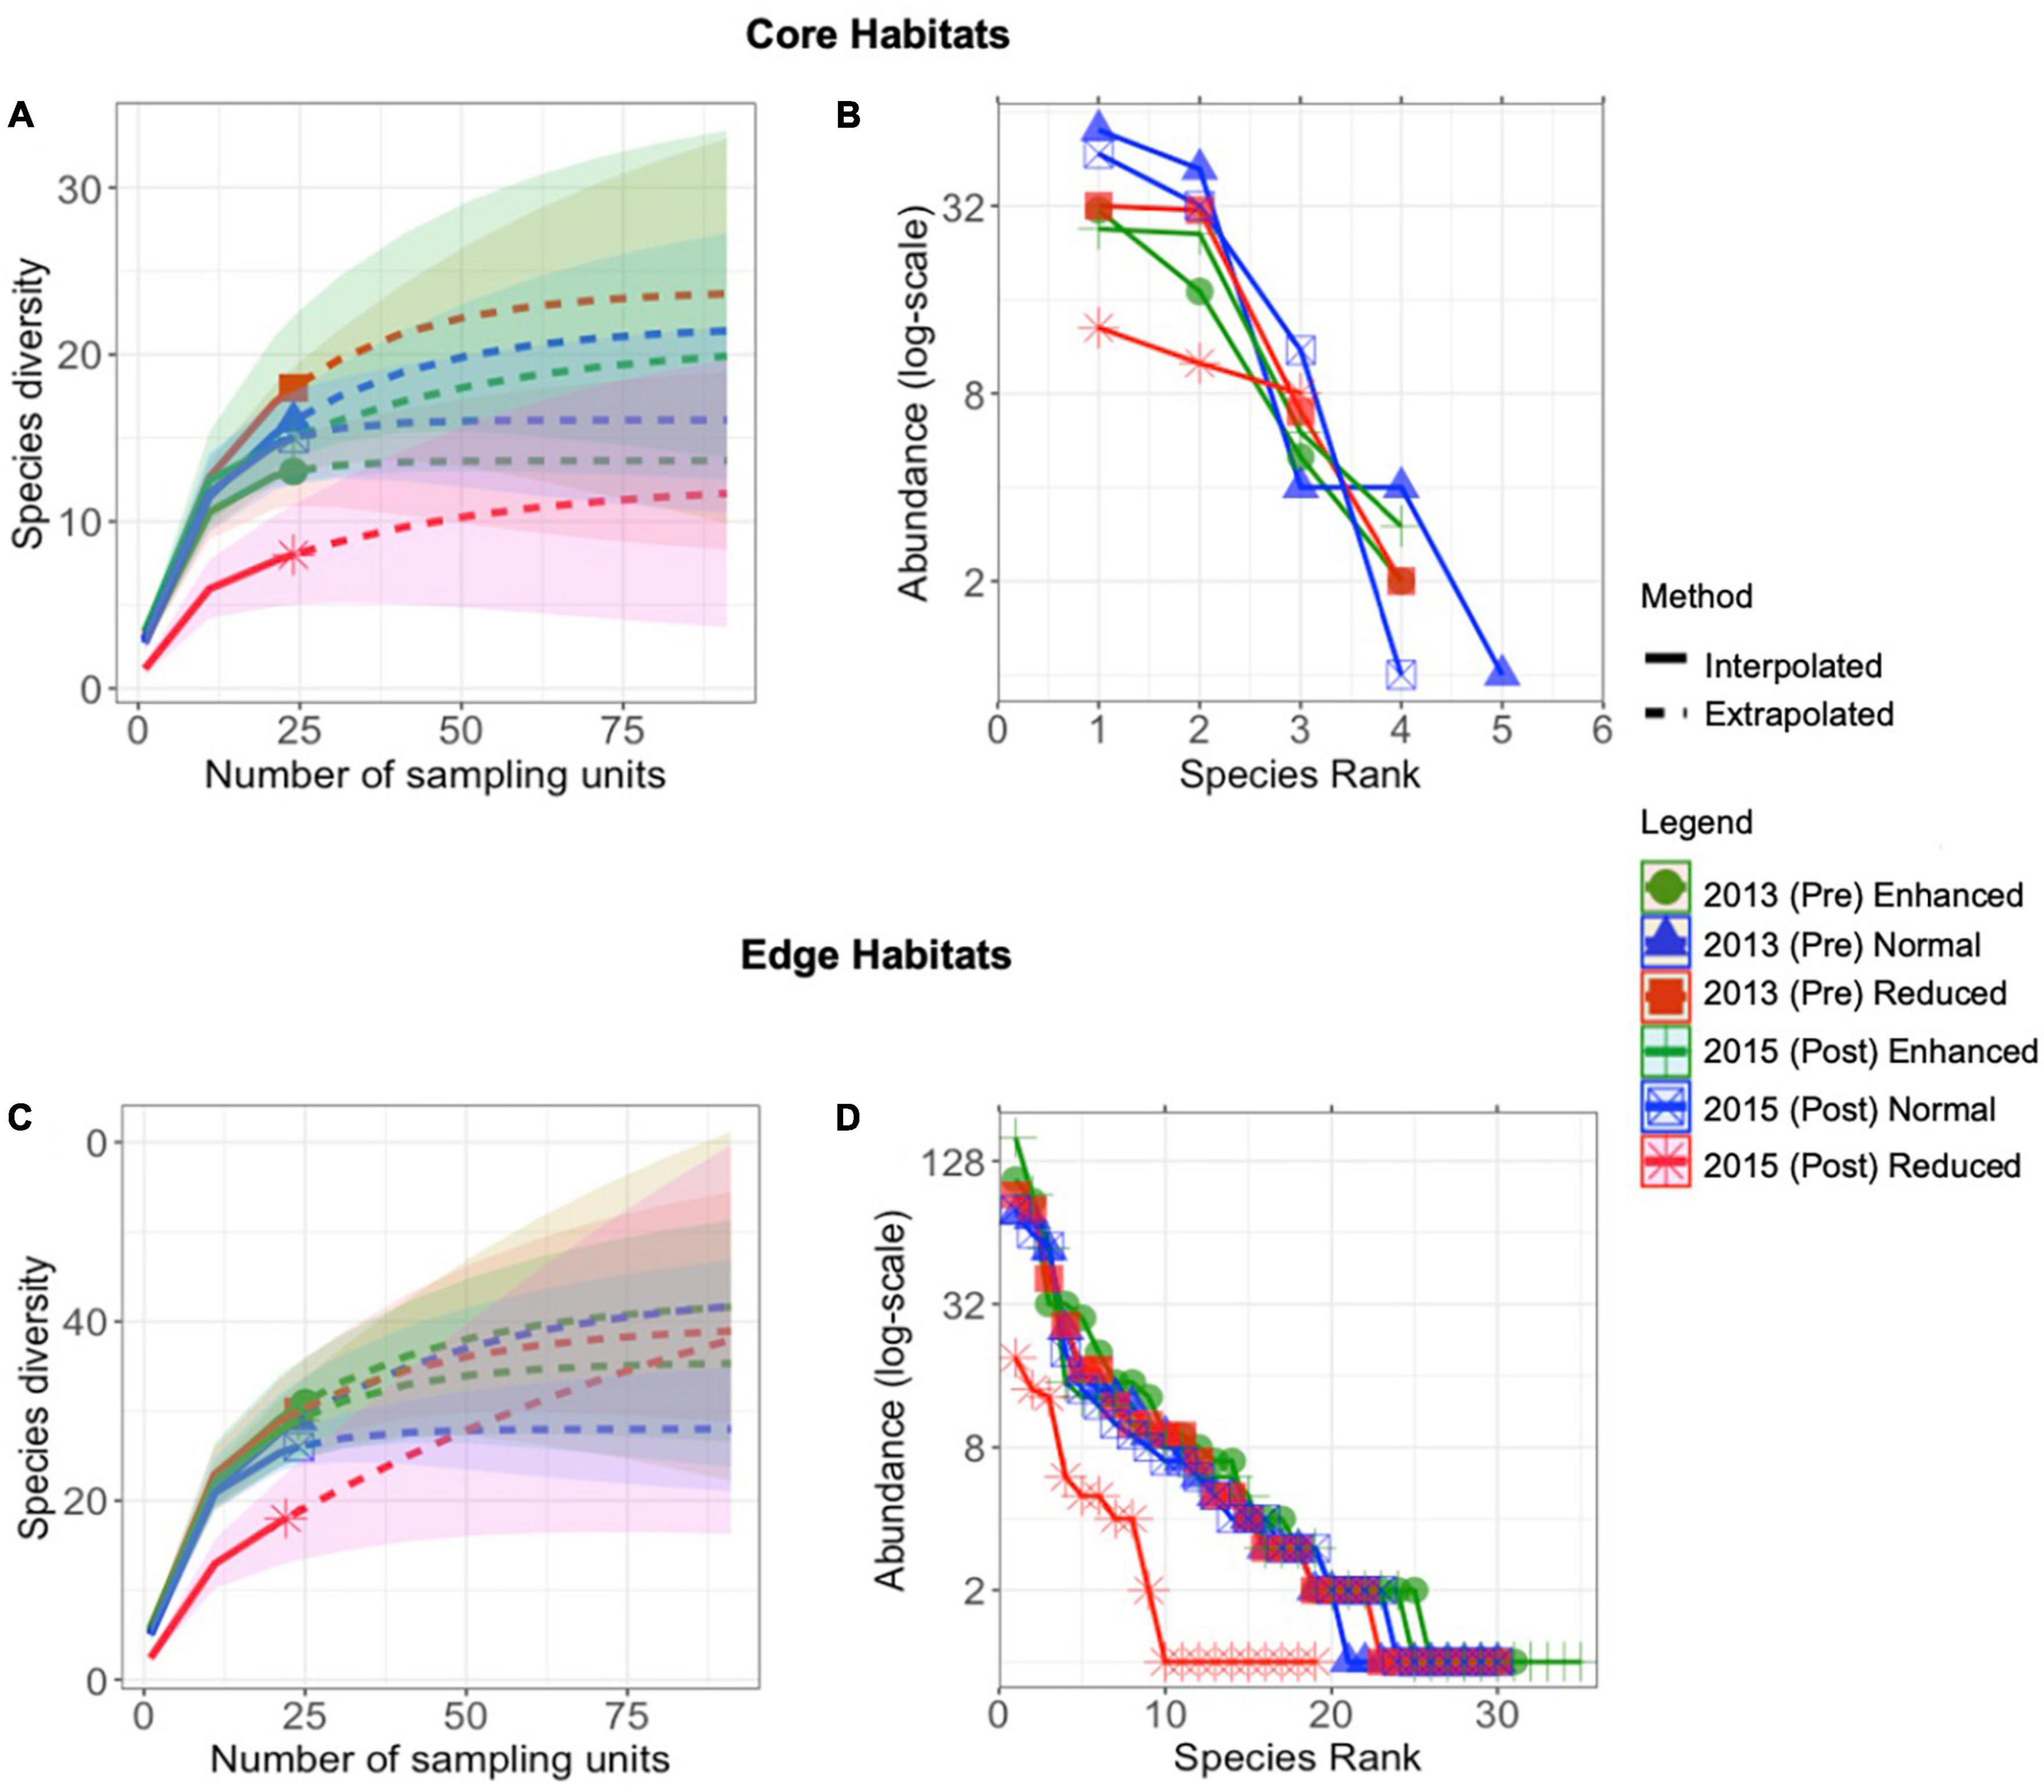
Figure 1. Sample-size-based rarefaction (solid line segment) and extrapolation (dotted line segments) sampling curves for species richness (q = 0) with 95% confidence intervals (shaded areas) for butterfly assemblages across years and treatments in Core (A) and Edge (C) habitats over the long-term (2013–2015). Rank abundance curves of Lepidoptera communities across years and treatments in Core (B) and Edge (D) habitats, displayed on a log-scale (B).
Lepidoptera abundance was significantly affected by the interaction between pre- or post-treatment year and treatment type, indicating an effect of the experimental treatments (Core: Estimate = 0.38, SE = 0.078, p = < 0.001; Edge: Estimate = 0.34, SE = 0.07, p = < 0.001), as well as year and treatment independently (Core: Estimate = 13.94, SE = 0.18, p = < 0.001, Edge: Estimate = −0.77, SE = 0.16, p = < 0.001; Core: Estimate = −5.09, SE = 1.08, p = < 0.001; Edge: Estimate = −0.77, SE = 0.16, p = < 0.001, respectively). In Core habitats, abundance decreased in 2015 post-treatment Reduced (2013-Pre mean = 4.3, SE = 0.9; 2015-Post mean = 1.1, SE = 0.6), and Normal (2013-Pre mean = 3.7, SE = 1.1; 2015-Post mean = 2.6, SE = 1.2) sites, but increased from 2013 to 2015 in Enhanced treatment sites (2013-Pre mean = 3.1, SE = 1.1; 2015-Post mean = 4.3, SE = 1.4) (Figure 2A). In Edge habitats, a similar reduction in abundance per transect was seen after treatment application in Reduced treatment sites (2013-Pre mean = 16.1, SE = 1.7; 2015-Post mean = 3.2, SE = 0.9), but abundance increased from 2013 to 2015 in Normal (2013-Pre mean = 16, SE = 1.5; 2015-Post mean = 17.6, SE = 3.2) and Enhanced (2013-Pre mean = 16, SE = 1.3; 2015-Post mean = 21.1, SE = 3.0) sites (Figure 2D). For both Core and Edge habitats, the most marked change in abundance was seen in a decrease from 2013-Pre to 2015-Post in Reduced treatment sites.
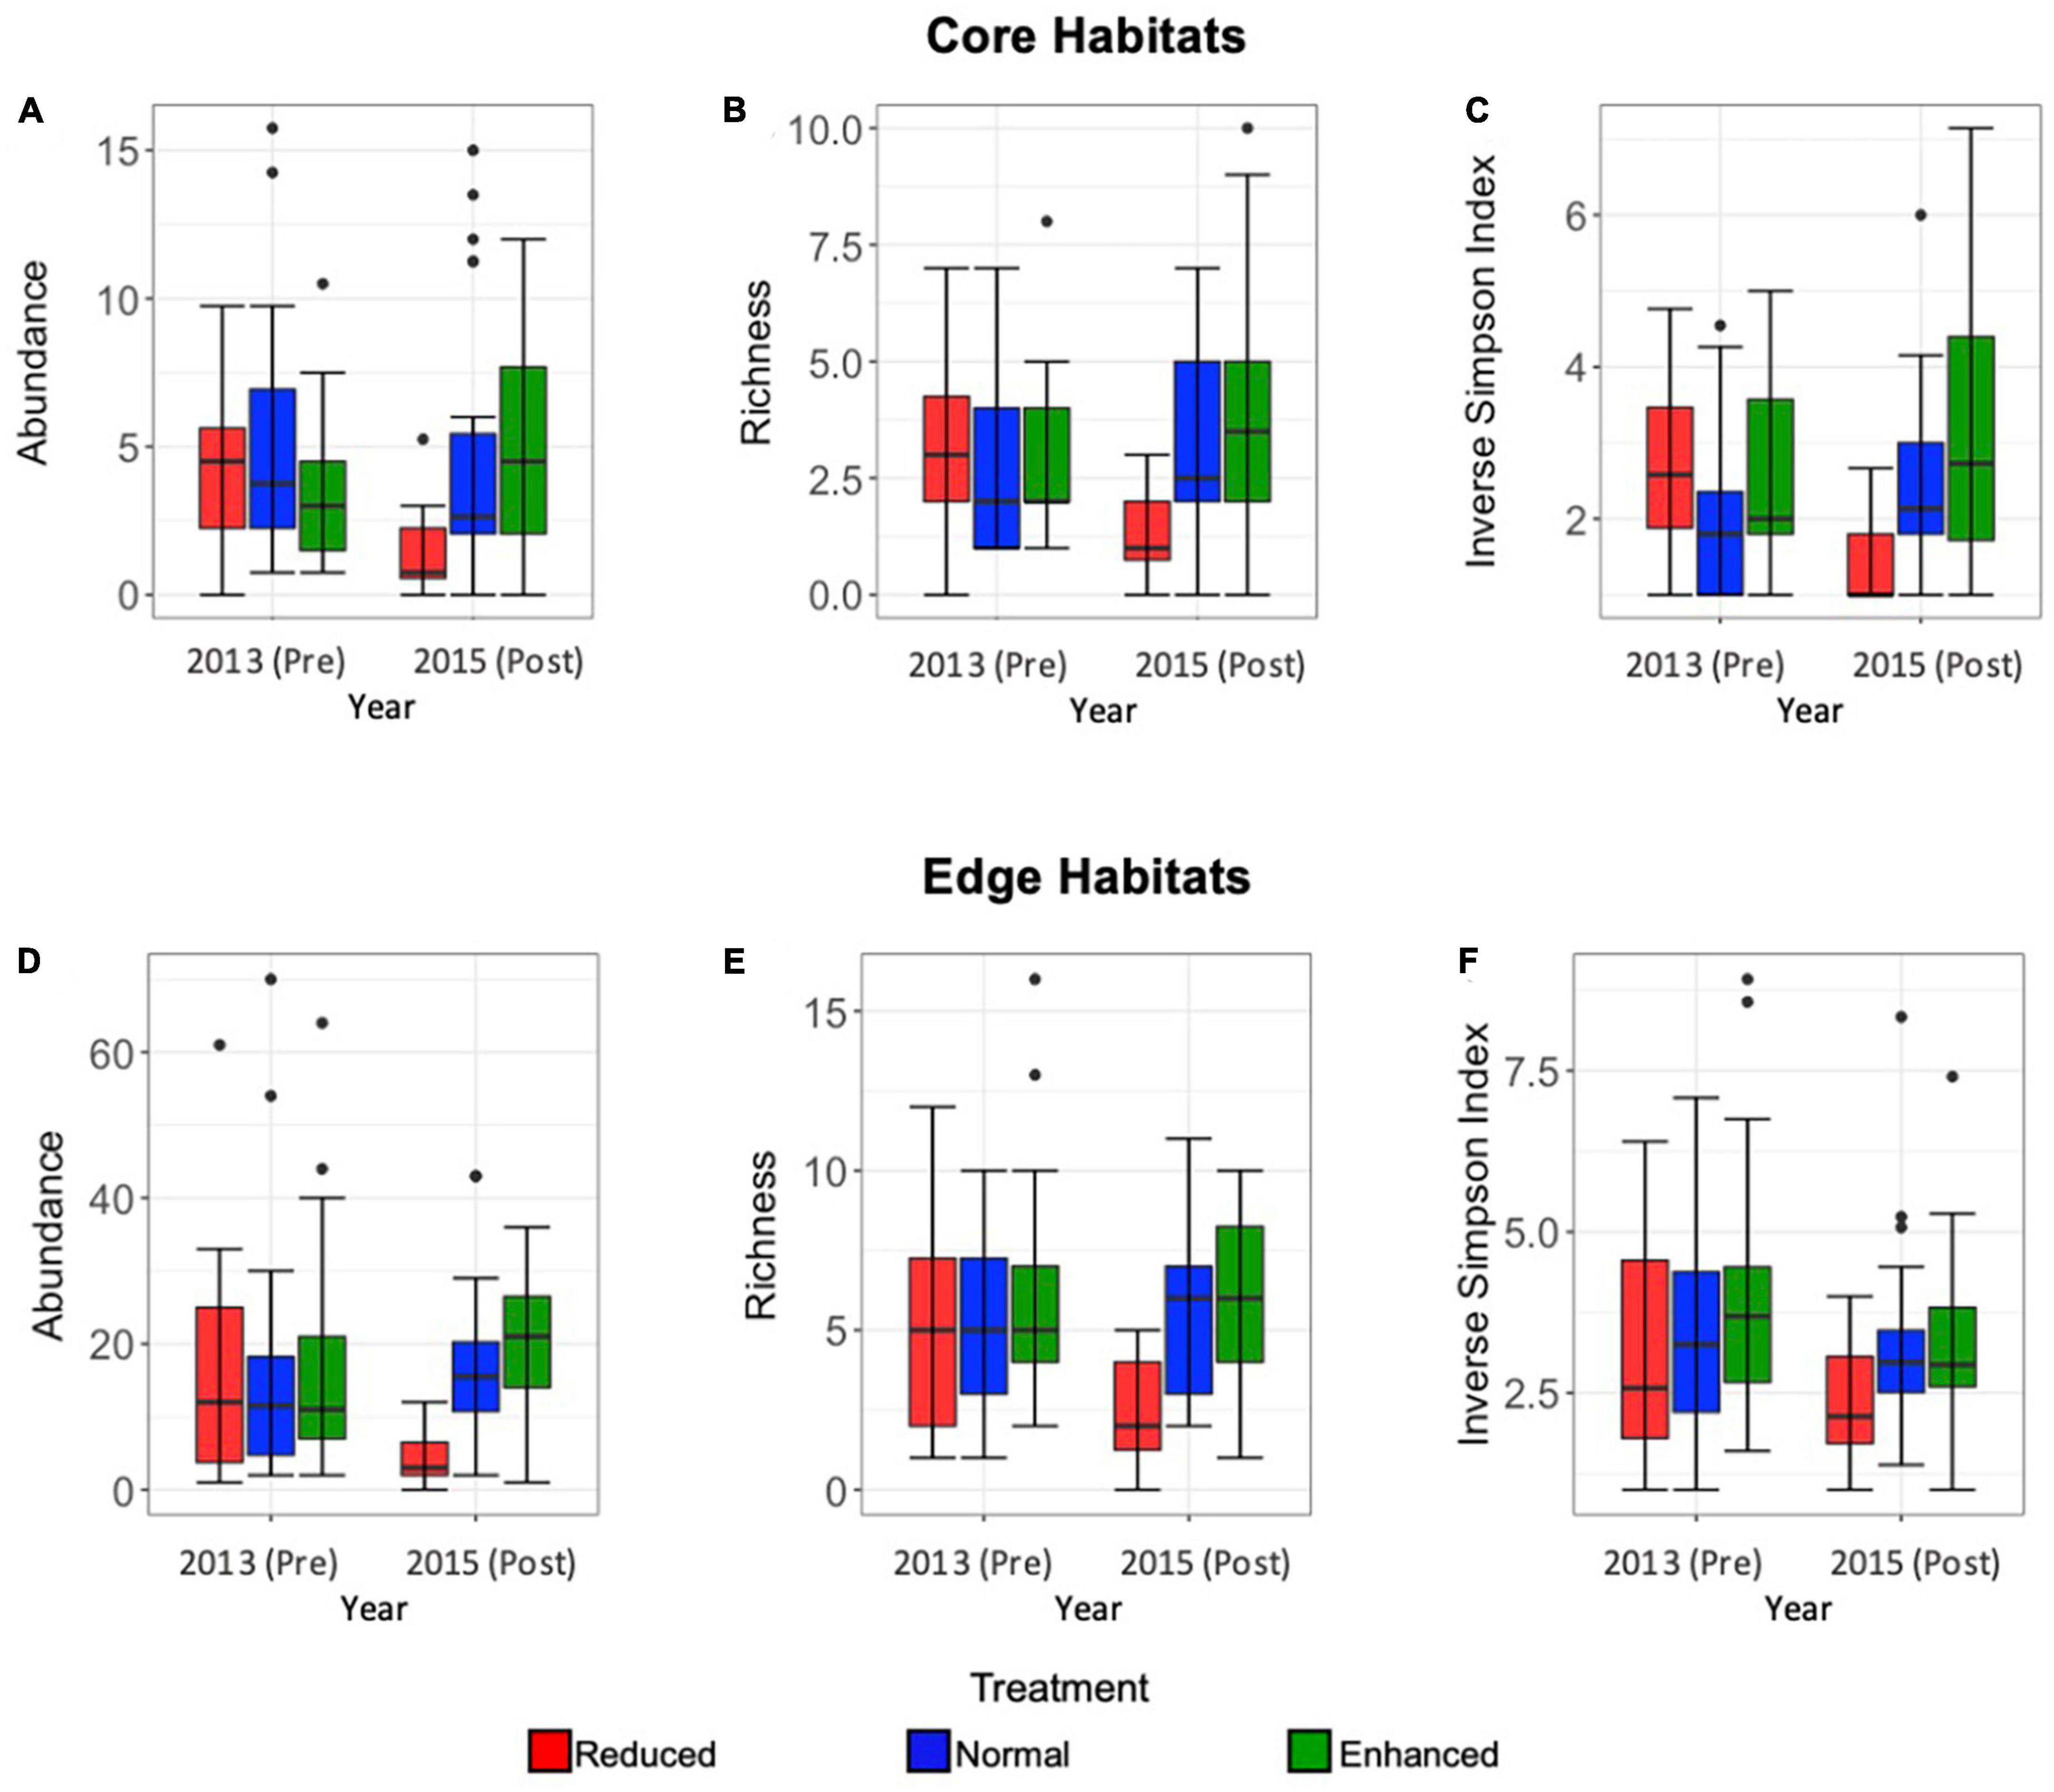
Figure 2. Box and whisker plots comparing Core habitat Lepidoptera mean abundance per transect (A), richness (at morphospecies level) (B), and inverse Simpson Index (C) in pre- (2013) and post- (2015) sites under Reduced (red), Normal (blue), and Enhanced (green) treatments, and Edge habitat Lepidoptera abundance (D), richness (at morphospecies level) (E), and inverse Simpson Index (F) in pre- and post-sites under Reduced (red), Normal (blue), and Enhanced (green) treatments over the long-term (2013–2015). Median, interquartile range, range, and outliers are given. Scales differ between Edge and Core plots.
Species richness was significantly affected by the interaction between year and treatment type, again indicating an effect of the experimental treatments (Core: Estimate = 0.209, SE = 0.038, p = < 0.001; Edge: Estimate = 0.17, SE = 0.054, p = 0.001), and year and treatment independently (Core: Estimate = −0.64, SE = 0.15, p = < 0.001; Edge: Estimate = −0.455, SE = 0.12, p = < 0.001; Core: Estimate = −3.63, SE = 0.90, p = < 0.001; Edge: Estimate = −2.21, SE = 0.75, p = 0.003). For both Core and Edge habitats, species richness was greater in pre-treatment 2013 sites, than in post treatment 2015 sites (Figures 2B, E). As seen for abundance, the nature of the effect varied by treatment. Species richness declined in 2015 after implementation of treatments for Reduced sites, whereas it increased in 2015 for Normal and Enhanced treatments (Figures 2B, E). In both Core and Edge habitats, the largest change in species richness was seen in Reduced treatments sites (Core: 18 species observed in 2013, 8 observed in 2015; Edge: 30 species observed in 2013, 18 observed in 2015).
The Inverse Simpson Index was significantly affected by the interaction between year and treatment in Core habitats, therefore indicating an effect of the experimental treatments (Estimate = 0.21, SE = 0.038, p = < 0.001), but this was not the case in Edge habitats (Estimate = 0.0001, SE = 0.036, p = 0.99). Similarly, the independent effects of year and treatment were significant in Core habitats (Estimate = −0.45, SE = 0.08, p = < 0.001; Estimate = −2.76, SE = 0.53, p = < 0.001, respectively), but not in Edge habitats (Estimate = −0.075, SE = 0.70, p = 0.28; Estimate = 0.13, SE = 0.49, p = 0.79, respectively) (Figures 2C, F). As with abundance and richness, the Inverse Simpson Index declined in 2015 after implementation of treatments for Reduced sites but increased in Normal and Enhanced Treatments in Core habitats (Figure 2C).
Long-term effects of treatment on community composition (2013-Pre and 2015-Post)
Across the 2 years and both Core and Edge habitats combined, 43% of the individuals found belonged to the family Nymphalidae and 22% to Satyridae, with all other families combined representing 35% of individuals (Supplementary Information 4). Different families dominated different habitat types: as a proportion of total abundance, Callidulidae and Pieridae were more common in Core habitats, while Satyridae and Nymphalidae dominated Edge habitats (Supplementary Information 5). Across both Core and Edge habitats, family community composition was significantly affected by the interaction between treatment type and pre-post year, therefore indicating an effect of the experimental treatments on family-level community composition (Interaction: R = 0.060, p = < 0.001, Interaction: R = 0.66, p = < 0.001, for Core and Edge, respectively; Supplementary Information 5). At the species level, the interaction between year and treatment type also had a significant effect for both Core and Edge habitats (Core: R = 0.088, p = < 0.001, Edge: R = 0.074, p = < 0.001) (Figure 3). In particular, percentage abundance of Lambrix stellifer noticeably increased after 2015-Post Enhanced treatment application in Core habitats, and E. hypermnestra increased after 2015-Post Reduced treatment in Core habitats, while the percentage abundance of Ypthima spp. increased after 2015-Post Enhanced treatment application in Edge habitats (Figure 3).
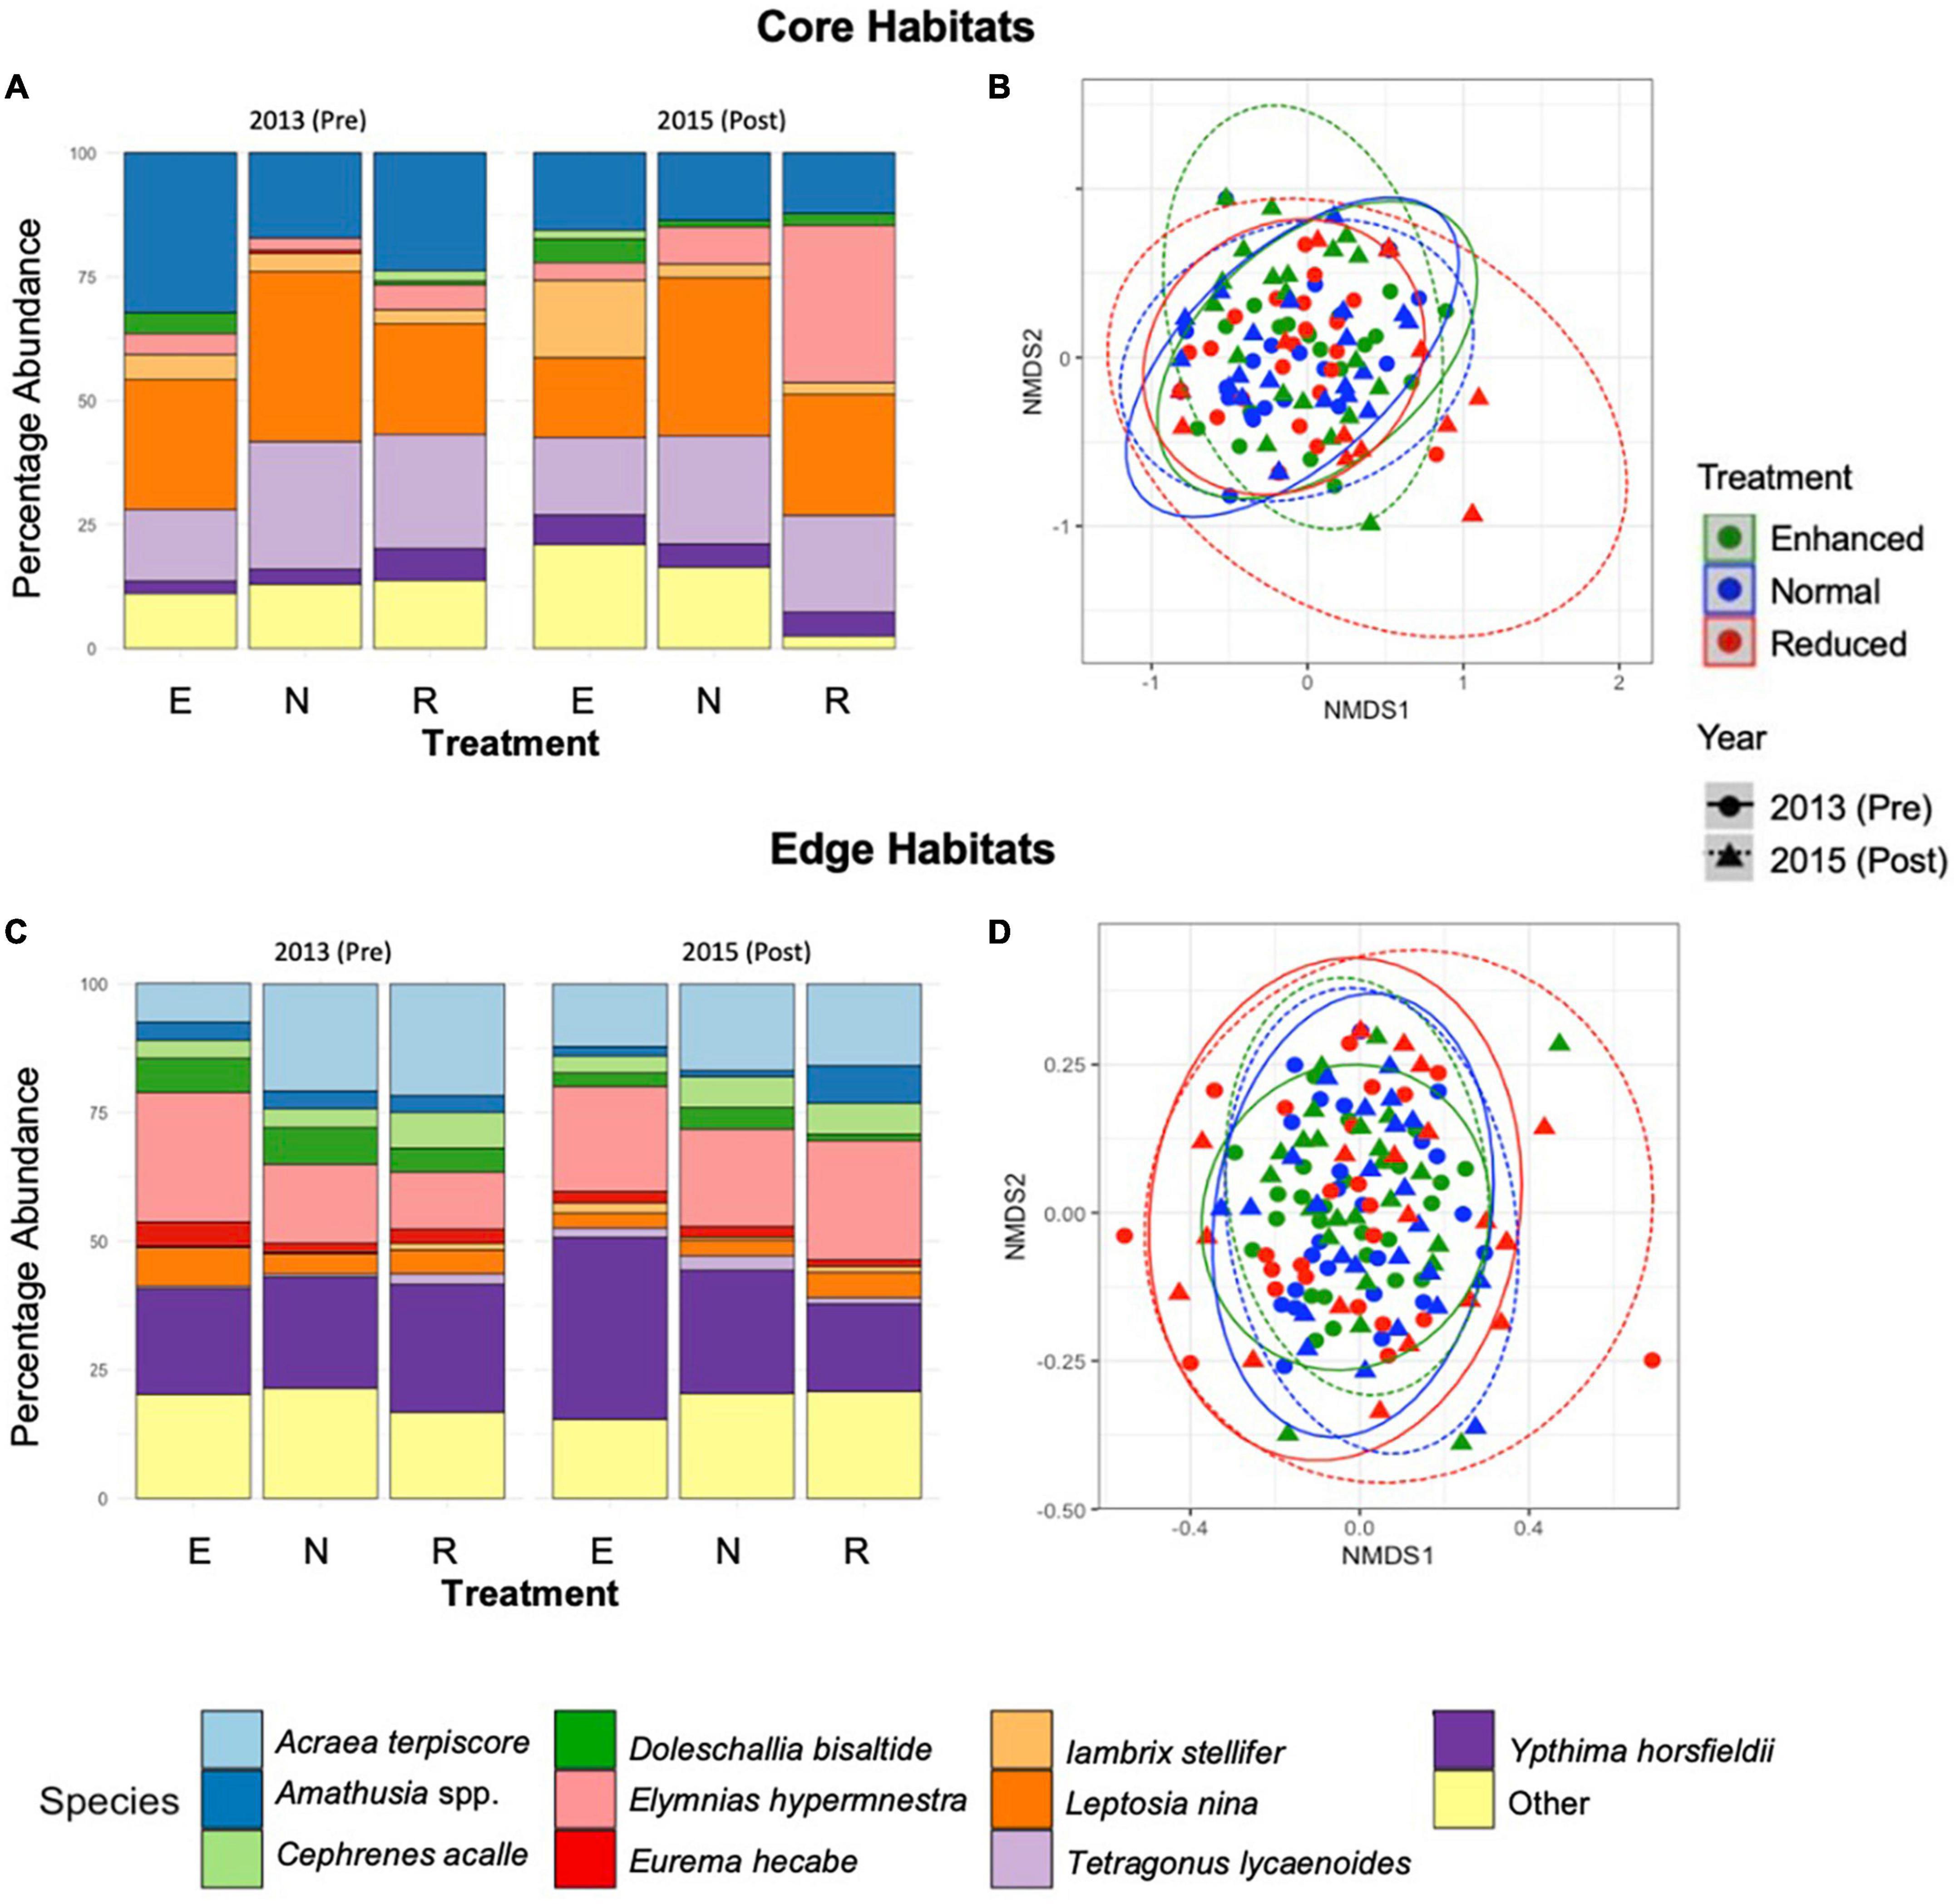
Figure 3. Stacked bar charts showing the percentage abundance by species for Core sites over the long-term (2013–2015), across the three treatment types (A) (E, Enhanced; N, Normal; R, Reduced treatment). Results of non-metric multidimensional scaling, showing the effects of year and treatment type on species composition of butterflies and day-flying moths in Core habitats (B). The same is shown for Edge habitats (C,D). Points are spherically grouped by plot type (2013 Reduced, 2013 Normal, 2013 Enhanced, 2015 Reduced, 2015 Normal, and 2015 Enhanced), based on a 98% confidence interval, using a Bray–Curtis dissimilarity matrix with 999 permutations (stress = 0.07).
Short-term effects of vegetation treatment (2014-Pre and 2014-Post)
A total of 584 individuals were found in the 2014 surveys: 301 immediately before treatment application, and 283 immediately after. In 2014-Pre surveys, 32 species were recorded within the Core and Edge habitats. In 2014-Post surveys, 30 species were recorded. Only four species had more than 50 individual observations (Callidulidae spp., Ypthima spp., L. nina, and E. hypermnestra) (Supplementary Information 4).
Abundance did not vary significantly with the interaction between immediate time period and treatment type in either Core or Edge habitats, indicating that there was no significant immediate effect of the herbicide application (Core: Estimate = −0.13, SE = 0.49, p = 0.81, Edge: Estimate = 0.78, SE = 0.56, p = 0.17). There was also no significant independent effect of time period or treatment type on abundance for either Core or Edge habitats (Time period: Estimate = 0.25, SE = 0.34, p = 0.48; Estimate = −0.28, SE = 0.40, p = 0.49; Treatment: Estimate = −0.19, SE = 0.36, p = 0.60; Estimate = −0.93, SE = 0.42, p = 0.22; for Core and Edge, respectively) (Figures 4A, D). Richness was significantly affected by the interaction between time period and treatment in Edge (Estimate = 0.87, SE = 0.35, p = 0.013), but not in Core habitats (Estimate = −0.35, SE = 0.49, p = 0.47). Richness declined in Edge Reduced treatments, but not in Normal treatments. There was a significant effect on species richness due to treatment type in Edge habitats, but not in Core habitats, and no significant effect was seen due to time period in either Core or Edge habitats (Edge treatment: Estimate = −0.83, SE = 0.29 p = 0.005; Core treatment: Estimate = −0.08, SE = 0.35 p = 0.81; Edge 2014-Pre 2014-Post: Estimate = −0.26, SE = 0.22, p = 0.25; Core 2014-Pre 2014-Post: Estimate = 0.31, SE = 0.33, p = 0.35) (Figures 4B, E).
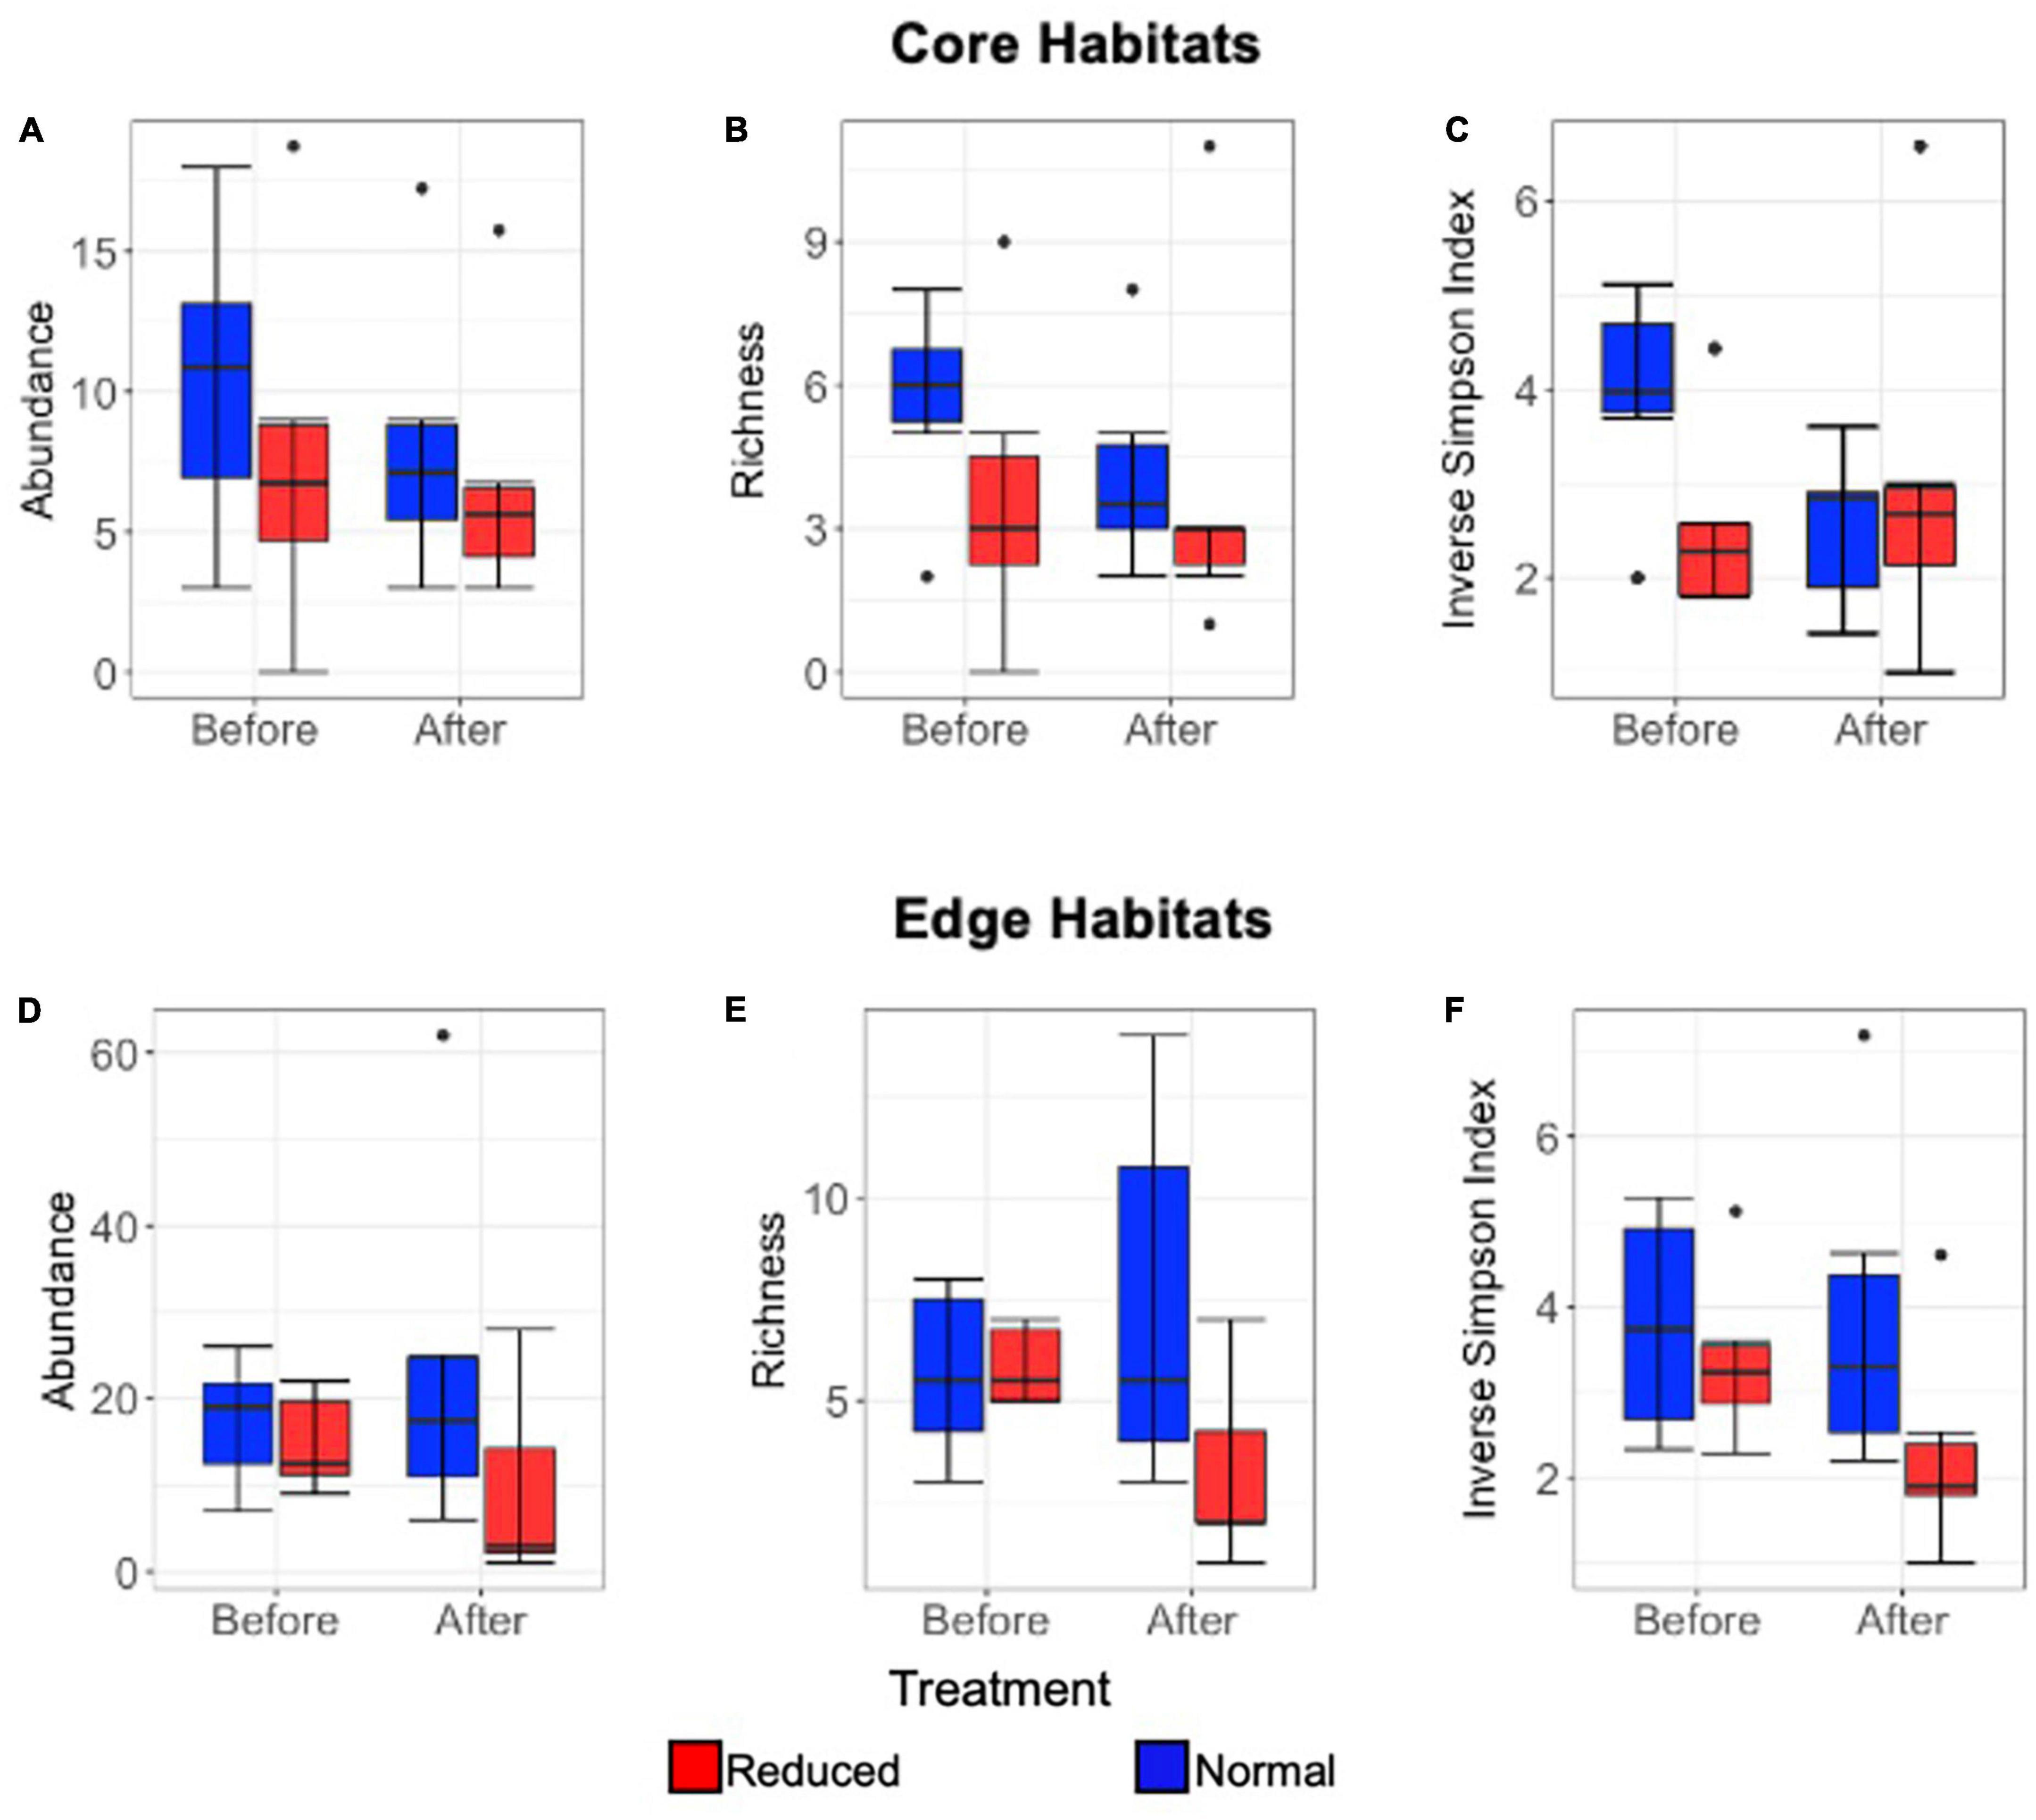
Figure 4. Box and whisker plots comparing short-term (2014 only) Lepidoptera mean abundance per transect (A), richness (to morphospecies level) (B), and inverse Simpson Index (C) immediately 2014-Pre and 2014-Post application of Reduced (red) and Normal (blue) treatments (A–C) in Core habitats, and in Edge habitats for mean abundance per transect (D), richness (to morphospecies level) (E), inverse Simpson Index (F). Median, interquartile range, range, and outliers are given.
The Inverse Simpson Index did not differ significantly with the interaction between time period and treatment type in either Core or Edge habitats, suggesting that there was no immediate effect of vegetation removal on this diversity measure (Core: Estimate = −0.59, SE = 0.48, p = 0.22; Edge: Estimate = 0.39, SE = 0.35, p = 0.26). There was also no significant independent effect of time period or treatment type in either Core or Edge habitats (Time period: Estimate = 0.44, SE = 0.31, p = 0.16; Estimate = −0.011, SE = 0.24, p = 0.96; Treatment: Estimate = 0.16, SE = 0.33, p = 0.62; Estimate = −0.51, SE = 0.27, p = 0.06; for Core and Edge, respectively) (Figures 4C, F).
Across combined Core and Edge 2014 surveys, 47% of the individuals belonged to the family Nymphalidae and 15% to Satyridae, with all other families combined representing 38% of individuals (Supplementary Information 6). The majority of Satyridae were found in Edge habitats, while Pieridae and Nymphalidae were more common in Core habitats. At a family level, no significant effect was seen with time period, treatment, or their interaction on community composition in either Core or Edge habitats (Core Treatment: R = −0.032, p = 0.64; Time period: R = −0.39, p = 0.69, Interaction: R = −0.108, p = 0.94, respectively; Edge Treatment: R = 0.012, p = 0.33; Time period: R = −0.03, p = 0.68, Interaction: R = −0.03, p = 0.66, respectively) (Supplementary Information 6). Similarly, at species level, there was no significant effect in Core nor Edge habitats with time period, treatment type, or their interaction (Core: Treatment: R = −0.07, p = 0.90; Time period: R = −0.003, p = 0.43, Interaction: R = −0.11, p = 0.93; Edge: Treatment: R = 0.003, p = 0.39; Time period: R = −0.01, p = 0.54, Interaction: R = 0.01, p = 0.37) (Figure 5). The effects on composition at a family level are found in Supplementary Information 6.
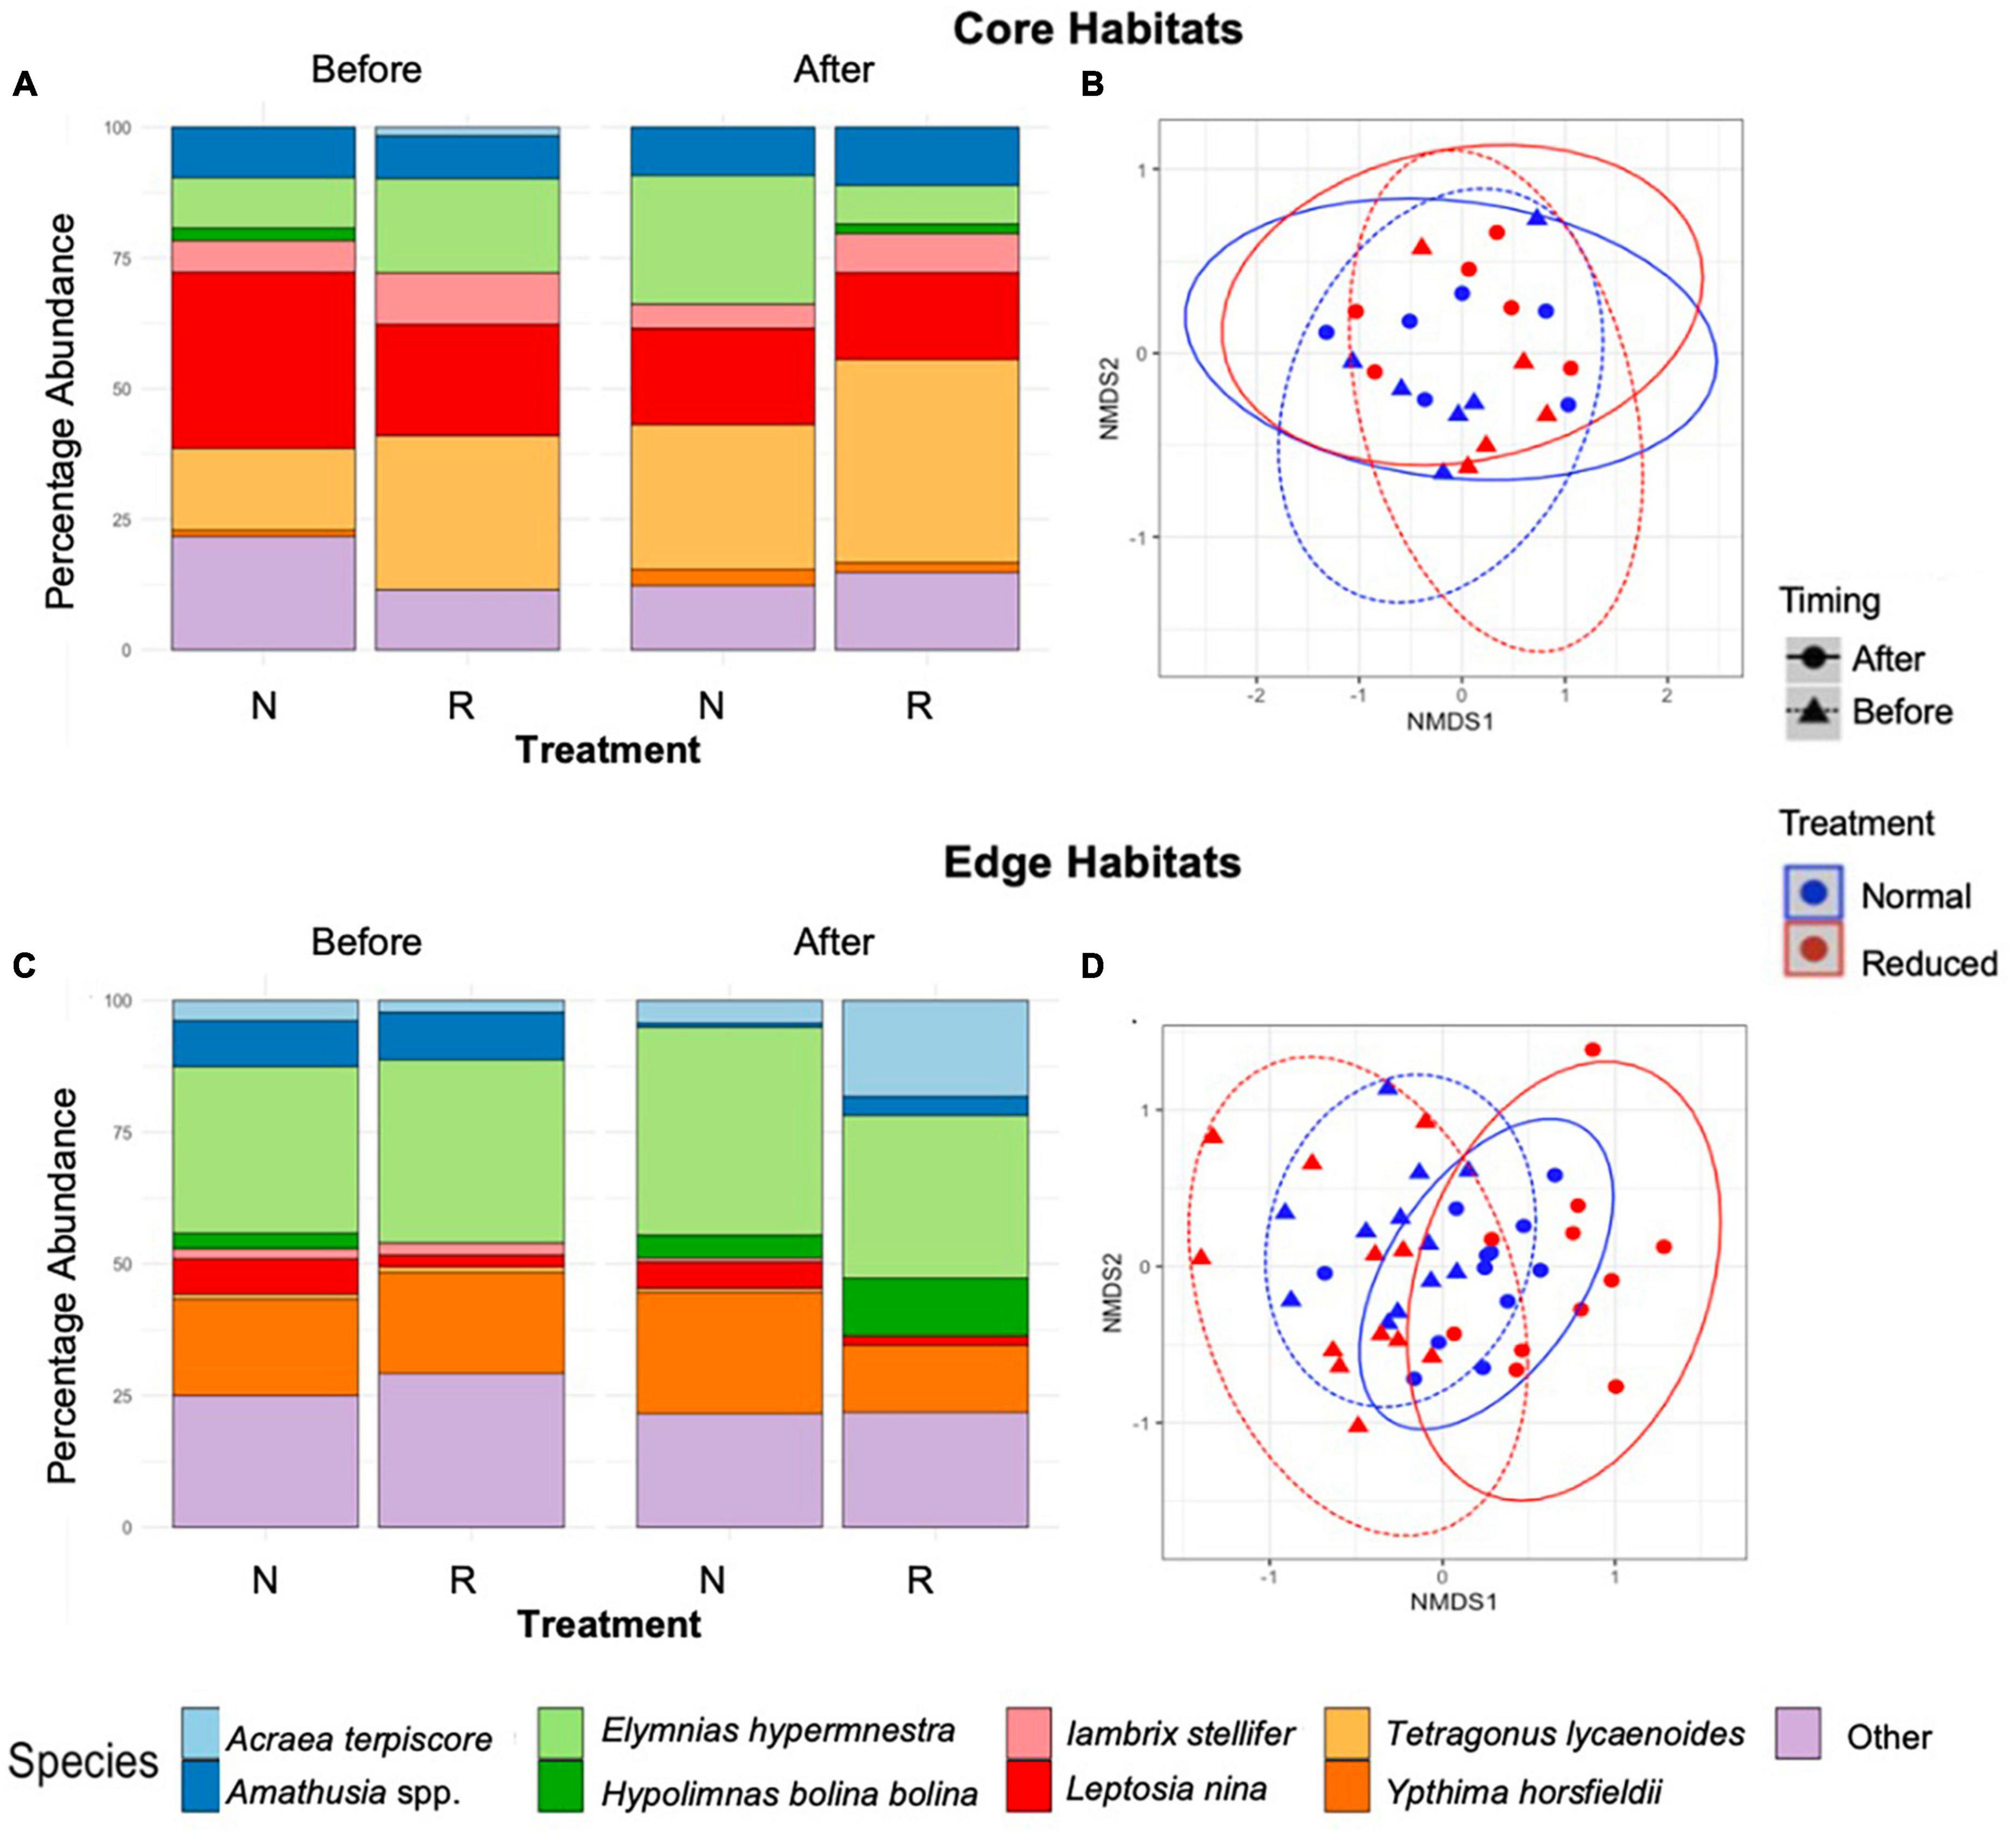
Figure 5. Stacked bar charts showing short-term (2014) percentage abundance by species for Core (A), and Edge (C) sites immediately before and after treatment implementation across the Normal (N) and Reduced (R) treatment types. Results of non-metric multidimensional scaling, showing the effects of time period and treatment type on species composition of butterflies and moths in Core (B) and Edge (D) habitats. Points are spherically grouped by plot type (Pre-treatment Reduced, Pre-treatment Normal, Pre-treatment Enhanced, and Pre-treatment Reduced), based on a 98% confidence interval, using a Bray–Curtis dissimilarity matrix with 999 permutations (stress = 0.09).
Discussion
Over the course of our study, we observed 55 species of butterflies and day-flying moths, from eight families. However, none of these species were reported as forest specialists in terms of preferred habitat in the literature (Corbet et al., 1978; Kunte, 2000). Over the long-term, Reduced vegetation plots (with the most intensive understory removal regime) had significantly lower abundance, species richness and evenness of Lepidoptera than Normal vegetation plots (medium levels of understory management) or Enhanced vegetation plots (least intensive understory management, with no herbicide and minimal manual cutting). The community composition was also affected by treatment. Differences between Enhanced and Normal treatments were less clear, with abundance, species richness, community evenness and composition tending to be similar in Normal and Enhanced plots. In some cases, the long-term effects of treatment were not consistent between Core and Edge sites. For example, although evenness differed with treatment in Core sites, there was a less marked difference in Edge. In contrast to long-term effects caused by changes in vegetation complexity, we recorded much less immediate impact over the short-term, with no significant difference in abundance or evenness recorded between treatments.
Lepidoptera community composition
Our study indicates that oil palm plantations can host a diverse and abundant population of Lepidoptera, albeit at notably reduced levels than native forests in Sumatra (Panjaitan et al., 2020). The number of species we observed was similar to comparative oil palm studies in the region (Purnamasari and Santosa, 2018 – 42 species, 5 families; Kwatrina et al., 2018 – 57 species, 5 families). The true number of species present may exceed this, as our transect methodology did not include recording species in the canopy. The community was dominated by Nymphalidae (1,127 individuals, 31% of total), the most numerous and varied family within Lepidoptera, and Satyridae (800 individuals, 22% of total), which are common in both forest and agricultural land (Vu, 2009). At a species level, those most represented (Amathusia phidippus, L. nina, Callidulidae spp., Ypthima spp., Acraea violae, and E. hypermnestra), are all common across Southeast Asia, reflecting findings of previous studies that oil palm biodiversity is dominated by common and widespread species (Estalita, 2012; Chahyadi and Bibas, 2016; Reiss-Woolever et al., 2023), highlighting the importance of conserving forests to ensure the preservation of forest-specialist species which are not found elsewhere, and are therefore in greater danger of population declines. No major pest species were found; although A. phidippus larvae do feed on oil palm fronds, they are not reported to reach pest levels in the study region.
This relatively high level of Lepidoptera biodiversity may have positive effects for both conservation and ecosystem functioning in oil palm. For example, diverse butterfly communities can contribute to wider taxonomic biodiversity through their role in the food chain as prey species (Janzen, 1987), and as pollinators of flowering plants (Bonebrake et al., 2010). This food-web-linkage increases the potential of Lepidoptera to support ecosystem services and functions beyond their individual contributions, thus enhancing their value to agricultural landscapes. As no pest species were found, our study indicates that relatively diverse and abundant Lepidoptera communities could be supported in oil palm without negative effects on yield. However, we note that most serious Lepidoptera pests in oil palm are nocturnal as adults, so this result should be tested for nocturnal assemblages.
Long-term effects (2013–2015) of understory treatment
Management regime had a significant effect on Lepidoptera abundance, richness, and evenness in the long-term surveys, indicating that plantation understory management decisions have a direct impact on plantation biodiversity. Consistently, the application of a Reduced vegetation treatment (a high level of chemical and manual understory removal) caused a marked decrease in abundance and species richness, and changes in community composition in day-flying Lepidoptera. A study carried out on the same plots and treatments, however, several weeks later, showed that Reduced habitats had less vegetation diversity and complexity than other treatments (Luke et al., 2020), confirming the effectiveness of BEFTA understory treatment regimes. As butterflies and moths rely on vegetation throughout their lifecycle as a larval food source, hatching site, basking site, and nectar source (Bonebrake et al., 2010), it is likely that reductions in local-scale habitat heterogeneity and plant cover are directly reducing butterfly populations, or their use of these areas in the plantation, over an extended period. This could be due to the direct effect of changes in vegetation, or indirect effects of changes in vegetation structure on the availability and characteristics of microclimates upon which butterflies rely. This finding reflects similar benefits of less intense understory management recorded in other taxonomic groups from the same plots, including soil macrofauna abundance and richness (Ashton-Butt et al., 2018) and ant abundance (Hood et al., 2020), as well as findings from similar studies in other regions (Nájera and Simonetti, 2010).
The composition of Lepidoptera communities was also significantly affected by understory treatment at both a family and species level, with Reduced treatment sites having a more variable community per plot, as well as differences in the abundance of some common species. The steep gradient seen in Reduced post-treatment plots indicated a lower evenness than in other habitats. These findings are likely to be due to the inhospitable nature of Reduced plots, which meant that fewer species were resident (and therefore at higher density), and most were transitory, as has been recorded for inhospitable habitats in other taxa (Savilaakso et al., 2014), and crops (Macfadyen et al., 2014). As a result, reduced treatment plots are likely to have few abundant species, but occasional recordings of transitory species as they move through. This would also explain the variable composition, steeper accumulation curves and steeper rank abundance curves we recorded in reduced plots, as these recordings are likely to be largely chance encounters, rather than reflecting a direct use of plot habitat by these butterflies.
In contrast to clear differences between Reduced plots and other treatments, there was much less of a difference between Enhanced and Normal treatments. However, overall Enhanced treatment plots did show a more marked increase in abundance and richness as a result of treatment than Normal plots. Similarly, Luke et al. (2020) found that Enhanced treatment plots had an increased number of “negative” plants (weeds which are deemed harmful to the ecosystem), than Normal treatment plots, perhaps indicating that it is differences in specific plant species that are driving the subtle differences in butterflies we recorded between Normal and Enhanced plots in this study. As the surveys were conducted over several seasons, it is less likely that individuals were using habitats as a temporary refuge, and more probable that the increase in abundance was due to an active choice of Enhanced treatment plots as preferred habitats.
While the direction of change depended on treatment type, the overall abundance and species richness decreased from 2013 to 2015. This decrease may be due to annual trends, weather patterns, or the broader effect of long-term treatment at plantation landscape scale (Fourcade et al., 2014; Grøtan et al., 2014). As average rainfall was higher in 2013 than in 2015, it may be that the greater rainfall supported more abundant communities through its effect on vegetation and other animal species and therefore community dynamics (Luke et al., 2020). The overall decrease may also be influenced by the decrease in butterfly abundance in 2015-Post Reduced treatment plots, with no increase in 2015-Post Enhanced sites sufficient to make up the net difference.
Short-term effect of vegetation treatment
In contrast to long-term impacts, in both Core and Edge habitats there was no short-term effect of vegetation treatment on butterfly abundance, evenness, or family or species level community composition immediately after application of treatments, and the common species recorded in 2014 surveys were similar to that of 2013 and 2015 surveys. However, richness did decline in Edge but not Core sites in Reduced vegetation plots. This may be due to the starting point of the plots; the originally low numbers in Core sites or higher initial complexity of vegetation in Edge sites may have resulted in a larger change in vegetation, and therefore significant immediate effect of spraying on butterflies, for Edge, but not Core habitats. These results indicate that butterflies are more affected by the change in vegetation structure, as larval or adult food sources, rather than the short-term chemical effects of herbicide spraying. Similarly, direct toxicity from herbicide application has not been seen in temperate butterfly surveys (Smart et al., 2000). However, research by Darras et al. (2019) observed higher arthropod biodiversity with manual than chemical clearing practice in oil palm, indicating that more research is needed on the direct effects of chemical application in oil palm on various taxa. The lack of short-term effect may also be due to the two-stage lifecycle of butterflies; while caterpillars are more likely to be directly affected by herbicide application (as their food source dies and they are less mobile), this will not have an immediately observable effect on adults. As a caveat to this finding, it should be noted that the 2014 surveys were conducted with a single transect walk, and therefore may have had reduced power to detect immediate effects. However, the lack of clear trends in our data makes it likely that a larger-scale study would return similar results.
Differences between Core and Edge habitats
In both the short and long-term surveys, Lepidoptera communities differed between Core and Edge habitats in their overall composition, as well as family and species level response to treatment. Across treatment types, Core habitats had proportionally more Callidulidae and fewer Satyridae than Edge habitats, which may be due to the increased access to water in the ditches bordering Edge habitats supporting Satyridae’s needs for moist environments (Corbet et al., 1978). At a species level, Edge habitats had markedly higher proportions of Ypthima spp. than Core habitats, suggesting that the plantation roads boarding Edge habitats may be acting similarly to forest gaps and riverbanks that are preferred by Ypthima spp. in forested landscapes (Hill et al., 2001; Laurance et al., 2014). Core habitats had greater abundance of Tetragonus lycaenoides and L. nina than Edge habitats, likely due to the species’ preferences for shady habitats and dense vegetation (Aluthwattha et al., 2017). Our findings demonstrate the value of both habitat types, and therefore landscape scape habitat heterogeneity, to support diverse Lepidoptera communities in oil palm.
The only significant short-term effects after vegetation treatment in 2014-Post plots were on species richness in Edge, but not Core, habitats. As Edge habitats are bordered by roads and ditches on one side (unlike Core habitats which are surrounded by palms on all sides), these Edge plots may be susceptible to higher foot traffic, greater exposure to the elements (e.g., wind, rain, and sun) or more chemical application during the spraying process, and are perhaps therefore uniquely affected by the Reduced treatment application. The distinction between treatment intensity may also be greater in Edge habitats since there is no buffer from drastic vegetation removal, as plots already lack vegetation on one of their four sides.
Conclusion and implications for management
Our study shows that understory management decisions can significantly affect Lepidoptera in oil palm plantations. Less intense management of vegetation led to a more abundant and diverse butterfly community; therefore, we suggest that plantation managers be encouraged to limit understory clearing and maintain habitat heterogeneity on both a local and landscape scale. We observed the most significant effects of treatment in Reduced vegetation habitats, which would suggest that having an intermediate level of spraying, as in Normal treatment sites, while not optimal, is still significantly more biodiversity-friendly than intense clearing. The lack of significant difference between Enhanced and Normal sites indicates that a hard “no-spray” guideline is not the only option to support butterfly friendly plantations. As oil palm yield was not significantly affected by understory management (Popkin et al., in review) in our sites, it suggests that such conservation-conscious management decisions can be taken without significantly sacrificing production.
As there were significant effects from vegetation treatment in the long-term, but not the short-term, manual and chemical removal of understory may have an equally negative effect on butterflies and should be considered similarly in sustainability guidelines, as it appears that vegetation changes, rather than direct chemical application, were driving changes in Lepidoptera communities. No significant pest species were found in our study, suggesting relaxed understory management may be implemented without negative effects on yield, although we highlight that it is important to also assess the effects of alternative understory management on nocturnal species. As Lepidoptera are a common indicator taxa for ecosystem health, due to their responsiveness to environmental changes, the higher butterfly presence in Enhanced treatment plots may also indicate wider biodiversity benefits. Reduced clearing, and therefore reduced herbicide application, may also have a positive effect on the wider environment through reduced run-off of chemicals. Therefore, encouraging such practices should be a high priority for interdisciplinary certification schemes such as the RSPO. Management practices may be further manipulated to ensure that understory heterogeneity is as beneficial as possible, by not only allowing understories to grow, but through planting diverse nectar sources and non-crop vegetation. Finally, to determine if findings are similar in smallholder plantations and emergent oil palm locations in other regions where native species composition and plantation practices may differ, and to ensure that there is no negative effect from such practices on yield, further research is required across a wider range of plantation types and regions.
Data availability statement
The datasets presented in this study can be found in online repositories. The names of the repository/repositories and accession number(s) can be found below: all raw data is available at the University of Cambridge Data Repository, https://doi.org/10.17863/CAM.96818.
Ethics statement
The manuscript presents research on animals that do not require ethical approval for their study.
Author contributions
VR-W led statistical analyses and writing of the manuscript, with SL and ET. J-PC, JS, WF, SP, and ET designed the study. AAKA, MN, Pujianto, DP, Soeprapto, Suhardi, RT, RW, TR, and RHW contributed to the sampling design and experimental protocols. ADA, JS, and ET collected the field data. VR-W, ADA, and ET identified and cataloged specimens from photographs. All authors approved the manuscript.
Funding
This work was funded by the Natural Environment Research Council (grant/award number: NE/P00458X/1), The Gates Cambridge Trust, The Isaac Newton Trust Cambridge, and Golden Agri Resources (GAR).
Acknowledgments
We thank RISTEK (Kementerian Riset dan Teknologi Republik Indonesia) for permission to establish the BEFTA Understory Vegetation Project and to conduct research in Indonesia (permit numbers 426/SIP/FRP/SM/XI/2012, 72/EXT/ SIP/FRP/SM/IX/2013, 44/EXT/SIP/FRP/SM/IX/2014, 354/SIP/ FRP/E5/Dit.KI/X/2016, 66/EXT/SIP/FRP/E5/Dit.KI/IX/2017,45/ EXT/SIP/FRP/E5/Dit.KI/X/2018,431/E5/E5.4/SIP/2019, 53/E5/ E5.4/SIP.EXT/2020, and 1/SIP.EXT/IV/FR/1/2022). We thank Pt Ivo Mas Tunggal and Golden Agri Resources, and Sinar Mas Agro Resources Technology Research Institute (SMARTRI) for allowing us to conduct research in their plantations, and we are grateful to the staff of SMARTRI for their help with fieldwork.
Conflict of interest
Co-authors with a Sinar Mas Agro Resources and Technology Research Institute (SMARTRI) affiliation were employed by SMARTRI, the research division of Golden Agri Resources (GAR), while research was conducted. SMARTRI and the University of Cambridge shared a Collaboration Agreement for this study that protects the intellectual property rights and data-use of all researchers involved in this study. This research is therefore a full collaboration between the University of Cambridge and GAR.
Publisher’s note
All claims expressed in this article are solely those of the authors and do not necessarily represent those of their affiliated organizations, or those of the publisher, the editors and the reviewers. Any product that may be evaluated in this article, or claim that may be made by its manufacturer, is not guaranteed or endorsed by the publisher.
Supplementary material
The Supplementary Material for this article can be found online at: https://www.frontiersin.org/articles/10.3389/ffgc.2023.1205744/full#supplementary-material
References
Aluthwattha, S. T., Harrison, R. D., Ranawana, K. B., Xu, C., Lai, R., and Chen, J. (2017). Does spatial variation in predation pressure modulate selection for aposematism? Ecol. Evol. 7, 7560–7572. doi: 10.1002/ece3.3221
Ashton-Butt, A., Aryawan, A. A. K., Hood, A. S. C., Naim, M., Purnomo, D., and Suhardi, et al. (2018). Understory vegetation in oil palm plantations benefits soil biodiversity and decomposition rates. Front. For. Glob. Change 1:10. doi: 10.3389/ffgc.2018.00010
Azhar, B., Saadun, N., Puan, C. L., Kamarudin, N., Aziz, N., Nurhidayu, S., et al. (2015). Promoting landscape heterogeneity to improve the biodiversity benefits of certified palm oil production: Evidence from Peninsular Malaysia. Global Ecol. Conserv. 3, 553–561. doi: 10.1016/j.gecco.2015.02.009
Bates, D., Mächler, M., Bolker, B., and Walker, S. (2015). Fitting linear mixed-effects models using lme4. J. Stat. Softw. 67, 1–48. doi: 10.18637/jss.v067.i01
Bonebrake, T., Ponisio, L., Boggs, C., and Ehrlich, P. (2010). More than just indicators: A review of tropical butterfly ecology and conservation. Biol. Conserv. 143, 1831–1841. doi: 10.1016/j.biocon.2010.04.044
Bonhommeau, S., Dubroca, L., Le Pape, O., Barde, J., Kaplan, D. M., Chassot, E., et al. (2013). Eating up the world’s food web and the human trophic level. Proc. Natl. Acad. Sci. U.S.A. 110, 20617–20620. doi: 10.1073/pnas.1305827110
Chahyadi, E., and Bibas, E. (2016). Jenis-jenis kupu-kupu (Sub Ordo Rhopalocera) yang terdapat di Kawasan Hapanasan, Kabupaten Rokan Hulu, Provinsi Riau. J. Riau Biol. 1, 50–56.
Corbet, A. S., Pendlebury, H. M., van der Poorten, G. M., and van der Poorten, N. E. (1978). Butterflies of the Malay Peninsula. Kuala Lumpur: Southdene.
Darras, K. F. A., Corre, M. D., Formaglio, G., Tjoa, A., Potapov, A., Brambach, F., et al. (2019). Reducing fertilizer and avoiding herbicides in oil palm plantations—ecological and economic valuations. Front. For. Glob. Change 2:65. doi: 10.3389/ffgc.2019.00065
Dislich, C., Keyel, A. C., Salecker, J., Kisel, Y., Meyer, K. M., Auliya, M., et al. (2017). A review of the ecosystem functions in oil palm plantations, using forests as a reference system. Biol. Rev. 92, 1539–1569. doi: 10.1111/brv.12295
Dowle, M., Srinivasan, A., Gorecki, J., Chirico, M., Stetsenko, P., Short, T., et al. (2021). data.table: Extension of “data.frame.”
Estalita, R. S. (2012). Kelimpahan dan Keanekaragaman Spesies Kupu-Kupu (Lepidoptera; Rhopalocera) Pada Berbagai Tipe Habitat di Hutan Kota Muhammad Sabki Kota Jambi The Richness and Diversity of Butterflies (Lepidoptera; Rhopalocera) in the Urban Forest of Muhammad Sabki, Jambi Province, Indonesia. Biospecies 5, 40–48.
FAO (2019). Food and Agriculture Organization of the United Nations. Rome: FAOSTAT Statistical Database.
FAO (2020). Food and Agriculture Organization of the United Nations. Rome: FAOSTAT Statistical Database.
Fitzherbert, E. B., Struebig, M. J., Morel, A., Danielsen, F., Brühl, C. A., Donald, P. F., et al. (2008). How will oil palm expansion affect biodiversity? Trends Ecol. Evol. 23, 538–545. doi: 10.1016/j.tree.2008.06.012
Fourcade, Y., Engler, J. O., Rödder, D., and Secondi, J. (2014). Mapping species distributions with MAXENT using a geographically biased sample of presence data: A performance assessment of methods for correcting sampling bias. PLoS One 9:e97122. doi: 10.1371/journal.pone.0097122
Foster, W. A., Snaddon, J. L., Advento, A. D., Agung, A. A., Barclay, H., Caliman, J. P., et al. (2014). The Biodiversity and Ecosystem Function in Tropical Agriculture (BEFTA) project. Planter 90, 581–591.
Foster, W. A., Snaddon, J. L., Turner, E. C., Fayle, T. M., Cockerill, T. D., Ellwood, M. D. F., et al. (2011). Establishing the evidence base for maintaining biodiversity and ecosystem function in the oil palm landscapes of South East Asia. Philos. Trans. R. Soc. B Biol. Sci. 366, 3277–3291. doi: 10.1098/rstb.2011.0041
Grøtan, V., Lande, R., Chacon, I., and Devries, P. (2014). Seasonal cycles of diversity and similarity in a Central American rainforest butterfly community. Ecography 37, 509–516. doi: 10.1111/ecog.00635
Hahn, M., and Brühl, C. A. (2016). The secret pollinators: An overview of moth pollination with a focus on Europe and North America. Arthropod Plant Interact. 10, 21–28. doi: 10.1007/s11829-016-9414-3
Hill, J. K., Thomas, C. D., Fox, R., Telfer, M. G., Willis, S. G., Asher, J., et al. (2001). Impacts of landscape structure on butterfly range expansion. Ecol. Lett. 4, 313–332.
Hood, A. S. C., Advento, A. D., Stone, J., Fayle, T. M., Fairnie, A. L. M., Waters, H. S., et al. (2020). Removing understory vegetation in oil palm agroforestry reduces ground-foraging ant abundance but not species richness. Basic Appl. Ecol. 48, 26–36. doi: 10.1016/j.baae.2020.07.002
Hood, A. S. C., Aryawan, A. A. K., Advento, A. D., Purnomo, D., Wahyuningsih, R., Luke, S. H., et al. (2019). Understory vegetation in oil palm plantations promotes leopard cat activity, but does not affect rats or rat damage. Front. For. Glob. Change 2:51. doi: 10.3389/ffgc.2019.00051
Hsieh, T. C., Ma, K. H., and Chao, A. (2020). iNEXT: Interpolation and Extrapolation for Species Diversity.
iNaturalist (2020). iNaturalist.org web application. Available online at: http://www.inaturalist.org (accessed February 2020).
Janzen, D. (1987). Insect diversity of a Costa Rican dry forest: Why keep it, and how? Biol. J. Linn. Soc. 30, 343–356.
Koh, L. P., and Wilcove, D. S. (2008). Is oil palm agriculture really destroying tropical biodiversity? Conserv. Lett. 1, 60–64. doi: 10.1111/j.1755-263X.2008.00011.x
Kunte, K. (2000). Butterflies of Peninsular India. Hyderabad: Indian Academy of Sciences, Bangalore, University Press.
Kwatrina, R., Santosa, Y., Bismark, M., and Santoso, N. (2018). Ecological impacts of oil-palm plantation on butterfly and bird species diversity. J. Manaj. Hutan Trop. J. Trop. For. Manag. 24, 23–31. doi: 10.7226/jtfm.24.1.23
Laurance, W. F., Sayer, J., and Cassman, K. G. (2014). Agricultural expansion and its impacts on tropical nature. Trends Ecol. Evol. 29, 107–116. doi: 10.1016/j.tree.2013.12.001
Luke, S. H., Advento, A. D., Aryawan, A. A. K., Adhy, D. N., Ashton-Butt, A., Barclay, H., et al. (2020). Managing oil palm plantations more sustainably: Large-scale experiments within the Biodiversity and Ecosystem Function in Tropical Agriculture (BEFTA) programme. Front. For. Glob. Change 2:75. doi: 10.3389/ffgc.2019.00075
Luke, S. H., Purnomo, D., Advento, A. D., Aryawan, A. A. K., Naim, M., Pikstein, R. N., et al. (2019). Effects of understory vegetation management on plant communities in oil palm plantations in Sumatra, Indonesia. Front. For. Glob. Change 2:33. doi: 10.3389/ffgc.2019.00033
Luskin, M. S., and Potts, M. D. (2011). Microclimate and habitat heterogeneity through the oil palm lifecycle. Basic Appl. Ecol. 12, 540–551. doi: 10.1016/j.baae.2011.06.004
Macfadyen, S., Hardie, D. C., Fagan, L., Stefanova, K., Perry, K. D., DeGraaf, H. E., et al. (2014). Reducing insecticide use in broad-acre grains production: An australian study. PLoS One 9, 89–119. doi: 10.1371/journal.pone.0089119
Nájera, A., and Simonetti, J. A. (2010). Can oil palm plantations become bird friendly? Agrofor. Syst. 80, 203–209. doi: 10.1007/s10457-010-9278-y
Öckinger, E., and Smith, H. G. (2006). Landscape composition and habitat area affects butterfly species richness in semi-natural grasslands. Oecologia 149, 526–534. doi: 10.1007/s00442-006-0464-6
Oksanen, J., Blanchet, F. G., Friendly, M., Kindt, R., Legendre, P., McGlinn, D., et al. (2020). Vegan community ecology package version 2.5-7 November 2020.
Panjaitan, R., Drescher, J., Buchori, D., Peggie, D., Harahap, I. S., Scheu, S., et al. (2020). Diversity of butterflies (Lepidoptera) across rainforest transformation systems in Jambi, Sumatra, Indonesia. Biodivers. J. Biol. Divers. 21, 5119–5127. doi: 10.13057/biodiv/d211117
Pashkevich, M. D., Aryawan, A. A. K., Luke, S. H., Dupérré, N., Waters, H. S., Caliman, J.-P., et al. (2021). Assessing the effects of oil palm replanting on arthropod biodiversity. J. Appl. Ecol. 58, 27–43. doi: 10.1111/1365-2664.13749
Pollard, E., and Yates, T. J. (1993). Monitoring butterflies for ecology and conservation: The British butterfly monitoring scheme, conservation biology. Netherlands: Springer.
Purnamasari, I., and Santosa, Y. (2018). Butterfly diversity on different types of land cover in oil palm plantations (Case study: PT. AMR, Central Kalimantan, Indonesia). AIP Conf. Proc. 2019:040009. doi: 10.1063/1.5061879
R Core Team (2020). R: A language and environment for statistical computing. Vienna: R Foundation for Statistical Computing.
Reiss-Woolever, V. J., Dwi Advento, A., Aryawan, A. A. K., Caliman, J.-P., Foster, W. A., Naim, M., et al. (2023). Habitat heterogeneity supports day-flying Lepidoptera in oil palm plantations. J. Trop. Ecol. 39, 1–11. doi: 10.1017/S0266467423000111
Reiss-Woolever, V. J., Luke, S. H., Stone, J., Shackelford, G. E., and Turner, E. C. (2021). Systematic mapping shows the need for increased socio-ecological research on oil palm. Environ. Res. Lett. 16:063002. doi: 10.1088/1748-9326/abfc77
Roundtable of Sustainable Palm Oil [RSPO] (2018). Principles and Criteria for the Productino of Sustainable Palm Oil. Geneva: Roundtable of Sustainable Palm Oil.
Saravanan, L., Kalidas, P., Phanikumar, T., Dwarakakumar, D., Gupta, A., and Arunkumar, R. (2020). Life history, phenology, host range and natural enemies of Acria meyricki Shashank and Ramamurthy (Lepidoptera: Depressariidae): An emerging defoliator of oil palm, Elaeis guineenis Jacq. In India. Phytoparasitica 48, 427–454. doi: 10.1007/s12600-020-00806-7
Savilaakso, S., Garcia, C., Garcia-Ulloa, J., Ghazoul, J., Groom, M., Guariguata, M. R., et al. (2014). Systematic review of effects on biodiversity from oil palm production. Environ. Evid. 3:4. doi: 10.1186/2047-2382-3-4
Scharlemann, J. P. W., and Laurance, W. F. (2008). How green are biofuels? Science 319, 43–44. doi: 10.1126/science.1153103
Smart, S. M., Firbank, L. G., Bunce, R. G. H., and Watkins, J. W. (2000). Quantifying changes in abundance of food plants for butterfly larvae and farmland birds. J. App. Ecol. 37, 398–414. doi: 10.1046/j.1365-2664.2000.00508.x
Tao, H.-H., Slade, E. M., Willis, K. J., Caliman, J.-P., and Snaddon, J. L. (2016). Effects of soil management practices on soil fauna feeding activity in an Indonesian oil palm plantation. Agric. Ecosyst. Environ. 218, 133–140. doi: 10.1016/j.agee.2015.11.012
Teuscher, M., Gérard, A., Brose, U., Buchori, D., Clough, Y., Ehbrecht, M., et al. (2016). Experimental biodiversity enrichment in oil-palm-dominated landscapes in Indonesia. Front. Plant Sci. 7:1538. doi: 10.3389/fpls.2016.01538
Thomas, J. A. (2005). Monitoring change in the abundance and distribution of insects using butterflies and other indicator groups. Philos. Trans. R. Soc. B Biol. Sci. 360, 339–357. doi: 10.1098/rstb.2004.1585
USDA (2020). U.S. Department of Agriculture Agricultural Research Service. Washington, DC: FoodData Central Database.
Vijay, V., Pimm, S. L., Jenkins, C. N., and Smith, S. J. (2016). The impacts of oil palm on recent deforestation and biodiversity loss. PLoS One 11:e0159668. doi: 10.1371/journal.pone.0159668
Vu, L. V. (2009). Diversity and similarity of butterfly communities in five different habitat types at Tam Dao National Park, Vietnam. J. Zool. 277, 15–22. doi: 10.1111/j.1469-7998.2008.00498.x
Wahid, M. B., Abdullah, S. N. A., and Henson, I. E. (2005). Oil palm — achievements and potential. Plant Prod. Sci. 8, 288–297. doi: 10.1626/pps.8.288
Wang, Y., Naumann, U., Wright, S., and Warton, D. (2012). mvabund–an R package for model-based analysis of multivariate abundance data. Methods Ecol. Evol. 3, 471–474.
Wickham, H. (2007). Reshaping data with the reshape package. J. Stat. Softw. 21, 1–20. doi: 10.18637/jss.v021.i12
Wickham, H., Averick, M., Bryan, J., Chang, W., McGowan, L. D., François, R., et al. (2019). Welcome to the tidyverse. J. Open Source Softw. 4:1686. doi: 10.21105/joss.01686
Wickham H., François R., Henry L., Müller K. and RStudio (2021). dplyr: A grammar of data manipulation.
Wilcove, D. S., Giam, X., Edwards, D. P., Fisher, B., and Koh, L. P. (2013). Navjot’s nightmare revisited: Logging, agriculture, and biodiversity in Southeast Asia. Trends Ecol. Evol. 28, 531–540. doi: 10.1016/j.tree.2013.04.005
Keywords: agricultural inputs, herbicides, invertebrate biodiversity, Lepidoptera, palm oil, sustainable agriculture, tropical agriculture, understory vegetation
Citation: Reiss-Woolever VJ, Advento AD, Aryawan AAK, Caliman J-P, Foster WA, Naim M, Pujianto, Purnomo D, Soeprapto, Suhardi, Tarigan RS, Wahyuningsih R, Rambe TDS, Ps S, Widodo RH, Luke SH, Snaddon JL and Turner EC (2023) Understory vegetation supports more abundant and diverse butterfly communities in oil palm plantations. Front. For. Glob. Change 6:1205744. doi: 10.3389/ffgc.2023.1205744
Received: 14 April 2023; Accepted: 31 July 2023;
Published: 17 August 2023.
Edited by:
Selva Dhandapani, University of Reading, United KingdomReviewed by:
Amy-Marie Gilpin, Western Sydney University, AustraliaLois Kinneen, University of Reading, United Kingdom
Copyright © 2023 Reiss-Woolever, Advento, Aryawan, Caliman, Foster, Naim, Pujianto, Purnomo, Soeprapto, Suhardi, Tarigan, Wahyuningsih, Rambe, Ps, Widodo, Luke, Snaddon and Turner. This is an open-access article distributed under the terms of the Creative Commons Attribution License (CC BY). The use, distribution or reproduction in other forums is permitted, provided the original author(s) and the copyright owner(s) are credited and that the original publication in this journal is cited, in accordance with accepted academic practice. No use, distribution or reproduction is permitted which does not comply with these terms.
*Correspondence: Valentine Joy Reiss-Woolever, vjr30@cam.ac.uk