Dynamic Change of Vegetation Index and Its Influencing Factors in Alxa League in the Arid Area
 Peng Zhou
 Dongxue Zhao4*
  Xiao Liu
 Linghua Duo
 Bao-Jie He
- 1School of Surveying and Land Information Engineering, Henan Polytechnic University, Jiaozuo, China
- 2Smart City Research Institute of Chongqing University in Liyang, Chongqing University, Liyang, China
- 3State Environment Protection Key Laboratory of Satellite Remote Sensing, Aerospace Information Research Institute, Chinese Academy of Sciences, Beijing, China
- 4Centre for Crop Science, Queensland Alliance for Agriculture and Food Innovation, The University of Queensland, Gatton, QLD, Australia
- 5School of Architecture, South China University of Technology, Guangzhou, China
- 6Department of Urban Planning and Design, Faculty of Architecture, The University of Hong Kong, Pok Fu Lam, Hong Kong SAR, China
- 7Design and Research Institute Co., Ltd., South China University of Technology, Guangzhou, China
- 8State Key Laboratory of Subtropical Building Science, South China University of Technology, Guangzhou, China
- 9Jiangxi Ecological Civilization Construction System Research Center, East China University of Technology, Nanchang, China
- 10Faculty of Geomatics, East China University of Technology, Nanchang, China
- 11Key Laboratory of Mine Environmental Monitoring and Improving Around Poyang Lake, Ministry of Natural Resources, Nanchang, China
- 12Centre for Climate–Resilient and Low–Carbon Cities, School of Architecture and Urban Planning, Chongqing University, Chongqing, China
- 13Key Laboratory of New Technology for Construction of Cities in Mountain Area, Chongqing University, Ministry of Education, Chongqing, China
While there have been various studies on global vegetation dynamics, limited studies have been conducted to understand vegetation changes in arid areas. Vegetation distribution patterns can be affected by multiple factors, so understanding their interactions can help improve the capability of predicting future vegetation dynamics. This study, therefore, analyzed the dynamic vegetation changes in Alxa League, China, using the Normalized Difference Vegetation Index (NDVI) dataset (2000–2019), with the consideration of land cover types, digital elevation model, air temperature, precipitation, soil moisture, total evaporation, and air quality. The results show that the NDVI in Alxa League is small. Before 2012, the NDVI value fluctuated, while after 2012, the NDVI value dropped sharply and then slowly recovered after 2015. High NDVI values were found in areas with high and frequent human activities (city centers). The NDVI in the northwest region showed a slight degradation trend, and the southeast showed a slight improvement trend. According to the land cover type analysis, the NDVI value was the largest when the land cover type was tree cover, and the NDVI value was the smallest when the land cover type was bare/sparse vegetation. Alxa League was dominated by a bare/sparse vegetation distribution. The terrain analysis indicates that when the height was between 1800 and 3492 m, the NDVI value was the highest, and high NDVI values were mainly distributed in the area with a slope > 25°. When the slope was flat, the NDVI value was the smallest. Considering climate factors, the NDVI was negatively correlated with air temperature, precipitation, soil moisture, and total evaporation in space, and only precipitation and soil moisture were positively correlated in time. Moreover, the population size has a strong positive correlation with the NDVI in this area. The monthly variation of the NDVI and absorbable particulate matter (PM10) was negatively correlated, i.e., strongly negatively correlated in spring, summer, and autumn, but only weakly positively correlated in winter. The seasonal variation of the NDVI was as follows: summer > autumn > spring > winter, and the seasonal variation of PM10 was spring > winter > summer > autumn. The interannual variation of the NDVI and PM10 was positively correlated. This suggests that the absorbable particulate matter (PM10) may be an essential factor for the normalized vegetation index to underestimate the dynamic changes of vegetation in arid regions. This study provides a theoretical basis for the dynamic changes of vegetation in the dry Alxa League.
Introduction
Vegetation is important for global environmental changes (Latif et al., 2019), for it bridges the atmosphere, soil, water, and soil (Leanne et al., 2020). In particular, vegetation plays a pivotal role in water conservation, soil erosion prevention, wind and sand fixation, and ecosystem stability (Zhao et al., 2020; Kooch et al., 2022; Mor-Mussery et al., 2022). However, land degradation is aggravating, and especially arid ecosystems are being stressed by increasing demands on natural resources and increasing extreme weather. More frequent and severe droughts are expected to occur in the 21st century, especially in mid-latitudes (Sheffield and Wood, 2008; He et al., 2021, 2022). At the global and regional scales, complex climate changes and human activities significantly affect vegetation growth and development (Burrell et al., 2020; Jiao et al., 2021; Boulton et al., 2022), especially in arid regions. Furthermore, arid environments seriously affect plant growth and thereby pose a significant threat to human life, so it is urgent to address the ecological deterioration of arid regions under climate change and anthropogenic activities. Alxa League is a “severely critical ecological environment area” and a “natural protection barrier” in northern China. Timely, scientific, and accurate assessment of the dynamic vegetation changes in the dry Alxa League and the understanding of the spatial heterogeneity of vegetation changes and the interactions with extreme climates, human activities, and absorbable particulate matter are important.
The Normalized Difference Vegetation Index (NDVI) is closely related to vegetation coverage, leaf area index, biomass, and land use and can comprehensively reflect vegetation greenness, photosynthesis intensity, and vegetation metabolism intensity (Huang et al., 2019; Zhao D. et al., 2021). Therefore, the NDVI has been one of the critical indicators for desertification dynamics assessment and land cover classification, and it has been widely used in soil and water conservation and the ecological environment (Amano and Iwasaki, 2020; Bishnoi et al., 2021). For instance, Na et al. (2021) used AVHRR-GIMMS NDVI3g and the 1982–2015 climate reanalysis datasets to analyze the change of vegetation greenness and its response to climate change in the arid and semi-arid transition areas of the Inner Mongolia Plateau. Measho et al. (2021) used MODIS NDVI combined with evapotranspiration, air temperature, and precipitation datasets to assess vegetation dynamics and ecosystem resilience to climate change and drought in the Horn of Africa. Zhao et al. (2017) investigated the relationship between vegetation changes and extreme climates based on data from 52 meteorological observation stations on the Loess Plateau. Zhao M. et al. (2021) assessed the correlation between the NDVI, land-use dynamics, and water resources in the Mu Us Sandy land. Wu et al. (2020) analyzed the effects of human activities and climatic factors on the NDVI of the desert/steppe biome transition zone in the Sahel region of Africa.
Overall, previous studies focused on the vegetation changes in a region in the desertification degree, terrain, extreme climate, and human activities (Baniya et al., 2018; Nanzad et al., 2019). Among them, different elevations, slopes, and aspects in the topographic analysis could have effects on factors such as human activities, precipitation, and solar radiation in the regions, and climatic and anthropogenic factors have an impact on photosynthesis, transpiration, and growth environment of vegetation, making the results of the NDVI vary in different regions. Furthermore, many scholars have used these factors to conduct spatiotemporal analysis of the vegetation changes with the consideration of such factors. For instance, Ren et al. (2022) analyzed the correlation between air temperature, precipitation, human activities, and the NDVI in the Yellow River basin of China. Zhang et al. (2022) analyzed the spatial and temporal variations of the NDVI in the Qinba Mountains from 1985 to 2015 and combined elevation, air temperature, precipitation, soil type, and human activities to conduct the correlation analysis. However, these studies have not well explored the dynamic distribution of the NDVI and its influencing factors in the arid regions, and the analysis of NDVI dynamics and its relationship through the main component of sand and dust (PM10) in dry areas have not been reported. Therefore, this study aimed to synthesize and analyze various factors, add the assessment of the impact in arid areas from the perspective of absorbable particulate matter (PM10), and make a preliminary determination of whether absorbable particulate matter (PM10) affects the NDVI. Accordingly, the primary objective of this study was to analyze the NDVI dynamic changes in the dry Alxa League, and the second one was to explore the relationship between the NDVI and many factors such as land cover types, digital elevation model (DEM), air temperature, precipitation, soil moisture, total evaporation, human activities (e.g., population size, engineering water supply, and total irrigation area), and air quality to understand the characteristics of vegetation growth changes and the response to the driving factors. Overall, this study can provide a theoretical basis and new ideas for vegetation growth and ecological restoration in this area.
The remainder of this article is structured into four sections. Section “Materials and methods” describes the study area, the sources of all the data used, and the methods used. Section “Results” describes the study results on the temporal and spatial variations of the NDVI and its driving factors. Section “Discussion” discusses the causes of NDVI spatiotemporal variation and the specific responses of driving factors to NDVI spatiotemporal distribution. Conclusions are presented in Section “Conclusion.”
Materials and Methods
Study Area
Alxa League is located in the western part of the Inner Mongolia Autonomous Region, China, and it is divided into Ejin Jinna Banner, Alxa Right Banner, and Alxa Left Banner, with an administrative area of 2.7 × 10⁵ km2. The geographical coordinates are 97°10′∼106°53′E and 37°24′∼42°47′N. Alxa League has a significant air temperature difference between day and night, and the precipitation decreases from the southeast to the northwest. Its annual average air temperature is 8.25°C, and its annual rainfall is 10.64 mm. The landscape is mainly desert, has a Gobi climate, and is surrounder in mountainous hills, and the desertification area is as high as 2 × 10⁵ km2, accounting for 84% of the total land area. In addition, the natural vegetation in Alxa League is sparse, and the whole league presents steppe desert belt, typical desert belt, and arid desert belt from the southeast to the northwest. In particular, more than 0.88 × 10⁵ km is covered by desert, accounting for one-third of the total area; the site is also one of the sandstorm outbreak sources in East Asia.
Data
Normalized Difference Vegetation Index Data
The NDVI data obtained were at the annual and quarter scales. Monthly 1 km vegetation (NDVI) spatial distribution datasets in China and the monthly NDVI datasets were generated based on SPOT/VEGETATION PROBA-V 1 KM PRODUCTS1 (accessed on 17 January 2022), and decadal 1 km vegetation index data were generated based on the maximum synthesis method. Annual and quarterly NDVI data were generated using the same way based on monthly data. The annual NDVI data were selected from 2000 to 2019, and the monthly and seasonal NDVI data were chosen from 2015 to 2019. The reliability and accuracy of this dataset have been well demonstrated in studies related to spatial and temporal variations of the NDVI (Zhang Y. et al., 2021).
Vegetation-Type Data and Digital Elevation Model Data
ESA_WorldCover_10 land cover types were provided by the European space agency2 (accessed on 17 January 2022) with a 10 m spatial resolution. With more than 74% overall accuracy, the ESA_WorldCover_10 data have been widely used for monitoring land use/land cover studies worldwide (Wang et al., 2022). The vegetation types of the region can be divided into eleven categories: tree cover, shrubland, grassland, cropland, built-up, bare/sparse vegetation, snow and ice, permanent water bodies, herbaceous wetland, mangroves, and moss and lichen (Zanaga et al., 2021). The areas with unchanged vegetation types from 2000 to 2019 were extracted here to represent the vegetation cover status of the study area in recent years. The DEM data at a spatial resolution of 90 m × 90 m in the TPRR were collected from the SRTM dataset3 (accessed on 17 January 2022). The primary topographic features based on DEM data, such as elevation, slope, and aspect layers, were computed using the “Slope/Aspect Tool” in the ArcGIS 10.2 Spatial Analyst module. According to the Chinese classification standards for the potential hazard of soil erosion and some other relevant references (Jiang et al., 2014; He et al., 2020), four maps of land use type, elevation, slope, and aspect were generated (Supplementary Figure 1). In addition, spatial analysis tools were also used to overlay both the topographic factors layers and NDVI data to obtain the spatiotemporal distribution of the NDVI for each topographic factor over the past 20 years.
Other Data
The air temperature and precipitation applied were from the widely used and accepted climate dataset (CRU TS v. 4.05) produced by the Climatic Research Unit (CRU) (Harris et al., 2020). Soil moisture data were obtained from the NOAA Climate Prediction Center (van den Dool et al., 2003), a dataset describing global gridded monthly average soil moisture. The total evaporation data used in this study were obtained from the latest international climate reanalysis dataset (ERA5)4 (accessed on 7 April 2022). Human activities data, including population size, engineering water supply, and total irrigation area, were derived from Alxa Statistical Yearbook5 (accessed on 12 January 2022). Monthly and seasonal PM10 data were obtained from the National Real-time Air Quality Publishing Platform public website for air quality monitoring data maintained by the China National Environmental Monitoring Center (CMC) of the Ministry of Ecology and Environment of China6 (accessed on 17 January 2022). The annual data of PM10 were from obtained from China HighPM10 (Wei et al., 2021). ChinaHighPM10 is one of the series of long-term, full-coverage, high-resolution, and high-quality datasets of ground-level air pollutants of China (i.e., ChinaHighAirPollutants, CHAP). It is generated from the big data (e.g., ground-based measurements, satellite remote sensing products, atmospheric reanalysis, and model simulations) using artificial intelligence by considering the spatiotemporal heterogeneity of air pollution.
Methods
Average Analyses of Normalized Difference Vegetation Index
The annual NDVI data were processed into 20-year overall NDVI mean data for analysis in time and space based on the maximum value synthesis method. In addition, annual, quarterly, and monthly data were analyzed temporally using NDVI mean values from raster images, and data on three different temporal metrics were used separately.
Spatial Trend Analysis Methods
Linear trend analysis can simulate the changing trend of the NDVI pixel by pixel and can be used to analyze the changing trend of the NDVI in the Alxa League region on the interannual scale. The regression slope is given as follows:
where n is the study time 20, yi is the NDVI of the year i, the slope is the slope of NDVI change, slope > 0 means an increase in the vegetation cover, and pitch < 0 means a decrease in the vegetation cover. To further analyze the significance of the vegetation cover change trend in Alxa League at the interannual scale, the F-test was conducted on the changing trend. The significance of NDVI trends in Alxa League was classified into four categories: nonsignificant degradation, nonsignificant improvement, significant degradation, and significant improvement.
Extraction and Classification of Land Cover Types and Terrain Factors
The land cover types were classified into eight categories: tree cover, shrubland, grassland, cropland, built-up, bare/sparse vegetation, permanent water bodies, and herbaceous wetland. In addition, this study used ArcGIS spatial analysis tools to extract elevation, slope, and aspect information from the DEM of the study area. According to the actual situation of the study area, the elevation was divided into seven grades: 651–800, 800–1000, 1000–1200, 1200–1400, 1400–1600, 1600–1800, and 1800–3492 m, and the slope of the study area was divided into eight grades: 0–2, 2–5, 5–15, 15–25, 25–35, 35–40, 40–45, and > 45(°). According to the angle of 45° clockwise, the slope aspect was divided into nine grades: flat (-1°), N (0–22.5°) (337.5°–360°), NE (22.5°–67.5°), E (67.5°–112.5°), SE (112.5°–157.5°), S (157.5°–202.5°), SW (202.5°–247.5°), W (247.5°–292.5°), and NW (292.5°–337.5°).
Correlation Analysis
Correlation analysis was used to examine the correlation between the NDVI and air temperature, precipitation, soil moisture, and total evaporation. It then revealed the correlation between the interannual NDVI and air temperature, precipitation, soil moisture, and total evaporation in the Alxa League region from 2000 to 2019. It was calculated as follows:
where Rxy is the correlation coefficient between x and y, the coefficient value is between -1 and 1; n is the study time; xi and yi are air temperature, precipitation, soil moisture, and total evaporation, and NDVI in the i year value; and and are the mean values of x and y, respectively; Rxy > 0 is a positive correlation; and Rxy ≤ 0 is a negative correlation. This study also analyzed the spatiotemporal changes of the NDVI and air temperature, precipitation, soil moisture, and total evaporation to explore the relationship between the NDVI and them.
We synthesized and selected three factors, population size, engineered water supply, and total irrigated area, to analyze human-induced impacts on the NDVI based on information from local statistical offices. The NDVI, which was correlated with the three factors, was analyzed using IBM SPSS Statistics. This study analyzed the correlation between the NDVI and PM10, by the use of average daily 24-h PM10 data. In addition, the daily average data were then processed for monthly and seasonal averages to obtain the monthly and average seasonal data used in this study.
Results
Spatiotemporal Variation of Normalized Difference Vegetation Index
Overall, the NDVI values in Alxa League were small, no more than 0.15 (Figure 1). From 2000, the NDVI values showed fluctuating changes until 2012, in which year the NDVI values peaked to 0.12131. From 2012 to 2015, the NDVI dropped sharply, with the lowest value of 0.08055 in 2015, while the NDVI rebounded slowly after 2015, with a trend of increase again.
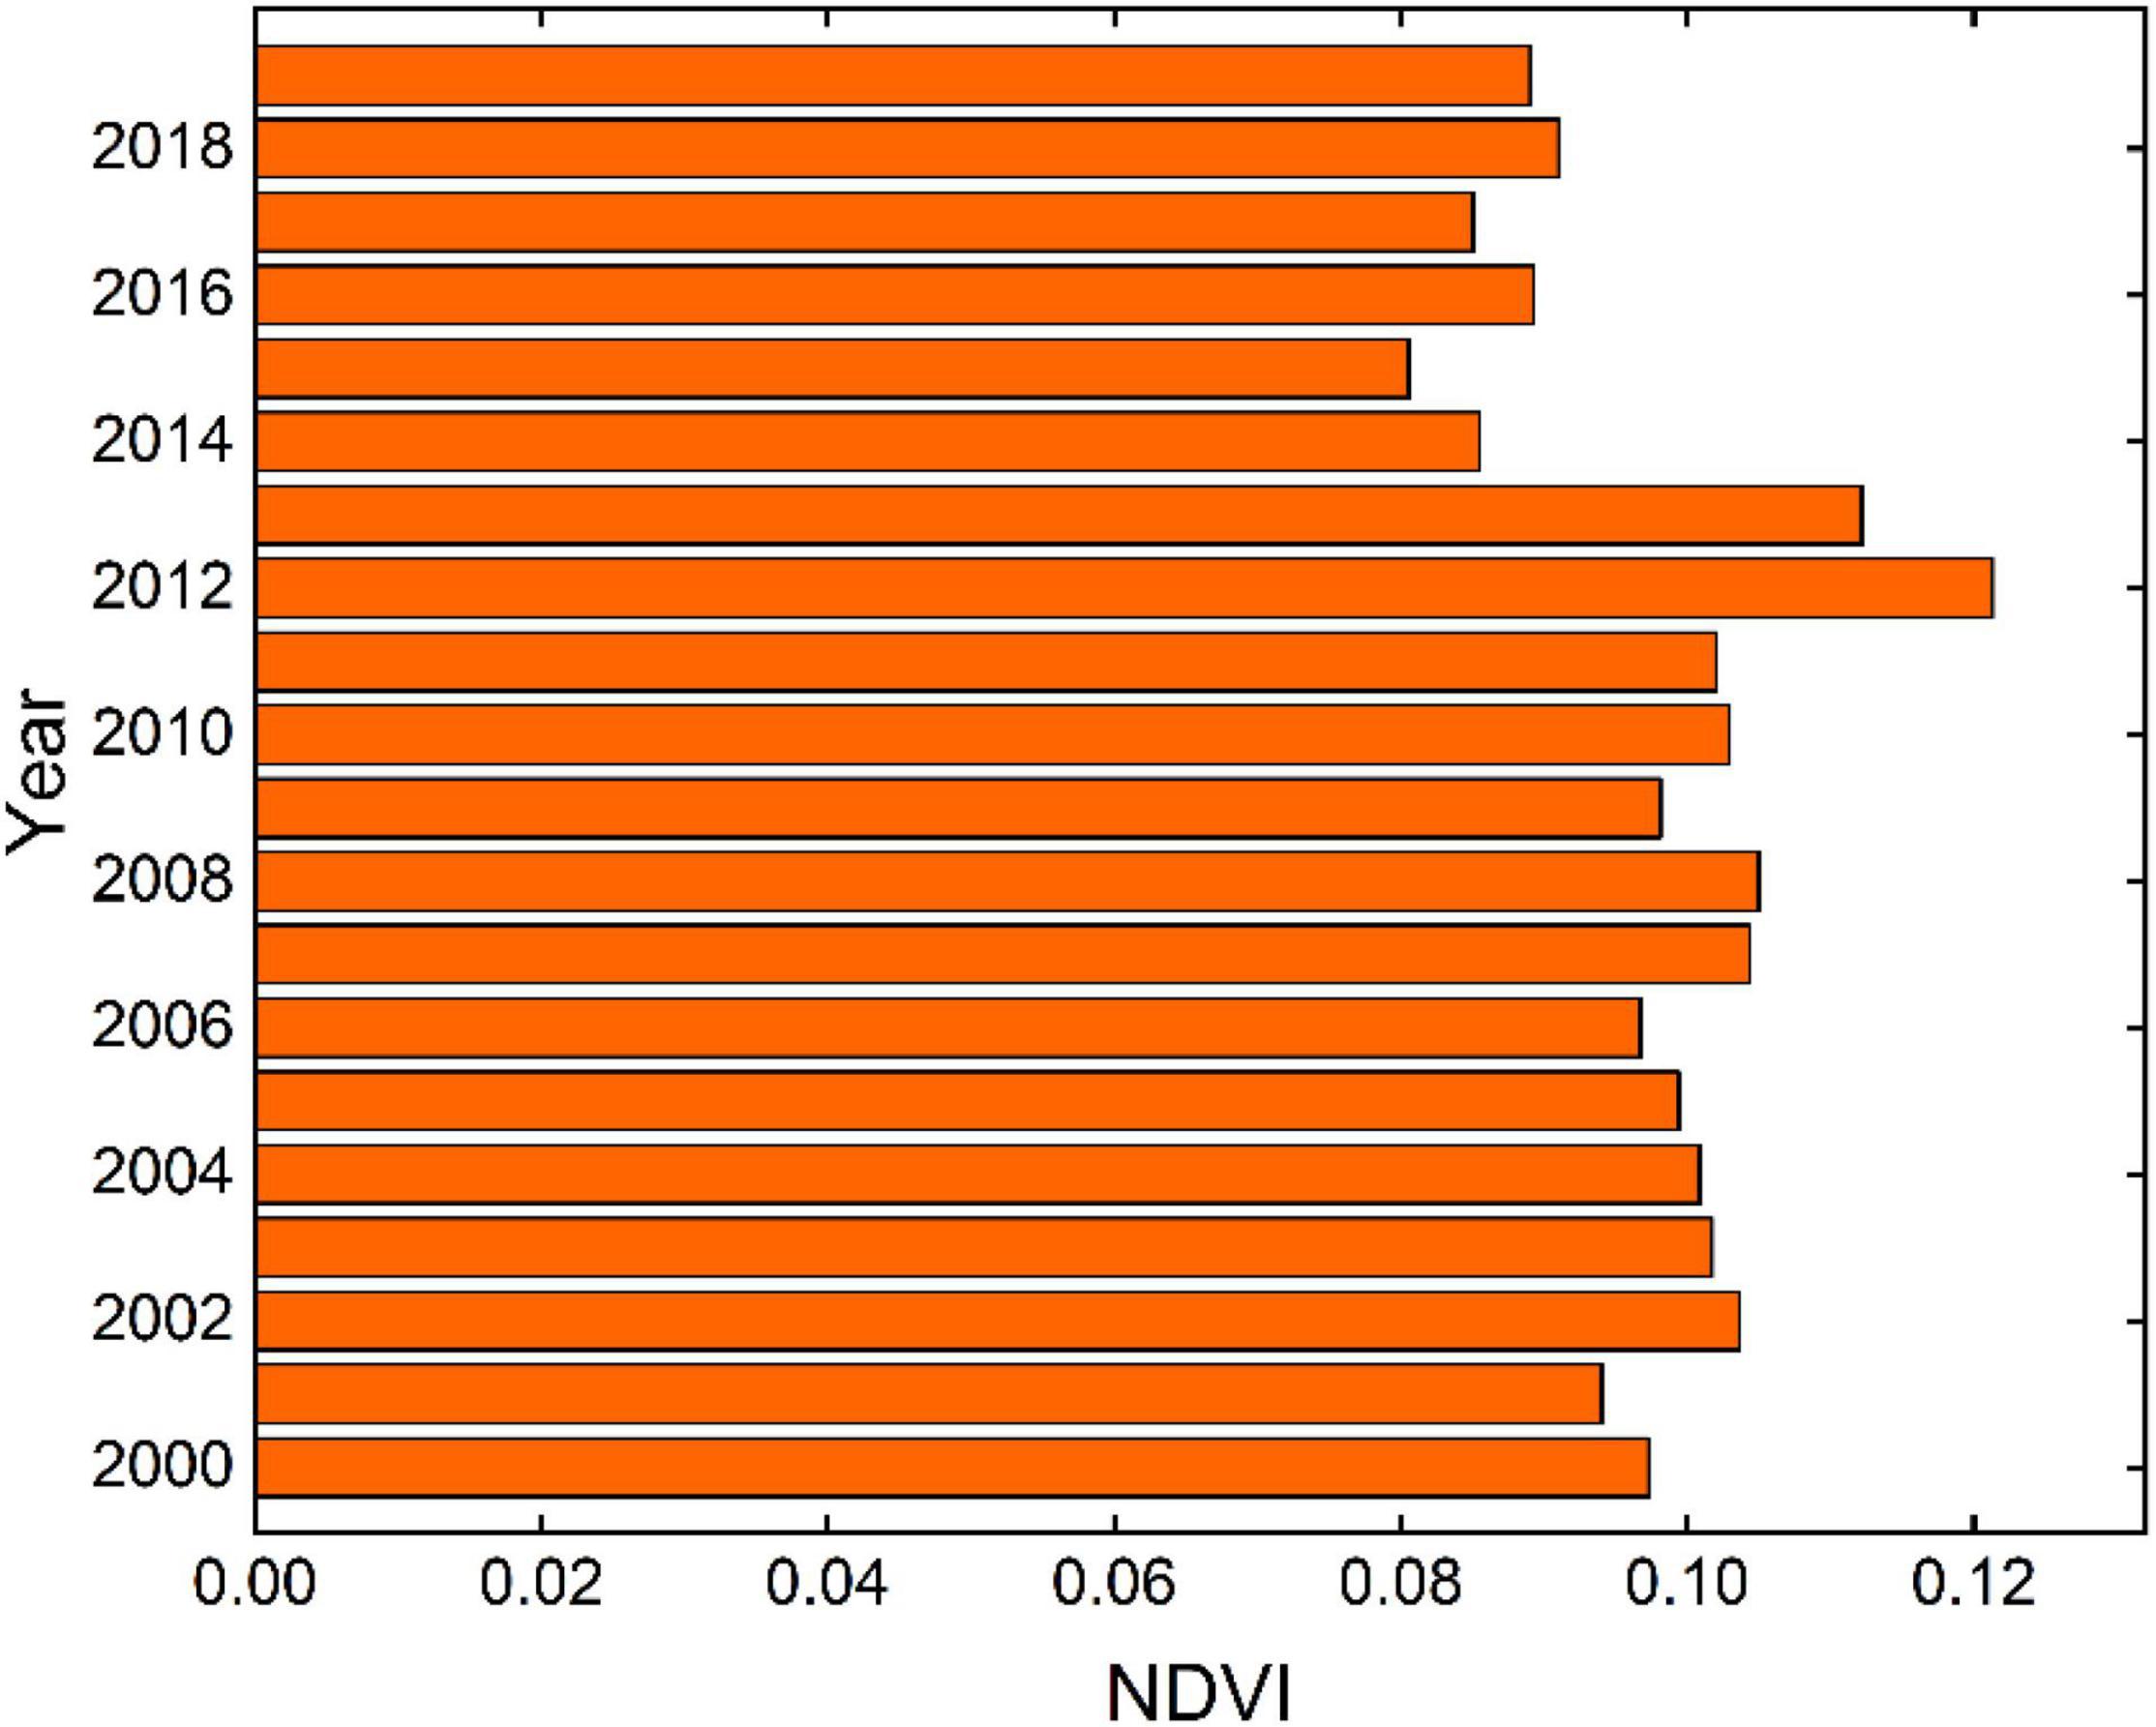
Figure 1. Bar chart of interannual NDVI variation.
The mean spatial distribution of the NDVI from 2000 to 2019 was calculated, as shown in Figure 2. The NDVI had a mean value of 0.098 during the 20 years. The spatial NDVI values in Alxa League were generally small, with smaller values in Alxa Right Banner and the smallest NDVI values in Ejin Jinna Banner, indicating only a small amount of vegetation cover in these areas. In comparison, the NDVI values in Alxa Left Banner were slightly larger, indicating a higher vegetation cover in these areas. The places with higher NDVI values in Ejin Jinna Banner, Alxa Right Banner, and Alxa Left Banner were mainly areas with high human activities (city centers), which means that human activities could be conducive to vegetation improvement in desert areas. The results further verified the gradually increasing NDVI values from northwest to southeast in spatial distribution, almost consistent with the description in Section “Study area”.
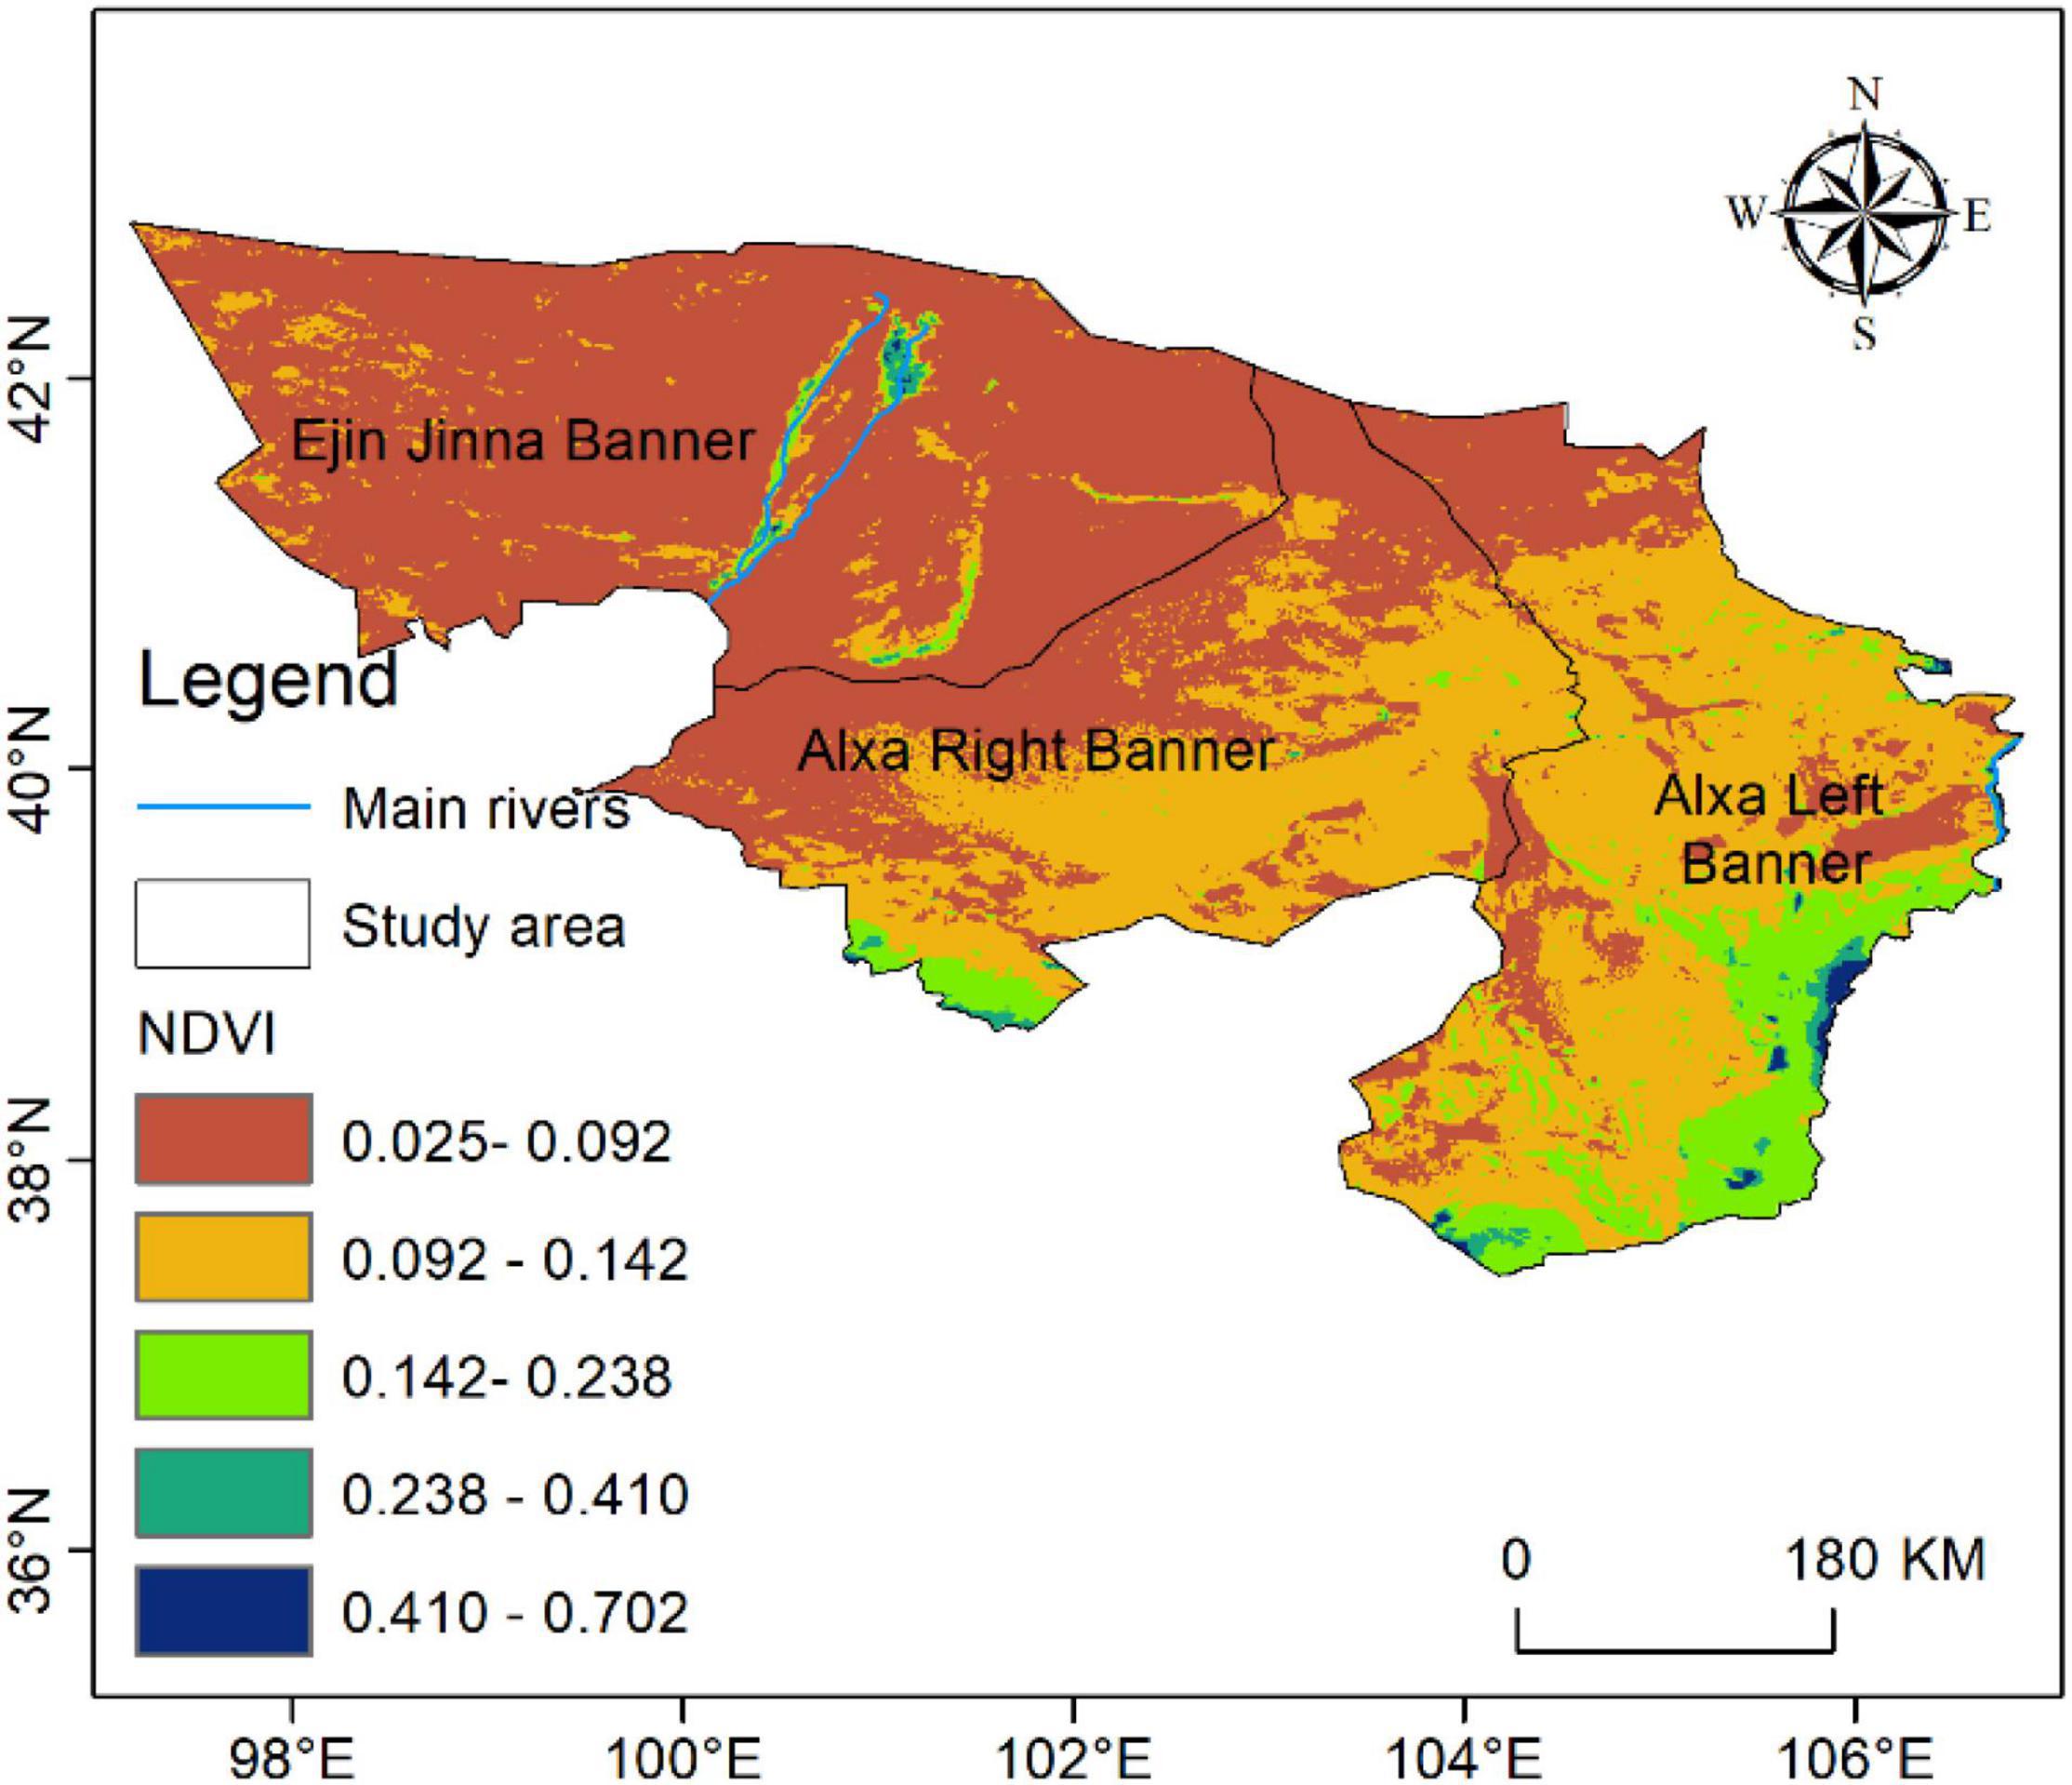
Figure 2. Spatial distribution of 20-year overall NDVI mean values.
Based on the trend analysis method, the pixel-by-pixel trend analysis of the NDVI of Alxa League in the past 20 years was carried out. The interannual variation trend and significance of the NDVI were judged based on the F-test (Figure 3A). The results indicated that the whole of Ejin Jinna Banner and part of Alxa Right Banner witnessed a slight trend of degradation (-0.005–0.001), while the vegetation in the Alxa Left Banner and some areas of the Alxa Right Banner was slightly improved (0.001–0.004), showing a slight improvement trend. The city center of Ejin Jinna Banner and some areas of Alxa Left Banner was highly enhanced (>0.004). Nevertheless, according to Figure 3B, the NDVI in most areas of Alxa League was nonsignificant. Significant changes were mainly found in the Alxa Left Banner. The general trend from the southeast to the northwest followed a rough trend of significant improvement, significant degradation, nonsignificant degradation, and nonsignificant improvement.
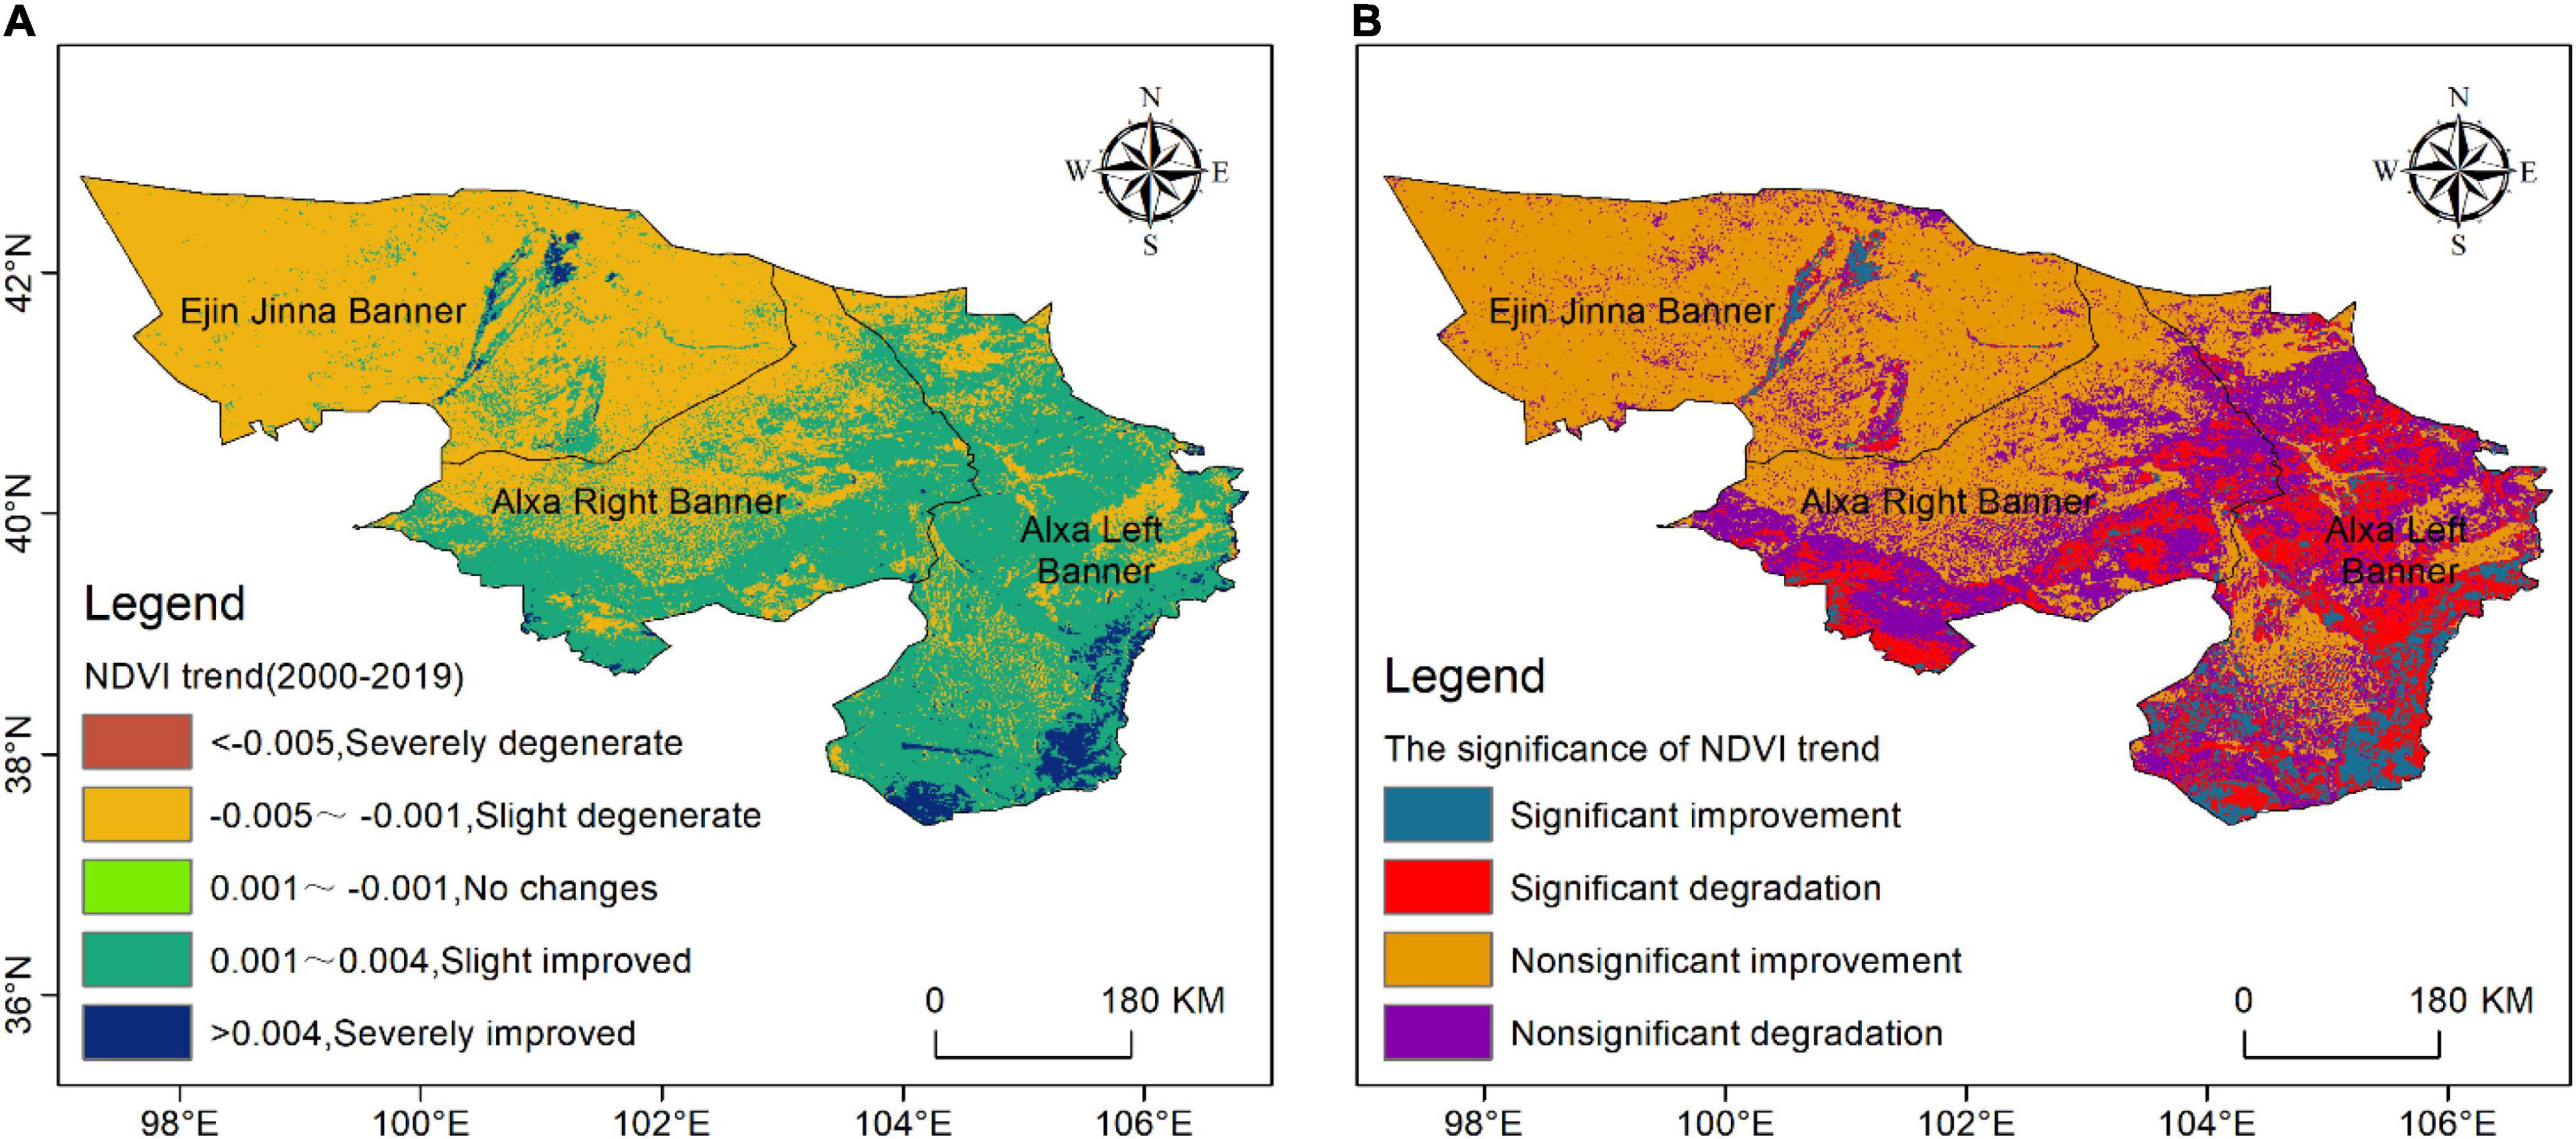
Figure 3. Spatial distribution of interannual NDVI trends and significance.
Figure 4 presents the proportion of the NDVI, NDVI trend, and significance of the spatial distribution. More than 90% of the interannual NDVI values were less than 0.142. The areas with the highest (0.410–0.702) and higher (0.238–0.410) NDVI only accounted for 0.31% and 0.93%, respectively. In Figure 4B, the NDVI trend was mainly slight degenerate and slight improved, with 58.98% and 38.13%, respectively. Fortunately, there was almost no severely degenerate (0.04%), and the severely improved (>0.004) accounted for 2.85% in this area. In Figure 4C, the significance of the NDVI trend was mainly nonsignificant improvement with a proportion of 52.91%, followed by nonsignificant degradation (25.52%), significant degradation (15.4%), and significant improvement (5.5%), which accounted for the smallest proportion.
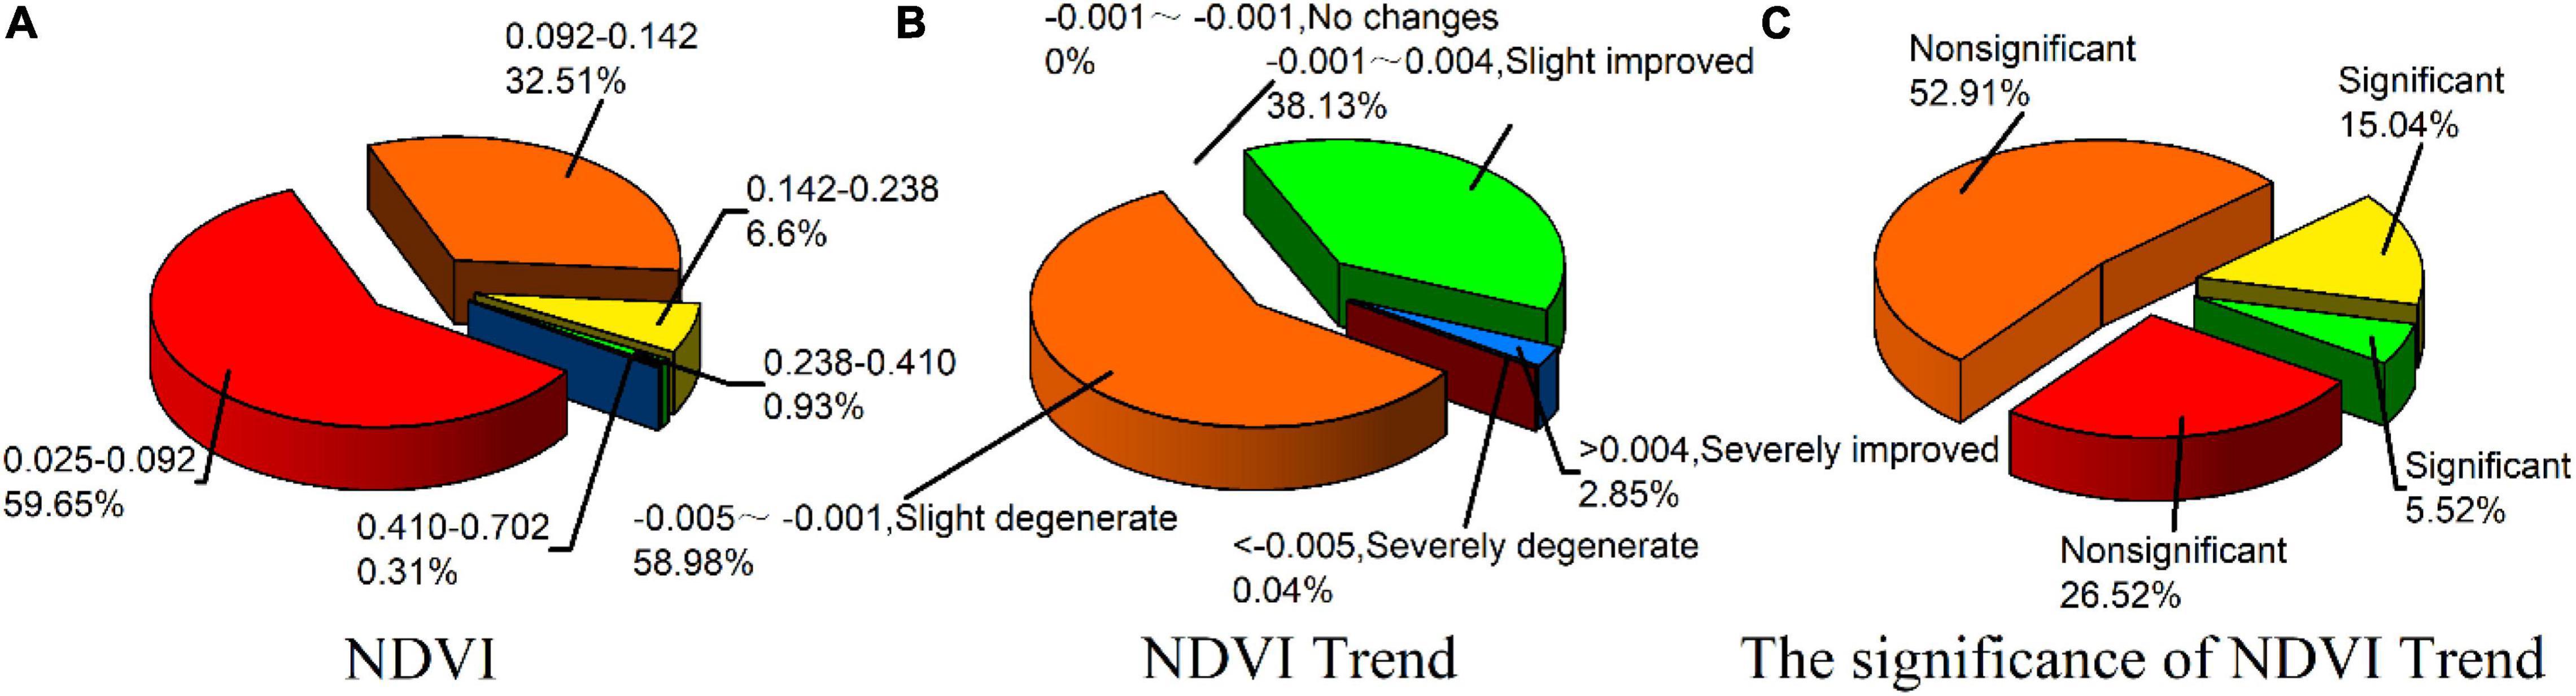
Figure 4. Pie chart of NDVI value and its change trend and the proportion of significant spatial distribution change.
Influence of Land Use Type, Elevation, Slope, and Aspect
Figure 5 is the overlay analysis of the NDVI by land use type, elevation, slope, and aspect. According to Figure 5A, when the land use type was tree cover, the NDVI value was the largest. Moreover, the cropland and grassland were characterized by higher NDVI values. In comparison, the NDVI value was the smallest when the land use type was bare/sparse vegetation. Figure 5B indicates that the mean value of the NDVI increased with the elevation gradually, and the mean value of the NDVI reached the maximum at the elevation of 1800-3492 m and the minimum at 651–800m. In Figure 5C, the NDVI showed a trend of increase and then decrease with the slope, and the NDVI reached the maximum at 40–45° slope and the minimum at 0–2°. In Figure 5D, the NDVI fluctuated, and the NDVI was the largest when the aspect was north and the smallest when it was flat.
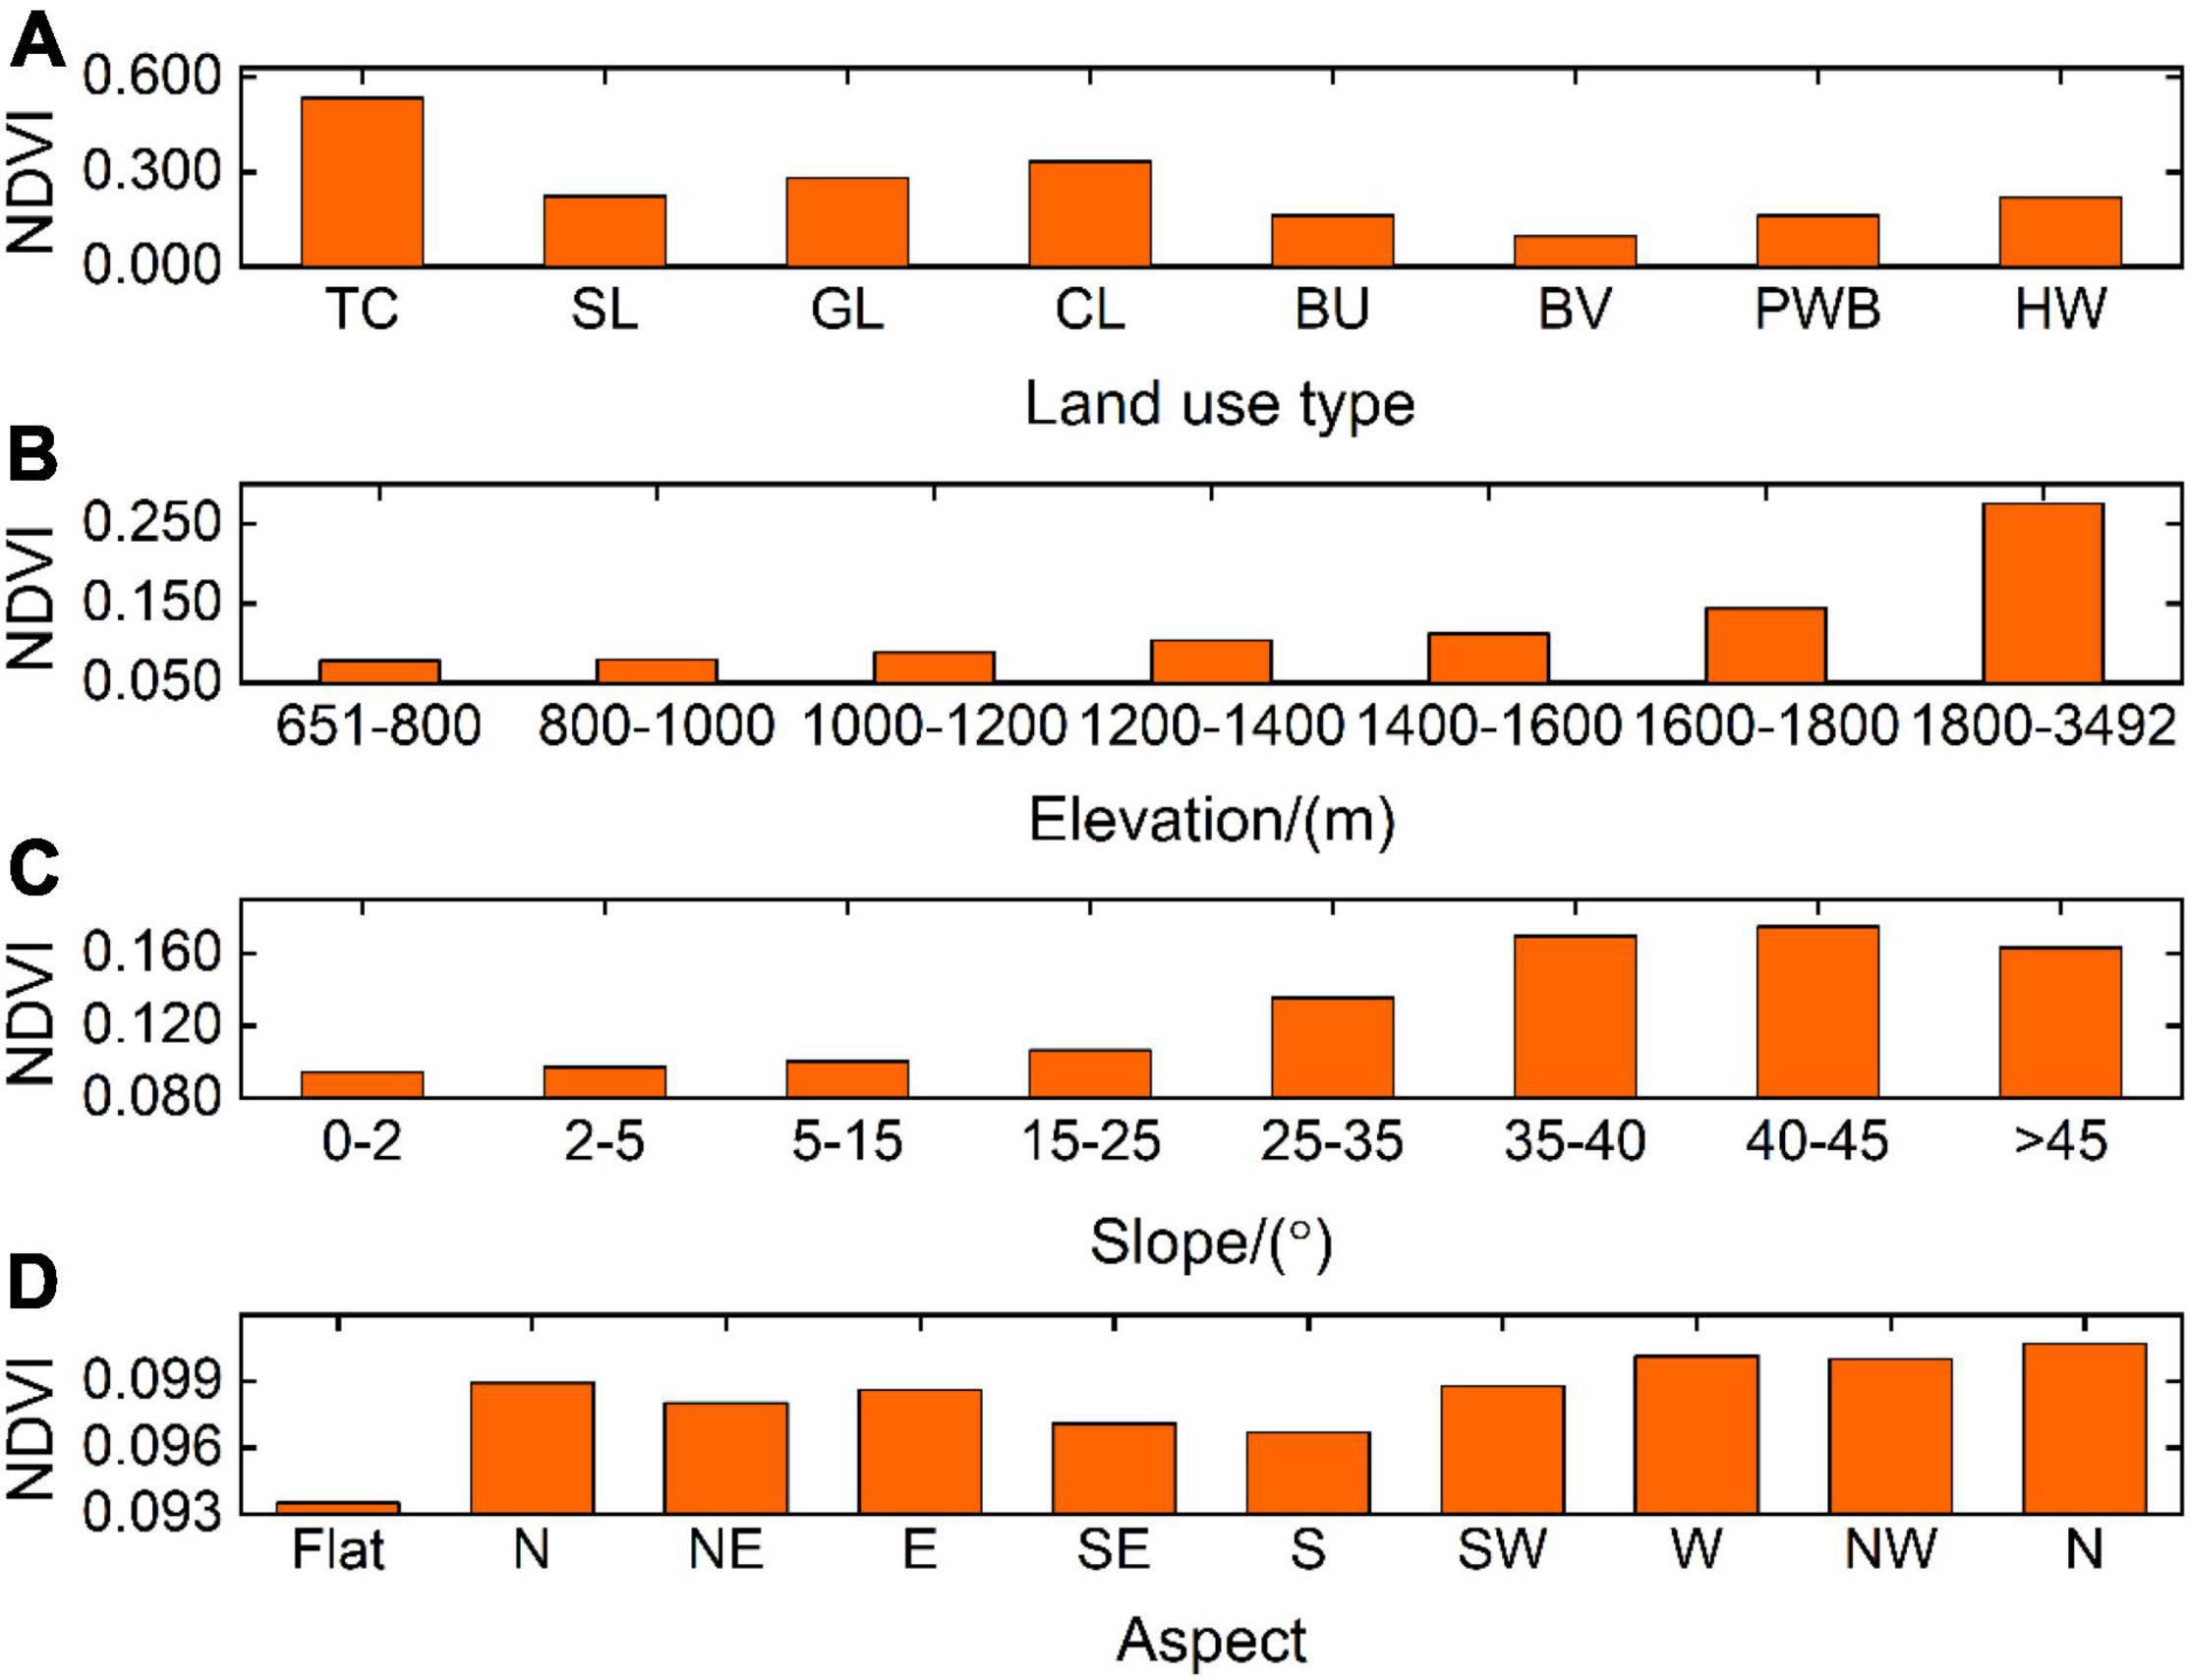
Figure 5. Distribution characteristics of the average vegetation index in the range of different land use types, elevations, slopes, and aspects. Note: TC: tree cover, SL: shrubland, GL: grassland, CL: cropland, BU: built-up, BV: bare/sparse vegetation, PWB: permanent water bodies, HW: herbaceous wetland.
Impact of Air Temperature, Precipitation, Soil Moisture, and Total Evapotranspiration
This study further analyzed the effect of air temperature, precipitation, soil moisture, and total evaporation on vegetation growth. Figure 6 presents the annual average changes in air temperature, precipitation, soil moisture, and total evaporation in Alxa League from 2000 to 2019. Overall, the air temperature showed an upward trend, with the lowest air temperature of 7.36°C in 2012 and the highest temperature of 9.26°C in 2017. The 20-year precipitation also showed an upward trend, and its fluctuation was also obvious. The typical years with a precipitation lower than the average were 2001 and 2005, and their precipitation values were 8.53 mm and 8.77 mm, respectively. The soil moisture content increased significantly. The soil moisture in 2000 was 39.48 mm, and the soil moisture increased to 51.94 mm by 2019, with an increase of 12.46 mm. The 20-year evaporation change was not apparent, but after 2012, the band amplitude decreased.
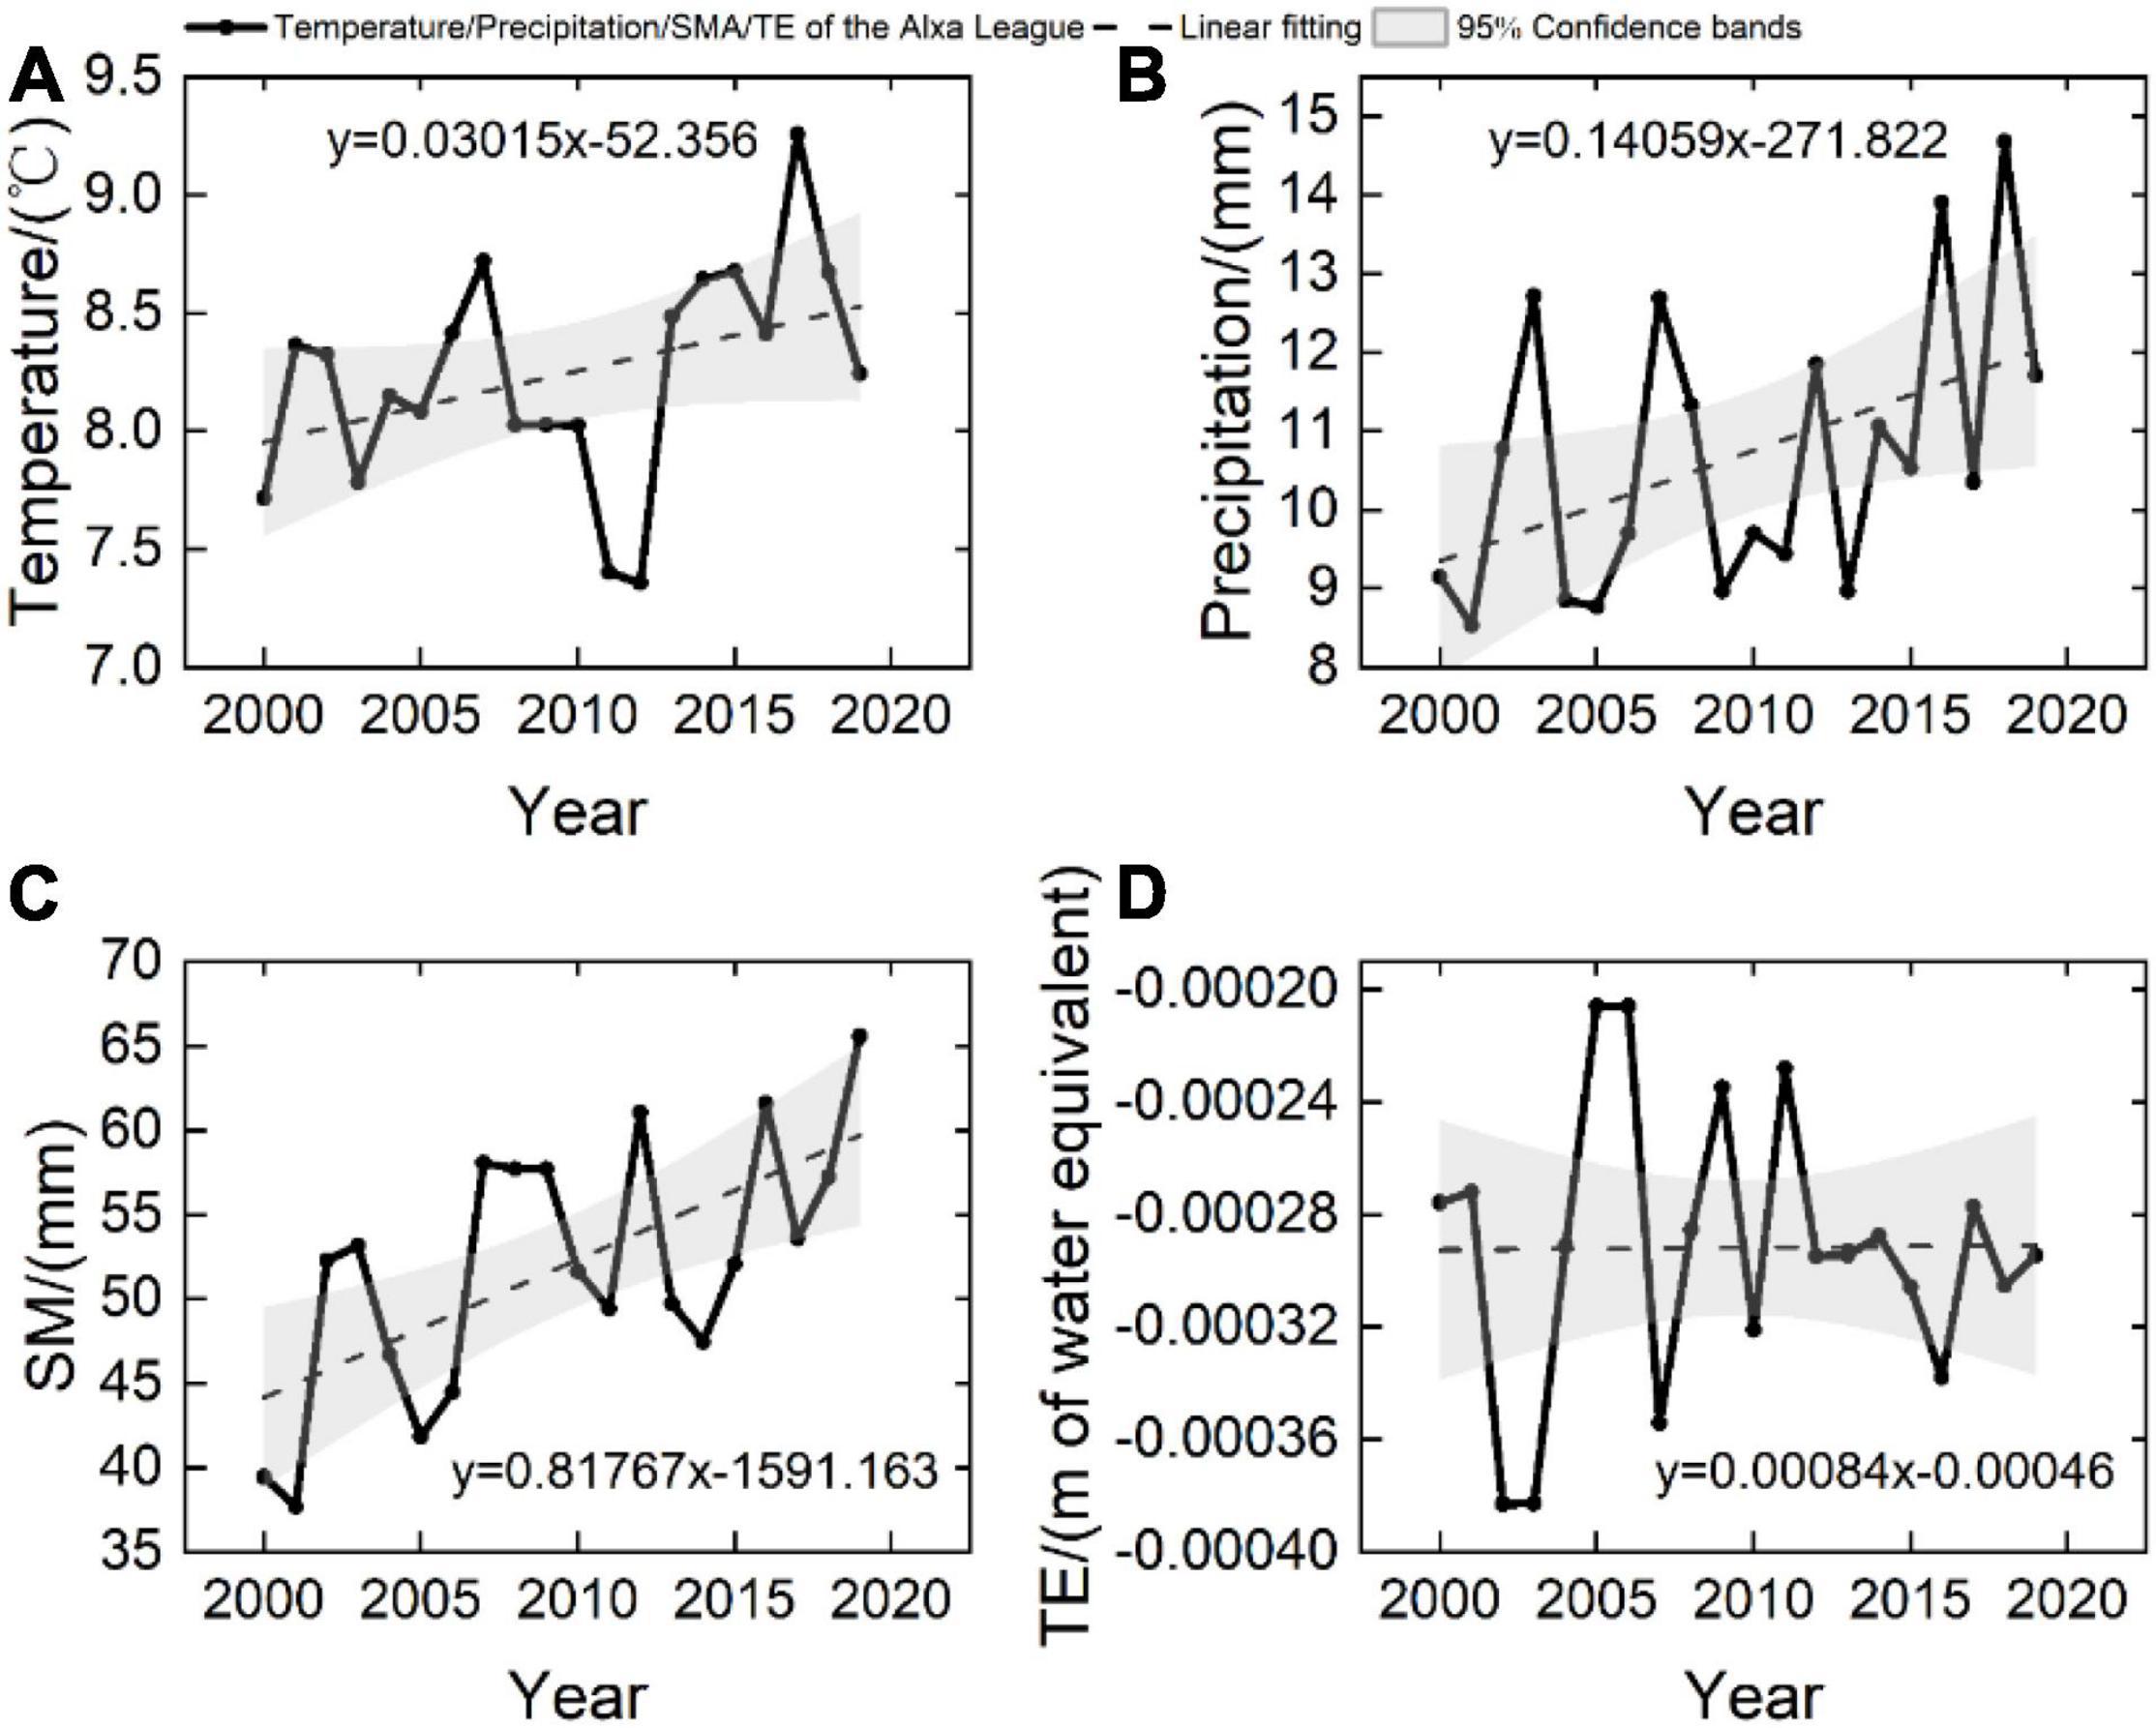
Figure 6. Timeline chart of air temperature, precipitation, soil moisture, and total evaporation.
Figure 7 shows the spatial distribution of air temperature and precipitation and their correlations with the NDVI. Overall, the 20-year average air temperature was 8.25°C. The air temperature was higher in the central–eastern part of Alxa League and lower in the northwest and southwest areas (Figure 7A). The lowest air temperature was in the downtown area of the suitable banner of Alxa League. The precipitation gradually increased from the northwest to the southeast, with the least rainfall in Ejin Jinna Banner and the most precipitation in the Left Banner of Alxa League (Figure 7B), and the 20-year average rainfall in the league area was 10.64 mm. The spatial distribution pattern of the NDVI was similar to that of rainfall, and there was a big difference in the spatial distribution of air temperature. In particular, according to Figure 7C, negative correlation was found in most areas of the league, especially in the central-western deserts and the Gobi region. The NDVI in the downtown, the eastern regions, mountain ranges, and river belts showed a weak positive correlation with the temperature. According to Figure 7D, the negative correlation was stronger in the central part, followed by the western part, the downtown, and the eastern part. The mountain and river zones showed a positive correlation. Overall, the spatial distribution shows a higher positive correlation of precipitation on the NDVI than the air temperature.
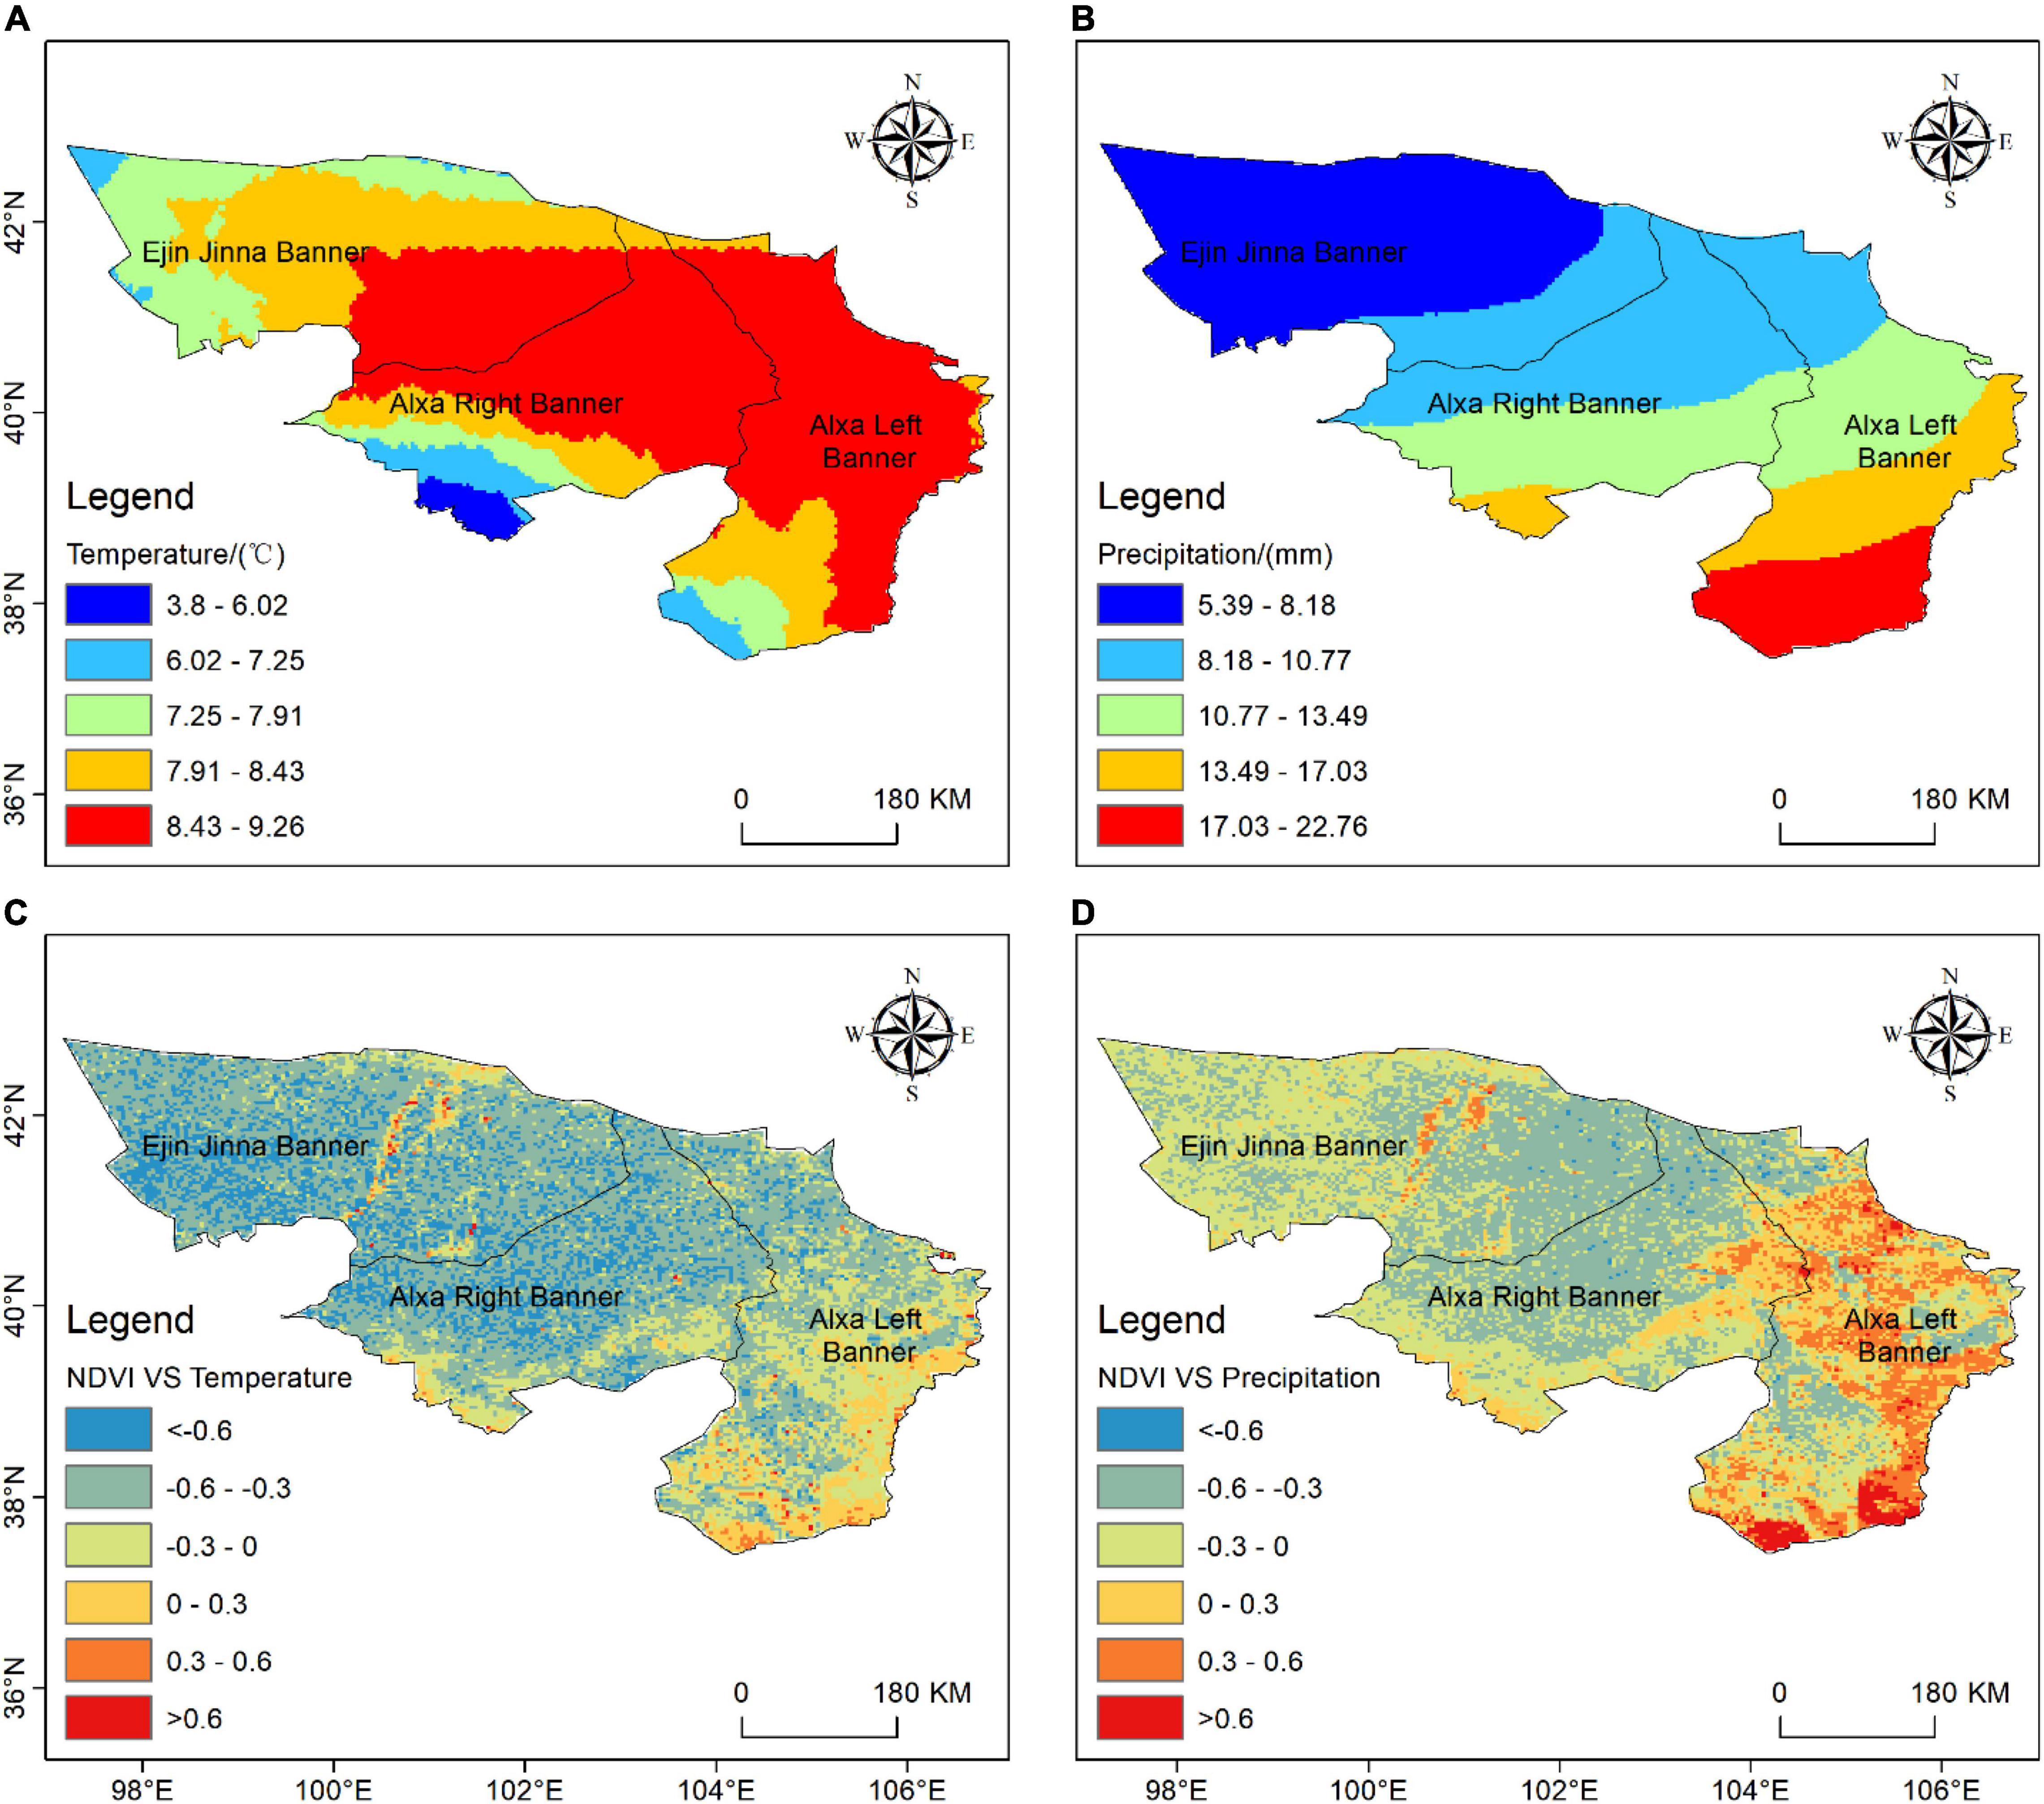
Figure 7. Spatial distribution of mean air temperature and precipitation in Alxa League from 2000 to 2019 and their correlation with NDVI.
Figure 8 shows the spatial distribution pattern of soil moisture and total evaporation and their correlations with NDVI. The soil moisture gradually increased from the northwest to the southeast, and the soil moisture content in the northwestern and southeastern regions was quite different, with a minimum value of 21.15 mm and a maximum value of 135.09 mm (Figure 8A). Figure 8B shows that the total evapotranspiration decreased from northwest to southeast, but the spatial distribution appeared different in the center of Ejin Jinqi and some areas in the northeast of the Alxa League area. The NDVI and soil moisture were generally positively correlated in the central and the eastern part of the Alxa League, the Heihe River Basin, and the central area of Ejin Jinna Banner, while it was negatively correlated in the northwestern region. In Figure 8D, the NDVI and total evaporation showed a strong positive correlation in parts of the northern and southern areas and a negative correlation in the eastern and central regions.
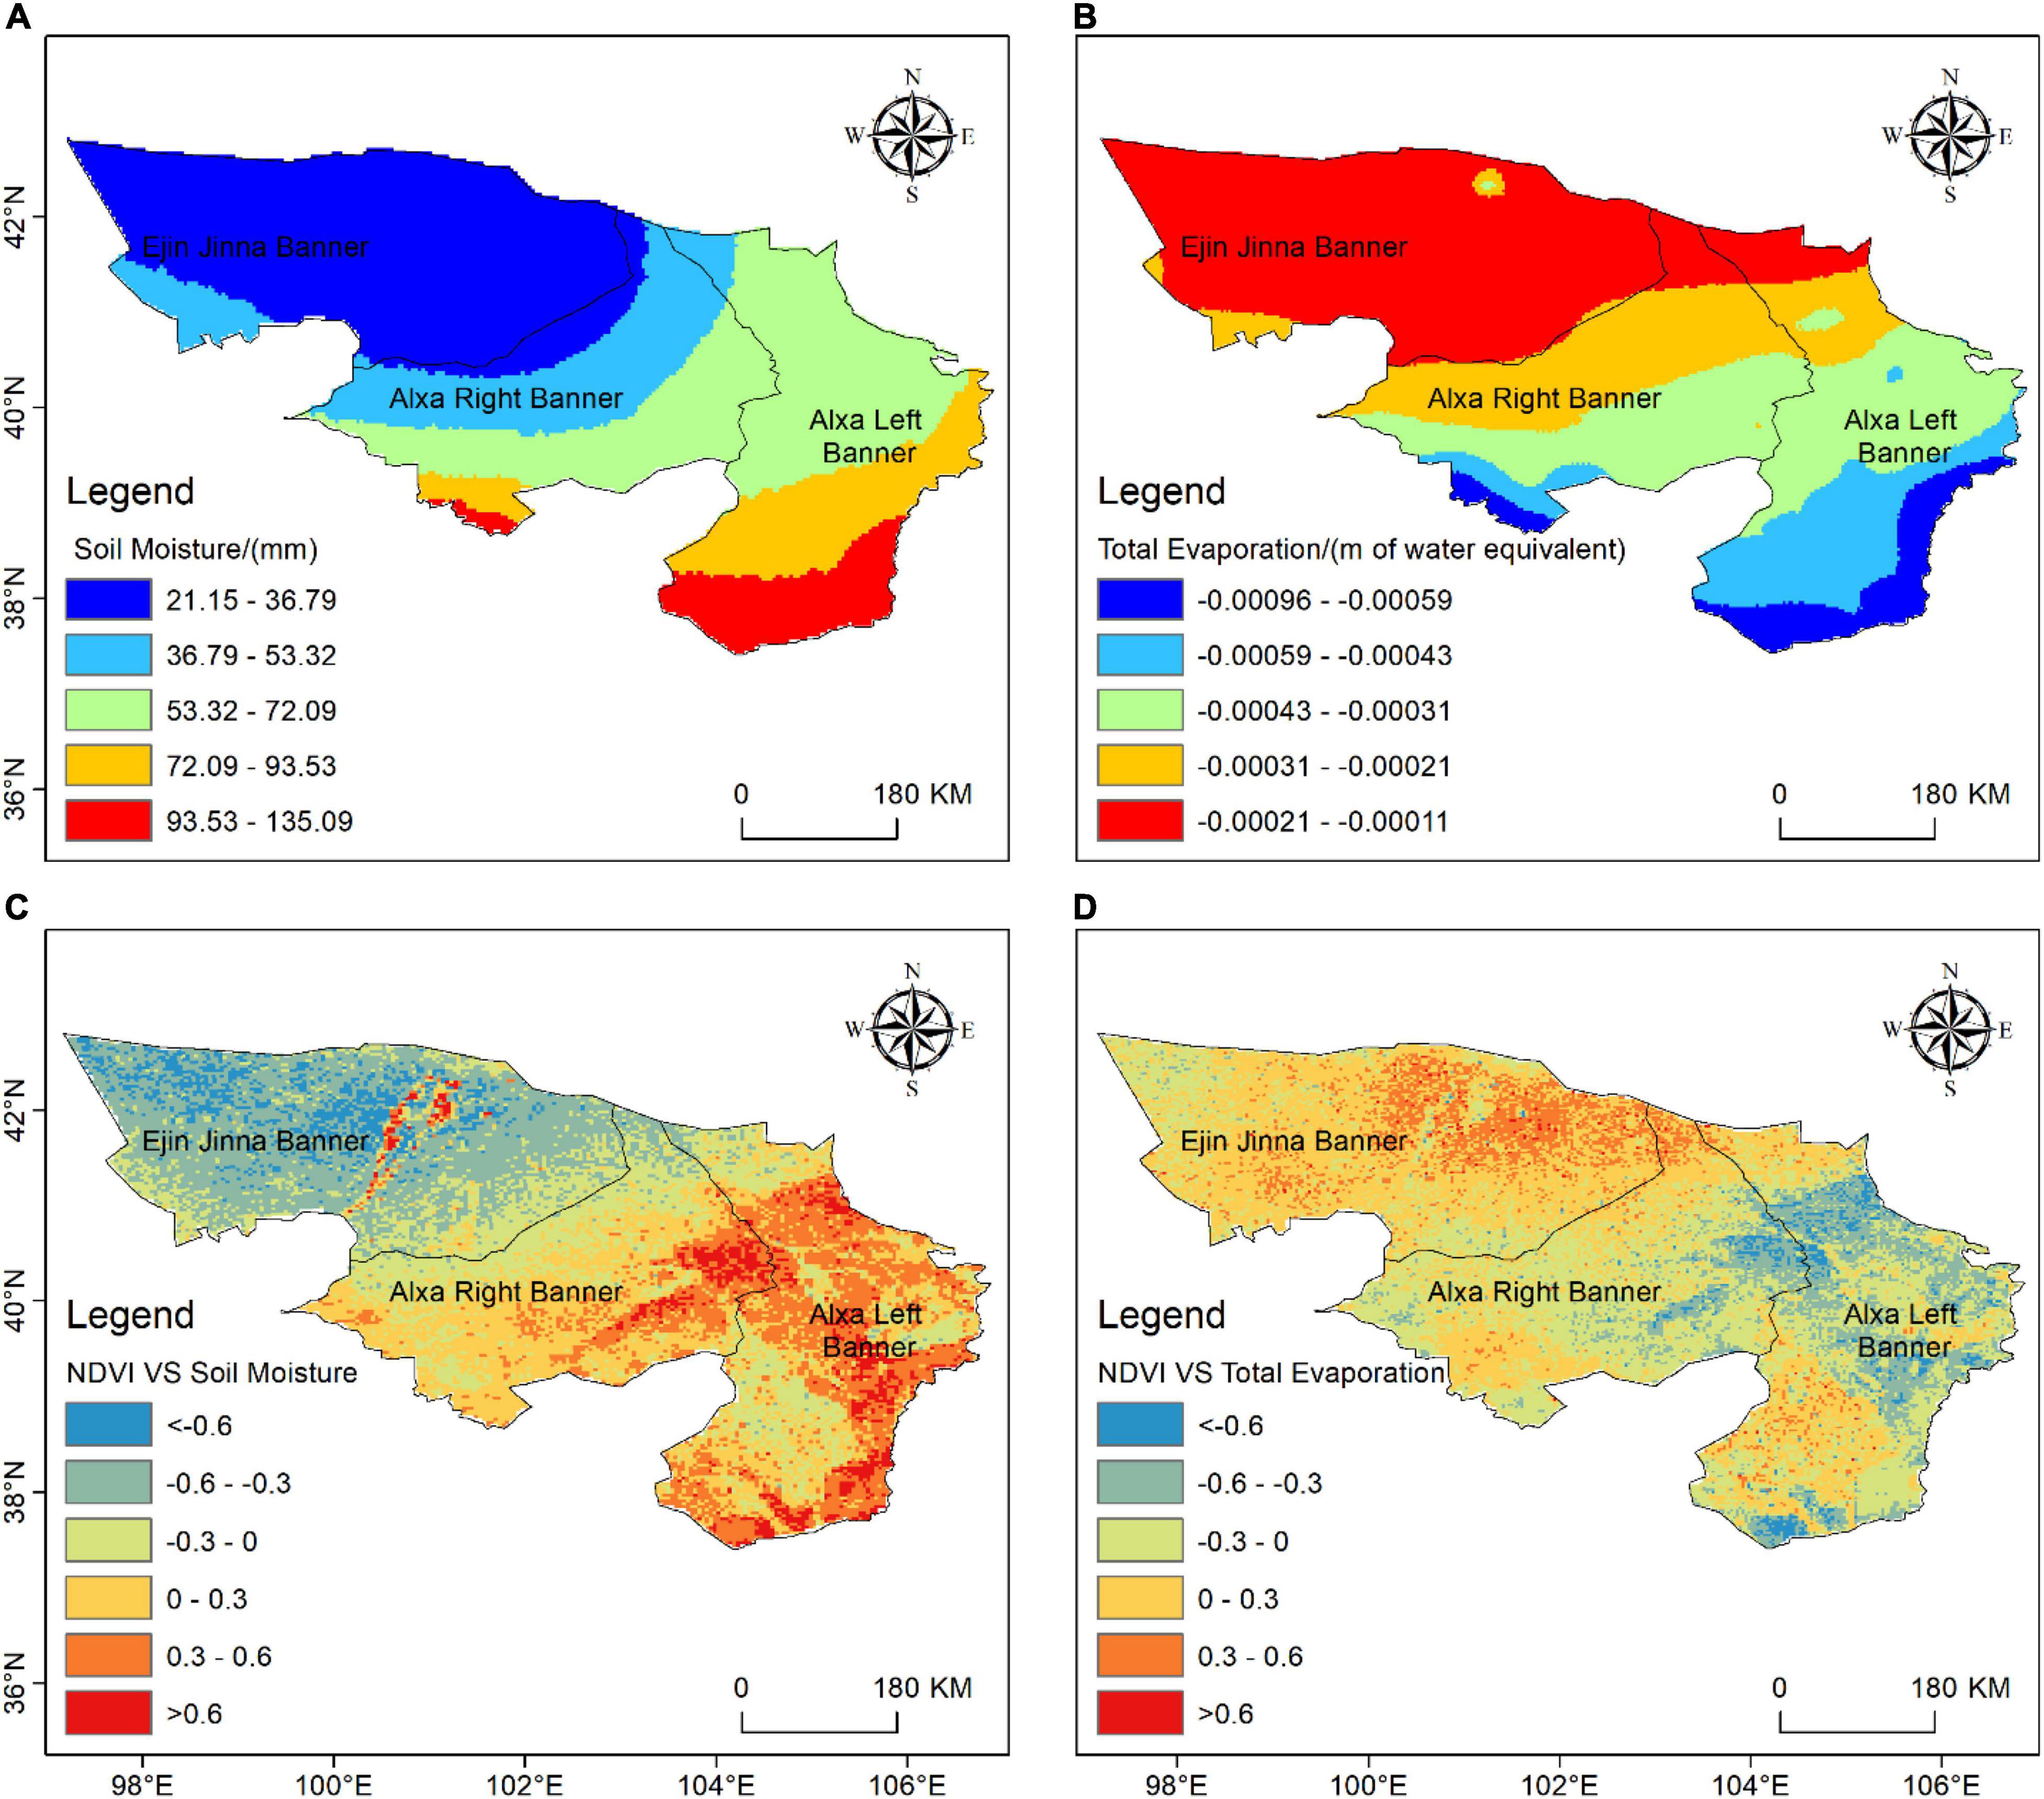
Figure 8. Spatial distribution of mean soil moisture and total evaporation in Alxa League from 2000 to 2019 and their correlation with NDVI.
According to Table 1, furthermore, the NDVI and air temperature in Alxa League showed a strong negative correlation in both temporal and spatial scales. The NDVI negatively correlated with precipitation and soil moisture in space, and only soil moisture had a positive correlation in time. Moreover, the NDVI showed a weak negative correlation with total evaporation in both temporal and spatial correlations.
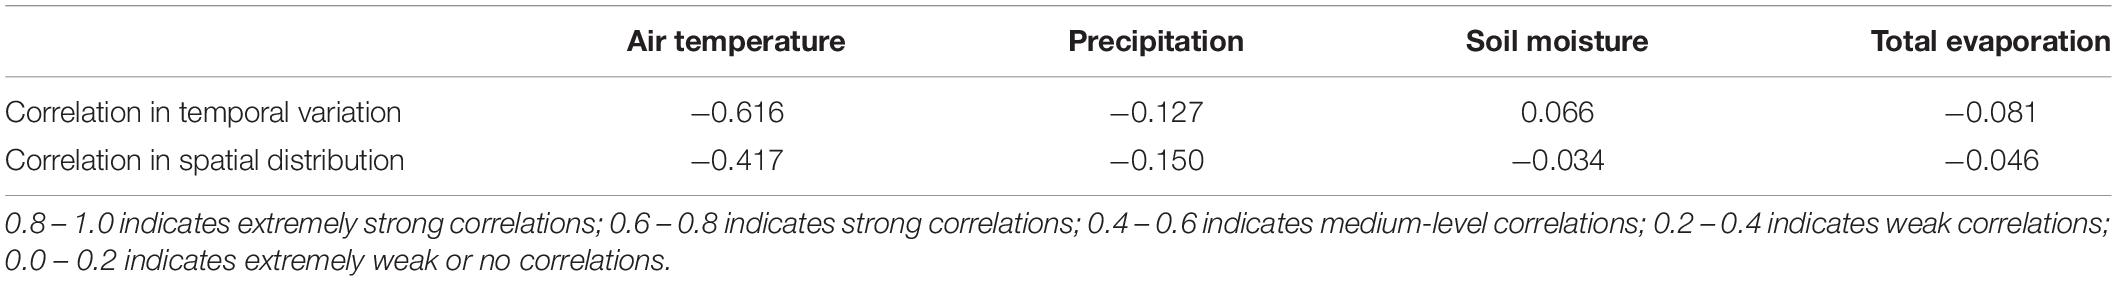
Table 1. Correlation of interannual variation of the NDVI with air temperature, precipitation, soil moisture, and total evaporation.
Impact of Human Activities
The population size, engineering water supply, and total irrigation area were human-related factors that could affect vegetation growth and development to a certain extent (Yang et al., 2020). The population of the arid area was mainly in the city center. The population data indicate that the Alxa League Left Banner had the largest population, followed by the Alxa League Right Banner, and the Ejina Banner had the smallest population. According to Table 2, the p-values of population size and engineering water supply in the analysis with the NDVI were less than 0.01, and the p-value of the NDVI and the total irrigated area was less than 0.05, indicating that three factors had significant correlations with the NDVI. The population size (R2 = 0.982), engineering water supply (R2 = 0.461), and total irrigation area (R2 = 0.403) had significant positive correlations with the NDVI, and the population size has the strongest correlation, and the entire irrigation area had the weakest correlation.
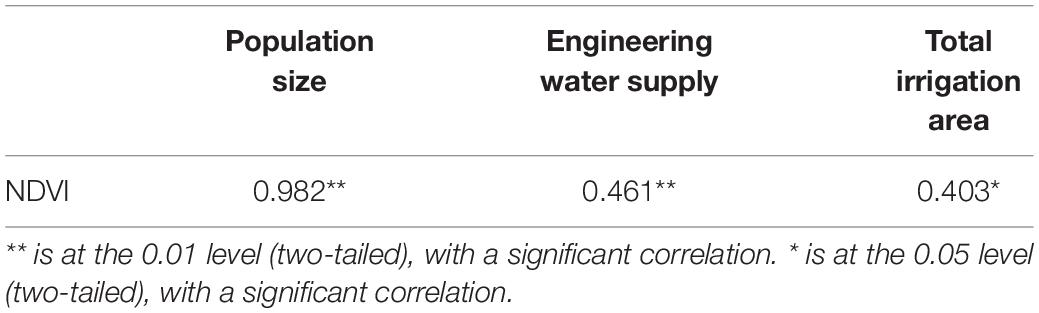
Table 2. Correlation between NDVI and human factors in Alxa League from 2000 to 2019.
Impact of Absorbable Particulate Matter
Figure 9 shows the inter-month variation of the NDVI and PM10 from 2015 to 2019. The results indicate that the NDVI reached the maximum in June, July, and August and reached the minimum in January, February, and March every year. However, the PM10 presented an opposite trend. In the past five years, there was a gradual increase in NDVI values and a gradual decrease in PM10. Figure 10 presents the correlation between NDVI and PM10, which indicates that there could be a negative relationship between them, while the p-value was only 0.488, meaning that the relationship was not significant.
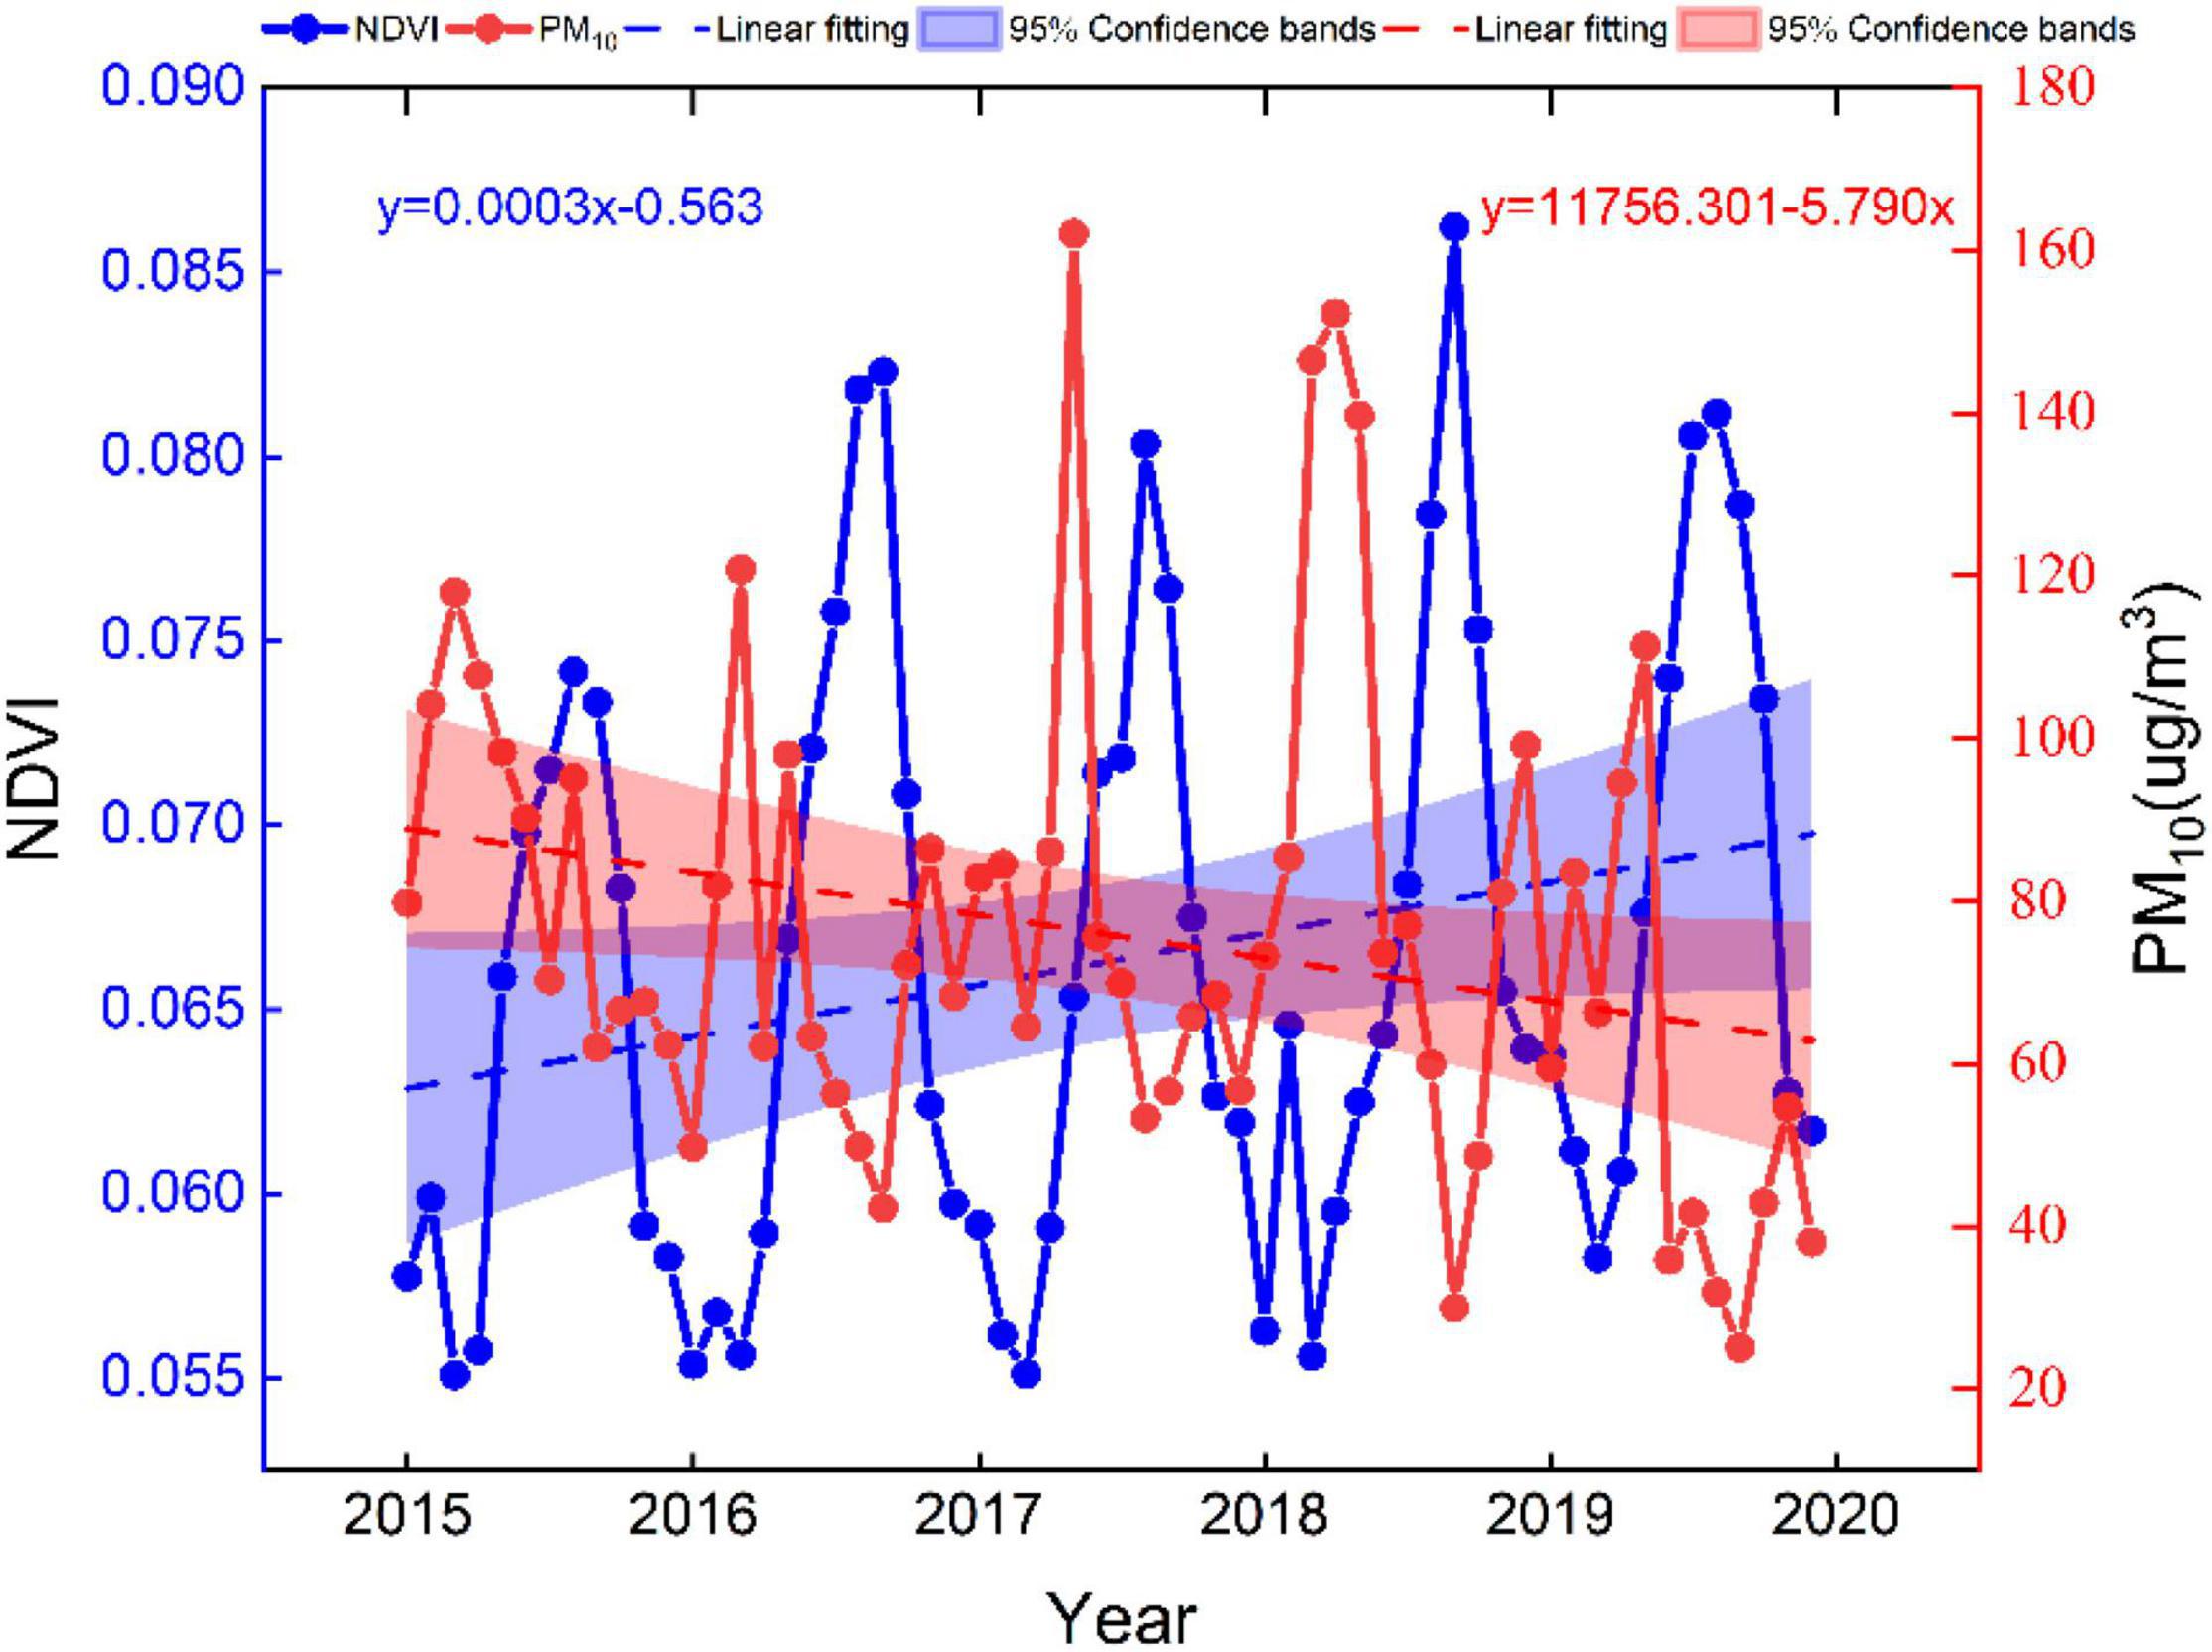
Figure 9. Line chart of NDVI and PM10 of Alxa League from 2015 to 2019.
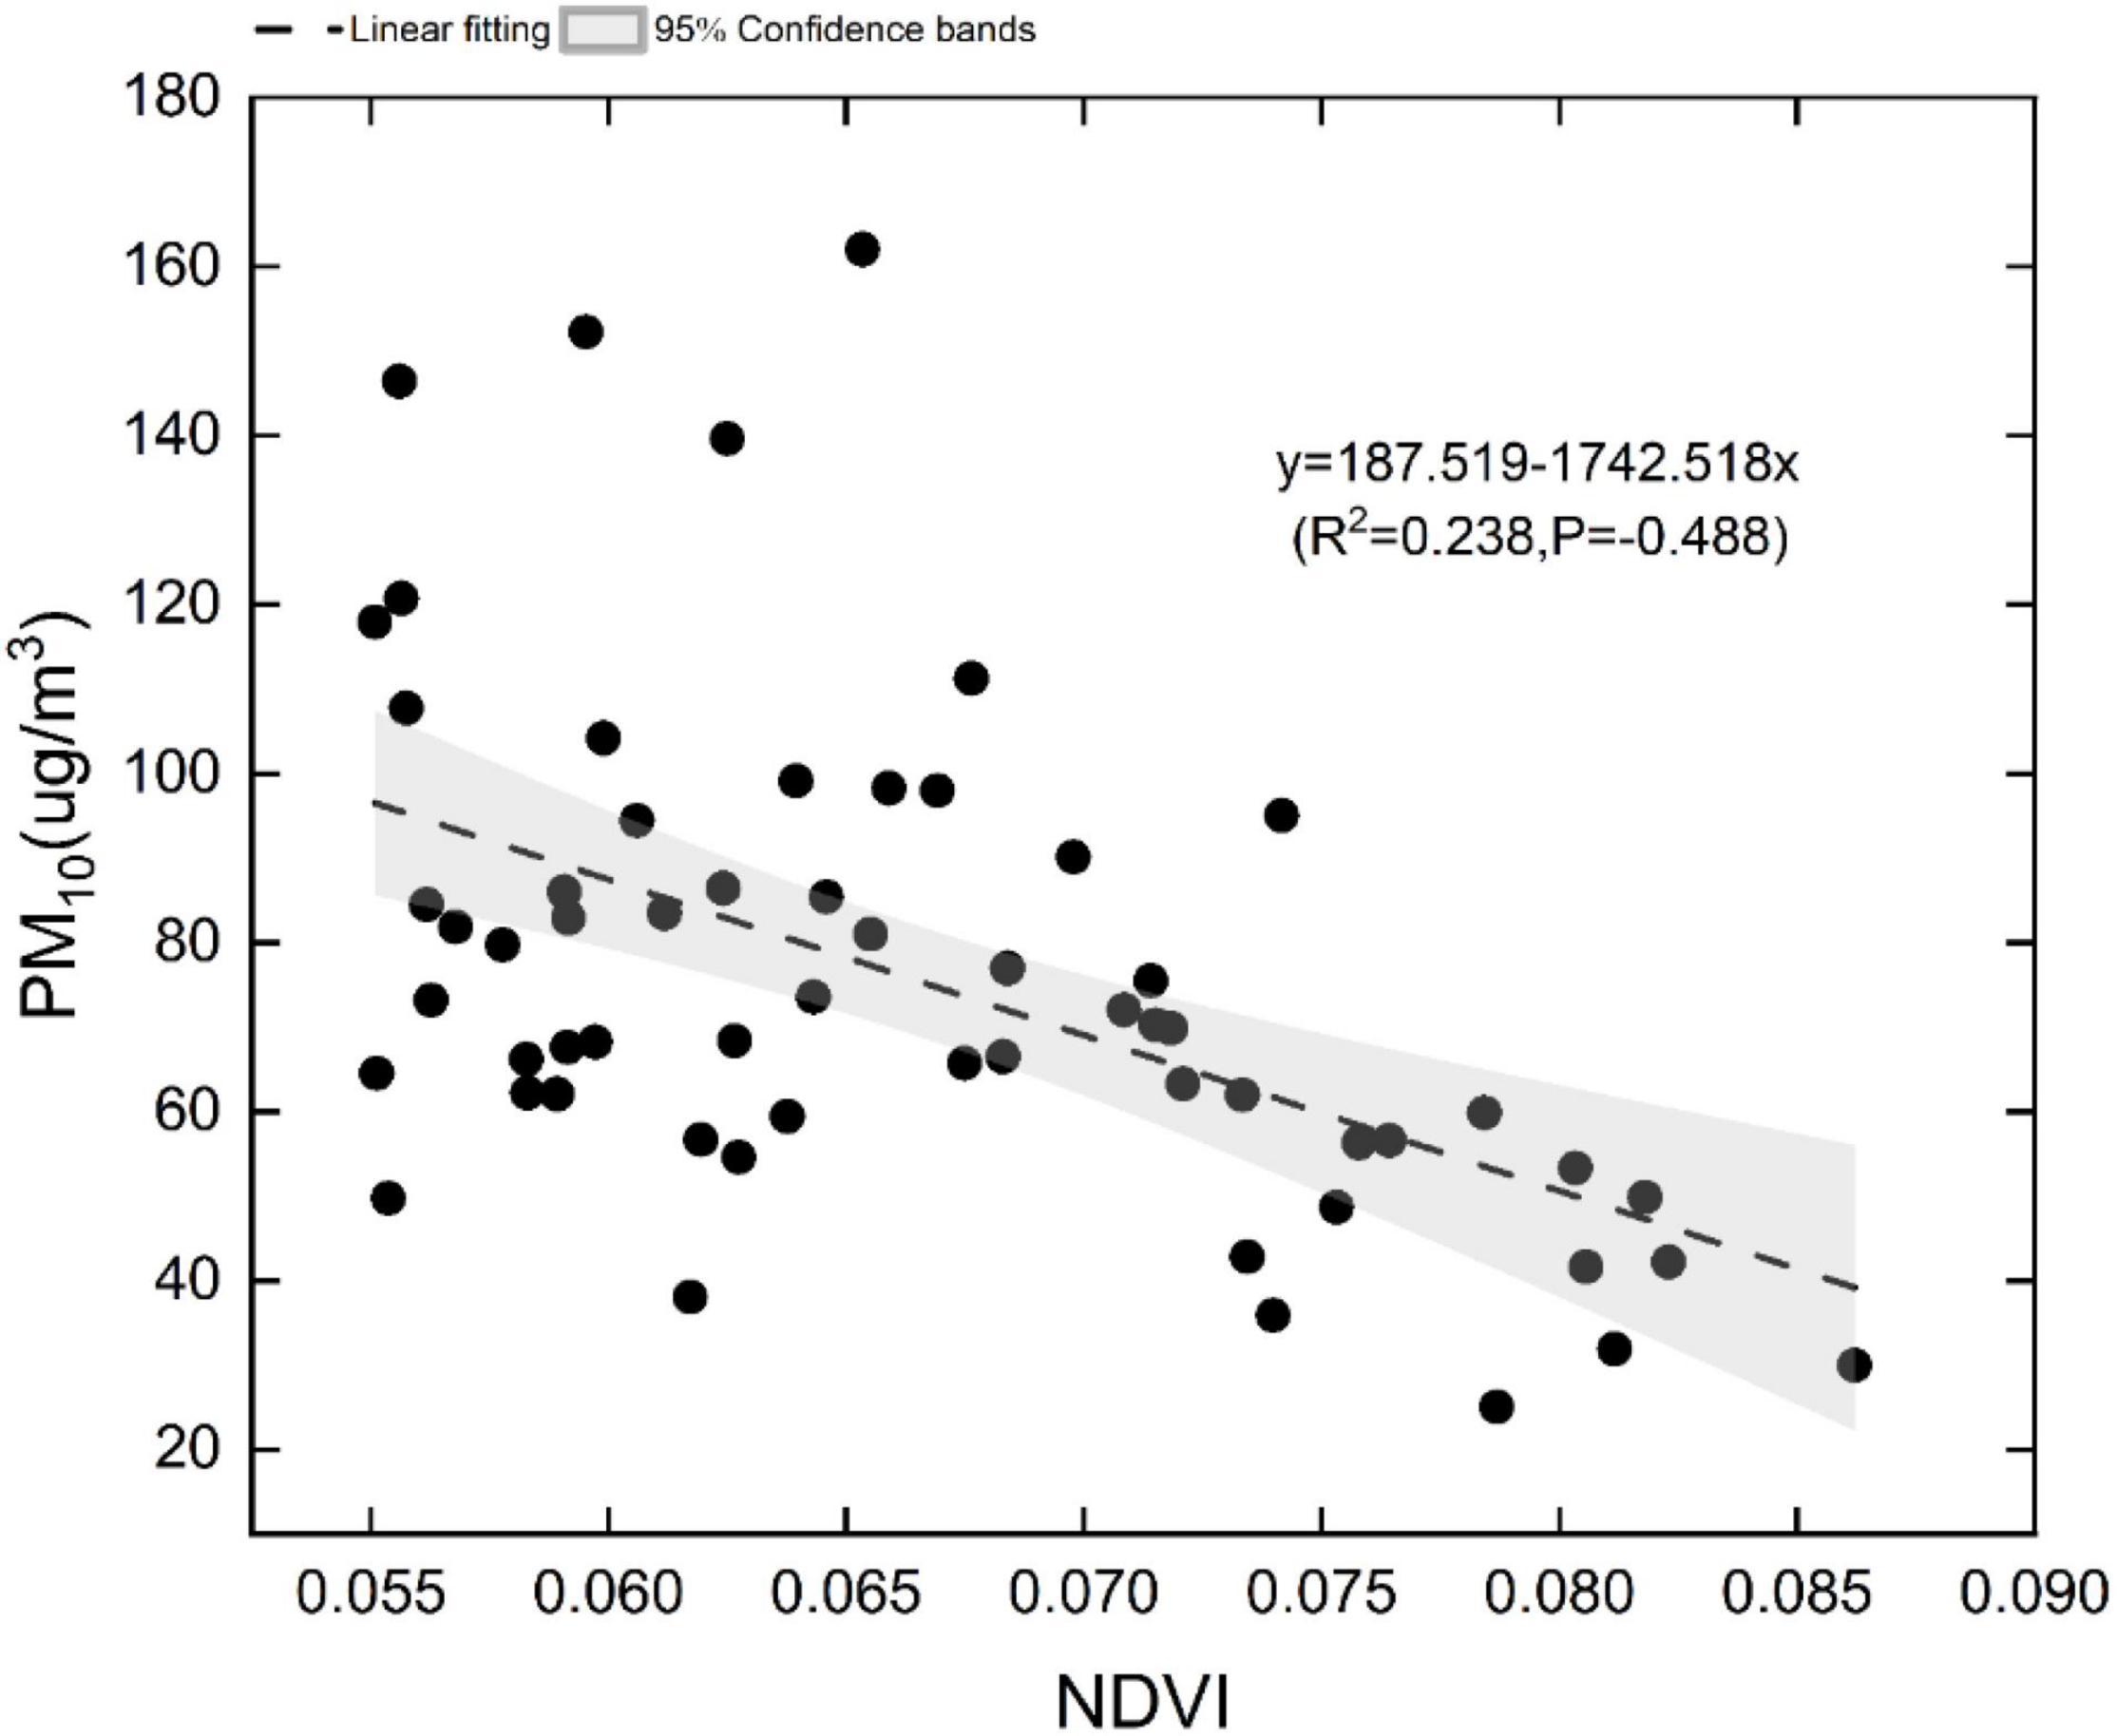
Figure 10. A Scatter plot of NDVI and PM10 in Alxa League from 2015 to 2019.
Figure 11 shows the spatial distribution of PM10 and its correlation with NDVI from 2000 to 2019. Overall, the average value of overall PM10 concentration in 20 years was 135.044ug/m3. The high-concentration areas were mainly in the desert areas in the northwest and east parts, while the low-concentration areas were primarily in the mountain areas in the southeast part. The NDVI and PM10 were positively correlated in space, and the average correlation coefficient was 0.349. Moreover, there was a positive correlation with the desert area in the northwest part. In terms of time variation, the NDVI was positively correlated with PM10, and the correlation coefficient was 0.522.
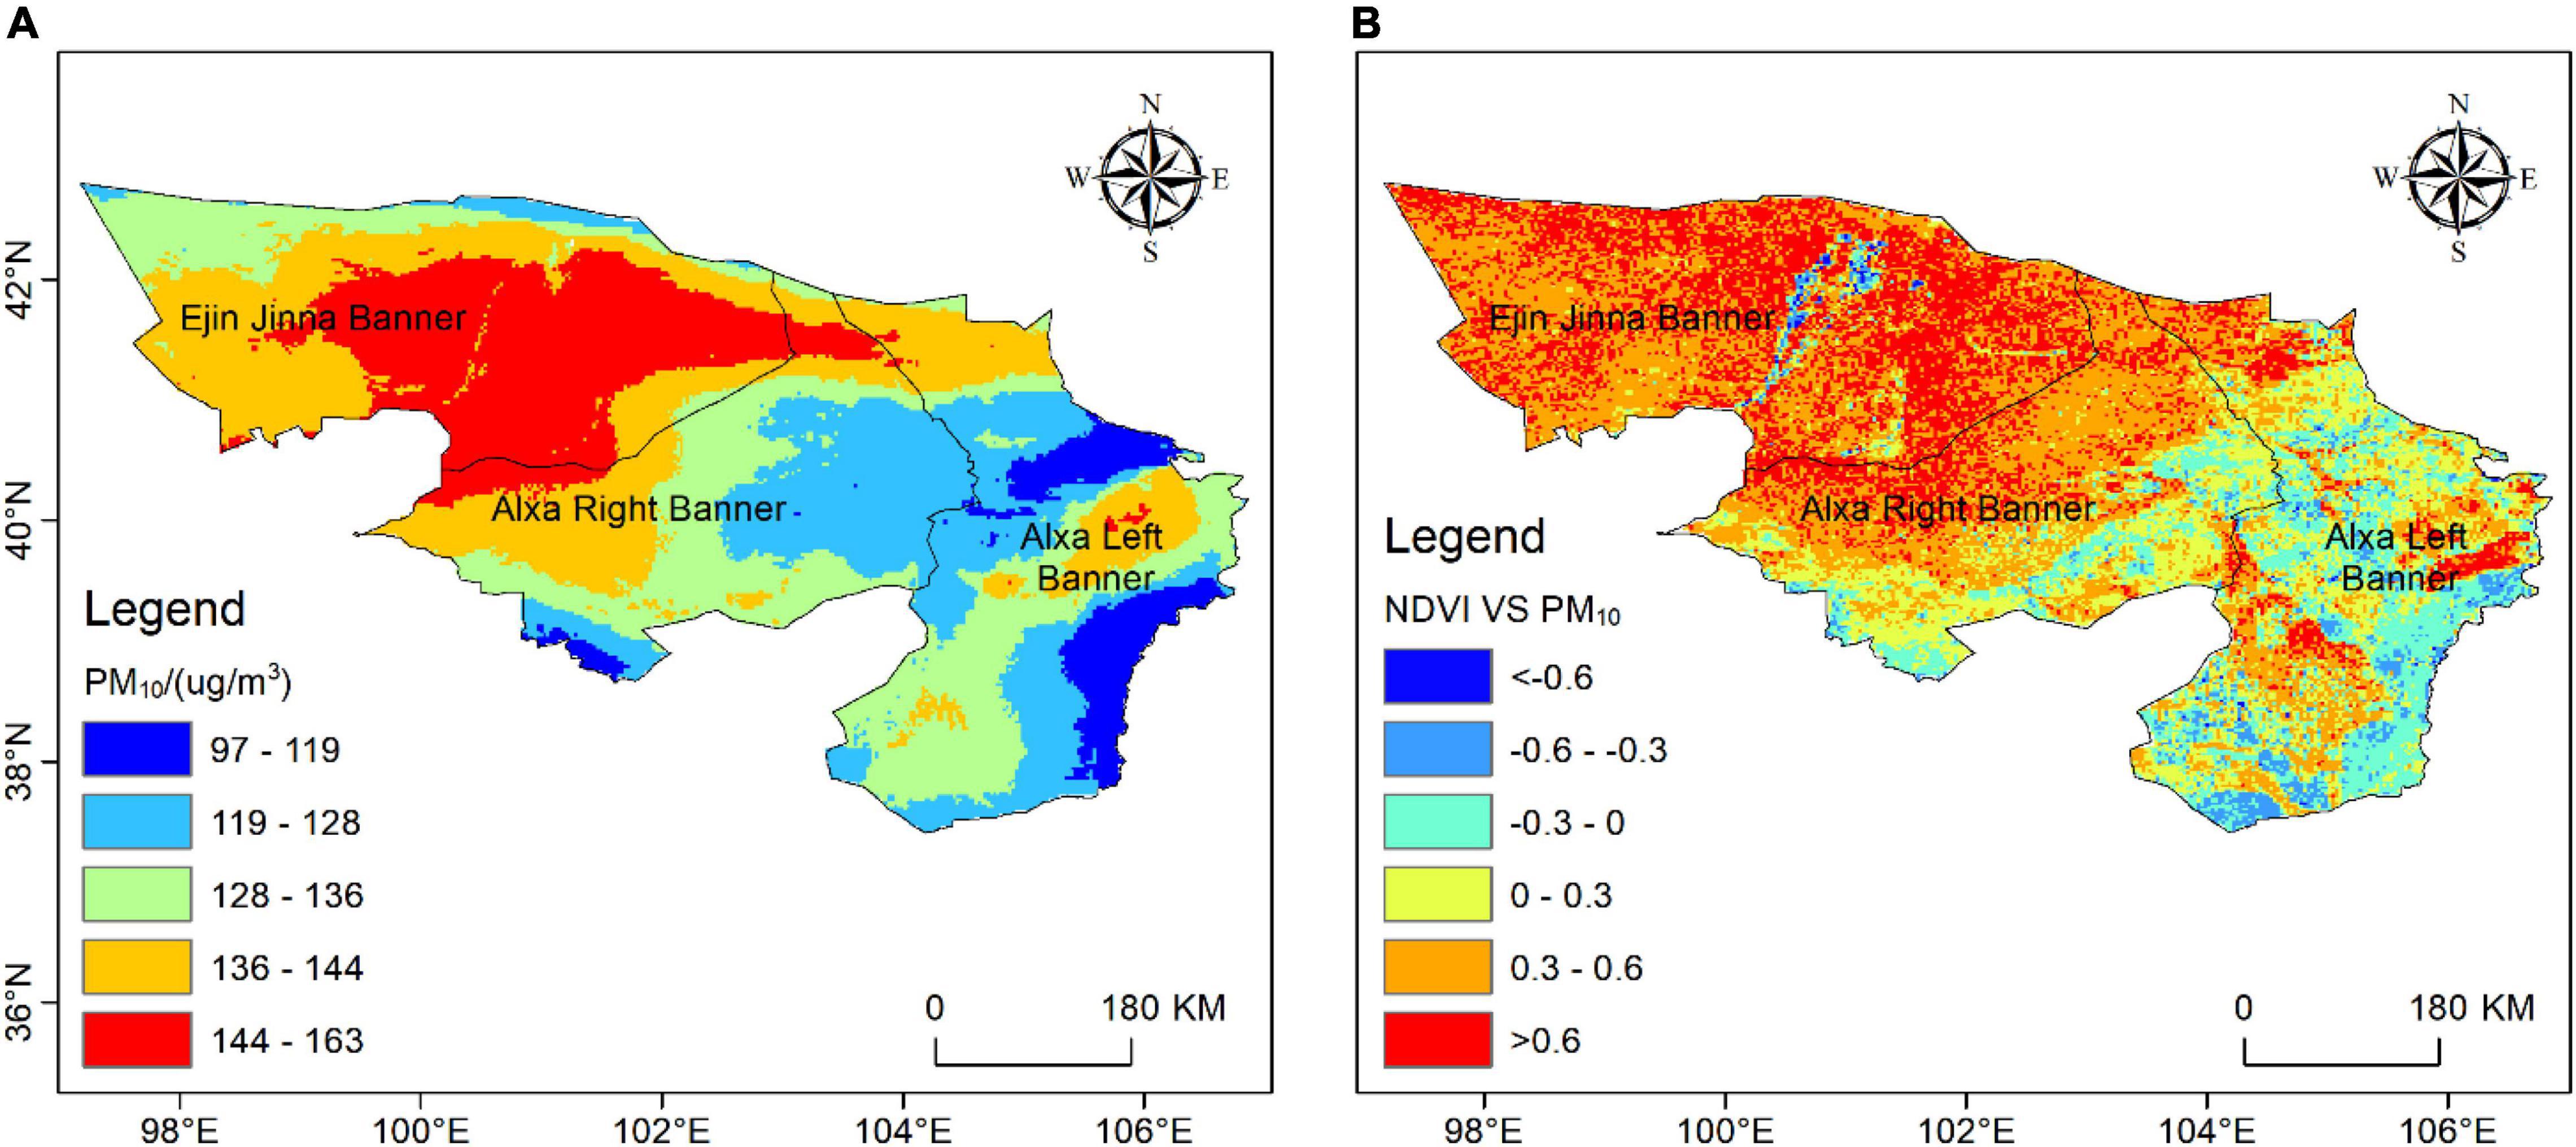
Figure 11. Spatial distribution of overall PM10 and its correlation with NDVI for 20 years.
Table 3 shows the seasonal variations NDVI and PM10 from 2015 to 2019. The NDVI value in the winter of 2015 was the lowest at 0.059, and the PM10 in the spring of 2018 was the highest at 146.146 ug/m3. In the five-year mean distribution, the NDVI and PM10 showed noticeable seasonal changes. The seasonal variation of NDVI was summer > autumn > spring > winter, and the seasonal variation of PM10 was spring > winter > summer > autumn. However, in these 5 years, when the PM10 concentration in spring increased, its NDVI value would decrease, making the case that the spring NDVI value was smaller than the winter NDVI value. Furthermore, Figure 12 presents that NDVI was negatively correlated with PM10 in spring, summer, and autumn but was positively correlated with PM10 in winter. In addition, in summer, the negative correlation between the NDVI and PM10 was the strongest, with a correlation coefficient of -0.938. The correlation between NDVI and PM10 was weak in winter, with a correlation coefficient of 0.074.
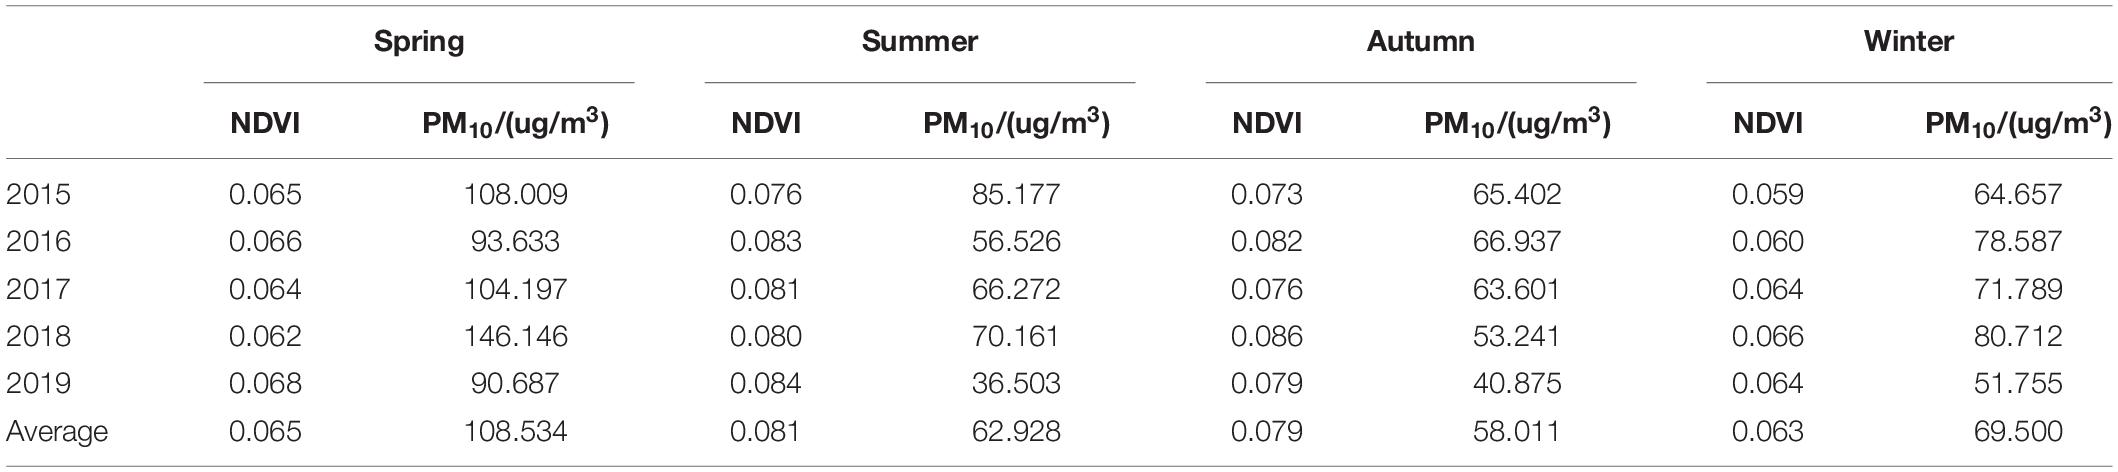
Table 3. Seasonal and interannual dynamic changes of NDVI and PM10 in Alxa League from 2015 to 2019.
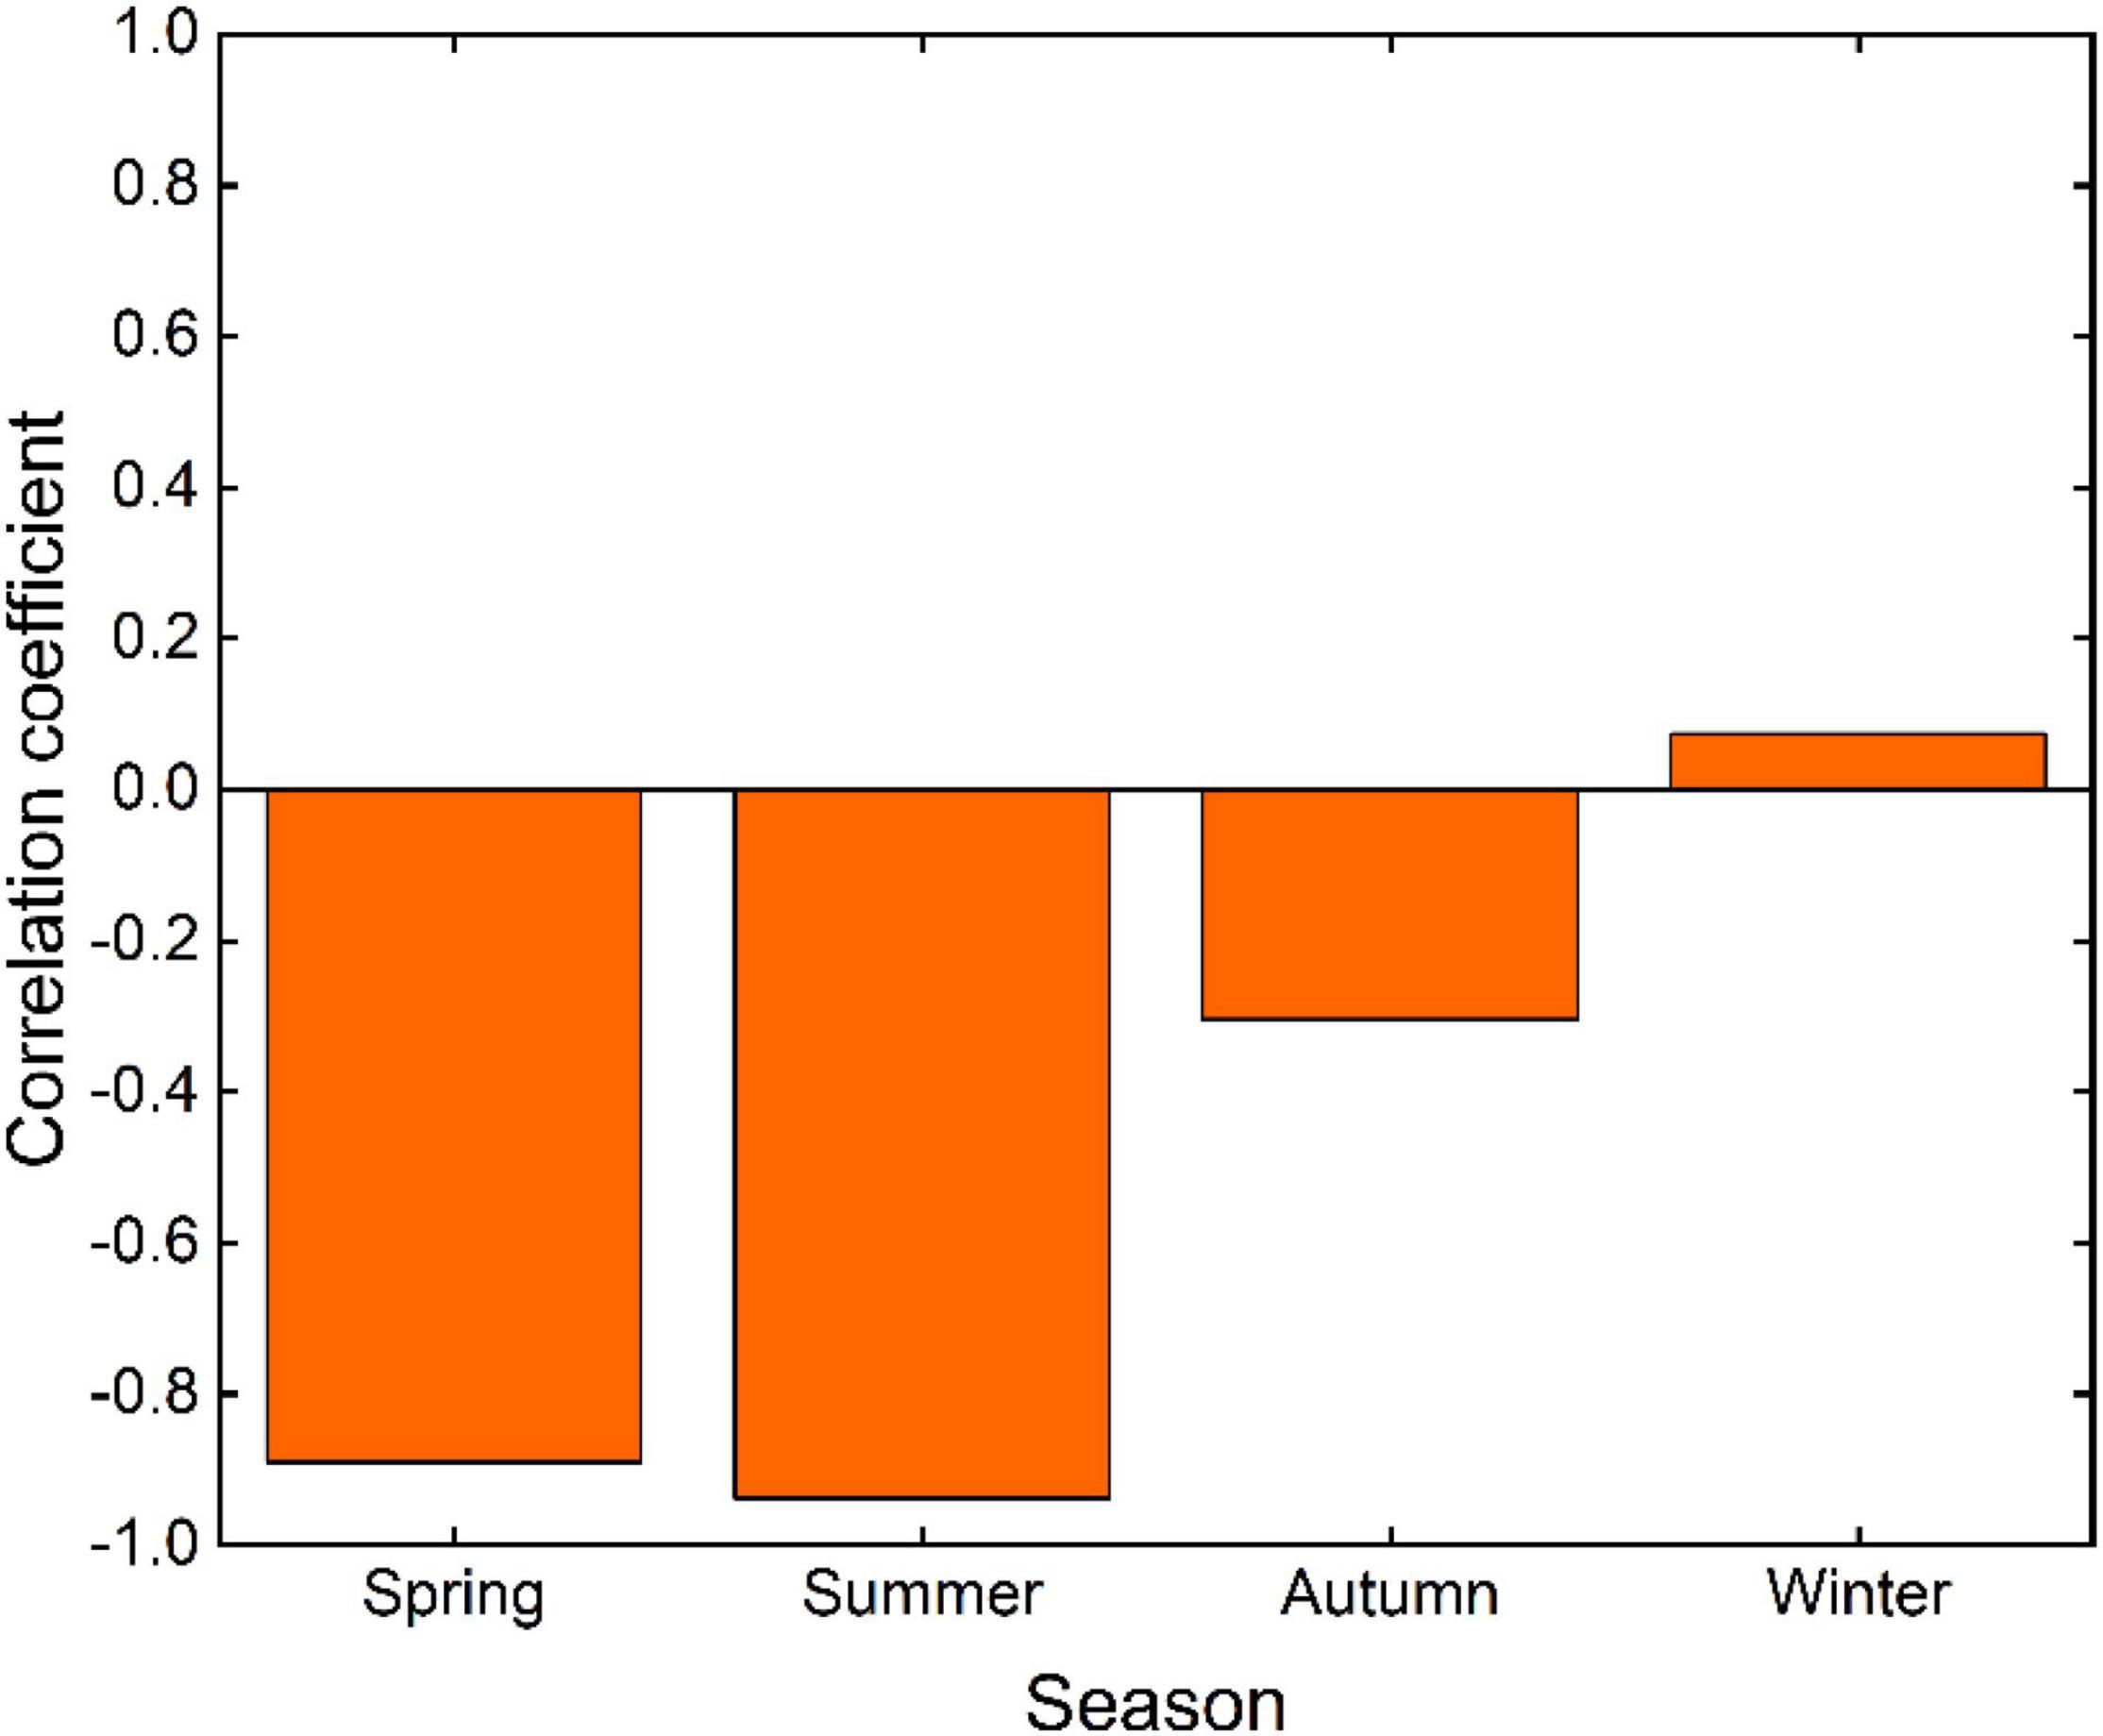
Figure 12. Distribution of correlation coefficients between NDVI and PM10 seasonal changes.
Discussion
Temporal and Spatial Distribution of Normalized Difference Vegetation Index
The NDVI value of Alxa League fluctuated before 2012, dropped sharply after 2012, and then slowly recovered after 2015. Our findings are consistent with those of other scholars who have studied vegetation in Alxa League or the entire Chinese region (Xie et al., 2021). After 2012, the desertification situation of Alxa League worsened. Zhang and Huisingh (2018) and others found that warm and dry climates were the critical factor leading to the deterioration of the ecological environment, and the frequent occurrence of severe weather such as sand and dust weather was the driving factor for the decline of the environmental climate. In addition, in the Qinghai–Tibet Plateau, the warm and dry environment caused by the continuous uplift was the fundamental factor for the fragile ecological environment. In terms of spatial distribution, the overall NDVI value of Alxa League was low, which was the same as the change of the NDVI value in other arid regions (Suzuki et al., 2001; Shabanov et al., 2021). In areas with severe desertification, the vegetation was mainly in the city center, indicating that the population in the desert area was the most critical factor affecting the vegetation change. The higher NDVI values in the southern and southeastern regions were due to the extensive planting of trees and the distribution of mountains and rivers. In terms of the trend and significance of NDVI changes, the desertification in the northwestern part of the League intensified. The desertification in the southeastern region reduced, indicating that, although relevant measures and means to protect the ecological environment had been implemented, the desertification trend could not be solved in a short time. A series of policies and measures to improve the ecological environment implemented by the state, such as returning grazing land to grassland and planting artificial forests, indeed improved the environmental climate in arid areas. This is also the one of most effective ways to improve the ecological environment in dry regions.
Spatial Heterogeneity of Land Use Type and Topographic Factors in Normalized Difference Vegetation Index
Topography controlled the distribution of vegetation patterns (Riihimäki et al., 2016). Our results show that elevation had the most significant impact on local vegetation patterns in the large-scale study range, followed by slope and aspect, consistent with previous studies (Wang et al., 2019; Xu et al., 2020). The average value of the NDVI was mainly concentrated in the area with a slope > 25°, which may be because the room with a higher pitch had suffered minor artificial damage, and the vegetation distribution in this area was mainly natural vegetation and abandoned farmland. A suitable slope aspect was conducive to the growth and survival of vegetation. The influence of the slope aspect on vegetation was reflected in the difference between solar radiation and sunshine hours. There were apparent differences in air temperature and vegetation between light-facing and back-lighting slopes. The solar radiation on the south slope was the strongest, followed by the southeast slope and the southwest slope. Again, the east and west slopes and the northeast and northwest slopes had the least solar radiation (Yirdaw et al., 2015). The north slope had the highest average NDVI in this study, and the flat had the lowest average NDVI. It might be because water-saving shrubs and semi-shrubs dominated the vegetation in this area. At the same time, the southern slope was a light-facing slope, with stronger solar radiation, higher air temperature, and faster water evaporation, resulting in a drier and hotter growth environment for vegetation. This negatively affected vegetation growth in the area, so the vegetation was concentrated on the northern slope with little solar radiation. However, our results show that the mean NDVI was the lowest when the slope aspect was flat because there were more deserts and Gobi regions in this area.
Effects of Air Temperature, Precipitation, Soil Moisture, Total Evaporation, and Human Activities on the Dynamic Changes of Normalized Difference Vegetation Index
Air temperature and precipitation indirectly affect the productivity of terrestrial ecosystems by changing nutrient availability (Vo and Johnson, 2001; Jobbágy et al., 2002), and these two climatic factors affect soil moisture and microbial activities in Alxa League, thereby affecting the photosynthesis and respiration in vegetation. In the study area, the air temperature negatively correlated with the NDVI in both time and space, consistent with the research results of related researchers in Iraq, also an arid region (Daham et al., 2018). This is because the air temperature will cause cell dehydration and affect plants’ physiological and metabolic activities if it is too high. Precipitation had a weak positive correlation in both time and space. Still, areas with a positive correlation were relatively densely vegetated areas, which indicated that in most cases, precipitation was positively correlated with the NDVI. In addition, most of the negatively correlated areas were desert areas. Relevant studies have shown that the NDVI and precipitation in adjacent areas were also negatively correlated (Guan et al., 2018). The weather in the Alxa League area was cold and snowy and frozen, causing the water in the cells to freeze and rupture, especially in winter. The correlation coefficient between NDVI and soil moisture and the correlation coefficient between NDVI and precipitation were similar. Still, the soil moisture correlation was lower, and soil moisture was positively correlated in time. Similarly, the air temperature was identical to total evaporation. Still, total evaporation was less correlated, suggesting that the NDVI was more strongly associated with air temperature and precipitation among the four factors. This shows that a certain amount of soil moisture can promote the growth of vegetation. In addition, the NDVI was negatively correlated with total evaporation in space and time because an increase in total evaporation affected soil moisture and vegetation growth changes in the area. Around 2015, when the NDVI value dropped sharply, the air temperature increased and the fluctuation of total evaporation decreased, which may be the reason for its sharp decline. Alxa League NDVI and climatic factors were in such a state because the region was in a continental extreme arid climate zone, with hot summers and little rain, cold and windy winters, scarce precipitation, very scarce surface water resources, and intense evaporation. There was abundant wind and sand, and the power of human beings cannot withstand the harsh natural conditions. The NDVI has a strong positive correlation with population, indicating that, in other arid and semi-arid regions similar to arid climates, the impact of human habitation on ecological vegetation could dominate (Zhang Z. et al., 2021).
Influence of PM10 on the Dynamic Change of Normalized Difference Vegetation Index
Figures 9, 10 show the negative correlation between NDVI values and PM10, which is consistent with previous studies (Xu et al., 2015). The NDVI values were the highest in June, July, and August in each year, and the PM10 concentrations were the highest in January, February, and March, which was in line with the maximum NDVI value in the growing season and the spring sandstorms in Alxa League area (Hao and Li, 2012; Lin et al., 2013). In addition, the results in Figure 11 show that the NDVI and PM10 had a strong negative correlation in all three seasons and only a weak positive correlation in winter. The positive correlation in winter may be because the high pressure of Inner Mongolia influences the winter atmosphere in the Alxa League area, and the League area was windy in winter, making the sand particles on the vegetation surface to blow away. Moreover, the three deserts in the study area were the source of PM10 transported from many cities in China, transporting the absorbable particles in the area to other cities. Table 3 shows that, in the 5-year average, the NDVI value reached the maximum value in every summer and the minimum value in every winter, and the PM10 value showed an opposite pattern. However, in the years with high PM10 concentration, the NDVI value in spring was lower than that in winter, indicating that absorbable particulate matter did affect the observation accuracy of the Normalized Difference Vegetation Index. Although the overall spatial distribution of the NDVI and PM10 was positively correlated, in places with lush vegetation, the NDVI was significantly negatively correlated with PM10. This indicates that the absorbable particulate matter may affect the observation accuracy of the NDVI, but when in the desert region of the League, the NDVI was positively correlated with PM10. Overall, there is a need to conduct further field investigation and research reasons.
Conclusion
Using the NDVI, this study investigated the vegetation dynamic change in the arid Alxa League from 2000 to 2019 and analyzed the correlation between the NDVI and land cover types, topographic factors (elevation, slope, and aspect), climatic factors (air temperature and precipitation), soil moisture, total evaporation, human activity factors (population size, engineering water supply, and total irrigation area), and inhalable particulate matter (PM10). The main conclusions drawn are presented as follows.
1. The NDVI across Alxa League was generally low, while high NDVI values were found in areas with frequent and high human activities (city centers, etc.). The highest NDVI of the region was found in 2012, while the NDVI has decreased significantly in recent years. The NDVI value in the northwest of the Alxa League area showed a slight degradation trend, and the NDVI value in the southeast showed a slight improvement trend.
2. The main land cover types in Alxa League are bare/sparse vegetation. When the land cover types were tree cover and bare/sparse vegetation, the NDVI values were the highest and lowest, respectively. The elevation, slope, and aspect made a difference in the spatial distribution pattern of the NDVI, and the impact of the elevation was the most significant.
3. The NDVI was negatively correlated with air temperature, precipitation, soil moisture, and total evaporation in space. In comparison, the NDVI was positively correlated with total evaporation in time, but the correlation was weak. There was also a strong positive correlation between the population and NDVI.
4. There was a negative correlation between the NDVI and PM10 in monthly changes. On the seasonal variations, there was a strong negative correlation between the NDVI and PM10 in spring, summer, and autumn but a weak positive correlation in winter. When the PM10 concentration was higher, the NDVI value in spring was lower than that in winter. In the interannual variation, the areas with high PM10 values were mainly desert areas. The NDVI showed a weak positive correlation with overall PM10 and a negative correlation in areas with lush vegetation. The interannual temporal variation also showed a positive correlation between the NDVI and PM10.
Data Availability Statement
The data analyzed in this study is subject to the following licenses/restrictions: The original contributions presented in the study are included in the article, further inquiries can be directed to PZ, 212104020091@home.hpu.edu.cn.
Author Contributions
PZ, DZ, and XL: conceptualization, methodology, and visualization. PZ and XL: software and funding acquisition. DZ, LD, and B-JH: validation. PZ: formal analysis and investigation. DZ and XL: supervision. LD, DZ, and XL: writing—first draft. B-JH and XL: writing—review and editing. All authors contributed to the article and approved the submitted version.
Funding
This research was funded by the National Natural Science Foundation of China (Grant No. 52108011), China Postdoctoral Science Foundation (Grant No. 2021M701249), Guangzhou Philosophy and Social Science Planning 2022 Annual Project (Grant No. 2022GZQN14), the Department of Education of Guangdong Province (Grant No. 2021KTSCX004), Science and Technology Program of Guangzhou, China (Grant No. 202102020302), the Department of Housing and Urban–Rural Development of Guangdong Province (Grant No. 2021-K2-305243), and the State Key Laboratory of Subtropical Building Science, South China University of Technology (Grant No. 2021ZB16).
Conflict of Interest
XL was employed by Architectural Design & Research Institute Co., Ltd.
The remaining authors declare that the research was conducted in the absence of any commercial or financial relationships that could be construed as a potential conflict of interest.
Publisher’s Note
All claims expressed in this article are solely those of the authors and do not necessarily represent those of their affiliated organizations, or those of the publisher, the editors and the reviewers. Any product that may be evaluated in this article, or claim that may be made by its manufacturer, is not guaranteed or endorsed by the publisher.
Acknowledgments
We thank all individuals and organizations who provided data.
Supplementary Material
The Supplementary Material for this article can be found online at: https://www.frontiersin.org/articles/10.3389/fevo.2022.922739/full#supplementary-material
Footnotes
- ^ http://www.vito-eodata.be
- ^ https://viewer.esa-worldcover.org/worldcover
- ^ https://srtm.csi.cgiar.org/srtmdata/
- ^ https://cds.climate.copernicus.eu/cdsapp/search
- ^ http://tjj.als.gov.cn/col/col4189/index.html
- ^ http://www.mee.gov.cn/
References
Amano, H., and Iwasaki, Y. (2020). Land cover classification by integrating NDVI time series and gis data to evaluate water circulation in aso Caldera, Japan. Int. J. Environ. Res. Public Health 17:6605. doi: 10.3390/ijerph17186605
Baniya, B., Tang, Q., Huang, Z., Sun, S., and Techato, K. (2018). Spatial and temporal variation of NDVI in response to climate change and the implication for carbon dynamics in Nepal. Forests 9:329. doi: 10.3390/f9060329
Bishnoi, P., Sharma, P., and Kumar, E. M. (2021). Analyzing dynamics of degraded lands using NDVI time-series in a semi-arid region of India. Arab. J. Geosci. 14:828. doi: 10.1007/s12517-021-07096-1
Boulton, C. A., Lenton, T. M., and Boers, N. (2022). Pronounced loss of Amazon rainforest resilience since the early 2000s. Nat. Clim. Change 12, 271–278. doi: 10.1038/s41558-022-01287-8
Burrell, A. L., Evans, J. P., and Kauwe, M. (2020). Anthropogenic climate change has driven over 5 million km2 of drylands towards desertification. Nat. Commun. 11:3853. doi: 10.1038/s41467-020-17710-7
Daham, A., Han, D., Rico-Ramirez, M., and Marsh, A. (2018). Analysis of NVDI variability in response to precipitation and air temperature in different regions of Iraq, using MODIS vegetation indices. Environ. Earth Sci. 77:389. doi: 10.1007/s12665-018-7560-x
Guan, Q., Yang, L., Guan, W., Wang, F., Liu, Z., and Xu, C. (2018). Assessing vegetation response to climatic variations and human activities: spatiotemporal NDVI variations in the hexi corridor and surrounding areas from 2000 to 2010. Theor. Appl. Climatol. 135, 1179–1193. doi: 10.1007/s00704-018-2437-1
Hao, Y., and Li, L. (2012). Study of the characteristics, disaster and prevention of sandstorm in the central and western regions of inner Mongolia. Adv. Mat. Res. 433-440, 1366–1371. doi: 10.4028/www.scientific.net/AMR.433-440.1366
Harris, I., Osborn, T. J., Jones, P., and Lister, D. (2020). Version 4 of the CRU TS monthly high-resolution gridded multivariate climate dataset. Sci. Data 7:109. doi: 10.1038/s41597-020-0453-3
He, B.-J., Wang, J., Liu, H., and Ulpiani, G. (2021). Localized synergies between heat waves and urban heat islands: implications on human thermal comfort and urban heat management. Environ. Res. 193:110584. doi: 10.1016/j.envres.2020.110584
He, B.-J., Wang, J., Zhu, J., and Qi, J. (2022). Beating the urban heat: situation, background, impacts and the way forward in China. Renew. Sustain. Energy Rev. 161:112350. doi: 10.1016/j.rser.2022.112350
He, W., Ye, C., Sun, J., Xiong, J., Wang, J., and Zhou, T. (2020). Dynamics and drivers of the alpine timberline on Gongga Mountain of tibetan plateau-adopted from the Otsu method on google earth engine. Remote Sens. 12:2651. doi: 10.3390/rs12162651
Huang, J., Gómez-Dans, J., Huang, H., Ma, H., and Xie, X. (2019). Assimilation of remote sensing into crop growth models: current status and perspectives. Agric. For. Meteorol. 276:107609. doi: 10.1016/j.agrformet.2019.06.008
Sheffield, J., and Wood, E. F. (2008). Projected changes in drought occurrence under future global warming from multi-model, multi-scenario, IPCC AR4 simulations. Clim. Dyn. 31, 79–105. doi: 10.1007/s00382-007-0340-z
Jiang, L., Liu, X., and Feng, Z. (2014). Remote sensing identification and spatial pattern analysis of the alpine timberline in the three parallel rivers region. Res. Sci. 36, 259–266.
Jiao, W., Wang, L., Smith, W. K., Chang, Q., and D’Odorico, P. (2021). Observed increasing water constraint on vegetation growth over the last three decades. Nat. Commun. 12:3777. doi: 10.1038/s41467-021-24016-9
Jobbágy, E. G., Sala, O. E., and Paruelo, J. M. (2002). Patterns and controls of primary production in the patagonian steppe: a remote sensing. Ecology 83, 307–319. doi: 10.1890/0012-9658(2002)083[0307:PACOPP]2.0.CO;2
Kooch, Y., Amani, M., and Abedi, M. (2022). Vegetation degradation threatens soil health in a mountainous semi-arid region. Sci. Total Environ. 830:154827. doi: 10.1016/j.scitotenv.2022.154827
Latif, A., Sana, I., Zhang, Y., Xin, Y., Zhou, L., and Zhou, Q. (2019). Review on global change status and its impacts on the Tibetan Plateau environment. J. Plant. Ecol. 12, 917–930. doi: 10.1093/jpe/rtz038
Leanne, L. C., Guillermo, H. R., David, S. H., Isabel, C. B., Carol, M. F., Cristina, C. S., et al. (2020). A methane sink in the central American high elevation páramo: Topographic, soil moisture and vegetation effects. Geoderma 362:114092. doi: 10.1016/j.geoderma.2019.114092
Lin, Q., Sun, L., Wang, X., and Hu, L. (2013). Spatio-temporal variation of vegetation NDVI in China from 2001 to 2011. Adv. Mat. Res. 610-613, 3752–3755. doi: 10.4028/www.scientific.net/AMR.610-613.3752
Measho, S., Chen, B., Pellikka, P., Guo, L., Zhang, H., Cai, D., et al. (2021). Assessment of Vegetation dynamics and ecosystem resilience in the context of climate change and drought in the Horn of Africa. Remote Sens 13:1668. doi: 10.3390/rs13091668
Mor-Mussery, A., Ben-Eli, M., and Leu, S. (2022). Afforestation of gullies in arid regions, intensification of internal ecological functionality until rehabilitation of the whole area. Attir basin, the Northern Negev, Israel. Catena 213:106146. doi: 10.1016/j.catena.2022.106146
Na, R., Na, L., Du, H., He, H., Shan, Y., Zong, S., et al. (2021). Vegetation greenness variations and response to climate change in the arid and semi-arid transition zone of the mongo-Lian Plateau during 1982–2015. Remote Sens 13:4066. doi: 10.3390/rs13204066
Nanzad, L., Zhang, J., Tuvdendorj, B., Nabil, M., Zhang, S., and Yun, B. (2019). NDVI anomaly for drought monitoring and its correlation with climate factors over Mongolia from 2000 to 2016. J. Arid Environ. 164, 69–77. doi: 10.1016/j.jaridenv.2019.01.019
Ren, Z., Tian, Z., Wei, H., Liu, Y., and Yu, Y. (2022). Spatiotemporal evolution and driving mechanisms of vegetation in the yellow river basin, China during 2000–2020. Ecol. Indic. 138:108832. doi: 10.1016/j.ecolind.2022.108832
Riihimäki, H., Heiskanen, J., and Luoto, M. (2016). The effect of topography on arctic-alpine aboveground biomass and NDVI patterns. Int. J. Appl. Earth Obs. 56, 44–53. doi: 10.1016/j.jag.2016.11.005
Shabanov, R. M., Dedov, A. A., Vershinin, V. V., Khutorova, A. O., and Dedova, A. A. (2021). Geoecological estimate of grassland use in the desert and semi-desert zone of the Republic of Kalmykia. IOP Conf. Ser. Earth Environ. Sci. 867:012077. doi: 10.1088/1755-1315/867/1/012077
Suzuki, R., Nomaki, T., and Yasunari, T. (2001). Spatial distribution and its seasonality of satellite-derived vegetation index (NDVI) and climate in Siberia. Int. J. Climatol. 21, 1321–1335. doi: 10.1002/joc.653
van den Dool, C., Huang, J., and Fan, Y. (2003). Performance and analysis of the constructed analogue method applied to U.S. soil moisture over 1981–2001. J. Geophys. Res. Atmos. 108:8617. doi: 10.1029/2002JD003114
Vo, S. T. K., and Johnson, E. A. (2001). Alpine plant life: functional plant ecology of high mountain ecosystems. Mt. Res. Dev. 21:202. doi: 10.1659/0276-4741(2001)021[0202:APLFPE]2.0.CO;2
Wang, H., Qi, Y., Huang, C., Li, X., Deng, X., and Zhang, J. (2019). Analysis of vegetation changes and dominant factors on the Qinghai-Tibet Plateau. China. Sci. Cold Arid. Reg. 11, 62–70.
Wang, J., Yang, X., Wang, Z., Cheng, H., Kang, J., Tang, H., et al. (2022). Consistency analysis and accuracy assessment of three global ten-meter land cover products in rocky desertification Region&mdash: a case study of southwest China. ISPRS Int. J. Geo. Inf. 11:202. doi: 10.3390/ijgi11030202
Wei, J., Li, Z., Xue, W., Sun, L., Fan, T., Liu, L., et al. (2021). The ChinaHighPM10 dataset: generation, validation, and spatiotemporal variations from 2015 to 2019 across China. Environ. Int. 146:106290. doi: 10.1016/j.envint.2020.106290
Wu, S., Gao, X., Lei, J., Zhou, N., and Wang, Y. (2020). Spatial and temporal changes in the normalized difference vegetation index and their driving factors in the desert/grassland biome transition zone of the sahel region of Africa. Remote Sens. 12:119. doi: 10.3390/rs12244119
Xie, J., Lu, Z., Xiao, S., and Yan, C. (2021). Driving force and ecosystem service values estimation in the extreme arid region from 1975 to 2015: a case study of Alxa League. China. Chin. Geogr. Sci. 31, 1097–1107. doi: 10.1007/s11769-021-1244-2
Xu, H., Cheng, T., Gu, X., Yu, T., Xie, D., and Zheng, F. (2015). Spatiotemporal variability in dust observed over the Sinkiang and inner Mongolia regions of Northern China. Atmos. Pollut. Res. 6, 562–571. doi: 10.5094/APR.2015.063
Xu, M., Li, X., Liu, M., Shi, Y., Zhou, H., Zhang, B., et al. (2020). Spatial variation patterns of plant herbaceous community response to warming along latitudinal and altitudinal gradients in mountainous forests of the Loess Plateau, China. Environ. Exp. Bot. 172:103983. doi: 10.1016/j.envexpbot.2020.103983
Yang, L., Shen, F., Zhang, L., Cai, Y., Yi, F., and Zhou, C. (2020). Quantifying influences of natural and anthropogenic factors on vegetation changes using structural equation modeling: a case study in Jiangsu Province, China. J. Clean. Prod. 280:124330. doi: 10.1016/j.jclepro.2020.124330
Yirdaw, E., Starr, M., Negash, M., and Yimer, F. (2015). Influence of topographic aspect on floristic diversity, structure and treeline of afromontane cloud forests in the Bale Mountains, Ethiopia. J. For. Res. 26, 919–931. doi: 10.1007/s11676-015-0155-4
Zanaga, D., Van De Kerchove, R., De Keersmaecker, W., Souverijns, N., Brockmann, C., and Quast, R. (2021). ESA WorldCover 10 m 2020 v100. Wageningen: VITO Remote Sensing, Brockmann Consult, CS SI, Gamma Remote Sensing AG, IIASA and Wageningen University.
Zhang, Y., He, Y., Li, Y., and Jia, L. (2022). Spatiotemporal variation and driving forces of NDVI from 1982 to 2015 in the Qinba Mountains, China. Environ. Sci. Pollut. Res. doi: 10.1007/s11356-022-19502-6
Zhang, Y., Yu, W., Ji, R., Zhao, Y., Peng, R., Jia, Q., et al. (2021). Dynamic response of Phragmites australis and suaeda salsa to climate change in the Liaohe Delta wetland. J. Meteor. Res. 35, 157–171. doi: 10.1007/s13351-021-0016-3
Zhang, Z., and Huisingh, D. (2018). Combating desertification in China: monitoring, control, management and revegetation. J. Clean. Prod. 182, 765–775. doi: 10.1016/j.jclepro.2018.01.233
Zhang, Z., Xu, E., and Zhang, H. (2021). Complex network and redundancy analysis of spatial–temporal dynamic changes and driving forces behind changes in oases within the Tarim Basin in northwestern China. Catena 201:105216. doi: 10.1016/j.catena.2021.105216
Zhao, A., Zhang, A., Liu, X., and Cao, S. (2017). Spatiotemporal changes of normalized difference vegetation index (NDVI) and response to climate extremes and ecological restoration in the Loess Plateau, China. Theor. Appl. Climatol. 132, 555–567. doi: 10.1007/s00704-017-2107-8
Zhao, D., Arshad, M., Wang, J., and Triantafilis, J. (2021). Soil exchangeable cations estimation using Vis-NIR spectroscopy in different depths: effects of multiple calibration models and spiking. Comput. Electron. Agric. 182:105990. doi: 10.1016/j.compag.2021.105990
Zhao, D., Li, N., Zare, E., Wang, J., and Triantafilis, J. (2020). Mapping cation exchange capacity using a quasi-3d joint inversion of EM38 and EM31 data. Soil Tillage Res. 200:104618. doi: 10.1016/j.still.2020.104618
Keywords: drought, NDVI, topographical differentiation, climate factors, soil moisture, total evaporation, human activities, absorbable particulate matter
Citation: Zhou P, Zhao D, Liu X, Duo L and He B-J (2022) Dynamic Change of Vegetation Index and Its Influencing Factors in Alxa League in the Arid Area. Front. Ecol. Evol. 10:922739. doi: 10.3389/fevo.2022.922739
Received: 18 April 2022; Accepted: 24 May 2022;
Published: 22 June 2022.
Edited by:
Bing Xue, Institute of Applied Ecology (CAS), ChinaCopyright © 2022 Zhou, Zhao, Liu, Duo and He. This is an open-access article distributed under the terms of the Creative Commons Attribution License (CC BY). The use, distribution or reproduction in other forums is permitted, provided the original author(s) and the copyright owner(s) are credited and that the original publication in this journal is cited, in accordance with accepted academic practice. No use, distribution or reproduction is permitted which does not comply with these terms.
*Correspondence: Dongxue Zhao, zhaodx08@gmail.com; Xiao Liu, xiaoliu@scut.edu.cn