Spatiotemporal features of the soil moisture across Northwest China using remote sensing data, reanalysis data, and global hydrological model
 Meijun Wang1,2
  Gang Yin
 Zengyun Hu
 Xi Chen
- 1College of Geography and Remote Sensing Sciences, Xinjiang University, Urumqi, Xinjiang, China
- 2Research Center for Ecology and Environment of Central Asia, Chinese Academy of Sciences, Urumqi, Xinjiang, China
- 3Xinjiang Key Laboratory of Oasis Ecology, Xinjiang University, Urumqi, Xinjiang, China
- 4University of Chinese Academy of Sciences, Beijing, China
- 5State Key Laboratory of Desert and Oasis Ecology, Xinjiang Institute of Ecology and Geography, Chinese Academy of Sciences, Urumqi, Xinjiang, China
Soil moisture is an important factor affecting the change of land surface hydrological processes and the distribution of material and energy exchanges between the land and atmosphere and vegetation’s temporal and spatial distributions, especially in arid and semi-arid regions. This paper focuses on soil moisture features across Northwest China, the core region of the Silk Road Economic Belt. Six soil moisture datasets from the period 1981–2020 were employed, which included ERA5 (the European Centre for Medium-Range Weather Forecasts Atmospheric Reanalysis 5), ESA-CCI (European Space Agency Climate Change Initiative), GLDAS (Global Land Data Assimilation System), MERRA-2 (The Modern-Era Retrospective Analysis for Research and Applications, Version 2), RSSSM (A Remote Sensing-based global 10-day resolution Surface Soil Moisture dataset), and SSM-Feng (Regional multimodal fusion of surface soil moisture data in China). The temporal and spatial variation of the linear trend and abrupt change characteristics at seasonal and annual scale were explored. The results are as follows: 1) ESA-CCI, GLDAS, and MERRA-2 showed a slow increase in annual soil moisture tendency at a rate of less than 0.001 m3/m3/year, while ERA5 and SSM-Feng showed a significant decreasing linear trend at a rate of 1.31 × 10⁻⁴ m3/m3/year and 1.01 × 10⁻⁴ m3/m3/year (p < 0.05), respectively. 2) In autumn and winter, only GLDAS and MERRA-2 showed significant increasing trends. In the growing season (i.e., from April to October), the soil moisture of ESA-CCI, GLDAS, and MERRA-2 significantly increased at the rates of 3.29 × 10⁻⁴ m3/m3/year, 3.30 × 10⁻⁴ m3/m3/year, and 6.64 × 10⁻⁴ m3/m3/year (p < 0.05), respectively. 3) ERA5 and ESA-CCI have frequent abrupt changes in 1984, 1987, and 2006 for ERA5, 2010–2012 and 2019–2020 for ESA-CCI. 4) In terms of spatial variations, most datasets show that soil moisture has increased across most regions. The ERA5, ESA-CCI, GLDAS, MERRA-2, and SSM-Feng datasets show decreased soil moisture in the Tarim Basin. The conclusions of this study deepen the understanding of temporal and spatial variation in soil moisture in arid areas of Northwest China. Through these conclusions, a certain theoretical basis can be provided for the complex water cycle process in the arid region.
1 Introduction
Soil moisture is one of the essential components in land–atmosphere interaction, which affects the physical properties of soil (such as surface albedo and soil heat capacity). Soil moisture directly or indirectly participates in the water and heat exchange and material exchange between the surface and atmosphere to interact with the near-surface climate and affect or change the water cycle process and the temporal and spatial distribution characteristics of vegetation (Seneviratne et al., 2010; Zhou et al., 2021a). Moreover, as an indicator of climate change, soil moisture is widely used to measure drought characteristics on regional and global scales (McColl et al., 2017; Seneviratne and Orth, 2017; Zhao and Dai, 2021). Therefore, soil moisture analysis has become one of the most significant and vital scientific issues attracting increasing attention (Gu et al., 2019a; Deng et al., 2019; Deng et al., 2020; Yao et al., 2021).
Influenced by temperature, precipitation, wind speed, and vegetation cover, soil moisture shows significant temporal differences and spatial heterogeneities at regional and global scales (Das and Mohanty, 2006). According to the basic parameters of soil moisture data from the essential climate variable satellites, The Global Land Data Assimilation System (GLDAS), Coupled Model Intercomparison Project Phase 5 (CMIP5), and several kinds of reanalysis soil moisture data, the change characteristics of global surface soil moisture during 1980–2005 were analyzed (Gu et al., 2019a). All datasets showed a drying trend in global soil moisture (Gu et al., 2019a). Quantification of global hydroclimate and drought changes in the 21st century using 25 CMIP6 models showed that surface soil moisture is generally reduced in most parts of the United States of America, Southeast Asia, and North Asia (Zhao and Dai, 2021). At the regional scale, in Eurasia, over the past 63 years, soil moisture has generally decreased during the warm season (Gu et al., 2019b). The soil moisture data of the root zone (0–100 cm) were estimated using the ESA-CCI (European Space Agency Climate Change Initiative), as well as surface soil moisture data (0–5 cm), to understand the spatial and temporal distribution characteristics in the root zone of East Asia. The variation trend of soil moisture in the root zone was different in different climatic regions. From 1982 to 2014, 53% of the study area was dry land in East Asia (Zohaib et al., 2017).
The in situ observation data account for the most accurate soil moisture data. However, due to their low temporal and spatial resolution and small coverage time range, it is difficult to adapt to practical applications in the field of hydrometeorology (Bárdossy and Lehmann, 1998). With the rapid development of remote sensing technology, this problem has gradually been solved. Microwave sensors on satellites can observe soil moisture daily and worldwide; thus, they are widely used (Peng and Loew, 2017). For example, soil moisture products from the ESA-CCI have attracted considerable attention (Dorigo et al., 2017). However, satellite remote sensing of soil moisture has the disadvantages of measuring soil moisture in the root zone, temporal and spatial discontinuity of coverage, and limited historical data (Ford et al., 2020). In contrast, the land surface models and reanalysis products have the advantages of global coverage, high spatial and temporal resolution, long time series, spatial and temporal continuity, etc. Therefore, they can be used to study the spatial and temporal variation characteristics of soil moisture in a refined time scale. Therefore, many scholars have compared satellite remote sensing, land surface simulation, and reanalysis products at different regional scales (Peng et al., 2017; Bai et al., 2018; Deng et al., 2019; Deng et al., 2020). Although model outputs are spatially and temporally continuous, there is uncertainty in model-simulated soil moisture products because of the physical model structure, input parameters, input datasets, and other factors (Schellekens et al., 2017; Chew and Small, 2018; Gruber et al., 2019). Hence, multiple sources of soil moisture data are needed to investigate soil moisture variations and to overcome the disadvantages and uncertainties of single data.
The arid region of Northwest China plays a vital role in the Silk Road. The fragile ecosystem in Northwest China is susceptible to climate change and soil moisture. Recent studies have shown that this region has experienced a significant warming trend (Hu et al., 2014), wetting trend (Hu et al., 2017, 2019a), and decreasing terrestrial water storage (Hu et al. (2019b); Zhou et al., 2022) and groundwater. Furthermore, it has been shown that under the long-term influence of climatic drought, insufficient water supply, and substantial water consumption by plants, the phenomenon of soil moisture negative balance frequently occurs in the arid region of Northwest China. Therefore, soil desiccation becomes increasingly severe (Yan et al., 2015). Climate change, terrestrial water storage variations, and the response of soil moisture to climate and plants have substantial regional disparities. A previous study detected an increased soil moisture trend in Xinjiang during 2000–2017 using six GLDAS models (Hu et al., 2021a). Nevertheless, remote sensing and reanalysis data were not considered.
Based on this analysis, it is essential to address the following three questions regarding the arid region of Northwest China: 1) Do the different sources of soil moisture datasets have consistent spatiotemporal feature results? 2) Does soil moisture undergo abrupt changes? 3) Do soil moistures have evident regional disparities? In this paper, the soil moisture content in Northwest China was studied using satellite remote sensing, global land surface modeling, and reanalysis data. The second part is mainly about the research scope, data, and research methods. Next, we present our research results in the third section. A discussion is provided in the fourth section. The last section concludes this paper.
2 Study area, dataset, and methodology
2.1 Study area
The arid area in Northwest China is in the center of Eurasia and the core area of the Silk Road Economic Belt, located at 34°–50° N and 72°–107° E. It includes the Xinjiang Uygur Autonomous Region, the Hexi Corridor in Gansu Province, the Alxa Plateau to the west of Qilian Mountain in Inner Mongolia, a part of the northern Qilian Mountain in Qinghai Province, and a small part of Ningxia (Li et al., 2022). Affected by its topography and complex climate system, the study area has arid and semi-arid climate characteristics throughout the year, with precipitation less than 400 mm. The annual average potential evapotranspiration is high, up to 1216.39 mm, and its fragile ecosystem is extremely sensitive to climate change and human activities (Li and Sawada, 2022). The soil moisture observation stations are sparsely distributed in the arid region of Northwest China and are mainly concentrated near the Tian shan and Qilian Mountains (Figure 1). Based on the topography and climate characteristics, the study area was divided into nine sub-regions: the Altay Prefecture of Xinjiang, Junggar Basin, northern Tian shan Mountains, southern Tian shan Mountains, Tuha Basin, Tarim Basin, Kunlun Mountains, Hexi Corridor, and Alxa Plateau.
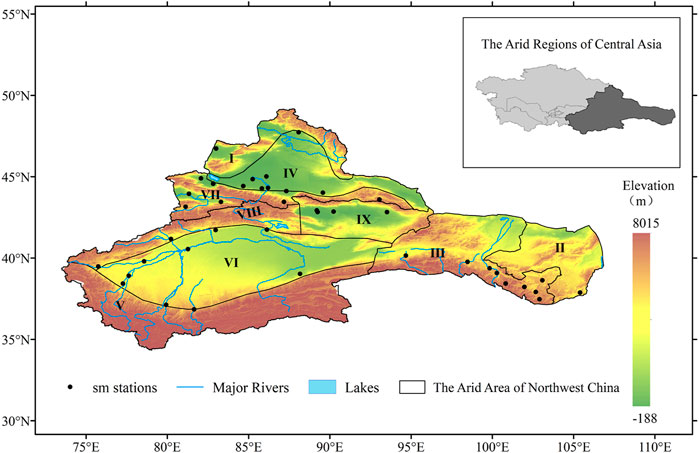
FIGURE 1. Study area and the station distribution in Northwest China, (Ⅰ) Altay Mountains, (Ⅱ) Alxa Plateau, (Ⅲ) Hexi Corridor, (Ⅳ) Junggar Basin, (Ⅴ) Kunlun Mountains, (Ⅵ) Tarim Basin, (Ⅶ) northern Tian shan Mountains, (Ⅷ) southern Tian Shan Mountains, and (Ⅸ) Tuha Basin, Figure number: GS(2019)1822.
2.2 Datasets
In this study, site soil moisture data were analyzed based on the gravity method, ERA5 reanalyzed soil moisture data, ESA-CCI active–passive satellite remote sensing soil moisture data, GLDAS land simulation soil moisture data, MERRA-2 reanalyzed soil moisture data, global surface soil moisture decade-based remote sensing dataset (RSSSM, 2003–2020), and China regional multi-mode fusion surface soil moisture data (SSM-Feng) (Table 1). The unit of all soil moisture data is soil volumetric water content (m3/m3), except that of MERRA-2 soil moisture data, which is ground wetness values (GWET). The details of data are in the Supplementary materials.
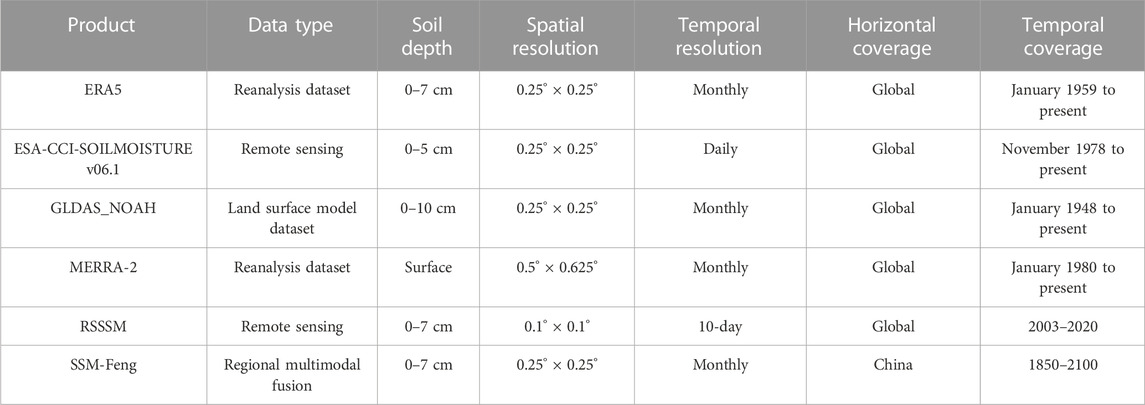
TABLE 1. Six soil moisture datasets used in this study.
2.3 Methodologies
This study analyzed the linear trend, mutation characteristics, and main spatial modes of soil moisture in the arid region of Northwest China. Linear least squares, Mann–Kendall abrupt test, Mann–Kendall trend analysis, and empirical orthogonal function (EOF) analysis were used. Considering the difference in the applicability of satellite remote sensing data, GLDAS data, and reanalysis data in different regions, the accuracy was evaluated using data from 41 stations. The accuracy evaluation methods include the correlation coefficient (CC), relative error (RE), root mean square error (RMSE), distance between indices of simulation and observation (DISO) and the triple collocation (TC) method. The DISO index is widely used in many fields, such as climate change, medicine, and economics (Hu et al., 2019; Hu et al., 2020; Zhou et al., 2021b; Hu et al., 2022; Liu et al., 2022; Yin et al., 2022; Zhang et al., 2022). TC (Stoffelen, 1998; Gruber et al., 2016) is a statistical method used to estimate the random error variance of three independent datasets. The specific method is described in the Supplementary Materials.
2.3.1 Seasonal and annual scales in this study
In order to study the dynamic change of soil moisture, the time scales were divided into annual and seasonal scales. Among them, the seasonal scales are divided into spring [from March to May (MAM)], summer [from June to August (JJA)], autumn [from September to November (SON)], winter [from December to February (DJF)], and growing season. The growing season is defined as April–October (Yin et al., 2016).
3 Result
This section mainly discusses the accuracy in evaluating multiple datasets and the temporal and spatial variation characteristics of soil moisture. The precision evaluation included statistical metrics and the TC method. The temporal variation characteristics included inter-annual and seasonal linear variation trends and abrupt change characteristics. Spatial variation includes linear trends, abrupt changes, and spatial modes. Moreover, we analyzed the spatiotemporal variations in nine sub-regions to address more detailed spatial differences.
3.1 Accuracy assessment of the six different soil moisture datasets
The accuracy of ERA5, ESA-CCI, GLDAS, MERRA-2, RSSSM, and SSM-Feng soil moisture datasets from 1992 to 2013 was evaluated using the soil moisture data of 41 ground observation stations in the arid area of Northwestern China. The statistical indices RE, RMSE, and DISO were calculated. The TC method was used to compare the statistical index results. Table 2 describes the assessment results derived from the three statistical indices. Supplementary Tables S1, S2 describe the TC results.
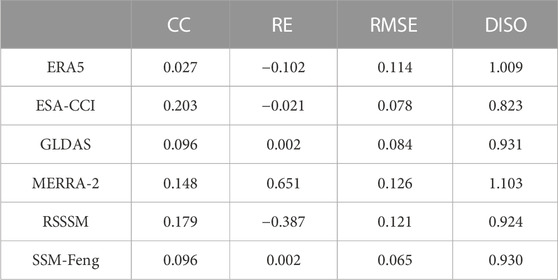
TABLE 2. Evaluation results of the six soil moisture datasets.
ERA5, ESA-CCI, and RSSSM underestimate the soil moisture, and the other three datasets ( GLDAS, MERRA-2, and SSM-Feng) slightly overestimate the observed data. GLDAS and SSM-Feng had the smallest RE with the same value of 0.002 m3/m3; the corresponding RMSE values were 0.084 m3/m3 and 0.065 m3/m3. The DISO values of the six datasets were approximately 1, with the smallest value of 0.823 for the ESA-CCI (Table 2).
The correlation coefficient was calculated between the datasets and combinations with a correlation coefficient greater than 0.5 were excluded, as shown in Table 3. The triple collocation method was used to calculate the errors among the multi-source soil moisture datasets, and the following conclusions were obtained (Supplementary Table S2). The error ranges of ERA5, ESA-CCI, and SSM-Feng were 0–0.12, 0–0.08, and 0–0.05, respectively. ERA5 had better precision throughout the entire study area, and the area with an error between 0 and 0.02 is the largest. The dataset’s accuracy in the eastern part of the arid region of Northwest China was higher than that in the northwestern part. The accuracies of ERA5, GLDAS, and SSM-Feng were similar, with error ranges of 0–0.15, 0–0.12, and 0–0.15, respectively. From the spatial scale, an area with an error smaller than 0.05 accounts for more than 90% of the total area (Supplementary Figure S1), and the areas with poor accuracy for the three datasets are the Kunlun Mountains and west of the southern slope of the Tian shan Mountains. The soil moisture product with the highest accuracy was in the combination ERA5 data. Among the three datasets, ESA-CCI had the smallest overall error range, with the average of error being 0.0112, and GLDAS had the higher overall error, with the average of error being 0.0122 (Supplementary Figure S2).
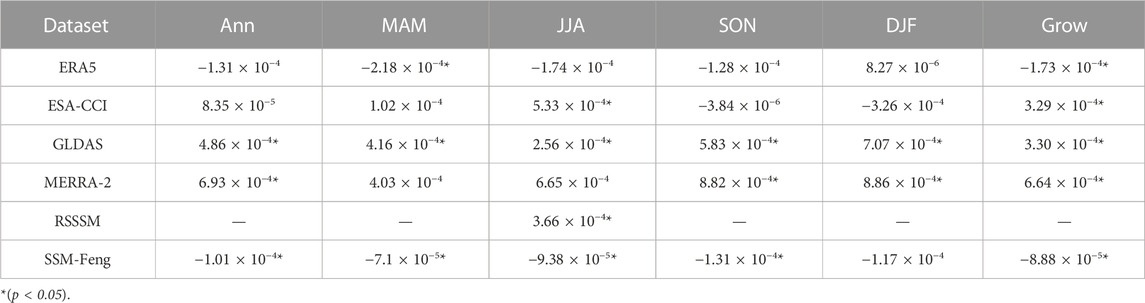
TABLE 3. Linear trends of the six soil moisture datasets in Northwest China.
The previously mentioned analysis shows that GLDAS, SSM-Feng, and ESA-CCI datasets have higher precision in the arid area of Northwest China. In contrast, accuracy evaluation using the TC method showed that the ERA5 and ESA-CCI datasets had higher accuracy than the different combinations. The difference between the two methods may be due to the need for more soil moisture data and the different depths of the soil surface layer in the multi-source soil moisture datasets.
3.2 Temporal variations of soil moisture
3.2.1 Linear trends and abrupt changes of the annual soil moisture
Because of the lack of data in the RSSSM, calculating the annual SM linear trend was challenging. The inter-annual variation trends of the five soil moisture products differed from 1981 to 2020 in the arid region of Northwest China (Figures 2, 3, 5), in which the soil moisture of ESA-CCI, GLDAS, and MERRA-2 showed an increasing trend. ESA-CCI and GLDAS showed a significant increasing tendency (p < 0.05). The annual SM of ERA5 and SSM-Feng decreased significantly at rates of 1.31 × 10⁻⁴ m3/m3/year and 1.01 × 10⁻⁴ m3/m3/year, respectively (p < 0.05).
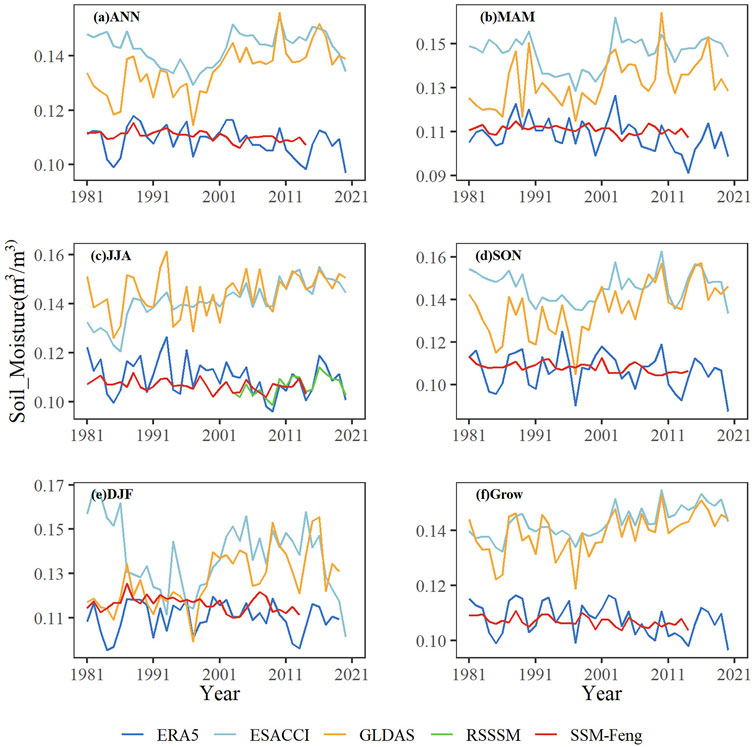
FIGURE 2. Temporal variations of annual and seasonal soil moisture in Northwest China (ERA5, ESA-CCI, GLDAS, RSSSM, and SSM-Feng), (A) ANN, (B) MAM, (C) JJA, (D) SON, (E) DJF, (F) Grow.
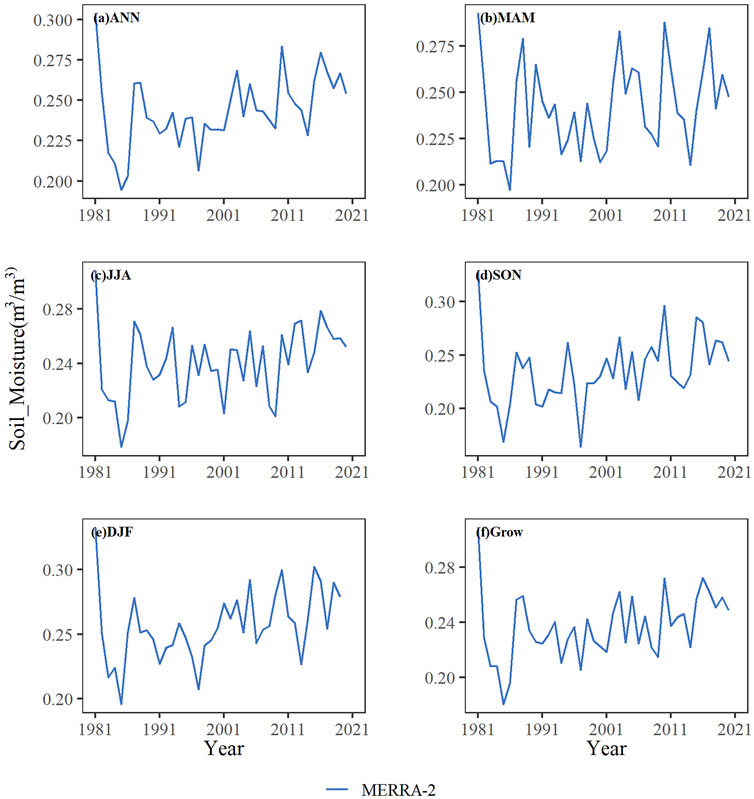
FIGURE 3. Temporal variations of annual and seasonal soil moisture in Northwest China (MERRA-2). (A) ANN, (B) MAM, (C) JJA, (D) SON, (E) DJF, (F) Grow.
For the abrupt changes, the Mann–Kendall results showed that abrupt changes in ERA5 and ESA-CCI data were frequent; the abrupt change in ERA5 data was concentrated in 1984, 1987, and 2006. The abrupt change years of ESA-CCI data were concentrated in 2000, 2001, 2011, 2012, 2019, and 2020 (Table 4). The abrupt change years of the GLDAS and MERRA-2 were concentrated in 2007 and 2015, respectively.
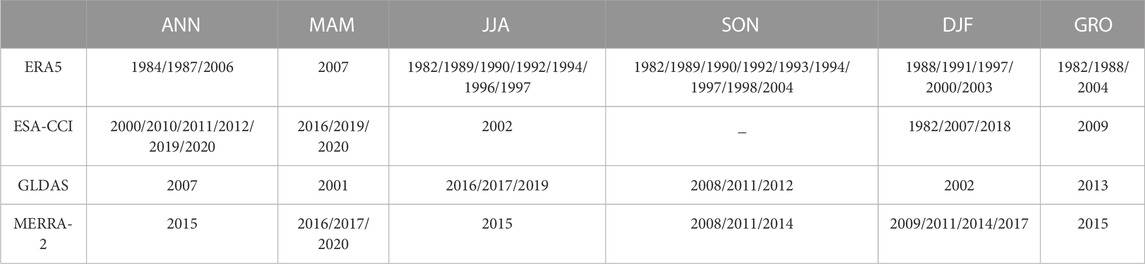
TABLE 4. Abrupt change years in the arid region of Northwest China from 1981 to 2020.
3.2.2 Linear trends and abrupt changes of the seasonal soil moisture
For the seasonal variations, the six datasets exhibited different linear trends (Figures 2, 3; Table 5). The GLDAS showed that soil moisture increased significantly (p < 0.05) in all seasons, with the smallest increase rate in summer (2.56×10⁻⁴ m3/m3/year) and the most significant increase rate in winter (7.07 × 10⁻⁴ m3/m3/year). The soil moisture drying rate was fastest in autumn (−1.31 × 10⁻⁴ m3/m3/year), while the RSSSM dataset did not have enough data for summer (3.66 × 10⁻⁴ m3/m3/year). In spring, ERA5 and SSM-Feng datasets showed a significant trend of soil moisture drying (p < 0.05), which were −2.18 × 10⁻⁴ m3/m3/year and −7.1 × 10⁻⁵ m3/m3/year, respectively. In contrast, ESA-CCI and MERRA-2 showed no significant trend. In summer, the variation trends of ERA5 and MERRA-2 were not significant. The ESA-CCI data showed that soil moisture increased significantly at a rate of 5.33 × 10⁻⁴ m3/m3/year (p < 0.05) in Northwest China. SSM-Feng showed a significant trend of soil moisture drying (p < 0.05), with a rate of change of −9.38 × 10⁻⁵ m3/m3/year. In autumn, the variation trends in ERA5 and ESA-CCI were not significant. The MERRA-2 dataset showed that soil moisture increased significantly (p < 0.05) at 8.82 × 10⁻⁴ m3/m3/year. In contrast, SSM-Feng showed a significant increase in soil moisture (p < 0.05) at 1.31 × 10⁻⁴ m3/m3/year. In winter, the changing trend of ERA5, ESA-CCI, and SSM-Feng datasets was insignificant, while the changing trend of MERRA-2 was significantly (p < 0.05) reduced, with a change rate of 8.86 × 10⁻⁴ m3/m3/year.
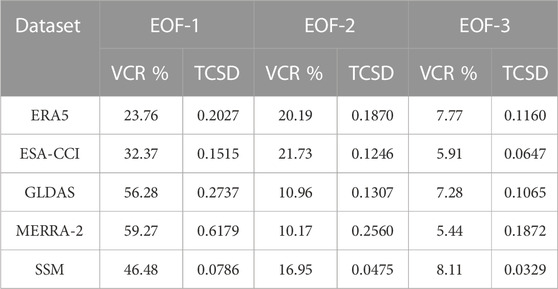
TABLE 5. Variance contribution rate (VCR) and time-coefficient standard deviation (TCSD) of EOF-1, EOF-2, and EOF-3.
During the growing season (from April to October), the soil moisture of ESA-CCI, GLDAS, and MERRA-2 increased significantly (p < 0.05) at rates of 3.29 × 10⁻⁴ m3/m3/year, 3.30 × 10⁻⁴ m3/m3/year, and 6.64 × 10⁻⁴ m3/m3/year, respectively.
Mann–Kendall abrupt change detection was used to analyze the soil moisture change characteristics in the arid area of Northwest China (Figure 5). The ERA5 data are frequently abrupt in summer, autumn, and winter. The abrupt years are concentrated in 1992–2004, consistent with the inter-annual mutation of soil moisture. The MERRA-2 dataset also showed frequent abrupt changes during winter, mainly from 2009 to 2017.
3.3 Spatial variations of soil moisture
The spatial variations in soil moisture at annual and seasonal scales were calculated by linear regression, and the variation characteristics of soil moisture in different seasons were analyzed. The spatial variation trends of soil moisture were different between datasets, and the spatial variation of soil moisture in the same dataset was also different at different time scales. Spatial trends were tested using Mann–Kendall trend analysis.
The conclusion was consistent with the linear regression analysis. Unfortunately, the spatial analysis of the RSSSM is not provided because of serious missing data in space.
3.3.1 Spatial variations of the linear trends of the annual soil moisture
The spatial distributions of linear trends derived using the linear least-squares approach are shown in Figures 4, 5. For further analysis, the area percentages with a significantly increasing trend of annual soil moisture were calculated, as shown in Figure 5. As per ERA5, most areas had decreased annual soil moisture from 1981 to 2021 (Figure 4A). ESA-CCI, GLDAS, and MERRA-2 had similar spatial distributions of annual soil moisture, with significantly increased areas of 67% and 53%, respectively (Figures 4, 6). The significantly increased areas of the annual soil moisture were distributed over the Tian shan Mountains, southern areas of the Tarim Basin and the Kunlun Mountains, the Hexi Corridor and Alxa Plateau from GLDAS (Figure 4C), and most areas of the Altay Mountains and Tarim Basin for Hexi Corridor and Alxa Plateau from MERRA-2 (Figure 4D). SSM-Feng showed a significantly decreasing trend in annual soil moisture across the study area (Figure 4E).
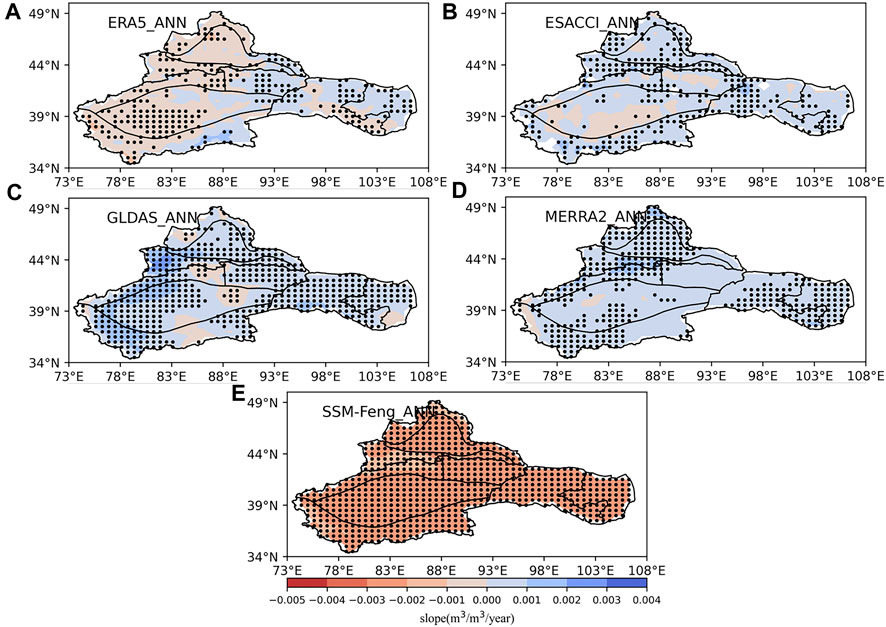
FIGURE 4. Spatial distributions of linear trends of annual soil moisture, (A) ERA5, (B) ESA-CCI, (C) GLDAS, (D) MERRA-2, (E) SSM-Feng.
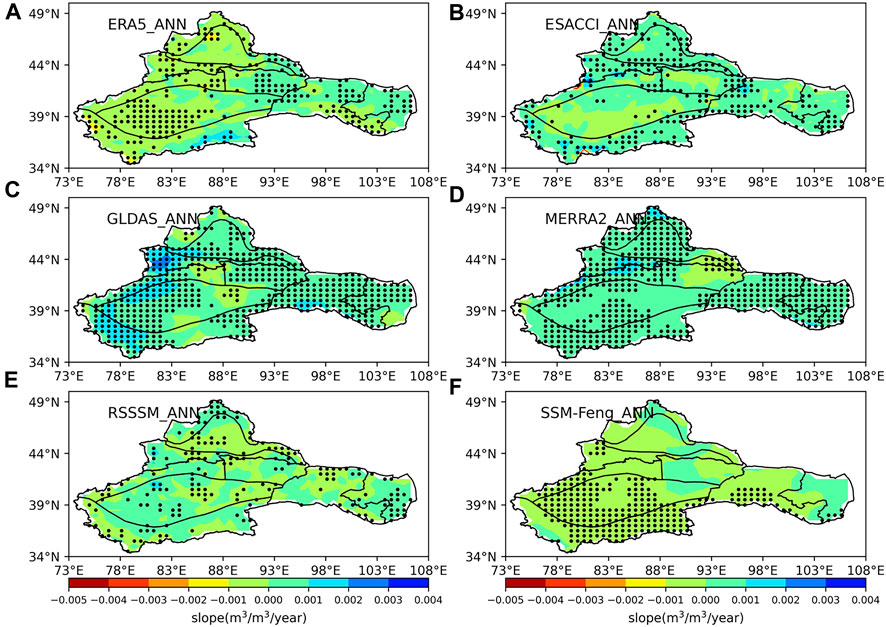
FIGURE 5. Spatial distributions of linear trends of annual soil moisture, (A) ERA5, (B) ESA-CCI, (C) GLDAS, (D) MERRA-2, (E) RSSSM, (F) SSM-Feng.
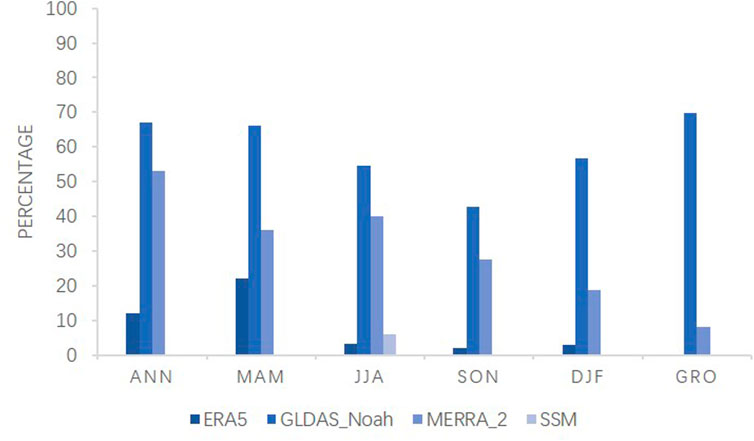
FIGURE 6. Percentages of significantly increased soil moisture (p < 0.05).
3.3.2 Spatial variations of the linear trends of the seasonal soil moisture
Figure 5 shows the spatial distributions of the linear trends in the growing season surface soil moisture from ERA5, ESA-CCI, GLDAS, MERRA-2, and SSM-Feng during 1981–2020. The spatial distributions of the linear trends for the four seasons (i.e., MAM, JJA, SON, and DJF) are shown in Supplementary Figure S3–S6. The growing season soil moisture data from ERA5, ESA-CCI, GLDAS, and MERRA-2 had similar spatial distributions of linear trends (Figure 7) to that of the annual soil moisture as illustrated in Figure 4. The SSM-Feng dataset showed positive linear trends over the northern and eastern parts of the study area, except the areas with the most decreased soil moisture (Figure 7E), which differ from the decreasing trends of the annual soil moisture (Figure 4F).
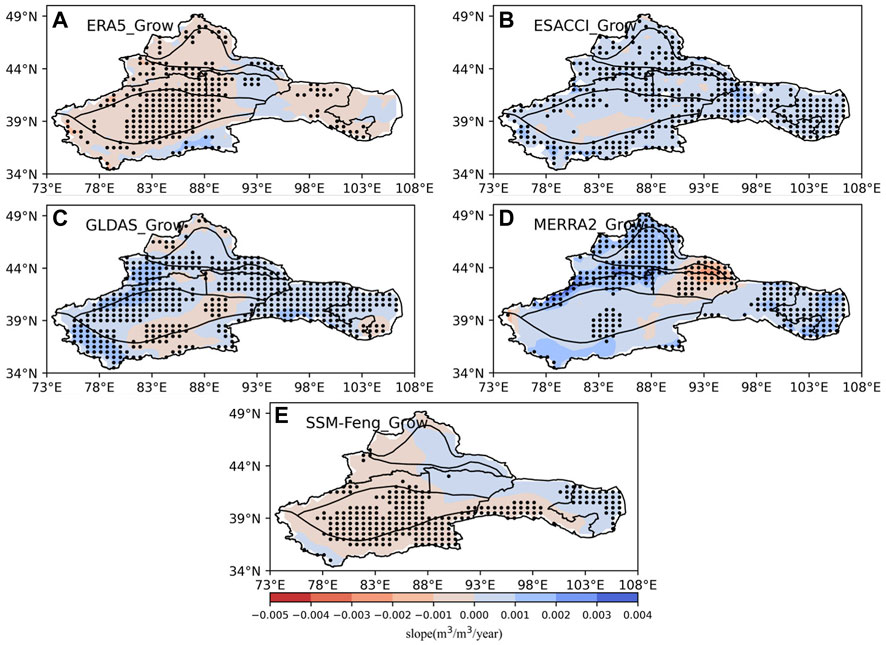
FIGURE 7. Spatial distributions of linear trends of annual soil moisture, (A) ERA5, (B) ESA-CCI, (C) GLDAS, (D) MERRA-2, (E) SSM-Feng.
The five datasets for the four seasons had significantly different linear trends (Supplementary Figures S3-S6). Specifically, for MAM (Supplementary Figure S2), ERA5 dataset showed that soil moisture decreased in most areas, and there was a significant drying trend in the Tarim Basin and Hexi Corridor. ERA5, GLDAS, and MERRA-2 showed significantly increased soil moisture in the western Tian shan Mountains. For JJA (Supplementary Figure S2), ERA5 dataset showed the soil moisture in the Tarim Basin had a significant decreasing trend; ESA-CCI dataset showed the soil moisture has significantly increasing trends in most areas, except the Tarim Basin and Altay Mountains. The GLDAS dataset showed that the soil moisture in western Tian shan and Kunlun Mountains increased significantly, and the southeast of Xinjiang showed a drying trend. The MERRA-2 dataset showed a significant increasing trend in the northern part of the arid region in Northwest China. The soil moisture trends in the SSM-Feng dataset in the northern part of the arid region in Northwest China showed a drying–wetting–drying trend from west to east in the horizontal direction.
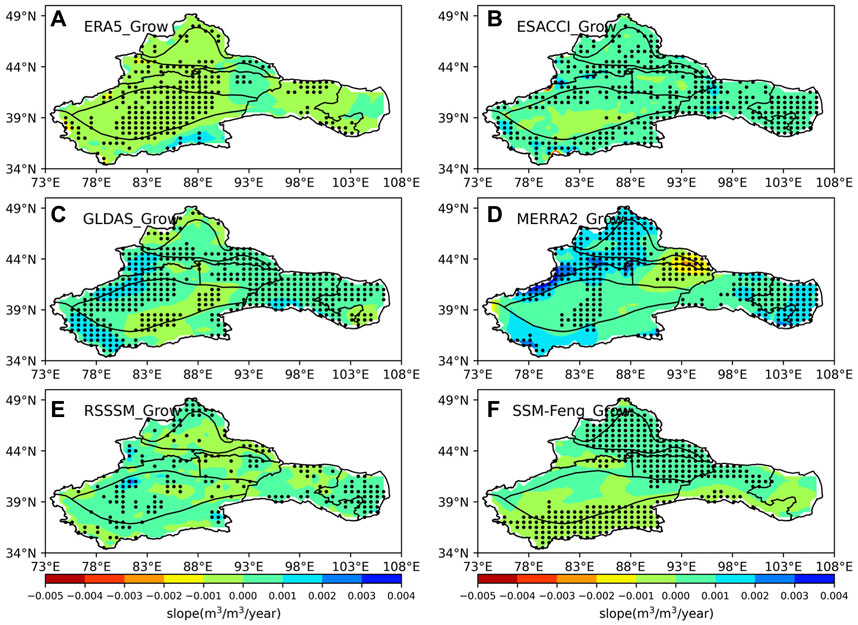
FIGURE 8. Spatial distributions of linear trends of annual soil moisture, (A) ERA5, (B) ESA-CCI, (C) GLDAS, (D) MERRA-2, (E) RSSSM, (F) ESA-CCI.
For SON and DJF (Supplementary Figure S5, S6), GLDAS and MERRA-2 showed a larger increasing trend in areas than MAM and JJA. The areas with increasing trend values of GLDAS and MERRA-2 are mainly distributed in the Tian shan Mountains, Tarim Basin, and Hexi Corridor. The ERA5 data showed that the soil moisture in the northern and southwestern parts of the arid region of Northwest China decreased slowly in winter. The GLDAS data showed that the soil moisture in winter increased considerably, and the increasing speed gradually slowed down from west to east. The MERRA-2 surface soil moisture products showed a significant increasing trend in the Tian shan Mountains, Turpan–Hami Basin, southeastern Tarim Basin, Hexi Corridor, and Alxa Plateau.
3.3.3 EOF results of annual soil moisture
The variance contribution rate of the first EOF mode (EOF-1) was much higher than that of the other modes, with variance contributions of 23.76% (ERA5), 32.37% (ESA-CCI), 56.28% (GLDAS), 59.27% (MERRA-2), and 46.48% (SSM-Feng) (Table 5). At the 95% confidence level, the variance contribution rate of MERRA-2 was the largest, indicating that EOF-1 can reveal the most spatial variations in soil moisture. However, the spatial variations of the EOF first-mode performance of different data are different. The ERA5 and SSM-Feng data showed that the soil moisture in most areas shows a drying trend. The center of variation is in the east of the Kunlun Mountains. The GLDAS and MERRA-2 data showed that soil moisture in most areas of the arid region of Northwest China increases, and the change rate gradually decreases from west to east. The ESA-CCI and RSSSM datasets had missing data that could not show the spatial variation trend of soil moisture in Northwest China (Figure 9).

FIGURE 9. Spatial distributions of linear trends of annual soil moisture, (A,B) ERA5; (C,D) GLDAS; (E,F) MERRA-2; (G,H) SSM-Feng.
The variance contribution rate of the second EOF mode (EOF-2) was much higher than that of the other modes, with variance contributions of 20.19% (ERA5), 21.73% (ESA-CCI), 10.96% (GLDAS), 10.17% (MERRA-2), and 16.95% (SSM-Feng) (Table 5). The variance contribution rate of the third EOF mode (EOF-3) was much higher than that of the other modes, with variance contributions of 7.77% (ERA5), 5.91% (ESA-CCI), 7.28% (GLDAS), 5.44% (MERRA-2), and 8.11% (SSM-Feng) (Table 5).
3.3.4 Characteristics of soil moisture variation in different sub-regions
The linear trends of the six annual soil moisture datasets in the nine sub-regions also differed (Figure 10). In the Altay Mountains, the ESA-CCI and MERRA-2 showed significant increase (p < 0.05). In the Alxa region, the six datasets showed a slow wetting trend, where GLDAS and MERRA-2 showed significant (p < 0.05) wetting trends of 1.53 × 10⁻⁴ m3/m3/year and 1.04 × 10⁻³ m3/m3/year, respectively. The GLDAS, MERRA-2, and RSSSM datasets show an increasing trend in the Hexi Corridor, which are significant for GLDAS and MERRA-2 (p < 0.05), with values of 5.53 × 10⁻⁴ m3/m3/year and 8.23 × 10⁻⁴ m3/m3/year, respectively. In the Kunlun Mountains, the GLDAS dataset showed a significant increase (p < 0.05) at a rate of 6.25 × 10⁻⁴ (m3/m3/year), but the SSM-Feng dataset showed an opposite trend. The ERA and SSM-Feng datasets showed a significant decreasing trend in the Tarim Basin (p < 0.05). All datasets showed the same increasing trends in the northern and southern Tian shan Mountains at different magnitudes (Figure 10). In the Turpan–Hami Basin, only MERRA-2 showed a decreasing trend of soil moisture. In contrast, in the Junggar Basin, the ESA-CCI, GLDAS, and MERRA-2 datasets showed a significantly increasing trend. In expressing the annual soil moisture change trend, the ERA5 and SM-Feng datasets showed the same trend; ESA-CCI, GLDAS, and MERRA-2 showed the same trend; RSSSM only had enough data pertaining to Alxa, Hexi Corridor, Kunlun, and northern Tian shan, and the trend was the same as that of ESA-CCI, GLDAS, and MERRA-2.

FIGURE 10. Annual linear trend of soil moisture in sub-regions, (A) Altay region, (B) Alxa Plateau, (C) Hexi Corridor, (D) Junggar Basin, (E) Kunlun Mountains, (F) Tarim Basin, (G) northern Tian shan Mountains, (H) southern Tian Shan Mountains, and (I) Tuha Basin.
Regarding seasonal soil moisture, the variation trends of the sub-regions in different seasons differed. In spring, ERA5 (Supplementary Table S3) dataset showed that only soil moisture in the Turpan–Hami Basin showed a weak, increasing trend, with a growth rate of 7.45 × 10⁻⁵ m3/m3/year, while other sub-regions showed a decreasing trend. The ESA-CCI dataset (Supplementary Table S4) show that the Alxa Plateau, Junggar Basin, Kunlun Mountains, and Tarim Basin showed a weak decreasing trend, whereas the other regions showed an increasing trend, among which the Altay Mountain Range, Tian shan Mountain Range, and Turpan–Hami Basin showed a significant increasing trend (p < 0.05). The growth rates were 7.75 × 10⁻⁴ m3/m3/year, 1.24 × 10⁻⁴ m3/m3/year, 2.55 × 10⁻⁴ m3/m3/year, and 1.39 × 10⁻⁴ m3/m3/year. GLDAS dataset (Supplementary Table S5) showed that soil moisture on the southern slope of the Tian shan Mountains decreased at a rate of 6.18 × 10⁻⁴ m3/m3/year. The MERRA-2 dataset (Supplementary Table S6) showed only a drying trend for soil moisture in the Turpan–Hami Basin. The SSM-Feng dataset (Supplementary Table S8) showed a weak trend of soil moisture increase in the Alxa Plateau and the Turpan–Hami Basin. In summer, the ERA5 (Supplementary Table S3) dataset showed a decreasing trend in all sub-regions and a significant decreasing trend in the Altay Mountains, Junggar Basin, and the north slope of Tian shan Mountains (p < 0.05). The ESA-CCI (Supplementary Table S4) dataset showed that soil moisture increased significantly in all nine sub-regions (p < 0.05), and the region with the fastest growth rate was Kunlun Mountains, with a growth rate of 8.83 × 10⁻⁴ m3/m3/year. In the Altay Mountains and Alxa Plateau, the GLDAS dataset (Supplementary Table S5) showed a drying trend. MERRA-2 (Supplementary Table S6) showed a decreasing trend in the Turpan–Hami Basin. The SSM-Feng dataset showed an increasing trend in the Alxa Plateau, Kunlun Mountains, and Turpan–Hami Basin but a decreasing trend in other areas. In autumn, the ERA5 (Supplementary Table S3) dataset showed that soil moisture in the Alxa Plateau increased at a rate of 1.9 × 10⁻⁴ m3/m3/year. In contrast, soil moisture in other regions showed a decreasing trend, but only in the Tarim Basin, it showed a significant decreasing trend (p < 0.05), with a rate of 2.89 × 10⁻⁴ m3/m3/year. In the ESA-CCI dataset (Supplementary Table S4), only the Altay Mountain Range and the northern slope of Tian shan Mountain showed significant changes (p < 0.05). The Altay Mountain Range showed a significantly increasing trend at a rate of 3.29 × 10×10−4 m3/m3/year, while the northern slope of Tian Shan Mountains showed a significantly increasing trend at a rate of 1.24 × 10⁻⁴ m3/m3/year. The GLDAS dataset (Supplementary Table S5) showed that soil moisture in the Hexi Corridor, Tarim Basin, and northern Slope of Tian Shan Mountains increased significantly (p < 0.05), and the growth rates were 5.11 × 10⁻⁴ m3/m3/year, 4.79 × 10⁻⁴ m3/m3/year, and 9.63 × 10⁻⁴ m3/m3/year, respectively. However, soil moisture on the southern slope of Tian shan gradually decreased. The MERRA-2 (Supplementary Table S6) dataset showed that soil moisture in the Turpan–Hami Basin showed a decreasing trend. As per the SSM-Feng data (Supplementary Table S8), only the southern slope of Tian shan Mountains showed a significant change trend (p < 0.05), and soil moisture decreased at a rate of 7.1 × 10⁻⁵ m3/m3/year. In winter, a small amount of ESA-CCI (Supplementary Table S4) data was missing in the partial region due to snow and ice. The ERA5 (Supplementary Table S3) and SSM-Feng datasets showed similar variation trends of soil moisture in the Altay Mountains, Hexi Corridor, the northern and southern slopes of the Tian shan Mountains and the Turpan–Hami Basin. The MERRA-2 dataset (Supplementary Table S6) showed a decreasing trend in the Turpan–Hami Basin, with a rate of 1.12 × 10⁻⁵ m3/m3/year. During the growing season (April–October), the ERA5 dataset (Supplementary Table S3) showed a decreasing trend of soil moisture in all sub-regions. However, they only showed a significant decreasing trend in four regions: the Altay Mountain Range, Kunlun Mountain Range, and the northern and southern slopes of the Tian shan Mountains. The corresponding rate of change is 3.18 × 10⁻⁴ m3/m3/year, 2.07 × 10⁻⁴ m3/m3/year, 3.17 × 10⁻⁴ m3/m3/year, and 3.83 × 10⁻⁴ m3/m3/year, respectively. The ESA-CCI dataset (Supplementary Table S4) showed a significant growth trend in mountainous regions (p < 0.05), and the fastest growth rate was 7.15 × 10⁻⁴ m3/m3/year on the northern slope of the Tian shan Mountains. The GLDAS (Supplementary Table S5) dataset showed that soil moisture decreased slowly at a rate of 2.39 × 10⁻⁴ m3/m3/year in the Altay Mountains but increased in other areas. The MERRA-2 (Supplementary Table S6) dataset still showed a decreasing trend in the Turpan–Hami Basin, with a rate of change of 4.92 × 10⁻⁵ m3/m3/year.
In addition, the soil moisture variation trends of different data at the growing season and inter-annual scales were similar.
4 Discussion
4.1 Uncertainties of the soil moisture variations from multi-source soil moisture datasets
In this study, we employed six gridded datasets to analyze spatiotemporal variations in soil moisture across arid regions of Northwest China. Large uncertainties exist in the different soil moisture variations, which may be caused by different factors, such as different input data and model structures in GLDAS and ERA-5 and different soil moisture depths for all gridded datasets. Moreover, these factors are the primary reasons for the different performances of the gridded datasets against the OBS and the highly uneven distribution of meteorological stations. The detailed reasons of the uncertainties of the soil moisture variations for each gridded dataset are as follows.
The ESA-CCI and RSSSM are soil moisture datasets based on microwave remote sensing monitoring, which are affected by the atmosphere detection process and can produce atmospheric errors. Because of the limited microwave penetration, vegetation and snow cover will affect microwave remote sensing monitoring data, resulting in inaccurate data (Kerr, 2006). In addition, the ESA-CCI soil moisture product selected here is an active–passive combination product, and Dorigo et al. (2017) found a low correlation for the combination product. Beck et al. (2021) found poor applicability of ASCAT satellite data; the overall poor applicability of ESA-CCI may be due to the inclusion of ASCAT satellite data. Moreover, owing to the limited number of remote sensing satellites and the revisit cycle, many missing remote sensing data may be related to the poor correlation of remote sensing soil moisture products.
The GLDAS land model simulated soil moisture, ERA5 reanalysis data, MERRA-2 reanalysis data, and the SSM-Feng dataset also showed large deviations. To calculate soil moisture, the model needs to input relevant auxiliary data such as soil temperature, surface roughness, and vegetation index. Different model algorithms have different sensitivities to auxiliary data, and the uncertainties of the auxiliary data are the primary error sources in the calculation process of the model (Hu et al., 2021b).
In the absence of ground observation data, the TC method can be used to evaluate the accuracy of multiple soil moisture datasets, but the accuracy evaluation results are affected by the data itself and the correlation between the datasets.
4.2 Comparison with the soil moisture variations over other regions
Berg et al. (2017) conducted a study using CMIP5 data. The results showed that the surface soil moisture in Central Asia showed a downward trend in the context of global warming during 1976–2005. Gu et al. (2019b) showed that under the effect of global warming, the drying trend of soil moisture in Eurasia during the warm season intensified, and the dry area of soil moisture expanded. A dry soil moisture trend was identified in 69.2% of Eurasia, and the area with a significant drying trend accounted for 40% of the total area. The soil moisture decrease rate in the warm season of Eurasia was 0.008 kg/m2/year. The result is consistent with the trend of soil moisture change shown by the ERA5 and SSM-Feng datasets, and the decreasing rate of soil moisture is 1.31 × 10⁻⁴ m3/m3/year and 1.01 × 10⁻⁴ m3/m3/year.
According to the CPC soil moisture data from the NOAA Physical Sciences Laboratory (https://psl.noaa.gov/data/gridded/data.cpcsoil.html), Northwest China showed a significant wetting trend from 1950 to 2015 with centers in mountainous areas (Hu et al., 2019a), which is consistent with GLDAS and MERRA-2 in our study. Furthermore, the wetting results of the GLDAS were similar to those of a previous study (Hu et al., 2021a).
4.3 Factors affecting soil moisture
Soil moisture is affected by temperature, precipitation, evapotranspiration, and other meteorological factors (Seneviratne et al., 2010; Wang et al., 2020; Li et al., 2021). In the past 50 years, the temperature in the arid region of Northwest China has been increasing at a rate of 0.34 °C/10 a, which is significantly higher than the global average. In addition, potential evapotranspiration showed an increasing trend after 1993, with an increasing rate of 10.7 mm yr−1 (Chen and Small, 2018).
Potential evapotranspiration (PET), precipitation (PRE), and temperature (TMP) were analyzed by unitary linear regression, which showed an increasing trend at the inter-annual scale, among which PET and TMP showed a significant increasing trend, with a change trend of 1.75 mm/year and 0.0357°C/year, respectively (Supplementary Figure S9). At the growing season scale, PET, PRE, and TEM also showed an increasing trend, among which potential evapotranspiration and air temperature showed a significant increasing trend, with a change trend of 1.46 mm/year and 0.0386°C/year (Supplementary Figure S9), respectively. The correlation between soil moisture datasets and three meteorological elements was calculated, and it was found that most soil moisture datasets were negatively correlated with PET, positively correlated with PRE, and positively correlated with TMP, irrespective of the inter annual or growing season. Detailed data are given in Supplementary Tables S9, S10. It can be concluded that the increase of PET will lead to the decrease of soil moisture, and PRE has a positive influence on soil moisture, while TMP is positively correlated with soil moisture.
There are seasonal and spatial differences in the temperature variation in Northwest China. The change rate of precipitation in Northwest China increases from southeast to northwest regions. Hence, most soil moisture data show that soil moisture is increasing significantly in the northwest of the arid region of Northwest China. In addition, the soil moisture trends of mountain ranges, basins, and plateaus are different, and the trends of the northern and southern slopes of the Tian shan Mountains are also different; therefore, the soil moisture change may have a specific relationship with topography. The relationship will be explored in a future analysis.
5 Conclusion
In this study, the arid area of Northwest China was taken as the research area. Six soil moisture datasets, namely remote sensing inversion of soil moisture dataset ESA-CCI, land simulation soil moisture dataset GLDAS, ERA5 soil moisture dataset, MERRA-2 reanalysis soil moisture dataset, RSSSM soil moisture dataset, and SSM-Feng soil moisture dataset, were used. The spatiotemporal variations in soil moisture at seasonal and annual scales during 1981–2020 were analyzed, including linear trends, abrupt changes, and spatial modes. The main conclusions are as follows.
(1) According to the ESA-CCI, GLDAS, and MERRA-2 datasets, the annual soil moisture in the arid region of Northwest China increased slowly from 1981 to 2020, with annual change rates of 8.35 × 10⁻⁵ m3/m3/year, 4.86 × 10⁻⁴ m3/m3/year, and 6.93 × 10⁻⁴ m3/m3/year, respectively. In contrast, according to the ERA5 and SSM-Feng data, the soil moisture in the arid region of Northwest China decreased, with annual change rates of −1.31 × 10⁻⁴ m3/m3/year and −1.01 × 10⁻⁴ m3/m3/year, respectively.
(2) Seasonal soil moisture changes in the arid areas of Northwest China from 1981 to 2020 were different. In spring and summer, most soil moisture products showed a slow increase in soil moisture, whereas in autumn and winter, only the GLDAS and MERRA-2 data showed a significant increasing trend. ESA-CCI, GLDAS, and MERRA-2 datasets for the growing season showed a significantly increasing trend. RSSSM could not describe the soil moisture change trend in the growing season in the arid region of Northwest China due to missing data; the ERA 5 and SSM-Feng datasets showed a significant decreasing trend.
Most of the data show that the spatial variation of soil moisture shows a slowly increasing trend. The rate of soil moisture gradually increases from west to east and south to north, such as in GLDAS and MERRA-2. According to most datasets, the Tarim Basin shows a slow drying trend. Soil moisture is always used to detect drought variations as a drought index and has been widely used to reveal dry and wet changes over regional and global scales (Hu et al., 2019b; Zhao et al., 2021). Moreover, the correlation between soil moisture and climate factors and the impacts of soil moisture on the vegetation in this study area still require further analysis. This study provides a scientific basis for soil moisture variations and other hydroclimate studies in Northwest China, which may play a key role in understanding water resource circulation in arid regions.
Data availability statement
Publicly available datasets were analyzed in this study. These data can be found here: http://data.cma.cn/; https://cds.climate.copernicus.eu/; https://gmao.gsfc.nasa.gov/reanalysis/MERRA-2/data_access/. Soil Moisture datasets SSM-Feng and RSSSM can be found here: https://data.tpdc.ac.cn/home. Data sources for GLDAS and ESACCI can be found here - GLDAS: https://earth.gsfc.nasa.gov/hydro/data/gldas-global-land-data-assimilation-system-data; ESA-CCI: https://esa-soilmoisture-cci.org/data.
Author contributions
MW is responsible for downloading data, processing data, drawing charts and writing articles, GY is responsible for downloading data and revising articles, MM is responsible for data preprocessing and writing the article, HaZ is in charge of writing the article, HuZ writing the article, ZH is responsible for setting up the paper framework and guiding the paper, XC is responsible for setting up the paper framework and guiding the paper.
Funding
This study was supported by the Third Xinjiang Scientific Expedition Program (Grant No. 2021xjkk1300), the National Natural Science Foundation of China (Grant Nos 42230708 and 41971386), and the Western Scholars of the Chinese Academy of Sciences (Grant No. 2020- XBQNXZ-010).
Conflict of interest
The authors declare that the research was conducted in the absence of any commercial or financial relationships that could be construed as a potential conflict of interest.
Publisher’s note
All claims expressed in this article are solely those of the authors and do not necessarily represent those of their affiliated organizations, or those of the publisher, the editors, and the reviewers. Any product that may be evaluated in this article, or claim that may be made by its manufacturer, is not guaranteed or endorsed by the publisher.
Supplementary material
The Supplementary Material for this article can be found online at: https://www.frontiersin.org/articles/10.3389/fenvs.2023.1164895/full#supplementary-material
References
Bai, W., Gu, X., Li, S., Tang, Y., He, Y., Gu, H., et al. (2018). The performance of multiple model-simulated soil moisture datasets relative to ECV satellite data in China. Water 10 (10). doi:10.3390/w10101384
Bárdossy, A., and Lehmann, W. (1998). Spatial distribution of soil moisture in a small catchment. Part 1: Geostatistical analysis. J. Hydrology 206 (1), 1–15.
Beck, H. E., Pan, M., Miralles, D. G., Reichle, R. H., Dorigo, W. A., and Hahn, S. (2021). Evaluation of 18 satellite- and model-based soil moisture products using in situ measurements from 826 sensors. Hydrology and Earth System Sciences 25 (1), 17–40. doi:10.5194/hess-25-17-2021
Berg, A., Sheffield, J., and Milly, P. (2017). Divergent surface and total soil moisture projections under global warming. Geophys. Res. Lett. 44 (1), 236–244. doi:10.1002/2016gl071921
Chew, C., and Small, E. (2018). Soil moisture sensing using spaceborne GNSS reflections: Comparison of CYGNSS reflectivity to SMAP soil moisture. Geophys. Res. Lett. 45 (9), 4049–4057. doi:10.1029/2018gl077905
Das, N., and Mohanty, B. (2006). Root zone soil moisture assessment using remote sensing and vadose zone modeling. Vadose Zone J. 5 (1), 296–307. doi:10.2136/vzj2005.0033
Deng, Y., Wang, S., Bai, X., Luo, G., Wu, L., Cao, Y., et al. (2020). Variation trend of global soil moisture and its cause analysis. Ecol. Indic. 110, 105939. doi:10.1016/j.ecolind.2019.105939
Deng, Y., Wang, S., Bai, X., Wu, L., Cao, Y., Li, H., et al. (2019). Comparison of soil moisture products from microwave remote sensing, land model, and reanalysis using global ground observations. Hydrol. Process. 34 (3), 836–851. doi:10.1002/hyp.13636
Dorigo, W., Wagner, W., Albergel, C., Albrecht, F., Balsamo, G., Brocca, L., et al. (2017). ESA-CCI soil moisture for improved Earth system understanding: State-of-the art and future directions. Remote Sens. Environ. 203, 185–215. doi:10.1016/j.rse.2017.07.001
Ford, T. W., Quiring, S., Zhao, C., Leasor, Z. T., and Landry, C. (2020). Triple collocation evaluation of in situ soil moisture observations from 1200+ stations as part of the U.S. National soil moisture network. J. Hydrometeorol. 21 (11), 2537–2549. doi:10.1175/jhm-d-20-0108.1
Gruber, A., Su, C., Zwieback, S., Crow, W., Dorigo, W., and Wagner, W. (2016). Recent advances in (soil moisture) triple collocation analysis. Int. J. Appl. Earth Observation Geoinformation 45, 200–211. doi:10.1016/j.jag.2015.09.002
Gruber, A., Scanlon, T., Van der Schalie, R., Wagner, W., and Dorigo, W. (2019). Evolution of the ESA-CCI soil moisture climate data records and their underlying merging methodology. Earth Syst. Sci. Data 11 (2), 717–739. doi:10.5194/essd-11-717-2019
Gu, X., Li, J., Chen, Y., Kong, D., and Liu, J. (2019a). Consistency and discrepancy of global surface soil moisture changes from multiple model-based datasets against satellite observations. J. Geophys. Res. Atmos. 3, 1474–1495. doi:10.1029/2018jd029304
Gu, X., Zhang, Q., Li, J., Singh, V. P., Liu, J., Sun, P., et al. (2019b). Intensification and expansion of soil moisture drying in warm season over Eurasia under global warming. J. Geophys. Res. Atmos. 124 (7), 3765–3782. doi:10.1029/2018jd029776
Hu, Z., Chen, X., Zhou, Q., Chen, D., and Li, J. (2019). Diso: A rethink of taylor diagram. Int. J. Climatol. 39, 2825–2832. doi:10.1002/joc.5972
Hu, Z., Chen, X., Chen, D., Li, J., Wang, S., Zhou, Q., et al. (2019a). Dry gets drier, wet gets wetter”: A case study over the arid regions of central Asia. Int. J. Climatol. 39, 1072–1091. doi:10.1002/joc.5863
Hu, Z., Chen, X., Li, Y., Zhou, Q., and Yin, G. (2021a). Temporal and spatial variations of soil moisture over Xinjiang based on multiple GLDAS datasets. Front. Earth Sci. 9. doi:10.3389/feart.2021.654848
Hu, Z., Zhang, C., Hu, Q., and Tian, H. (2014). Temperature changes in central Asia from 1979 to 2011 based on multiple datasets. J. Clim. 27, 1143–1167. doi:10.1175/jcli-d-13-00064.1
Hu, Z., Zhang, Z., Sang, Y., Qian, J., Feng, W., Chen, X., et al. (2021b). Temporal and spatial variations in the terrestrial water storage across Central Asia based on multiple satellite datasets and global hydrological models. J. Hydrology 596, 126013. doi:10.1016/j.jhydrol.2021.126013
Hu, Z., Zhou, Q., Chen, X., Chen, D., Li, J., Guo, M., et al. (2019b). Groundwater depletion estimated from grace: A challenge of sustainable development in an arid region of central Asia. Remote Sens. 11, 1908. doi:10.3390/rs11161908
Hu, Z., Zhou, Q., Chen, X., Qian, C., Wang, S., and Li, J. (2017). Variations and changes of annual precipitation in Central Asia over the last century. Int. J. Climatol. 37, 157–170. doi:10.1002/joc.4988
Hu, Z., Cui, Q., Han, J., Wang, X., Sha, W. E., and Teng, Z. (2020). Evaluation and prediction of the Covid-19 variations at different input population and quarantine strategies, a case study in Guangdong province, China. Int. J. Infect. Dis. 95, 231–240. doi:10.1016/j.ijid.2020.04.010
Hu, Z., Chen, D., Chen, X., Zhou, Q., Peng, Y., Li, J., et al. (2022). CCHZ-DISO: A timely new assessment system for data quality or model performance from da dao zhi jian. Geophys. Res. Lett. 49. doi:10.1029/2022gl100681
Kerr, Y. (2006). Soil moisture from space: Where are we? Hydrogeology J. 15 (1), 117–120. doi:10.1007/s10040-006-0095-3
Li, S., and Sawada, Y. (2022). Soil moisture-vegetation interaction from near-global in-situ soil moisture measurements. Environ. Res. Lett. 17 (11), 114028. doi:10.1088/1748-9326/ac9c1f
Liu, W., Zhao, S., Gong, R., Zhang, Y., Ding, F., Zhang, L., et al. (2022). Interactive effects of meteorological factors and ambient air pollutants on mumps incidences in Ningxia, China between 2015 and 2019. Front. Environ. Sci. 10. doi:10.3389/fenvs.2022.937450
Li, X., Ren, G., You, Q., Wang, S., and Zhang, W. (2021). Soil moisture continues declining in north China over the regional warming slowdown of the past 20 years. J. Hydrometeorol. 11, 3001–3015. doi:10.1175/jhm-d-20-0274.1
Li, X., Zulkar, H., Wang, D., Zhao, T., and Xu, W. (2022). Changes in vegetation coverage and migration characteristics of center of gravity in the arid desert region of northwest China in 30 recent years. Land 11 (10), 1688. doi:10.3390/land11101688
McColl, K. A., Wang, W., Peng, B., Akbar, R., Short Gianotti, D. J., Lu, H., et al. (2017). Global characterization of surface soil moisture drydowns. Geophys. Res. Lett. 44 (8), 3682–3690. doi:10.1002/2017gl072819
Peng, J., Loew, A., Merlin, O., and Verhoest, N. E. C. (2017). A review of spatial downscaling of satellite remotely sensed soil moisture. Rev. Geophys. 55 (2), 341–366. doi:10.1002/2016rg000543
Peng, J., and Loew, A. (2017). Recent advances in soil moisture estimation from remote sensing. Water 9 (7), 530. doi:10.3390/w9070530
Schellekens, J., Dutra, E., Martinez-de la Torre, A., Balsamo, G., van Dijk, A., Sperna Weiland, F., et al. (2017). A global water resources ensemble of hydrological models: The earth2observe Tier-1 dataset. Earth Syst. Sci. Data 9 (2), 389–413. doi:10.5194/essd-9-389-2017
Seneviratne, S., Corti, T., Davin, E., Hirschi, M., Jaeger, E. B., Lehner, I., et al. (2010). Investigating soil moisture–climate interactions in a changing climate: A review. Earth-Science Rev. 99 (3-4), 125–161. doi:10.1016/j.earscirev.2010.02.004
Seneviratne, S., and Orth, R. (2017). Variability of soil moisture and sea surface temperatures similarly important for warm-season land climate in the community Earth system model. J. Clim. 30 (6), 2141–2162. doi:10.1175/jcli-d-15-0567.1
Stoffelen, A. (1998). Toward the true near-surface wind speed: Error modeling and calibration using triple collocation. J. Geophys. Res. Oceans 103 (C4), 7755–7766. doi:10.1029/97jc03180
Wang, T., Wu, D., and Zhan, C. (2020). Comparison of environmental controls on soil moisture spatial patterns at mesoscales: Observational evidence from two regions in China. Geoderma 374, 114451. doi:10.1016/j.geoderma.2020.114451
Yan, W., Deng, L., Zhong, Y., and Shangguan, Z. (2015). The characters of dry soil layer on the loess plateau in China and their influencing factors. PLOS ONE 10, e0134902. doi:10.1371/journal.pone.0134902
Yao, P., Lu, H., Shi, J., Zhao, T., Yang, K., Cosh, M. H., et al. (2021). A long term global daily soil moisture dataset derived from AMSR-E and AMSR2 (2002–2019). Sci. Data 8, 143. doi:10.1038/s41597-021-00925-8
Yin, G., Hu, Z. Y., Chen, X., and Tiyip, T. (2016). Vegetation dynamics and its response to climate change in Central Asia. J. Arid Land 8 (3), 375–388. doi:10.1007/s40333-016-0043-6
Yin, W. J., Yang, S., Hu, L. T., Tian, S., Wang, X., Zhao, R., et al. (2022). Improving understanding of spatiotemporal water storage changes over China based on multiple datasets. J. Hydrology 612, 128098. doi:10.1016/j.jhydrol.2022.128098
Zhao, T., and Dai, A. (2021). CMIP6 model-projected hydroclimatic and drought changes and their causes in the 21st century. J. Clim., 1–58. doi:10.1175/jcli-d-21-0442.1
Zhang, X., Duan, Y. W., Duan, J. P., Chen, L., Jian, D., Lv, M., et al. (2022). A daily drought index-based regional drought forecasting using the global forecast system model outputs over China. Atmos. Res. 273, 106166. doi:10.1016/j.atmosres.2022.106166
Zhou, Q., Huang, J., Hu, Z., and Yin, G. (2022). Spatial-temporal changes to GRACE-derived terrestrial water storage in response to climate change in arid Northwest China. Hydrol. Sci. Journal-Journal Des. Sci. Hydrol. 67 (4), 535–549. doi:10.1080/02626667.2022.2030060
Zhou, S., Williams, A., Lintner, B., Berg, A. M., Zhang, Y., Keenan, T. F., et al. (2021a). Soil moisture–atmosphere feedbacks mitigate declining water availability in drylands. Nat. Clim. Change 11, 38–44. doi:10.1038/s41558-020-00945-z
Zhou, Q., Chen, D., Hu, Z., and Chen, X. (2021b). Decompositions of Taylor diagram and diso performance criteria. Int. J. Climatol. 41 (12), 5726–5732. doi:10.1002/joc.7149
Keywords: soil moisture, microwave remote sensing data, lobal hydrological model, reanalysis data, spatiotemporal characteristics
Citation: Wang M, Yin G, Mao M, Zhang H, Zhang H, Hu Z and Chen X (2023) Spatiotemporal features of the soil moisture across Northwest China using remote sensing data, reanalysis data, and global hydrological model. Front. Environ. Sci. 11:1164895. doi: 10.3389/fenvs.2023.1164895
Received: 13 February 2023; Accepted: 09 March 2023;
Published: 28 March 2023.
Edited by:
Lunche Wang, China University of Geosciences Wuhan, ChinaReviewed by:
Jianhui Xu, Guangzhou Institute of Geography, ChinaXihui Gu, China University of Geosciences Wuhan, China
Copyright © 2023 Wang, Yin, Mao, Zhang, Zhang, Hu and Chen. This is an open-access article distributed under the terms of the Creative Commons Attribution License (CC BY). The use, distribution or reproduction in other forums is permitted, provided the original author(s) and the copyright owner(s) are credited and that the original publication in this journal is cited, in accordance with accepted academic practice. No use, distribution or reproduction is permitted which does not comply with these terms.
*Correspondence: Zengyun Hu, huzengyun@ms.xjb.ac.cn; Xi Chen, chenxi@ms.xjb.ac.cn