Disentangling Forest Dynamics for Litter Biomass Production in a Biosphere Reserve in Central India
 Tarun Kumar Thakur1
  Kiran Kumar Eripogu2,3
  Anita Thakur4
  Amit Kumar5*
  Sanjeev Bakshi6
  S. L. Swamy7 Arvind Bijalwan8 Munesh Kumar9
- 1Department of Environmental Science, Indira Gandhi National Tribal University, Amarkantak, India
- 2Biodiversity Program, Taiwan International Graduate Program, Biodiversity Research Centre Academia Sinica, Taipei, Taiwan
- 3Department of Life Sciences, National Taiwan Normal University, Taipei, Taiwan
- 4Agriculture Science Centre, Indira Gandhi National Tribal University, Amarkantak, India
- 5School of Hydrology and Water Resources, Nanjing University of Information Science and Technology, Nanjing, China
- 6Department of Statistics, Indira Gandhi National Tribal University, Amarkantak, India
- 7College of Agriculture, Katghora, Indira Gandhi Krishi Vishwavidhyalaya, Raipur, India
- 8College of Forestry, VCSG Uttarakhand University of Horticulture and Forestry, Bharsar, India
- 9Department of Forestry and Natural Resources, H.N.B. Garhwal University, Srinagar, India
Investments in energy sources are scaling up across India to improve climate security and further mitigate future climate change. Forest biomass and litterfall pattern play an important role in the sustainable management of forests and the efficient utilization of resources. This study investigates the seasonal litterfall biomass pattern for five consecutive years (2015–2019) in four different vegetation types in Central India (AABR) using the litter traps method on the forest floor. An ANOVA model was adopted to infer the effects of forest types, litter types, and seasonality on litterfall production. The estimated mean litterfall of the dry tropical forest in Central India was recorded as 4.19 ± 0.305 Mg/ha/y where teak plantations contribute higher values compared to other studied vegetation types. A positive correlation was observed between the litterfall and nutrient storage with soil-adjusted vegetation index and other vegetation indices. The findings of litterfall pattern and turnover rate of nutrients indicated that the vegetation types of AABR have huge potential for carbon sequestration and help to achieve the Conference of the Parties (COP-26) goal of reducing regional and/or global climate change.
Introduction
Forest litter biomass is one of the key biological resources of natural systems that provides various ecological services and is an important area for sustainable bio-economy as a way of facing the challenges associated with global climate change (Thakur et al., 2021; Sun et al., 2022). The substitution of biomass for fossil fuels in energy consumption is a key measure to reduce the atmospheric greenhouse gas (GHG), which mitigates global warming (Kumar et al., 2021a). In this perspective, proper utilization of forest biomass for energy production is generally acknowledged and is considered helpful for achieving sustainable development goals (Kumar et al., 2021b). Global warming, which is a result of growing levels of carbon dioxide (CO2) in the Earth’s atmosphere, is directly linked to sustainability in the period of climate change and must be addressed for stabilization. In the recent past, the atmospheric CO2 level has reached 418.81 ppm (NOAA-ESRL, 2021), which could, in turn, increase the rate of photosynthesis resulting in a further increase in vegetation productivity. Tropical forests of India play a significant role in carbon sequestration, which is mostly stored in above-ground biomass and litterfall (Thakur et al., 2021). In the terrestrial ecosystem, vegetation and its underlying soil may store a significant quantity of carbon. Climate change has increasingly gained global momentum as a major threat to the survival of humankind and other living beings. Reducing CO2 levels in the atmosphere and its accretion in plant biomass is one of the viable means of mitigating climate change (Sarto et al., 2020). It is an established understanding that the 26th Conference of Parties (CoP26) at Glasgow Climate Pact in 2021 has focused on action-oriented delivery on combating global climate change. Tropical Forests are considered the lungs of the world, yet, understanding and establishing sustainability in the bio-economy of these forests is the need of the hour (U-Din et al., 2022). India committed to having a “net zero” carbon emitter by 2070, where these tropical forests are good reservoirs of carbon both above-and-below ground (Kumar et al., 2021b). The present study is an attempt in this direction employing studying litterfall and litter dynamics linking to carbon sequestration and future energy security.
Litterfall is an important pathway for the return of organic matter (OM) and nutrients from above-ground biomass (AGB) to the forest floor, which is directly linked to the soil C pool (Wang et al., 2016). Soil organic carbon depends on the quantity of litterfall and the rate of its decomposition (Oelbermann et al., 2004). The litter dynamics tend to influence the leaf area index (LAI) and also the forest respiration rate, both of which are used as markers of change in carbon flux in the forest ecosystems (Joshi and Garkoti, 2020). Litter crop and productivity are unequivocally related to soil respiration or CO2 efflux, which are strongly influenced by the factors like soil temperature, rainfall, and litter quality (Bond-Lamberty and Thomson, 2010). Understanding the C balance vis-a-vis nutrient transfer in terrestrial ecosystems, the estimation of litterfall is a prerequisite to measuring the patterns of soil C accumulation (Jia et al., 2020). Over the last few decades, there has been a rapid intrigue in the study of litterfall dynamics on various spatial scales (Souza et al., 2019) for numerous functions, i.e., to quantify nutrient dynamics (Zhu et al., 2019), energy security (Manolis et al., 2019), carbon and nutrient input (Feng et al., 2019), its contribution to net primary productivity (Chen et al., 2017), and in forest restoration (Lanuza et al., 2018). Various studies have been conducted on the litterfall dynamics in tropical forests, primarily in moist forests, with relatively few in dry tropical forests (TDFs) (Morffi-Mestre et al., 2020).
Often, TDFs are recognized as the largest major biomes in the world (Santos et al., 2012). Peak litterfall in TDFs usually occurs in the dry season to evade water losses through transpiration and endure vegetation under the conditions of stress and high vapor-pressure deficit (Aryal et al., 2015). At spatial scales (regional or worldwide), AGB and litter decay rates in TDFs will enhance with an increase in mean annual precipitation (Souza et al., 2019). Few studies reported that litter mass production synchronizes with canopy processes linked to phenology, vegetative, and reproductive growth phases and biomass production (Zeilhofer et al., 2012). The quantification of the litter production at higher temporal and spatial scales is cumbersome and restricts the development of the linkage between litter crop and complex canopy processes (Wang et al., 2016). Based on the existing literature, climatic variables (temperature and precipitation) and stand characteristics (vegetation type, canopy density, age, site quality, climate, and phenology) are some of the important elements that influence litterfall (Qin et al., 2022). The tropical forest provides many environmental services that are helpful, like biodiversity conservation, natural resource conservation and management, soil enrichment, temperature regulation, soil moisture conservation, etc., which subsequently reinstates the environment. The productivity and nutrient status of the soil is governed by the flow of a large number of inputs to the system (Jeet et al., 2014).
The geospatial techniques are quite indispensable for estimating canopy and stand characteristics, phenological changes, and associated processes in forest ecosystems (Liu et al., 2021). Greenness and phonological variations of vegetation could be easily detected from time-series data of normalized difference vegetation index (NDVI) derived from satellite images. This data could serve as a proxy for precisely enumerating the vegetation changes and biomass productivity of different settings (Frolking et al., 2009). Remote sensing indices such as enhanced vegetation index, photosynthetic vegetation, and photochemical reflectance index proved to be convenient predictors related to vegetation phenology and stand characteristics (Wang et al., 2020; Khan et al., 2022).
The litterfall in TDFs is strongly correlated with annual, seasonal, and monthly precipitation, temperature, and soil fertility (Morffi-Mestre et al., 2020). Long-term studies have proven to be effective in estimating litter mass production in TDF, which is regulated through cycles of precipitation and temperature (Tang et al., 2010). Aryal et al. (2015) detected one or more irregular peaks of litterfall measured at monthly intervals in different periods of the year. The seasonal and inter-annual patterning of litterfall accumulation has also been studied to quantify the effects of the litter dynamics on carbon and nutrient cycling (Chave et al., 2010). Long-term studies on periodical variations in litterfall are vital in terms of forest ecosystem service assessment and ecosystem functioning to ensure the benefits of biodiversity, soil water conservation, hydrology, biomass, and energy supplies to societies (Shen et al., 2019).
The Achanakmaar Amarkantak Biosphere Reserve (AABR) in Central India is the 14th biosphere reserve of India declared in 2005 (Roychoudhury et al., 2019), and UNESCO recognized it as the world’s heritage site in 2012 (Thakur et al., 2020). To date, studies carried out in AABR mainly focused on floristic composition (Thakur et al., 2019) to understand the traditional use of plants (Thakur et al., 2017) and the structure of understorey vegetation (Thakur et al., 2014). Few studies focused on assessing the effect of fireplace frequency (Kittur et al., 2014), land use and land cover change detection (Thakur et al., 2019), and the litterfall pattern in ABBR (Yadav et al., 2019). The results derived from the preliminary studies in AABR revealed that a maximum litterfall pattern was observed in the winter season, followed by the summer and the rainy seasons (Yadav et al., 2019). Darro et al. (2020) revealed that temporal studies are essential to understanding patterns of litterfall and soil organic matter (SOM) production in different vegetation types. The present study was conducted to analyze the litterfall pattern and macro-nutrient accumulation over 5-year period in four different vegetation types from the TDFs of AABR through remote sensing techniques with ground truth observations. This study aims to estimate and highlight the litterfall biomass production in the biosphere reserve in Central India for carbon neutrality. The objective of the study is 1) to quantify the seasonal patterns of litterfall using litter trap data of four different vegetation types, 2) to understand the influence of temperature and precipitation on litterfall, and 3) to examine the correlations among spectral vegetation indices with litterfall, carbon and nitrogen storage of the selected vegetation types of AABR. The studies will help in evolving site-specific forest management strategies for improving carbon storage and offsetting emissions to mitigate climate change for sustainable and efficient resource application.
Material and Methods
Study Site
The study was carried out in the TDF of AABR, which falls under the Deccan Peninsular zone as per the bio-geographic classification of India. It lies between the parallel of latitude 22°15′ to 20°58′N and longitude 81°25′ to 82°5′E. The AABR is covered by 3835.51 km2, and 16% is under the seasonal dry tropical forest region. The location map, along with the digital elevation model (DEM) of the site and select sampling units, is depicted in Figure 1. The climate of the region is sub-humid tropical with summer, winter, and rainy seasons. In AABR, maximum precipitation (>80%) occurs from July to October in the rainy season. Winter starts in November and lasts until February, and summer from March to June. The rainfall varies from 1,050–1,500 mm/y, and the annual temperature is from 25.8 to 30°C at elevations of 884 m mean above sea level (m a.s.l). The average annual temperature (°C) and precipitation (mm) were 26.68°C and 1,197.23 mm. The mean annual temperature was maximum in 2017 (35.23°C) and minimum in 2015 (24.12°C) (Figure 2I), whereas the annual precipitation was high in 2016 (1,327.68 mm) and low in 2018 (1074.24 mm) (Figure 2II). Based on vegetation composition, the four different functional types, i.e., teak plantations (TP), sal mixed forest (SMF), dense mixed forest (DMF), and open mixed forest (OMF) were identified in TDF. The field study sites of the selected vegetation types are shown in Supplementary Figure S1.
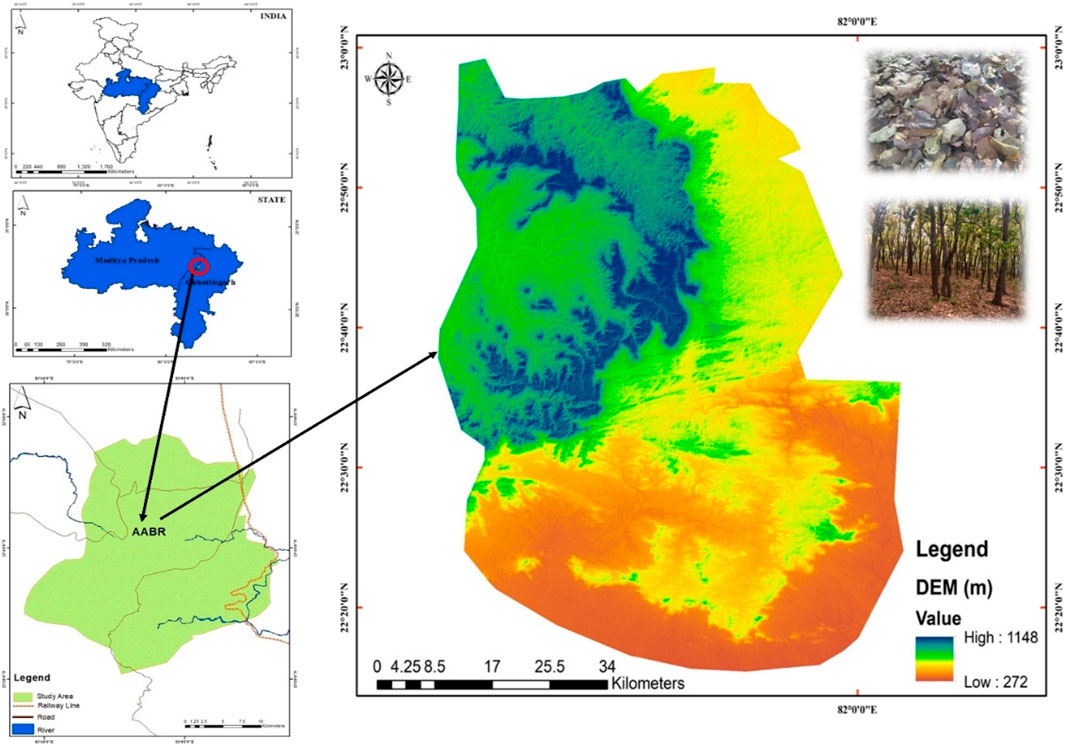
FIGURE 1. Location Map (left side) and digital elevation model (DEM) (right side) of the study area.
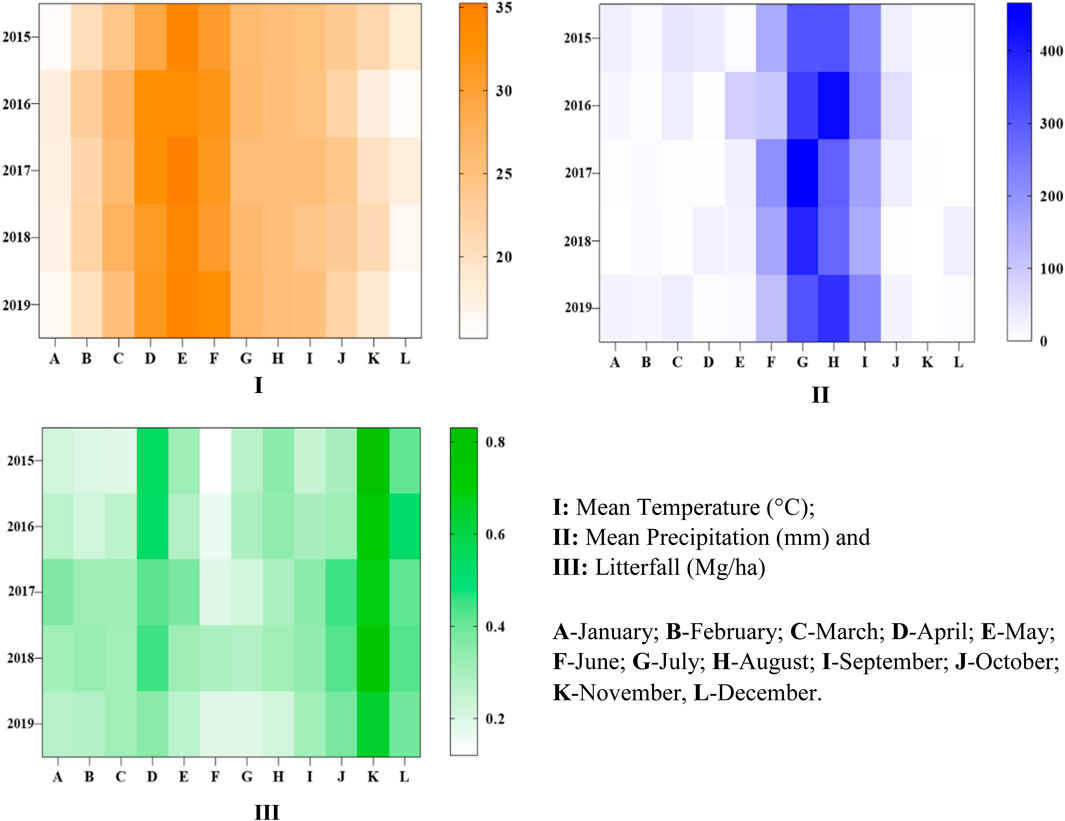
FIGURE 2. Monthly estimation of various parameters recorded in AABR for the period 2015–2019. (I): mean temperature (°C); (II): mean precipitation (mm), and (III): litterfall (Mg/ha). A-January; B-February; C-March; D-April; E-May; F-June; G-July; H-August; I-September; J-October; K-November, L-December.
Structural Attributes and Soil Characteristics of TDFs
The stand characteristics were measured in permanent plots marked for long-term ecological research in different functional types of TDFs in AABR. The structural attributes of vegetation, such as stand density, basal area, crop height, canopy cover, canopy density, LAI, etc., were measured in these plots during 2015–2019 (Sagar et al., 2003). The structural attributes (altitude, slope, and plot area); biometric measurements of tree species (height, DBH, and basal area); density of trees (trees/ha), LAI (i.e., it is defined as the projected area of leaves over a unit of land (m2 m−2), so one unit of LAI is equivalent to 10,000 m2 of leaf area per hectare), canopy parameters (canopy cover and canopy height) and soil characteristics (pH, texture, bulk density, soil OM and total nitrogen) were derived for all the selected forest types (DMF, SMF, OMF, and TP) as shown in Supplementary Table S2. The plot remains constant for all the vegetation types, i.e., 0.8 ha. The altitude (m a.s.l) and the slope (m) range from 505 to 720 m a.s.l and 35%–75%, respectively. The total number of trees present in the four vegetation types was 171, where DMF 52) recorded the most and TP 24) least. The number of trees in SMF and OMF was 49 and 46. The density of trees (trees/ha) was found to be maximum in the SMF region (652.5) followed by DMF (587.5), OMF (467.5), and TP (470). In terms of biometric measurements of the tree species associated with the vegetation types, the mean DBH (cm) ranged from 20 to 30 cm in TP and OMF; 25–35 cm in DMF, and 30–40 cm in SMF. The tree species present in SMF had higher values of height (m) and basal area (m/ha) and least in OMF, whereas, in DMF and TP, the values were almost similar (Table 1). A pH was relatively the same in SMF and DMF, ranging from 7–7.5, whereas, in the sites of OP and TP, it was slightly on the lower side ranging from 6–6.5. The relative fractions of sand, silt, and clay in the soil were almost similar in SMF and DMF. The bulk density of soil (0–30 and 30–60 cm) of soil depth was found to be higher in OMF and least TP. The SOM content was higher in DMF followed by SMF, TP, and OMF, while SMF showed a high N content, which was least under OMF (Table 1).
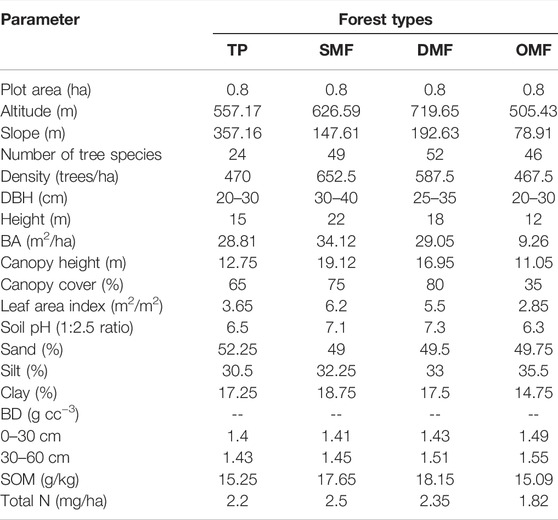
TABLE 1. Structural attributes and soil characteristics of the different forest types in AABR.
Estimation of Standing Litter
The standing litter crop was measured by using three sub-quadrates (0.5 m × 0.5 m) laid randomly on the forest floor in different sample plots (20 m × 20 m) distributed in four forest types. The standing litter was collected in 15 sample plots (3 locations within quadrate × 5 quadrates) from each forest, constituting a total of 60 plots laid in four vegetation types of dry tropical forests of AABR. The litter samples were collected in polyethylene bags at monthly intervals and were transported to the laboratory from 2015 to 2019. These collected samples were separated into different litter components such as leaves, wood, fruits, flower, and bark components. Litter fractions were dried at 80°C in a hot air oven for three days; thereafter, the samples were weighed using an analytical scale (0.0001g). The weights of the dried samples of the different litter components were taken, and the values were converted to Mg/ha. The litter components (leaves, wood, bark, and twigs) were added to derive the total standing litter. The average of all five years was considered to calculate the mean standing litter for a given functional type to calculate the turnover rates.
Along with standing litter, litterfall on the forest floor, i.e., litter input, was recorded in three different seasons (rainy, winter and summer) for each year using the above-described protocol (Zhu et al., 2021). The litterfall of three seasons was compiled and then added to obtain the total annual litterfall (Mg/ha). The total litterfall obtained from 2015–2019 was averaged to derive the mean annual litterfall of each forest type (Mg/ha/y).
Turnover of Litter and Sustainability
To realize sustainability, in the present study, we calculated the turnover rate of litterfall for the selected sites of AABR. The turnover rate (
where
In this study,
Physico-Chemical Analysis of Soils, Litter, and Meteorological Data
The physicochemical properties (pH, bulk density, texture, OM, C, total N) of soil (up to 10 cm) collected from four different types were determined in 2019. In a similar manner, the total organic carbon was estimated following the procedure by Walkley and Black (1934); (Kumar et al., 2021a), while total N was analyzed by adopting the micro-Kjeldahl method (Jackson, 1958). Monthly meteorological data (precipitation and mean temperature) was acquired from the Indian Meteorological Department, New Delhi, for the years 2015–2019.
Satellite Remote Sensing Data Predictors
Cloud-free satellite data of the study area for the years 2015–2019 was acquired freely from the United States Geological Survey website (GloVis, 2021), as shown in Supplementary Figure S2. All the electromagnetic wavelength/bands (Visible and NIR bands) were stacked and pre-processed in ERDAS Imagine (version 9.3); the geometric and atmospheric corrections were done before further analysis. The spectral vegetation indices derived from satellite data, maps of normalized vegetation moisture index (NDMI), NDVI, and oil-adjusted vegetation index (SAVI) were generated.
ANOVA Model for Variation in Sustainable litterfall Over Selected Forest Types, Litter Types, and Selected Reference Periods
The variation observed in the litterfall (LF) may be attributed to the differences in selected forest types (DMF, OMF, SMF, and TP), litter types (leaves, twigs, and wood), and selected reference periods (2015, 2016, 2017, 2018, and 2019). The variation of LF over selected forest types, litter types, and selected reference periods are modeled as a three-way repeated-measures ANOVA model given
Because of the non-normal distribution of LF, Box-Cox transformed values of LF (denoted as
The residuals of the ANOVA model are tested for normality using the Anderson–Darling test (p-value 0.38) (Stephens, 1974). Post-hoc tests were carried out to infer the differences in the amount of LF contributed by different categories of the three factors in the model.
Regression of Litterfall on Temperature and Precipitation
The data set contains monthly data on precipitation (P), temperature (T), and LF for five consecutive years from January 2015 to December 2019. The recorded T varies in the range from 15.07 to 35.03°C. The amount of P ranges from 0 to 465.74 mm where LF has the least value of 0.12 (Mg/ha) and a high of 0.83 (Mg/ha). The distribution of LF was found to be non-normal. LF is, log-transformed, and the distribution of ln (LF) was tested for normality using the Anderson–Darling normality test (p-value 0.08). The following statistical analyses utilize the transformed variable ln (LF).
Three different sets of linear regression models were considered for predicting ln (LF) with P as a predictor, T as a predictor, and T & P together as predictors. Among the set of models, the parsimonious models with a high value of R2 are utilized for the present study (Table 2). Depending upon the model utilized LF can be predicted for a given P, T, or both P & T by utilizing the predicting functions given in Table 2. The models M1, M2, and M3 predict mean LF for a given value of P, V, and P-V. To assess the performance of these models, the dataset was divided into four sub-datasets, namely S1, S2, S3, and S4. These sub-datasets represent different scenarios of P and T. The criteria for sub-datasets were based on median P (26.74 mm) and median T (25.06°C). The data points with precipitation below-median P are defined as points of low precipitation (LP), and the rest of the data points are defined as points of high precipitation (HP). The data points with temperature below-median T are defined as points of low temperature (LT), and the rest of the data points are defined as points of high temperature (HT). The two criteria are crossed to produce four sub-datasets, namely S1 (LP–LT), S2 (HP–LT), S3 (HP–HT), and S4 (LP–HT). The predicted LFs for the median temperature and mean rainfall for each sub-dataset are obtained using M1, M2, and M3. These predicted LFs are compared with the average (geometric mean) LFs for each sub-dataset. The data analysis was performed using statistical software R (version 3.6.3).
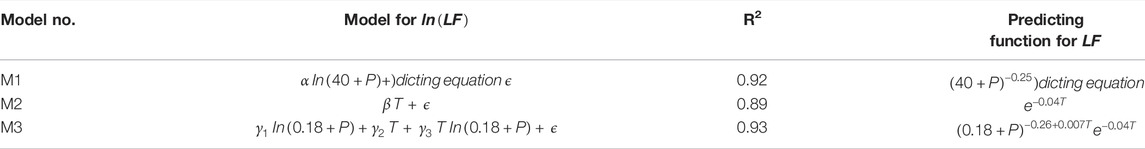
TABLE 2. Linear regression models for
Correlations Among Spectral Vegetation Indices (NDVI, SAVI, and NDMI), Sustainable Litterfall, Carbon and Nitrogen Storage
The data on litterfall, carbon, and nitrogen storage status of vegetation were analyzed using GraphPad Prism (version 9.1.0). The correlations were obtained for each of the spectral vegetation indices (NDVI, SAVI, and NDMI) with litterfall, C, and N storage for different vegetation types of AABR. The data of ground sample plots were overlaid on vegetation indices images to extract the representative data under Arc-GIS (version 10.3) platform. The spectral vegetation indices (viz. NDVI, SAVI, and NDMI) derived from satellite data were correlated along with ground-measured structural and functional variables and tested at p ≤ 0.01.
Results
Sustainable Litterfall Analysis
Litterfall estimation for observing the sustainability was carried out for four different vegetation types for a period of five years, from 2015–2019. The mean LF (Mg/ha) for DMF, OMF, SMF, and TP was found to be 0.52 ± 0.34, 0.59 ± 0.35, 0.59 ± 0.40, and 0.61 ± 0.46 (Supplementary Table S1 and Figure 3B). The mean LF (Mg/ha) for selected for the reference periods 2015, 2016, 2017, 2018, and 2019 was found to be 0.57 ± 0.39, 0.57 ± 0.39, 0.59 ± 0.39, 0.61 ± 0.40, and 0.53 ± 0.40 (Supplementary Table S1). The monthly estimation of litterfall for all the vegetation types from 2015 to 2019 is shown in Figure 2III. The mean annual litterfall is 4.19 ± 0.305 Mg/ha. Maximum litterfall was observed in November and minimum in June. The temperature was at its peak in May and low in December and January (Figure 3A). With regards to precipitation, maximum was recorded in July and minimum in November (Figure 3B). In the case of different litter types, the mean LF because of leaves, twigs, and wood was found to be 1.09 ± 0.10, 0.23 ± 0.04, and 0.40 ± 0.05 (Supplementary Table S1 and Figure 3A). A comparatively higher value of standard deviations for LF in four selected forest types and five selected reference periods when compared to the three litter types is observed (Supplementary Table S1). This is because of the huge difference between the LF because of leaves and that because of twigs or wood for each forest type and each reference period (Figures 4A–C).
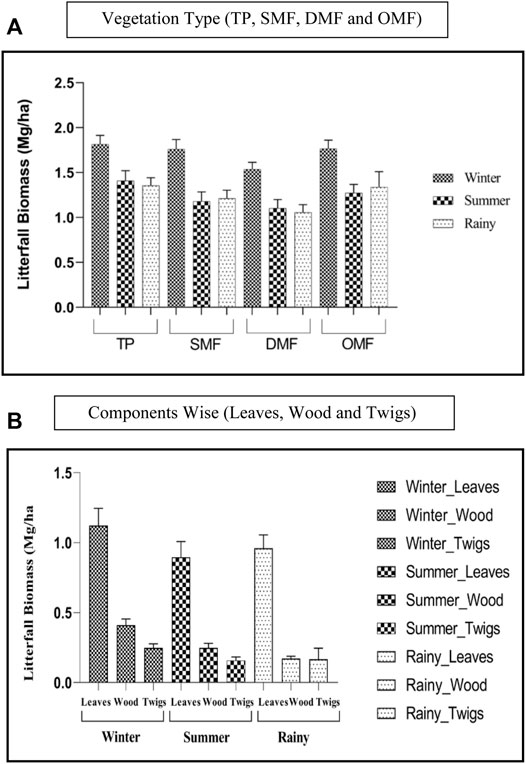
FIGURE 3. Mean annual seasonal litterfall production in AABR for the period of 2015–2019. (A): vegetation type (TP, SMF, DMF, and OMF). (B): components wise (leaves, wood, and twigs)
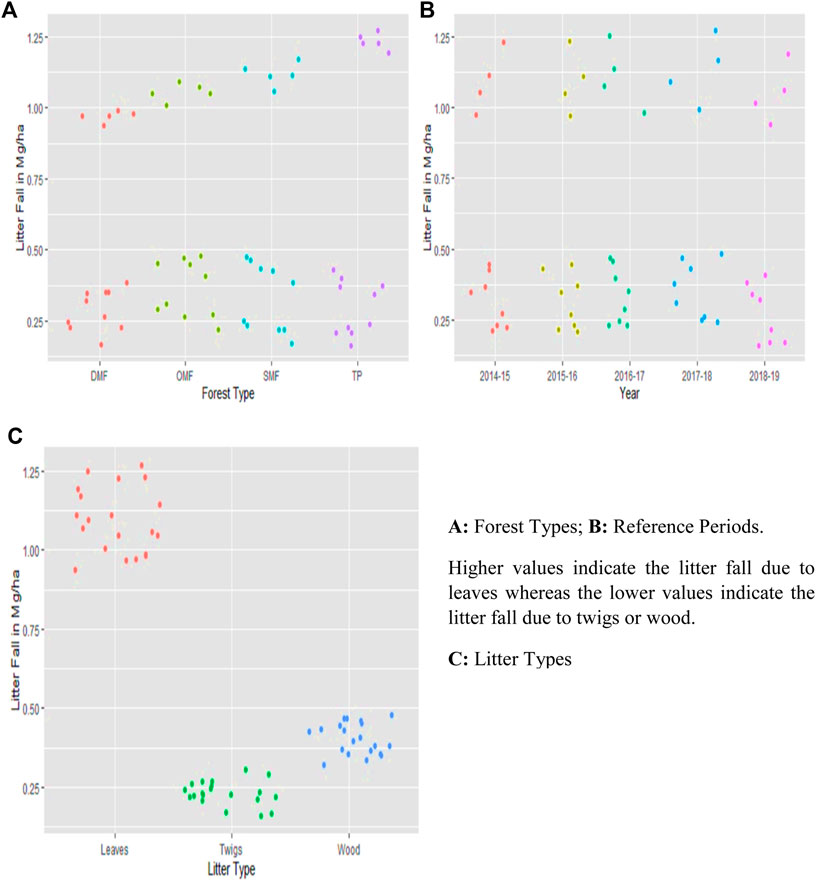
FIGURE 4. Litter fall observation for understanding sustainable bioeconomic patterns in parameters. (A): forest types; (B): reference periods. Higher values indicate the litter fall because of leaves, whereas the lower values indicate the litter fall because of twigs or wood. (C): litter types.
The findings for 3-way ANOVA are presented in Supplementary Table S2, and the following post-hoc tests are presented in Table 3. The within-group variations for all the three factors considered for ANOVA are found to be significant (p-value for F < 0.01) (Supplementary Table S2). This indicates that the mean for different forest types (litter types/reference periods) are not all the same. At least one of the categories from DMF, OMF, SMF, and TP differs from the rest in this aspect.
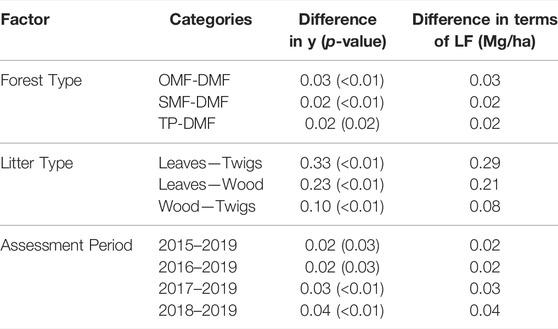
TABLE 3. Significant Differences Obtained in Post-Hoc Tests for sustainable management.
Similar interpretations hold for categories of litter types and reference periods. The post-hoc tests indicate that DMF has a significantly different mean when compared to the rest of the three forest types (Table 3). When the other factors are held constant, the mean for DMF is 0.03 Mg/ha lesser than that of OMF. The mean for DMF is lesser than that for SMF and TP by 0.02 Mg/ha when the other factors are held constant. Keeping other factors constant, the mean for leaves is found to be more than that for twigs and wood by 0.29 Mg/ha and 0.21 Mg/ha. Under similar conditions, the mean of wood is found to be more than that of twigs by 0.08 Mg/ha (Table 3). The mean LF for the reference period 2019 was found to be significantly different from other reference periods, namely, 2015, 2016, 2017, and 2018. It was found to be lower than that of the reference periods, i.e., 2015, 2016, 2017, and 2018 by 0.02 Mg/ha, 0.02 Mg/ha, 0.03 Mg/ha and 0.04 Mg/ha. The seasonal-wise determined litterfall biomass values were observed in the winter season, whereas the values in the remaining two seasons were almost alike (Figures 3, 5). The season litterfall pattern observed in TP, SMF, and DMF followed the pattern of winter > summer > rainy (Figure 3A). The order differed in OMF, where the pattern observed was winter > rainy > summer. A variation was observed in component-wise (leaves, wood, and twigs) analysis of mean seasonal litterfall. Leaves followed the order of winter > rainy > summer, whereas wood and twigs followed the pattern of winter > summer > rainy (Figure 3B).
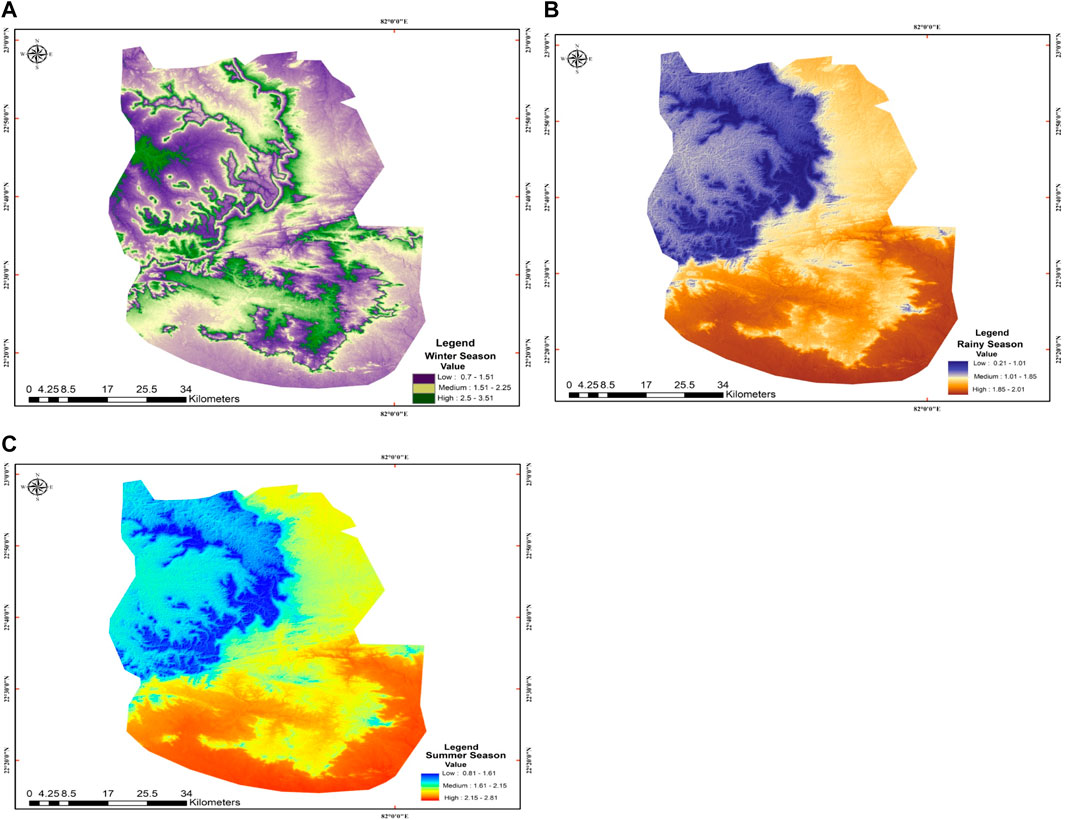
FIGURE 5. Seasonal litterfall (Mg/ha) of different vegetation types in AABR showing sustainable litterfall pattern. (A): winter season. (B): rainy season. (C): summer season.
Fine Root Biomass and Decomposition Rate of Sustainable Litterfall (Turnover of Litter)
The fine root biomass was analyzed for three parameters, namely, seasonality, depth of soil (0–30 cm and 30–60 cm), and different vegetation types (Table 4). The mean fine root biomass (g/m2) was observed to be higher in the rainy season (1.35 g/m2) followed by winter (1.06 g/m2) and summer (0.89 g/m2) seasons. In the case of depth zones, the mean fine root biomass value was observed higher in 0–30 cm (0.95 g/m2) and lower in 30–60 cm (0.29 g/m2). The turnover rate in different forest types varied from 0.50–0.62, indicating approximately 45–62% turnover of litter in a year. The turnover time of litter in different forest types varied from 1.61–1.98 y. The minimum time was estimated in TP, and the maximum was recorded in OMF, followed by SMF and DMF.
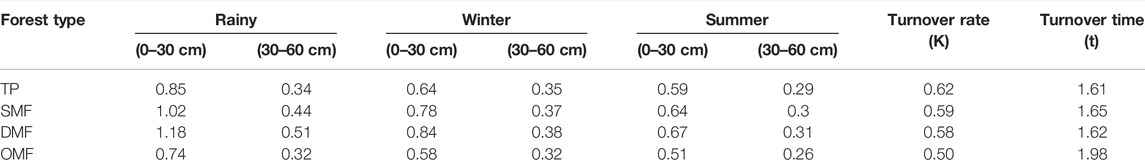
TABLE 4. Fine Root Biomass (Mg/ha), Turnover rate (K), and Turnover time (t) of litter in Forest type during 2015–2019.
Correlation Between Vegetation Indices (SAVI, NDVI, and NDMI), Litterfall, Carbon and Nitrogen Storage
The mean annual litterfall of TDFs is 4.19 ± 0.305 Mg/ha/y (Figure 6A). The total C sequestration in various components of litter (i.e., leaves, wood, and twigs) was 4.64 Mg/ha with a mean of 4.4 ± 1.16 Mg/ha (Figure 6B). Leaves contributed the highest to the total litterfall production, followed by wood and twigs with a mean of 0.73 ± 0.42 Mg/ha, 0.25 ± 0.02 Mg/ha, and 0.17 ± 0.03 Mg/ha. The total N storage in all the components of litter was 0.062 Mg/ha with a mean of 0.02 ± 0.002 Mg/ha (Figure 6C). Similar to the C content, the storage of N content was higher in leaves, followed by wood and twigs. Pearson correlation was used to analyze the important spectral vegetation indices (NDVI, SAVI, and NDMI), litterfall, and C & N storage in the dry tropical forest of AABR as summarized in Table 5. The SAVI, NDVI, and NDMI images are represented (Figures 7A–C). Results indicated that the SAVI and NDVI values were positively correlated with litterfall, C, and N storage. The study found a positive correlation between the litterfall and nutrient storage (C and N) with soil-adjusted vegetation index and other vegetation indices. Pearson Correlation among SAVI with pooled data of litterfall and nutrient storage (C and N) were performed and shown in Table 5. Litterfall and C storage values were estimated following stratified random sampling, and noticed that there was a significant correlation between the NDVI and SAVI. It was evident from the results that the litterfall and C storage were positive and highly significant (both at 5 and 1 percent level) and strongly correlated with NDVI and SAVI, whereas they were not significant with NDMI. Among the forest types, DMF recorded the highest values of NDVI, SAVI, and NDMI.
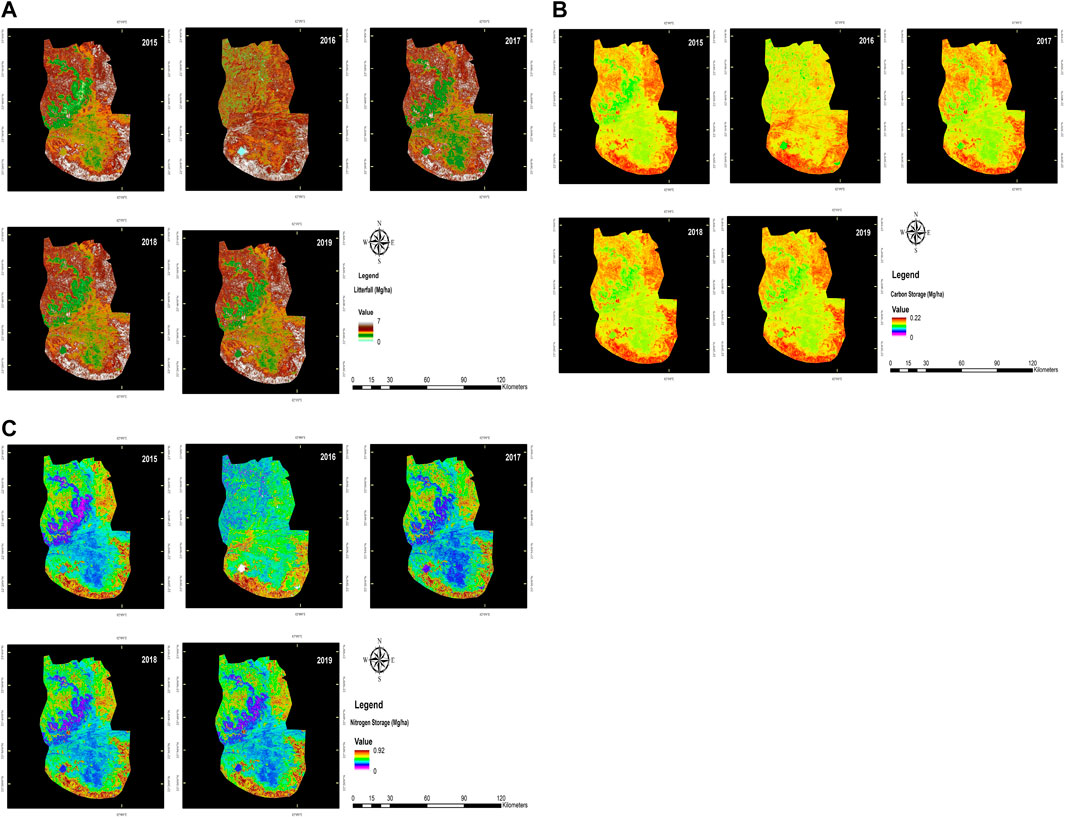
FIGURE 6. Understanding sustainability-estimation of annual litterfall (Mg/ha), carbon and nitrogen storage (Mg/ha) under different vegetation types in AABR. (A): annual litterfall (Mg/ha); (B): carbon storage (Mg/ha); (C): nitrogen storage (Mg/ha).
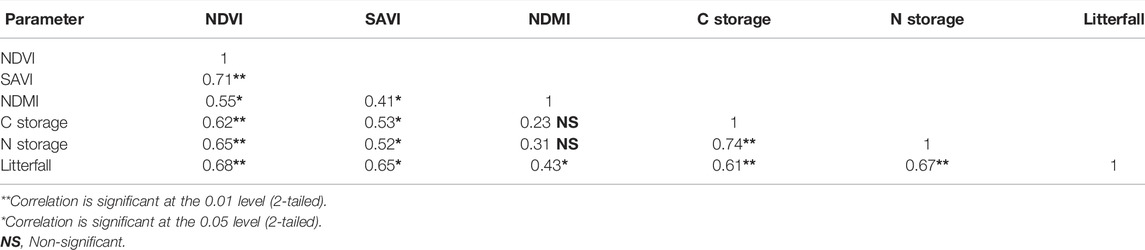
TABLE 5. Pearson correlations among important spectral vegetation indices (NDVI, SAVI, and NDMI), litterfall, carbon and nitrogen storage in dry tropical forests of AABR.
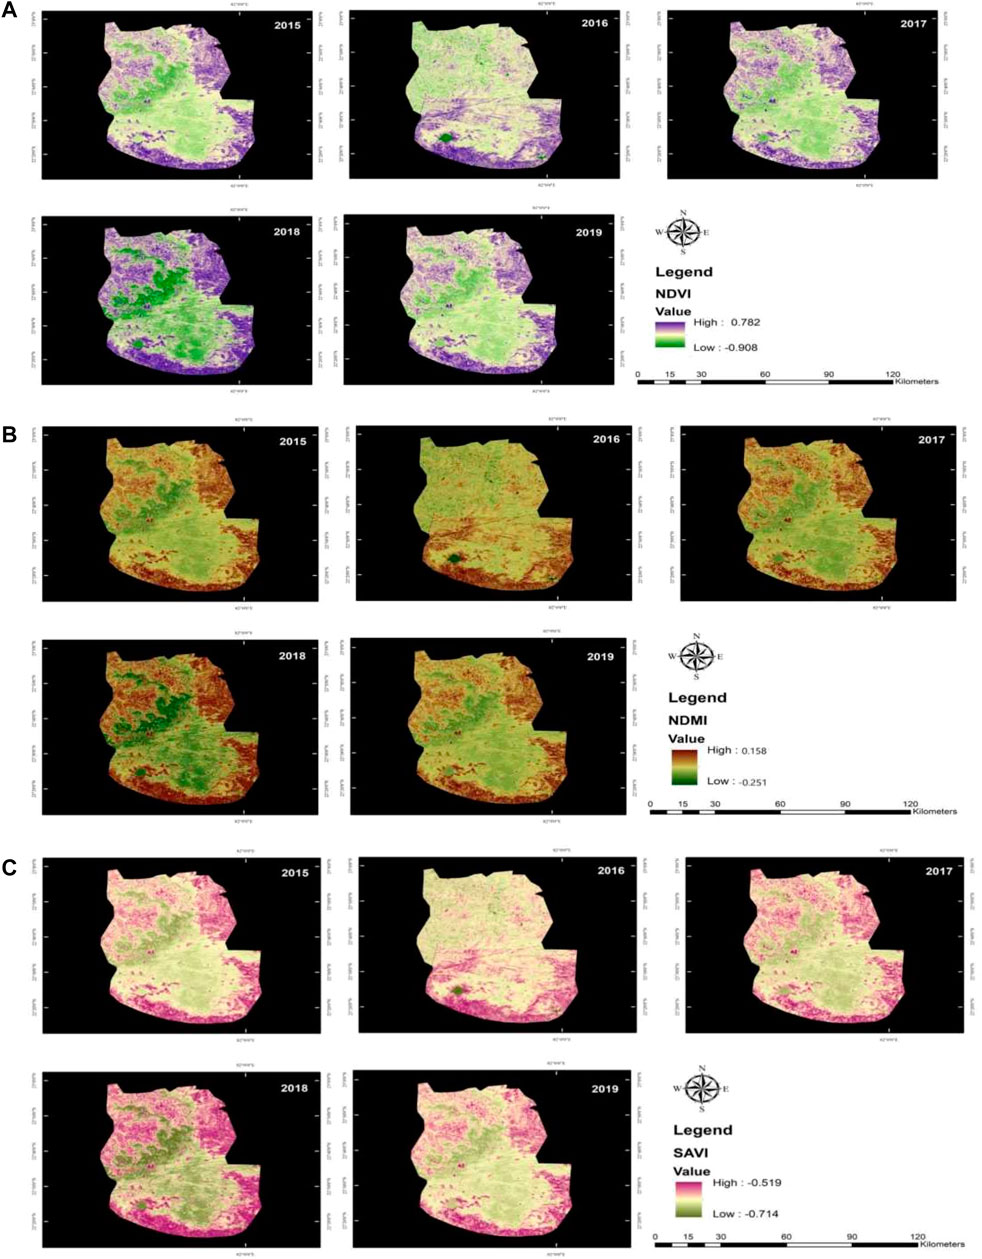
FIGURE 7. Spectral vegetation indices (NDVI, NDMI, and SAVI) of AABR
Temperature and Precipitation as Predictors of Litterfall
Three different models (M1, M2, and M3) were developed to establish the relationship between litterfall, temperature, and precipitation (Table 6 and Figure 8). Model M1 and M2 were utilized as predictor models of ln (LF) with P and T as predictors. Model M3 incorporates both P and T as predictors of ln (LF). Homoscedasticity for the selected was tested using the Breusch-Pagan test (Breusch and Pagan, 1979), p-values for M1, M2, and M3 are 0.38, 0.87, and 0.19, respectively. The normality of the model residuals examined using the Anderson–Darling test, p-values for M1, M2, and M3 are 0.95, 0.24, and 0.39, respectively.

TABLE 6. Model based predicted LF for different sub-datasets
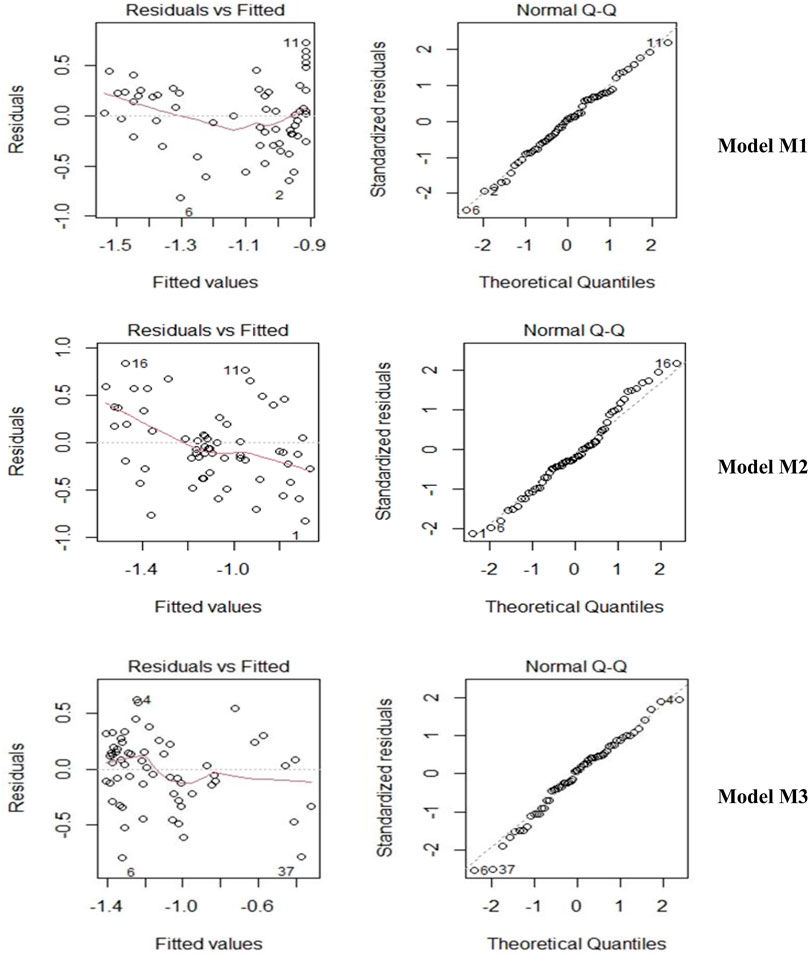
FIGURE 8. Residual plot and normal QQ plot.
The model M1 (Tables 2, 6 and Figure 9A) indicated that LF is a decreasing function of P. The predicted value of LF at minimum precipitation (0 mm) is 0.40 Mg/ha. The geometric mean of LF for observations with 0 cm precipitation is found to be 0.53 Mg/ha. The maximum value attained by P in the data set is 465.24 mm. The LF observed at this value of P is 0.22 Mg/ha and as per M1 the predicted LF at this value of P is 0.21 Mg/ha. Similar to model M1, model M2 (Table 2 and Figure 9B) indicates that LF is a decreasing function of T (Tables 2 and 6 and Figure 8B). The maximum and minimum values of LF, as predicted by M2 are 0.51 Mg/ha (at T = 15.07°C) and 0.21 Mg/ha (at T = 35.23°C). These observed values are 0.39 Mg/ha (at T = 15.07°C) and 0.38 Mg/ha (at T = 35.23°C). Model M3 (Tables 2, 6) indicates a complex interaction between P and T. M3 predicts a maximum value for LF (0.75 Mg/ha) at 0 mm precipitation and 15.07°C of temperature. As per M3, the minimum LF (0.22 Mg/ha) was obtained at 465.54 mm precipitation and 15.07°C of temperature. In what follows, the predictions for sub-datasets S1, S2, S3, and S4 are described.
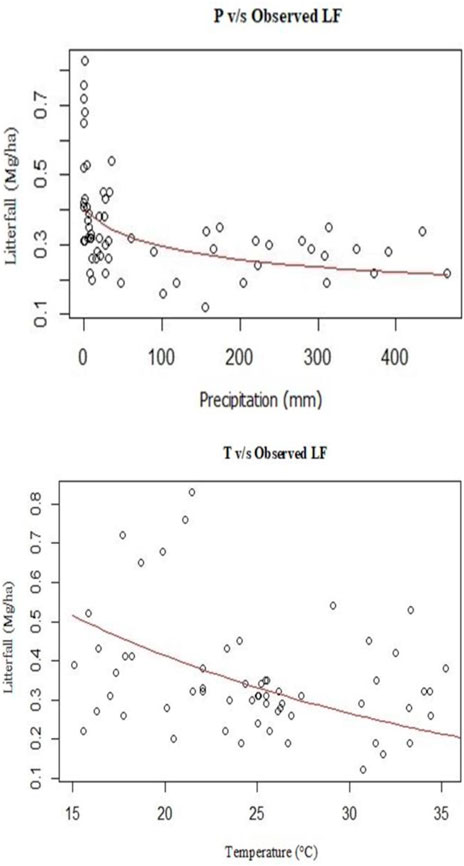
FIGURE 9. Scatter plot of the selected parameters v/s litterfall. (A): Mean precipitation (mm) v/s litterfall. Observed LF was predicted by model M1. The curve gives the predicted litter fall over the range of precipitations as per the model M1. (B): mean temperature (°C) v/s litterfall. observed LF was predicted by model M2. The curve gives the predicted litter fall over the range of temperature as per the model M2.
The set S1 consists of 20 sample points covering the months of November, December, January, and February. The temperature for S1 varied in the range of 15.7–23.36°C with a median of 19.29°C (Table 6). The precipitation for the sub-dataset varied in the range of 0–20.46 mm with a mean value of 6.13 mm. The average LF for S1 is found to be 0.40 Mg/ha. The LF for S1, as predicted by the models M1, M2, and M3 were 0.39 Mg/ha, 0.43 Mg/ha, and 0.40 Mg/ha. The set S2 consists of 8 sampled points spread mostly over January, March, September, October, and December. The temperature of S2 varied from 15.36 to 24.73°C with a median of 23.76°C. The precipitation for S2 varied in the range from 27.46 to 237.51 mm, with a mean value of 77.01 mm. The average LF for S2 was found to be 0.31 Mg/ha. The LF for S2, as predicted by the three models, was 0.31 Mg/ha, 0.35 Mg/ha, and 0.29 Mg/ha. The set S3 consists of 23 sample points spread over March, April, May, June, July, August, and September. The temperature for S3 was observed to be in the range of 25.03–35.23°C with a median of 26.26°C (Table 6). The precipitation for S3 varied in the range of 26.02–465.54 mm with a mean value of 221.26 mm. The average LF for S3 was found to be 0.26 Mg/ha. The predicted values of LF for S3, as predicted by the three models, were 0.25 Mg/ha, 0.31 Mg/ha and 0.26 Mg/ha. The set S4 consists of 9 sample points spread over March, April, and May. The temperature for S4 was observed to be in the range of 26.14–34.40°C with the median at 32.50°C. The precipitation for S4 varied in the range of 0.04–24.11 mm with a mean of 8.36 mm. The average LF for S4 was found to be 0.36 Mg/ha. The predicted values of LF for S4, as predicted by the three models, were 0.38 Mg/ha, 0.24 Mg/ha, and 0.29 Mg/ha.
Discussion
A seasonal litterfall epitomizes a crucial process in C and elemental cycling of the forest ecosystems (Wang et al., 2016). The major aim of the present study was to estimate the annual and seasonal litterfall pattern for 5 years from four different vegetation types of the tropical dry forest. The results revealed a positive relationship between the vegetation indices with the present litterfall along with the nutrient storage. The regression models were developed to establish the association between the litterfall and the climatic measures such as temperature and precipitation.
The short-term and long-term studies on estimating the annual litterfall patterns showed close relation in maintaining the C balance and sustainability within the forest ecosystems. The litter not only significantly contributed to the global C cycle but played a vital role in the supply of OM and enriching nutrients in the soil, which control intrinsic self-sustainable functions of the forest ecosystem (Sayer et al., 2011). The majority of the studies focused on analyzing the forest patterns for >5 y in different forest zones, i.e., tropical forests (Aryal et al., 2015), tropical dry forests (Souza et al., 2019), tropical rainforests, sub-tropical forests (Yang et al., 2004), temperate forests (Thakur et al., 2021). Few studies considered assessing the litterfall throughout for 5 y (Williams-Linera et al., 2021), 10 y (Wang et al., 2016), and >10 y (Leishangthem and Singh, 2021). Few studies narrowed down the range of field sites and analyzed litterfall from the specific tree species micro-sites. Few of the meta-analysis studies emphasize the long-term data as it is required for an improved understanding of the litter dynamics and the biogeochemical cycles involved within the forest ecosystems (Liu et al., 2021). Sustainable resource use efficiency of soil system depends upon the activeness of the microfaunal population and depends upon the C:N ratio. The addition of OM with the desirable C:N ratio improves the nutrient status of soil and enhances the soil quality (Kumar et al., 2021b). The debris and leaf fall from the trees on the forest floor make the soil porous, spongy, and biologically active. It provides a habitat for millions of micro-flora and macro-fauna essential for the decomposition of litter and nutrient cycling (Panwar and Gupta, 2015). The root systems of the trees bind the soil, particularly in the ecologically fragile and risk-prone areas that create barriers to soil erosion.
The total annual litterfall pattern of the world’s tropical forests is presented in Supplementary Table S3. In the present study, the mean annual litterfall coincides with the global estimation provided (Souza et al., 2019). In addition, the litterfall from the TDFs of India is consistent with the global litterfall patterns of the tropical forest, as mentioned in Supplementary Table S3. Results from Zhang et al. (2014) revealed that global litterfall patterns for tropical forests and tropical rainforests are equivalent. In the present study, leaves contributed ∼64% of the total annual litterfall, which is similar to the findings of previous studies (Araújo et al., 2019). The litterfall significantly correlates with the vegetative phenology of the plants since it is observed that the majority of the litterfall consists of leaf litter (Araújo et al., 2019). In TDFs, the ratio of leaf fall to the living leaf biomass decreases drastically with the increase in soil moisture, which in turn reflects the sensitivity of leaf turnover to changes in water availability (Van Bloem et al., 2003). Within the variation in annual litterfall production, seasonal variations were also observed throughout the year. From the present study, maximum litterfall production was detected in the winter season, i.e., ∼ 40%, while the remaining seasons contributed 30% each. Monthly studies (Figure 2) reveal that the cold–dry season (November–December) was favorable for litterfall production, followed by the hot–dry season (April–May). Similar observations were reported in the tropical rainforests, where the cold-dry seasons were ideal for the maximum litterfall input (Darro and Swamy, 2020). The present result contradicts the previous studies carried out in tropical forest ecosystems of India (Thakur et al., 2014). The litterfall production was maximum in summer, followed by the winter and monsoon seasons. As the data was collected for only one year, this could be the possible reason for such variation, which ultimately supports the studies carried out by Jia et al. (2020) and Wang et al. (2016), emphasizing the importance of long-term data analysis for precise litterfall estimation.
Remote sensing and GIS-associated techniques have been playing a key role in the detection and estimation of functional processes and biomass storage in tropical forests (Thakur et al., 2019), sub-tropical forests (Wang et al., 2016), temperate deciduous forests (Thakur et al., 2021), tropical montane forest (Wang et al., 2016), boreal forests (Zheng et al., 2004), deciduous forests (Birky, 2001) and Pine forests (Ozdemir and Yilmaz, 2020). Shen et al. (2019) demonstrated the conjunctive use of remote sensing and GIS-based techniques coupled with statistical analysis in estimating global litterfall patterns. It has been considered the largest dataset of litterfall patterns using geo-statistics. The present study revealed a positive and significant correlation between SAVI and NDVI (Figure 6 and Table 5) with litterfall and carbon storage for different vegetation types in the study area, which matches with reports of previous studies (Thakur et al., 2019). Spectral models were developed for the estimation of biomass and NPP using vegetation indices [NDVI, SAVI, and transformed vegetation index, and advanced vegetation index] (Thakur et al., 2019), considering forest growth rate as a function of climatic parameters such as temperature, moisture and light intensity (Birky, 2001).
Numerous studies evidenced a strong correlation between the vegetation indices such as NDVI, NDMI, and SAVI with ecological variables in various forest ecosystems (Thakur et al., 2019). The results of the studies revealed that NDVI is a key variable that strongly correlated to biomass C of vegetation, whereas N values were not found significant in any of the tested spectral vegetation indices (NDVI, SAVI, and NDMI) (Figure 6 and Table 5). Studies reveal that NDVI is positively correlated with litter biomass (Thakur et al., 2019), and the temporal anomalies in NDVI could be a good indicator of stress conditions in an ecosystem (Wang et al., 2020). Ozdemir & Yilmaz (2020) estimated litterfall biomass in pine forests of Turkey using NDVI extracted from Rapid-Eye, Spot-5, and Aster Satellite imageries along with the environmental factors such as heat and radiation index. In one of the interesting studies, i.e., Yang et al. (2018) developed a geometrical-optical based model using MODIS data along with statistical analysis to estimate the forest litter moisture of sub-tropical forests. This method separates the background reflectance from the optical remote sensing imagery, and it has proved to be an efficient model as it can also provide information about the undergrowth vegetation. Few studies that were carried out in tropical and sub-tropical forests (Wang et al., 2016) attempted to use the remote sensing time series such as MODIS data along with the vegetation indices, i.e., NDVI and climatic variables such as temperature and precipitation data, to estimate the litterfall production. Such studies demonstrated the importance of exploiting MODIS temporal data in monitoring the biogeochemical cycles in forest ecosystems.
Climatic variables such as temperature and precipitation are essential as they influence the annual litterfall production in forest ecosystems. A negative correlation was observed in the present study between the mean annual precipitation (mm) and mean litterfall (Mg/ha/y) which corroborates with the previous studies (Morffi-Mestre et al., 2020). Few studies in dry forests exhibited a close association between precipitation and litterfall (Darro and Swamy, 2020). The monthly dataset (Figure 2) highlights a low mean temperature (16–19°C) with low mean precipitation (0.1–7.5 mm), leading to the monthly high mean litterfall production (0.4–0.7 Mg/ha). This implies the importance of a monthly estimation of climatic parameters and litterfall in long-term studies. Zhang et al. (2014) concluded that precipitation is a major constraining factor in regulating litterfall in tropical forest ecosystems. Plants adopt a mechanism in which leaves shed is because of intense water stress, and this is most visible in the dry season (Zhang et al., 2014). Because the primary productivity is mostly controlled by the quantity and duration of precipitation, the seasonal fluctuations in precipitation limit and control the productivity and nutrient dynamics of seasonally dry forest ecosystems (Araújo et al., 2019). The duration and the quantity of the litterfall are heavily controlled by various abiotic parameters such as water, temperature, and precipitation and also depend on nutrient availability in the soil (Souza et al., 2019). Similar to tropical forests, the key drivers, such as temperature and precipitation, are also responsible for the change in litterfall production. The results of the study showed that there were negative effects of LT on total litterfall production (Wang et al., 2020). Because of the higher root: shoot biomass, dry tropical forests have the advantage of maintaining the metabolism at lower soil and leaf water potentials in comparison to temperate or humid tropical forests (Van Bloem et al., 2003).
Microfaunal populations also exert a vital influence on the sustainable and judicious decomposition of litter and regulation of litter dynamics. The soil micro-and macro-fauna influence the decomposition process as the litter accumulated on the surface layer serves as a source of organic food materials for soil fauna and ensures the efficient cycling of nutrients within a forest community (Preusser et al., 2021). Litter degradation and its conversion into humus accompanied by the decomposition of litter by microbial activities enhance the mineralization process and release nutrients in available forms from complex organic compounds (Cotrufo et al., 2010). Climatic factors, litter quality, and activity microorganisms regulate the standing state and litter turnover. It is widely demonstrated that the rate of annual litter decomposition (k-value) increases with temperature, precipitation, and litter quality in certain limits across the forest ecosystems, while it decreases with elevation characterized by LT, precipitation regimes in poor quality litter containing high lignin (Zhang et al., 2008). The temperature and drought are detrimental climatic effects that increase the k-value of various litter types in heterogonous forest landscapes (Jasińska et al., 2020). The litterfall and litterfall dynamics are key functionaries in the TDFs ecosystem, mainly hang on stand types and climatic variables, and are considered to be a storehouse of carbon for maintaining sustainable global climate change (Santos et al., 2012).
Conclusion
The present study is developed based on field and satellite data to understand the effect of stand type, seasons, and climatic variables on the litterfall in the seasonally dry tropical forests in Central India. The study indicates that litterfall in TDFs is significantly influenced by vegetation functional type, seasons, and climatic variables such as temperature and precipitation. The study linked to understanding sustainability in relation to litterfall leading to biomass and carbon sequestration for global climate change. The results revealed that the maximum litterfall biomass was obtained in the cold-dry season and that leaves contributed to most of the total litterfall production in the dry tropical forest. A positive correlation was observed between the litterfall and nutrient storage with soil-adjusted vegetation index and other vegetation indices. It will be possible to fairly predict the sustainable decomposition of litterfall using vegetation indices derived from remote sensing. These, in turn, will help in understanding both vegetation and soil carbon dynamics in the forest ecosystems. The study also demonstrated that both temperature and precipitation affected the litterfall in different functional types of vegetation. The results depicted that the precipitation is inversely proportional to the annual litterfall production in a dry tropical forest. Thus, the present study concludes that the vegetation types of AABR have significant potential to improve litter production and further store a large quantity of C and N from the atmosphere in the future to mitigate global climate change sustainably.
Data Availability Statement
The original contributions presented in the study are included in the article/Supplementary Material, further inquiries can be directed to the corresponding author.
Author Contributions
TT: conceptualization, methodology, writing-original draft, writing—review and editing, supervision. KE: software, formal analysis, writing—original draft, writing—review and editing. AT: data collection, analysis, review. AK: writing—review and editing. SB: software, formal analysis, writing-review, and editing. SS: formal analysis, writing—review and editing. AB: writing—review and editing. MK: writing-review and editing.
Funding
We would also like to acknowledge the financial support provided by the University Grants Commission (UGC) and Ministry of Environment, Forests and Climate Change (MoEF and CC), Government of India, New Delhi, vide its project Sanction No. F.13/4/2013- NNRMS/RE to conduct this research.
Conflict of Interest
The authors declare that the research was conducted in the absence of any commercial or financial relationships that could be construed as a potential conflict of interest.
The reviewer AS declared a shared affiliation with the author SS to the handling editor at the time of review.
Publisher’s Note
All claims expressed in this article are solely those of the authors and do not necessarily represent those of their affiliated organizations, or those of the publisher, the editors, and the reviewers. Any product that may be evaluated in this article, or claim that may be made by its manufacturer, is not guaranteed or endorsed by the publisher.
Acknowledgments
The authors are thankful to the authorities of Indira Gandhi National Tribal University (IGNTU), Amarkantak, Madhya Pradesh, India for their support and encouragement to carry out the present research work. The authors are also thankful to Digvesh Kumar Patel, Rohit Jaiswal, and Yogesh Kumar for their support provided during field and lab analysis.
Supplementary Material
The Supplementary Material for this article can be found online at: https://www.frontiersin.org/articles/10.3389/fenvs.2022.940614/full#supplementary-material
References
Araújo, M. B., Anderson, R. P., Márcia Barbosa, A., Beale, C. M., Dormann, C. F., Early, R., et al. (2019). Standards for Distribution Models in Biodiversity Assessments. Sci. Adv. 5 (1), eaat4858. doi:10.1126/sciadv.aat4858
Aryal, D. R., De Jong, B. H. J., Ochoa-Gaona, S., Mendoza-Vega, J., and Esparza-Olguin, L. (2015). Successional and Seasonal Variation in Litterfall and Associated Nutrient Transfer in Semi-evergreen Tropical Forests of SE Mexico. Nutr. Cycl. Agroecosyst 103 (1), 45–60. doi:10.1007/s10705-015-9719-0
Birky, A. K. (2001). NDVI and a Simple Model of Deciduous Forest Seasonal Dynamics. Ecol. Model. 143 (1-2), 43–58. doi:10.1016/s0304-3800(01)00354-4
Bond-Lamberty, B., and Thomson, A. (2010). Temperature-associated Increases in the Global Soil Respiration Record. Nature 464 (7288), 579–582. doi:10.1038/nature08930
Breusch, T. S., and Pagan, A. R. (1979). A Simple Test for Heteroscedasticity and Random Coefficient Variation. Econometrica 47, 1287–1294. doi:10.2307/1911963
Chave, J., Navarrete, D., Almeida, S., Álvarez, E., Aragão, L. E. O. C., Bonal, D., et al. (2010). Regional and Seasonal Patterns of Litterfall in Tropical South America. Biogeosciences 7 (1), 43–55. doi:10.5194/bg-7-43-2010
Chen, H. Y. H., Brant, A. N., Seedre, M., Brassard, B. W., and Taylor, A. R. (2017). The Contribution of Litterfall to Net Primary Production during Secondary Succession in the Boreal Forest. Ecosystems 20 (4), 830–844. doi:10.1007/s10021-016-0063-2
Cotrufo, M. F., Del Galdo, I., and Piermatteo, D. (2010). “Litter Decomposition: Concepts, Methods and Future Perspectives,” in Soil Carbon Dynamics (Cambridge: Cambridge University), 76–90.
Darro, H., and Swamy, S. L. (2020). Standing Litter and Litterfall Pattern in Dry Tropical Forests of Achanakmaar-Amarkantak Biosphere Reserve (AABR), India. Int. J. Curr. Microbiol. App. Sci. 9 (4), 2000–2007. doi:10.20546/ijcmas.2020.904.240
Darro, H., Swamy, S. L., Thakur, T. K., and Mishra, A. (2020). Floristic Composition, Structure, Diversity and Conservation Strategies for Rehabilitation of Dry Tropical Forests in Buffer Zone of Achanakmaar Amarkantak Biosphere Reserve (AABR), India. Int. J. Curr. Microbiol. App. Sci. 9 (4), 650–663. doi:10.20546/ijcmas.2020.904.079
Feng, C., Wang, Z., Ma, Y., Fu, S., and Chen, H. Y. H. (2019). Increased Litterfall Contributes to Carbon and Nitrogen Accumulation Following Cessation of Anthropogenic Disturbances in Degraded Forests. For. Ecol. Manag. 432, 832–839. doi:10.1016/j.foreco.2018.10.025
Frolking, S., Palace, M. W., Clark, D. B., Chambers, J. Q., Shugart, H. H., and Hurtt, G. C. (2009). Forest Disturbance and Recovery: A General Review in the Context of Spaceborne Remote Sensing of Impacts on Aboveground Biomass and Canopy Structure. J. Geophys. Res. 114, a–n. doi:10.1029/2008JG000911
GloVis (2021). Global Land Survey. AvaliableAt: https://glovis.usgs.gov/ (Accessed April 20, 2021).
Jasińska, J., Sewerniak, P., and Puchałka, R. (2020). Litterfall in a Scots Pine Forest on Inland Dunes in Central Europe: Mass, Seasonal Dynamics and Chemistry. Forests 11 (6), 678. doi:10.3390/f11060678
Jeet, I., Pandey, P. C., Singh, G. D., and Shankhwar, A. K. (2014). Influence of Organic and Inorganic Sources of Nutrients on Growth and Yield of Rice in Tarai Region of Uttarakhand. Ann. Agric. Res. New Ser. 35 (2), 176–182.
Jenny, H., Gessel, S. P., and Bingham, F. T. (1949). Comparative Study of Decomposition Rates of Organic Matter in Temperate and Tropical Regions. Soil Sci. 68 (6), 419–432. doi:10.1097/00010694-194912000-00001
Jia, B., Sun, H., Yu, W., and Zhou, G. (2020). Quantifying the Interannual Litterfall Variations in China’s Forest Ecosystems. J. Plant Ecol. 13 (3), 266–272. doi:10.1093/jpe/rtaa010
Joshi, R. K., and Garkoti, S. C. (2020). Litter Dynamics, Leaf Area Index and Forest Floor Respiration as Indicators for Understanding the Role of Nepalese Alder in White Oak Forests in Central Himalaya, India. Ecol. Indic. 111, 106065. doi:10.1016/j.ecolind.2020.106065
Khan, M. Y. A., El Kashouty, M., Gusti, W., Kumar, A., Subyani, A. M., and Alshehri, A. (2022). Geo-Temporal Signatures of Physicochemical and Heavy Metals Pollution in Groundwater of Khulais Region-Makkah Province, Saudi Arabia. Front. Environ. Sci. 9, 800517. doi:10.3389/fenvs.2021.800517
Kittur, B. H., Swamy, S. L., Bargali, S. S., and Jhariya, M. K. (2014). Wildland Fires and Moist Deciduous Forests of Chhattisgarh, India: Divergent Component Assessment. J. For. Res. 25 (4), 857–866. doi:10.1007/s11676-014-0471-0
Kumar, A., Kumar, M., Pandey, R., ZhiGuo, Y., and Cabral-Pinto, M. (2021a). Forest Soil Nutrient Stocks along Altitudinal Range of Uttarakhand Himalayas: An Aid to Nature Based Climate Solutions. Catena 207, 105667. doi:10.1016/j.catena.2021.105667
Kumar, A., Yu, Z.-G., Klemeš, J. J., and Bokhari, A. (2021b). A State-Of-The-Art Review of Greenhouse Gas Emissions from Indian Hydropower Reservoirs. J. Clean. Prod. 320, 128806. doi:10.1016/j.jclepro.2021.128806
Lanuza, O., Casanoves, F., Zahawi, R. A., Celentano, D., Delgado, D., and Holl, K. D. (2018). Litterfall and Nutrient Dynamics Shift in Tropical Forest Restoration Sites after a Decade of Recovery. Biotropica 50 (3), 491–498. doi:10.1111/btp.12533
Leishangthem, D., and Singh, M. R. (2021). Litter Fall Production Pattern and Leaf Litter Decomposition Rate from Three Dominant Tree Species Found in a Subtropical Semi Ever Green Riparian Forest of Dikhu River, North East India. Int. J. Ecol. Environ. Sci. 3 (1), 185–196.
Liu, F., Wang, C., and Wang, X. (2021). Can Vegetation Index Track the Interannual Variation in Gross Primary Production of Temperate Deciduous Forests? Ecol. Process. 10 (1), 1–3. doi:10.1186/s13717-021-00324-2
Manolis, E. N., Zagas, T. D., Karetsos, G. K., and Poravou, C. A. (2019). Ecological Restrictions in Forest Biomass Extraction for a Sustainable Renewable Energy Production. Renew. Sustain. Energy Rev. 110, 290–297. doi:10.1016/j.rser.2019.04.078
Morffi-Mestre, H., Ángeles-Pérez, G., Powers, J. S., Andrade, J. L., Huechacona Ruiz, A. H., May-Pat, F., et al. (2020). Multiple Factors Influence Seasonal and Interannual Litterfall Production in a Tropical Dry Forest in Mexico. Forests 11 (12), 1241. doi:10.3390/f11121241
NOAA-ESRL (2022). Trends in Atmospheric CO2. AvaliableAt: https://www.co2.earth/ (Accessed April 21st, 2022).
Oelbermann, M., Paul Voroney, R., and Gordon, A. M. (2004). Carbon Sequestration in Tropical and Temperate Agroforestry Systems: a Review with Examples from Costa Rica and Southern Canada. Agric. Ecosyst. Environ. 104 (3), 359–377. doi:10.1016/j.agee.2004.04.001
Ozdemir, I., and Yilmaz, S. (2020). Modeling Litter Mass Using Satellite NDVI Images and Environmental Variables in a Brutian Pine Forest Located in the Southwest of Turkey. Carbon Manag. 11 (3), 205–212. doi:10.1080/17583004.2020.1735917
Panwar, V. P., and Gupta, M. K. (2015). Litter Fall, Nutrient Return and Soil Fertility under Celtis Australis: an Indigenous Agroforestry Tree Species in Himachal Pradesh, India. Int. J. Environ. Sci. 6 (3), 318–329. doi:10.6088/ijes.6036
Preusser, S., Liebmann, P., Stucke, A., Wirsching, J., Müller, K., Mikutta, R., et al. (2021). Microbial Utilisation of Aboveground Litter-Derived Organic Carbon within a Sandy Dystric Cambisol Profile. Front. Soil Sci. 1, 666950. doi:10.3389/fsoil.2021.666950
Qin, S., Nie, S., Guan, Y., Zhang, D., Wang, C., and Zhang, X. (2022). Forest Emissions Reduction Assessment Using Airborne LiDAR for Biomass Estimation. Resour. Conservation Recycl. 181, 106224. doi:10.1016/j.resconrec.2022.106224
Roychoudhury, N., Sharma, R., and Mishra, R. K. (2019). Scope and Challenges of Biodiversity Conservation and Management in Achanakmaar-Amarkantak Biosphere Reserve. Plants Environ. 1 (1), 46–54.
Sagar, R., Raghubanshi, A. S., and Singh, J. S. (2003). Tree Species Composition, Dispersion and Diversity along a Disturbance Gradient in a Dry Tropical Forest Region of India. For. Ecol. Manag. 186 (1-3), 61–71. doi:10.1016/s0378-1127(03)00235-4
Santos, R. M., Oliveira-Filho, A. T., Eisenlohr, P. V., Queiroz, L. P., Cardoso, D. B. O. S., and Rodal, M. J. N. (2012). Identity and Relationships of the Arboreal Caatinga Among Other Floristic Units of Seasonally Dry Tropical Forests (SDTFs) of North-Eastern and Central Brazil. Ecol. Evol. 2 (2), 409–428. doi:10.1002/ece3.91
Sarto, M. V. M., Borges, W. L. B., Sarto, J. R. W., Rice, C. W., and Rosolem, C. A. (2020). Deep Soil Carbon Stock, Origin, and Root Interaction in a Tropical Integrated Crop-Livestock System. Agroforest Syst. 94 (5), 1865–1877. doi:10.1007/s10457-020-00505-6
Sayer, E. J., Heard, M. S., Grant, H. K., Marthews, T. R., and Tanner, E. V. J. (2011). Soil Carbon Release Enhanced by Increased Tropical Forest Litterfall. Nat. Clim. Change 1 (6), 304–307. doi:10.1038/nclimate1190
Shen, G., Chen, D., Wu, Y., Liu, L., and Liu, C. (2019). Spatial Patterns and Estimates of Global Forest Litterfall. Ecosphere 10 (2), e02587. doi:10.1002/ecs2.2587
Souza, S. R., Veloso, M. D., Espírito-Santo, M. M., Silva, J. O., Sánchez-Azofeifa, A., Souza e Brito, B. G., et al. (2019). Litterfall Dynamics along a Successional Gradient in a Brazilian Tropical Dry Forest. For. Ecosyst. 6 (1), 1–2. doi:10.1186/s40663-019-0194-y
Stephens, M. A. (1974). EDF Statistics for Goodness of Fit and Some Comparisons. J. Am. Stat. Assoc. 69 (347), 730–737. doi:10.1080/01621459.1974.10480196
Sun, J., Sarfraz, M., Khawaja, K. F., and Abdullah, M. I. (2022). Sustainable Supply Chain Strategy and Sustainable Competitive Advantage: A Mediated and Moderated Model. Front. Public Health 10, 895482. doi:10.3389/fpubh.2022.895482
Tang, J. W., Cao, M., Zhang, J. H., and Li, M. H. (2010). Litterfall Production, Decomposition and Nutrient Use Efficiency Varies with Tropical Forest Types in Xishuangbanna, SW China: a 10-year Study. Plant Soil 335 (1), 271–288. doi:10.1007/s11104-010-0414-2
Thakur, T. K., Padwar, G. K., Patel, D. K., and Bijalwan, A. (2019). Monitoring Land Use, Species Composition and Diversity of Moist Tropical Environ in Achanakmaar Amarkantak Biosphere Reserve, India Using Satellite Data. Bij 3 (4), 162–172. doi:10.15406/bij.2019.03.00141
Thakur, T. K., Patel, D. K., Bijalwan, A., Dobriyal, M. J., Kumar, A., Thakur, A., et al. (2020). Land Use Land Cover Change Detection through Geospatial Analysis in an Indian Biosphere Reserve. Trees, For. People 2, 100018. doi:10.1016/j.tfp.2020.100018
Thakur, T. K., Patel, D. K., Thakur, A., Kumar, A., Bijalwan, A., Bhat, J. A., et al. (2021). Biomass Production Assessment in a Protected Area of Dry Tropical Forest Ecosystem of India: A Field to Satellite Observation Approach. Front. Environ. Sci. 432, 757976. doi:10.3389/fenvs.2021.757976
Thakur, T., Kumar, Y., Bijalwan, A., and Dobriyal, M. J. (2017). Traditional Uses and Sustainable Collection of Ethnobotanicals by Aboriginal Communities of the Achanakmaar Amarkantak Biosphere Reserve of India. Fem 3 (3), 39–49. doi:10.11648/j.fem.20170303.11
Thakur, T., Swamy, S. L., and Nain, A. S. (2014). Composition, Structure and Diversity Characterization of Dry Tropical Forest of Chhattisgarh Using Satellite Data. J. For. Res. 25 (4), 819–825. doi:10.1007/s11676-014-0486-6
U-Din, S., Nazir, M. S., and Sarfraz, M. (2022). The Climate Change and Stock Market: Catastrophes of the Canadian Weather. Environ. Sci. Pollut. Res 29, 44806–44818. doi:10.1007/s11356-022-19059-4
Van Bloem, S. J., Murphy, P. G., and Lugo, A. E. (2003). Subtropical Dry Forest Trees with No Apparent Damage Sprout Following a Hurricane. Trop. Ecol. 44 (2), 137–146.
Walkley, A., and Black, I. A. (1934). An Examination of the Degtjareff Method for Determining Soil Organic Matter, and a Proposed Modification of the Chromic Acid Titration Method. Soil Sci. 37 (1), 29–38. doi:10.1097/00010694-193401000-00003
Wang, H.-C., Lin, K.-C., and Huang, C.-y. (2016). Temporal and Spatial Patterns of Remotely Sensed Litterfall in Tropical and Subtropical Forests of Taiwan. J. Geophys. Res. Biogeosci. 121 (2), 509–522. doi:10.1002/2015jg003113
Wang, J., Yang, D., Detto, M., Nelson, B. W., Chen, M., Guan, K., et al. (2020). Multi-scale Integration of Satellite Remote Sensing Improves Characterization of Dry-Season Green-Up in an Amazon Tropical Evergreen Forest. Remote Sens. Environ. 246, 111865. doi:10.1016/j.rse.2020.111865
Williams-Linera, G., Bonilla-Moheno, M., López-Barrera, F., and Tolome, J. (2021). Litterfall, Vegetation Structure and Tree Composition as Indicators of Functional Recovery in Passive and Active Tropical Cloud Forest Restoration. For. Ecol. Manag. 493, 119260. doi:10.1016/j.foreco.2021.119260
Yadav, D. K., Jhariya, M. K., and Ghosh, L. (2019). Vegetation Inter-relationship and Regeneration Status in Tropical Forest Stands of Central India. J. Plant Dev. Sci. 11 (3), 151–159.
Yang, K., Yang, Y., Xu, Z., and Wu, Q. (2018). Soil Respiration in a Subtropical Forest of Southwestern China: Components, Patterns and Controls. PloS one 13 (9), e0204341. doi:10.1371/journal.pone.0204341
Yang, Y. S., Guo, J. F., Chen, G. S., Xie, J. S., Cai, L. P., and Lin, P. (2004). Litterfall, Nutrient Return, and Leaf-Litter Decomposition in Four Plantations Compared with a Natural Forest in Subtropical China. Ann. For. Sci. 61 (5), 465–476. doi:10.1051/forest:2004040
Zeilhofer, P., Sanches, L., Vourlitis, G. L., and Andrade, N. L. R. D. (2012). Seasonal Variations in Litter Production and its Relation with MODIS Vegetation Indices in a Semi-deciduous Forest of Mato Grosso. Remote Sens. Lett. 3 (1), 1–9. doi:10.1080/01431161.2010.523025
Zhang, D., Hui, D., Luo, Y., and Zhou, G. (2008). Rates of Litter Decomposition in Terrestrial Ecosystems: Global Patterns and Controlling Factors. J. Plant Ecol. 1 (2), 85–93. doi:10.1093/jpe/rtn002
Zhang, H., Yuan, W., Dong, W., and Liu, S. (2014). Seasonal Patterns of Litterfall in Forest Ecosystem Worldwide. Ecol. Complex. 20, 240–247. doi:10.1016/j.ecocom.2014.01.003
Zheng, D., Prince, S., and Hame, T. (2004). Estimating Net Primary Production of Boreal Forests in Finland and Sweden from Field Data and Remote Sensing. J. Veg. Sci. 15 (2), 161–170. doi:10.1111/j.1654-1103.2004.tb02251.x
Zhu, X., Liu, W., Chen, H., Deng, Y., Chen, C., and Zeng, H. (2019). Effects of Forest Transition on Litterfall, Standing Litter and Related Nutrient Returns: Implications for Forest Management in Tropical China. Geoderma 333, 123–134. doi:10.1016/j.geoderma.2018.07.023
Zhu, X., Zou, X., Lu, E., Deng, Y., Luo, Y., Chen, H., et al. (2021). Litterfall Biomass and Nutrient Cycling in Karst and Nearby Non-karst Forests in Tropical China: A 10-year Comparison. Sci. Total Environ. 758, 143619. doi:10.1016/j.scitotenv.2020.143619
Nomenclature
Abbreviation
C Carbon
C.G. Chhattisgarh
LF Litterfall
GIS Geographic Information System
IVI Important value index
SAVI Soil-Adjusted Vegetation Index
NS Non-Significant
R Red
R2 Coefficient of determination
VI Vegetation Index
Keywords: litterfall biomass, landscape ecology, plant climate interation, climatic variables, carbon sequestration
Citation: Thakur TK, Eripogu KK, Thakur A, Kumar A, Bakshi S, Swamy SL, Bijalwan A and Kumar M (2022) Disentangling Forest Dynamics for Litter Biomass Production in a Biosphere Reserve in Central India. Front. Environ. Sci. 10:940614. doi: 10.3389/fenvs.2022.940614
Received: 10 May 2022; Accepted: 01 June 2022;
Published: 12 July 2022.
Edited by:
Larisa Ivascu, Politehnica University of Timișoara, RomaniaReviewed by:
Abhinav Sao, Indira Gandhi Agricultural University, IndiaManmohan Dobriyal, Rani Lakshmi Bai Central Agricultural University, India
Zeying Li, Hanshan Normal University, China
Copyright © 2022 Thakur, Eripogu, Thakur, Kumar, Bakshi, Swamy, Bijalwan and Kumar. This is an open-access article distributed under the terms of the Creative Commons Attribution License (CC BY). The use, distribution or reproduction in other forums is permitted, provided the original author(s) and the copyright owner(s) are credited and that the original publication in this journal is cited, in accordance with accepted academic practice. No use, distribution or reproduction is permitted which does not comply with these terms.
*Correspondence: Amit Kumar, amitkdah@nuist.edu.cn