Litterfall in a Scots Pine Forest on Inland Dunes in Central Europe: Mass, Seasonal Dynamics and Chemistry


1
Department of Soil Science and Landscape Management, Faculty of Earth Sciences and Spatial Management, Nicolaus Copernicus University, 87-100 Toruń, Poland
2
Department of Ecology and Biogeography, Faculty of Biological and Veterinary Sciences, Nicolaus Copernicus University, 87-100 Toruń, Poland
3
Centre for Climate Change Research, Nicolaus Copernicus University, 87-100 Toruń, Poland
*
Authors to whom correspondence should be addressed.
Forests 2020, 11(6), 678; https://doi.org/10.3390/f11060678
Submission received: 19 May 2020
/
Revised: 6 June 2020
/
Accepted: 9 June 2020
/
Published: 12 June 2020
(This article belongs to the Section Forest Ecology and Management)
Abstract
:Extensive areas of inland dunes are commonly overplanted with Scots pine (Pinus sylvestris). However, thus far the pine litterfall has not been investigated in detail in Scots pine stands overgrowing the landforms. Therefore, the aim of this study was to analyse the mass and chemical composition of litterfall in a dune Scots pine forest, paying special attention to the differences in the properties of the particular categories of litterfall (needles, twigs, bark, cones, residue) occurring in different seasons. The secondary goal of the research was to investigate the possible effect of contrasting slope aspect on litterfall properties. Litterfall was examined for three years on a north- and south-facing dune slope using the litter trap method. The mass and chemical composition (C, N, P, K, Mg, Mn, Ca, Fe, Al) of each litterfall category was analysed. Average annual mass of litterfall ranged from 322.0 ± 2.6 (slope N) to 361.9 ± 34.2 (slope S) g m−2 year−1. Fluctuations in the annual concentrations of N, P, K and Mg were determined, which was the result of their gradual withdrawal from needles before they were dropped in autumn. Immobile or poorly mobile elements (i.e., Mn, Ca, Fe and Al) were found to be steadily accumulated during the year in fallen tissues. The studied elements can be set in the following order as regards the annual pools which return to a topsoil with litterfall: C > N > Ca > K > Mg > Mn > Al > P > Fe on slope N and C > Ca > N > K > Mg > Al > P > Mn > Fe on slope S. Despite the fact that the residue (seeds etc.) constitutes a much smaller part of the total litterfall mass than the needles, comparable amounts of N, P, K, Al and Fe return to a topsoil with both these categories. The only element for which we determined differences in concentrations regarding slope aspect was Mn: the concentrations were significantly higher for needles, twigs, bark and cones on the N than the S slope.
1. Introduction
Litterfall is a significant pathway for the return of nutrients from plants to the forest floor and, subsequently, to the mineral soil [1]. It provides the soil surface with plant debris (e.g., needles, broadleaves, twigs, branches, cones, bark, seeds, flowers, fruits) that gradually decays with the participation of decomposer communities (bacteria, actinomycetes, fungi and invertebrates) during the decomposition process [2,3]. During that process, nutrients gradually become available for plant uptake, and consequently nutrient turnover in the vegetation–soil system is crucial for the productivity of forest ecosystems [4]. The chemical composition of litterfall is one of the main factors determining the course of nutrient release [5]. Thus, quantitative and qualitative analyses of litterfall contributes to a better understanding of nutrient cycling dynamics. Moreover, particular plant communities are characterised by different chemical composition of litterfall, and thus, in the long term, litterfall with specific chemical properties has an appreciable influence on the chemical and physicochemical properties of soil organic matter and, subsequently, on soil type [6,7]. Some authors [8] even suggest that litterfall can be used as an indicator of forest stand condition, especially in a coniferous ecosystem. Therefore, any information supplementing the knowledge on the above issues may be useful in sustainable forest management [9] or in the re-establishment of damaged environments [10].
The mass, structure and chemical composition of litterfall depend on many factors, the most important of which include forest stand’s: species composition [9,11,12], stage of succession development [13], age [14], tree density [15], tree vigour (health condition [8]), and form of regeneration (naturally vs. artificially regenerated [16]). Additionally, the properties of litterfall are affected by habitat conditions, such as climate [5], air temperature [12,13,17] and soil properties [7]. The mass, structure and chemical composition of litterfall show annual dynamics associated with the cyclical nature of physiological processes, usually resulting from the seasons [18,19]; however, the observed regularities can be affected by incidental events, such as extreme weather conditions (strong winds or heavy rainfall, [9]), fire [20] and tree pest gradation [21].
In most European forest ecosystems, the main source of litterfall is trees [5,22], and it is the foliar fall which is the major constituent of the debris that falls to the ground surface [23]. However, other categories of litterfall from various parts of trees, such as branches, cones, seeds, fruits, bark, etc. are also important in the nutrient cycling dynamics, because they change the quality of annual litterfall [9]. Most often, the research concerns the chemical composition in annual litterfall of particular categories [9,12,23].
In general, the litterfall in a Scots pine forest has been studied extensively in different ecosystems e.g., [11,17,22,23]; however, so far litterfall has not been investigated and described in detail with reference to inland dunes, despite the fact that these landforms are common and usually overgrown with forest stands (pine dominated, mainly) in many regions of the world, especially in Central and Eastern Europe [24], northern Asia [25] and North America [26]. Thus, the aim of this research was to analyse the mass and chemical composition of litterfall from trees in a dune Scots pine forest, paying special attention to the differences in properties of the particular categories of litterfall (needles, twigs, cones, bark, residue) in seasons. Furthermore, despite inland dunes not being huge landforms, topographically induced differentiation in some environmental characteristics and processes have lately been described with regard to those landforms [27,28,29]. These findings encouraged us to establish the secondary goal of our study, namely, to investigate the possible effect that contrasting slope aspect (north vs. south facing) can have on the properties of litterfall. Designing our research, we hypothesised that in a dune Scots pine forest (i) mass and chemical composition of litterfall from trees is significantly different in particular seasons, (ii) mass and chemical composition of litterfall significantly varies in particular categories of litterfall (needles, twigs, cones, bark, residue), (iii) litterfall categories of relatively low mass can have a more crucial importance for nutrient turnover than would result from their mass, and that (iv) slope aspect could potentially affect characteristics of litterfall.
2. Materials and Methods
2.1. Study Site
The study was conducted on an inland dune area of the Toruń Basin (N Poland). The basin is one of the largest inland dune fields in Central Europe [24]. The area has an average annual temperature of 7.9 °C and an average annual precipitation of 522.5 mm [30]. Following the fact that inland dunes constitute poor habitats, the potential vegetation for dune fields of the basin is subcontinental, poor in species richness pine forest Peucedano-Pinetum [31].
The research sites were situated on contrasting slope aspects (north and south facing, hereafter referred to as “slope N” and “slope S”) of a latitudinally situated dune (52°55′13.08″ N, 18°42′05.42″ E) with a relative height of ca. 15 m. On both investigated slopes (north and south facing) acidic Podzols occur, but the soil of the north facing slope is more podzolized [27,32]. Both slopes were located within the same 145-year-old planted Scots pine stand, which has been subjected to the same forest management treatments (thinning, etc.) on both studied slopes since planting. The average diameter at breast height of pines growing on the studied slopes was 33.2 ± 5.7 cm (32.4 ± 5.5 cm on the north- and 34.0 ± 6.0 cm on the south-facing slope), whereas the average height was 20.1 ± 1.8 m (19.7 ± 1.7 m on the north- and 20.5 ± 1.8 m on the south-facing slope) [32].
2.2. Sampling
Litterfall was examined for three years (2013, 2016, 2017) on the north- and south-facing slopes on the investigated dune using the litter trap method [33]. On both studied slopes, 10 litter traps were placed (20 in total) and arranged on every slope in two rows of 5 traps each, spaced 5 m apart. The litter traps had a circular shape with a nominal single sampling area of 0.25 m2 and were installed at 1 m above ground level. Subsequently, litterfall material was collected monthly (in the middle of a month) from each trap to linen bags for laboratory analyses.
2.3. Laboratory Methods
The collected samples were dried at 65 °C to constant weight. Then, the samples were manually sorted into five categories: needles, twigs, bark, cones and residue (which included other organic debris like seeds and unidentified materials). Subsequently, the material of each category was weighed and homogenised with a grinder. Next, for each category and each year separately, samples were combined into compound samples representing seasons: winter (samples collected in December–February), spring (March–May), summer (June–August) and autumn (September–November). The three years of the study were replicates in the analysis of the contents of elements in particular litterfall categories in each season. Altogether, 60 samples were obtained for each slope (5 categories × 4 seasons × 3 years), thus a total of 120 samples being collected on two dune slopes were investigated in the study.
All the samples were tested for the contents of nine elements (C, N, P, K, Ca, Mg, Mn, Fe, Al), which were determined according to the following methods: total nitrogen by the Kjeldahl method; organic carbon by sample oxidation in a mixture of K2Cr2O7 and H2SO4 [34]; phosphorus by the colorimetric method with the use of Molybdenum Blue; iron by the colorimetric method using 1,10-phenanthroline and aluminium by the colorimetric method with the use of Aluminon. The contents of phosphorus, iron and aluminium were measured with a UV-1601 Spectrophotometer (Beijing Rayleigh Analytical Instrument Corp., Chaoyang District, Beijing, China) at wavelengths of 700, 518 and 525 nm, respectively. The contents of K, Mg, Ca and Mn were determined with a SOLAR 969 Atomic Absorption Spectrophotometer (UNICAM, Cambridge, United Kingdom). The contents of P, K, Mg, Ca, Mn, Fe and Al were determined after an acidic digestion of the samples (acid mixture: nitric, perchloric and sulphuric acid in a volume ratio of 20:5:1 [35]).
2.4. Data Analysis
The Kruskal–Wallis test and post hoc Dunn’s test were used to compare the mean contents of particular elements between studied categories of litterfall and the mean contents of the elements in the same category of litterfall between seasons. While the Mann–Whitney U-Test was used to compare the mean contents of elements in the same category of litterfall between investigated slopes. In these calculations, detected differences were deemed significant if p < 0.05. The statistical analyses were performed in Statistica 7.1 (StatSoft, Tulsa, OK, USA). In the Results section, mean values are given together with values (±) of standard error.
3. Results
3.1. Litterfall Mass Dynamics
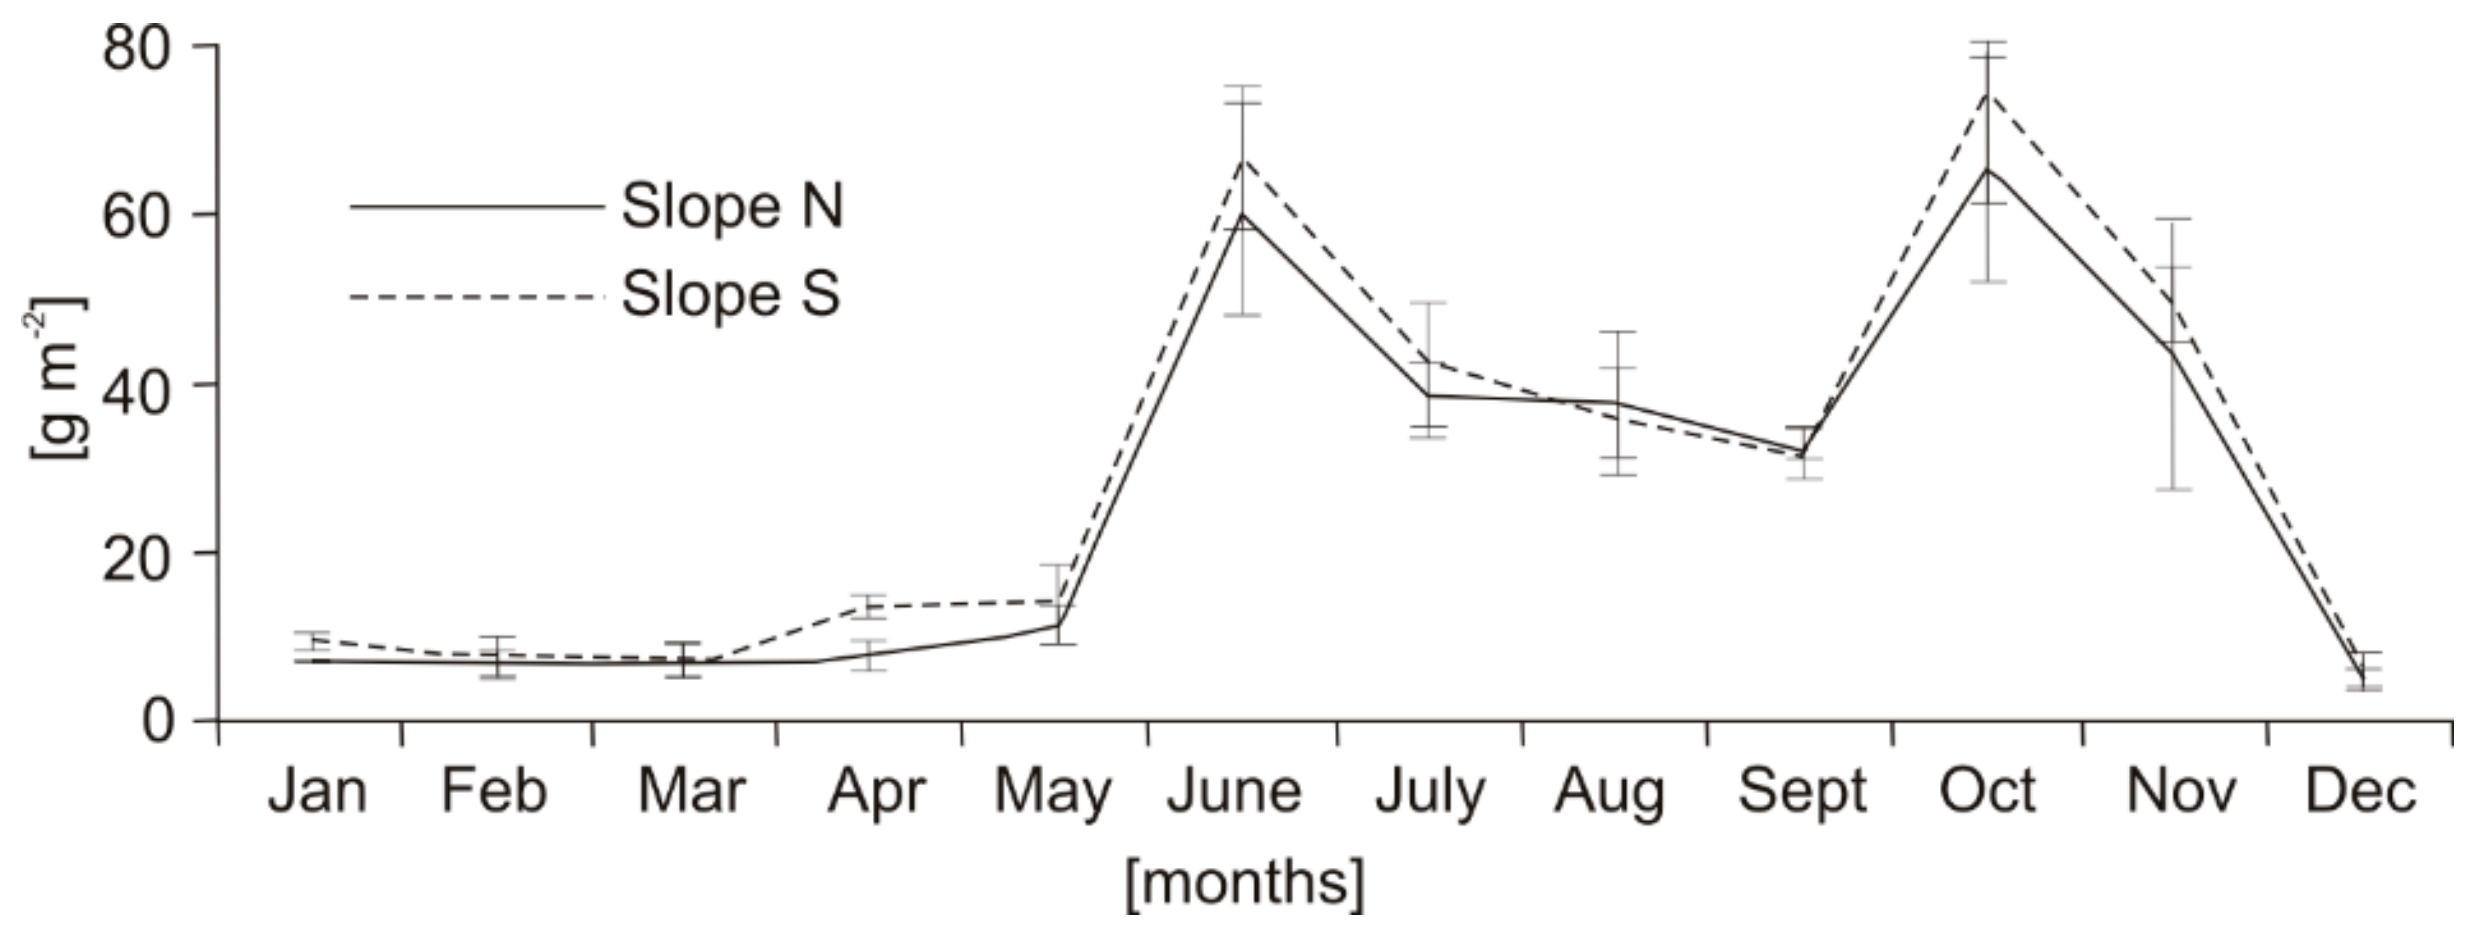
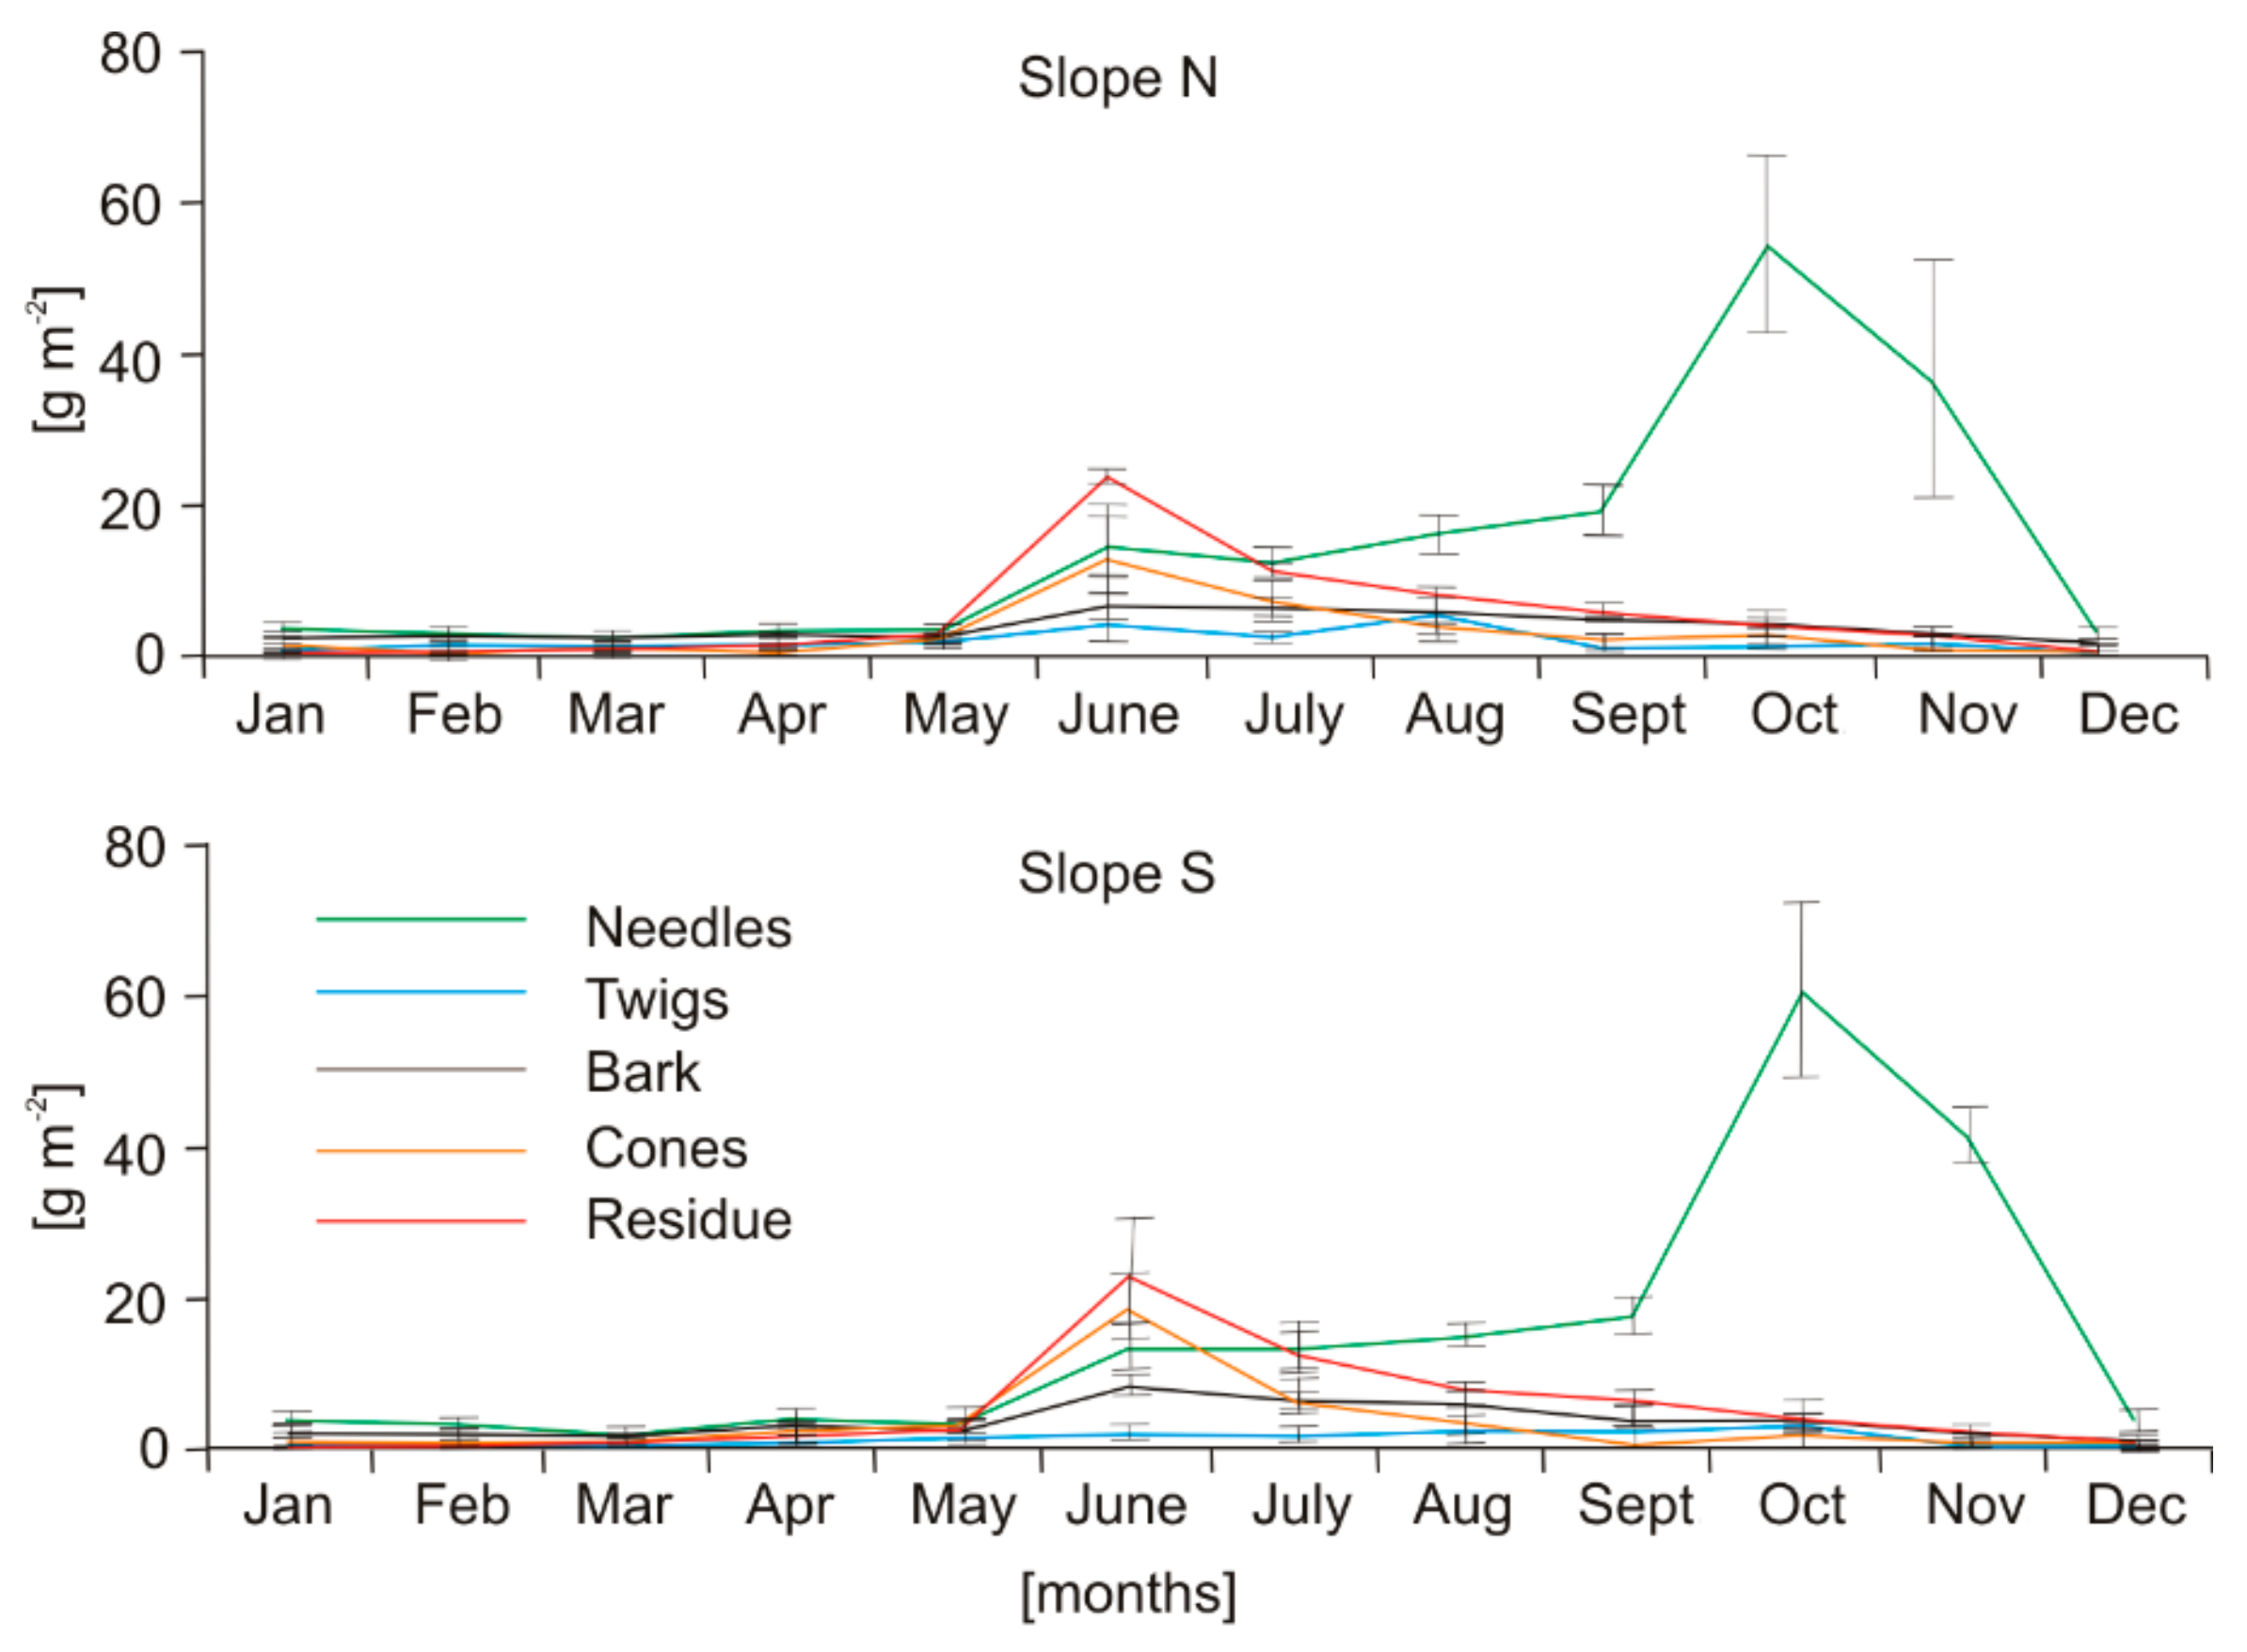
Average annual mass of tree litterfall ranged from 322.0 ± 2.6 (slope N) to 361.9 ± 34.2 (slope S) g m−2 year−1 (Table 1). During the research, two peaks in the annual dynamics of total litterfall were recorded: the primary in autumn and the secondary in summer (Figure 1). The autumn peak was recorded in October, while the summer peak was in June (Figure 1). As can be seen from Figure 2, the autumn peak was caused on both studied slopes by the pine needle fall, whereas the summer peak was mostly caused by residue fall, and to a lesser extent by cone and pine needle fall.
3.2. Litterfall Chemistry
3.2.1. Differences Between Categories
The chemical composition of each category of litterfall significantly varied. On both studied slopes, the lowest contents of N, P, K, Mg and C was found in the bark, the lowest contents of Ca and Mn was found in the cones, and the smallest content of Fe and Al was identified in the needles and cones. The bark possessed the highest content of Ca, and the needles had the highest content of Mn and C, whereas the residue was characterised by the highest content of N, P, K, Mg, Fe and Al (Table 2 and Table 3).
3.2.2. Differences Between Seasons
The dynamics of C, Mn and Ca content in particular litterfall categories did not show significant seasonal variation, whereas there was clear inter-seasonal variation in N, P, K and Mg content in needles, and in N and P content in residue. In the case of pine needles, the content of N and P was the lowest in autumn. By contrast, in the case of residue, a reduced content of N and P was observed in summer (Table 2 and Table 3). Thus, in both cases the lowest content of N and P was observed during the highest fall of the category (autumn for needles, summer for residue, Figure 2). Furthermore, it was also found that the content of K in needles significantly decreased in winter compared to other seasons (Table 2 and Table 3). With regard to the dynamics of N, P, K and Mg contents in the fall of the bark, cones and branches, no regularities were noted (Table 2 and Table 3).
Statistically significant differences between seasons were found in the Fe content in fall of bark, and the Al content in the fall of residues on both studied slopes (Table 2 and Table 3). Additionally, the Kruskal–Wallis test detected statistically significant differences between seasons in the Fe content in the fall of residues as well as the Al content in the fall of bark and cones on slope S (Table 3).
3.2.3. Pools of Elements Returning to the Topsoil
The studied elements can be set in the following order as regards the increasing annual pools which return to the organic soil horizon with litterfall: C > N > Ca > K > Mg > Mn > Al > P > Fe on slope N and C > Ca > N > K > Mg > Al > P > Mn > Fe on slope S (Table 4). The largest proportions of pools of C, Mg, Ca and Mn return to the topsoil with needles (Figure 3), and the most N, P, K and Al returns to topsoil with the needles and residue (similar proportions in both categories of litterfall, despite the fact that the mass of needle fall to the surface is much higher than mass of residue, Table 4), while the highest proportion of Fe pools returns to the topsoil with the residue (Figure 3).
3.2.4. Differences between Slopes
No significant differences in chemistry of litterfall were found between the studied slopes, except Mn. Content of Mn in the fall of needles, twigs, bark and cones differs significantly between slopes. Specifically, we found that the values were statistically higher on slope N than S (e.g., Mn content in needles in winter was 0.74 ± 0.03 and 0.52 ± 0.02, respectively, etc., Table 2 and Table 3).
4. Discussion
4.1. Litterfall Mass Dynamics
The total annual litterfall mass and that of the particular categories obtained in our research is consistent with values obtained in previous studies conducted in coniferous stands at similar latitudes in the northern hemisphere [11,22,36]. The values of total annual litterfall obtained by us are lower than those obtained by other authors to the south of the latitude tested by us, e.g., 411.6 ± 93.2 g m−2 year−2 at Valsaín in Segovia in Spain [37], and higher than values of litterfall mass to the north of the latitude tested by us, e.g., 199.5 ± 27.2 g m−2 year−2 in eastern Finland [38]. However, the values we received fit into ranges obtained at other latitudes in earlier years, e.g., 270–440 g m−2 year−2 in the eastern Pyrenees (Iberian peninsula; [39]), 132.5–340.2 g m−2 year−2 at various sites in Finland (in the north–south transect; [23]). Other species of the genus Pinus growing in tropical climates have a much greater total annual litterfall mass, e.g., 598.8 ± 64.7 g m−2 year−2 for Pinus caribaea in Ibadan in Nigeria [40], 800 g m−2 year−2 for Pinus luchuensis in the north of Okinawa Island [41], and 1430 g m−2 year−2 for Pinus caribaea var. hondurensis in Puerto Rico [9]. The mass of litterfall is closely related to latitude, as other authors have already shown in their studies [5]. However, this dependence may be changed by environmental factors such as altitude, microclimate, catastrophic events like droughts and gradations, etc.; thus, in some cases litterfall in forest stands in northern areas may be larger than that in southern areas, as shown in some of the examples we have provided above regarding our results. The changing climate also affects the mass of litterfall [37].
Litterfall occurs throughout the whole year, but in temperate regions of the northern hemisphere, its intensity varies seasonally and forms two peaks within a year. The highest, which is majorly composed of leaf/needle fall, is recorded in autumn (October or November), followed by the summer peak (May or June) majorly composed of other categories of litterfall [16,22], while the lowest rate is found in winter and spring. The dynamics of litterfall are related to latitude; specifically, further north of our research area, in northern Finland, autumn litterfall is in early August [22], while further south of our research area, in a Mediterranean climate, the pattern of dynamics of litterfall is different, with the highest peak of litterfall being observed in June during the drought period [22,37]. At latitude, which we also studied, there is a seasonal shift in the recorded months of the autumn litterfall peak, when we compare the reports of earlier studies to recent ones. For instance, a study from northern Poland reported September as hosting the maximum litterfall [42], whereas in recent studies, October [43] or November [36] showed the highest peak. The contemporary examples are consistent with our studies. This might be an indicator of a seasonal shift in litterfall that could potentially be being induced by climate variability and change [5,17]. However, this issue requires further research, which is not within the scope of this study, and here it is only being mentioned. Martínez-Alonso et al. [37] also found that more detailed studies of litterfall are needed for better forest management in the era of ongoing climate change.
4.2. Chemistry of Litterfall
Amongst the elements returning to topsoil in litterfall, C has the highest amount, reaching 100 times that of other elements, as it is the basic ingredient of all organic compounds in plants and constitutes about half the mass of litterfall. Liski et al. [44] report in their research that litterfall in western European forest was the greatest source of soil carbon, providing about 70–80% of the total. Furthermore, according to our studies, the amounts of N and Ca returned in litterfall were the highest after that of C. A similar composition of these two elements was reported by similar investigations [23,45,46]. Further, the amounts of K and Mg returned in litterfall were the highest after those of Ca and N, and the least returned to the topsoil with litterfall were Mn, P, Fe and Al (Table 4). Litterfall is a main pathway for N, P, Ca, Mg, Mn and Fe to the forest floor, but for K the main pathway to the forest floor is leaching by the throughfall [47].
According our studies, each category of litterfall has a different chemical composition. The proportions of particular categories of litterfall in total litterfall regulate the litter chemistry and subsequent litter decomposition and the soil-forming process more than other factors, e.g., climate [48]. Most C is returned to the soil with the category of litterfall with the greatest mass, i.e., needles. However, this relationship (i.e., that the highest mass of an element returns with the category of the greatest mass) does not hold for all elements. According our studies, despite the fact that the residue is a much smaller part of the mass of the total litterfall than the needles, it returns to the topsoil a comparable amount of elements such as N, P, K and Al as do needles, and Fe returns much more to the soil from residue than from needles. Ukonmaanaho et al. [23] found that Fe was the only element with a higher concentration in the residue category than in needles. They found this regularity despite the fact that they studied cones, bark, branches and residue jointly, and treated these categories as one laboratory sample.
However, the chemical composition in particular categories of pine litterfall is not constant, and shows seasonal variation, which was stated not only in our findings (Table 2 and Table 3), but also in other studies [19,38]. In a temperate climate in the northern hemisphere, mobile nutrients (i.e., N, P, K and Mg) are retranslocated from senescing needles (in autumn, before their falling) to remaining needles and other tree structures for overwinter storage [19,38]. Then, they are used for physiological processes, or to form new plant structures [12,19], so the elements are not lost. About 60–90% of N, P and K contents are retranslocated from senescing needles before falling [19]. This is perceived by some authors as a sign of adaptation to habitats with poor nutrient supply [49]. However, other researchers report that retranslocation is not determined by soil nutrient availability, but the growth rate of trees is the main factor controlling the process [50]. Retranslocation may also occur in young needles during intensive growth [51]. About 17–42% of the annual requirements of N, P and K for the production of above-ground tree biomass are provided by retranslocation [1]. Regarding Mg, it should be noted that it is an element necessary for the proper functioning of chlorophyll and it has an important function in photosynthesis [52]. The lowest content of Mg in winter needles identified in our study might be associated with the weakest rate of photosynthesis occurring in this season. Immobile or poorly mobile nutrients (C, Mn, Ca, Fe and Al) are steadily accumulated in the tissues [19,38]. According to our studies, in the case of Fe and Al, significant differences between seasons occur in bark, twigs and residue, and this may be due to which parts of the twigs and bark (more or less woody) are falling.
The uniformity of most nutrients between the investigated aspects (slope N vs. slope S) might be due to the uniform stand on both slopes and to the same forest management activities. In our study, the content of Mn is higher in categories of litterfall on slope N than slope S. In line with our findings, Ukonmaanaho et al. [23] showed that Mn concentrations increased northwards. However, some environmental factors that do not matter in our research were relevant in ecosystems investigated by Ukonmaanaho et al. [23]. Previous research at the current study area showed that the process of podzolization is stronger on the north- than the south-facing slope [27]. Additionally, the litter decomposition process is faster on slope N than slope S [29], and the release of manganese from decomposing material is faster on slope N [29], so the circulation of this element could also be faster on slope N. The larger contents of Mn in categories of litterfall on slope N could be related to the availability of Mn in the soil of that stand, and to trees thus consuming more Mn and litterfall returning more of this element to the soil [45]. It may also be related to the production and activity of manganese peroxidase, which is a lignin-degrading enzyme involved in decomposition process [53,54], whose production could be higher on slope N. This issue, however, requires further research.
5. Conclusions and Management Implication
Our study showed the detailed characteristics of pine litterfall on inland dunes regarding litterfall categories, seasons as well as slope aspect, which thus far have not been reported. We discovered that even the litterfall categories of relatively low mass are important for the total return of nutrients to topsoil (and subsequently for the whole nutrient turnover). This importance is greater than would result from their mass. Despite the fact that the residue is a much smaller part of the mass of the total litterfall than the needles, it returns to the topsoil a comparable number of elements. In turn, the effect of slope aspect on characteristics of litterfall was negligible in this study, which likely could be explained by the unification influence of forest management treatments on forest ecosystem.
Following the fact that the lowest contents of nutrients were found in litterfall in autumn, it could be presumed that cuttings executed in the season due to forest management could be postponed for winter months. Then, contents of nutrients in needles which are usually left on the ground after the cuts are higher than in autumn, and consequently it can be presumed that the elimination of nutrients from forest ecosystem with timber removal could be decreased. This idea would be especially relevant to poor ecosystems such as inland dunes; the nutritional state of a forest site is only one of the premises which should be considered when the term of cuttings in forest stands are planned. However, in an era of ongoing climate change, research into the impact of climate change on the mass, seasonal dynamics and chemical properties of litterfall is needed. This type of research would be helpful in sustainable forest management.
Author Contributions
Conceptualization and design, J.J. and P.S.; methodology and investigation, J.J. and P.S.; writing—original draft preparation, J.J., P.S. and R.P.; supervision, P.S and R.P. All authors have read and agreed to the published version of the manuscript.
Funding
This study was supported by the Polish Ministry of Science and Higher Education (grant number N N305 304840), and the Polish National Science Centre (project number 2016/23/B/ST10/01067).
Acknowledgments
We are grateful to Adam Michalski and Michał Dąbrowski for their help in laboratory work and Tim Brombley for improving our English.
Conflicts of Interest
The authors declare no conflict of interest. The funders had no role in the design of the study; in the collection, analyses, or interpretation of data; in the writing of the manuscript, or in the decision to publish the results.
References
- Helmisaari, H.S. Nutrient cycling in Pinus sylvestris stands in eastern Finland. Plant Soil 1995, 168–169, 327–336. [Google Scholar] [CrossRef]
- Swift, M..; Heal, O.; Anderson, J.M. Decomposition in Terrestrial Ecosystems; University of California Press: Berkeley, CA, USA, 1979. [Google Scholar]
- Berg, B.; McClaugherty, C. Plant litter. Decomposition, Humus Formation, Carbon Sequestration; Springer: Berlin/Heideberg, Germany, 2008. [Google Scholar]
- Nilsson, L.; Htittl, R.F.; Johansson, U.T.; Jochheim, H. Nutrient uptake and cycling in forest ecosystems-present status and future research directions. Plant Soil 1995, 168/169, 5–13. [Google Scholar]
- Berg, B.; Meentemeyer, V. Litter fall in some European coniferous forests as dependent on climate: A synthesis. Can. J. For. Res. 2001, 31, 292–301. [Google Scholar] [CrossRef]
- Stone, E. Effects of species on nutrient cycles and soil changes. Philos. Trans. R. Soc. B. Biol. Sci. 1975, 271, 149–162. [Google Scholar]
- Alban, D.H.; Perala, D.A. Carbon storage in Lake States aspen ecosystems. Can. J. For. Res. 1992, 22, 1107–1110. [Google Scholar] [CrossRef]
- Pedersen, L.B.; Bille-Hansen, J. A comparison of litterfall and element fluxes in even aged Norway spruce, sitka spruce and beech stands in Denmark. For. Ecol. Manag. 1999, 114, 55–70. [Google Scholar] [CrossRef]
- Cuevas, E.; Lugo, A.E. Dynamics of organic matter and nutrient return from litterfall in stands of ten tropical tree plantation species. For. Ecol. Manage. 1998, 112, 263–279. [Google Scholar] [CrossRef] [Green Version]
- Singh, K.P.; Singh, P.K.; Tripathi, S.K. Litterfall, litter decomposition and nutrient release patterns in four native tree species raised on coal mine spoil at Singrauli, India. Biol. Fertil. Soils 1999, 29, 371–378. [Google Scholar] [CrossRef]
- Bray, J.R.; Gorham, E. Litter Production in Forests of the World. Adv. Ecol. Res. 1964, 2, 100–157. [Google Scholar]
- González-Rodríguez, H.; Ramírez-Lozano, R.G.; Cantú-Silva, I.; Gómez-Meza, M.V.; Estrada-Castillón, E.; Arévalo, J.R. Deposition of litter and nutrients in leaves and twigs in different plant communities of northeastern Mexico. J. For. Res. 2018, 29, 1307–1314. [Google Scholar] [CrossRef]
- Zhou, G.; Guan, L.; Wei, X.; Zhang, D.; Zhang, Q.; Yan, J.; Wen, D.; Liu, J.; Liu, S.; Huang, Z.; et al. Litterfall production along successional and altitudinal gradients of subtropical monsoon evergreen broadleaved forests in Guangdong, China. Plant Ecol. 2007, 188, 77–89. [Google Scholar] [CrossRef]
- Ovington, J.D. The Circulation of Minerals in Plantations of Pinus sylvestris L. Ann. Bot. 1959, 23, 229–239. [Google Scholar] [CrossRef]
- Hennessey, T.C.; Dougherty, P.M.; Cregg, B.M.; Wittwer, R.F. Annual variation in needle fall of a loblolly pine stand in relation to climate and stand density. For. Ecol. Manage. 1992, 51, 329–338. [Google Scholar] [CrossRef]
- Krynytska, O.; Bondarenko, T.; Capuliak, J.; Trenciansky, M. Quantitative analysis of litter-fall in hornbeam-oak-pine stands in the Lviv Roztoche region. Cent. Eur. For. J. 2017, 63, 35–41. [Google Scholar] [CrossRef]
- Kouki, J.; Hokkanen, T. Long-term needle litterfall of a Scots pine Pinus sylvestris stand: relation to temperature factors. Oecologia 1992, 89, 176–181. [Google Scholar] [CrossRef] [PubMed]
- Gholz, H.; Perry, C.; Cropper, W.; Hendry, L. Litterfall, Decomposition, and Nitrogen and Phosphorus Dynamics in a Chronosequence of Slash Pine (Pinus elliottii) Plantations. For. Sci. 1985, 31, 463–478. [Google Scholar]
- Helmisaari, H.S. Temporal variation in nutrient concentrations of pinus sylvestris needles. Scand. J. For. Res. 1990, 5, 177–193. [Google Scholar] [CrossRef]
- Odiwe, A.I.; Muoghalu, J.I. Litterfall dynamics and forest floor litter as influenced by fire in a secondary lowland rain forest in Nigeria. Trop. Ecol. 2003, 44, 241–249. [Google Scholar]
- Grace, J.R. The influence of gypsy moth on the composition and nutrient content of litter fall in a Pennsylvania oak forest. For. Sci. 1986, 32, 855–870. [Google Scholar]
- Berg, B.; Albrektson, A.; Berg, M.P.; Cortina, J.; Johansson, M.-B.; Gallardo, A.; Madeira, M.; Pausas, J.; Kratz, W.; Vallejo, R.; et al. Amounts of litter fall in some pine forests in a European transect, in particular Scots pine. Ann. For. Sci. 1999, 56, 625–639. [Google Scholar] [CrossRef]
- Ukonmaanaho, L.; Merilä, P.; Nöjd, P.; Nieminen, T.M. Litterfall production and nutrient return to the forest floor in Scots pine and Norway spruce stands in Finland. Boreal Environ. Res. 2008, 13, 67–91. [Google Scholar]
- Zeeberg, J.J. The European sand belt in eastern Europe-and comparison of Late Glacial dune orientation with GCM simulation results. Boreas 1998, 27, 127–139. [Google Scholar] [CrossRef]
- Zhu, J.; Tan, H.; Kang, H.; Xu, M. Comparison of foliar nutrient concentrations between natural and artificial forests of Pinus sylvestris var. mongolica on sandy land, China. J. For. Res. 2003, 17, 177–184. [Google Scholar] [CrossRef]
- Forman, S.L.; Oglesby, R.; Webb, R.S. Temporal and spatial patterns of Holocene dune activity on the Great Plains of North America: Megadroughts and climate links. Glob. Planet. Chang 2001, 29, 1–29. [Google Scholar] [CrossRef]
- Sewerniak, P.; Jankowski, M.; Dąbrowski, M. Effect of topography and deforestation on regular variation of soils on inland dunes in the Toruń Basin (N Poland). Catena 2017, 149, 318–330. [Google Scholar] [CrossRef]
- Sewerniak, P.; Jasińska, J.; Golińska, P.; Składanowski, M. Rate of mineralization of needles in Scots pine stand in relations to site and microbiological conditions occurring on dune slopes of contrasting aspects. Sylwan 2015, 159, 839–847. [Google Scholar]
- Jasińska, J.; Sewerniak, P.; Markiewicz, M. Links between slope aspect and rate of litter decomposition on inland dunes. Catena 2019, 172, 501–508. [Google Scholar] [CrossRef]
- Wójcik, G.; Marciniak, K. Klimat. In Toruń i jego okolice, UMK; Andrzejewski, L., Weckwerth, P., Burak, S., Eds.; Wydawnictwo UMK: Toruń, Poland, 2006; pp. 99–128. [Google Scholar]
- Chojnacka, J.; Cyzman, W.; Nienartowicz, A.; Deptuła, M. Variability of the structure and directions in the development of heaths and psammophilous grasslands within the artillery range near the city of Toruń. Ecol. Quest. 2010, 12, 89–129. [Google Scholar]
- Sewerniak, P.; Bednarek, R.; Szymańska, A. Preliminary studies on the influence of dune-slope exposure on a pine forest ecosystem in the Toruń Basin. For. Res. Pap. 2011, 72, 37–46. [Google Scholar] [CrossRef]
- Anderson, J.M.; Ingram, J.S.I. Tropical soil biology and fertility: A handbook of methods, Second edition. Soil Sci. 1994, 157, 256. [Google Scholar] [CrossRef]
- Bednarek, R. Analiza podstawowych właściwości gleb. In Badania ekologiczno-gleboznawcze.; Bednarek, R., Dziadowiec, H., Pokojska, U., Prusinkiewicz, Z., Eds.; PWN: Warszawa, Poland, 2004; pp. 100–107. [Google Scholar]
- Sapek, A. Metody analizy chemicznej roślinności łąkowej, gleby i wody.; Instytut Melioracji i Użytków Zielonych: Falenty, Poland, 1979. [Google Scholar]
- Astel, A.; Parzych, A.; Trojanowski, J. Comparison of litterfall and nutrient return in a Vaccinio uliginosi-Betuletum pubescentis and an Empetro nigri-Pinetum forest ecosystem in northern Poland. For. Ecol. Manag. 2009, 257, 2331–2341. [Google Scholar] [CrossRef]
- Martínez-Alonso, C.; Valladares, F.; Camarero, J.J.; Arias, M.L.; Serrano, M.; Rodríguez, y.J.A. The uncoupling of secondary growth, cone and litter production by intradecadal climatic variability in a mediterranean scots pine forest. For. Ecol. Manag. 2007, 253, 19–29. [Google Scholar] [CrossRef]
- Finér, L. Variation in the amount and quality of litterfall in a Pinus sylvestris L. stand growing on a bog. For. Ecol. Manage. 1996, 80, 1–11. [Google Scholar] [CrossRef]
- Pausas, J.G. Litter fall and litter decomposition in Pinus sylvestris forests of the eastern Pyrenees. J. Veg. Sci. 1997, 8, 643–650. [Google Scholar] [CrossRef] [Green Version]
- Egunjobi, J.; Onweluzo, B. Litter Fall, Mineral Turnover and Litter Accumulation in Pinus caribaea L. Stands at Ibadan, Nigeria. Biotropica 1997, 11, 251–261. [Google Scholar] [CrossRef]
- Xu, X.N.; Hirata, E. Forest floor mass and litterfall in Pinus luchuensis plantations with and without broad-leaved trees. For. Ecol. Manag. 2002, 157, 165–173. [Google Scholar] [CrossRef]
- Prusinkiewicz, Z.; Dziadowiec, H.; Jakubusek, M. Zwrot do gleby pierwiastków–biogenów z opadem roślinnym w lesie liściastym i mieszanym na luźnych glebach piaskowych. Rocz. Glebozn. 1974, 25, 237–245. [Google Scholar]
- Jonczak, J. Structure, dynamics and properties of litterfall in a 110−year−old beech stand with admixture of pine and spruce. Sylwan 2011, 155, 760–768. [Google Scholar]
- Liski, J.; Perruchoud, D.; Karjalainen, T. Increasing carbon stocks in the forest soils of western Europe. For. Ecol. Manag. 2002, 169, 159–175. [Google Scholar] [CrossRef]
- Rapp, M.; Santa Regina, I.; Rico, M.; Gallego, H.A. Biomass, nutrient content, litterfall and nutrient return to the soil in Mediterranean oak forests. For. Ecol. Manag. 1999, 119, 39–49. [Google Scholar] [CrossRef]
- Edmonds, R.L.; Murray, G.L.D. Overstory litter inputs and nutrient returns in an old-growth temperate forest ecosystem, Olympic National Park, Washington. Can. J. For. Res. 2002, 32, 742–750. [Google Scholar] [CrossRef]
- Ukonmaanaho, L.; Starr, M. The importance of leaching from litter collected in litterfall traps. Environ. Monit. Assess. 2001, 66, 129–146. [Google Scholar] [CrossRef]
- Li, X.; Hu, Y.; Han, S.; Liu, Y.; Zhang, Y. Litterfall and litter chemistry change over time in an old-growth temperate forest, northeastern China. Ann. For. Sci. 2010, 67, 1–8. [Google Scholar] [CrossRef] [Green Version]
- Miller, H.G.; Cooper, J.M.; Miller, J.D.; Pauline, O.J.L. Nutrient cycles in pine and their adaptation to poor soils. Can. J. For. Res. 1979. [Google Scholar] [CrossRef]
- Nambiar, E.; Fife, D. Growth and Nutrient Retranslocation in Needles of Radiata Pine in Relation to Nitrogen Supply. Ann. Bot. 1987, 60, 147–156. [Google Scholar] [CrossRef]
- Fife, D.; Nambiar, E. Accumulation and Retranslocation of Mineral Nutrients in Developing Needles in Relation to Seasonal Growth of Young Radiata Pine Trees. Ann. Bot. 1982, 50, 817–829. [Google Scholar] [CrossRef]
- Clarkson, D.; Hanson, J. The mineral nutrition of higher plants. Annu. Rev. Plant Physiol. 1980, 31, 239–298. [Google Scholar] [CrossRef]
- Perez, J.; Jeffries, T.W. Roles of Manganese and Organic Acid Chelators in Regulating Lignin Degradation and Biosynthesis of Peroxidases by Phanerochaete chrysosporium. Appl. Environ. Microbiol. 1992, 58, 2402–2409. [Google Scholar] [CrossRef] [Green Version]
- Berg, B.; Erhagen, B.; Johansson, M.B.; Nilsson, M.; Stendahl, J.; Trum, F.; Vesterdal, L. Manganese in the litter fall-forest floor continuum of boreal and temperate pine and spruce forest ecosystems - A review. For. Ecol. Manag. 2015, 358, 248–260. [Google Scholar] [CrossRef]
Figure 1.
Averaged annual dynamics of total litterfall mass on slopes N and S (averaged for the three study years).
Figure 1.
Averaged annual dynamics of total litterfall mass on slopes N and S (averaged for the three study years).

Figure 2.
Averaged annual dynamics of mass of the investigated litterfall categories on slopes N and S (averaged for the three study years).
Figure 2.
Averaged annual dynamics of mass of the investigated litterfall categories on slopes N and S (averaged for the three study years).

Figure 3.
Return of elements to soil with particular categories of litterfall on slopes N and S.


Table 1.
Mean mass (±SE) of the total annual litterfall and mass of the studied categories of litterfall (g m−2 year−1) on slopes N and S (averaged for the three study years).
Table 1.
Mean mass (±SE) of the total annual litterfall and mass of the studied categories of litterfall (g m−2 year−1) on slopes N and S (averaged for the three study years).
| Category | N | S |
|---|---|---|
| Needles | 169.7 ± 7.2 | 183.3 ± 17.7 |
| Twigs | 19.0 ± 3.6 | 20.7 ± 4.7 |
| Bark | 42.0 ± 4.2 | 48.4 ± 7.3 |
| Cones | 31.8 ± 10.5 | 43.7 ± 7.2 |
| Residue | 59.5 ± 8.3 | 65.8 ± 12.4 |
| Total | 322.0 ± 2.6 | 361.9 ± 34.2 |
Table 2.
Mean contents (±SE) of elements in the litterfall categories by season (g kg−1) on slope N. p-values were obtained after the Kruskal–Wallis test: values in rows refer to differences in content of an element between litterfall categories in a season; values in the last column refer to differences in content of an element between seasons in a litterfall category (only values of p < 0.05 were shown); lower cases at the SE values refer to rows (different letters indicate the difference in the element content between seasons), while capital letters at the SE values refer to columns (different letters indicate the difference in the element content between litterfall categories).
| Category | Season | p-Value | |||
|---|---|---|---|---|---|
| Winter | Spring | Summer | Autumn | ||
| Carbon | |||||
| Needles | 550 ± 3 aA | 548 ± 5 aA | 544 ± 6 aA | 553 ± 5 aA | |
| Twigs | 540 ± 5 aA | 533 ± 9 aA | 512 ± 5 aA | 519 ± 8 aAB | |
| Bark | 512 ± 2 aA | 509 ± 2 aA | 503 ± 6 aA | 508 ± 3 aB | |
| Cones | 562 ± 33 aA | 510 ± 12 aA | 527 ± 7 aA | 528 ± 5 aAB | |
| Residue | 537 ± 12 aA | 526 ± 16 aA | 531 ± 9 aA | 534 ± 7 aAB | |
| p-value | 0.05 | ||||
| Nitrogen | |||||
| Needles | 7.67 ± 0.32abAB | 9.65 ± 0.41 aAB | 7.82 ± 0.34 abAB | 5.01 ± 0.28 bAB | 0.04 |
| Twigs | 8.78 ± 0.49 aAB | 8.33 ± 0.35 aAB | 6.65 ± 0.67 aAB | 9.18 ± 0.69 aAB | |
| Bark | 3.98 ± 0.62 aA | 4.21 ± 0.20 aA | 3.91 ± 0.35 aA | 3.66 ± 0.09 aA | |
| Cones | 10.6 ± 1.1 aAB | 6.79 ± 1.00 aAB | 6.41 ± 1.20 aAB | 7.67 ± 1.03 aAB | |
| Residue | 16.9 ± 0.7 aB | 18.2 ± 1.2 aB | 12.5 ± 0.5 aB | 15.6 ± 1.0 aB | |
| p-value | 0.01 | <0.01 | <0.01 | 0.02 | |
| Phosphorus | |||||
| Needles | 0.45 ± 0.05 aA | 0.47 ± 0.08 aAB | 0.51 ± 0.05 aA | 0.29 ± 0.04 aAB | |
| Twigs | 0.46 ± 0.09 aA | 0.40 ± 0.02 aAB | 0.27 ± 0.08 aA | 0.33 ± 0.05 aAB | |
| Bark | 0.26 ± 0.05 aA | 0.12 ± 0.03 aA | 0.19 ± 0.05 aA | 0.16 ± 0.03 aA | |
| Cones | 0.56 ± 0.10 aA | 0.44 ± 0.05 aAB | 0.30 ± 0.07 aA | 0.37 ± 0.09 aAB | |
| Residue | 1.33 ± 0.18 aA | 1.59 ± 0.08 aB | 0.94 ± 0.08 aA | 1.26 ± 0.20 aB | |
| p-value | <0.01 | <0.01 | |||
| Potassium | |||||
| Needles | 1.24 ± 0.02 aAB | 1.83 ± 0.05 aAB | 2.50 ± 0.37 aA | 1.29 ± 0.12 aAB | 0.04 |
| Twigs | 1.06 ± 0.17 aAB | 0.77 ± 0.09 aAB | 1.01 ± 0.09 aA | 1.09 ± 0.11 aAB | |
| Bark | 0.52 ± 0.07 aA | 0.40 ± 0.02 aA | 0.50 ± 0.07 aA | 0.54 ± 0.05 aA | |
| Cones | 1.51 ± 0.59 aAB | 3.15 ± 1.00 aAB | 2.22 ± 0.23 aA | 1.72 ± 0.35 aAB | |
| Residue | 3.85 ± 1.30 aB | 2.79 ± 0.30 aB | 1.96 ± 0.13 aA | 3.50 ± 0.91 aB | |
| p-value | <0.01 | <0.01 | - | <0.01 | |
| Calcium | |||||
| Needles | 6.13 ± 0.56 aAB | 5.24 ± 0.28 aAB | 5.09 ± 0.41 aAB | 6.15 ± 0.49 aAB | |
| Twigs | 5.95 ± 0.09 aAB | 5.40 ± 0.38 aAB | 5.70 ± 0.54 aAB | 6.31 ± 0.44 aAB | |
| Bark | 7.73 ± 0.60 aA | 8.31 ± 0.57 aA | 8.54 ± 0.53 aA | 8.38 ± 0.30 aA | |
| Cones | 1.42 ± 0.62 aB | 0.75 ± 0.14 aB | 0.59 ± 0.05 aB | 0.77 ± 0.11 aB | |
| Residue | 5.23 ± 1.00 aAB | 5.95 ± 1.32 aAB | 5.40 ± 0.84 aAB | 4.68 ± 0.81 aAB | |
| p-value | 0.04 | <0.01 | <0.01 | <0.01 | |
| Magnesium | |||||
| Needles | 0.65 ± 0.07 aA | 1.02 ± 0.18 aA | 1.34 ± 0.09 aAB | 1.05 ± 0.10 aAB | |
| Twigs | 0.70 ± 0.11 aA | 0.64 ± 0.06 aA | 1.02 ± 0.12 aAB | 1.26 ± 0.08 aAB | |
| Bark | 0.35 ± 0.15 aA | 0.24 ± 0.02 aA | 0.27 ± 0.03 aA | 0.34 ± 0.03 aA | |
| Cones | 0.52 ± 0.03 aA | 0.78 ± 0.22 aA | 0.94 ± 0.12 aAB | 1.12 ± 0.12 aAB | |
| Residue | 1.34 ± 0.47 aA | 1.54 ± 0.30 aA | 1.37 ± 0.18 aB | 1.14 ± 0.08 aB | |
| p-value | <0.01 | 0.01 | |||
| Manganese | |||||
| Needles | 0.74 ± 0.03 aA | 0.68 ± 0.03 aA | 0.79 ± 0.07 aA | 0.70 ± 0.05 aA | |
| Twigs | 0.22 ± 0.02 aAB | 0.19 ± 0.02 aAB | 0.23 ± 0.03 aAB | 0.25 ± 0.02 aAB | |
| Bark | 0.17 ± 0.03 aAB | 0.15 ± 0.01 aAB | 0.15 ± 0.01 aAB | 0.19 ± 0.02 aAB | |
| Cones | 0.08 ± 0.01 aB | 0.08 ± 0.02 aB | 0.07 ± 0.01 aB | 0.09 ± 0.01 aB | |
| Residue | 0.48 ± 0.17 aAB | 0.27 ± 0.02 aAB | 0.32 ± 0.05 aAB | 0.43 ± 0.14 aAB | |
| p-value | 0.01 | <0.01 | <0.01 | <0.01 | |
| Iron | |||||
| Needles | 0.17 ± 0.02 aAB | 0.17 ± 0.04 aAB | 0.18 ± 0.05 aAB | 0.12 ± 0.00 aAB | |
| Twigs | 0.47 ± 0.07 aAB | 0.54 ± 0.08 aAB | 0.35 ± 0.04 aAB | 0.54 ± 0.04 aAB | |
| Bark | 0.47 ± 0.09 aAB | 0.34 ± 0.03 aAB | 0.20 ± 0.02 aAB | 0.21 ± 0.01 aAB | 0.04 |
| Cones | 0.15 ± 0.02 aA | 0.36 ± 0.27 aA | 0.11 ± 0.02 aA | 0.10 ± 0.02 aA | |
| Residue | 1.06 ± 0.22 aB | 1.74 ± 0.31 aB | 0.60 ± 0.05 aB | 0.73 ± 0.04 aB | |
| p-value | <0.01 | <0.01 | <0.01 | <0.01 | |
| Aluminum | |||||
| Needles | 0.35 ± 0.01 aAB | 0.36 ± 0.01 aA | 0.36 ± 0.04 aAB | 0.32 ± 0.02 aAB | |
| Twigs | 0.77 ± 0.05 aAB | 0.84 ± 0.07 aAB | 0.59 ± 0.02 aAB | 0.82 ± 0.06 aAB | |
| Bark | 0.77 ± 0.13 aAB | 0.61 ± 0.01 aAB | 0.46 ± 0.02 aAB | 0.48 ± 0.06 aAB | |
| Cones | 0.40 ± 0.08 aA | 0.36 ± 0.07 aA | 0.27 ± 0.04 aA | 0.22 ± 0.04 aA | |
| Residue | 1.66 ± 0.16 aB | 1.77 ± 0.16 aB | 0.76 ± 0.08 aB | 1.05 ± 0.07 aB | 0.03 |
| p-value | <0.01 | <0.01 | <0.01 | <0.01 | |
Table 3.
Mean contents (±SE) of elements in the litterfall categories by seasons (g kg−1) on slope S. p-values were obtained after the Kruskal–Wallis test: values in rows refer to differences in content of an element between litterfall categories in a season; values in the last column refer to differences in content of an element between seasons in a litterfall category (only values of p < 0.05 were shown); lower cases at the SE values refer to rows (different letters indicate the difference in the element content between seasons), while capital letters at the SE values refer to columns (different letters indicate the difference in the element content between litterfall categories).
| Category | Season | p-Value | |||
|---|---|---|---|---|---|
| Winter | Spring | Summer | Autumn | ||
| Carbon | |||||
| Needles | 547 ± 3 aA | 547 ± 3 aA | 546 ± 7 aA | 561 ± 4 aA | |
| Twigs | 547 ± 2 aA | 545 ± 10 aA | 524 ± 10 aA | 517 ± 9 aA | |
| Bark | 508 ± 6 aA | 510 ± 5 aA | 510 ± 3 aA | 507 ± 6 aA | |
| Cones | 552 ± 29 aA | 526 ± 4 aA | 506 ± 8 aA | 538 ± 7 aA | |
| Residue | 555 ± 1 aA | 527 ± 14 aA | 519 ± 5 aA | 527 ± 8 aA | |
| p-value | |||||
| Nitrogen | |||||
| Needles | 6.79 ± 0.35a bAB | 8.86 ± 0.31 aAB | 7.82 ± 0.54a bAB | 4.60 ± 0.20 bAB | 0.03 |
| Twigs | 7.62 ± 0.16 aAB | 8.20 ± 0.45 aAB | 7.00 ± 0.14 aAB | 7.84 ± 0.76 aAB | |
| Bark | 4.51 ± 0.34 aA | 4.00 ± 0.42 aA | 3.25 ± 0.34 aA | 3.59 ± 0.33 aA | |
| Cones | 8.69 ± 2.57 aAB | 4.73 ± 0.63 aA | 4.46 ± 0.85 aAB | 7.50 ± 0.62 aAB | |
| Residue | 14.9 ± 1.0 aB | 16.7 ± 0.6 aB | 12.2 ± 0.9 aB | 15.5 ± 0.9 aB | |
| p-value | <0.01 | <0.01 | <0.01 | <0.01 | |
| Phosphorus | |||||
| Needles | 0.30 ± 0.04 aA | 0.55 ± 0.05 aAB | 0.47 ± 0.06 aAB | 0.25 ± 0.03 aAB | |
| Twigs | 0.38 ± 0.07 aA | 0.39 ± 0.06 aAB | 0.32 ± 0.05 aAB | 0.34 ± 0.04 aAB | |
| Bark | 0.19 ± 0.03 aA | 0.16 ± 0.02 aA | 0.13 ± 0.03 aA | 0.17 ± 0.03 aA | |
| Cones | 0.57 ± 0.13 aA | 0.30 ± 0.05 aAB | 0.24 ± 0.06 aAB | 0.28 ± 0.08 aAB | |
| Residue | 0.99 ± 0.23 aA | 1.57 ± 0.05 aB | 0.86 ± 0.12 aB | 1.22 ± 0.20 aB | |
| p-value | <0.01 | 0.02 | <0.01 | ||
| Potassium | |||||
| Needles | 1.11 ± 0.10 aA | 1.95 ± 0.08 aAB | 2.39 ± 0.33 aAB | 1.42 ± 0.16 aAB | 0.05 |
| Twigs | 0.87 ± 0.04 aA | 0.88 ± 0.02 aAB | 1.05 ± 0.06 aAB | 1.53 ± 0.37 aAB | |
| Bark | 0.46 ± 0.02 aA | 0.42 ± 0.04 aA | 0.48 ± 0.03 aA | 0.53 ± 0.01 aA | |
| Cones | 1.21 ± 0.04 aA | 1.30 ± 0.10 aAB | 1.65 ± 0.19 aAB | 1.71 ± 0.16 aAB | |
| Residue | 3.37 ± 0.96 aA | 2.99 ± 0.49 aB | 3.03 ± 0.83 aB | 4.38 ± 1.59 aB | |
| p-value | - | <0.01 | <0.01 | <0.01 | |
| Calcium | |||||
| Needles | 5.90 ± 0.23 aAB | 5.47 ± 0.11 aAB | 5.54 ± 0.17 aAB | 6.20 ± 0.08 aAB | |
| Twigs | 6.30 ± 0.49 aAB | 6.49 ± 0.55 aAB | 6.22 ± 0.26 aAB | 6.75 ± 0.57 aAB | |
| Bark | 9.76 ± 0.32 aA | 8.14 ± 0.51 aA | 9.22 ± 0.28 aA | 8.37 ± 0.51 aA | |
| Cones | 1.17 ± 0.35 aB | 1.13 ± 0.22 aB | 0.42 ± 0.04 aB | 0.56 ± 0.05 aB | |
| Residue | 5.74 ± 1.03 aAB | 5.51 ± 1.18 aAB | 4.62 ± 0.23 aAB | 5.00 ± 0.71 aAB | |
| p-value | <0.01 | <0.01 | <0.01 | <0.01 | |
| Magnesium | |||||
| Needles | 0.68 ± 0.09 aA | 1.38 ± 0.31 aA | 1.46 ± 0.10 aA | 1.06 ± 0.09 aAB | |
| Twigs | 0.85 ± 0.15 aA | 0.87 ± 0.22 aA | 1.24 ± 0.15 aA | 1.20 ± 0.17 aAB | |
| Bark | 0.32 ± 0.07 aA | 0.23 ± 0.02 aA | 0.28 ± 0.01 aA | 0.36 ± 0.00 aA | |
| Cones | 0.50 ± 0.08 aA | 0.75 ± 0.24 aA | 0.69 ± 0.05 aA | 0.96 ± 0.11 aAB | |
| Residue | 1.10 ± 0.36 aA | 1.57 ± 0.40 aA | 1.28 ± 0.17 aA | 1.45 ± 0.02 aB | |
| p-value | <0.01 | ||||
| Manganese | |||||
| Needles | 0.52 ± 0.02 aA | 0.50 ± 0.01 aA | 0.57 ± 0.04 aA | 0.62 ± 0.00 aA | |
| Twigs | 0.16 ± 0.01 aAB | 0.17 ± 0.01 aA | 0.18 ± 0.01 aAB | 0.19 ± 0.01 aAB | |
| Bark | 0.13 ± 0.01 aAB | 0.11 ± 0.01 aA | 0.13 ± 0.01 aAB | 0.15 ± 0.01 aAB | |
| Cones | 0.05 ± 0.00 aB | 0.11 ± 0.06 aA | 0.04 ± 0.00 aB | 0.06 ± 0.00 aB | |
| Residue | 0.40 ± 0.15 aAB | 0.21 ± 0.03 aA | 0.25 ± 0.05 aAB | 0.34 ± 0.10 aAB | |
| p-value | 0.02 | <0.01 | <0.01 | ||
| Iron | |||||
| Needles | 0.17 ± 0.01 aA | 0.19 ± 0.04 aA | 0.14 ± 0.01 aA | 0.13 ± 0.00 aA | |
| Twigs | 0.51 ± 0.07 aAB | 0.48 ± 0.02 aA | 0.41 ± 0.02 aAB | 0.48 ± 0.08 aAB | |
| Bark | 0.40 ± 0.04 aAB | 0.37 ± 0.05 aA | 0.21 ± 0.01 aAB | 0.21 ± 0.02 aAB | 0.04 |
| Cones | 0.12 ± 0.01 aB | 0.27 ± 0.13 aA | 0.10 ± 0.01 aB | 0.11 ± 0.02 aB | |
| Residue | 1.12 ± 0.31 aAB | 1.68 ± 0.23 aA | 0.62 ± 0.07 aAB | 0.84 ± 0.08 aAB | 0.01 |
| p-value | <0.01 | <0.01 | <0.01 | ||
| Aluminum | |||||
| Needles | 0.40 ± 0.02 aAB | 0.34 ± 0.03 aA | 0.32 ± 0.02 aAB | 0.35 ± 0.02 aAB | |
| Twigs | 0.82 ± 0.07 aAB | 0.78 ± 0.02 aAB | 0.62 ± 0.05 aAB | 0.73 ± 0.06 aAB | |
| Bark | 0.71 ± 0.05 aAB | 0.63 ± 0.01 aAB | 0.47 ± 0.03 aAB | 0.53 ± 0.06 aAB | <0.01 |
| Cones | 0.38 ± 0.05 aA | 0.62 ± 0.22 aAB | 0.22 ± 0.03 aA | 0.17 ± 0.04 aA | 0.05 |
| Residue | 1.56 ± 0.06abB | 1.81 ± 0.08 aB | 0.79 ± 0.11bB | 1.21 ± 0.10abB | 0.03 |
| p-value | <0.01 | <0.01 | <0.01 | <0.01 | |
Table 4.
Return of particular elements to a topsoil (g m−2 year−1) with total annual litterfall on slopes N and S.
Table 4.
Return of particular elements to a topsoil (g m−2 year−1) with total annual litterfall on slopes N and S.
| Slope | C | N | P | K | Mg | Ca | Mn | Fe | Al |
|---|---|---|---|---|---|---|---|---|---|
| N | 172 | 2.32 | 0.15 | 0.52 | 0.30 | 1.85 | 0.18 | 0.09 | 0.15 |
| S | 193 | 2.48 | 0.16 | 0.68 | 0.34 | 3.18 | 0.14 | 0.10 | 0.18 |
© 2020 by the authors. Licensee MDPI, Basel, Switzerland. This article is an open access article distributed under the terms and conditions of the Creative Commons Attribution (CC BY) license (http://creativecommons.org/licenses/by/4.0/).
Share and Cite
MDPI and ACS Style
Jasińska, J.; Sewerniak, P.; Puchałka, R. Litterfall in a Scots Pine Forest on Inland Dunes in Central Europe: Mass, Seasonal Dynamics and Chemistry. Forests 2020, 11, 678. https://doi.org/10.3390/f11060678
AMA Style
Jasińska J, Sewerniak P, Puchałka R. Litterfall in a Scots Pine Forest on Inland Dunes in Central Europe: Mass, Seasonal Dynamics and Chemistry. Forests. 2020; 11(6):678. https://doi.org/10.3390/f11060678
Chicago/Turabian StyleJasińska, Justyna, Piotr Sewerniak, and Radosław Puchałka. 2020. "Litterfall in a Scots Pine Forest on Inland Dunes in Central Europe: Mass, Seasonal Dynamics and Chemistry" Forests 11, no. 6: 678. https://doi.org/10.3390/f11060678
Note that from the first issue of 2016, this journal uses article numbers instead of page numbers. See further details here.