Responses of ozone concentrations to the synergistic control of NOx and VOCs emissions in the Chengdu metropolitan area
 Xiaohui Du1,2,3
  Wei Tang1* Zhongzhi Zhang1 Junhui Chen4 Li Han4 Yang Yu1 Yang Li1 Yingjie Li4 Hong Li1 Fahe Chai1 Fan Meng2
- 1Atmospheric Environment Institute, Chinese Research Academy of Environmental Sciences, Beijing, China
- 2State Key Laboratory of Environmental Criteria and Risk Assessment, Chinese Research Academy of Environmental Sciences, Beijing, China
- 3College of Water Sciences, Beijing Normal University, Beijing, China
- 4Sichuan Academy of Environmental Sciences, Chengdu, China
Simulations of 108 emission reduction scenarios for NOx and VOCs using Comprehensive Air Quality Model with Extensions (CAMx) were conducted for eight cities in the Chengdu metropolitan area (CMA). The isopleth diagrams were drawn to explore the responses and differences of ozone (O3) concentrations to NOx and VOCs emission changes under Chengdu, CMA and Sichuan Province emission reduction scenarios. The results show that the O3-sensitive regimes of eight cities may change under different emission reduction scenarios. Under Chengdu emission reduction scenario, the Chengdu city is in the transition regime and O3 formation will shift from transition to VOC-limited when the VOCs emissions decreased by 50%, and the decreases in O3 concentrations caused by VOCs emission reductions are small. For the CMA and Sichuan Province emission reduction scenarios, all cities are NOx-limited in the baseline cases and with at least a 66% and a 77% reduction in NOx emissions, respectively, the daily maximum 8-h average O3 (MDA8) can attain the O3 standard (160 μg m−3). Although reductions in VOCs emissions can also lessen the O3 concentration, the effectiveness is relatively small. The changes in O3 concentrations under different VOCs to NOx emission reduction ratios indicate that all cities achieve a relatively high O3 concentration decrement with low VOCs to NOx emission reduction ratios and that the decreasing O3 concentrations caused by non-local emission reductions are much higher than those achieved by local emission reductions. In addition, the decreases in O3 concentrations in Chengdu are quite close when the total NOx and VOCs emissions reduction percentages are less than 30% under the CMA and Sichuan emission reduction scenarios.
1 Introduction
High ozone (O3)concentrations threaten human health and shorten human life (Amann et al., 2008). The mechanism of O3 formation and destruction is very complex. O3 can be generated via a series of complex chemical reactions between nitrogen oxides (NOx) and volatile organic compounds (VOCs) under sunlight conditions (Haagen-Smit, 1952; Yu, 2019; Li et al., 2022). Therefore, it is useful to study the relationship between the changes of NOx and VOCs emissions and O3 pollution in oreder to develop mitigation strategies that effectively reduce O3 concentrations. The Chengdu metropolitan area (CMA) has become a large urban agglomeration in southwestern China due to its rapid industrial development and population growth (Yang et al., 2020), leading to a significant increase in air pollutant emissions and air pollution problems (Zhou et al., 2019). O3 concentrations in CMA have gradually increased from 2015 to 2019. The number of days when the daily maximum 8-h average O3 concentration (MDA8) in CMA exceeded the secondary standard of the Ambient Air Quality Standard (GB3095-2012) increased by 95 days, and the total number of exceeding days for 2019 reached 331 days in CMA. The number of days with excessive O3 concentrations in Chengdu accounted for 1/6 of the polluted days in 2019. Therefore, it is essential to control regional O3 pollution in the CMA region.
Studies show that when NOx emissions are at very high level, the reaction of NOx with OH radicals will inhibit the formation of O3. However, when VOCs emissions increase concurrently, O3 concentrations increase. At very high VOCs emissions, the rate of self-reaction of HO2 is much greater than its reaction with NO, and increasing NOx emissions will enhance O3 formations as well (Zhang, 2013; Itahashi et al., 2015, 2020; Kim et al., 2017; Wickham et al., 2019). This indicates that the relationships among O3-NOx-VOC need to be considered in conjunction with NOx and VOCs emission reductions to prevent O3 pollution. The ‘Ozone Pollution Prevention and Control Action Program’ implemented in 2017 in Chengdu demonstrated that scientific emission reduction ratio of VOCs to NOx could reduce the O3 concentration in Chengdu more effectively (Wu and Xie, 2017). Other studies conducted in different regions also revealed that appropriate VOCs to NOx ratios could enhance the reduction of O3 concentrations (Chen et al., 2019; He et al., 2019; Wang et al., 2019).
The response of O3 to NOx and VOCs emissions can be determined by setting different NOx and VOCs emissions abatement scenarios to simulate the changes in O3 concentrations, and the sensitivities of O3 to VOCs and NOx emissions can be explored by plotting empirical kinetic modeling approach (EKMA) curves based on various emission reduction scenarios (Qu et al., 2014; Ou et al., 2016; Tan et al., 2018; Cui et al., 2021; Jiang et al., 2021; Liu et al., 2021). Although the contributions from local emissions play an important role in O3 foramtion in CMA (Yang et al., 2020; Yang et al., 2021), studies investigating the separate effects of local and regional emissions on O3 concentrations in the CMA region have not been widely conducted.
In this study, 108 emission reduction scenarios for NOx and VOCs emissions, including 36 scenarios for the Chengdu city, 36 scenarios for the CMA region and 36 scenarios for Sichuan Province are conducted using the Comprehensive Air Quality Model with Extensions (CAMx) model, to explore the different effects of local and regional emissions on O3 concentrations and to develop a more refined O3 abatement policy for the Chengdu city. The effects of changes in NOx and VOCs emissions from different source regions on the O3 concentrations are compared and discussed. The results provide the scientific supports for developing O3 control measures at municipal and regional levels in the CMA region.
2 Method and material
2.1 Model description and settings
CAMx, version 7.1 (ENVIRON, 2020), is a third-generation three-dimensional (3D) air quality model and can be applied to multi-scale integrated simulation studies of photochemical smog and fine particulate matter in a 3D nested grid. It can provide several extensions, such as source apportionment techniques, sensitivity analysis, process analysis, etc. These extension modules have been widely used in China and abroad (Chatani et al., 2020; A. M. Dunker, 2015; Alan M. Dunker et al., 2015; Yarwood et al., 2013).
In this study, the horizontal resolution of the master grid is 36 × 36 km (Figure 1A), covering the whole China, Northeast Asia and some parts of Southeast Asia. The nested grid is 12 × 12 km, covering Sichuan Province and its surrounding areas (Figure 1B). The model is divided into 20 layers vertically. The Weather Research and Forecasting (WRF v3.9.1.1) model (Skamarock et al., 2019) is used to provide meteorological conditions, with the input data (6 h interval) from the National Centers for Environmental Prediction (NCEP) Final Analysis (FNL). The gas-phase chemical mechanism is SAPRC07 and the coarse/fine aerosol chemistry scheme is used for the aerosol chemistry mechanism. The photolysis rates used in the model are calculated using the O3 column concentrations from the Ozone Monitoring Instrument (OMI) data.
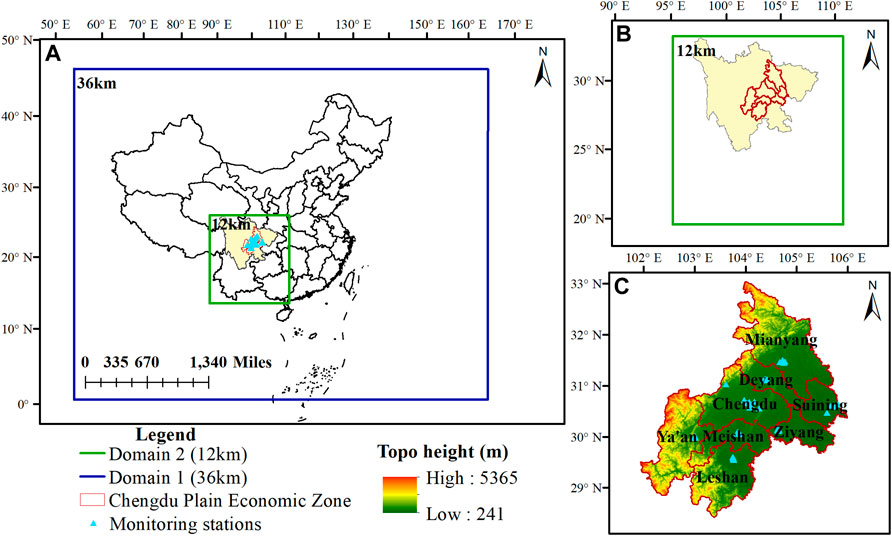
FIGURE 1. Modeling domains for (A) East Asia, (B) Sichuan and its surrounding area and (C) the CMA region. The blue triangles in (C) represent national air quality monitoring stations.
The emissions inventory for the master grid (36 km) is based on the Multi-resolution Emission Inventory for China (MEIC 2016, Li et al., 2017) and Regional Emission Inventory in Asia (REAS2.1, Kurokawa et al., 2013). The emission inventory used for the nest grid (12 km) is according to MEIC2016 and adjusted by the localized air pollutant emission inventory. VOCs emission is subdivided into 116 species using the VOCs species consolidation methods introduced by Carter. (2000), Li et al. (2014) and Carter and Heo. (2013) for allocation of VOCs species for the SAPRC07 mechanism. The biogenic emissions used in the simulations are generated by the Model of Emissions of Gases and Aerosols from Nature (MEGANv3.1; Guenther et al., 2019).
2.2 Simulation scenarios design
One baseline scenario and 108 emission reduction scenarios are designed in this study. Of the 108 scenarios, 36 are region-wide NOx and VOCs emissions reductions for Chengdu with emissions outside Chengdu remaining unchanged; 36 are region-wide emission reduction scenarios for eight cities in the CMA region (Chengdu, Deyang, Mianyang, Meishan, Leshan, Ziyang, Suining and Ya’an) with emissions outside CMA remaining unchanged; 36 are region-wide emission reduction scenarios for entire Sichuan Province with emissions outside Sichuan Province remaining unchanged. Figure 2 shows the matrix of different NOx and VOCs emission reductions. The origin (x = y = 0) represents the baseline scenario and the dots identify the proportions of NOx and VOCs emissions reduction percentages that are applied for Chengdu, CMA and Sichuan Province. Referring to Ou et al. (2016), Chen et al. (2019) and Luo et al. (2021) for the setting of emission reduction scenarios, since those nearest the baseline cases represent more feasible emissions reductions, the emissions reduction percentages are spaced at 10% intervals when the emissions reduction percentages are 50% or less and at 20% intervals when the emissions reduction percentages exceeded 50%. In order to investigate the changes in O3 concentrations at different emissions reduction ratios of VOCs to NOx, 12 scenarios with different reduction percentages of NOx and VOCs emissions are designed (e.g., 20% reduction for NOx and 40% reduction for VOCs). All simulations are conducted for the August 2019 period, and the other input parameters used for all simulations are unified. Finally, the responses of O3 to NOx and VOCs emission reductions are calculated based on the 108 emission reduction scenarios and are visualised via O3-NOx-VOC isopleths.
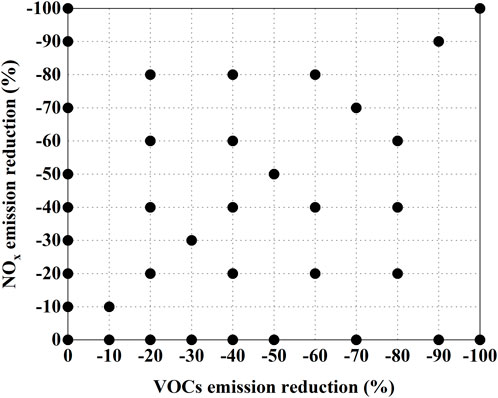
FIGURE 2. NOx and VOCs emission reductions matrix.
Considering that pollution control measures are mainly targeted at stages of heavy pollution, O3 polluted days in each city are selected as those for which the observed and simulated MDA8 O3 concentrations are simultaneously greater than 160 μg m−3, and the number of O3 polluted days during August 2019 are counted (Table 1), the simulated MDA8 O3 concentrations for each city are averaged over the modeling grids where the monitoring stations are located. The factional bias between observed and simulated MDA8 O3 concentrations are calculated for each city, showing that the model is well performed for simlulating the polluted days with most of biases less than 20%.
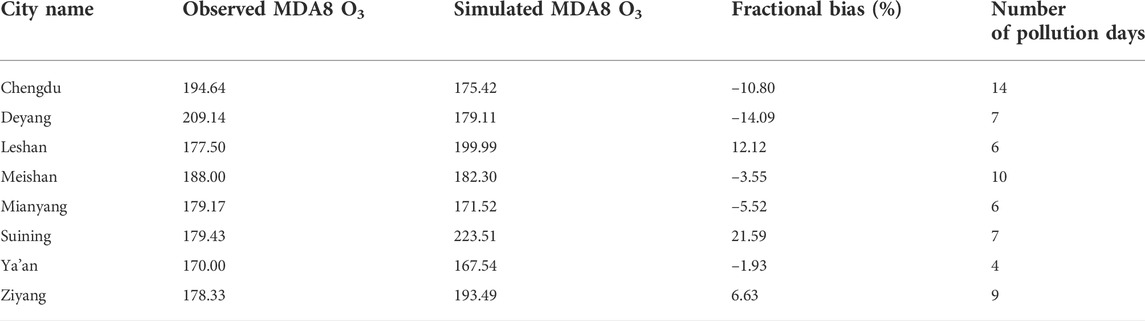
TABLE 1. Comparisons of observed and simulated MDA8 O3 concentrations on polluted days in eight cities in August 2019 (MDA8 O3 concentrations exceeding 160 μg m−3).
3 Results and discussions
3.1 Model evaluation
The evaluation of the model performance for O3 and NO2 concentrations in cities of the CMA region is illustrated in Figure 3. The observed MDA8 O3 concentrations and the daily NO2 concentrations averaged over the monitoring sites in each city are used against the simulated data. The simulated MDA8 O3 concentrations in August 2019 are extracted from the modeling grids where the monitoring stations are located. A total of 37 national monitoring stations in the eight cities in CMA are chosen for model validations (Figure 1C). The statistical metrics, correlation coefficient (R), normalised mean bias (NMB) and normalised mean error (NME) show that the correlations between simulated and observed O3 and NO2 concentrations are both greater than 0.8, the NMB values of O3 and NO2 are –1.73% and 9.01%, and the NME values of O3 and NO2 are 18.02% and 14.81%, indicating that the model generally performs well over the CMA region (Emery et al., 2017).
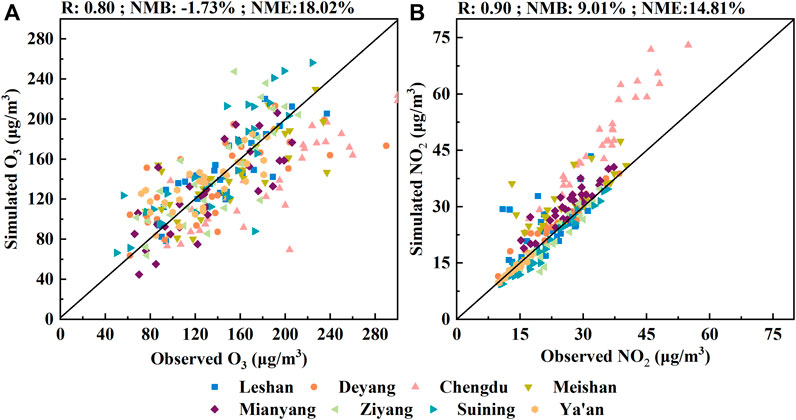
FIGURE 3. Comparisons of (A) daily maximum 8-h average O3 and (B) daily averaged NO2 concentrations in eight cities of the CMA region in August 2019.
3.2 Responses of O3 to NOx and VOCs emission reductions
3.2.1 Reduction scenarios in chengdu
A baseline and thirty-six abatement scenarios were conducted to investigate the effects of local and regional emission reductions on MDA8 O3 concentrations in Chengdu. Isopleth diagrams of average MDA8 O3 concentration are plotted on polluted days during August 2019 with NOx and VOCs emissions reduced only for Chengdu (Figure 4A), following the method as described in Section 2.2 (Table 1). The decreases in O3 concentrations due to the reductions of local NOx and VOCs emissions for Chengdu are small, even with a 100% reduction of local emissions, which only brings down the MDA8 O3 concentration close to 170 μg m−3. The isopleth diagrams illustrate that the MDA8 O3 concentration for the baseline scenario is skewed towards the transition regime (Figure 4A). When the VOCs emissions gradually reduce and NOx emissions remain the same or decrease less than the VOCs emissions, the O3-sensitive regime in Chengdu gradually moves toward VOC-limited.
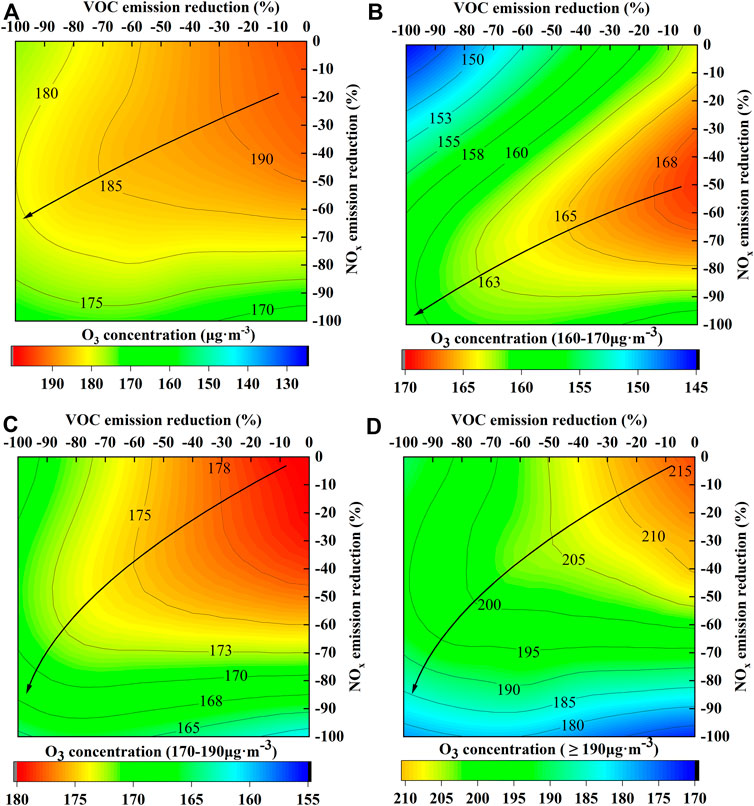
FIGURE 4. Isopleth diagrams of MDA8 O3 varing with VOCs and NOx emission reductions in Chengdu for (A) all polluted days, (B) polluted days with MDA8 O3 concentrations in the range of 160–170 μg m−3, (C) polluted days with MDA8 O3 concentrations in the range of 170–190 μg m−3 and (D) polluted days with MDA8 O3 concentrations greater than 190 μg m−3 (the black arrows are ridgelines).
The average MDA8 O3 polluted days during August 2019 in Chengdu are divided into three categories based on the following concentration ranges, 160–170 μg m−3, 170–190 μg m−3 and ≥190 μg m−3 (Figures 4B–D). When the MDA8 O3 concentrations at the range of 160–170 μg m−3, Chengdu is in VOC-limited regime and a decrease in NOx emissions enhancing O3 concentrations. However, a 20% reduction in VOCs emissions in Chengdu can bring down the MDA8 O3 concentration to 160 μg m−3. When the MDA8 O3 concentration above 170 μg m−3, Chengdu is in a transition regime. At the range of 170–190 μg m−3, MDA8 O3 concentrations in Chengdu are only likely to reach 160 μg m−3 when NOx emissions decreased by almost 100%. At the O3 level above 190 μg m−3, the MDA8 O3 concentrations in Chengdu cannot reach 160 μg m−3 if only local emissions are reduced. It indicates that at light levels of O3 pollution, reducing local emission can attain O3 standard, while at more severe levels of O3 pollution, considering regional control measures are necessary in Chengdu.
3.2.2 Reduction scenarios in CMA
In the emission reduction scenario for eight cities in CMA, the isopleth diagrams of MDA8 O3 illustrates that all cities are mainly NOx-limited in the baseline scenario except for Chengdu, which is in a transition regime (Figure 5). In Chengdu, the reduction of both NOx and VOCs emissions resulted in a decrease in O3 concentration. When NOx and VOCs emission reductions exceeded 40%, the gradient of O3 concentration decrement caused by NOx reduction is greater than that from VOCs reduction. Similar trend is also observed for Deyang. The O3 isopleths for Leshan, Meishan, Mianyang and Ya’an show that the effects of VOCs emission reductions on O3 concentrations are small, with only a decrease of O3 concentration around 5 μg m−3 by more than 50% reductions. The nearly horizontal contours of Suining and Ziyang indicate that these two cities are NOx-limited and reducing NOx emissions inhibits O3 formations. Therefore, priorly reducing NOx emissions in the eight cities of CMA will bring down O3 concentrations more effectively.
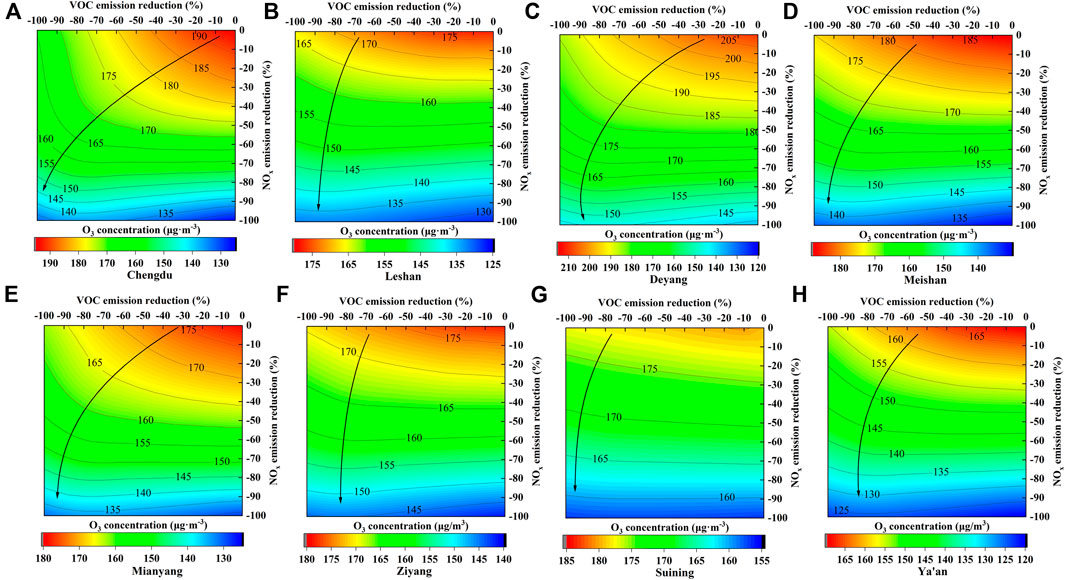
FIGURE 5. Isopleth diagrams of MDA8 O3 varing with VOCs and NOx emission reductions for the CMA scenario ((A) Chengdu, (B) Leshan, (C) Deyang, (D) Meishan, (E) Mianyang, (F) Ziyang, (G) Suining, (H) Ya’an; the black lines with arrows are ridgelines).
The responses of O3 concentrations to NOx and VOCs emissions vary in different cities in the CMA region. The averaged MDA8 O3 concentrations in cities such as Leshan, Mianyang and Ya’an can attain the standard (160 μg m−3) when NOx emissions in CMA are reduced by 22–53%. Cities such as Chengdu, Ziyang, Deyang and Meishan need to reduce NOx emissions in CMA by 60–77% to reach the standard. Although the MDA8 O3 concentrations in Suining are lower than most of the other cities, the reduction of NOx emissions in CMA causes a small gradient in the decrease of O3, resulting in more than 89% reduction of NOx emissions in CMA to lower down O3 concentrations below 160 μg m−3. It indicates that synergistic precursor emission reductions from the CMA region or outside CMA are required to achieve more effective O3 controls.
3.2.3 Reduction scenarios in Sichuan Province
Isopleth diagrams of the averaged MDA8 O3 concentrations versus the VOCs and NOx emission reduction percentages for Sichuan Province are shown in Figure 6. It shows that reducing NOx and VOCs emissions in Sichuan Province cause a larger gradient in the decrease of MDA8 O3 concentrations compared to those shown in Figure 4 and Figure 5. Although the responses of O3 concentrations to NOx and VOCs emissions in most cities are NOx-limited, the same percentage of VOCs emission reductions in Figure 6 causes a greater decrease in MDA8 O3 concentrations than in Figure 4 and Figure 5. In Leshan, Mianyang and Meishan, around 30% VOCs emission reductions result in a 5 μg m−3 decrease in the O3 concentrations. Similarly, the MDA8 O3 concentrations in eight cities reach the 160 μg m−3 much faster in the emission reduction scenarios for Sichuan Province. Cities such as Ziyang, Suining, Leshan, Mianyang and Ya’an, NOx emissions dropped by around 20–45%, and cities such as Chengdu, Deyang and Meishan, NOx emissions dropped by approximately 48–66%, respectively, MDA8 O3 concentrations can attain the standard of 160 μg m−3.
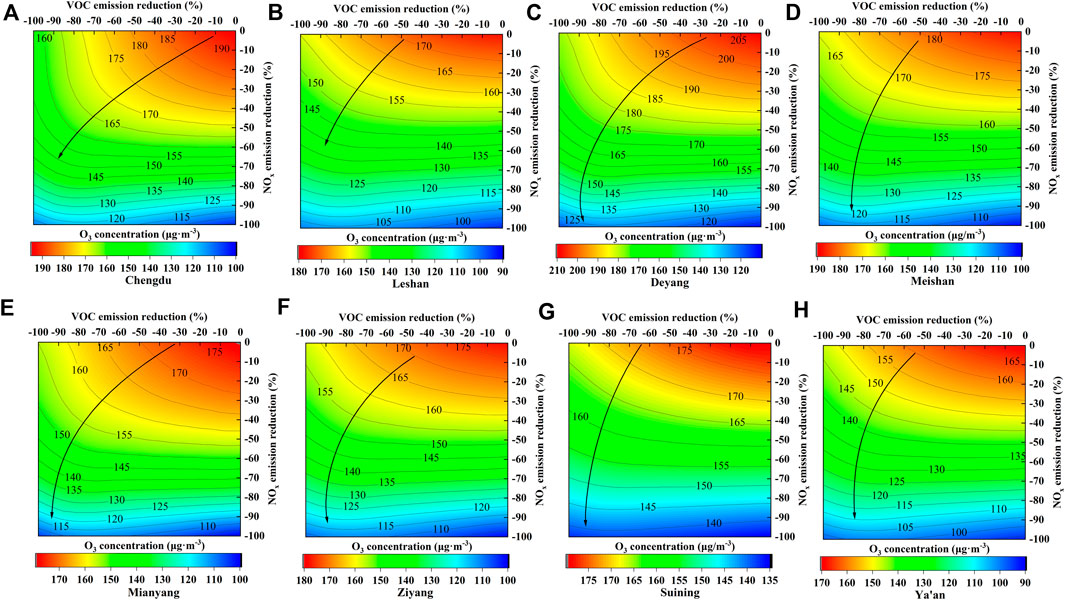
FIGURE 6. Isopleth diagrams of MDA8 O3 varing with VOCs and NOx emission reductions for the Sichuan Province scenario ((A) Chengdu, (B) Leshan, (C) Deyang, (D) Meishan, (E) Mianyang, (F) Ziyang, (G) Suining, (H) Ya’an; the black lines with arrows are ridgelines).
The effects of NOx and VOCs emission reductions from different regions on O3 concentrations vary significantly among cities. Figure 7 shows the maximum decrements in MDA8 O3 concentrations for each city under the 100% NOx and VOCs emission reductions for the CMA region and Sichuan Province. The emission reductions for Sichuan Province result in a maximum decrease in MDA8 O3 concentrations above 77.4 μg m−3 (40%) for most cities, with a maximum of approximately 83.9 μg m−3 (47%) in Leshan. The exception is in Suining, which has the smallest decrease in O3 concentrations among these cities, with a maximum decrease of about 44 μg m−3 (25%) in two different regional emission reduction scenarios. A study by Lu et al. (2019) revealed that the background O3 concentrations from May to August accounted for approximately 50.3% of total O3 concentrations in the Sichuan Basin, indicating that a 100% reduction of anthropogenic emissions in Sichuan Province may cause less than 50% decrease of total O3 concentrations.
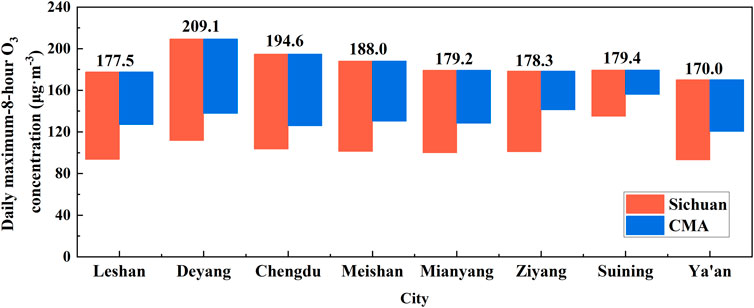
FIGURE 7. The effects of 100% NOx and VOCs emission reductions on MDA8 O3 concentrations in eight cities for the CMA and Sichuan Province scenarios.
The maximum decrease in O3 concentrations in Deyang and Chengdu under the CMA emission reduction scenario is around 71.4 μg m−3 (34.1%) and 68.8 μg m−3 (35.4%), respectively, and the maximum decrease in O3 concentrations in Chengdu and Deyang under the Sichuan Province emission reduction scenario is about 97.5 μg m−3 (46.6%) and 91.0 μg m−3 (46.8%), respectively. The decreases in O3 concentrations under the Sichuan Province emission reduction scenario are approximately 12% larger compared to the CMA emission reduction scenario, especially in Leshan, Mianyang and Ziyang, decreases in O3 concentrations under the Sichuan Province emission reduction scenario are about 20% higher than those under the CMA emission reduction scenario.
3.3 Differences in O3 reduction effectiveness
Figures 4–6 illustrate the effects of local and regional emission perturbations on O3 concentrations. Comparing the O3 isopleth diagrams for Chengdu, CMA and Sichuan Province emission reduction scenarios reveals that, although the baseline scenario showing Chengdu is in a VOC-limited regime, the reductions of local VOCs emissions have small impact on the decrease of O3 concentrations. When local VOCs emissions decreased by 60%, the decrease of O3 concentrations in Chengdu is less than 5 μg m−3. In contrast, under emission reduction scenarios for the CMA and Sichuan Province, to achieve a 5 μg m−3 decrease in MDA8 O3 concentrations in Chengdu only required a reduction of NOx or VOCs emissions of less than 20%, and even a smaller reduction rate is demanded if both NOx and VOCs emissions are reduced. It indicates that the regional and transported emission sources on O3 concentrations should be considered in emission control strategies.
Referring to the emission ratios of VOCs to NOx in other studies (Chen et al., 2019; Wang et al., 2019; Yao et al., 2021), 11 different emission reduction ratios of VOCs to NOx emissions (VOCs/NOx = 1:4, 1:3, 1:2, 1:1.5, 1:1.25, 1:1, 1.25:1, 1.5:1, 2:1, 3:1, 4:1) within 100% emission reductions under Chengdu, CMA, and Sichuan Province scenarios are conducted to investigate the changes for MDA8 O3 in Chengdu (Figure 8). When the emission reduction ratio of VOCs/NOx is greater than 1, the decreasing trend of the averaged MDA8 O3 concentration is closer to linear and the decrement in the averaged MDA8 O3 concentration is significantly smaller than those when the ratio is less than 1. In contrast, the decreasing trend in the averaged MDA8 O3 concentration is non-linear when the emission reduction ratio of VOCs/NOx is equal to or less than one and the smaller the ratio (the larger reduction of NOx emission) the faster the O3 decrease. The largest decrease in the averaged MDA8 O3 concentration is at the VOCs/NOx ratio of 1:4.
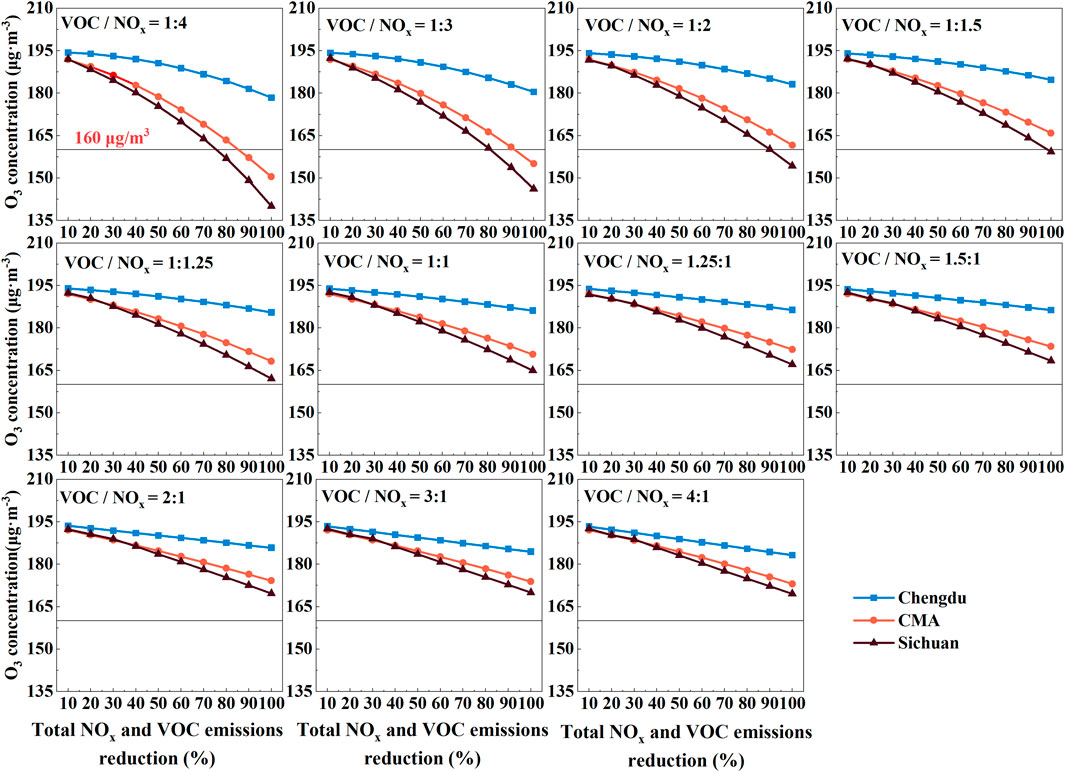
FIGURE 8. Effects of the emission reductions with different VOCs to NOx ratios on the changes in MDA8 O3 concentrations under Chengdu, CMA and Sichuan Province scenarios.
Among the emission reduction scenarios in different regions, the decrease in the averaged MDA8 O3 concentration under the Chengdu emission reduction scenario is significantly smaller than those under the other two regional emission reduction scenarios (the CMA and Sichuan Province). However, when the total VOCs and NOx emission reductions are less than 30%, especially at high ratio of VOCs/NOx, the decrease in the averaged MDA8 O3 concentration under these two emission reduction scenarios is almost identical.
4 Conclusion
108 scenarios of NOx and VOCs emission reductions for different regions were simulated using the CAMx model and the relationship among O3-NOx-VOC was obtained in this study. The responses of O3 formation to the changes in NOx and VOCs emissions in the CMA region were demonstrated by the O3 isopleth diagrams. In addition, 11 emission reduction cases with different VOCs-to-NOx ratios were investigated to explore the changes in O3 concentrations under different reduction ratios of precursor emissions.
It was found that the O3-sensitive regimes in Chengdu city was in a transition zone, while the other cities in the CMA region were in the NOx-limited zone. Eight cities could meet the MDA8 O3 concentration standard when NOx emissions in the CMA region were reduced by 77% or more. However, if only cut VOCs emissions, even with a 100% reduction, it failed to attain O3 standard of 160 μg m−3 for all cities in the CMA region. The results showed that under the NOx and VOCs emission reduction scenario in Sichuan Province, the most effective way to reduce the peak MDA8 O3 concentration was to control NOx emissions, with a 66% reduction in NOx emissions enabling cities in the CMA region to reach the MDA8 O3 standard (160 μg m−3). However, in reality, it is quite difficult to achieve 66% NOx emission reductions in a short time period. Hence, in order to reach the MDA8 O3 standard in all cities in the CMA region, joint regional pollutant prevention and control abatement measures outside of Sichuan Province may need to be considered. Although a decrease in VOCs emissions could also reduce the MDA8 O3 concentration, the effects were smaller than that achieved with a decrease in NOx emissions, and cutting VOCs emissions alone may not be able to achieve the MDA8 O3 standard in some cities, such as Deyang, Meishan, and Suining. Overall, the NOx and VOCs emission reductions in Sichuan Province could reach a 50% higher O3 concentration decrease than the emission reductions in the CMA region, such as in the Ziyang city, but the other cities such as Deyang, Chengdu and Suining, such differences were not significant.
The MDA8 O3 concentration decreases resulting from different VOCs to NOx emission reduction ratios for the eight cities in the CMA region showed that all cities reach higher MDA8 O3 decreases due to NOx emissions control. In addition, the effects of non-local emission reductions on MDA8 O3 decreases were much higher than those from local emission reductions. Furthermore, in the emission reduction scenarios for the CMA and Sichuan Province, the decreases in MDA8 O3 were almost identical for NOx and VOCs emission reductions at less than 30%, suggesting that if the non-local NOx and VOCs emission reductions were small, effects of expanding the emission control area from CMA to Sichuan Province on MDA8 O3 were insignificant.
O3 is highly transportable and biogenic VOCs emissions were relatively high in summer, contributing high background O3 concentrations and increasing the difficulties in O3 control. Although most cities in the CMA region were NOx-limited on the regional basis, the synergistic control of NOx and VOCs emissions was still an effective way to reduce O3 concentrations in the short term. On the other hand, persistently controlling regional NOx emissions should become a control measure in a long run to further reduce O3 levels regionally.
Data availability statement
The raw data supporting the conclusions of this article will be made available by the authors, without undue reservation.
Author contributions
XD and WT contributed significantly to the conception of the study and to model data analysis and manuscript preparation; ZZ, YY and YL conducted simulations and model performance evaluations; JC, LH, YL prepared emission inventory for the modeling; HL, FC and FM helped perform the analysis with constructive discussions. All authors contributed to the article and approved the submitted version.
Funding
This work was supported by National Key Research and Development Project (NO. 2017YFC0213003, NO. 2018YFC0213504, NO. 2016YFC0208905).
Acknowledgments
The authors would like to thank Jiemeng Bao and Zhenhai Wu for providing measurement data.
Conflict of interest
The authors declare that the research was conducted in the absence of any commercial or financial relationships that could be construed as a potential conflict of interest.
Publisher’s note
All claims expressed in this article are solely those of the authors and do not necessarily represent those of their affiliated organizations, or those of the publisher, the editors and the reviewers. Any product that may be evaluated in this article, or claim that may be made by its manufacturer, is not guaranteed or endorsed by the publisher.
References
Amann, M., Derwent, D., Forsberg, B., Hanninen, O., Hurley, F., Krzyzanowski, M., et al. (2008). World Health Organization: Health risks of ozone from long-range transboundary air pollution. Geneva, Switzlerand: World Health Organisation Regional Office for Europe. Available at: http://www.euro.who.int/__data/assets/pdf_file/0005/78647/E91843.pdf (Accessed October 18, 2017).
Carter, W. P. L., and Heo, G. (2013). Development of revised SAPRC aromatics mechanisms. Atmos. Environ. 77, 404–414. doi:10.1016/j.atmosenv.2013.05.021
Carter, W. P. L. (2000). Implementation of the saprc-99 chemical mechanism into the models-3 framework. Report, 1–101.
Chatani, S., Shimadera, H., Itahashi, S., and Yamaji, K. (2020). Comprehensive analyses of source sensitivities and apportionments of PM<sub>2.5</sub> and ozone over Japan via multiple numerical techniques. Atmos. Chem. Phys. 20 (17), 10311–10329. doi:10.5194/acp-20-10311-2020
Chen, X., Situ, S., Zhang, Q., Wang, X., Sha, C., Zhouc, L., et al. (2019). The synergetic control of NO2 and O3 concentrations in a manufacturing city of southern China. Atmos. Environ. 201 (2), 402–416. doi:10.1016/j.atmosenv.2018.12.021
Cui, M., An, X., Xing, L., Li, G., Tang, G., He, J., et al. (2021). Simulated sensitivity of ozone generation to precursors in beijing during a high O3 episode. Adv. Atmos. Sci. 38 (7), 1223–1237. doi:10.1007/s00376-021-0270-4
Dunker, A. M., Koo, B., and Yarwood, G. (2015). Source apportionment of the anthropogenic increment to ozone, formaldehyde, and nitrogen dioxide by the path-integral method in a 3D model. Environ. Sci. Technol. 49 (11), 6751–6759. doi:10.1021/acs.est.5b00467
Dunker, A. M. (2015). Path-integral method for the source apportionment of photochemical pollutants. Geosci. Model Dev. 8 (6), 1763–1773. doi:10.5194/gmd-8-1763-2015
Emery, C., Liu, Z., Russell, A. G., Odman, M. T., Yarwood, G., and Kumar, N. (2017). Recommendations on statistics and benchmarks to assess photochemical model performance. J. Air Waste Manag. Assoc. 67 (5), 582–598. doi:10.1080/10962247.2016.1265027
ENVIRON (2020). CAMx (comprehensive air quality model with extensions) user’s guide version 7.10. Novato, CA: ENVIRON International Corporation.
Guenther, A., Jiang, X., Shah, T., Huang, L., Kemball-Cook, S., and Yarwood, G. (2019). “Model of emissions of gases and aerosol from nature version 3 (MEGAN3),” in Air pollution modeling and its application XXVI (Cham: Springer), 187.
Haagen-Smit, A. J. (1952). Chemistry and physiology of Los Angeles smog. Ind. Eng. Chem. 44 (6), 1342–1346. doi:10.1021/ie50510a045
He, Z., Wang, X., Ling, Z., Zhao, J., Guo, H., Shao, M., et al. (2019). Sources of methacrolein and methyl vinyl ketone and their contributions to methylglyoxal and formaldehyde at a receptor site in Pearl River Delta. J. Environ. Sci. x, 1–10. doi:10.1016/j.jes.2018.12.001
Itahashi, S., Hayami, H., and Uno, I. (2015). Comprehensive study of emission source contributions for tropospheric ozone formation over East Asia. J. Geophys. Res. Atmos. 120 (1), 331–358. doi:10.1002/2014JD022117
Itahashi, S., Mathur, R., Hogrefe, C., Napelenok, L. S., and Zhang, Y. (2020). Modeling stratospheric intrusion and trans-Pacific transport on tropospheric ozone using hemispheric CMAQ during April 2010 - Part 2: Examination of emission impacts based on the higher-order decoupled direct method. Atmos. Chem. Phys. 20 (6), 3397–3413. doi:10.5194/acp-20-3397-2020
Jiang, Z., Shi, H., Zhao, B., Gu, Y., Zhu, Y., Miyazaki, K., et al. (2021). Modeling the impact of COVID-19 on air quality in southern California: Implications for future control policies. Atmos. Chem. Phys. 21 (11), 8693–8708. doi:10.5194/acp-21-8693-2021
Kim, E., Kim, B. U., Kim, H. C., and Kim, S. (2017). The variability of ozone sensitivity to anthropogenic emissions with biogenic emissions modeled by MEGAN and BEIS. Atmosphere 8 (10), 187–225. doi:10.3390/atmos8100187
Kurokawa, J., Ohara, T., Morikawa, T., Hanayama, S., Janssens-Maenhout, G., Fukui, T., et al. (2013). Emissions of air pollutants and greenhouse gases over Asian regions during 2000–2008: Regional Emission inventory in Asia (REAS) version 2. Atmos. Chem. Phys. 13 (21), 11019–11058. doi:10.5194/acp-13-11019-2013
Li, M., Liu, H., Geng, G., Hong, C., Liu, F., Song, Y., et al. (2017). Anthropogenic emission inventories in China: A review. Natl. Sci. Rev. 4 (6), 834–866. doi:10.1093/nsr/nwx150
Li, M., Zhang, Q., Streets, D. G., He, K. B., Cheng, Y. F., Emmons, L. K., et al. (2014). Mapping Asian anthropogenic emissions of non-methane volatile organic compounds to multiple chemical mechanisms. Atmos. Chem. Phys. 14 (11), 5617–5638. doi:10.5194/acp-14-5617-2014
Li, Z., Yu, S., Li, M., Chen, X., Zhang, Y., Song, Z., et al. (2022). The modeling study about impacts of emission control policies for Chinese 14th five-year plan on PM2.5 and O3 in yangtze river delta, China. Atmosphere 13 (1), 26. doi:10.3390/atmos13010026
Liu, C., Zhang, L., Wen, Y., and Shi, K. (2021). Sensitivity analysis of O3 formation to its precursors-Multifractal approach. Atmos. Environ. 251, 118275. doi:10.1016/j.atmosenv.2021.118275
Lu, X., Zhang, L., Chen, Y., Zhou, M., Zheng, B., Li, K., et al. (2019). Exploring 2016-2017 surface ozone pollution over China: Source contributions and meteorological influences. Atmos. Chem. Phys. 19 (12), 8339–8361. doi:10.5194/acp-19-8339-2019
Luo, H., Zhao, K., Yuan, Z., Yang, L., Zheng, J., Huang, Z., et al. (2021). Emission source-based ozone isopleth and isosurface diagrams and their significance in ozone pollution control strategies. J. Environ. Sci. (China) 105, 138–149. doi:10.1016/j.jes.2020.12.033
Ou, J., Yuan, Z., Zheng, J., Huang, Z., Shao, M., Li, Z., et al. (2016). Ambient ozone control in a photochemically active region: Short-term despiking or long-term attainment? Environ. Sci. Technol. 50 (11), 5720–5728. doi:10.1021/acs.est.6b00345
Qu, Y., An, J., Li, J., Chen, Y., Li, Y., Liu, X., et al. (2014). Effects of NOx and VOCs from five emission sources on summer surface O3 over the Beijing-Tianjin-Hebei region. Adv. Atmos. Sci. 31 (4), 787–800. doi:10.1007/s00376-013-3132-x
Skamarock, W. C., Klemp, J. B., Dudhia, J., Gill, D. O., Zhiquan, L., Berner, J., et al. (2019). A description of the advanced research WRF model version 4. NCAR technical note NCAR/TN-475+STR. AvaliableAt: http://library.ucar.edu/research/publish-technote.
Tan, Z., Lu, K., Jiang, M., Su, R., Dong, H., Zeng, L., et al. (2018). Exploring ozone pollution in chengdu, southwestern China: A case study from radical chemistry to O3-VOC-NOx sensitivity. Sci. Total Environ. 636, 775–786. doi:10.1016/j.scitotenv.2018.04.286
Wang, N., Lyu, X., Deng, X., Huang, X., Jiang, F., and Ding, A. (2019). Aggravating O 3 pollution due to NO x emission control in eastern China. Sci. Total Environ. 677, 732–744. doi:10.1016/j.scitotenv.2019.04.388
Wickham, J., Stehman, S., Gass, L., Dewitz, J., Sorenson, D., Granneman, B., et al. (2019). EPA public access. Adv. Ecol. Res. 60, 1–24. doi:10.1016/j.scitotenv.2019.01.116.Source
Wu, R., and Xie, S. (2017). Spatial distribution of ozone formation in China derived from emissions of speciated volatile organic compounds. Environ. Sci. Technol. 51 (5), 2574–2583. doi:10.1021/acs.est.6b03634
Yang, X., Wu, K., Lu, Y., Wang, S., Qiao, Y., Zhang, X., et al. (2021). Origin of regional springtime ozone episodes in the Sichuan Basin, China: Role of synoptic forcing and regional transport. Environ. Pollut. 278, 116845. doi:10.1016/j.envpol.2021.116845
Yang, Y., Lan, H., and Li, J. (2020). Spatial econometric analysis of the impact of socioeconomic factors on PM2.5 concentration in China’s inland cities: A case study from chengdu plain economic zone. Int. J. Environ. Res. Public Health 17 (1), 74. doi:10.3390/ijerph17010074
Yao, S., Wei, W., Cheng, S., Niu, Y., and Guan, P. (2021). Impacts of meteorology and emissions on O3 pollution during 2013–2018 and corresponding control strategy for a typical industrial city of China. Atmosphere 12 (5), 619. doi:10.3390/atmos12050619
Yarwood, G., Emery, C., Jung, J., Nopmongcol, U., and Sakulyanontvittaya, T. (2013). A method to represent ozone response to large changes in precursor emissions using high-order sensitivity analysis in photochemical models. Geosci. Model Dev. 6 (5), 1601–1608. doi:10.5194/gmd-6-1601-2013
Yu, S. (2019). Fog geoengineering to abate local ozone pollution at ground level by enhancing air moisture. Environ. Chem. Lett. 17 (1), 565–580. doi:10.1007/s10311-018-0809-5
Zhang, W. (2013). Direct sensitivity techniques in regional air quality models: Development and application. Atlanta, Georgia: Georgia Institute of Technology. Doctoral dissertation. Available at: https://smartech.gatech.edu/bitstream/handle/1853/52941/ZHANG-DISSERTATION-2013.pdf?sequence=1&isAllowed=y.
Keywords: ozone modeling, emission reduction scenarios, O3-sensitive regimes, empirical kinetic modeling approach, Chengdu metropolitan area
Citation: Du X, Tang W, Zhang Z, Chen J, Han L, Yu Y, Li Y, Li Y, Li H, Chai F and Meng F (2022) Responses of ozone concentrations to the synergistic control of NOx and VOCs emissions in the Chengdu metropolitan area. Front. Environ. Sci. 10:1024795. doi: 10.3389/fenvs.2022.1024795
Received: 22 August 2022; Accepted: 06 October 2022;
Published: 21 October 2022.
Edited by:
Gen Zhang, Chinese Academy of Meteorological Sciences, ChinaReviewed by:
Yun Lin, Joint Institute for Regional Earth System Science and Engineering, College of Physical Sciences, University of California, Los Angeles, United StatesShupeng Zhu, University of California, Irvine, United States
Copyright © 2022 Du, Tang, Zhang, Chen, Han, Yu, Li, Li, Li, Chai and Meng. This is an open-access article distributed under the terms of the Creative Commons Attribution License (CC BY). The use, distribution or reproduction in other forums is permitted, provided the original author(s) and the copyright owner(s) are credited and that the original publication in this journal is cited, in accordance with accepted academic practice. No use, distribution or reproduction is permitted which does not comply with these terms.
*Correspondence: Wei Tang, tangwei@craes.org.cn