Bio-Compatible Sensor for Middle Ear Pressure Monitoring on a Bio-Degradable Substrate
 Klara Mosshammer1*
  Theresa Lüdke2* Sarah Spitzner1 Daniel Firzlaff3 Kathrin Harre3 Hans Kleemann1
  Marcus Neudert2 Thomas Zahnert2
  Karl Leo1
- 1Dresden Integrated Center for Applied Physics and Photonic Materials (IAPP) and Institute for Applied Physics, Technische Universität Dresden, Dresden, Germany
- 2Ear Research Center Dresden (ERCD), Department of Otorhinolaryngology, Head and Neck Surgery, Carl Gustav Carus Faculty of Medicine, Technische Universität Dresden, Dresden, Germany
- 3Professur für Technische Chemie, Fakultät Landbau/ Umwelt/ Chemie, Hochschule für Technik und Wirtschaft Dresden, Dresden, Germany
Hypotension in the middle ear can cause serious diseases and hearing disorders. Until now, pressure in the middle ear is measured indirectly by using the impedance of the tympanic membrane (tympanometry). Direct methods are just described in scientific studies and would be harmful in clinical routine. Here, we demonstrate a bio-compatible pressure sensor, which can resolve pressure changes in the range of −7.5 kPa up to +7.5 kPa, and due to its compact design (area of 2 × 4 mm2), can be directly implanted in the human middle ear. Furthermore, the read-out of the pressure sensor can be conveniently done using wireless data communication technologies employing a plate capacitor with an elastic dielectric for pressure monitoring and a planar coil. Thus, our sensor allows for direct pressure measurements in the middle ear, avoiding additional surgeries after device implantation.
1 Introduction
Bio-compatible electronic devices are a rapidly developing field of technology that may not only provide a way to achieve green, environmental-friendly electronics (Irimia-Vladu, 2014) but also have the potential to revolutionize the world of medical therapies. In particular, small, flexible, and versatile sensors [e.g., for ion (Tseng et al., 2021), chemical, electrical sensing (Bai et al., 2019; Keene et al., 2020), etc.], which can be integrated in the human body, enable completely new treatment and monitoring methods (Lee et al., 2015; Minev et al., 2015; Someya et al., 2016; Torricelli et al., 2021).
Pressure sensing inside the human body is of particular interest as pressure is used to regulate specific physiological functions (e.g., inside the ears or eyes) or might serve as an indicator for early-stage detection of certain diseases. However, there are at least two challenges in the development of pressure sensor units for in-vivo measurements: 1) the low pressure change, e.g., inside the ears or eyes typically in the range of ≤10 kPa, and 2) the necessity to integrate such sensor units including read-out electronics on chips with a size of only several square millimeter (e.g., for integration into the middle ear). In addition, if only short-term pressure recording is required (e.g., for postoperative monitoring), ideally, the sensors units should be bio-degradable to avoid additional surgery. However, using bio-compatible or even bio-degradable materials increases the complexity of device fabrication due to the limited choice of materials and restrictions concerning compatibility with fabrication processes.
One application for in-vivo pressure sensing with high medical need is hypotension in the middle ear. It is the leading cause for hearing disorders and potentially life threatening chronic inflammatory processes such as cholesteatoma, which commonly leads to middle ear surgery (Magnuson, 1981). Another crucial point is balanced middle ear pressure after ear surgery, as maintaining the physiological function of the middle ear and the overall rate of healing and hearing rehabilitation success is determined by a balanced middle ear pressure (Takahashi et al., 2007; Müller et al., 2019). Currently, only indirect pressure measurement methods are established. Tympanometry measures the acoustic resistance of the tympanic membrane and thus indirectly the pressure in the middle ear (Lidén et al., 1970). In contrast direct and continuous measurement of pressure in the middle ear over an extended period of time has been described only in experimental work. In these studies, the pressure sensor was inserted into the middle ear via an artificially created hole in the tympanic membrane (Tideholm et al., 1998) or via a catheter through the mastoid bone (Jacobsen et al., 2007; Gaihede et al., 2010). However, these methods have been used only in healthy ears and in a small numbers of cases. Moreover, they employ a highly invasive procedure that requires immense personnel and time. Additionally, these devices need to be removed in a second step and perforations left could serve as entrance for infections.
Hence, a small sensor which is well-tolerated by the human body and could be left in the middle ear cavity after surgery and enable a direct and continuous monitoring of the pressure without the need to remove it by another potentially risky surgery would represent a substantial improvement compared to the current possibilities.
In this work, we develop a bio-compatible pressure sensor which shall be implanted in the human middle ear in order to quantify the middle ear pressure for efficient postoperative monitoring. We employ a pressure sensitive membrane embedded into a capacitor structure in order to analyze the change of static pressure by means of the capacitance. Combing the capacitor with an appropriate coil design, we are able to fabricate LC-units with resonance frequencies typically used in radio-frequency identification tags (RFID), and the non-invasive readout of the pressure is realized by determining the pressure-induced modulation of the resonance frequency/phase of the LC-unit. The entire sensor unit requires an maximum area of 2 × 4 mm2, which is a specification originating from the anatomy of the middle ear. Furthermore, with a sensitivity of 0.002 kPa−1 and a linearity of R2 = 0.977, our sensor is able to resolve the relevant pressure changes. In literature, pressure sensors utilizing PDMS are demonstrated in various configurations (Lei et al., 2012; Boutry et al., 2018; Kou et al., 2019; Zhang et al., 2019; Jung et al., 2020; Hwang et al., 2021). Clearly, the central challenge of our work is to design a device that fulfills all technological requirements but is only build up from bio-compatible materials, which significantly limits the choice of applicable processing techniques.
2 Sensor Concept and Sensor Fabrication
In Figure 1, we show the concept of the pressure sensor unit discussed in this work. The pressure sensitive capacitor is made of metallic electrodes and polydimethylsiloxane (PDMS) as an elastic dielectric material.

FIGURE 1. (A) Scheme of a human ear. The red arrow indicates the position of the pressure sensor within the middle ear [adapted from (Schünke et al., 2018)]. (B) Schematic illustration of the sensor structure on a flexible gelatine substrate. (C) Cross-section of sensor structure.
With a Young’s modulus E in the range of 1 MPa (Troels and Lee, 2014), PDMS is a rubber and can be compressed easily compared to other polymers such as polyethylene with E ∼ 2000 MPa (MacDonald et al., 2007). Also, for PDMS the temperature sensitivity of E is rather small (∼ 6 kPa/K) (Troels and Lee, 2014). Hence, for a temperature variation of ∼ 2 K in the human body, E is expected to change only by ∼ 1% which does not effect the sensitivity of the pressure sensor significantly.
We are employing with a very simple sample structure consisting of a flexible, bio-compatible gelatin substrate coated with thin gold electrodes separated by a corrugated layer of PDMS. The capacitor is combined with a planar coil, which enables radio-frequency identification (RFID) technology for wireless data transmission. Overall, the yield of the sensor fabrication is decent. Except from devices at the edges of the carrier substrate, the yield can be close 100% as we do not employ any high-risk process (e.g., lift-off, transfer with precise alignment requirements) but rather we only use well-established, high yield methods (deposition through shadow mask, photolithography, etc.). The different processing steps are described in the following.
Bio-Compatible Gelatin Substrates
The gelatin Type A used to fabricate bio-compatible substrates is purchased from Carl Roth. The source material is processed by a procedure adapted from (Aewsiri et al., 2010; Zhang et al., 2010) as described in the following. Gelatin, glycerin and water were added to a three-necked flask. The suspension was stirred for 1 h at 50°C. The pH value was adjusted to 9.0 with 1 M NaOH. Tannic acid was separately solved in water and the pH value was adjusted to 9.0 with 1 M NaOH. The suspension was stirred for another 30 min after addition of the crosslinker. For the sample preparation, thin PET foils with dimensions of 25 × 25 mm2 were used. Compared to a glass substrate the final peel-off from PET foils is much easier. On these foils, 369 µL of gelatin suspension were applied and evenly distributed with a glass rod yielding a thickness of about 200 µm. The surface is sufficiently smooth and homogeneous enabling the deposition of closed films of thin metal electrodes. The gelatin layer was cured for 24 h at room temperature (23 ± 2°C) and a relative humidity of 40–60% RH. After curing, it is mechanically peeled off and serves as a flexible, bio-compatible substrate for the deposition of the sensor as shown in Figure 2.
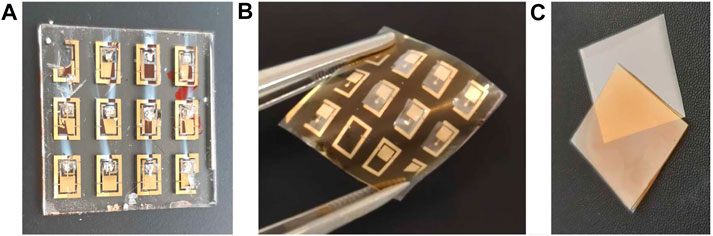
FIGURE 2. Fabricated devices on glass (A) and gelatin (B). The samples at the top left and bottom right corner are damaged which is due to the sample holder that covers a part of the electrode shadow mask. Furthermore, the samples in (A) look damaged but in fact, the photo has been taken after measurement for which conductive silver paste has been used. (C) The gelatin substrate (yellowish) is processed on PET (gray) and can be easily peeled off.
It should be noted that no controlled and standardized flexibility tests are conducted here since flexibility is more a consequence of the material choice rather than a requirement for the application case. Nevertheless, the substrates easily survive a couple of cycles of bending and stretching by hand which might be beneficial for the handling during surgery.
PDMS Structuring
The PDMS is fabricated by spin coating and photolithography, and the process is illustrated in Figure 3A. The first step is to create a photoresist stamp by spin coating SU-8 2002 (1 min at 3,000 rpm) (purchased from Microresist) on a glass substrate. This sample is then placed on a hot plate for 5 min at 95°C. The resist is now illuminated for 8 s (Mercury i-line) through a conventional lithography mask (chromium mask) with 3 µm transmitting structures. After this exposure, the sample is baked again (5 min at 95°C) and afterwards the resist pattern is developed in 1-Methoxy-2-propylacetat (PGMEA) for 1 min in an ultrasonic bath followed by gently cleaning using isopropanol. After evaporation of the solvent on a hot plate, the structure is further hardened by exposure to UV light (Mercury, i-line) for 5 minutes and consecutive heating to 150°C on a hot plate for 5 min. This treatment leads to photoresist stamp, which is used in the following.
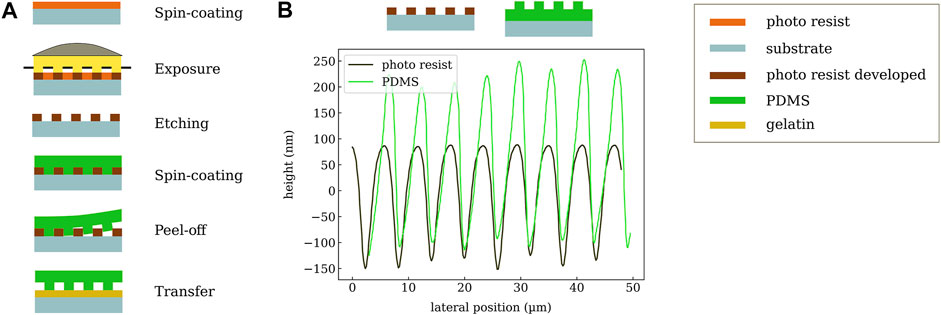
FIGURE 3. (A) Workflow of PDMS structuring. First, a stamp is created via photolithography. Then, PDMS is coated, released, and transferred to the gelatin substrate. (B) Measured profiles of the photo-resist (SU-8) stamp and the resulting corrugated PDMS layer.
The second step is to transfer the resist pattern into a layer of PDMS in order to increase its compressibility and eventually the sensitivity of the pressure sensor. The SU-8 stamp with a thickness of 3 µm is covered by PDMS using spin-casting (5 min at 1,000 rpm) followed by a curing step for 45 min at 100°C. A combination of lower curing temperatures and longer exposure time is possible and has been tested for initial samples. More specifically, we are using SYLGARD 184 Silicone Elastomer which is mixed with 184 Silicone Elastomer Curing Agent for 2 min (mixing 10:1). To avoid the formation of air bubbles occurring in the highly viscous liquid, it is treated in an ultrasonic bath for 20 min (bath is heated to 70°C). This step leads to even higher viscosity which enables thicker layers of PDMS. Now the elastomer is cut to the desired size with a scalpel and carefully released from the SU-8 stamp. This procedures creates a PDMS layer structured at the bottom, which can be transferred to the target gelatin substrate. It should be noted that a direct structuring of the dielectric layer on top of the substrate is not possible since the chemical treatment during the development of the photo-resist causes the gelatin to swell, which then destroys the electrode layers. Despite the increased process complexity of a transfer process in comparison to direct fabrication of the PDMS on the substrate, the transfer step does not influence the device yield or reliability. In particular, it does not require precise alignment since, in general, the PDMS area can be much larger than the bottom electrode. In the specific case of the electrode layout with GSG contacts (for ultra-high-frequency measurements), which surround the sensor and should not be covered, the PDMS needs to be placed with an accuracy of about 1 mm. The surface profile of the SU-8 stamp and the PDMS after release are shown in Figure 3B. The periodicity of about 6 µm is nicely reproduced on the polymer layer. A profile depth of around 300 nm is achieved which slightly depends on the sample position.
Metal Contacts
The metal contacts are made of gold which not only fulfills the requirement of bio-compatibility, but also has the advantage of high conductivity and being well established in terms of micro-processing. Subsequent studies may explore the applicability of low cost and also bio-degradable alternatives like magnesium. During the evaporation process, a shadow mask covering the sample allows for generating the required design of electrodes which includes the capacitor plates as well as the planar coil. The thickness is set to around 100 nm. It is relatively thick, but assures to overcome the gelatin’s substrate roughness and also allows for contacting the prototype samples for the impedance measurements.
Another challenge is to create a through-hole to connect bottom and top electrode. This hole is formed by removing the PDMS on top of the bottom contact in the area of the center of the planar coil using CO2-Laser structuring tool.
The entire process for the fabrication of the sensor contains several unconventional fabrication methods (1: metal patterning shadow mask rather than lithography, electroplating, etc., 2: transfer of PDMS to gelatin substrate rather than coating PDMS directly, 3: creating the through-hole with a laser process rather than dry-etching and lithography), which is the prize one has to pay for using a bio-compatible (in our case even bio-degradable) substrate material. In particular, the gelatin substrate used in this work cannot withstand a temperature ≥100°C even for a short duration (curing of PDMS on gelatin leads to the formation of wrinkles in the substrates and eventually mechanical delamination). Furthermore, the gelatin substrate does not allow for the use of process chemicals such as PGMEA, photoresist, or typical etchants used for patterning of metals. However, the process we have established allows for reliable fabrication of the sensor units with device dimensions that match with the medical requirements.
3 Methods
Profilometry
Although PDMS is known to be among the best elastomers allowing for significant change of thickness if pressure is applied, we recognized that the use of a planar PDMS layers did not provide the required resolution for the pressure sensor. Therefore, we decided to work with a corrugated PDMS layer. It has been shown that the incorporation of air into the sensor by using microstructuring reduces the Young’s modulus and enables an easier deformation of the layer (Li et al., 2021). Hence, the corrugated PDMS is expected to have a higher degree of compressibility. To quantify the corrugation profiles, we use a Dektak 150 Profiler with a 5 µm tip and a contact pressure of 3 mg.
Physical Vapor Deposition
The metal electrodes are prepared using physical vapor deposition (PVD). The deposition takes place under high vacuum conditions with an operating pressure of 10–7 mbar. The layer thickness is monitored via a quartz crystal micro-balance (QCM).
Impedance Spectroscopy and Pressure Measurement
In this work, we determine the capacitance of the PDMS plate capacitor to quantify the pressure-induced thickness change of the PDMS. The capacitance of the device is obtained from an impedance spectroscopy analysis where the measured complex impedance is modelled by an R(RC) circuit (accounting for a finite sheet resistance and a leakage path thought the dielectric layer). The impedance is recorded in a four-point measurement configuration using a 4284 A Precision LCR meter in the frequency range from 1 kHz up to 10 MHz. Since the expected and then also measured capacities are in the lower pF-range, a metal box made of copper is used to shield influences from outside. From consecutive measurements of the capacitance under identical conditions, we determine the error of the capacitance measurement to be ≤0.1% (in the range above 100 kHz).
To measure the pressure response of the capacitor samples, an air-tight container is used and the pressure in the container can be set between -7.5 and +7.5 kPa using a precision pressure control system P2CS (Biophysical Tools GmbH, Germany) with a precision of 0.007% Full Scale Span. For each measurement step, the desired pressure is slowly approached and kept constant for 2 min. Then the capacitance is measured via impedance spectroscopy as described above with the copper shield box placed inside of the air-tight container.
4 Results
In general, capacitive pressure sensors are well known and exist in various designs. However, meeting the strict medical requirements of both, small size, and bio-compatibility is very challenging. In this section, the measured pressure response of different device types is presented. To reduce the experimental constraints, first, the principle function is demonstrated with a simplified sample structure on a glass substrate. Subsequently, the final layout with a much smaller active area is processed on top of a bio-compatible gelatin substrate.
To focus on the basic functionality of the pressure sensor, an initial capacitor device is fabricated on a 2.5 × 2.5 cm2 glass substrate using a crossbar structure of gold electrodes which sandwich a 25 µm thick PDMS dielectric. The resulting active area has a size of about A = 32 mm2 which is about five times as large as intended for the final device but helps to simplify the measurement since it increases the capacitance (C ∼ A).
Preliminary measurements revealed that closed, planar PDMS layers do not show any measurable pressure sensitivity. The reason might be that the untreated PDMS is too dense and rigid to show observable compression in the range of applied pressures. To test this hypothesis, the PDMS layer of the first prototype sample was structured (by simple scratching with a knife) providing more expansion space for the polymer. Indeed, this treatment lead to a drastically increased sensitivity. As depicted in Figure 4A, the measured capacitance (blue) clearly follows the applied pressure (black). capacitance changes of about 1% are induced within the pressure range of −7.5 kPa to +7.5 kPa at a frequency of 10 kHz. It has to be mentioned that for the last measurement steps, the pressure sensitivity seems to get worse and the under-pressure cannot be recorded exactly. An explanation might be that before—at the high-pressure conditions—the PDMS was compressed a lot and needs more time to relax or expand afterward.
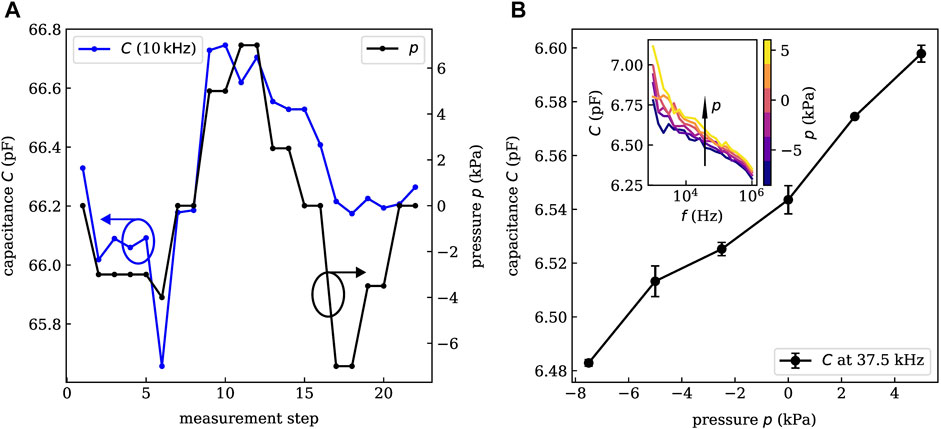
FIGURE 4. Experimental pressure-capacitance characteristics of an initial sample on glass (A) and a small area sample on gelatin (B). A linear relation between applied pressure and measured capacitance is shown over a large range of operation frequencies. Error bars in B are obtained from the comparison of consecutive measurements. For a specific sensor layout, we obtain similar pressure sensitivities. However, the absolute value of the capacitance might vary by 10–20% among equivalent devices. This derivation is caused by the formation of small gas bubbles in the PDMS during the transfer process. As they cover several percent of the active area, the capacitance of the devices varies.
Starting from the proof-of-principle device described above, the second generation of samples with sizes scaled down to an active area of about 5 mm2 and processed on bio-compatible gelatin substrates is developed. Also, a more controlled technique for structuring the PDMS as described in Section 2 is applied.
The capacitance characterization is carried out under the same conditions and with the same setup as described above. The resulting frequency-capacitance characteristics are shown in the inset of Figure 4B for external pressures in the range of −7.5–5.0 kPa. Again, a clear pressure dependence is observed over a large range of frequencies. In general, higher pressures lead to an increased capacitance. Especially, for larger frequencies (
Within this study about 20 sensors with three different electrode layouts have been investigated. The error bars in Figure 4B are obtained from the standard deviation of two consecutive measurements and show a small deviation only. By linear regression, we obtain a linearity of R2 = 0.977 which is decent for capacitive pressure sensors (Choi et al., 2020; Li et al., 2021). Hence, we conclude that the sensor does not show a significant hysteresis on the time-scale of the investigation. Whether long-term stability and hysteresis-free sensing is given cannot be concluded at this moment and should be target of subsequent investigations. At a pressure of +7.5 kPa, the device was destroyed which marks the upper limit of the operation range. The lowest applied pressure of −7.5 kPa did not harm the sensor. Hence, the required detection range of ±2–4 kPa is well covered. The sensor response time is not crucial parameter for the given application case since pressure changes in the mid-ear occur rather on time scales of several minutes or hours. Nevertheless, an upper limit can be estimated from the time between two pressure steps in the measurement which is about 2 min.
To finalize the sensor device, we combine the plate capacitor with a planar antenna structure which has been designed via finite element method simulations to possess a static inductance of 10 nH. Together, they form an LC-circuit that has a capacitance- and, hence, pressure-dependent response. These LC-circuits have been integrated with the process described above, including GSG-probes for ultra-high-frequency characterization using a vector network analyzer.
As depicted in Figure 5A, the bandwidth of the resonance can be tuned by the ohmic resistance R of the coil with smaller R (series resistance of the coil is defined by the thickness of the metal layers), yielding more narrow features. The wireless readout of the device can utilize a phase- or amplitude-modulated response. To illustrate the respective characteristics of the available sensors, the pressure-dependent phase- and amplitude-shift of the resonance is predicted in Figures 5B,C. Here, an ohmic resistance of R = 5 Ω is used, which is slightly lower than the experimentally determined values. Looking at the pressure-dependent phase shift in Figure 5B, a phase shift of approximately 12° is measured at the resonance frequency of 622.5 MHz (condition without additional pressure), which can be done conveniently using phase-sensitive detection schemes. However, also the resonance frequency fmax might be used directly, as it changes by more than 6 MHz over the investigated pressure range.
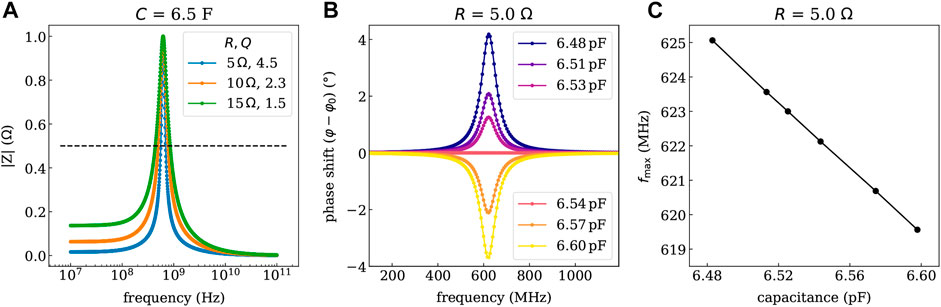
FIGURE 5. Impedance response simulated with Zview of the LC-circuit deposited on gelatin for different series resistance values of the planar coil (controllable by the thickness of the metal). (A) Shows the resonance curve of the magnitude of the impedance |Z| and the quality factors Q for the given series resistance values. (B) Shows the phase shift (in rad) referring to a phase angle φ0 of 45°at the resonance frequency fmax of 622.5 MHz determined for the condition without additional pressure. (C) Depicts the shift of the resonance frequency vs. the determined capacitance values. The capacitance values are linked to the pressure through the calibration curve shown in Figure 4B.
However, it should be noted that there is still plenty of room for improvement in the future. In particular, it is crucial to increase the quality factor of the LC-circuit as it mainly determines the quality of the readout. Reducing the series resistance of the coil by increasing the metal thickness seems to be the most direct way. However, this step would require the development of more suitable metal deposition techniques as the vapor phase deposition used in this work is limited to a layer thickness of ≤300 nm. Furthermore, it is crucial to further improve the pressure sensitivity of the capacitor. This goal could be achieved by increasing the depth of the corrugation profile of the PDMS. In principle, deeper profiles could be obtained by choosing a thicker stamp. However, there is a trade-off as the stability of the PDMS film during transfer to the gelatin substrate depends on the ratio of the PDMS thickness to the depth of the corrugation profile. This ratio needs to be carefully optimized to increase the sensitivity of the sensor further.
5 Conclusion
A pressure-sensitive device is developed which solves the most important difficulties for incorporating it in the human middle ear in the future. On one hand, it is bio-compatible and on the other hand, it has only a total size of 2 × 4 mm2, which would make it fit into the middle ear. To characterize the sensor, the capacitance-pressure-correlation is tested in a large frequency range from 1 kHz up to 1 MHz. The measurement shows a clear response of the sensor’s capacitance for applied pressures especially, and we obtain a change in the capacitance of 2% in the investigated pressure range. The sensitivity S of the sensor is determined from the slope of the relative capacitance changes (C − C0)/C0 by performing linear regression. Here, C0 is the capacitance at the smallest pressure. With the current device, a value of about S = 0.002 kPa−1 is achieved, which is already sufficient to differentiate the pressures typically occurring in the human middle ear. Compared to state-of-the-art capacitive sensors, the obtained sensitivity value is rather in the range of bare PDMS (Li et al., 2021). A reason might be that the depth of the structuring profile is only about 1% of the total PDMS layer thickness. By using a thinner dielectric layer and stamps with increased profile depth, it should be possible to distinctly improve the capacitor performance. Furthermore, by applying more sophisticated microstructuring methods or using a porous dielectric layer (Li et al., 2021), much higher sensitivities are in reach. It has to be pointed out that some of the established approaches like utilizing composite dielectric layers are not applicable due to the requisite of bio-compatibility.
Taking the measure values for the capacitance, coil inductance, and series resistance, we can estimate the expected phase/resonance frequency shift of the sensor system. The obtained results suggest that the pressure changes occurring in the middle ear could be detected using established RF-field detection techniques.
Data Availability Statement
The original contributions presented in the study are included in the article. Further inquiries can be directed to the corresponding authors.
Author Contributions
KL, TZ, MN, and HK had the idea for the project. KH supervised the design of the bio-compatible substrate. DF provided and prepared the bio-degradable substrates. SS contributed in preparing the samples. TL and KM did the experiments and wrote the manuscript. All authors revised the manuscript and approved the submitted version.
Funding
The authors received funding from the Else-Kröner-Fresenius-Center for Digital Health (EKFZ) for the project “PITROS”.
Conflict of Interest
The authors declare that the research was conducted in the absence of any commercial or financial relationships that could be construed as a potential conflict of interest.
Publisher’s Note
All claims expressed in this article are solely those of the authors and do not necessarily represent those of their affiliated organizations, or those of the publisher, the editors and the reviewers. Any product that may be evaluated in this article, or claim that may be made by its manufacturer, is not guaranteed or endorsed by the publisher.
References
Aewsiri, T., Benjakul, S., Visessanguan, W., Wierenga, P. A., and Gruppen, H. (2010). Antioxidative Activity and Emulsifying Properties of Cuttlefish Skin Gelatin-Tannic Acid Complex as Influenced by Types of Interaction. Innovative Food Sci. Emerging Tech. 11 (4), 712–720. doi:10.1016/j.ifset.2010.04.001
Bai, L., Elósegui, C. G., Li, W., Yu, P., Fei, J., and Mao, L. (2019). Biological Applications of Organic Electrochemical Transistors: Electrochemical Biosensors and Electrophysiology Recording. Front. Chem. 7, 313. doi:10.3389/fchem.2019.00313
Boutry, C. M., Kaizawa, Y., Schroeder, B. C., Chortos, A., Legrand, A., Wang, Z., et al. (2018). A Stretchable and Biodegradable Strain and Pressure Sensor for Orthopaedic Application. Nat. Electron. 1 (5), 314–321. doi:10.1038/s41928-018-0071-7
Choi, H. B., Oh, J., Kim, Y., Pyatykh, M., Chang Yang, J., Ryu, S., et al. (2020). Transparent Pressure Sensor with High Linearity over a Wide Pressure Range for 3D Touch Screen Applications. ACS Appl. Mater. Inter. 12 (14), 16691–16699. doi:10.1021/acsami.0c00267
Gaihede, M., Dirckx, J. J. J., Jacobsen, H., Aernouts, J., Søvsø, M., Tveterås, K., et al. (2010). Middle Ear Pressure Regulation-Complementary Active Actions of the Mastoid and the Eustachian Tube. Otology & Neurotology 31 (4), 603–611. doi:10.1097/mao.0b013e3181dd13e2
Hwang, J., Kim, Y., Yang, H., and Oh, J. H. (2021). Fabrication of Hierarchically Porous Structured PDMS Composites and Their Application as a Flexible Capacitive Pressure Sensor. Composites B: Eng. 211, 108607. doi:10.1016/j.compositesb.2021.108607
Irimia-Vladu, M. (2014). “Green” Electronics: Biodegradable and Biocompatible Materials and Devices for Sustainable Future. Chem. Soc. Rev. 43 (2), 588–610. doi:10.1039/c3cs60235d
Jacobsen, H., Joris, J., Dirckx, J., Gaihede, M., and Tveterås, K. (2007). “Direct Measurements and Monitoring of Middle Ear Pressure,” in Middle Ear Mechanics in Research and Otology. Editors A. Huber, and E. Albrecht (Singapore: World Scientific Publishing), 26–35.
Jung, Y., Lee, W., Jung, K., Park, B., Park, J., Ko, J., et al. (2020). A Highly Sensitive and Flexible Capacitive Pressure Sensor Based on a Porous Three-Dimensional PDMS/Microsphere Composite. Polymers (Basel) 12 (6), 1412. doi:10.3390/polym12061412
Keene, S. T., Lubrano, C., Kazemzadeh, S., Melianas, A., Tuchman, Y., Polino, G., et al. (2020). A Biohybrid Synapse with Neurotransmitter-Mediated Plasticity. Nat. Mater. 19, 969–973. doi:10.1038/s41563-020-0703-y
Kou, H., Zhang, L., Tan, Q., Liu, G., Dong, H., Zhang, W., et al. (2019). Wireless Wide-Range Pressure Sensor Based on Graphene/PDMS Sponge for Tactile Monitoring. Sci. Rep. 9 (1), 3916. doi:10.1038/s41598-019-40828-8
Lee, H., Lee, Y., Song, C., Cho, H. R., Ghaffari, R., Choi, T. K., et al. (2015). An Endoscope with Integrated Transparent Bioelectronics and Theranostic Nanoparticles for colon Cancer Treatment. Nat. Commun. 6 (1), 10059. doi:10.1038/ncomms10059
Lei, K. F., Lee, K.-F., and Lee, M.-Y. (2012). Development of a Flexible PDMS Capacitive Pressure Sensor for Plantar Pressure Measurement. Microelectronic Eng. 99, 1–5. doi:10.1016/j.mee.2012.06.005
Li, R., Zhou, Q., Bi, Y., Cao, S., Xia, X., Yang, A., et al. (2021). Research Progress of Flexible Capacitive Pressure Sensor for Sensitivity Enhancement Approaches. Sensors Actuators A: Phys. 321, 112425. doi:10.1016/j.sna.2020.112425
Lidén, G., Peterson, J. L., and Bjorkman, G. (1970). Tympanometry. Arch. Otolaryngol. - Head Neck Surg. 92 (3), 248–257. doi:10.1001/archotol.1970.04310030038009
MacDonald, W. A., Looney, M. K., MacKerron, D., Eveson, R., Adam, R., Hashimoto, K., et al. (2007). Latest Advances in Substrates for Flexible Electronics. J. Soc. Inf. Display 15 (12), 1075–1083. doi:10.1889/1.2825093
Magnuson, B. (1981). On the Origin of the High Negative Pressure in the Middle Ear Space. Am. J. Otolaryngol. 2 (1), 1–12. doi:10.1016/s0196-0709(81)80002-6
Minev, I. R., Musienko, P., Hirsch, A., Barraud, Q., Wenger, N., Moraud, E. M., et al. (2015). Electronic Dura Mater for Long-Term Multimodal Neural Interfaces. Science 347 (6218), 159–163. doi:10.1126/science.1260318
Müller, C., Zahnert, T., Ossmann, S., Neudert, M., and Bornitz, M. (2019). Vibroplasty Combined with Tympanic Membrane Reconstruction in Middle Ear Ventilation Disorders. Hearing Res. 378, 166–175. doi:10.1016/j.heares.2019.02.012
Schünke, M., Schulte, E., Schumacher, U., Voll, M., and Wesker, K. (2018). “5.1 ohr (auris): Übersicht und blutversorgung des äußeren ohrs (auris externa),” in Prometheus LernAtlas - Kopf, Hals und Neuroanatomie. Editors M. Schünke, E. Schulte, U. Schumacher, M. Voll, and K. Wesker (Stuttgart: Thieme).
Someya, T., Bao, Z., and Malliaras, G. G. (2016). The Rise of Plastic Bioelectronics. Nature 540 (7633), 379–385. doi:10.1038/nature21004
Takahashi, H., Sato, H., Nakamura, H., Naito, Y., and Umeki, H. (2007). Correlation between Middle-Ear Pressure-Regulation Functions and Outcome of Type-I Tympanoplasty. Auris Nasus Larynx 34 (2), 173–176. doi:10.1016/j.anl.2006.09.007
Tideholm, B., Carlborg, B., Jönsson, S., and Bylander-Groth, A. (1998). Continuous Long-Term Measurements of the Middle Ear Pressure in Subjects without a History of Ear Disease. Acta Oto-Laryngologica 118 (3), 369–374. doi:10.1080/00016489850183458
Torricelli, F., Adrahtas, D. Z., Bao, Z., Berggren, M., Biscarini, F., Bonfiglio, A., et al. (2021). Electrolyte-gated Transistors for Enhanced Performance Bioelectronics. Nat. Rev. Methods Primers 1 (1), 66. doi:10.1038/s43586-021-00065-8
Troels, R., and Lee, S. (2014). Influence of Temperature on the Frictional Properties of Water-Lubricated Surfaces. Lubricants 2 (4), 177–192. doi:10.3390/lubricants2040177
Tseng, H., Cucchi, M., Weissbach, A., Leo, K., and Kleemann, H. (2021). Membrane-free, Selective Ion Sensing by Combining Organic Electrochemical Transistors and Impedance Analysis of Ionic Diffusion. ACS Appl. Electron. Mater. 3 (9), 3898–3903. doi:10.1021/acsaelm.1c00486
Zhang, X., Do, M. D., Casey, P., Sulistio, A., Qiao, G. G., Lundin, L., et al. (2010). Chemical Modification of Gelatin by a Natural Phenolic Cross-Linker, Tannic Acid. J. Agric. Food Chem. 58 (11), 6809–6815. doi:10.1021/jf1004226
Keywords: bio-compatible, pressure sensor, PDMS, elastic polymer, hypotension, middle ear, bio-degradable substrate
Citation: Mosshammer K, Lüdke T, Spitzner S, Firzlaff D, Harre K, Kleemann H, Neudert M, Zahnert T and Leo K (2021) Bio-Compatible Sensor for Middle Ear Pressure Monitoring on a Bio-Degradable Substrate. Front. Electron. 2:802356. doi: 10.3389/felec.2021.802356
Received: 26 October 2021; Accepted: 02 December 2021;
Published: 24 December 2021.
Edited by:
Sandeep G. Surya, Dyson, United KingdomReviewed by:
Nazek El-Atab, King Abdullah University of Science and Technology, Saudi ArabiaKarumbaiah Chappanda Nanaiah, Birla Institute of Technology and Science, India
Mikhail Basov, Dukhov Automatics Research Institute, Russia
Copyright © 2021 Mosshammer, Lüdke, Spitzner, Firzlaff, Harre, Kleemann, Neudert, Zahnert and Leo. This is an open-access article distributed under the terms of the Creative Commons Attribution License (CC BY). The use, distribution or reproduction in other forums is permitted, provided the original author(s) and the copyright owner(s) are credited and that the original publication in this journal is cited, in accordance with accepted academic practice. No use, distribution or reproduction is permitted which does not comply with these terms.
*Correspondence: Klara Mosshammer, klara.mosshammer@tu-dresden.de; Theresa Lüdke, Theresa.luedke@uniklinikium-dresden.de