Comparative analysis of students’ emotional and motivational profiles in mathematics in grades 1–6
 Vanessa Hanin
 Philippe Gay
- 1Faculty of Psychology and Educational Sciences, Université Catholique de Louvain, Louvain-la-Neuve, Belgium
- 2Haute École Pédagogique du Canton de Vaud, Lausanne, Switzerland
Introduction: Mathematics continues to be a real stumbling block for many low-performing students. Research over the past decades has highlighted the joint and determining effects of emotions and motivation on learning and performance in mathematics and has shown an increase in negative emotions over the course of schooling. Inter-individual emotional differences and increasing classroom heterogeneity necessitate profile analysis that focuses on particular combinations of variables as they exist within groups of individuals.
Methods: The purpose of this cross-sectional research is twofold: (1) to identify the emotional profiles of 1,505 elementary school students (ages 6–12) in mathematics, and (2) to document, on the basis of expectancy-value theory, how these profiles differ in terms of beliefs about competence, perceived value, and performance.
Results: The results highlighted two profiles over the 6 years: positive and negative. Three other profiles were observed repeatedly throughout schooling: the anxious, the self-esteem focused, and the emotionally disengaged.
Discussion: Three pivotal years emerged from the analyses: the first year (transition to a more formal type of teaching), the third year (enculturation in normative evaluation practices and social comparison) and the final year (centering of learning around the external certification test). In terms of the dependent variables, the tendency of young children to overestimate their competences attenuates their negative emotions and the undesirable effects of these in terms of learning. Anxious and full-negative profiles performed the poorest and placed less value on mathematical learning. These findings indicate that interventions addressing the specific needs of each age and profile are needed.
Introduction
Recent national and international tests among secondary school students have reported poor academic performance, particularly in mathematics (Lajoie and Bednarz, 2014; Tzohar-Rozen and Kramarski, 2017; Organisation for Economic Co-operation and Development, 2018; van den Berg et al., 2018) and peaks of math anxiety at the beginning of the first grade or just around 7 years old (Szczygieł and Pieronkiewicz, 2022). Researchers have also identified problematic attitudes and motivation, such as a lack of interest in school and avoidance of achievement, beginning in primary school (Vierhaus et al., 2016). These behaviors have twofold consequences. On the one hand, they jeopardize students’ continuation of their school career and their professional aspirations (Wieselmann et al., 2020) along with their self-esteem (Coelho et al., 2017); on the other hand, the cost of early school dropout is deep, impacting economic sustainability, social stability, and the wealth and health of individuals throughout their lives (Organisation for Economic Co-operation and Development, 2015; Beswick et al., 2019).
Previous approaches addressing academic difficulties have focused on developing cognitive and metacognitive strategies. However, accumulating evidence, collected over the past decades, has indicated profound effects of achievement emotions on (1) students’ learning and achievement over and above the effects of cognitive abilities, prior achievement or demographic variables (Pinxten et al., 2014; Pekrun et al., 2017) and (2) their motivation and wellbeing (Raccanello et al., 2019). These results have turned the perspective of educational psychologists more toward emotional and not just cognitive aspects of learning and achievement. Additionally, the literature is unanimous on the fact that pleasant emotional experiences decline and unpleasant emotions increase throughout the school years (Jacobs et al., 2002; Muenks et al., 2018; Jindal-Snape et al., 2020). While the primary-secondary transition is especially salient in these curves, a recent study (Hanin and Van Nieuwenhoven, 2019) has suggested the existence of another pivotal moment earlier in the school career. That study showed that even in fifth and sixth grade, almost half of the students already displayed an at-risk emotional profile in mathematics. When and how this emotional shift takes place still remains unanswered. And yet, identifying the mechanisms related to this pivotal moment is essential if we wish to strike at its roots of this problem.
Therefore, the aim of the present paper is to expand the existing knowledge in two ways. First, it will distinguish subgroups of elementary students (Grades 1 to 6; 6–12 years old) having specific combinations of emotions regarding mathematics tasks. This characterization of students’ emotional relationship to mathematics from Grade 1 to Grade 6 aims to identify pivotal moments in the primary schooling. In order to take into account inter-individual differences regarding the emotional profiles with which students tackle mathematics tasks and thereby to assess students’ needs more accurately as well as in a more personalized way, we will adopt a profile analysis, that is, a focus on particular combinations of variables as they exist within groups of individuals (Hayenga and Corpus, 2010). Second, we will explore how these distinct subgroups differ regarding perceived competence, perceived value, emotion regulation and problem-solving (PS) performance. In this vein, we will use Pekrun’s (2006) control-value theory (CVT) of achievement emotions, acknowledged as one of the most comprehensive theoretical frameworks outlining the role played by the emotions in learning processes, with a direct relationship between emotional and motivational constructs.
Two rationales guided our decision to focus specifically on mathematical PS tasks (PST). On the one hand, we wanted to align with studies highlighting the domain (e.g., mathematics, languages) and subdomain (e.g., algebra, geometry; grammar, literature) specificity of achievement emotions and of their antecedents (Wu et al., 2012; Justicia-Galiano et al., 2017). On the other hand, we wanted to contribute to the seminal work that has been done during the last few decades in response to observation of the difficulties with PST encountered by both learners and teachers (Depaepe et al., 2015; Tzohar-Rozen and Kramarski, 2017; Hanin and Van Nieuwenhoven, 2019, 2020).
In the following section, we specify the constructs used in this study in relation to the CVT core propositions, as well as the extant evidence and our hypotheses.
Control and value appraisals, achievement emotions, emotion regulation, and performance
Antecedents of achievement emotions–control and value appraisals
As the main theoretical background for this research, Figure 1 presents control-value theory (CVT; Pekrun, 2006; Pekrun and Perry, 2014). Empirical studies that have tested CVT’s core tenets have showed that control and value appraisals are the closest determinants of students’ achievement emotions (Peixoto et al., 2017; Putwain et al., 2021).
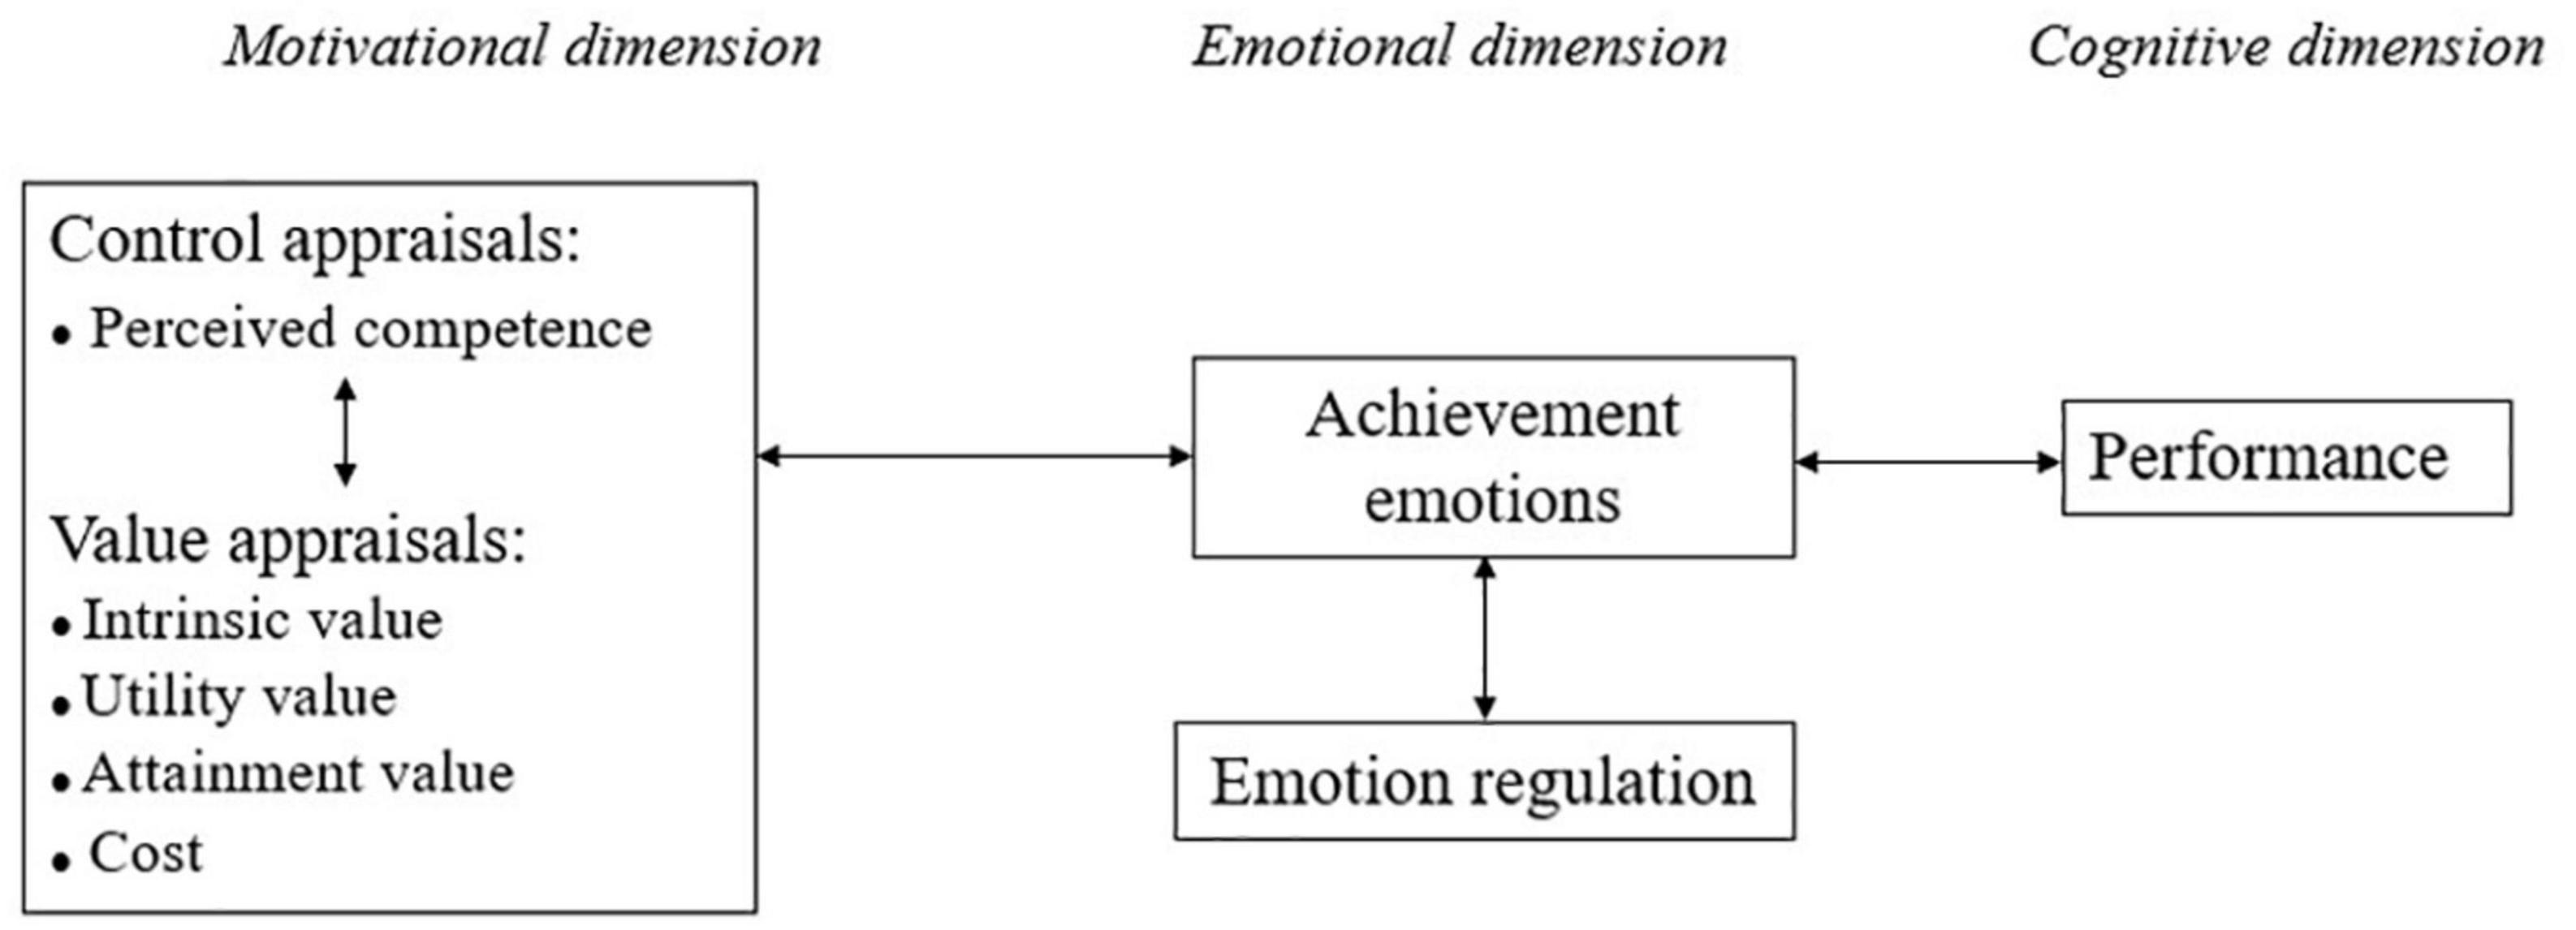
Figure 1. A simplified version of the control-value theory of achievement emotions, with the studied variables.
Control appraisals, defined as students’ beliefs in personal agency over actions and outcomes, include the following constructs: causal attributions, outcome expectancy, perceived competence and self-concept (Pekrun, 2006). Among them, perceived competence appears to be the most decisive in shaping the learner’s emotions in mathematics (Hanin and Van Nieuwenhoven, 2020). Building on Bandura’s (1997) social cognitive theory, perceived competence is conceptualized in CVT as an individual’s judgment of his/her personal ability to organize and execute a course of action in order to attain a specific goal. Like many scholars, we consider that when assessed at the task-specific level, perceived competence and self-efficacy belief reflect the same reality (Valentine et al., 2004; Bouffard and Vezeau, 2010; Ahmed et al., 2012).
Value appraisals reflects the subjective importance of learning activities and outcomes (Pekrun, 2006; Pekrun and Perry, 2014). Expectancy-value theory (EVT; Wigfield and Eccles, 1992, 2020), one of the bases of CVT, distinguishes four value components: (1) Intrinsic value refers to the enjoyment a person derives from engaging in a task, and has been associated with individual interest; (2) Utility value designates the perceived usefulness of engaging in a task, for both short- and long-term goals; (3) Attainment value specifies the importance a person attaches to doing well on a given task and is linked to the relevance of the task for their identity; (4) Cost refers to the perception of negative consequences of engaging in a task. Recent exploratory and confirmatory analyzes (conducted so far with secondary school students) have confirmed that several facets of each of these value components can be empirically distinguished (Gaspard et al., 2017; Fadda et al., 2020). Specifically, attainment value can be divided into the importance of achievement and personal importance, utility value can be separated into facets tapping different life domains (i.e., utility for school/job, utility for life, social utility) and cost can be differentiated into effort required, emotional cost, and opportunity cost. However, this structure has not been confirmed with a younger population, and most studies use a four-factor structure for value beliefs.
Achievement emotions
Control-value theory defines achievement emotions as emotions that are directly related to achievement activities or their outcomes (Pekrun, 2006; Pekrun and Perry, 2014). They can be characterized by three dimensions: (1) object focus (on the ongoing activities vs. on the resulting outcomes, these being subdivided into prospective vs. retrospective emotions), (2) valence (positive vs. negative), and (3) degree of physiological activation (activating vs. deactivating). Based on the last two dimensions, four groups of achievement emotions can be distinguished: positive activating emotions (e.g., enjoyment), positive deactivating emotions (e.g., relief), negative activating emotions (e.g., anger), and negative deactivating emotions (e.g., boredom). Among each group, one can distinguish emotions that are elicited from recalling a past activity or its outcome (e.g., pride, shame, sadness, anger), emotions related to future activities and outcomes (e.g., fear, nervousness) and emotions aroused from an activity one is currently undertaking (e.g., enjoyment, boredom, and anger). Despite the importance of achievement emotions in learning and academic success, only a few studies have addressed elementary school students’ emotional experiences (Raccanello et al., 2019). We wished to portray emotional profiles in as nuanced and complete a way as possible while also ensuring that the emotions assessed were distinguishable by first graders. Therefore, on the basis of the few existing studies available for this age (Lichtenfeld et al., 2012; Kwon et al., 2017; Raccanello et al., 2019), we assessed eight achievement emotions: two activating positive emotions (enjoyment, pride), four negative activating emotions (anger, fear, nervousness, and shame), and two negative deactivating emotions (sadness, boredom).
Regarding relations between achievement emotions and their antecedents, CVT posits that positive achievement emotions result from high levels of perceived competence and positive value, while negative achievement emotions are a joint function of perceived lack of competence and high value (Pekrun and Perry, 2014). The exception is boredom, which can be due both to low levels (over-challenge) or high levels (under-challenge) of perceived competence and lack of value (Pekrun et al., 2010, 2014). Cross-sectional and longitudinal evidence corroborating the core assumptions of CVT in the domain of mathematics is scarce for elementary school students. The few existing studies suggest that high level of perceived competence and positive value are related positively to primary school students’ positive emotions and negatively to their negative emotions (Lichtenfeld et al., 2012; Putwain et al., 2018; Forsblom et al., 2022). As for boredom, it appears that elementary school students’ perceived competence in mathematics is negatively associated with their level of boredom (Lichtenfeld et al., 2012; Putwain et al., 2018).
Achievement emotions and emotion regulation
Since students’ emotions are central to learning, achievement and wellbeing, it is important to support adaptive achievement emotions (Lichtenfeld et al., 2012; Putwain et al., 2018; Forsblom et al., 2022). The most common and appropriate mechanism for doing so is emotion regulation (Vierhaus et al., 2016; Harley et al., 2019; Putwain et al., 2021) characterized as a heterogeneous set of strategies used to influence the occurrence, duration, and intensity of positive and negative emotions (Gross, 1998; Gross and Thompson, 2007). Goetz and Bieg (2016) proposed an extension of CVT including emotion regulation. However, researchers have highlighted distinct emotion-regulation strategies, and specific strategies have been investigated mainly with students older than primary school children (Harley et al., 2019; Raccanello et al., 2019). In a previous study addressing this gap, we identified six emotion regulation strategies used by upper elementary students when solving math problems, based on three theoretical models (see Hanin et al., 2017). These strategies include negative self-talk, dysfunctional avoidance, emotion expression, task-utility self-persuasion, help seeking, and brief attentional relaxation. While findings have generally converged to affirm that the first two strategies are maladaptive per se (Garnefski et al., 2006; Nolen-Hoeksema et al., 2008; Mikolajczak and Desseilles, 2012), this is not the case for the other four strategies. In this connection, recent research conducted with undergraduate and secondary school students has shown that emotion-regulation strategies are not per se adaptive or maladaptive, but rather that this depends on the context, the frequency and intensity of use, the pattern of strategies used, and individual characteristics (Schmidt et al., 2010; Ben-Eliyahu and Linnenbrink-Garcia, 2013; Harley et al., 2019).
The relation between emotion regulation and achievement emotions has mainly been investigated with secondary school and university students, only rarely with elementary school children (Harley et al., 2019; Raccanello et al., 2019). For instance, with undergraduates, Ben-Eliyahu and Linnenbrink-Garcia (2013) found positive associations between reappraisal and positive emotions in both favorite and least favorite courses, and the opposite relations for unpleasant emotions, but in favorite courses only. Further, rumination was found to correlate positively with negative emotions across contexts and negatively with positive emotions in the least favorite course only. Schmidt et al. (2010) observed with regard to high school students’ upcoming final exam that anxiety and fear negatively predicted distancing and positively predicted problem-focused strategies and seeking social support. Frustration and powerlessness were found to positively influence distancing and seeking social support. Lastly, positive emotions positively predicted reappraisal, problem-focused strategies, and seeking social support. The few studies involving elementary school students include one conducted by Vierhaus et al. (2016) that showed that an increase in enjoyment was accompanied by an increase in adaptive regulation strategies, and an increase in boredom went together with an increase in maladaptive strategies in the context of general stressful academic situations. As we can see, the few existing studies have provided inconsistent results on this matter. The literature agrees on one point, that is, the complexity of the relation between emotion-regulation strategies and achievement emotions, which depends on both situational characteristics (e.g., object focus, time frames, high or low evaluative nature of the situation), and individual specifics (e.g., appraisals of value and control, gender, age; Jacobs and Gross, 2014; Harley et al., 2019).
Achievement emotions and mathematics performance
Control-value theory states that the relation between achievement emotions and “actual” performance is mediated by several motivational, cognitive and self-regulatory processes such as cognitive resources, motivation to learn, use of learning strategies, and self-regulation of learning (Pekrun, 2006; Pekrun and Perry, 2014). Positive activating emotions are assumed to be positively related with students’ academic performance by improving intrinsic motivation, focus on learning, deep learning, and self-regulation while conserving cognitive resources (Pekrun, 2006; Pekrun et al., 2011). Conversely, negative deactivating emotions are expected to harm academic performance by causing mind-wandering, lowering intrinsic and extrinsic motivation, and promoting shallow information processing and external regulation (Pekrun, 2006; Pekrun et al., 2011). Achievement effects for negative activating emotions are seen to be more complex and variable. On the one hand, they can prompt task-irrelevant thinking (through rumination, for instance), which leads to a reduction of cognitive resources available for the task at hand. They can also undermine intrinsic motivation to learn. On the other hand, negative activating emotions can stimulate extrinsic motivation to invest effort to overcome difficulties and avoid failure (Pekrun et al., 2011). Consistent with CVT, cross-sectional research has (1) shown that positive emotions are positively related to mathematics performance in primary school students and (2) highlighted the opposite relation for negative emotions, as well as for boredom (Lichtenfeld et al., 2012; Raccanello et al., 2019).
Research questions
Although the research conducted so far has produced important insights into the relations between achievement emotions and learning processes, none of it has looked at their complex combinations and the way these relate to their appraisal-based antecedents (i.e., perceived competence and perceived value). There is also a lack of research regarding emotion regulation and mathematics performance throughout (1) elementary education, and (2) profile analysis. The few studies that have examined the links between these constructs have done so using a variable-centered approach. While the latter approach takes the variables under study as the focal point, the profile analysis focuses on particular combinations of variables as they exist within groups of individuals (Hayenga and Corpus, 2010), allowing the growing heterogeneity of students to be taken into account. This perspective is of particular importance for both educational theorists and practitioners. At the conceptual level, a profile analysis reflects students’ diversity in a more comprehensive way, while at the practical level, it allows for a more accurate and personalized assessment of students’ needs and, thereby, tailoring of educational interventions accordingly.
The only study we are aware of that has looked at the emotional profiles of primary school students in a mathematics context from a profile analysis is the one conducted by Hanin and Van Nieuwenhoven (2019). More precisely, in our previous work, we identified four distinct emotional profiles among upper elementary students: those with high levels of positive emotions and low levels of negative emotions (the positive; 51.1%); those with high levels of boredom and low levels of the other emotions (the bored; 21.5%); those with high levels of nervousness, worry, and fear and low levels of positive emotions (the anxious; 15.8%); and those with high levels of negative emotions and low levels of positive emotions (the resigned; 11.6%). Analyses of variance showed first that the first profile stood out advantageously from the last two regarding mathematics performance and perceived competence. Second, regarding emotion-regulation strategies, upper elementary students, whatever their emotional profile, asked for teacher or peer assistance at a similar frequency. Third, the positive profile reported a significantly lower use of brief attentional relaxation than did the other three profiles. Fourth, the bored profile resorted significantly less to the task-utility self-persuasion strategy as compared to the three other profiles. Coupled with a below-average level of enjoyment, this means that there was an absolute absence of value ascribed to mathematics tasks. Fifth, the positive profile displayed significantly lower levels of emotion expression compared to the three other groups. Sixth, the resigned profile resorted substantially more and the positive profile significantly less to the self-talk strategy than the two other profiles. Finally, with respect to the dysfunctional avoidance strategy, the resigned profile relied on it to a greater extent than the positive profile.
The present study extends the previous one and, therefore, aims to overcome some of the limitations of the extant literature by addressing the following two research questions:
– Can meaningful distinct subgroups of elementary problem-solvers with specific combinations of achievement emotions be identified? More precisely, how do students, throughout primary education, combine those emotions into a personal position?
– Do these distinct subgroups differ regarding perceived competence, perceived value, emotion regulation and PS performance?
Considering that no study to our knowledge has attempted such a cluster analysis, our predictions are speculative. Based on previous findings revealing that young children do not discriminate as many achievement emotions as their older peers, we expect to find three distinct groups of students: (1) those presenting a disadvantageous profile, who would feel mainly negative emotions; (2) those with an advantageous profile, who would experience predominantly positive emotions; and (3) those halfway between the two previous profiles, who would have an ambivalent or mixed emotional relationship to complex mathematics tasks. Further, based on the literature reviewed above, we anticipated, on the one hand, that the disadvantageous and the ambivalent profiles would be less and less favorable to learning and achievement as the learner progress throughout schooling and, on the other hand, that the proportion of students with an at-risk profile would increase from year to year. With regard to our second research question, building on previous work, we postulated that the students with an advantageous profile would score favorably on motivational, emotional and performance indicators, in contrast to students with a disadvantageous profile. As for the ambivalent profile, according to their emotional pattern, we expect them to be positioned favorably on certain indicators. For instance, high levels of fear, nervousness and anger are assumed to trigger extrinsic motivation and therefore to be associated with high levels of utility value and importance of achievement, but at the same time to encourage rumination, that is, the use of maladaptive emotion-regulation strategies. In contrast, high levels of sadness and shame are expected to undermine every form of motivation and to greatly weaken the learner’s perceived competence.
Materials and methods
Sample and procedure
The study involved 1,505 students in Grades 1 through 6 from eight different schools in the French-speaking part of Belgium (Table 1). The sample represented a wide range of students in terms of socioeconomic background (see the section “Measures”). In line with Leiss et al.’s (2010) findings, students with significant reading difficulties were excluded from the data analysis; these included four Grade 1 children scoring 2 standard deviations below the mean on the Reading and Spelling Assessment Battery (BELO, George and Pech-Georgel, 2012) and three students in Grades 3 and 6 scoring 2 standard deviations below the mean on Lobrot’s Lecture 3 reading test (Lobrot, 1967). Students who were absent during data collection completed the PST and the self-report scales once back in class, so that no students were removed from the study. The respondents were solicited by their teacher to complete the questionnaires during their math class. The problem-solving task (PST) was given first, so that students could respond to the self-report questionnaires with the same examples of problems in mind. However, we are interested here in the typical emotional and motivational states repeatedly experienced by the students in the specific situation of PST.
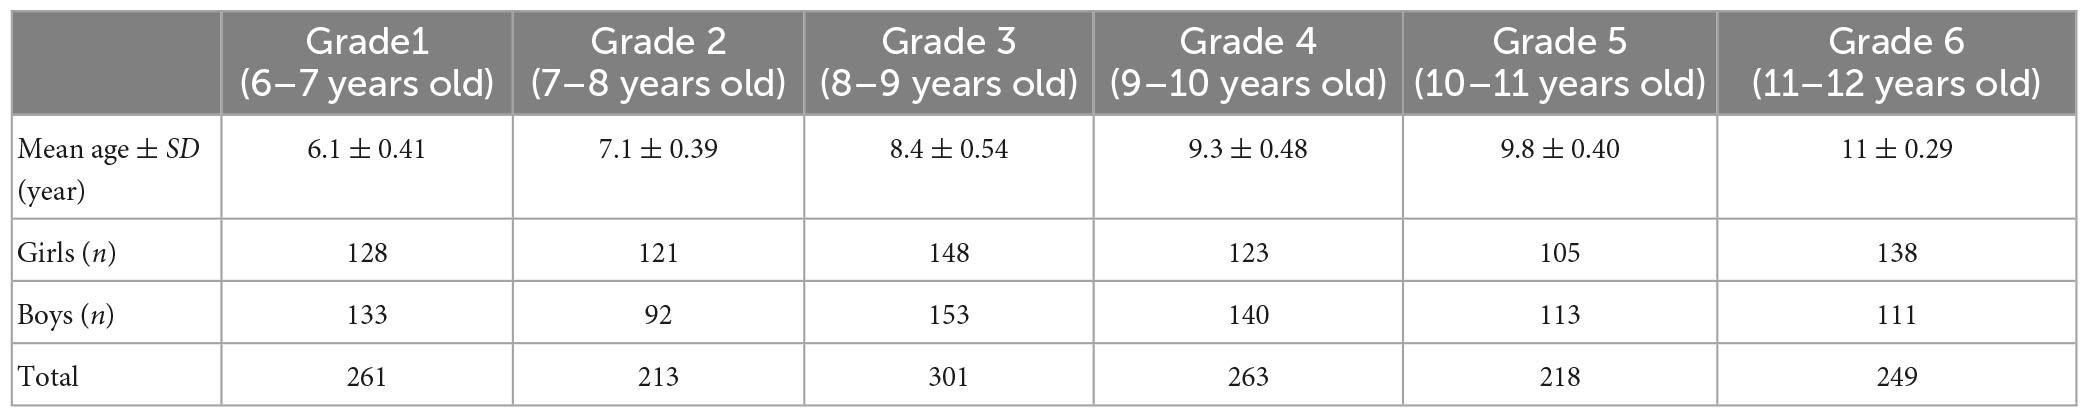
Table 1. Distribution of elementary school students by Grade.
After ensuring the confidentiality of the data (on both the problem-solving task and the self-report questionnaires), items were read aloud by the teacher and students were encouraged to follow along instead of working ahead. They were invited to express themselves if they did not understand an item.
Measures
In order to perform a comparative analysis of the emerging profiles over the 6 years of elementary education, we used the same questionnaires for the entire sample. Adaptations were therefore made in order to tailor the initial instruments to the cognitive and language ability levels of the youngest children. It should also be noted that, prior to large-scale use, all questionnaires were submitted to six pilot samples in order to check for understandability and clarity. In addition, as recommended by several researchers, we adapted the Likert-scale formats of the questionnaires for the youngest (i.e., Grades 1 and 2) to ensure that their answers accurately reflected their judgments and attitudes (Rubie-Davies and Hattie, 2012; Mellor and Moore, 2014).
Perceived problem-solving competence was assessed through seven items adapted for the use of younger student, and adapted to the context of math problem solving from Boekaerts’ (2002) Online Motivation Questionnaire and translated into French according to translation-back translation procedures (Gudmundsson, 2009). The internal consistency was satisfactory in all grades’ sub-samples (Grade 1: α = 0.72; Grade 2: α = 0.75; Grade 3: α = 0.84; Grade 4: α = 0.84; Grade 5: α = 0.89; Grade 6: α = 0.89). The items used a 3-point response scale (e.g., “If you were to rank all of the students in your class from worst to best in solving math problems, where would you fit in?”) for the first and second grades (e.g., 1 = in the worst, 2 = in the good ones, 3 = in the best) and on a 4-point response scale for the older ones (1 = as one of the worst, 2 = at the beginning of the bad ones, 3 = at the beginning of the best ones, 4 = as one of the best).
Perceived value for the domain of mathematics was measured with a French version of the value scale for mathematics (Gaspard et al., 2015), adapted for the present study following translation-back translation procedures. The original instrument captured the multidimensionality of value beliefs as conceptualized by Gaspard et al. (2015) through a nine-factor structure: intrinsic value, importance of achievement, personal importance, utility for school, utility for life, social utility, effort required, opportunity cost and emotional cost. According to exploratory factor analyses, in the present study a four-factor solution (explaining 54.4% of the total variance) suited the data best: (1) intrinsic value, (2) global utility (combination of utility for school and utility for daily life), (3) importance of achievement, and (4) effort required and emotional cost. This structure indicated that elementary school students do not discriminate the value components as finely as did their high school peers. The 21 items used a binary response scale in Grades 1 and 2 and a 4-point Likert scale ranging from completely disagree to completely agree in Grades 3 through 6. Sample items and reliabilities are reported in Table 2.
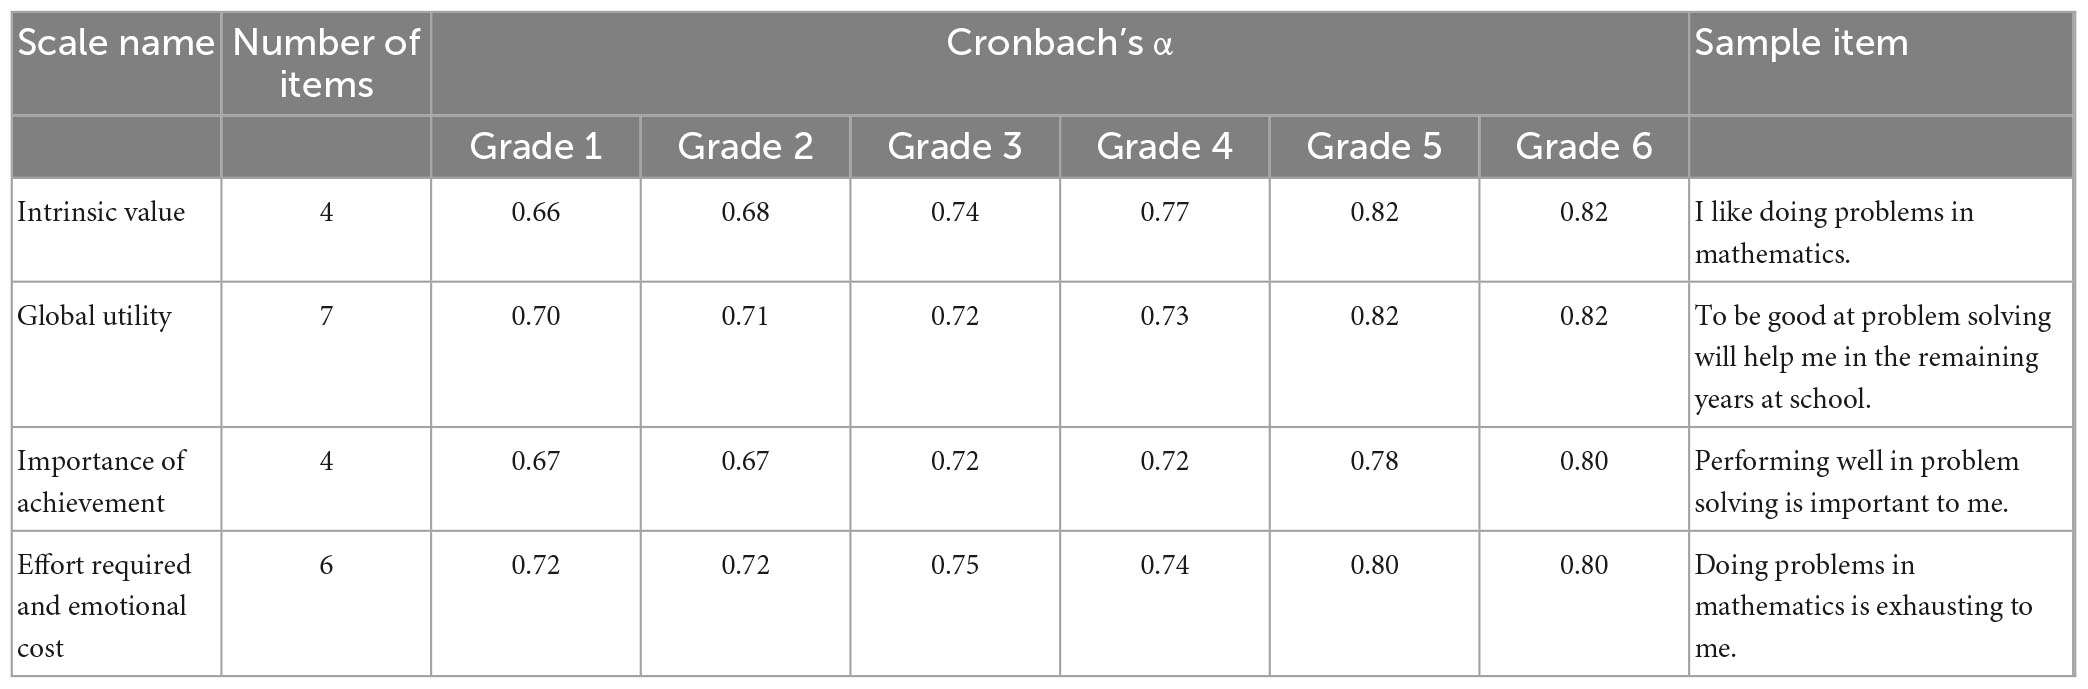
Table 2. Sample items and reliabilities for value components for each Grade.
Achievement emotions typically experienced by elementary students in mathematical PST were evaluated through a questionnaire presenting facial expressions (one pictorial item per emotion; Hall et al., 2016). This has been used in previous empirical studies with elementary school students (e.g., Hanin and Van Nieuwenhoven, 2018, 2019, 2020). The assessed emotions included two positive activating emotions (enjoyment, pride), four negative activating emotions (shame, fear, anger, nervousness), and two negative deactivating emotions (sadness, boredom). Again, first and second grade students were asked to indicate to what extent they felt each emotion when solving a math problem, using a binary scale (yes or no) while the oldest positioned themselves on a four-point Likert scale (1 = never and 4 = almost always).
Emotion regulation strategies were appraised using the Children’s Emotion Regulation Scale in Mathematics (CERS-M; Hanin et al., 2017). The original questionnaire consisted of 18 items rated on a 4-point response scale (1 = never and 4 = almost always) and targeted six strategies commonly used by upper elementary students to regulate their emotions when solving mathematical problems. Once again, a binary scale was used for the younger students (Grades 1 to 4), with results of exploratory factor analysis revealing three factors for Grades 1 to 4 and the six original factors for Grades 5 and 6 (with explained variance of 42.6, 42.5, 43.2, 45.9, 63.9, and 67.7%, respectively; Tables 3, 4).
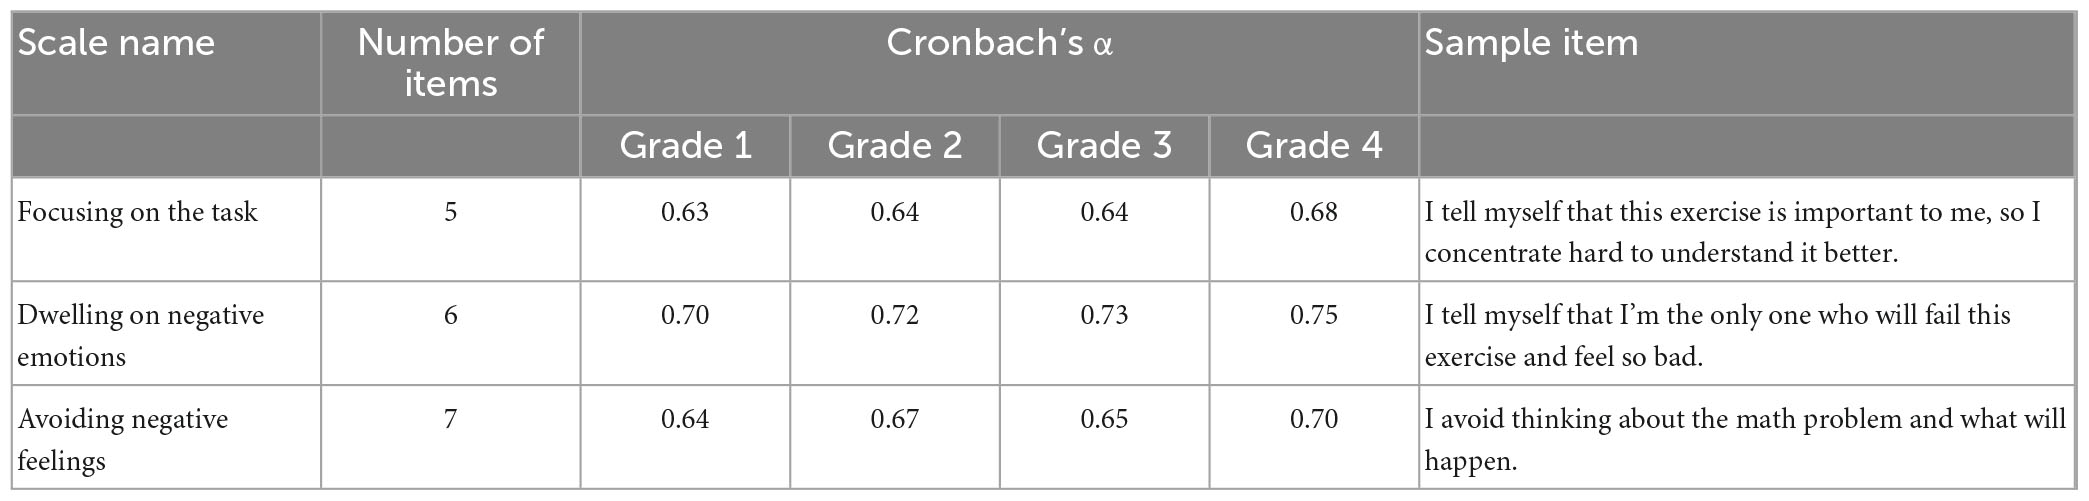
Table 3. Sample items and reliabilities for emotion regulation strategies for Grades 1 to 4.
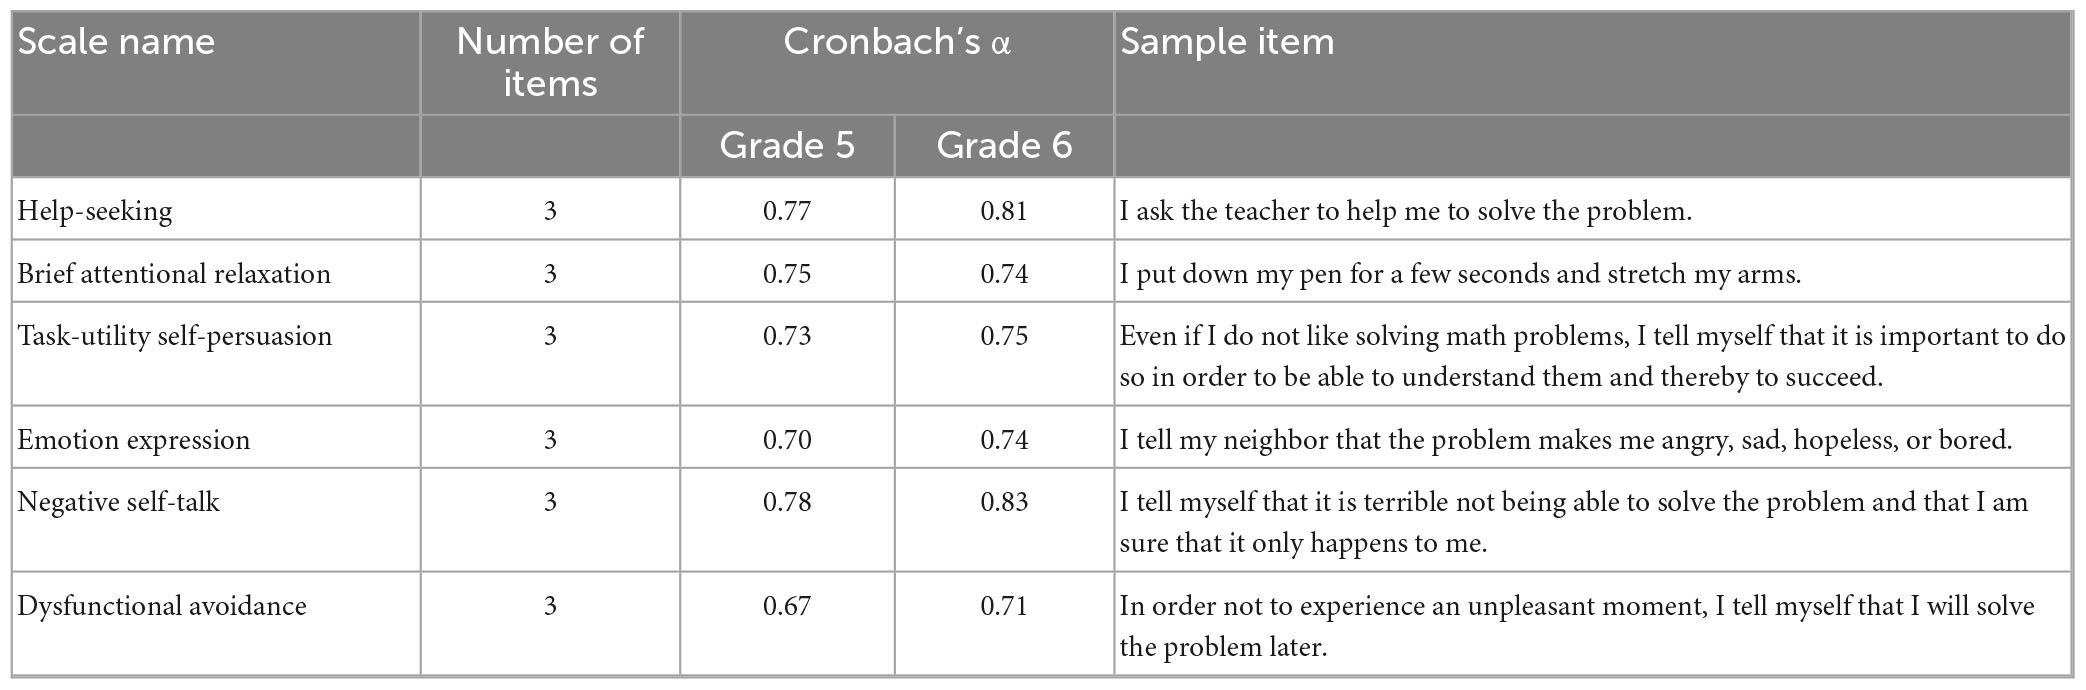
Table 4. Sample items and reliabilities for emotion regulation strategies for Grades 5 and 6.
Problem-solving performance was assessed by means of a standardized test made up of four non-routine word problems. This test was designed on the basis of the expertise of the first author, in collaboration with two teachers per grade level involved in the study. Various versions of tests were developed to be age appropriate. In order to measure students’ competence in solving non-routine problems and not their mathematical knowledge or technical ability, only application problems were offered, and use of the calculator was permitted. Accuracy of each problem response was scored between 0 and 1, with 0 reflecting a completely erroneous response, 0.5 reflecting a partially correct response, and 1 reflecting a completely correct response. Then, the four scores were summed to get a global score (ranging from 0 to 4) for each student. Interrater reliability for two independent blind scorers was excellent (k between 0.92 and 0.95; Cohen, 1960).
Students’ previous problem-solving performance, included as a control variable, was assessed 2 months before the start of the study, using a standardized test made up of four non-routine word problems similar to those used to assess students’ actual performance. Accuracy of problem responses was scored using the same procedure (k between 0.90 and 0.94).
The schools’ socio-economic index score, included as a control variable, was collected on the Ministry of the French Community of Belgium’s website (Enseignement Belgium, n.d.). This index classifies schools on a scale of 1 (the lowest score) to 20 (the highest score). It is calculated from five factors measured for each student’s family: the per capita income, the level of education, the unemployment rate, the professional activities, and the housing conditions. The index score of each school is then defined on the basis of the average of the indices of its population. In the present sample, the average score for the eight schools involved in the study was 10.5 (individual scores were as follows: 4, 4, 6, 10, 12, 13, 16, and 19).
Results
Cluster analysis
Variables were standardized through Z-transformations before starting the cluster analysis. Hierarchical cluster analysis using Ward’s linkage method and squared Euclidean distances as the measure of similarity was used to identify the number of clusters and to fix cluster centers (Aldenderfer and Blashfield, 1984). Further, Hair et al. (1998) underlined the importance of examining a range of possible cluster solutions in order to determine a final solution that best fits with theoretical categories or other reliable evidence. Four variations of the clustering procedure were thus considered. On examination of the dendrogram, it was determined that, for each year of the program, four clusters fit the data best. The four-cluster solutions were interpretable and had a good distribution of cases across clusters. Next, a K-means cluster procedure with a four-cluster solution was run to construct the final solution (Bergman, 1998). Specifically, the four clusters revealed by Ward’s analysis were used as the initial cluster centers. The final cluster centroids for the four clusters characterizing each year of primary education are displayed in Tables 5–10 and illustrated in Figures 2–7. Centroids reflect students’ means for each emotion in each cluster. It is worth mentioning that, as scales were standardized, a positive centroid indicates a higher score than the overall sample mean and a negative centroid reflects a lower score than the average score of the sample. The reliability of this solution was also examined through a MANOVA, as described below.
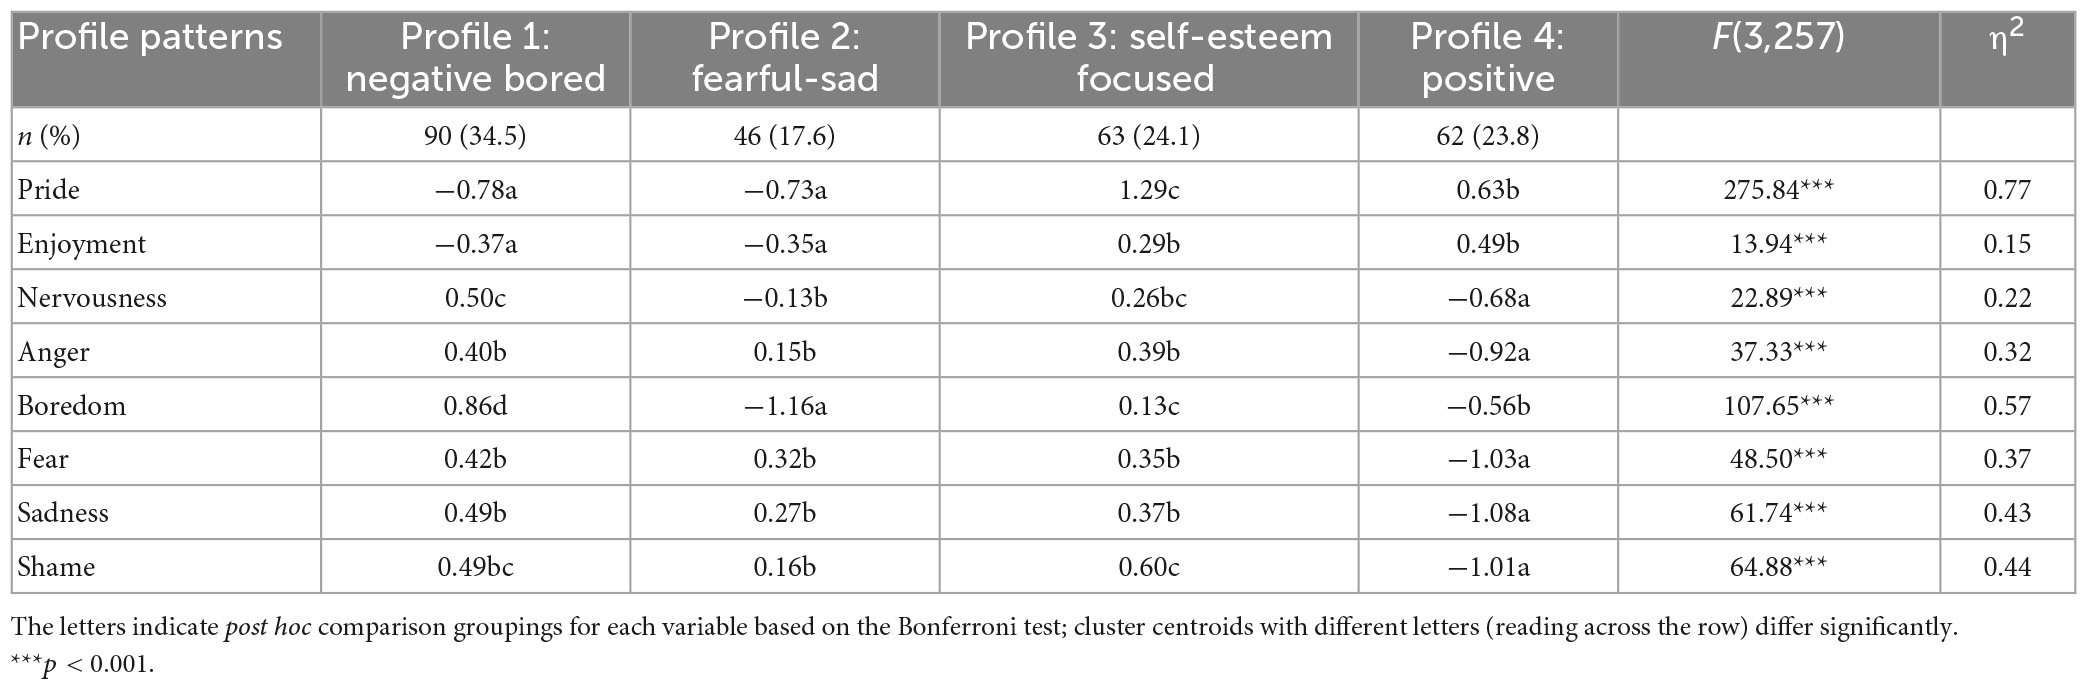
Table 5. Cluster centroids (mean values) and MANOVA results for the first year of elementary school.
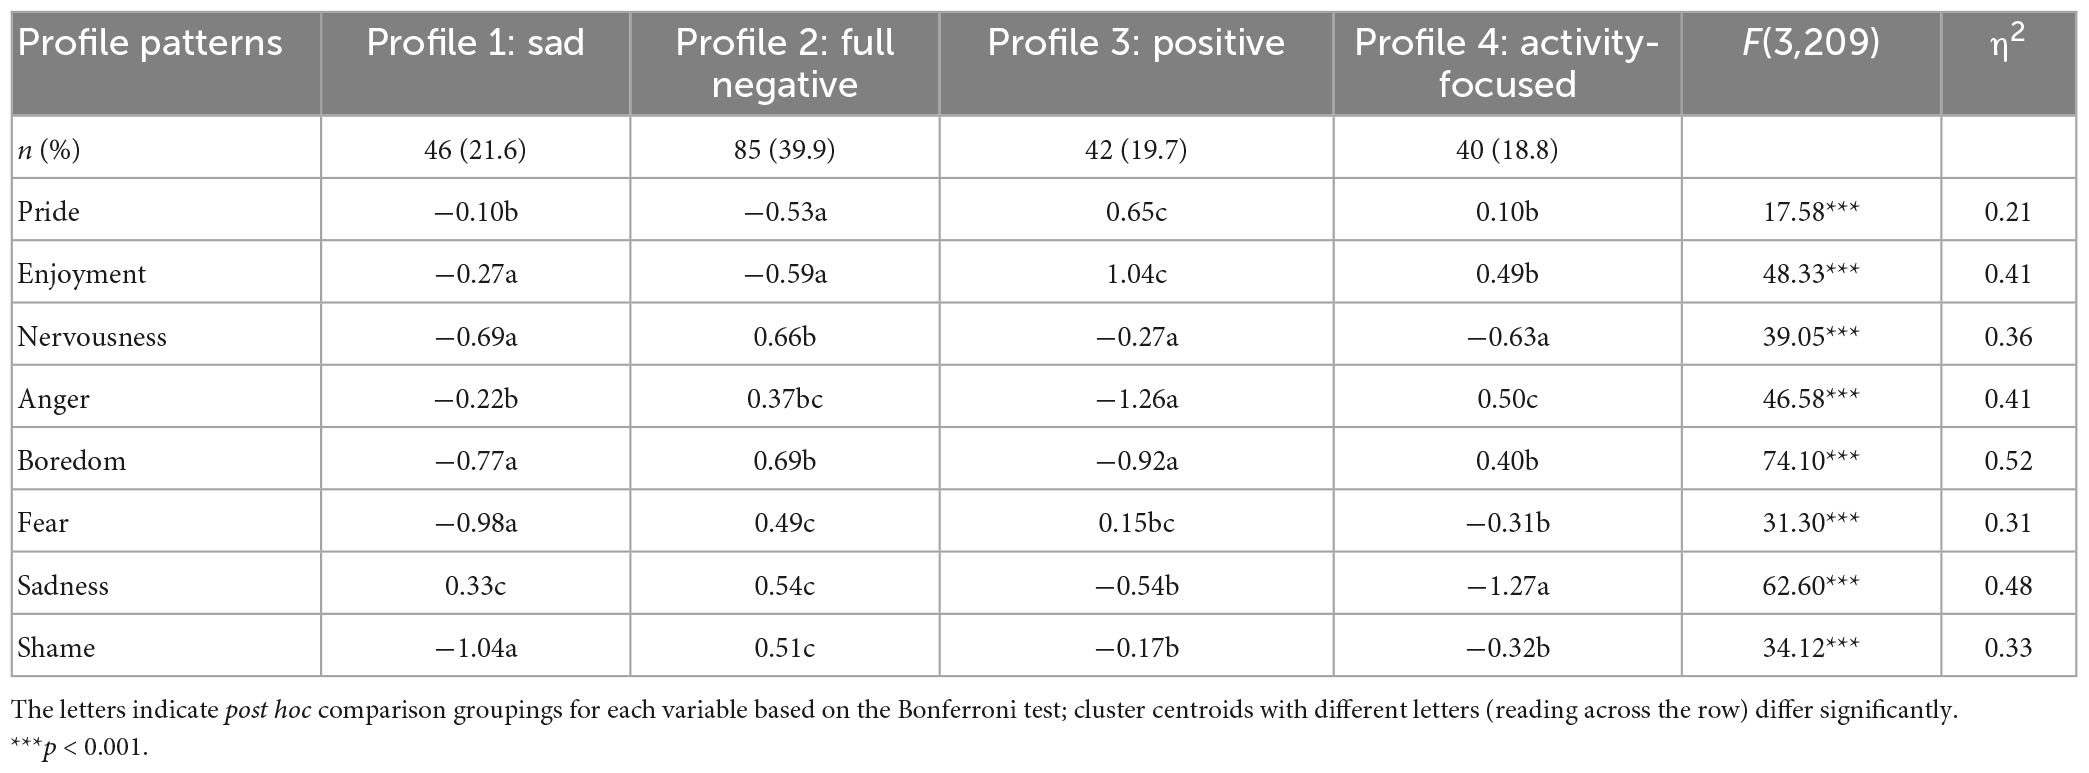
Table 6. Cluster centroids (mean values) and MANOVA results for the second year of elementary school.
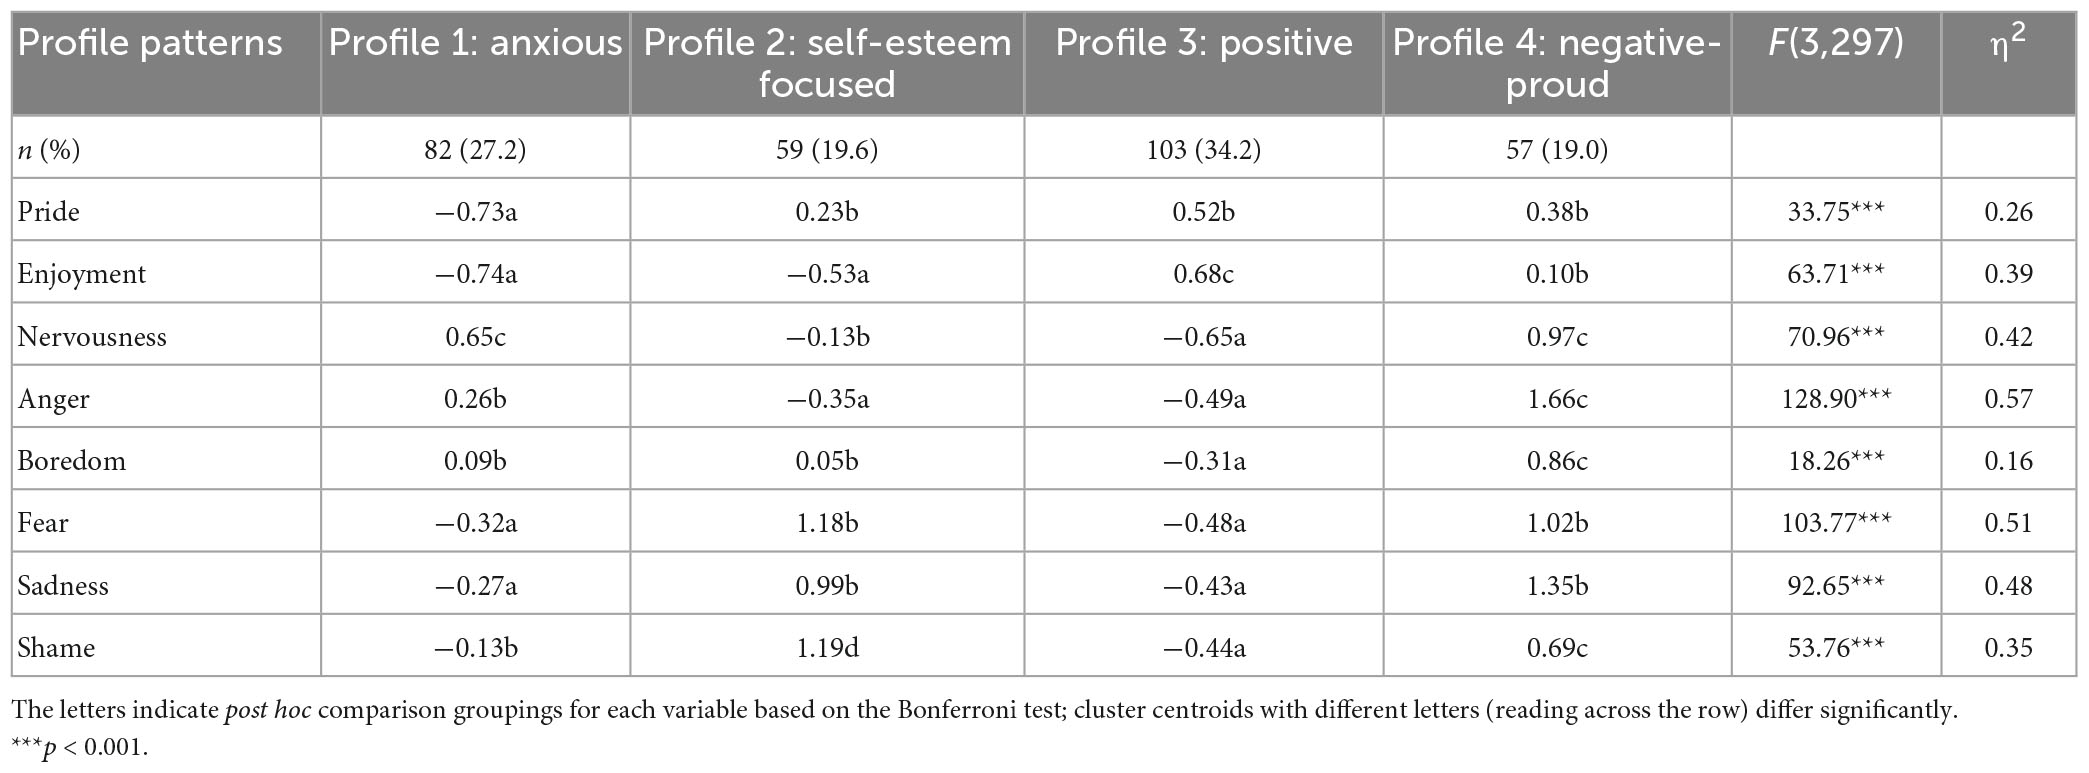
Table 7. Cluster centroids (mean values) and MANOVA results for the third year of elementary school.
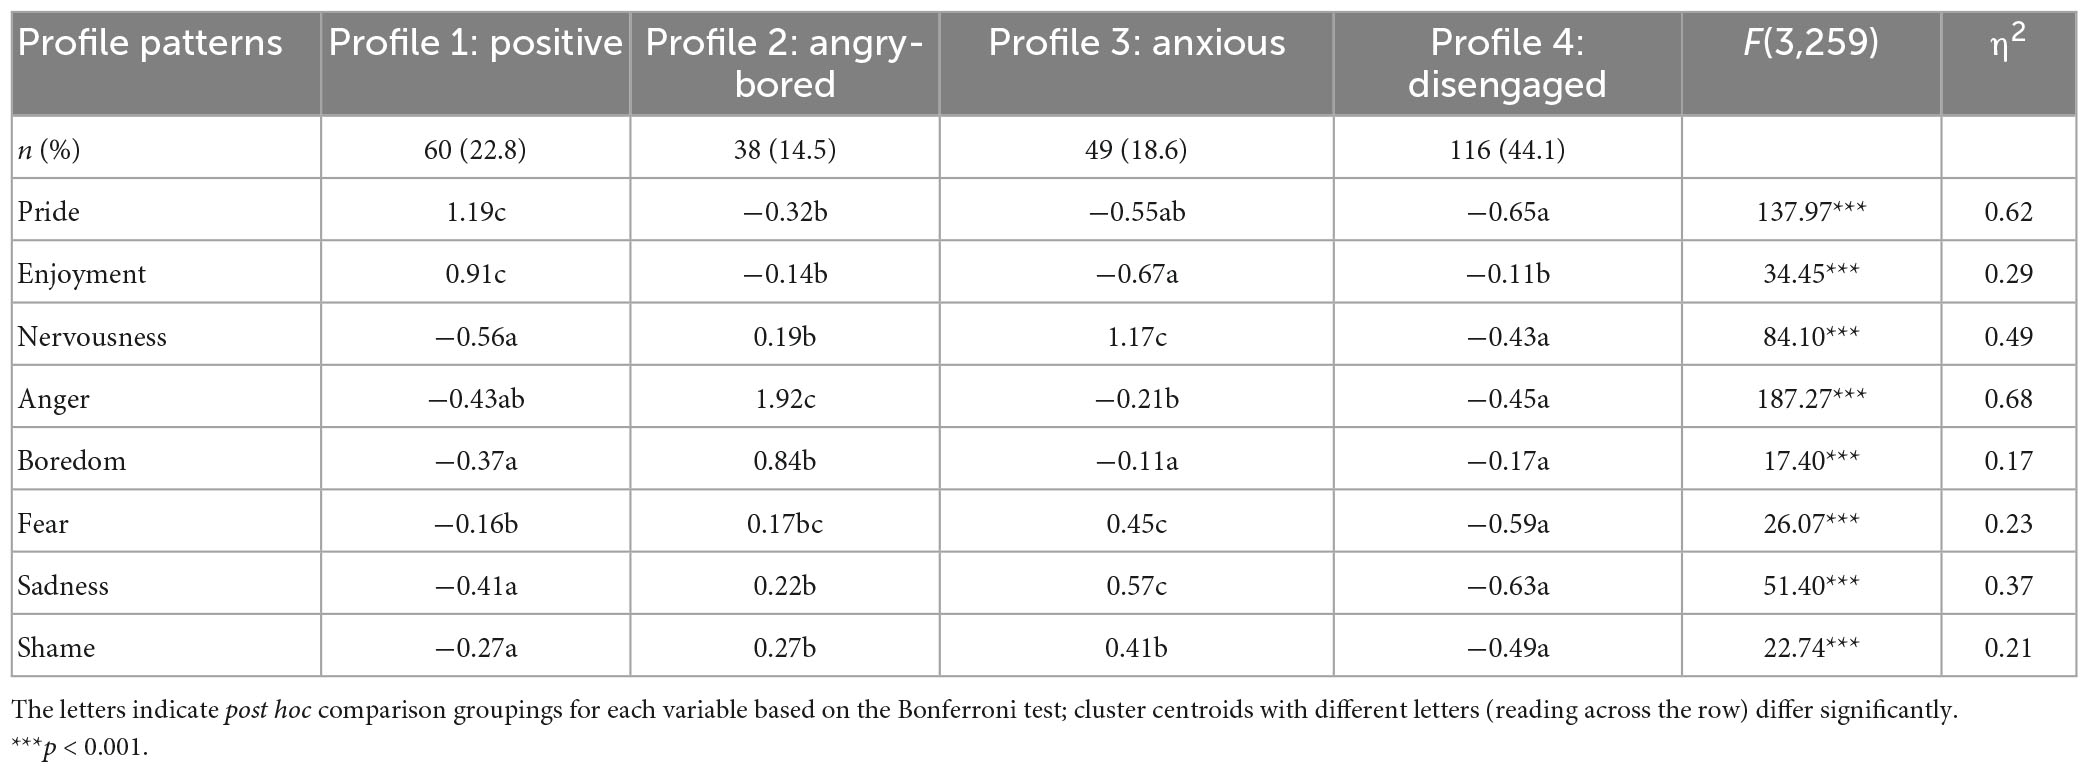
Table 8. Cluster centroids (mean values) and MANOVA results for the fourth year of elementary school.
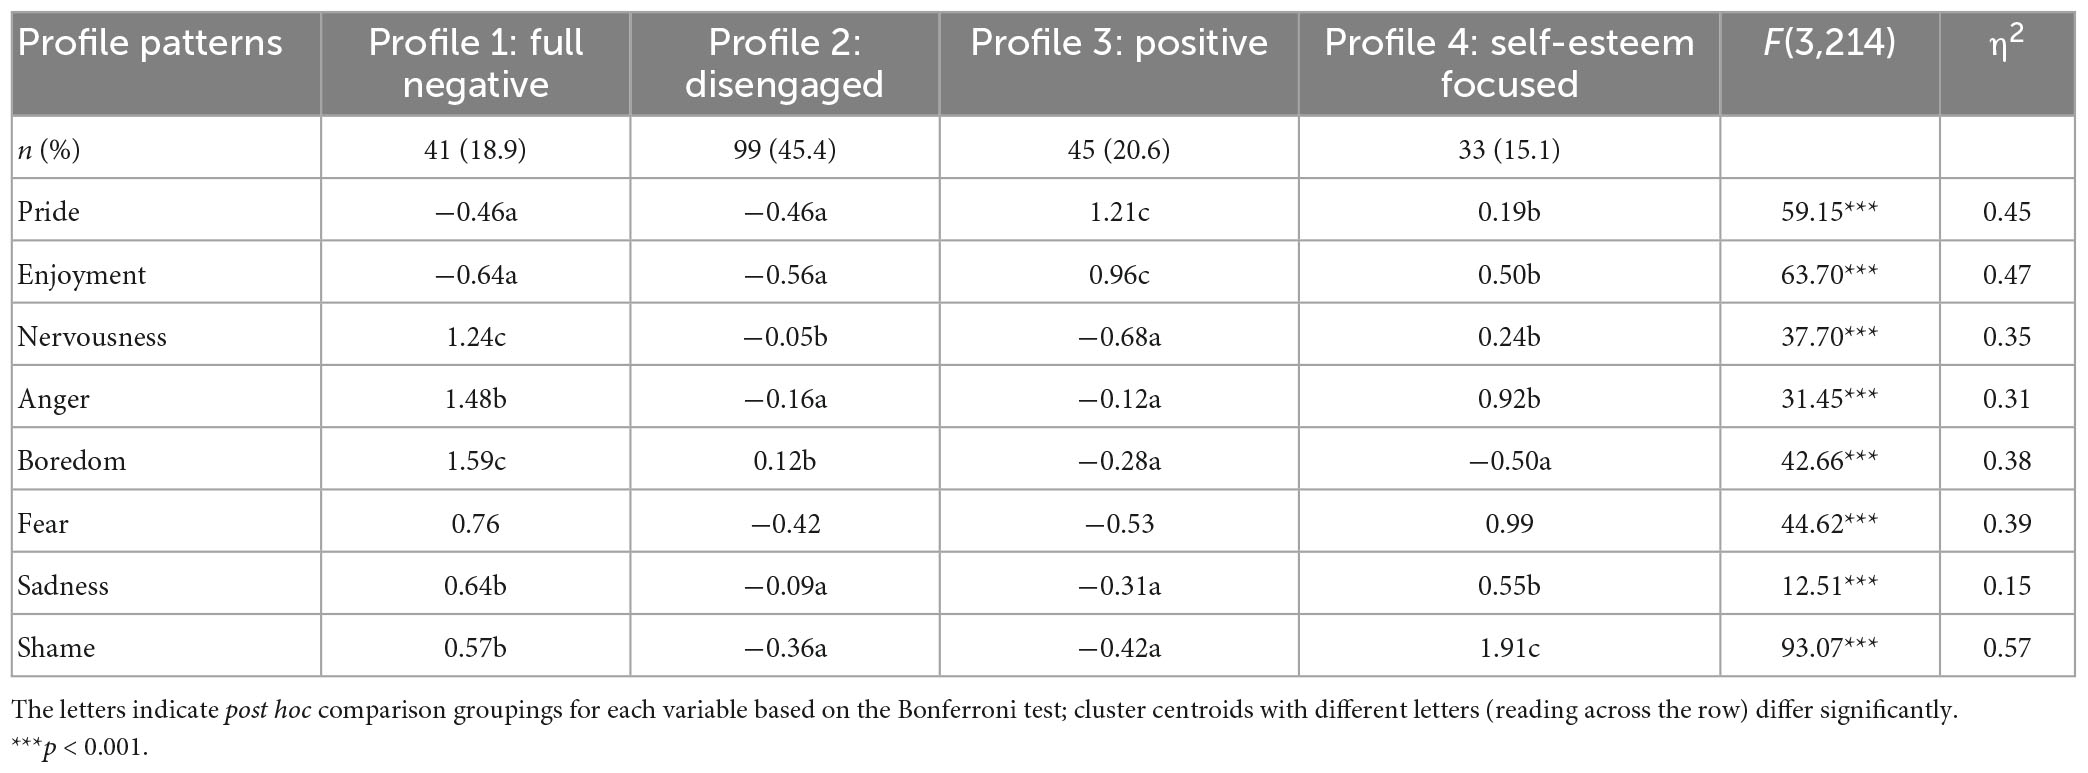
Table 9. Cluster centroids (mean values) and MANOVA results for the fifth year of elementary school.
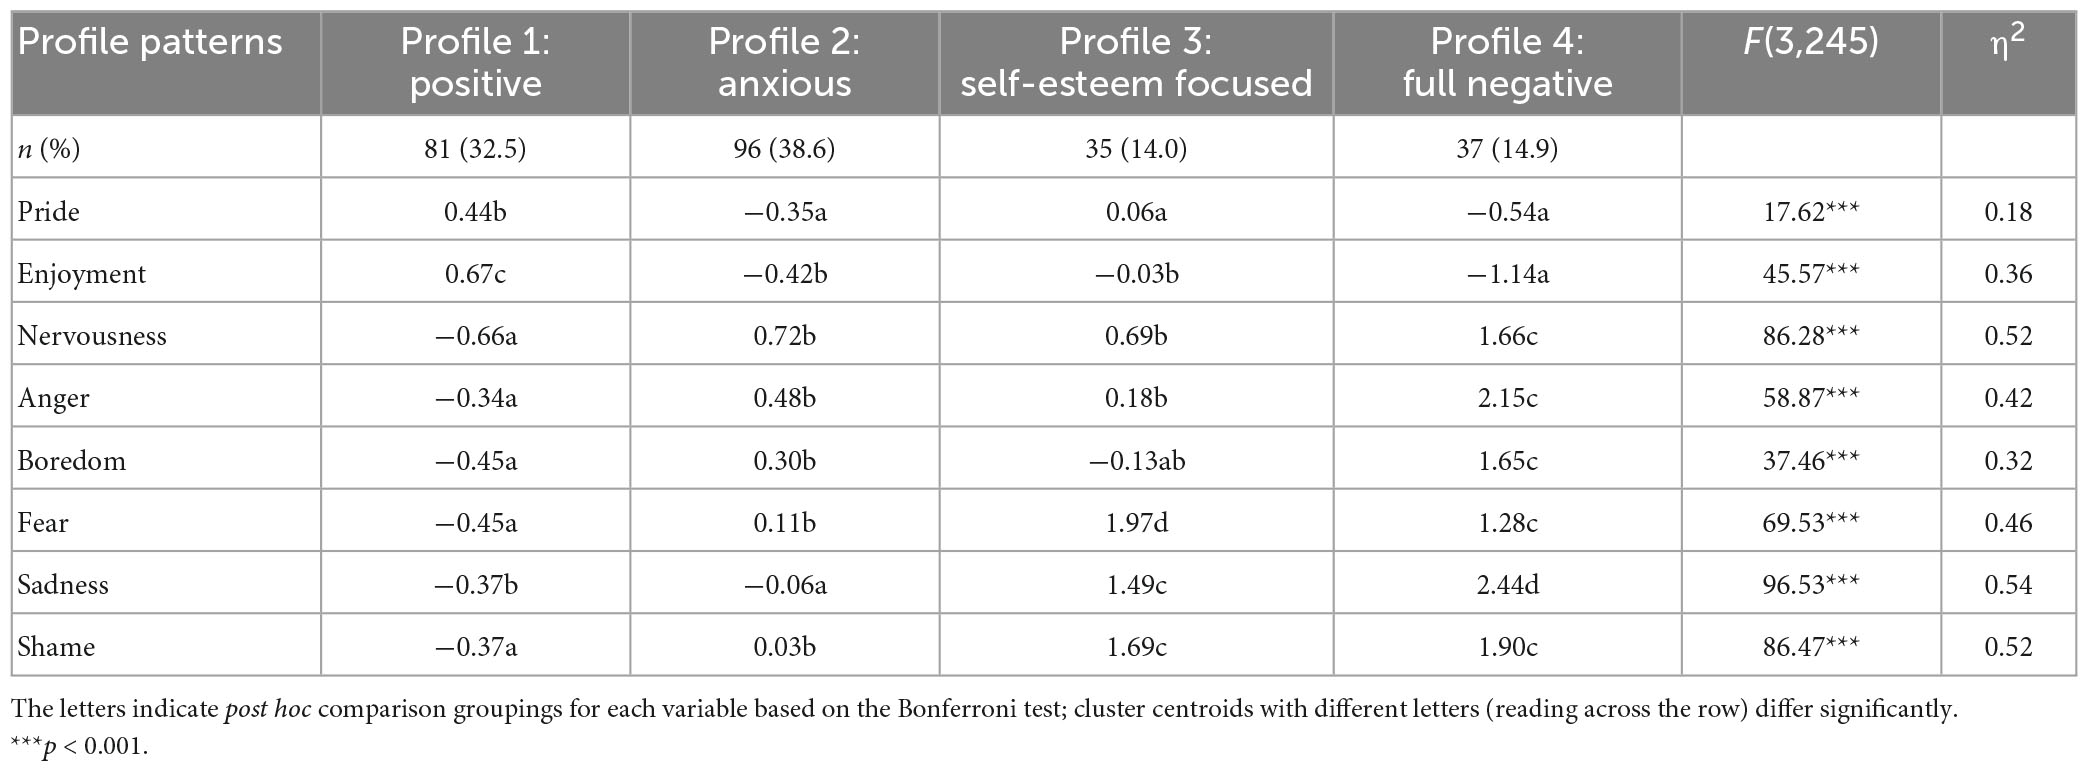
Table 10. Cluster centroids (mean values) and MANOVA results for the sixth year of elementary school.
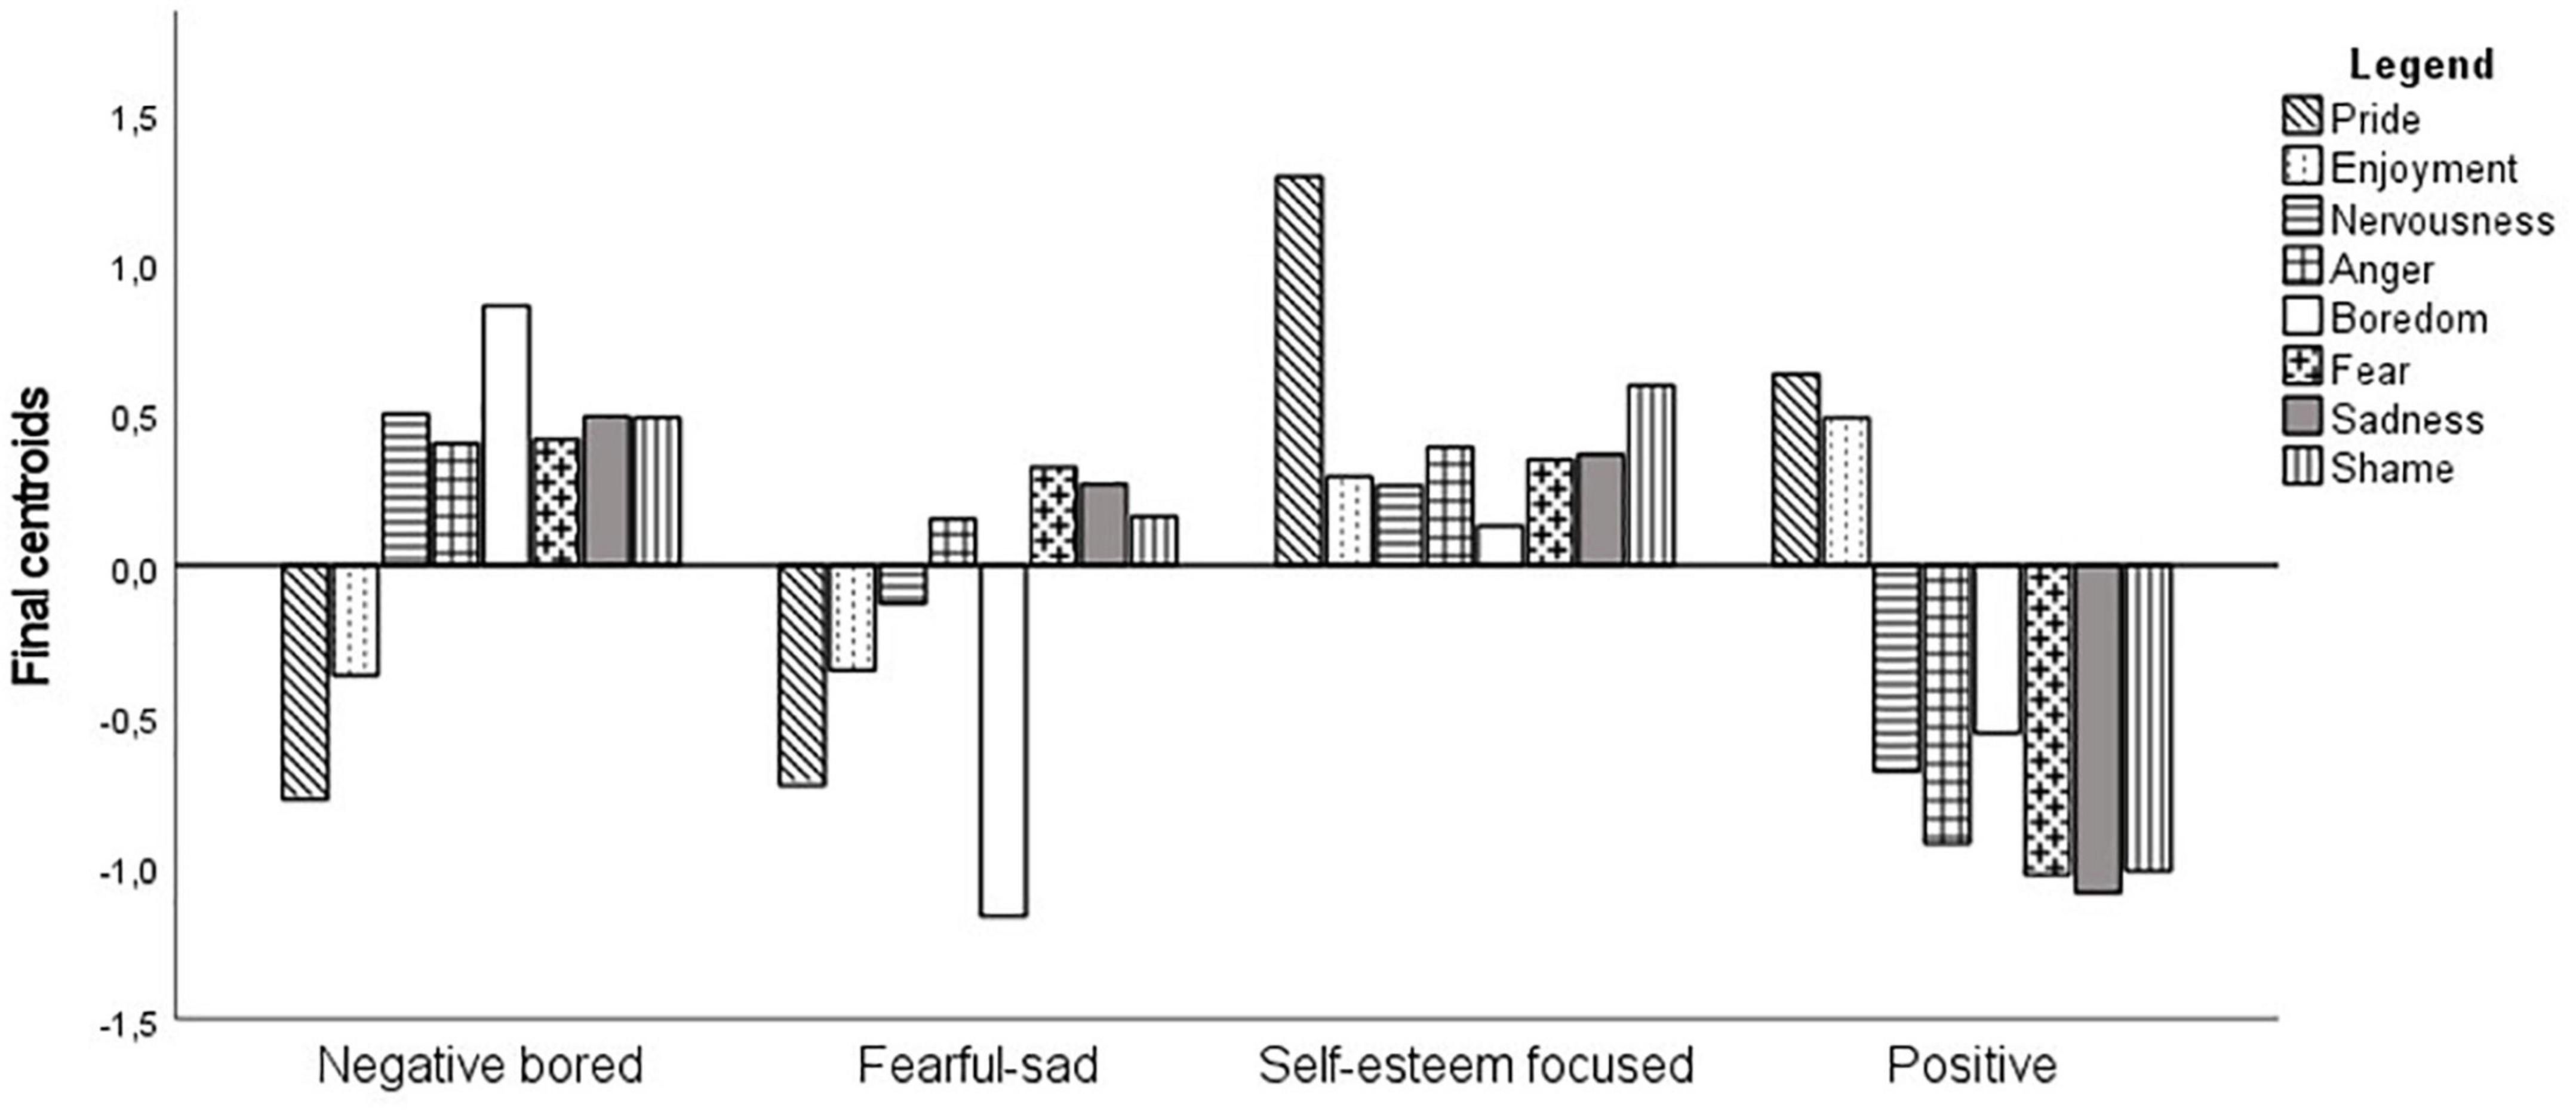
Figure 2. Standardized means of cluster variables for each profile for Grade 1 (n = 261).
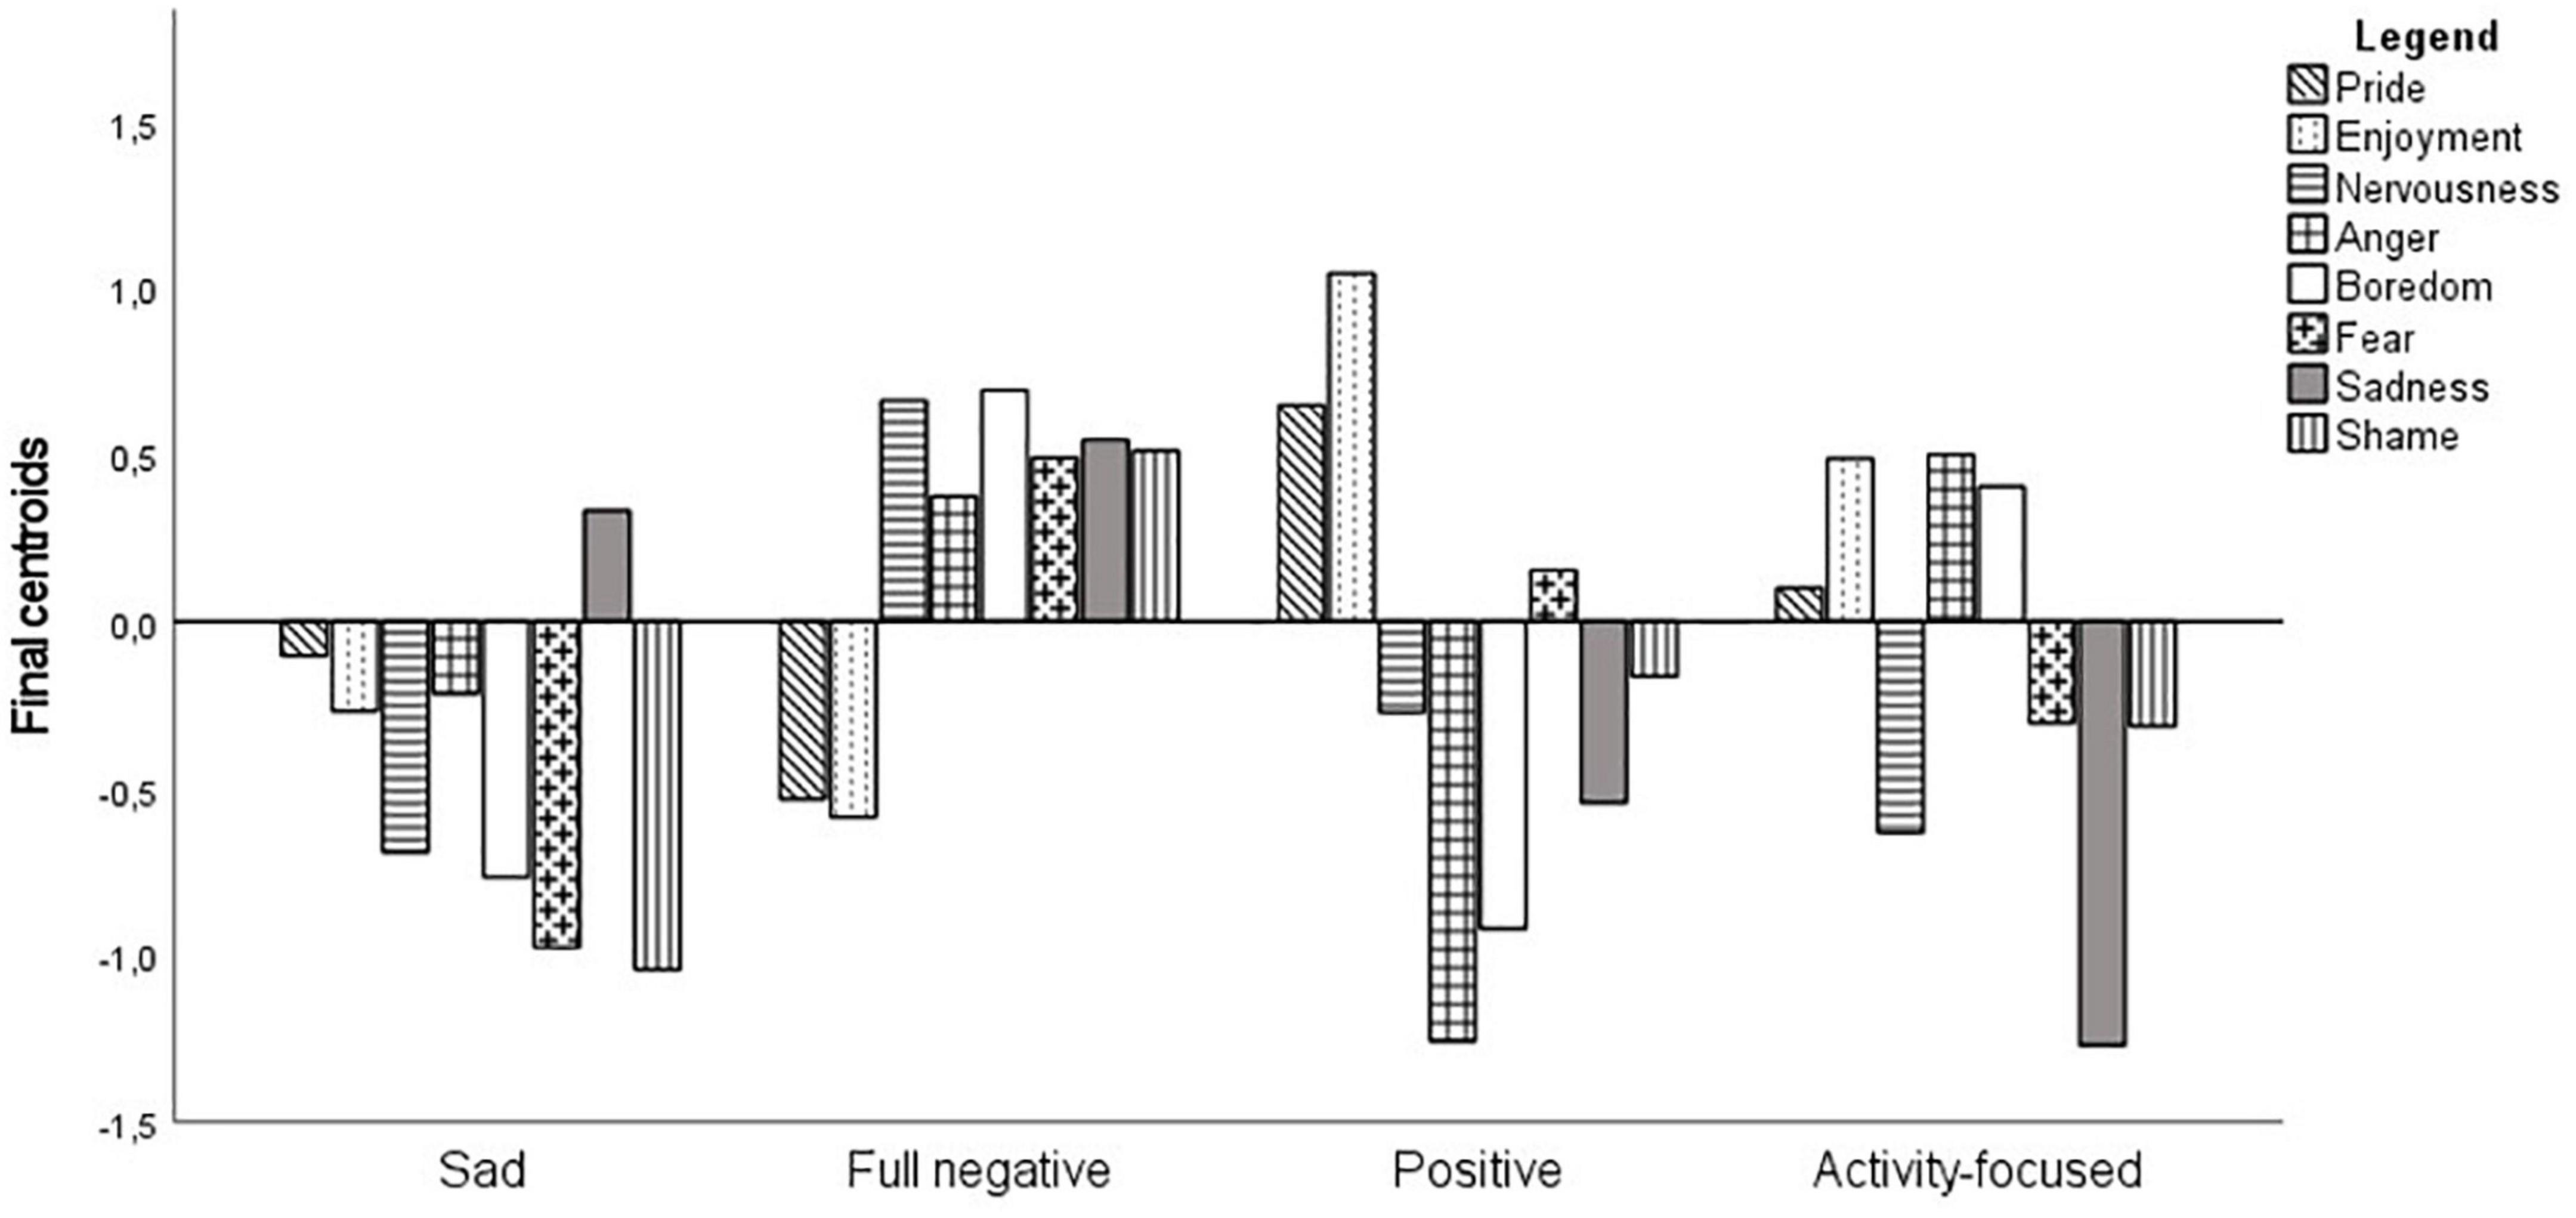
Figure 3. Standardized means of cluster variables for each profile for Grade 2 (n = 213).

Figure 4. Standardized means of cluster variables for each profile for Grade 3 (n = 301).
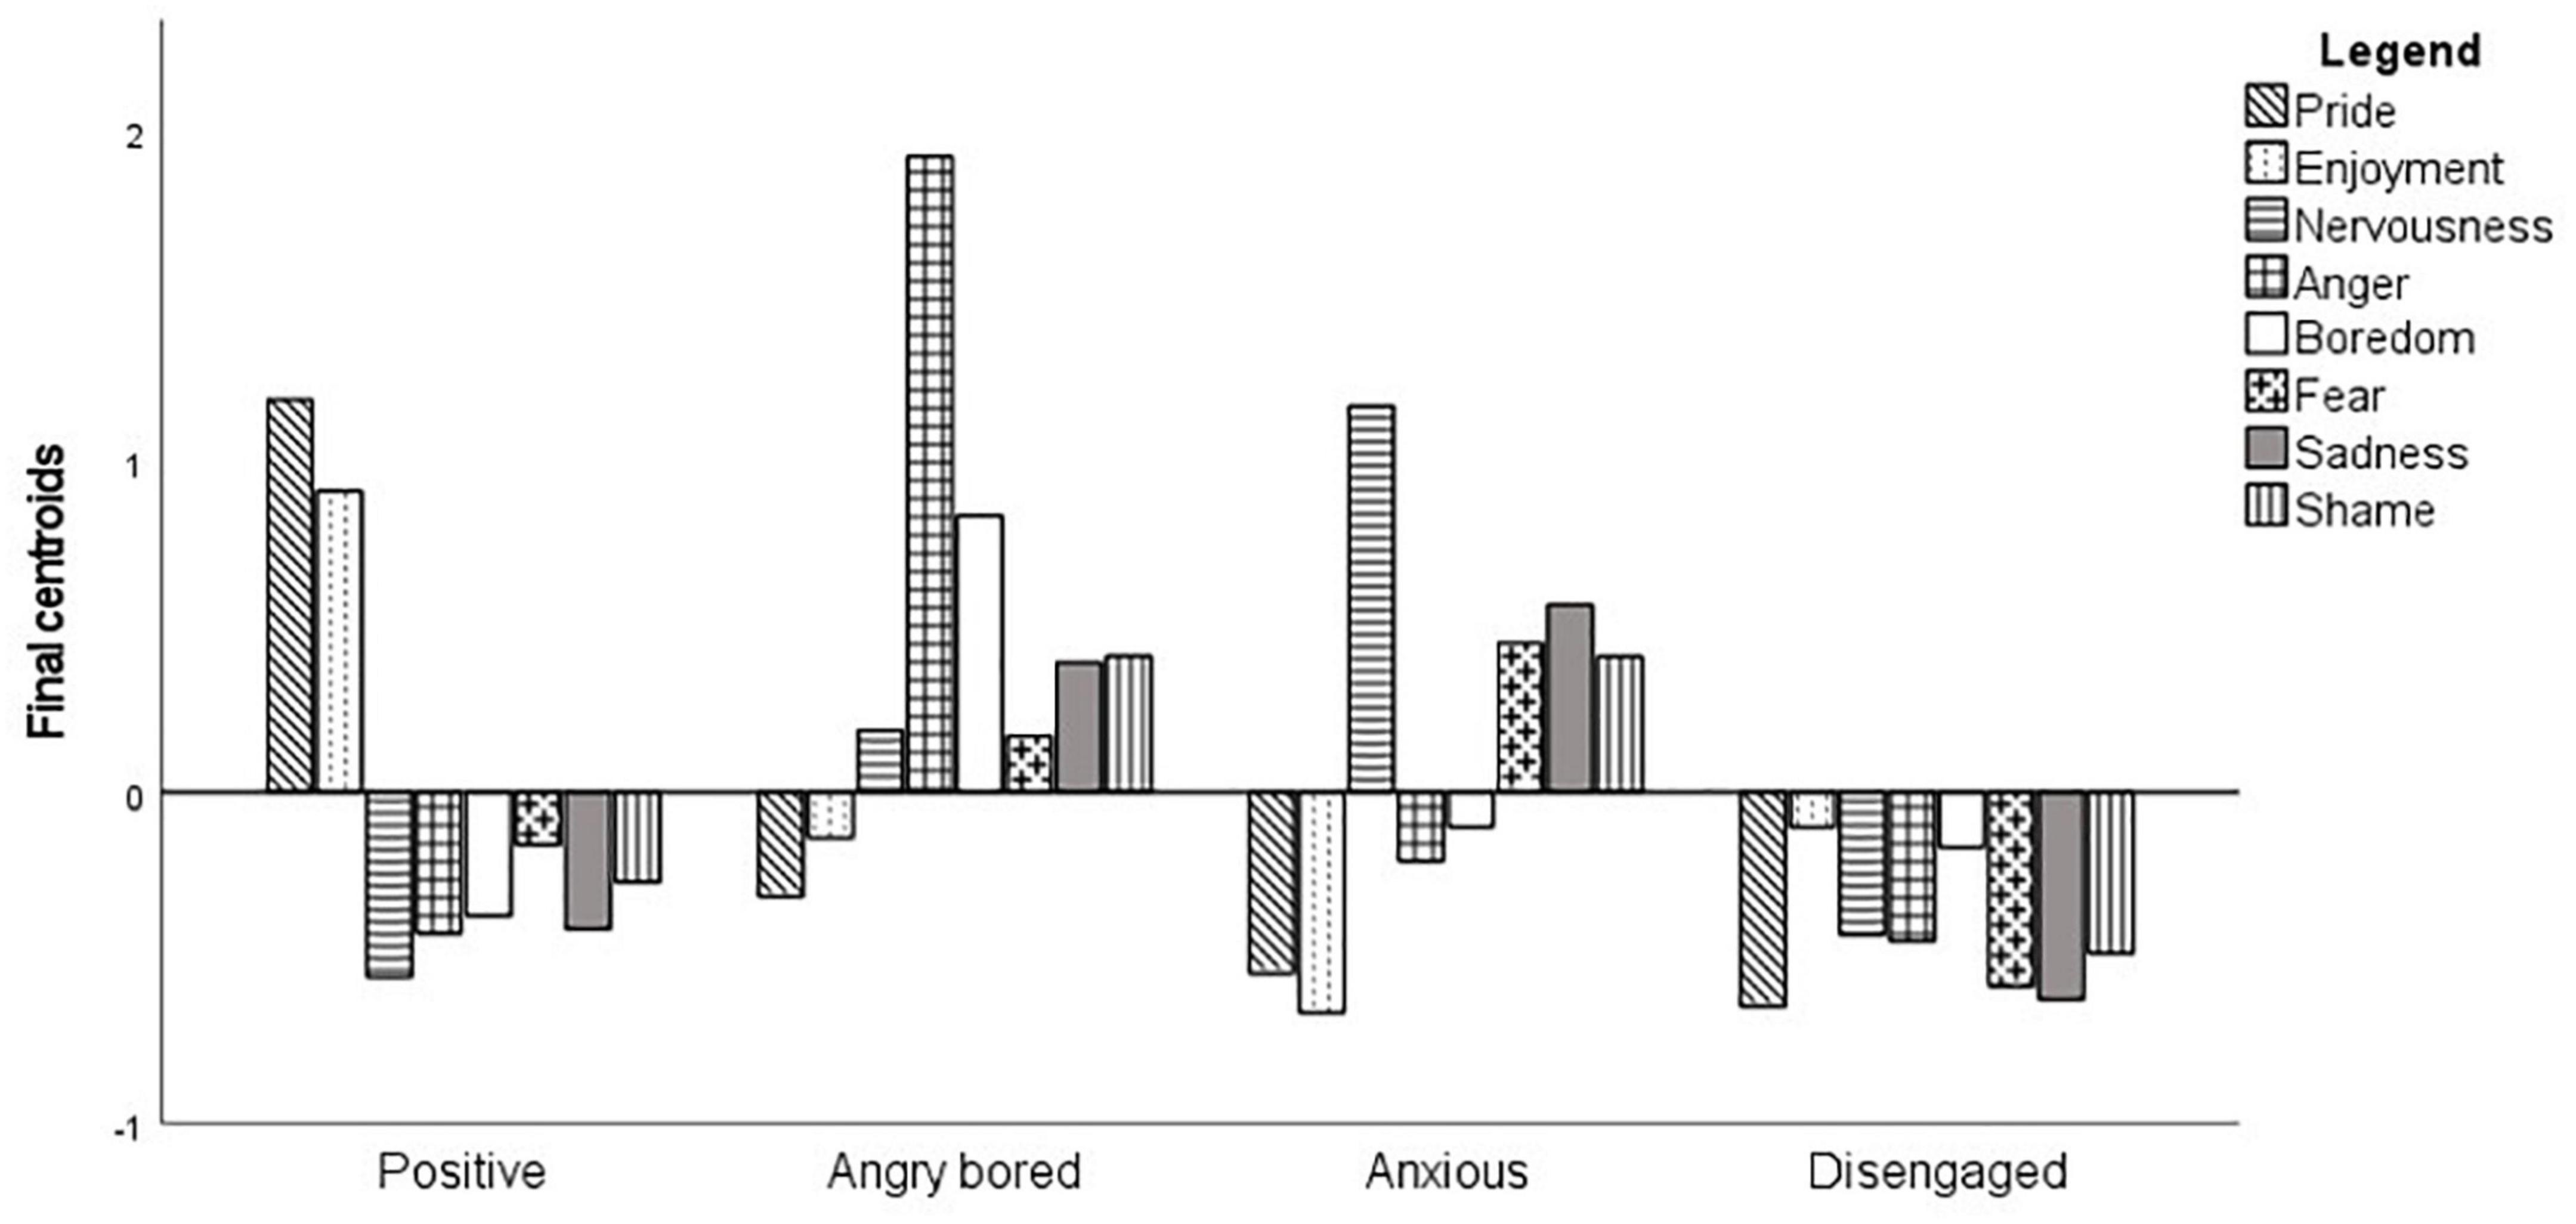
Figure 5. Standardized means of cluster variables for each profile for Grade 4 (n = 263).
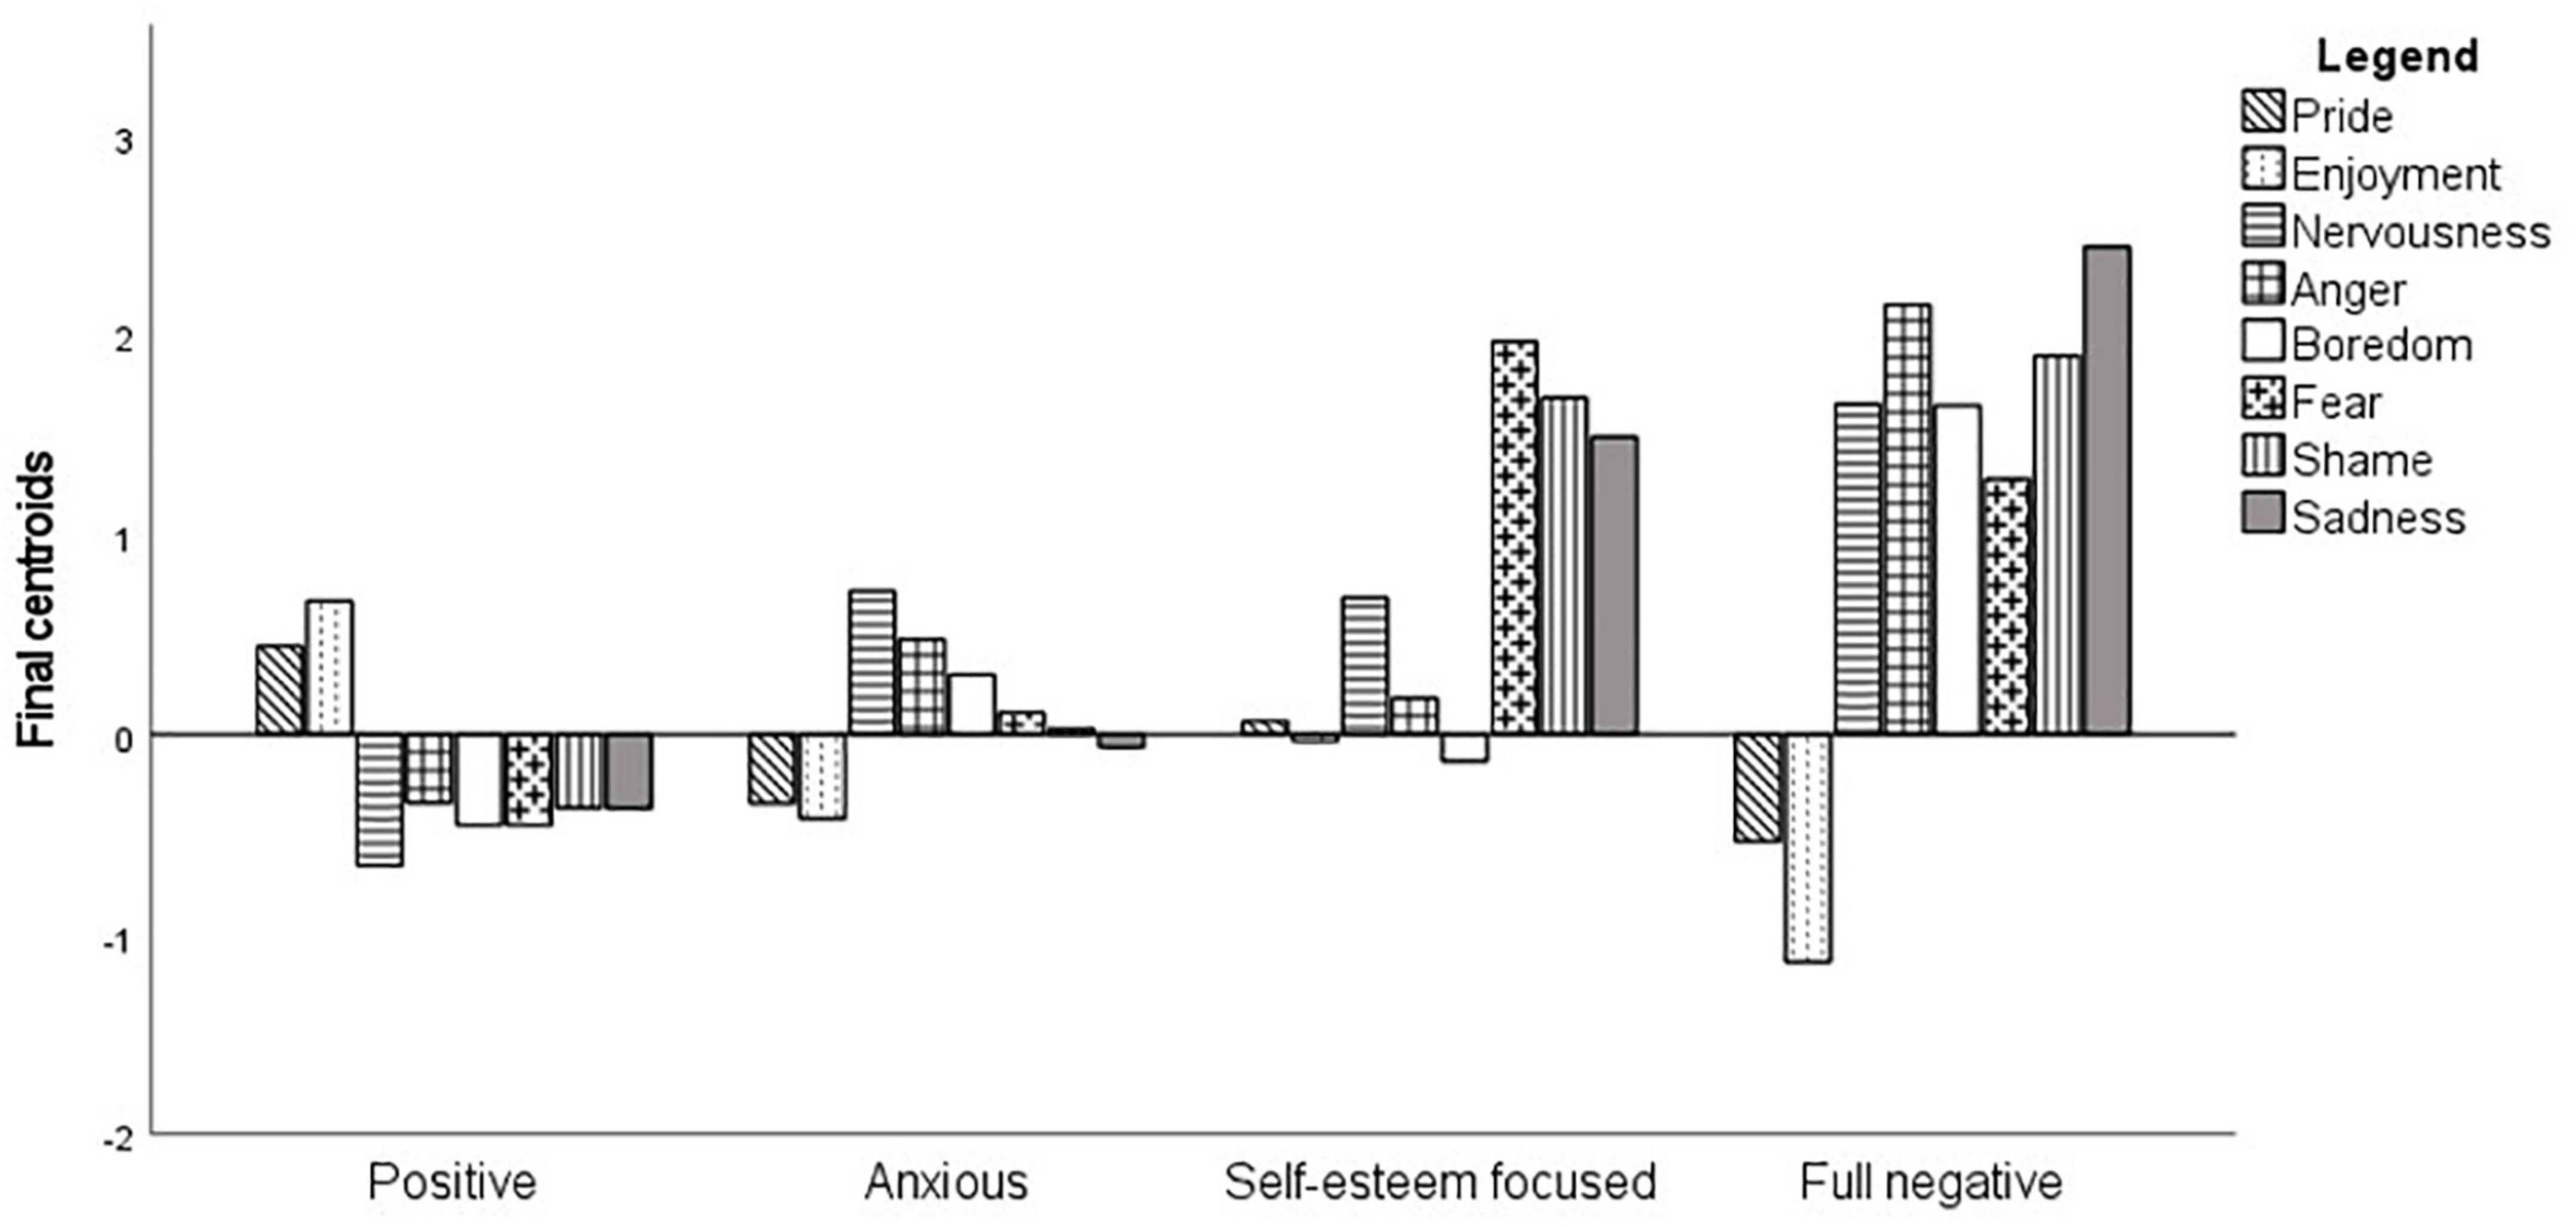
Figure 6. Standardized means of cluster variables for each profile for Grade 5 (n = 218).
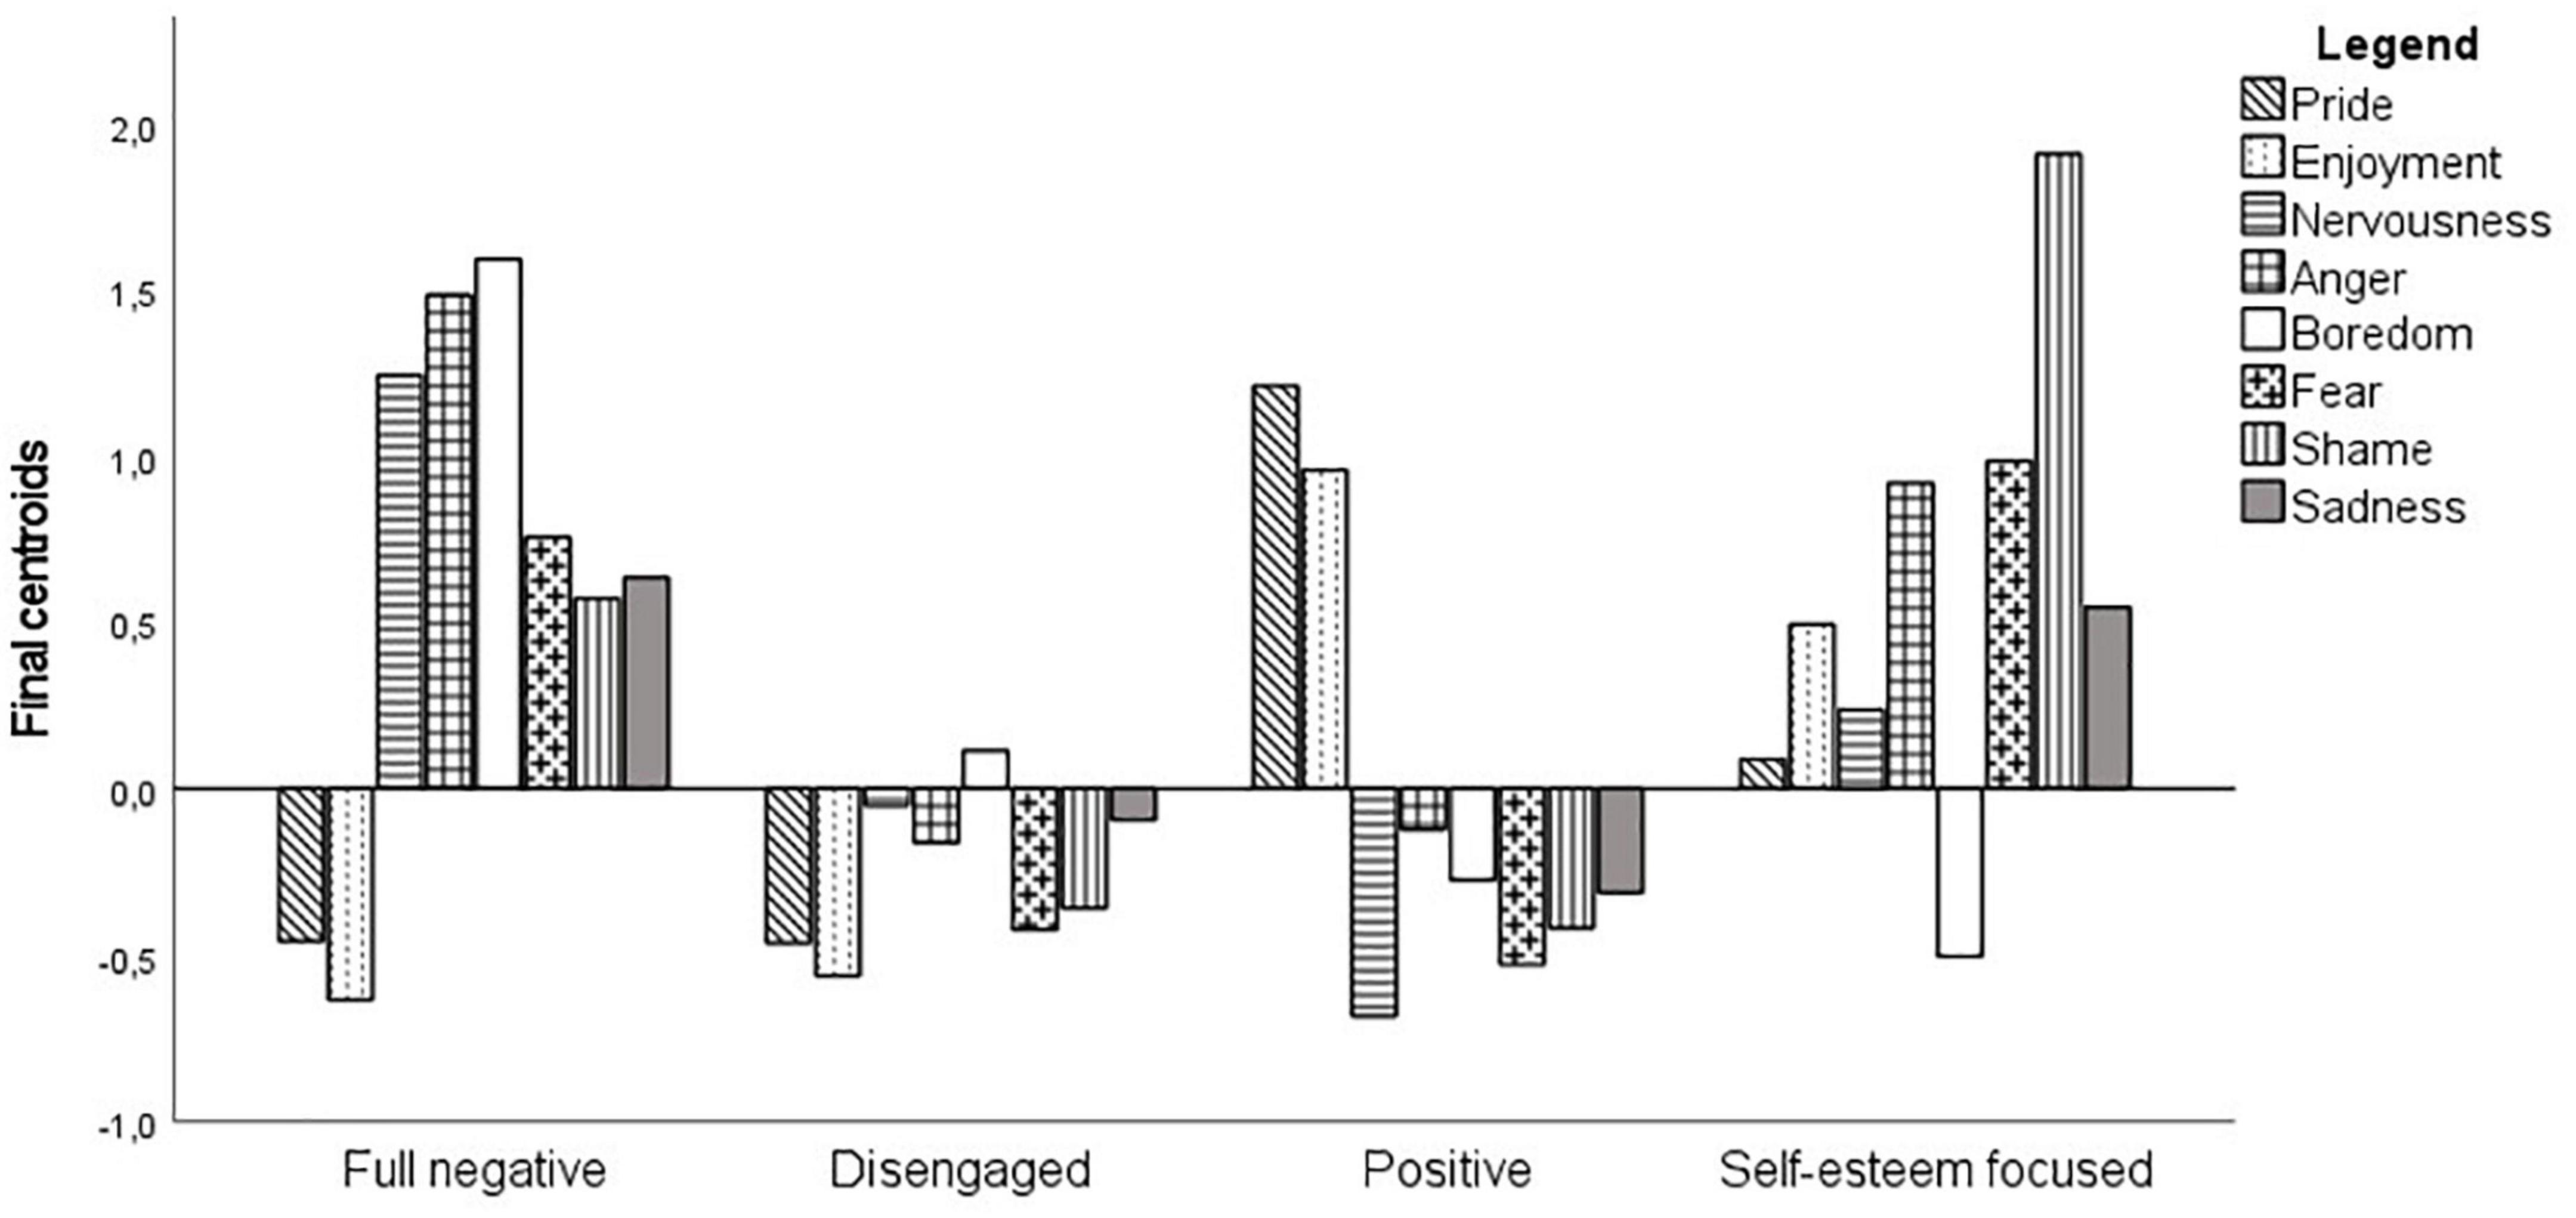
Figure 7. Standardized means of cluster variables for each profile for Grade 6 (n = 249).
Validation of the cluster solution
A one-way MANOVA was computed, with cluster membership as the between-subjects factor and the eight cluster variables as dependent variables. The overall MANOVA was significant for the 6 years of elementary school: G11 : Pillai’s trace = 1.98, F(24,726) = 58.42, p < 0.001, η2 = 0.66; G2: Pillai’s trace = 1.94, F(27,606) = 40.92, p < 0.001, η2 = 0.65; G3: Pillai’s trace = 1.71, F(24,876) = 47.97, p < 0.001, η2 = 0.57; G4: Pillai’s trace = 1.97, F(24,762) = 60.32, p < 0.001, η2 = 0.66; G5: Pillai’s trace = 1.74, F(24,627) = 36.21, p < 0.001, η2 = 0.58; G6: Pillai’s trace = 1.45, F(24,720) = 27.96, p < 0.001, η2 = 0.48. Given the significance of the overall tests, the univariate main effects were considered each time. The univariate tests for each cluster variable were all significant, and cluster membership explained between 15 and 77% of the variance in the eight variables used to create the clusters (Tables 5–10). Results suggested that the composition of each cluster was significantly different from that of the others.
Further, a cross-validation procedure was set up to assess the replication of the four-cluster solution (Breckenridge, 2000; Tibshirani and Walther, 2005). To do so, the dataset related to each year of elementary school was randomly divided into two samples (G1: n1 = 128, n2 = 133; G2: n1 = 105, n2 = 108; G3: n1 = 149, n2 = 152; G4: n1 = 130, n2 = 133; G5: n1 = 104, n2 = 114; G6: n1 = 124, n2 = 125). K-means clusters—specifying a four-cluster solution—were performed separately on samples 1 and 2 using the cluster centroid derived from the global sample. The agreement between the cluster solutions for the whole sample and for the two subsamples was substantial (average κ for G1 = 0.71; G2 = 0.73; G3 = 0.79; G4 = 0.72; G5 = 0.75; G6 = 0.77), according to Cohen’s (1960) recommendation.
In the next section, we answer our first research question by describing the emotional profiles observed in each of the primary grades.
Description of the clusters
The four-cluster solution, with the clusters’ validity confirmed by both theoretical and statistical criteria, revealed meaningful emotional profiles highlighting specific patterns of variables for each grade (Figures 2–7).
First year of elementary school
The first cluster (34.5% of which 57% are girls) was labeled the negative-bored profile due to a substantial highly positive centroid for boredom, highly positive centroids for the five other negative emotions assessed and negative centroids for pride and enjoyment. A typical student from this cluster experienced negative emotions, among which boredom had greater intensity, during PST.
The second cluster (17.6% of which 40.9% are girls) was labeled the fearful-sad profile due to its having above-average centroids for fear and sadness, but these were less pronounced than for the negative bored profile. If, like the latter, they did not experience positive emotions during PST, they differed from them by not being bored by such tasks.
The third cluster (24.1% of which 44.3% are girls) gathered students presenting a highly positive centroid for on pride and, to a lesser extent, for shame, two achievement emotions playing a central role in the development of self-esteem (Holodynski and Kronast, 2009; Pekrun and Perry, 2014), and was therefore named the self-esteem focused profile. In contrast to the other achievement emotions, pride and shame are assumed to be induced if success or failure are considered to be caused by oneself (Pekrun, 2006). As they are triggered by one’s evaluation, that is, on the basis of the norms and values defined by the individual, they are also called “self-evaluative” emotions (Holodynski and Kronast, 2009). Experiencing these emotions means that the individual is not capable of distinguishing a good/bad thing done from the global good/bad self. Students in this profile displayed above-average centroids for the other achievement emotions, except for boredom, for which the score was substantially lower.
The final cluster (23.9% of which 50% are girls) included students with highly positive centroids for enjoyment and pride and, hence, was labeled the positive profile. In contrast to the other three profiles, these students felt substantially fewer negative emotions during PST.
Second year of elementary school
The first cluster (21.6% of which 54.4% are girls) was entitled the sad profile due to a highly positive centroid for sadness. This was the only emotion felt by these students when solving mathematics problems.
The second cluster (39.9% of which 52.9% are girls) was labeled the full negative profile due to highly positive centroids for the six negative achievement emotions assessed. These students displayed below-average scores for pride and enjoyment.
In contrast with the previous profile, students in the third cluster (19.7% of which 50% are girls) experienced only positive emotions (i.e., pride and enjoyment), during mathematics tasks. For this reason, we named it the positive profile. Let us also note a slightly above-average score for fear.
The final cluster (18.8% of which 70% are girls) was characterized by highly positive centroids for three emotions related to activity (i.e., enjoyment, anger, boredom), that is, emotions experienced during the completion of mathematics tasks and, therefore, was termed the activity-focused profile.
Third year of elementary school
The first cluster (27.2% of which 57.9% are girls) was named the anxious profile because of a substantial positive centroid for nervousness and, to a lesser extent, for anger. Students in this profile did not experience positive emotions, fear, sadness or shame during mathematical PST.
The second cluster (19.6% of which 45.3% are girls) was characterized by highly positive centroids for fear, sadness and shame, and, to a lesser extent, for pride. The first two emotions are closely associated with self-evaluative emotions (i.e., shame and pride). When the discrepancy between students’ behavior and the ideal-self-representations goals to achieve seem too high, fear of failure can be experienced (Holodynski and Kronast, 2009; Park and Lewis, 2021). After failure, interpreted as not meeting parental or teacher expectations, sadness often accompanies the feeling of shame (Pekrun and Perry, 2014; Park and Lewis, 2021). This cluster was therefore entitled the self-esteem focused profile.
The third cluster (34.2% of which 42.7 % are girls) included students experiencing high levels of positive emotions and low levels of negative emotions during mathematical PST and, hence, was labeled the positive profile.
The fourth cluster contrasted with the previous profile and was named the negative-proud profile (19.0% of which 58.3% are girls). Students in this profile experienced a wide range of negative emotions at a high intensity during this type of task. Further, like the positive profile, they experienced pride when their performance in mathematical PS tasks met their standards or expectations.
Fourth year of elementary school
The first cluster (22.8% of which 30% are girls) was called the positive profile due to highly positive centroids for pride and enjoyment and negative centroids for the six negative emotions assessed.
In contrast with the previous profile, students in the second cluster (14.5% of which 50% are girls) presented positive centroids for the six negative emotions assessed, but was especially high on negative achievement emotions that are focused on the activity, to adopt Pekrun’s (2006) conceptualization, that is, anger and boredom and, hence, was termed the angry-bored profile.
The third cluster (18.6% of which 63.3% are girls) was characterized by a highly positive centroid for nervousness and therefore was named the anxious profile. While in Grade 3, nervousness was coupled with anger, in Grade 4, it was accompanied by fear, sadness and shame. This is totally coherent with the conceptualization of anxiety as a “subjective feeling of tension, apprehension, nervousness, and worry associated with an arousal of autonomic nervous system” (Spielberger, 1983, p. 15).
Students in the final cluster (44.1% of which 43.1% are girls) exhibited below-average centroids for the eight achievement emotions assessed, whether positive or negative and, therefore, were called emotionally disengaged. A typical student from this profile performed mathematics tasks without emotional involvement.
Fifth year of elementary school
Students in the full negative profile (18.8% of which 47.5% are girls) presented highly positive centroids for the six negative emotions assessed, particularly for nervousness, anger and boredom, and negative centroids for pride and enjoyment.
The second cluster (45.4% of which 45.5% are girls) was characterized by negative centroids for all emotions measured, whether positive or negative, except for boredom, which presented an average score. For this reason, it was labeled the emotionally disengaged profile.
In contrast to the first cluster, students in the positive profile (20.6%; 31% girls) were characterized by positive emotional experiences during PST.
Students in the final cluster (15.1% of which 55.6% are girls) displayed a particularly high centroid for shame and, high centroids for anger and fear, and therefore were grouped into a self-esteem focused profile. Like their peers in Grade 3, students who perceived mathematics tasks as a potential threat to their self-esteem experienced fear of failure and when they did fail, anger accompanied their feeling of shame. However, they seemed to be able to partially counteract this pattern of negative emotions, as evidenced by a positive centroid for enjoyment.
Last year of elementary school
As with the previous years, students experiencing high levels of positive emotions and low levels of negative emotions during PST were grouped into a positive profile (32.5% of which 28% are girls). It can nevertheless be noted that levels of pride and enjoyment were lower in this profile compared to the positive profiles in the other years.
The second cluster (38.6% of which 60.4% are girls) was named the anxious profile due to positive centroids for nervousness and anger.
The third cluster (14.0% of which 54.3% are girls) was termed the self-esteem focused profile due to highly positive centroids for shame and related achievement emotions (i.e., fear of failure and sadness after failure).
In contrast to the first cluster, students with a full negative profile (14.9% of which 29.7% are girls) had a negative emotional experience when dealing with mathematical PST.
In the next section we address our second research question.
Clusters and outcomes
To look at the differences between the clusters within each year of elementary school as far as the different outcome variables assessed in the present study, multilevel analyses were performed (SPSS software), so as to take into account the nested structure of the data (i.e., students being nested within classrooms that are grouped together within schools). Multilevel modeling is a statistical approach that allows simultaneous consideration of variables at the student level (L1), at the classroom level (L2), and at the school level (L3; Bressoux, 2010; Marsh et al., 2012). This approach is of particular interest here, in that it allows identification of the variability in PS performance, perceived competence, emotion regulation and perceived value that is strictly explained by the students’ characteristics, by controlling for the variability due to classroom and school characteristics. Therefore, two random intercepts were included in the model: one for the classroom and one for the school. To control for preexisting individual differences, the same four covariates (student’s prior PS performance, school level, gender, and school’s socio-economic index score) were also included in the model. Post hoc comparisons based on the Bonferroni test were performed to compare the mean scores between the different profiles and are presented in the Supplementary Material. Detailed statistical information (means, standard error (SE) values and effect sizes2 (d)) are available as Supplementary Material.
In short, students with a positive profile tend to perform better in problem-solving tasks than those with negative profiles, such as disengaged, anxious, or angry-bored. However, in the earlier grades, negative-bored or full negative profiles were associated with a greater sense of competence in problem-solving tasks, while positive profiles became more associated with perceived competence in the later grades. Furthermore, the perceived value of achievement in mathematics varies depending on the profile, with negative profiles attaching more importance to it in the earlier grades, and positive profiles placing more value on it in the later grades. In the next sections, results are presented for each outcome variable.
Results indicated significant differences in problem-solving (PS) performance between different clusters of students in Grades 3, 4, and 5. Post hoc comparisons using the Bonferroni test showed that in Grade 3, students with a positive profile had higher PS performance than those with a negative-proud profile. In Grade 4, students with a positive profile or a disengaged profile had better performance than angry-bored students. In Grade 5, students with a positive profile had better performance than those with a disengaged or full negative profile.
The profiles differed in terms of perceived competence in each grade of primary school. In the first and second year, negative-bored and full negative profile students, respectively displayed a greater sense of competence than those with a positive or activity-focused profile. However, for older students in Grades 3, 4, and 5, the trend was reversed, with students with a positive profile having the highest sense of competence compared to those with an anxious, self-esteem focused, or negative-proud profile. Disengaged students were more confident than both angry-bored and anxious students. In the final year, students with a positive profile had the highest sense of competence compared to those with an anxious, self-esteem focused, or full negative profile. Students with a full negative profile had the lowest sense of competence compared to both anxious and self-esteem focused groups.
The different profiles of primary school students differed in perceived value of achievement among. In the first and second grade, students with negative-bored or full negative profiles placed more importance on successfully completing mathematics tasks than those with positive or sad profiles. However, this trend reversed starting in the fourth year, with positive and angry-bored students assigning more value to success in mathematics than anxious students. In the fifth and sixth grades, students with positive or self-esteem focused profiles assigned more value to achievement in mathematics than those with a full negative profile. Disengaged students also valued success in mathematics more than those with a full negative profile in the fifth grade.
As for the global utility dimension, differences were seen in Grade 2 and then in the fourth to sixth grades. More precisely, in Grade 2, those with a full negative profile perceived mathematics tasks as more useful than those with a positive profile. In Grade 4, disengaged students considered mathematics as having higher utility for daily life and school compared to anxious students. In Grade 5, self-esteem focused and positive students both assigned higher utility to mathematics tasks compared to those with a full negative or disengaged profile. In the final year, those with a positive profile viewed mathematics tasks as significantly more useful than those with an anxious or a full negative profile. Self-esteem focused students also placed more importance on mathematics tasks as compared to those with a full negative profile.
In terms of effort required and emotional cost associated with mathematics tasks, profiles stood out starting from the first year. In Grade 1, fearful-sad students associated a significantly higher cost to mathematics task completion than negative-bored or self-esteem focused students. In Grade 2, those with a full negative profile reported the lowest cost, as compared to sad, positive or activity-focused students. In Grade 3, the cost associated with mathematics tasks completion was significantly higher for those with a negative-proud profile compared to those with a positive profile. In Grade 4, angry-bored students recorded the highest cost, compared to positive, anxious or disengaged students. In Grade 5, students with a full negative profile experienced the highest cost when dealing with mathematics tasks, compared to disengaged, positive or self-esteem focused students. Further, those with a positive profile associated a lower cost with PST than disengaged or self-esteem focused students. In the final year, those with a full negative profile attached a significantly higher cost to completing mathematics tasks than positive or self-esteem focused students. In addition, the effort and emotional cost perceived by positive students was significantly lower than for anxious or self-esteem focused students.
Finally, as regards the intrinsic value of mathematics tasks, there were no significant differences between profiles before Grade 4. More precisely, in Grades 4, 5, and 6 positive students assigned the highest intrinsic value to mathematics tasks compared to the other three profiles. In addition, in Grade 5, those with a full negative profile gave the least intrinsic value to mathematics tasks. In the final year, self-esteem focused students demonstrated higher PS interest than those with a full negative profile.
Emotion regulation3
As a reminder, factor analysis indicated that students in Grades 1 through 4 used three types of strategies to regulate their negative emotions during mathematics tasks: (1) focusing on the task in order to better understand it, (2) dwelling on negative emotions and (3) avoiding situations that generate short-term negative emotions but that are academically beneficial. In Grade 1, the profiles differed significantly only in terms of task focus (see tables in the Supplementary Material). More precisely, negative-bored or self-esteem focused students used task focus substantially more than positive students. In Grade 2, those with a full negative profile still resorted the most to the task-focusing strategy in comparison to sad, positive, or activity focused students, who showed equivalent results. Further, those with a full negative or positive profile both ruminated significantly less as compared to sad or activity-focused students. In Grade 3, as was the case for the motivational factors, the situation was reversed: positive students used the task-focusing strategy substantially more than those with a negative-proud profile. Further, negative-proud students were the ones who ruminated more frequently in comparison with anxious, self-esteem focused or positive students, who were equivalent to each other. As regards the strategy consisting of avoiding academic situations that are a source of negative emotions, negative-proud or self-esteem focused students both used that strategy significantly more than anxious or positive students. In Grade 4, differences in emotion regulation only concerned the strategy of dwelling on negative emotions: angry-bored students resorted to it markedly more than those with the other three profiles: positive, anxious, and disengaged.
Students in Grades 5 and 6 relied on six types of strategy to regulate their negative emotions in mathematics: help seeking, brief attentional relaxation, task-utility self-persuasion, emotion expression, negative self-talk, and dysfunctional avoidance. In Grade 5, in terms of help seeking, self-esteem focused students resorted to it more than positive students. The task-utility self-persuasion strategy was used more by self-esteem focused students than by those with a full negative profile. As for emotion expression, those with a full negative profile resorted markedly more to this than either disengaged or positive students. As regards the negative self-talk strategy, those with a full negative profile as well as self-esteem focused students used it significantly more than disengaged or positive students. No significant differences were observed between the profiles regarding the brief attentional relaxation and dysfunctional avoidance strategies.
In Grade 6, regarding the help-seeking strategy, anxious students resorted to it more than those with a positive or full negative profile. In terms of brief attentional relaxation, students with a full negative profile used it more than positive or anxious students. Anxious students relaxed their attention more often than positive students. As for task-utility self-persuasion, self-esteem focused students relied the most on it in comparison with those with the other profiles. With regard to the emotion expression strategy, positive students relied the least on it as compared to the other three profiles. Positive students also made the least use of the negative self-talk strategy. Further, anxious students ruminate markedly less than those with a full negative profile. Finally, with respect to the dysfunctional avoidance strategy, those with a full negative profile utilized it the most. Moreover, anxious students avoided learning situations generating negative emotions significantly more as compared to positive students.
Discussion
Previous studies have provided empirical insight into the relationships between achievement emotions in the context of mathematical learning among elementary school students. However, none of them has looked at their complex combinations and the way they relate to appraisal-based antecedents (i.e., perceived competence and perceived value), emotion regulation and mathematics performance throughout (1) elementary education, and (2) profile analysis. The current study addressed these shortcomings and presented results regarding distinct subgroups of elementary problem-solvers with specific combinations of achievement emotions, as well as the way these subgroups differ regarding perceived competence, perceived value, emotion regulation and PS performance. As discussed here, the findings support and extend existing empirical evidence in the research field, and provide practical guidance for designing tailor-made interventions that fit the specific emotional needs of students according to their profiles.
In what follows, we discuss our main findings. The causes suggested to explain the observed differences and compositions are, for most part, speculative and thereby open to future research.
Evolution of each profile throughout primary school education
Evolution of the two extreme profiles
A first observation that emerges from this study is the presence, throughout primary school, of two extreme profiles: the positive and the negative.
The positive profile is characterized, whatever the grade level concerned, by a positive emotional experience during PS tasks. Students with this profile appreciate the intrinsic value of such mathematics tasks (enjoyment) and interpret the outcomes of engagement in the tasks in light of self-set standards or social comparisons (pride). While pride can be an emotional response to intrapersonal improvement in performance over time, that is, reflecting one’s success relative to how one has done in the past (self-based pride), it can also arise in response to successfully outperforming others (social comparison-based pride). In the second case, pride reflects one’s success in terms of doing well relative to others (Buechner et al., 2018). In terms of frequency, in the first year of school, pride is predominant, most likely due to the transition to a more formal form of education, which is associated with an emphasis on performance and academic achievement, with a more structured approach to the content taught that follows the national curriculum guidelines (Skouteris et al., 2012). In the second and third years, enjoyment takes the lead. It is as if the students have become accustomed to the practices promoted in primary school. In the fourth and fifth years, pride takes the lead again. This observation can be linked to the important changes that take place in the educational context: there is an increase in normative and critical evaluations from significant others (i.e., teachers, parents, peers) that leads to a growing concern with relative performance and more normative achievement comparisons, and results in self-evaluations that contain more self-criticism (Weidinger et al., 2018). Surprisingly, in the final year, students experience a little more enjoyment than pride.
It should be noted that these positive emotions are experienced with high frequency throughout school, except in the final year, when there is a drastic drop. The pressure of the end-of-primary school certification test seems to also affect the most resilient profile. Further, as we discuss later on, the intrinsic value (the mean score) assigned by students with a positive profile to PST declines substantially in Grade 6, probably because the last year is entirely focused on the certification test, which appears to the students as an externally imposed objective. On this matter, Jarrell and Lajoie (2017) claimed that “if a student views the task as having no personal relevance, then it is unlikely that they will feel any strong emotions in relation to the task” (p. 278).
Regarding its prevalence, the positive profile represented about one fifth of the overall sample except in the third year, where it represented one third of the students. Further, while in the first and second year there were as many girls as boys with a positive profile, only 30% of those with a positive profile were girls from the fourth year on. We hypothesize that the prolonged enculturation in a classroom culture, and more broadly, in a society that conveys the idea that girls have weaker mathematical ability than boys and that mathematics falls within the male domain is at least partially responsible for that significant drop (Steffens et al., 2010; Cvencek et al., 2011).
Students with a negative profile have in common that they experience a wide range of negative emotions during mathematical PS tasks. However, the frequency with which they feel them and their possible combination with a positive emotional experience varies from 1 year to another. For example, in first grade, boredom is experienced at a higher frequency than the other negative emotions. Again, the pedagogical differences between preschool and primary education may explain such an observation. Preschools promote a flexible learning environment that offers children diversity in their choice of activities, while the primary school system takes a more structured approach, focusing on a brand of content designed to build the child’s knowledge and skill base. This emphasis on instruction leads to children losing some of their independence, as there is an increase in teacher-directed activities (Skouteris et al., 2012) that may make the tasks less valuable to the students, an important source of boredom (Putwain et al., 2018).
In both the second and final years, all negative emotions are experienced with almost similar frequency. In the third year, anger and sadness are at the top of the negative emotions felt; pride is also experienced, but in a much more modest way. In the fourth year, activity-related emotions (i.e., anger, boredom) are the most frequently felt. In Grade 5, three emotions are predominant: nervousness, anger, and boredom. In accordance with previous developmental research (Casas and González-Carrasco, 2020; Li et al., 2021) that highlights an increasingly damaging emotional and motivational experience in terms of learning throughout compulsory education, our results show that the intensity of negative emotions experienced by students with a negative profile increases as they progress through primary education. To put it another way, this profile takes on an increasingly risky coloration. The negative profile represents between 35 and 40% of the sample in the first and second years and drops to 15–20% from the third year onward. While, in the third year, this shift favors the positive profile, in the fourth and fifth years, it favors the emotionally disengaged profile, and in the last year, it favors profiles that are also unfavorable in terms of learning (i.e., the anxious and self-esteem focused profiles). In terms of gender distribution, while girls are the majority in the negative profile during the first 3 years of primary school, they represent only 40% of the students in fifth grade and one third in sixth grade. As we will see later, they more heavily occupy the anxious and the self-esteem focused profiles.
Based on the analysis of these first two profiles, the first and the third primary years appear to be pivotal. The first year is about shifting from an egocentric perspective on academic situations along with informal teaching practices to a decentration incorporating the views of significant others into one’s self-evaluations along with formal pedagogical practices. In the third year, the changes observed attest to a process of enculturation into practices that promote performance and social comparison.
Evolution of the self-esteem focused profile
Less linear than the two previous profiles, the self-esteem focused profile is observed in the first, third, fifth and final years. In first grade, students with this profile feel mostly pride and, to a lesser extent, shame during PST. The predominance of positive emotions (pride) is related to young children’s tendency to overestimate their competence (Muenks et al., 2018; Weidinger et al., 2018). These findings also indicate that by the age of 6, some children have already internalized their parents’ expectations and evaluate their performance on the basis of these expectations. In this connection, pride follows when they succeed in to living up to these expectations, but shame and associated negative emotions in the opposite case. In the third year, the self-esteem focused profile is characterized by high intensity of fear, sadness and shame and, to a much lesser extent, pride, resulting from more accurate evaluation by 8-year-old children of their capabilities (Muenks et al., 2018; Weidinger et al., 2018). They are more aware that they risk failure or will fail, which generates fear of failure and sadness and shame when they do. Once again, our results suggest that the third grade is a pivotal year in the evolution of students’ emotional relationship with mathematics learning. In fifth grade, this profile is characterized by a very high level of shame and, to a much lesser extent, of fear and sadness. The stronger weight of the gaze of others (i.e., teacher, parents, peers) and hence of the processes of social comparison, and the internalization of societal representations such as the direct association between intelligence and math proficiency that is nurtured by the fact that mathematical proficiency is critical not only for STEM-related fields but also for daily life experiences in today’s high-technology world (Namkung et al., 2019), may explain this even more significant focus on self-esteem as children progress through primary education. However, although the PST are costly to their self-esteem, they are able to enjoy them while doing them. In the final year, however, students with a self-esteem focused profile experience high levels of negative emotions (i.e., fear, shame and sadness) exclusively, most likely because of the pressure due to the external certification test. This profile represents about 20% of the sample overall, except in the final year, where it represents only 14% and has a balanced gender composition.
Evolution of the anxious profile
A second profile that is encountered several times during the school years (Grades 3, 4, and 6) is the anxious profile. Nervousness and anxiety are triggered when the outcome of an activity is perceived by the learner to be very important, and the perception of being competent enough to avoid failure is quite low (Pekrun, 2006; Pekrun and Perry, 2014) following repeated experiences of failure (Dowker et al., 2012). Therefore, if this profile does not appear earlier, it is probably because the younger children over-estimate their competence. From the age of 8 onward, as children are more able to accurately assess their competence, some realize that they will not be able to solve the given problem and assess their competence downward, which triggers a feeling of anxiety.
And so, in the third grade, the anxious profile is characterized by a high level of nervousness and, to a lesser extent, of anger. In the fourth year, the level of nervousness is still high and is accompanied by fear, sadness and shame, with more moderate frequency. In the final year, it is again the combination of nervousness and anger that defines the profile, but at a significantly lower frequency than for the younger students. While this profile represents about the same proportion of the sample in the third and fourth years (between one fifth and one fourth), it doubles in the final year, most probably due to the pressure of the external certification test. Moreover, girls are over-represented in this profile, starting in the third year (60% of the sample). This is consistent with previous studies conducted with elementary students showing that girls, whether they do poorly or well in mathematics, are more prone to internal distress and anxiety (Pomerantz et al., 2002; Martin, 2004), experience fewer positive emotions, and rate their competence in mathematics lower compared to boys (Stipek and Gralinski, 1991; Jacobs et al., 2002; Frenzel et al., 2007; Lichtenfeld et al., 2012).
Evolution of the disengaged profile
The disengaged profile is observed only in Grades 4 and 5. This profile is characterized by the learner’s absence of emotional engagement in mathematics tasks. It is similar to the “quiet disaffection” profile described by Nardi and Steward (2003) as composed of students who “routinely execute but do not get substantially involved with the tasks” (p. 346). It is as if they are surfing over the tasks without really plunging in.
The fact that this pattern is not observed until later in school is likely the result of enculturation in a classroom culture that emphasizes the importance of grades and the performance-oriented aspect of school climate (Daumiller et al., 2022). From experience, some students understand that it is less costly for them to block their emotional flow when faced with tasks where they are not sure of success. We can hypothesize that these are students who have accumulated several negative experiences with this type of task and who, in order avoid losing control of their learning and performance in mathematics, have chosen to distance themselves emotionally from them. These students are endowed with a certain emotional intelligence that allows them to be aware of the impact of their emotions on their learning and performance and to manage to distance themselves from them or to repress them. Our results, however, do not allow us to identify precisely the process at work. How then can we explain that such a profile is not present in the final year? In our opinion, the pressure of the external evaluation for certification affects every student, even those who try not to get emotionally involved in academic tasks. This observation is consistent with our results regarding the positive profile. As a reminder, in the final year, positive emotions are experienced at a substantially lower frequency than in previous years.
This profile represents almost half of the sample and includes an almost equal proportion of girls and boys. This last finding seems to indicate that girls and boys are equally capable of putting their emotions aside when it comes to complex mathematics tasks.
Grade-specific profiles
Other profiles are more specific to one particular grade. In the first year, 18% of the sample feels mostly fear and sadness at a moderate frequency during PS tasks (the fearful-sad profile). This profile seems to be updated in the second year in a sad profile (22% of the sample), which gathers students who feel only sadness during PS tasks. In terms of gender, there are slightly fewer girls in the first year and slightly more girls in the second year.
In the second year, a second specific profile is observed, representing 19% of the sample: the activity-focused profile. It includes almost one fifth of the sample, grouping students whose emotional experience is strictly linked to the accomplishment of the task (i.e., enjoyment, boredom, and anger). In other words, these students are able to experience PS activities emotionally without thinking about the potential outcome and its associated consequences. Note that the majority of these students are girls. This finding tells us that girls appreciate the intrinsic value of mathematics tasks and are more focused on the task than on its outcome, which is consistent with previous observations among older students that boys are more willing to compete than girls (Booth and Nolen, 2012; Dreber et al., 2014).
Relation of the profiles to outcomes
The two extreme profiles: comparison of full positive and full negative profiles
In Grades 1 and 2, a first and rather surprising finding is the presence of a higher sense of competence among students with a negative profile than among students with a positive profile. Children up to the age of 8 are known to have a clear tendency to over-estimate their school abilities (Archambault et al., 2010; Weidinger et al., 2018). Even more, past research has shown that in early elementary school, children maintain positive expectancies for success even after receiving repeated messages that they did poorly on a task (Muenks et al., 2018; Weidinger et al., 2018). Besides, according to Bandura (1997), the individual’s belief in their capacity is more effective for behavior than the individual’s actual competence in the field; that is, the individual’s behavior is shaped according to their perceived competence. Taken together, these findings suggest that children in Grades 1 and 2 with a negative profile rely heavily on their competence belief, and that their optimistic coloring of it allows them to smooth out the negative emotions they experience and their undesirable effects in terms of learning and engagement in mathematics tasks. In this connection, our results show that they use adaptive emotion-regulation strategies more frequently (i.e., focusing on the task to better understand it) and inadequate strategies less often (i.e., dwelling on negative emotions) than the others.
Further, children in Grades 1 and 2 with a negative profile grant significantly more importance to achievement and are more convinced of the global utility of mathematics tasks than their peers with a positive profile. This echoes the facet of competence beliefs pertaining to one’s judgment of one’s capacity to execute the required actions to achieve a certain level of performance, which in our case is to solve a given problem successfully (Bandura, 1997). In addition, according to Eccles and Wigfield’s (2020) expectancy-value theory, belief in one’s competence is associated with more positive valuing of a domain. Competence belief’s orientation toward outcomes and performance explains the better positioning of students with a negative profile on these more instrumental dimensions of perceived value. In addition, students’ over-confidence seems to mask the effort and emotional cost associated with PST, in that those with a negative profile also report lower emotional cost and effort than those in the other groups. This result is consistent with current motivation theories that argue that students’ competence beliefs are the major determinant of willingness to expend effort and persistence (Zuffiano et al., 2013; Schukajlow et al., 2017). Therefore, their positive stance on both perceived value and self-competence belief and the close relationship of these with performance may explain why students with a negative profile perform as well as positive students.
Between the ages of 7 and 8, children increasingly incorporate external performance feedback and social comparisons into their self-evaluations, which generates more accurate competence beliefs (Muenks et al., 2018) starting in Grades 3 and 4. This phenomenon explains why, from the third year onward, the positive profile stands out advantageously from the others, in terms of both actual and perceived competence. In a complementary way, the earlier favorable positioning of the negative profile with regard to the importance of achievement and global utility dimensions has faded and the changeover has already taken place for the effort and cost dimension: the negative profile is less favorable on this point than the positive profile. This observation is consistent with studies showing that between the ages of 7 and 8, children can more clearly differentiate effort, ability and performance in terms of cause and effect (Muenks et al., 2018). Grade 3 appears to be a transition year as regards perceived value. The changes really become operationalized in the fourth year: the positive profile stands out significantly in terms of both intrinsic value and the importance of succeeding in PST. In other words, the positive profile distinguishes itself for both motivational directions (i.e., intrinsic and extrinsic). The change in emotion-regulation strategies also takes place in the third year. More precisely, students with a negative profile resort significantly more to maladaptive strategies (i.e., dwelling on negative emotions, avoiding learning situations generating negative emotions that have learning benefits in the long run) and significantly less to adaptive strategies (i.e., focusing on the task) than positive students. While only one difference remained significant in Grade 4, probably, in part due to the smaller sample size, means analysis indicated the same pattern in that year.
Our results indicate that the positioning of the positive and negative profiles on the emotional, motivational and cognitive dimensions seen in previous years is globally maintained in Grades 5 and 6. In this regard, the positive profile differs from the negative profile regarding current4 and perceived competence. In terms of perceived value, positive students grant more intrinsic and achievement value to PST, recognize more the usefulness of it and perceive such tasks as requiring less effort and being less emotionally costly than those with a negative profile. Students with a negative profile make more use of maladaptive emotion-regulation strategies (i.e., negative self-talk, dysfunctional avoidance) than those with a positive profile. Negative students also tend to express their negative emotions more than those with a positive profile, which is quite logical considering the valence of the emotions felt by students with the two profiles. With regard to adaptive strategies, the negative profile has the lowest scores on the task-utility self-persuasion strategy and students with this profile ask for help very rarely. Furthermore, the negative profile has the highest brief attentional relaxation score, which suggests an interpretation of the strategy on its maladaptive side (i.e., long-term distraction). Together, these findings depict a negative profile that, at the end of primary school, represents students who are academically at risk and resigned.
The anxious profile
As concerned the anxious profile, few significant differences were observed with the other three profiles. The analysis of the mean scores gives us more information to characterize it.
In terms of objective performance, the anxious profile stands between the full positive and the full negative profiles. Regarding perceived competence, it has the lowest score in Grades 3 and 4 (compared with the other profiles in these grades), which is consistent with children’s more accurate evaluation of their competence. In terms of perceived value, the anxious profile falls between the two extreme profiles, except for the importance of achievement, for which it shows the lowest score in the 3 years in which this profile is observed (i.e. Grades 3, 4, and 6). This finding is probably related to anxious students’ low sense of competence. Accordingly, Mammarella et al. (2018) showed that personal protective factors in children from grades 3 to 6, such as self-confidence and resilience, were inversely proportional to the level of anxiety (based on measures of general anxiety, test anxiety, and math anxiety). In terms of emotional regulation, in the 3 years concerned, students with an anxious profile used the strategy of rumination significantly less than those with a negative profile, and in Grades 3 and 6, they used the strategy of avoiding learning situations that are sources of negative emotions, but that are associated with learning benefits in the long run, significantly less than those with a negative profile. Finally, in the Grade 6, anxious students show the highest help-seeking score, which differs significantly from that of positive students.
Together, these results depict an anxious profile that is less risky than the negative profile. More precisely, students with an anxious profile seem to compensate for their lack of belief in their competence by resorting significantly to external regulation, which, in view of their performance and its relation to dysfunctional emotion regulation strategies, seems relatively adaptive. However, given on the one hand, the decisive role played by competence beliefs in engagement, the intention to persevere in the face of difficulties, the nature of the learning strategies used and, consequently, in performance (Zuffiano et al., 2013; Schukajlow et al., 2017) and, on the other hand, the importance of developing self-regulatory behaviors in students, since only these ensure learning (McClelland et al., 2018; Cattelino et al., 2019), it is necessary to establish a specific action plan for anxious students as well.
The self-esteem focused profile
This profile is observed from Grade 1 on. Several studies have underlined that when children start school, they begin to be evaluated by their teachers in systematic, formal, and normative ways (for a review, see, e.g., Wigfield et al., 1998; Eccles and Wigfield, 2020). Partly as a result of this evaluation, they start to engage more systematically in social comparison with peers as a way to judge their own abilities. Such self-evaluative processes generate self-conscious emotions, such as pride and shame. On the whole, the self-esteem focused profile is positioned between the negative and the positive profiles. Several results deserve to be examined more specifically. In the first year, the self-esteem focus profile differs very little from the other profiles: we note greater use of the strategy consisting of focusing on the task than in the positive profile and an evaluation of PS tasks as requiring less effort and less emotionally costly than the evaluation in the anxious profile. These students’ optimistic perception of competence generates a virtuous circle of task engagement, persistence in the face of difficulties, and pride. In Grade 3, self-esteem focused students ruminate significantly less than students with a negative profile, but avoid more tasks that cause negative emotions but are academically beneficial in the long run as compared to both anxious and negative-proud students. In Grade 5, anxious students differ from disengaged students in assigning greater importance to the success and usefulness of PS tasks, but also in ruminating more. This demarcation of the self-esteem focused profile in terms of extrinsic motivation and emotional grip is not surprising, given these students’ focus on outcomes. If the practice of rumination, because of its close relationship with deficits in executive capacity, cognitive flexibility, task-switching, concentration, attention, memory, motivation, problem-solving, and beyond learning, with negative mental health effects (Thomsen, 2006; Haeffel, 2010), makes this an academically at-risk profile, it is less so than the negative profile, in that self-esteem focused students use adaptive strategies such as focusing on the task (demarcation from the negative profile) and seeking assistance (demarcation from the positive profile). This finding is supported by an advantageous distinction in terms of perceived effort, emotional cost and intrinsic value from the negative profile. In Grade 6, these differences are maintained: self-esteem focused students show greater extrinsic motivation (global utility, importance of achievement and task-utility self-persuasion), intrinsic motivation and competence belief; perceive PST as less costly, and face more tasks that are a source of negative emotions but academically beneficial than those with a negative profile.
The disengaged profile
Overall, our findings indicate that the disengaged profile is not the most academically risky profile. In Grade 4, disengaged students show better objective and perceived competence and less rumination than those with a negative profile. An interesting result is this profile’s favorable positioning on the different dimensions of perceived value. It is as if the ability to put the negative emotions felt on the back burner allow students with this profile to stay sufficiently engaged in PST, reinforcing the close relationship between motivation and emotions (Pekrun and Perry, 2014; Pinxten et al., 2014). This emotional non-engagement seems to also protect disengaged students against rumination and a reading of mathematics tasks in terms of effort and emotional cost. Taken together, our results indicate that the emotionally disengaged profile is relatively academically well-adjusted. As outlined in the research (Pekrun and Perry, 2014; Goetz and Bieg, 2016), both negative and positive emotions draw on cognitive resources that thereby become inaccessible for the learning tasks. This led Goetz and Bieg (2016) to conclude that “a relatively neutral mood is the most desirable state for enhancing achievement, especially if emotions are not directly related to the learning or academic activity” (p. 285).
Limitations and future perspectives
This study has several limitations. First, the typical constraints related to the use of self-report instruments (e.g., desirability biases) are present here and future research could extend these results with data related to students’ performance, such as end-of-year grades or standardized test scores. Second, in connection with that, our understanding of the characteristics of each profile and of the evolution of the profiles throughout primary education would benefit from being deepened and nuanced by physiological measures of emotions and engagement, qualitative studies, observation of students’ behaviors in natural contexts and interviews with several students from each profile. Third, the evolution of each outcome variable from Grade 1 to Grade 6 should be considered with caution, since scales were slightly adapted to ensure understanding by younger students. Fourth, and related to the previous point, our findings do not allow us to say whether in Grades 1 and 2, it is the students with a negative profile who stand out by showing a favorable emotional and motivational relationship with PST or the students with a positive profile who, because they enjoy such tasks, are not too concerned about their instrumental aspect. To better grasp the differences observed between Grade 1 and Grade 2, it would be interesting to look at preschooler’s emotional and motivational profiles in mathematics. Finally, limitations due to the cross-sectional nature should be overcome in future studies exploring these developments with a longitudinal design.
Notwithstanding these limitations, our findings can be considered as a first step toward a better understanding of primary school students’ emotional and motivational relations with complex mathematics tasks from a profile analysis, which has been largely neglected by the current literature. From a theoretical perspective, our findings provide better insight into pivotal periods (Grades 1 and 3) and suggest giving close attention to these crucial moments. From a practical perspective, such knowledge could guide stakeholders in various ways. For instance, it is of chief importance to teach learners and teachers that academic emotions are both controllable and valuable. If academic emotions are viewed as uncontrollable, students’ and teachers’ attempts at regulating academic emotions will not be successful. More specifically, CVT offers stakeholders such as teachers, parents, or psychologists the potential to foster success at school by intervening in ways that are assumed to influence later performance. More attention should paid to the possibility of enhancing school performance by focusing on students’ understanding of emotions (MacCann et al., 2020).
Data availability statement
The raw data supporting the conclusions of this article will be made available by the authors, without undue reservation.
Ethics statement
Ethical review and approval was not required for the study on human participants in accordance with the local legislation and institutional requirements. Written informed consent to participate in this study was provided by the participants’ legal guardian/next of kin.
Author contributions
Both authors listed have made a substantial, direct, and intellectual contribution to the work, and approved it for publication.
Funding
Open access funding by Haute École Pédagogique Du Canton De Vaud (HEP Vaud).
Conflict of interest
The authors declare that the research was conducted in the absence of any commercial or financial relationships that could be construed as a potential conflict of interest.
Publisher’s note
All claims expressed in this article are solely those of the authors and do not necessarily represent those of their affiliated organizations, or those of the publisher, the editors and the reviewers. Any product that may be evaluated in this article, or claim that may be made by its manufacturer, is not guaranteed or endorsed by the publisher.
Supplementary material
The Supplementary Material for this article can be found online at: https://www.frontiersin.org/articles/10.3389/feduc.2023.1117676/full#supplementary-material
Footnotes
- ^ Throughout the remainder of the article we use the following abbreviations to refer to the six grades of primary education: G1 (Grade 1), G2 (Grade 2), G3 (Grade 3), G4 (Grade 4), G5 (Grade 5), and G6 (Grade 6).
- ^ Cohen’s d was calculated based on the recommendations of Cumming (2013).
- ^ Emotion regulation strategies were measured with a binary response scale (1 = yes; 2 = no) from Grade 1 to Grade 4. A low mean score reflects high utilization of the strategy while a high mean score denotes low utilization of the strategy. For the last 2 years, we used a 4-point response scale (1 = strongly disagree; 4 = strongly agree). In this case, a low mean score indicates low use, while a high mean score reflects high use.
- ^ It should be noted that although the difference in actual performance between the two profiles is not statistically significant in the final year, means analysis showed a pattern similar to that observed in the fifth year.
References
Ahmed, W., Minnaert, A., Kuyper, H., and van der Werf, G. (2012). Reciprocal relationships between math self-concept and math anxiety. Learn. Individual Differ. 22, 385–389. doi: 10.1016/j.lindif.2011.12.004
Aldenderfer, M., and Blashfield, R. (1984). Cluster Analysis. Thousand Oaks, CA: SAGE. doi: 10.4135/9781412983648
Archambault, I., Eccles, J. S., and Vida, M. N. (2010). Ability self-concepts and subjective value in literacy: joint trajectories from Grades 1 through 12. J. Educ. Psychol. 102, 804–816. doi: 10.1037/a0021075
Ben-Eliyahu, A., and Linnenbrink-Garcia, L. (2013). Extending self-regulated learning to include self-regulated emotion strategies. Motiv. Emot. 37, 558–573. doi: 10.1007/s11031-012-9332-3
Bergman, L. R. (1998). “A pattern-oriented approach to studying individual development: snapshots and processes,” in Methods and Models for Studying the Individual, eds R. B. Cairns, L. R. Bergman, and J. Kagan (Thousand Oaks, CA: SAGE), 83–122.
Beswick, K., Wright, S., Watson, J., Hay, I., Allen, J., and Cranston, N. (2019). Teachers’ beliefs related to secondary school completion: associations with socio-educational advantage and school level. Aust. Educ. Res. 46, 751–774. doi: 10.1007/s13384-019-00317-3
Boekaerts, M. (2002). The on-line motivation questionnaire: a self-report instrument to assess students’ context sensitivity. New Dir. Meas. Methods 12, 77–120.
Booth, A., and Nolen, P. (2012). Choosing to compete: how different are girls and boys? J. Econ. Behav. Organ. 81, 542–555. doi: 10.1016/j.jebo.2011.07.018
Bouffard, T., and Vezeau, C. (2010). “Intention d’apprendre, motivation et apprentissage autorégulé: Le rôle de la perception de compétence et des émotions [Learning intention, motivation and self-regulated learning: the role of perceived competence and emotions],” in Psychologie des Apprentissages scolaires, eds M. Crahay and M. Dutrevis (Paris: De Boeck Supérieur), 66–84.
Breckenridge, J. N. (2000). Validating cluster analysis: consistent replication and symmetry. Multivariate Behav. Res. 35, 261–285. doi: 10.1207/S15327906MBR3502_5
Bressoux, P. (2010). Modélisation Statistique Appliquée aux Sciences Sociales [Statistical modeling applied to social sciences]. France: De Boeck Supérieur. doi: 10.3917/dbu.bress.2010.01
Buechner, V. L., Pekrun, R., and Lichtenfeld, S. (2018). The achievement pride scales (APS). Eur. J. Psychol. Assess. 34, 181–192. doi: 10.1027/1015-5759/a000325
Casas, F., and González-Carrasco, M. (2020). The evolution of positive and negative affect in a longitudinal sample of children and adolescents. Child Indicators Res. 13, 1503–1521. doi: 10.1007/s12187-019-09703-w
Cattelino, E., Morelli, M., Baiocco, R., and Chirumbolo, A. (2019). From external regulation to school achievement: the mediation of self-efficacy at school. J. Appl. Dev. Psychol. 60, 127–133. doi: 10.1016/j.appdev.2018.09.007
Coelho, V. A., Marchante, M., and Jimerson, S. R. (2017). Promoting a positive middle school transition: a randomized-controlled treatment study examining self-concept and self-esteem. J. Youth Adolesc. 46, 558–569. doi: 10.1007/s10964-016-0510-6
Cohen, J. (1960). A coefficient of agreement for nominal scales. Educ. Psychol. Meas. 20, 37–46. doi: 10.1177/001316446002000104
Cumming, G. (2013). Cohen’s d needs to be readily interpretable: comment on Shieh (2013). Behav. Res. Methods 45, 968–971. doi: 10.3758/s13428-013-0392-4
Cvencek, D., Meltzoff, A. N., and Greenwald, A. G. (2011). Math-gender stereotypes in elementary school children. Child Dev. 82, 766–779. doi: 10.1111/j.1467-8624.2010.01529.x
Daumiller, M., Fasching, M. S., Steuer, G., Dresel, M., and Dickhäuser, O. (2022). From teachers’ personal achievement goals to students’ perceptions of classroom goal structures: via student-oriented goals and specific instructional practices. Teach. Teacher Educ. 111:103617. doi: 10.1016/j.tate.2021.103617
Depaepe, F., Torbeyns, J., Vermeersch, N., Janssens, D., Janssen, R., Kelchtermans, G., et al. (2015). Teachers’ content and pedagogical content knowledge on rational numbers: a comparison of prospective elementary and lower secondary school teachers. Teach. Teacher Educ. 47, 82–92. doi: 10.1016/j.tate.2014.12.009
Dowker, A., Bennett, K., and Smith, L. (2012). Attitudes to mathematics in primary school children. Child Dev. Res. 2012:e124939. doi: 10.1155/2012/124939
Dreber, A., von Essen, E., and Ranehill, E. (2014). Gender and competition in adolescence: task matters. Exp. Econ. 17, 154–172. doi: 10.1007/s10683-013-9361-0
Eccles, J. S., and Wigfield, A. (2020). From expectancy-value theory to situated expectancy-value theory: a developmental, social cognitive, and sociocultural perspective on motivation. Contemp. Educ. Psychol. 61:101859. doi: 10.1016/j.cedpsych.2020.101859
Enseignement Belgium (n.d.). Indice Socioéconomique des Implantations, Établissements et Secteurs Statistiques [Socio-economic index of locations, schools and statistical sectors]. Available online at: http://www.enseignement.be/index.php?page=28576&navi=4891 (accessed January 21, 2022).
Fadda, D., Scalas, L. F., Morin, A. J. S., Marsh, H. W., and Gaspard, H. (2020). Value beliefs about math: a bifactor-ESEM representation. Eur. J. Psychol. Assess. 36, 259–268. doi: 10.1027/1015-5759/a000513
Forsblom, L., Pekrun, R., Loderer, K., and Peixoto, F. (2022). Cognitive appraisals, achievement emotions, and students’ math achievement: a longitudinal analysis. J. Educ. Psychol. 114, 346–367. doi: 10.1037/edu0000671
Frenzel, A. C., Pekrun, R., and Goetz, T. (2007). Girls and mathematics—a “hopeless” issue? a control-value approach to gender differences in emotions towards mathematics. Eur. J. Psychol. Educ. 22:497. doi: 10.1007/BF03173468
Garnefski, N., Rieffe, C., Jellesma, F., Terwogt, M. M., and Kraaij, V. (2006). Cognitive emotion regulation strategies and emotional problems in 9–11-year-old children. Eur. Child Adolesc. Psychiatry 16, 1–9. doi: 10.1007/s00787-006-0562-3
Gaspard, H., Dicke, A.-L., Flunger, B., Brisson, B. M., Häfner, I., Nagengast, B., et al. (2015). Fostering adolescents’ value beliefs for mathematics with a relevance intervention in the classroom. Dev. Psychol. 51, 1226–1240. doi: 10.1037/dev0000028
Gaspard, H., Häfner, I., Parrisius, C., Trautwein, U., and Nagengast, B. (2017). Assessing task values in five subjects during secondary school: measurement structure and mean level differences across grade level, gender, and academic subject. Contemp. Educ. Psychol. 48, 67–84. doi: 10.1016/j.cedpsych.2016.09.003
George, F., and Pech-Georgel, C. (2012). BELO: Batterie D’évaluation de lecture et D’orthographe - Recharge 10 Cahiers - Cahier Passation CP [Reading and spelling assessment battery-Refill 10 notebooks-Passing notebook Grade 1 & 2]. France: De Boeck Supérieur.
Goetz, T., and Bieg, M. (2016). “Academic emotions and their regulation via emotional intelligence,” in Psychosocial Skills and School Systems in the 21st Century: Theory, Research, and Practice, eds A. A. Lipnevich, F. Preckel, and R. D. Roberts (Berlin: Springer International Publishing), 279–298. doi: 10.1007/978-3-319-28606-8_11
Gross, J. J. (1998). Antecedent- and response-focused emotion regulation: divergent consequences for experience, expression, and physiology. J. Pers. Soc. Psychol. 74, 224–237. doi: 10.1037/0022-3514.74.1.224
Gross, J. J., and Thompson, R. A. (2007). “Emotion regulation: conceptual foundations,” in Handbook of Emotion Regulation, ed. J. J. Gross (New York: The Guilford Press), 3–24.
Gudmundsson, E. (2009). Guidelines for translating and adapting psychological instruments. Nordic Psychol. 61, 29–45. doi: 10.1027/1901-2276.61.2.29
Haeffel, G. J. (2010). Cognitive vulnerability to depressive symptoms in college students: a comparison of traditional, weakest-link, and flexibility operationalizations. Cogn. Therapy Res. 34, 92–98. doi: 10.1007/s10608-008-9224-8
Hair, J. F., Anderson, R. E., Tatham, R. L., and Black, W. C. (1998). Multivariate Data Analysis, 5th Edn. Hoboken, NJ: Prentice Hall.
Hall, L., Hume, C., and Tazzyman, S. (2016). Five Degrees of Happiness: Effective Smileyface Likert Scales for Evaluating with Children. New York, NY: ACM, 311–321. doi: 10.1145/2930674.2930719
Hanin, V., and Van Nieuwenhoven, C. (2018). Developing an expert and reflexive approach to problem-solving: The place of emotional knowledge and skills. Psychology 9, 280–309. doi: 10.4236/psych.2018.92018
Hanin, V., and Van Nieuwenhoven, C. (2019). Emotional and motivational relationship of elementary students to mathematical problem-solving: A person-centered approach. Eur. J. Psychol. Educ. 34, 705–730. doi: 10.1007/s10212-018-00411-7
Hanin, V., and Van Nieuwenhoven, C. (2020). Exploration of cognitive, motivational, emotional and regulative behaviors of elementary-school novice and expert problem-solvers. Can. J. Sci. Math. Technol. Educ. 20, 312–341. doi: 10.1007/s42330-020-00092-9
Hanin, V., Van Nieuwenhoven, C., Mikolajczak, M., Grégoire, J., and Fantini-Hauwel, C. (2017). Children’s Emotion Regulation Scale in Mathematics (CERS-M): Development and validation of a self-reported instrument. Psychol. Res. 8, 2240–2275. doi: 10.4236/psych.2017.813143
Harley, J. M., Pekrun, R., Taxer, J. L., and Gross, J. J. (2019). Emotion regulation in achievement situations: an integrated model. Educ. Psychol. 54, 106–126. doi: 10.1080/00461520.2019.1587297
Hayenga, A. O., and Corpus, J. H. (2010). Profiles of intrinsic and extrinsic motivations: a person-centered approach to motivation and achievement in middle school. Motivation Emot. 34, 371–383. doi: 10.1007/s11031-010-9181-x
Holodynski, M., and Kronast, S. (2009). “Shame and pride: invisible emotions in classroom research,” in Emotions as Bio-Cultural Processes, eds H. J. Markowitsch and B. Röttger-Rössler (Berlin: Springer), 371–394. doi: 10.1007/978-0-387-09546-2_17
Jacobs, J. E., Lanza, S., Osgood, D. W., Eccles, J. S., and Wigfield, A. (2002). Changes in children’s self-competence and values: gender and domain differences across grades one through twelve. Child Dev. 73, 509–527. doi: 10.1111/1467-8624.00421
Jacobs, S. E., and Gross, J. J. (2014). “Emotion regulation in education: conceptual foundations, current applications, and future directions,” in International Handbook of Emotions in Education, eds R. Pekrun and L. Linnenbrink-Garcia (Milton Park: Routledge), 183–201.
Jarrell, A., and Lajoie, S. P. (2017). The regulation of achievement emotions: implications for research and practice. Can. Psychol. 58, 276–287. doi: 10.1037/cap0000119
Jindal-Snape, D., Hannah, E. F. S., Cantali, D., Barlow, W., and MacGillivray, S. (2020). Systematic literature review of primary-secondary transitions: international research. Rev. Educ. 8, 526–566. doi: 10.1002/rev3.319
Justicia-Galiano, M. J., Martín-Puga, M. E., Linares, R., and Pelegrina, S. (2017). Math anxiety and math performance in children: the mediating roles of working memory and math self-concept. Br. J. Educ. Psychol. 87, 573–589. doi: 10.1111/bjep.12165
Kwon, K., Hanrahan, A. R., and Kupzyk, K. A. (2017). Emotional expressivity and emotion regulation: relation to academic functioning among elementary school children. School Psychol. Quart. 32, 75–88. doi: 10.1037/spq0000166
Lajoie, C., and Bednarz, N. (2014). La résolution de problèmes en mathématiques au québec: évolution des rôles assignés par les programmes et des conseils donnés aux enseignants [solving math problems in québec: changing roles assigned by programs and advice given to teachers]. Éducation et francophonie 42, 7–23. doi: 10.7202/1027903ar
Leiss, D., Schukajlow, S., Blum, W., Messner, R., and Pekrun, R. (2010). The role of the situation model in mathematical modelling—task analyses, student competencies, and teacher interventions. J. Math. Didakt. 31, 119–141. doi: 10.1007/s13138-010-0006-y
Li, Q., Cho, H., Cosso, J., and Maeda, Y. (2021). Relations between students’ mathematics anxiety and motivation to learn mathematics: a meta-analysis. Educ. Psychol. Rev. 33, 1017–1049. doi: 10.1007/s10648-020-09589-z
Lichtenfeld, S., Pekrun, R., Stupnisky, R. H., Reiss, K., and Murayama, K. (2012). Measuring students’ emotions in the early years: the achievement emotions questionnaire-elementary school (AEQ-ES). Learn. Individual Differ. 22, 190–201. doi: 10.1016/j.lindif.2011.04.009
Lobrot, M. (1967). Batterie pour mesurer la lecture et l’orthographe, ORLEC [Test to measure reading and spelling]. Beaumont-sur-Oise: Bureau d’Etudes et de Recherches.
MacCann, C., Jiang, Y., Brown, L. E. R., Double, K. S., Bucich, M., and Minbashian, A. (2020). Emotional intelligence predicts academic performance: a meta-analysis. Psychol. Bull. 146, 150–186. doi: 10.1037/bul0000219
Mammarella, I. C., Donolato, E., Caviola, S., and Giofrè, D. (2018). Anxiety profiles and protective factors: a latent profile analysis in children. Pers. Individual Differ. 124, 201–208. doi: 10.1016/j.paid.2017.12.017
Marsh, H. W., Lüdtke, O., Nagengast, B., Trautwein, U., Morin, A. J. S., Abduljabbar, A. S., et al. (2012). Classroom climate and contextual effects: conceptual and methodological issues in the evaluation of group-level effects. Educ. Psychol. 47, 106–124. doi: 10.1080/00461520.2012.670488
Martin, A. J. (2004). School motivation of boys and girls: differences of degree, differences of kind, or both? Aust. J. Psychol. 56, 133–146. doi: 10.1080/00049530412331283363
McClelland, M., Geldhof, J., Morrison, F., Gestsdóttir, S., Cameron, C., Bowers, E., et al. (2018). “Self-regulation,” in Handbook of Life Course Health Development, eds N. Halfon, C. Forrest, R. Lerner, and E. Faustman (Berlin: Springer), 275–298. doi: 10.1007/978-3-319-47143-3_12
Mellor, D., and Moore, K. A. (2014). The use of likert scales with children. J. Pediatric Psychol. 39, 369–379. doi: 10.1093/jpepsy/jst079
Mikolajczak, M., and Desseilles, M. (2012). Traité de Régulation des Émotions [Handbook on Emotional Regulation]. France: De Boeck Supérieur.
Muenks, K., Wigfield, A., and Eccles, J. S. (2018). I can do this! the development and calibration of children’s expectations for success and competence beliefs. Dev. Rev. 48, 24–39. doi: 10.1016/j.dr.2018.04.001
Namkung, J. M., Peng, P., and Lin, X. (2019). The relation between mathematics anxiety and mathematics performance among school-aged students: a meta-analysis. Rev. Educ. Res. 89, 459–496. doi: 10.3102/0034654319843494
Nardi, E., and Steward, S. (2003). Is mathematics T.I.R.E.D? a profile of quiet disaffection in the secondary mathematics classroom. Br. Educ. Res. J. 29, 345–367. doi: 10.1080/01411920301852
Nolen-Hoeksema, S., Wisco, B. E., and Lyubomirsky, S. (2008). Rethinking rumination. Perspect. Psychol. Sci. 3, 400–424. doi: 10.1111/j.1745-6924.2008.00088.x
Organisation for Economic Co-operation and Development (2015). Development Co-Operation Report 2016: the Sustainable Development Goals as Business Opportunities. Available online at: https://www.oecd.org/pisa/pisa-2015-results-in-focus.pdf
Organisation for Economic Co-operation and Development (2018). Development Co-Operation Report 2018: Joining Forces to Leave No One Behind. Available online at: https://www.oecd.org/pisa/publications/pisa-2018-results.htm
Park, P. S., and Lewis, M. (2021). On the measurement of self-conscious emotions. Child Psychiatry Hum. Dev. 52, 1164–1172. doi: 10.1007/s10578-020-01094-2
Peixoto, F., Sanches, C., Mata, L., and Monteiro, V. (2017). How do you feel about math?”: relationships between competence and value appraisals, achievement emotions and academic achievement. Eur. J. Psychol. Educ. 32, 385–405. doi: 10.1007/s10212-016-0299-4
Pekrun, R. (2006). The control-value theory of achievement emotions: assumptions, corollaries, and implications for educational research and practice. Educ. Psychol. Rev. 18, 315–341. doi: 10.1007/s10648-006-9029-9
Pekrun, R., and Perry, R. P. (2014). “Control-value theory of achievement emotions,” in International Handbook of Emotions in Education, eds R. Pekrun and L. Linnenbrink-Garcia (Milton Park: Routledge), 120–141. doi: 10.4324/9780203148211
Pekrun, R., Goetz, T., Daniels, L. M., Stupnisky, R. H., and Perry, R. P. (2010). Boredom in achievement settings: exploring control–value antecedents and performance outcomes of a neglected emotion. J. Educ. Psychol. 102, 531–549. doi: 10.1037/a0019243
Pekrun, R., Goetz, T., Frenzel, A. C., Barchfeld, P., and Perry, R. P. (2011). Measuring emotions in students’ learning and performance: the achievement emotions questionnaire (AEQ). Contemp. Educ. Psychol. 36, 36–48. doi: 10.1016/j.cedpsych.2010.10.002
Pekrun, R., Hall, N. C., Goetz, T., and Perry, R. P. (2014). Boredom and academic achievement: testing a model of reciprocal causation. J. Educ. Psychol. 106, 696–710. doi: 10.1037/a0036006
Pekrun, R., Lichtenfeld, S., Marsh, H. W., Murayama, K., and Goetz, T. (2017). Achievement emotions and academic performance: longitudinal models of reciprocal effects. Child Dev. 88, 1653–1670. doi: 10.1111/cdev.12704
Pinxten, M., Marsh, H. W., De Fraine, B., Van Den Noortgate, W., and Van Damme, J. (2014). Enjoying mathematics or feeling competent in mathematics? reciprocal effects on mathematics achievement and perceived math effort expenditure. Br. J. Educ. Psychol. 84, 152–174. doi: 10.1111/bjep.12028
Pomerantz, E. M., Altermatt, E. R., and Saxon, J. L. (2002). Making the grade but feeling distressed: gender differences in academic performance and internal distress. J. Educ. Psychol. 94, 396–404. doi: 10.1037/0022-0663.94.2.396
Putwain, D. W., Becker, S., Symes, W., and Pekrun, R. (2018). Reciprocal relations between students’ academic enjoyment, boredom, and achievement over time. Learn. Instruct. 54, 73–81. doi: 10.1016/j.learninstruc.2017.08.004
Putwain, D. W., Schmitz, E. A., Wood, P., and Pekrun, R. (2021). The role of achievement emotions in primary school mathematics: control–value antecedents and achievement outcomes. Br. J. Educ. Psychol. 91, 347–367. doi: 10.1111/bjep.12367
Raccanello, D., Brondino, M., Moè, A., Stupnisky, R., and Lichtenfeld, S. (2019). Enjoyment, boredom, anxiety in elementary schools in two domains: relations with achievement. J. Exp. Educ. 87, 449–469. doi: 10.1080/00220973.2018.1448747
Rubie-Davies, C. M., and Hattie, J. A. C. (2012). The dangers of extreme positive responses in likert scales administered to young children. Int. J. Educ. Psychol. Assess. 11, 75–89.
Schmidt, S., Tinti, C., Levine, L. J., and Testa, S. (2010). Appraisals, emotions and emotion regulation: an integrative approach. Motiv. Emot. 34, 63–72. doi: 10.1007/s11031-010-9155-z
Schukajlow, S., Rakoczy, K., and Pekrun, R. (2017). Emotions and motivation in mathematics education: theoretical considerations and empirical contributions. ZDM Math. Educ. 49, 307–322. doi: 10.1007/s11858-017-0864-6
Skouteris, H., Watson, B., and Lum, J. (2012). Preschool children’s transition to formal schooling: the importance of collaboration between teachers, parents and children. Aust. J. Early Childh. 37, 78–85. doi: 10.1177/183693911203700411
Spielberger, C. D. (1983). Manual for the State-Trait Anxiety Inventory STAI (Form Y). Palo Alto, CA: Consulting Psychologists Press. doi: 10.1037/t06496-000
Steffens, M. C., Jelenec, P., and Noack, P. (2010). On the leaky math pipeline: comparing implicit math-gender stereotypes and math withdrawal in female and male children and adolescents. J. Educ. Psychol. 102, 947–963. doi: 10.1037/a0019920
Stipek, D. J., and Gralinski, J. H. (1991). Gender differences in children’s achievement-related beliefs and emotional responses to success and failure in mathematics. J. Educ. Psychol. 83, 361–371. doi: 10.1037/0022-0663.83.3.361
Szczygieł, M., and Pieronkiewicz, B. (2022). Exploring the nature of math anxiety in young children: intensity, prevalence, reasons. Math. Thinking Learn. 24, 248–266. doi: 10.1080/10986065.2021.1882363
Thomsen, R. W. (2006). The lesser known effects of statins: benefits on infectious outcomes may be explained by “healthy user” effect. BMJ 333, 980–981. doi: 10.1136/bmj.39024.513218.BE
Tibshirani, R., and Walther, G. (2005). Cluster validation by prediction strength. J. Comput. Graph. Stat. 14, 511–528. doi: 10.1198/106186005X59243
Tzohar-Rozen, M., and Kramarski, B. (2017). Metacognition and meta-affect in young students: does it make a difference in mathematical problem solving? Teach. Coll. Rec. 119, 1–26. doi: 10.1177/016146811711901308
Valentine, J. C., DuBois, D. L., and Cooper, H. (2004). The relation between self-beliefs and academic achievement: a meta-analytic review. Educ. Psychol. 39, 111–133. doi: 10.1207/s15326985ep3902_3
van den Berg, M., Bosker, R. J., and Suhre, C. J. M. (2018). Testing the effectiveness of classroom formative assessment in dutch primary mathematics education. Sch. Eff. Sch. Improv. 29, 339–361. doi: 10.1080/09243453.2017.1406376
Vierhaus, M., Lohaus, A., and Wild, E. (2016). The development of achievement emotions and coping/emotion regulation from primary to secondary school. Learn. Instruct. 42, 12–21. doi: 10.1016/j.learninstruc.2015.11.002
Weidinger, A. F., Steinmayr, R., and Spinath, B. (2018). Changes in the relation between competence beliefs and achievement in math across elementary school years. Child Dev. 89, e138–e156. doi: 10.1111/cdev.12806
Wieselmann, J. R., Roehrig, G. H., and Kim, J. N. (2020). Who succeeds in STEM? elementary girls’attitudes and beliefs about self and STEM. School Sci. Math. 120, 297–308. doi: 10.1111/ssm.12407
Wigfield, A., and Eccles, J. S. (1992). The development of achievement task values: a theoretical analysis. Dev. Rev. 12, 265–310. doi: 10.1016/0273-2297(92)90011-P
Wigfield, A., and Eccles, J. S. (2020). “Chapter five - 35 years of research on students’ subjective task values and motivation: a look back and a look forward,” in Advances in Motivation Science, Vol. 7, ed. A. J. Elliot (Amsterdam: Elsevier), 161–198. doi: 10.1016/bs.adms.2019.05.002
Wigfield, A., Eccles, J. S., and Rodriguez, D. (1998). The development of children’s motivation in school contexts. Rev. Res. Educ. 23, 73–118. doi: 10.2307/1167288
Wu, S., Amin, H., Barth, M., Malcarne, V., and Menon, V. (2012). Math anxiety in second and third graders and its relation to mathematics achievement. Front. Psychol. 3:162. doi: 10.3389/fpsyg.2012.00162
Keywords: achievement emotions, competence and value beliefs, mathematics performance, elementary students, profile analysis
Citation: Hanin V and Gay P (2023) Comparative analysis of students’ emotional and motivational profiles in mathematics in grades 1–6. Front. Educ. 8:1117676. doi: 10.3389/feduc.2023.1117676
Received: 06 December 2022; Accepted: 02 May 2023;
Published: 17 May 2023.
Edited by:
Farzad Radmehr, Norwegian University of Science and Technology, NorwayReviewed by:
Alberto Crescentini, University of Applied Sciences and Arts of Southern Switzerland, SwitzerlandAnn Dowker, University of Oxford, United Kingdom
Copyright © 2023 Hanin and Gay. This is an open-access article distributed under the terms of the Creative Commons Attribution License (CC BY). The use, distribution or reproduction in other forums is permitted, provided the original author(s) and the copyright owner(s) are credited and that the original publication in this journal is cited, in accordance with accepted academic practice. No use, distribution or reproduction is permitted which does not comply with these terms.
*Correspondence: Vanessa Hanin, vanessa.hanin@uclouvain.be