Deep Semantic Segmentation for Rapid Extraction and Spatial-Temporal Expansion Variation Analysis of China’s Urban Built-Up Areas
 Maoyang Bai
 Shiqi Zhang1
 - 1College of Earth Sciences, Chengdu University of Technology, Chengdu, China
- 2College of Tourism and Urban-Rural Planning, Chengdu University of Technology, Chengdu, China
Changes in the spatial expansion of urban built-up areas are of great significance for the analysis of China’s urbanization process and economic development. Nighttime light data can be used to extract urban built-up areas in a large-scale and long-time series. In this article, we introduced the UNet model, a semantic segmentation network, as a base architecture, added spatial attention and channel attention modules to the encoder part to improve the boundary integrity and semantic consistency of the change feature map, and constructed an urban built-up area extraction model—CBAM_UNet. Also, we used this model to extract urban built-up areas from 2012 to 2021 and analyzed the spatial and temporal expansion of China’s urban built-up areas in terms of expansion speed, expansion intensity, expansion direction, and gravity center migration. In the last decade, the distribution pattern of urban built-up areas in China has gradually changed from “center” to “periphery-networked” distribution pattern. It reveals a trend from agglomeration to the dispersion of urban built-up areas in China. It provides a reference for China’s urban process and its economic development.
1 Introduction
In 2012, China’s economy ushered the “New Normal” period. After experiencing rapid growth, China’s economic growth rate began to slow down (Yang and Zhao, 2020; Yu et al., 2020). In 1966, J.R. Fridemna proposed the “center-periphery” theory, which emphasizes that regional economic growth must be accompanied by changes in the spatial structure of the economy and is mainly used as a theoretical model to explain the unbalanced development process between inter-regional or rural and urban areas (Liu et al., 2018). Urban built-up area expansion provides resources and capital for rapid industrialization and urbanization, thus promoting economic growth, which will drive the agglomeration of resources and labor, promoting the further expansion of urban built-up areas, but the expansion also brings various problems, such as endangering national food security and reducing biodiversity (Yue et al., 2014; Yang et al., 2020). Urban built-up areas are the most rapidly changing areas in China during the transition period, and the extent of urban built-up areas expansion affects the quality of urbanization and the process of sustainable development in China significantly (Liu et al., 2016; Zhang et al., 2016; Li J. et al., 2017; Hu et al., 2018). Therefore, accurate spatial change in urban built-up areas is essential to detect the urbanization process and to analyze the driving factors of urban development and its impact on the environment in China.
The gradual development of the remote sensing technology and big data technology offers the possibility of rapidly extracting urban built-up areas (Zhang et al., 2018; Bramhe et al., 2020). In recent years, a large number of high-resolution (12–30 m) built-up area products have been released globally and regionally, such as Fine Resolution Observation and Monitoring of Global Land Cover (FROM-GLC) (Gong et al., 2013) and GlobeLand30 (Chen et al., 2015), which contains built-up areas as of 2010. Although these product data have high accuracy, due to the limitations of remote sensing image quality and launch time, most of them have only 1 year of built-up area data, and there is also the problem of confusion with the classification of bare land (Liu et al., 2019). The nighttime light data (NTL) can provide timely urbanization information, and it reflects the regional light intensity of the earth’s surface at night and the weak light emitted from cities or even rural areas, traffic flow, etc. Therefore, it can also clearly distinguish urban and non-urban areas, and nighttime light data can frequently and quickly obtain information about the earth’s surface at night. Simultaneously, it can largely avoid the spectral confusion of traditional multispectral remote sensing, so it is widely used in long time series urban monitoring research. In recent years, with the continuous enrichment of nighttime light remote sensing data products, especially the emergence of the new generation of nighttime light data NPP/VIIRS (National Polar-Orbiting Partnership’s Visible Infrared Imaging Radiometer Suite), which has effectively improved the spatial resolution, temporal resolution, radiative resolution (Shi et al., 2014), and other deficiencies of DMSP/OLS (Defense Meteorological Satellite Program Operational Linescan System) nighttime light data, it expands the research direction and application fields of nighttime light data (Li and Zhou, 2017).
The data selection methods to extract urban built-up areas mainly include the following three ways: first, the nighttime light data were used alone. However, the lower spatial resolution and insufficient detailed information on urban built-up areas will lead to lower accuracy of the extraction (Zhang and Seto, 2013). Second, it extracted urban built-up areas by combining nighttime light data with statistical data, but statistical data are difficult to obtain and have low timeliness. Third, the method combined nighttime light data and remote sensing images to extract urban built-up areas, which is commonly used in small-scale extraction (Ma, 2018; He et al., 2020; Li et al., 2020), for example, combining the traditional remote sensing image Landsat with nighttime light data. However, the Landsat image has many bands, and extracting urban built-up areas on a large scale requires a large amount of data, resulting in a more complex and time-consuming experimental setup for extraction (Liu et al., 2021; Mithun et al., 2021). Lu et al. (2008) found that combining MODIS (moderate-resolution imaging spectroradiometer) and NDVI (Normalized Difference Vegetation Index) data with DMSP/OLS nighttime light data can improve the accuracy of urban built-up area extraction. In our experiment, a new generation of nighttime light data NPP/VIIRS combined with MODIS NDVI data was selected to explore a fast and accurate method to extract urban built-up areas on large-scale and long-time series. Also, there are three main methods to extract urban built-up areas from the aforementioned images. One is the threshold segmentation method, which relies on the determination of the best threshold for the data, and no systematic and effective threshold determination rules have been formed: the artificial threshold method has strong subjectivity, and the accuracy of extracting urban built-up areas is low through the cluster threshold method, and the mutation detection method is inefficient, and the accuracy stability is poor (Liu et al., 2019; Wang et al., 2021). The second is the pixel classification method. At present, machine learning methods such as K-means unsupervised classification (Ju et al., 2017) and support vector machines (SVMs) (Ma et al., 2017; Jiang C. et al., 2021) are mainly used. The traditional machine learning methods are relatively simple, but the feature learning ability is limited, resulting in lower accuracy. Deep learning can use deep-architecture neural networks (e.g., CNN) to automatically learn features from the input raw data and directly generate powerful deep features, making it rapidly developed in the field of target detection and scene classification (Tan et al., 2018, 2020; Sun et al., 2020). Fully convolutional neural networks are the cornerstone of deep learning in the image semantic segmentation field, and it replaces the last fully connected layer of the convolutional neural network with a convolutional layer, effectively implementing end-to-end training of the convolutional neural network for image semantic segmentation, but the disadvantage is that the translation invariance of the convolutional network does not consider useful global context information (Wang et al., 2018; Karim et al., 2019; Tan et al., 2019). The UNet model based on the encoder-decoder was proposed, which was widely used in medical images in the early days (Navab et al., 2015; Kaur et al., 2021; Zhou et al., 2021), and in recent years, it has also been performed prominently in the classification of remote sensing images. The model has a neural network with an encoder-decoder structure that first encodes features from the raw data using an encoder and then decodes the target result from the feature encoding using a decoder, while high-level and low-level image features are merged through skip connections to maximize the extraction of context information (Peng et al., 2019; Wu et al., 2021; Yang et al., 2021). The attention module was originally proposed to solve machine translation problems by automatically learning weights to capture the correlation between the hidden states of the encoder and the decoder, weighting the output of the encoder, and can achieve alignment between input and output while utilizing more context information about the original data, making it an integral part in the encoder-decoder structure (Zhu and Yang, 2018; Kearney et al., 2019; Yang et al., 2021).
Remote sensing data combined with deep learning can quickly extract urban built-up areas, which brings the possibility to measure the changes of urban built-up areas in both temporal and spatial dimensions. Previously, the existing urban expansion metrics mostly characterize the process and characteristics of urban land expansion from a single “temporal” or “spatial” dimension. Among them, the “temporal” urban expansion metrics refer to the use of urban built-up area land scale, spatial form, and other characteristics of the temporal change, the intensity of change, which mainly includes the expansion intensity index, and the average annual expansion index. “Spatial” urban built-up area expansion metrics are measured from the geometry of urban built-up areas (graphical patterns, such as shape and area), which mainly include the expansion direction index, center of gravity offset index, and aggregation index (Liu et al., 2018); domestic scholars mainly study the expansion characteristics of urban built-up areas in central, eastern, and central-western China on a large scale; representative regions such as Yangtze River Delta, Pearl River Delta, Beijing, Tianjin, and Tang (Liu et al., 2000) on a medium scale; studies of large cities such as Beijing, Shanghai, and Guangzho (Liu et al., 2018; Li et al., 2021) on a small scale; less research on the expansion of construction land in small- and medium-sized cities (Jiang W. et al., 2021), and less quantitative analysis of spatial and temporal changes in the expansion of urban built-up areas in China. In this article, based on Google Earth Engine (GEE), using NPP/VIIRS nighttime light data and MOD13Q1 NDVI with the same spatial resolution, the UNet deep semantic segmentation neural network was selected, which added both spatial attention and channel attention modules in the encoder to improve the boundary integrity and semantic consistency of the change feature map. Then, a deep semantic segmentation model—CBAM_UNet was built and was trained and tuned by the Adam optimization algorithm and Dice Loss function to get the best parameters. With the proposed model, we could rapidly extract urban built-up areas on a large scale. So, we effectively and rapidly extracted China’s urban built-up areas based on the CBAM_UNet model. Meanwhile, to deeply analyze the expansion of China’s urban built-up areas during slow economic growth, NPP/VIIRS nighttime light data and MOD13Q1 NDVI data in 2012, 2015, 2018, and 2021 were selected to calculate China’s urban built-up areas. We also analyzed the expansion characteristics of China’s urban built-up areas through expansion speed, expansion intensity, expansion direction, and gravity center migration. Therefore, the proposed model—CBAM_UNet can provide a methodological guide for quickly obtaining the area of built-up areas, and the analysis results of the long-term spatial expansion of built-up areas can also provide a certain reference value for urban construction in China.
2 Study Area and Datasets
2.1 Study Area
The study area is located in China (longitude 73°33'∼135°05′ East, latitude 3°51'∼53°33′ North). From 1980 to 2011 was a period of high economic growth in China: the average annual growth rate of GDP was 10.03%, and urban population had increased from 89.405 million to 354.256 million. Urban built-up areas of provinces were shown a typical center-periphery distribution, mostly concentrated around a pole, and the distribution of urban built-up areas in the coastal was concentrated around Beijing-Tianjin-Hebei urban agglomeration, Yangtze River Delta urban agglomerations, and Pearl River Delta urban agglomerations.
After 2012, China’s economy had ushered in a period of slow growth with a focus on high-quality development. From 2012 to 2018, the average annual growth rate of GDP was 7.24%, and urban population had increased from 369.897 million to 427.300 million. Based on the period from the launch of VIIRS (2012) to the present, this experiment researched the changes in China’s urban built-up area expansion after the slowdown of economic growth. These data come from the China Statistical Yearbook.
2.2 Datasets
2.2.1 Data Sources and Access
1) NTL data
We used VIIRS as the NTL data, derived from the National Geophysical Data Center (NGDC) of the National Oceanic and Atmospheric Administration (NOAA) and provided by the Suomi National Polar-orbiting Partnership (Suomi-NPP) Visible Infrared Imagining Radiometer Suite (VIIRS), with a spatial resolution of 742 m. In this experiment, monthly averaged radiometric composites images with the influence of stray light were removed and used. The aim was to avoid a large number of missing values in the summer at high latitudes in this image version (Li X. et al., 2017); the research period was chosen to be from January to March and from September to December for each year, with seven images per year.
2) Reference data
This experiment’s remote sensing data are NDVI data, which are from MOD13A1, a 16-day synthetic product with a spatial resolution of 500 m. Meanwhile, to reduce the influence of cloud cover, we used maximum value composite (MVC) (Holben, 1986) to get the NDVI images for each year.
Also, the sample data are the 2020 WorldCover product from the European Space Agency (ESA), which provides a 10-m spatial resolution global land cover map based on Sentinel-1 and Sentinel-2 data, including 11 land cover categories, and we selected the “built-up” label as the sample data for the model input.
All data were acquired through Google Earth Engine (https://code.earthengine.google.com/, GEE).
2.2.2 Data Reprocessing
We used the threshold method for NTL data to remove the images’ extraordinarily high and low values and the mean value method (Shi et al., 2014) to composite the annual images. In addition, we logarithmically transform the composite annual nighttime light images to reduce the influence of high values and enhance the homogeneity of the overall radiation value distribution in urban built-up areas.
All images were converted to Asia Lambert Conformal Conic projection, where both VIIRS and WorldCover images were resampled to 500 m spatial resolution by the nearest neighbor method to avoid decreasing in DN values of the images with increasing latitude (Elvidge et al., 2009) and ensure the spatial consistency across the datasets. In addition, based on WorldCover data, all data layers were geometrically rectified. An overview of the datasets is shown in Table 1.
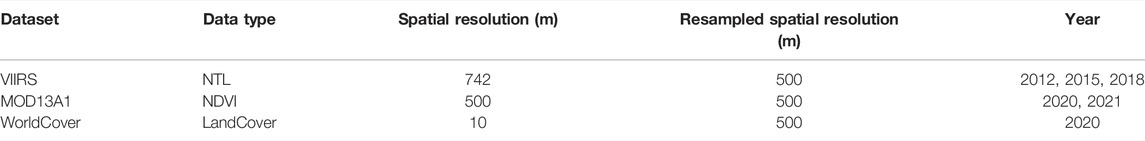
TABLE 1. Dataset overview.
3 Methods
This experiment consists of extracting China’s urban built-up areas and its spatial expansion analysis (Figure 1). The first part is the time-series urban built-up areas extraction. First, the NTL data and NDVI data in 2020 were chosen to build and train a deep semantic segmentation model for rapidly extracting China’s urban built-up areas, and then input the NTL data and NDVI data in 2012, 2015, 2018, and 2021 into the calibrated model to extract China’s urban built-up areas for the 4 years. The second part is to analyze the expansion speed, intensity, and direction of China’s urban built-up areas and gravity center migration of urban construction based on the extracted time-series urban built-up areas.
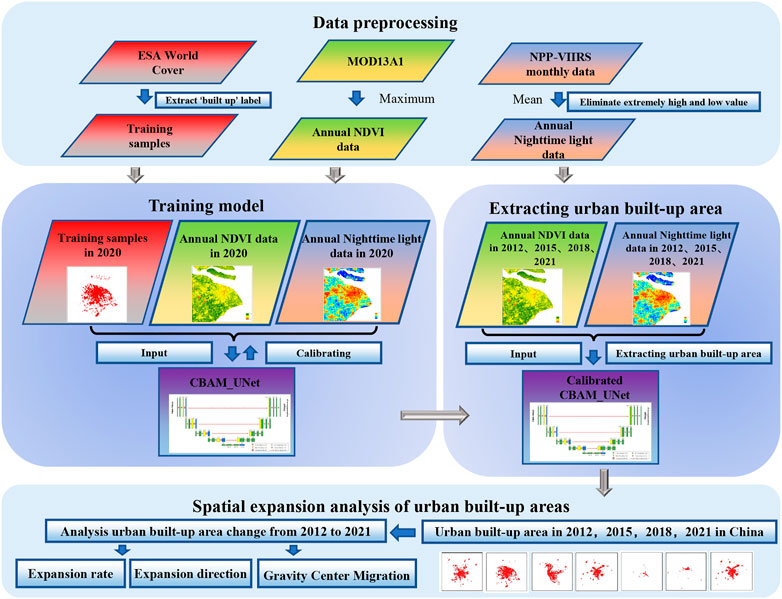
FIGURE 1. Overview of the workflow.
3.1 Construction and Training for Urban Built-Up Area Extraction’s Model
3.1.1 Developing CBAM_UNet
1) Standard UNet
The UNet is based on the fully convolutional neural network, which was first proposed for biomedical image segmentation, overcoming the difficulty of predicting boundaries with small training set images (Navab et al., 2015). It mainly consists of an encoder part and a decoder part. The encoder has four sub-modules: a convolutional layer and a pooling layer, making the image features progressively smaller and more abstract. The decoder corresponds to the encoder layer by layer. With the decoder deconvolution layer, the feature sizes were sequentially getting more extensive and using skip connections to connect and merge the decoder part deconvolution results in the output of the encoder part. Finally, the probability map is output through a 1 × 1 convolution layer.
The UNet model currently performs well in image segmentation due to its excellent model architecture. The combination of NTL data and NDVI used in this experiment has fewer bands, which was consistent with the medical image with fewer bands. In other words, this experiment can also be regarded as a problem of the image extraction with small training sets (urban built-up areas), so the model built in this experiment chose the UNet model as the base architecture.
2) Convolutional Block Attention Module
The attention module is a simulation of the human brain operation, which is designed to guide the deep neural network to focus on the features that are more relevant to the task. For the image classification task, the attention module combines the important features of the input image and the extracted feature spectrum, by combining the true value and the loss function, together with the backward propagation algorithm, to guide the network to automatically find the features that improve the task performance the most and assign a higher weight to that feature, thus improving the performance of the model.
Generally, the attention module mainly used by the neural network is divided into two categories: (1) soft attention, which assigns a weight between 0 and 1 to each input item, indicating the level of attention for each part. Soft attention is differentiable so that the attention weights can be obtained by forward and backward propagation (Xiao et al., 2015). However, since soft attention considers most of the information to different degrees, the amount of calculation is relatively large. (2) Hard attention, which assigns a weight of either 0 or 1 to each input item, is different from soft attention in that hard attention only considers which parts need attention and which parts do not. Hard attention is not differentiable, so the training process is usually carried out through reinforcement learning (Mnih et al., 2014). The advantage is that the time and computational cost can be reduced, but some information that should be attended to may be lost.
Convolutional block attention module (CBAM), as a lightweight attention module, belongs to soft attention and contains two sequential sub-modules: channel attention module (CAM) and spatial attention module (SAM), which build attention modules on channel and space, respectively (Figure 2) (Zhu and Yang, 2018).
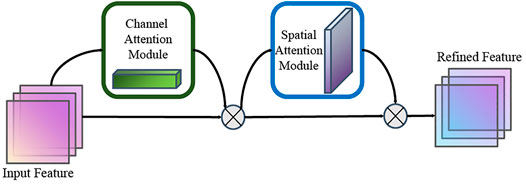
FIGURE 2. Overview of CBAM. The module has two sequential submodules: channel and spatial (Woo et al., 2018).
CAM mainly focuses on “what” is meaningful in the input image (Figure 3). To compute channel attention efficiently, average-pooling and max-pooling are used to compress the spatial dimension of the input feature map, realizing the aggregation of spatial information. Then, the average pooled features and max pooled features are forward propagated into a shared multi-layer perceptron (MLP). Finally, the two output feature vectors are merged by element summation to obtain the channel attention map. The calculation formula of channel attention is shown in Eq. 1.
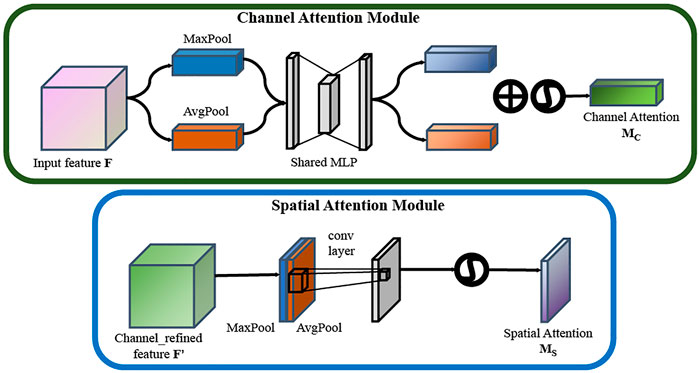
FIGURE 3. Diagram of each attention sub-module (Woo et al., 2018).
SAM is different from CAM in that it is more concerned with “where” being the more informative part, which complements channel attention (Figure 3). Average-pooling and max-pooling are first applied in the channel dimension, and the two-channel features are concatenated to compute spatial attention. A standard 7 × 7 convolutional layer then convolves the concatenated features to obtain the spatial attention map. The calculation formula of spatial attention is shown in Eq. 2.
where Mc(F) denotes channel attention map, and Ms(F) denotes spatial attention map; σ denotes the sigmoid function, MLP denotes multi-layer perceptron and F denotes input features, Fcavg and Fcmax denote average-pooled features and max-pooled features, respectively, W0 and W1 denote the MLP weights, f 7×7 represents a convolution operation with the filter size of 7 × 7, F savg and Fsmax denote average-pooled features and max-pooled features across the channel.
3) CBAM_UNet
In this experiment, we constructed a CBAM_UNet neural network for urban built-up areas extraction, which combined channel and spatial attention modules (Figure 4). The main structure of CBAM_UNet consists of two parts: the encoder and decoder. The encoder part, which extracted the features of the image layer by layer through convolution and pooling to obtain feature information, consists of four blocks, and each block was convolved twice with standard 3 × 3 convolution layer and batch normalization and activated by the ReLU function. The CBAM attention module was added before under-sampling the image. Each under-sampling doubled the number of feature channels while compressing the length and width of the image by half. Finally, the length and width of the input raw image were compressed from 128 × 128 to 8 × 8, and the number of feature channels was increased from 2 to 1024 through the entire encoder part.
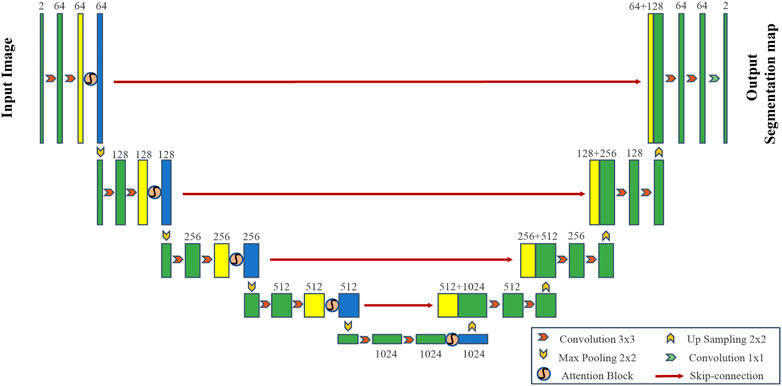
FIGURE 4. CBAM_UNet architecture.
The decoder part also consists of four blocks (this part follows the standard UNet), which were up-sampled by deconvolution to recover the original size of the image and output the segmentation result. It consists of eight 3 × 3 convolution layers, one 1 × 1 convolution layer, and four 2 × 2 up-sampling layers, with the feature channels, were reduced from 1024 to 2, all using ReLU as the activation finally got the classification results through the Sigmoid function. Since high-resolution feature information is often lost in up-sampling, the UNet did not directly up-sample high-level semantic features. It added skip connections to each block. There has the advantage of merging more low-level features into the up-sampling process, achieving feature fusion at different scales, improving the information during up-sampling, and complementing the contextual information of the input image. Ultimately, this multi-scale prediction is achieved, improving the segmentation’s accuracy.
Therefore, the main difference is in the encoder part between the proposed model CBAM_UNet and the standard UNet structure, and we added the CBAM attention module before under-sampling the image.
3.1.2 Algorithm Implementation
The training part is mainly to train and calibrate the model, and its purpose is to obtain the optimal tuning model. Essentially, calibration uses an optimization algorithm to minimize the loss function by iteratively estimating the weights of the parameters. The process consists of determining the loss function, setting the optimization algorithm, and iterating parameters.
In semantic segmentation, choosing the appropriate loss function is crucial to the results of model training. Linear cross-entropy loss was mostly used as the loss function in binary image segmentation (Vi-de and Qing, 2004) and is shown in Eq. 3:
where yi represents the label of sample, i and pi indicate the probability that the sample i is predicted to be a positive class.
However, the linear cross-entropy loss function has an obvious disadvantage. When the quantity of positive samples is significantly less than that of negative samples, the results of the model classification will be greatly biased toward the background. So we used Dice Loss, which was proposed to solve the problem of extremely unbalanced classification samples (Milletari et al., 2016). Dice Loss is a function based on the Dice coefficient and derived from binary classification. It is a measure of the overlapping part of two samples, with the measure ranging from 0 to 1. A dice coefficient equal to 1 means complete overlap. Dice Loss is defined as Eq. 4:
where ytrue represents the label’s value, and ypred denotes the value obtained from the model.
In summary, the steps of model training are as follows:
1) We combined the preprocessed NPP-VIIRS NTL data and MOD13A1 NDVI data in 2020 into a two-band image data through band composited and selected the “built-up” label from WorldCover product in 2020 provided by ESA as the label data for the model input.
2) Clipping the sample datasets: The “fishnet” function in ArcGIS was used to clip both the composited two-band image data and the label data into 128 × 128 size images.
3) Splitting the sample datasets: 1294 images were randomly chosen as the training set, and the remaining 142 images were used as the validation set. Both sets were the input data of the model.
4) Model training process: The training set was input into the CBAM_UNet model, the loss values of the training data and label data were calculated through the Dice Loss function, and the model parameters were optimized by the Adam optimizer until the loss function was fitted (Kingma and Ba, 2015). The initial learning rate of the model was 1e-3, and the total number of iterations was 40 epochs.
3.1.3 Accuracy Evaluation
We introduced five accuracy evaluation indicators to verify the model’s accuracy. These are precision (P), recall (R), F1-score (F1), mean of class-wise intersection over union (mIoU), and overall accuracy (OA). Among them, P evaluates the precision of the model: the larger value means there are fewer misclassified pixels. R evaluates the recall rate of the model: the larger the value is, the fewer omitted pixels are. F1 represents the harmonic mean of P and R, and it is a global indicator for evaluating the classification accuracy: the higher the value indicates, the more accurate the model is. Meanwhile, OA and mIoU show the model’s overall performance: and their larger values reveal the better performance. OA is the ratio of the number that correctly classified category elements to the total number of categories. mIoU is obtained by calculating the ratio of the intersection and union of the two sets of the true values and the predicted values of each category, then averaging the results. Intersection over union (IOU) of urban built-up areas was not used in the evaluation indicators. Because the number of samples in urban built-up areas (foreground) and non-urban built-up areas (background) was extremely unbalanced, it leads to low IOU values in urban built-up areas. Therefore, it is reasonable to evaluate the accuracy of the extraction results of urban built-up areas by p value, R value, and F1, and to evaluate the model’s overall accuracy by OA and mIOU. The calculation formula for each indicator is as follows:
where TP, FP, TN, and FN denote the number of true positives, the number of false positives, the number of true negatives, and the number of false negatives.
Meanwhile, to verify the model’s accuracy in extracting built-up areas from 2012 to 2021 without sample data, we introduced the “China Statistical Yearbook” (stats.gov.cn) issued by the National Bureau of Statistics to obtain the built-up area data in 2012, 2015, and 2018 (excluding Hong Kong, Macau, and Taiwan, but the data for 2021 have not yet been released), and the experimental model extraction results are compared.
3.1.4 Comparison With Other Methods
To verify the model accuracy of the proposed CBAM_UNet, we input the same sample data into the other three models, the standard U-Net, support vector machine (SVM), random forest (RF), and extracted urban built-up areas in China in 2020. Also, to ensure the objectivity of the result comparison, the loss function, optimizer, and training parameters of the basic UNet were the same as the method proposed in this article. SVM is a fast and reliable classification method for supervised learning. A given training data achieve classification by finding the maximum margin hyper-plane and using the cross-validation method to determine the penalty factor C and the parameter γ of the kernel function. RF is an ensemble learning algorithm based on a non-parametric regression algorithm, which is an ensemble classifier based on the decision tree. Parameters such as the number of decision trees, the maximum number of leaf nodes, and the minimum number of samples that can be divided by a node are optimized through the accuracy curve.
3.1.5 Experimental Setup
This experiment was carried out in a Windows10 environment, and the model was built by a deep learning framework—Pytorch. The software and hardware environments are shown in Table 2.
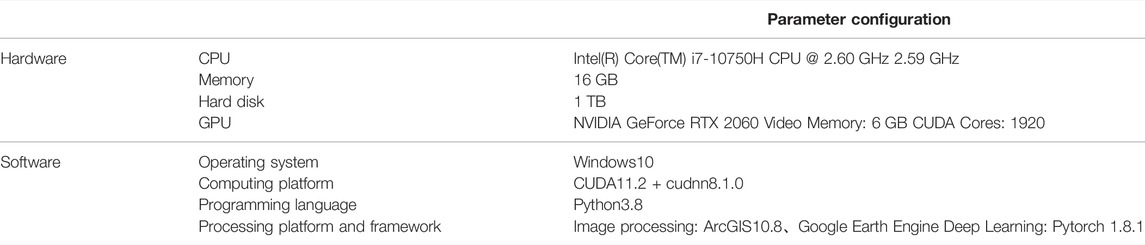
TABLE 2. Hardware and software parameters.
3.2 Extraction of Urban Built-Up Areas
We downloaded the NPP-VIIRS NTL and the MOD13A1 NDVI data from 2012 to 2021 through GEE (every 3 years). They were preprocessed as described earlier to composite the datasets for semantic segmentation. Then, we extracted China’s urban built-up areas in 2012, 2015, 2018, and 2021 through the calibrated CBAM_UNet and analyzed the change in urban built-up areas during the study period.
3.3 Spatial Expansion Analysis Method
1) Expansion speed and intensity
Using the urban expansion speed and intensity as indicators to study the spatial and temporal characteristics of China’s urban built-up areas expansion (Yin et al., 2021).
Urban expansion speed (Eq. 10): this indicates the growth of China’s urban built-up areas.
Urban expansion intensity (Eq. 11): this indicates the rate of China’s urban built-up areas in a period.
where S indicates the expansion speed of urban built-up areas, P is the expansion intensity of urban built-up areas, T is the time interval and Ma and Mb indicate the area of early and late urban built-up areas.
2) Expansion directions
The direction of the country’s urban expansion determines the development direction of the entire country to a certain extent and provides a reference value for the country’s macro-management work. In this section, we used the geometric quadrant orientation method (Liu et al., 2021) to compare and analyze the expansion differences of urban built-up areas in different spatial orientations in each period, and different spatial orientations reflected the spatial characteristics of urban expansion, so the spatial form of China’s urban built-up areas expansion can be described.
The area change of urban built-up areas in several regions of China during the study period was calculated by the geometric quadrant orientation method. The center was set at 34°32′27.00″N and 108°55′25.00″E. So China was divided into north (N), northeast (NE), east (E), southeast (SE), south (S), southwest (SW), west (W), and northwest (NW).
3) Gravity Center Migration
The change in the country’s urban built-up areas’ gravity center is a significant indicator (Liu et al., 2013; Zeng et al., 2015), which reflects the intensity and spatial characteristics of China’s urban expansion and is also important for understanding the compactness of modern urban development. With the expansion of China’s urban built-up areas, we calculated the coordinates of the gravity center and the migration distances of China’s urban built-up areas in 2012, 2015, 2018, and 2021. As shown in Eqs 12, 13:
where Xt denotes the longitude coordinate of the gravity center in year t, and Yt denotes the latitude coordinate of the gravity center in year t. Cti denotes the area of urban built-up areas patch i; Xi and Yi denote the gravity center coordinates of patch i, respectively; n denotes the number of patches.
4 Results and Analysis
4.1 Experimental Results and Analysis
4.1.1 Model Training and Built-Up Area Extraction Results in 2020
• Model training results
The learning rate is the hyperparameter of how the gradient of the loss function is used to adjust the network weights in the gradient descent method. A learning rate that is too large may cause the loss function to cross the global optimum directly; a learning rate that is too small will result in a slow change in the loss function, increase the convergence complexity of the network, and make it easy to get trapped in a local minimum. A suitable learning rate can reach the loss minimum faster, while ensuring that the converged loss value is the global optimal solution of the neural network. Therefore, the learning rate in model training is an unavoidable and particularly important hyperparameter. This experiment uses the Adam optimizer to adjust the gradient adaptively, which effectively balances the influence generated by the learning rate. Four initial learning rates of 0.1, 0.01, 0.001, and 0.0001 were set for comparison, all with 40 training cycles and a batch size of 16. The batch size refers to the number of data samples crawled in one training, which will have an impact on the stability of the network model. In this experiment, two batch sizes of 8 and 16 are selected for training, considering the effect of computer memory. Their accuracy variations are shown in Figure 5.
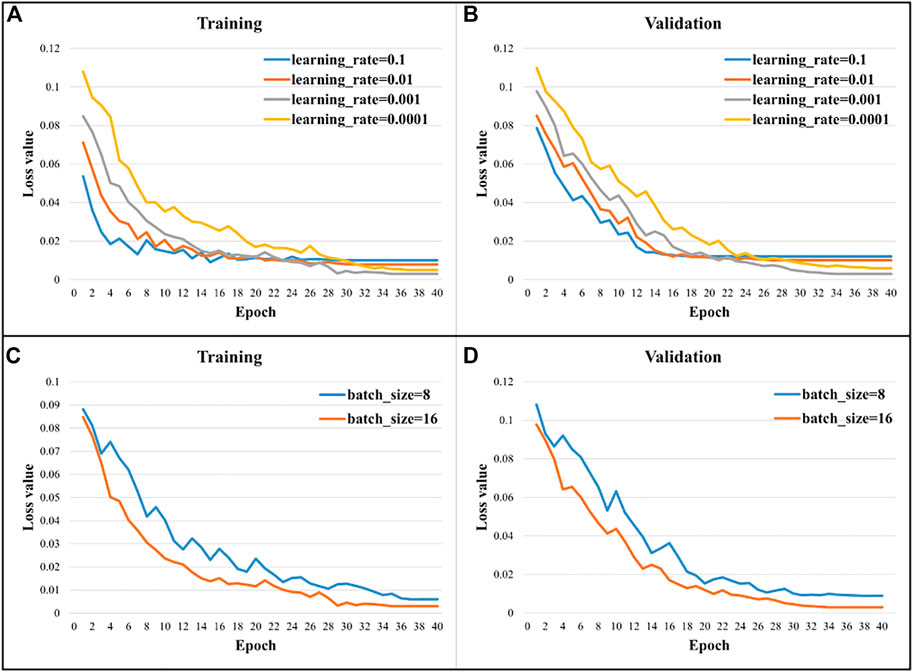
FIGURE 5. Sensitivity analysis. (A,B) Loss value with different learning rates. (C,D) Loss value with different batch sizes.
As can be seen from Figure 5, the convergence speed of the CBAM_UNet model for extracting the built-up area is mainly influenced by the learning rate. During training, the convergence speed obtained for small learning rate (0.0001, 0.001) than large learning rate (0.1, 0.01) is smaller, but the converged loss value is lower than that of large learning rate, but the loss value of small learning rate 0.0001 is not as good as that of learning rate 0.001, indicating that learning rate 0.0001 is trapped in the local minimum, so the optimal initial learning rate for the proposed CBAM_UNet model training is 0.001. When the batch size is selected as 8, the network model still has large local fluctuations after leveling off, while the network model with batch size 16 has less fluctuation in classification accuracy after leveling off.
Based on the sensitivity test of the model, we can derive the sensitivity analysis of this experiment for model training: the optimal parameters for its hyperparameter learning rate and batch size are learning rate 0.001 and batch size 16. According to the hyperparameters, it can be concluded the extraction accuracy urban built-up area in 2020.
Among the 34 provinces, Shanghai has the highest F1 value of 0.8095, followed by Guangdong, Taiwan, and Beijing, all of which have F1 values greater than 0.70. Eighteen provinces have F1 values in the range of 0.60–0.70, including Jiangsu, Sichuan, and Fujian. The remaining 12 provinces have F1 values below 0.60. Overall, the image segmentation accuracy is higher in economically developed regions.
To compare the differences between the areas extracted by the four models and Ground Truth, we selected three cities with GDP greater than 1 in 2012: Beijing, Shanghai, Guangzhou, three cities with GDP between 0.1 and 1 in 2012: Chengdu, Zhengzhou, Changchun, and two cities with GDP less than 0.1 in 2012:Haikou, Xining, tracking their urban built-up area variation over the past decade. As shown in Figure 6.
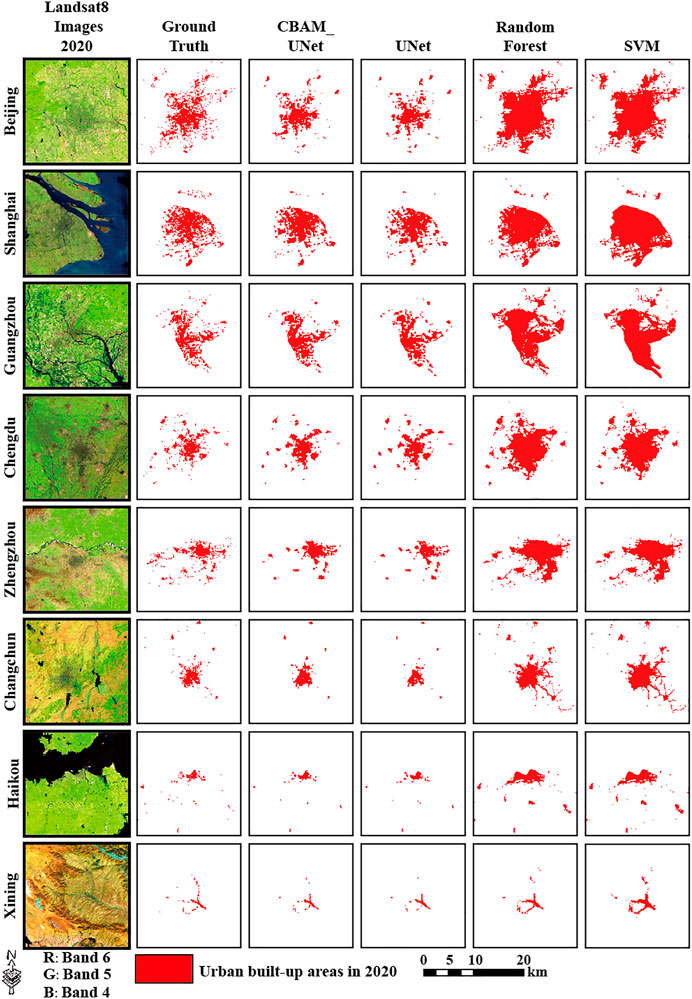
FIGURE 6. Accuracy assessment using ground truth.
We can see that for the eight cities, the area extracted by traditional machine learning algorithms is larger than that extracted by ground truth, especially SVM, which shows that traditional machine learning algorithms have more misclassifications and fewer wrong classification areas, which is consistent with our conclusion that the recall value of the classification accuracy is larger and the precision is smaller; for the deep learning model, the area extracted by the two models is smaller than the area extracted by the ground truth, which is also consistent with the precision value we obtained for its classification accuracy greater than its recall value. Meanwhile, the area of our proposed CBAM_UNet model is the closest to the ground truth, which also shows that our model has higher accuracy.
Also, we validated the accuracy of the model in 34 provinces in China. Except CBAM_UNet proposed in this article, we also used standard UNet, RF, and SVM, three models to extract China’s urban built-up areas in 2020. To ensure the objectivity of the result comparison, the loss function, optimizer, and training parameters of standard UNet were the same as the method proposed in this article. The various accuracy indicators proposed in the previous section were calculated by comparing the label data in 2020 with the image segmentation results obtained by the four models. The results are shown in Table 3.
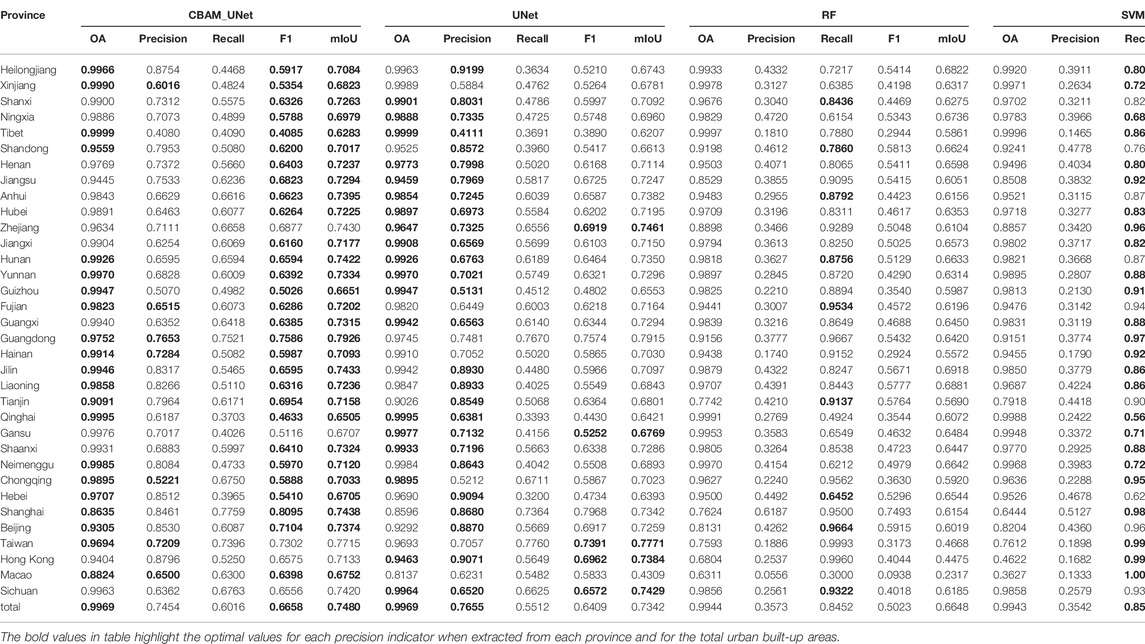
TABLE 3. Accuracy assessment of urban built-up area results.
As shown in Table 3, the average OA value of CBAM_UNet is 0.9969, p value is 0.7454, R value is 0.6016, F1 value is 0.6658, and mIoU value is 0.7480; the average OA value of UNet is 0.9969, p value is 0.7655, R value is 0.5512, F1 value is 0.6409, and mIoU value is 0.7342; the average OA value of RF is 0.9944, p value is 0.3573, R value is 0.8452, F1 value is 0.5023, and mIoU value is 0.6648; the average OA value of SVM is 0.9943, p value is 0.3542, R value is 0.8567, F1 value is 0.5012, and mIoU value is 0.6643. In the method proposed in this article, except the p value is slightly lower than the standard UNet (0.7655), the other four indicators are better than or equal to the standard UNet, RF, and SVM. Compared with traditional machine learning (RF and SVM), this model has a reduction in R value, which means the omitted urban built-up areas have increased, but the significant improvement in p value is useful for analyzing the changes of urban built-up areas over a period. Excessive misclassification of RF and SVM models will lead to overestimating urban built-up areas each year, thus weakening inter-annual growth.
4.1.2 The Extraction Results of Urban Built-Up Areas in China From 2012 to 2020
We used the calibrated model for extracting urban built-up areas, and the proposed built-up areas for 2012 to 2020 are shown in Table 4 as follows.
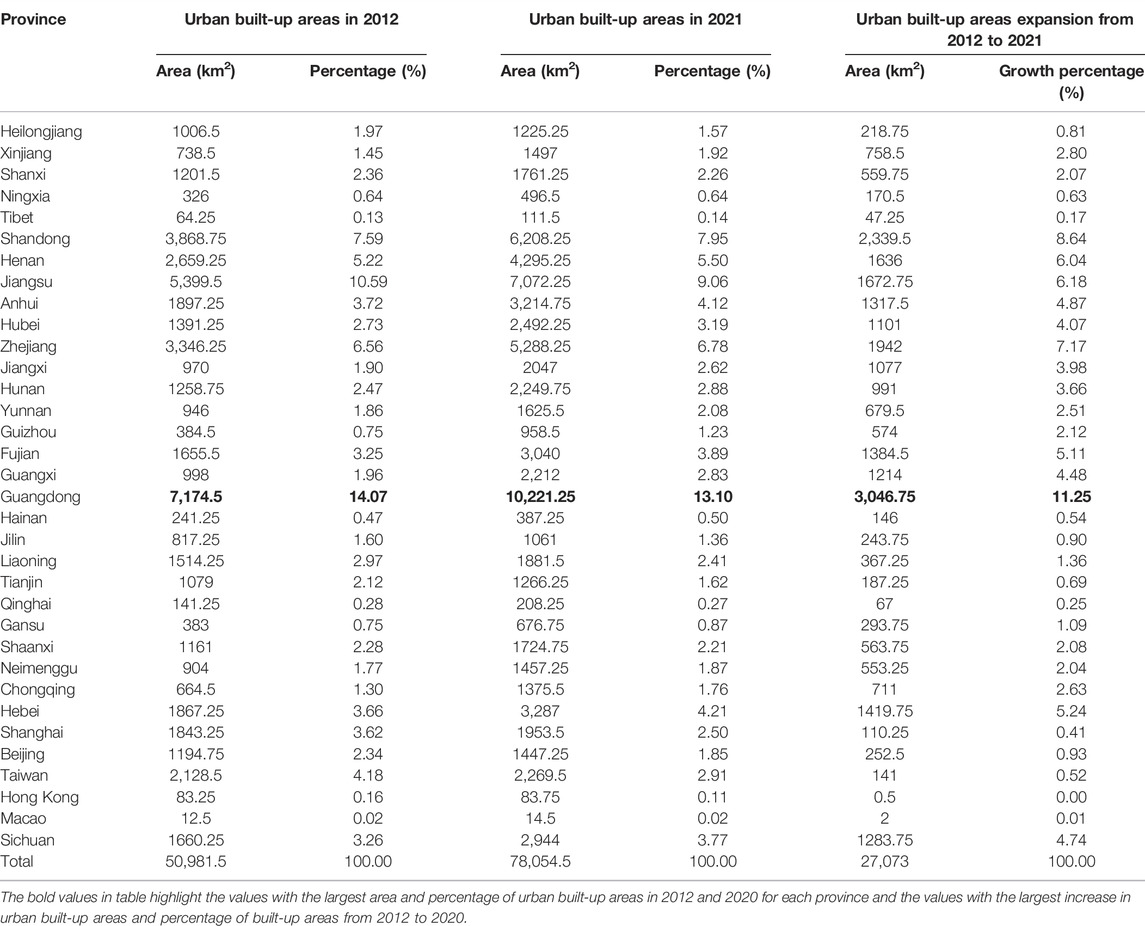
TABLE 4. Expansion of urban built-up areas in all provinces from 2012 to 2021.
On a province scale: Guangdong has the largest urban built-up areas, with 10,221.25 km2 in 2021, making it the only province with over 10000 km2, followed by Jiangsu, Shandong, and Zhejiang, which have urban built-up areas over 5000 km2. Hong Kong and Macau have the smallest urban built-up areas, especially due to their small administrative districts. In addition, urban built-up areas of Tibet, Qinghai, Hainan, and Ningxia are less than 500 km2, relatively smaller than other provinces.
From the above Table 4, it is worth noting that we can conclude that Guangdong, Shandong, Zhejiang, Jiangsu, and Henan have the largest growth area. Since 2011, these five provinces have introduced a series of policies that encourage farmers to buy houses in cities, providing preferential loans to promote the “citizenization” of migrant workers. The demand for commercial housing in cities has increased, which has also led to the expansion of urban built-up areas. Therefore, the relationship between urban built-up area expansion and population geography is also particularly close.
On the other hand, we compared the built-up area extracted by the corrected CBAM_UNet with the built-up area data obtained from the National Bureau of Statistics’ China Statistical Yearbook (stats.gov.cn) in 2012, 2015, and 2018 (excluding Hong Kong, Macau, and Taiwan, and 2021 data not yet available); results are shown in Table 5.
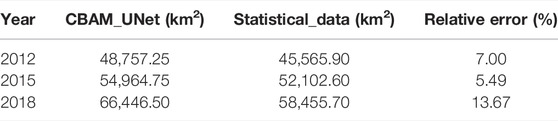
TABLE 5. Comparison of extracted areas to statistical data.
By comparison, we can see that the area we extracted can achieve more than 85% accuracy without labels, proving that our model has strong generalization ability and can also ensure a certain accuracy. Then, we can also be seen that the area we extracted is generally larger than the area of the statistical yearbook, indicating that there is a certain misclassification in our model.
To more intuitively see the expansion in the built-up area from 2012 to 2020, we compared the urban built-up areas in 2012 with the urban built-up areas in 2021 and obtained the figure as shown in Figure 7.
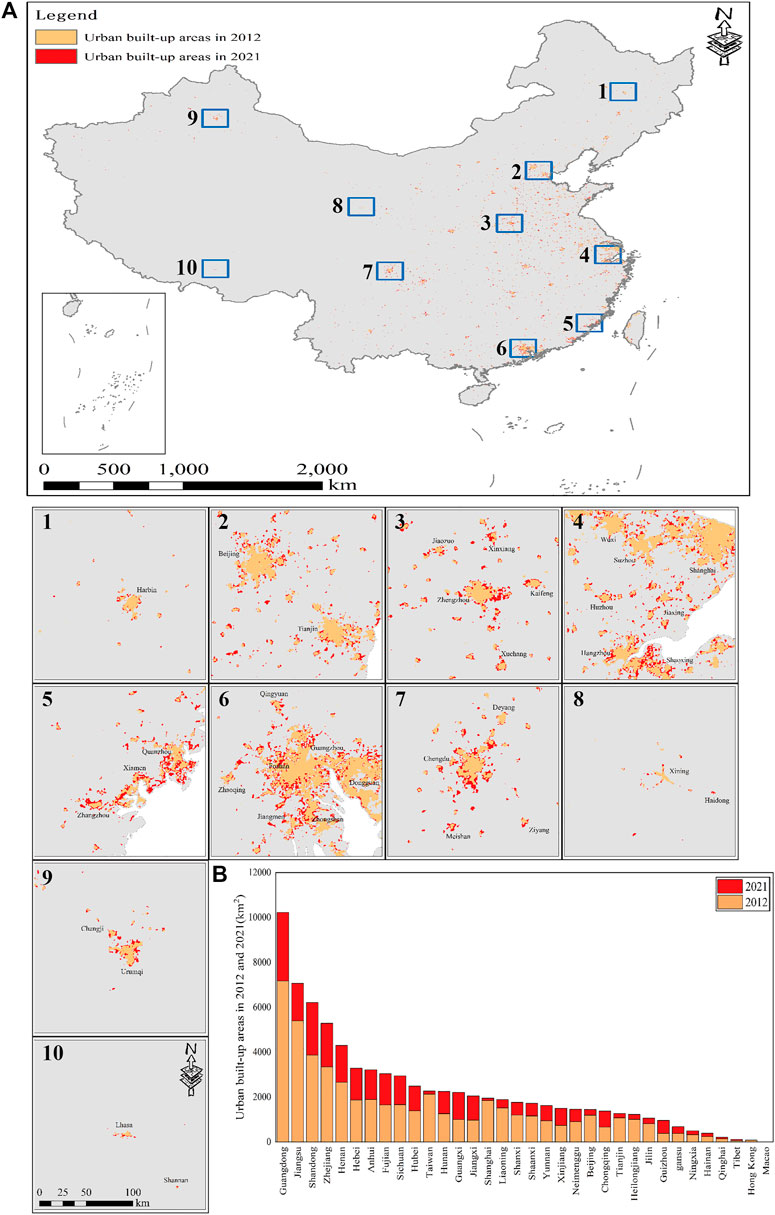
FIGURE 7. Expansion of urban built-up areas in China from 2012 to 2021. (A) Expansion of urban built-up areas in some cities (including developed, moderately developed, and underdeveloped). (B) Urban built-up area expansion by provinces.
During the study period, there were 12 provinces with a growth of urban built-up areas over 1000 km2, and Guangdong has the most significant growth area, with an increase of 3,046.75 km2, accounting for 11.25% of China’s urban built-up areas growth. From a geographical point of view, these provinces are primarily found in the east and southeast of the country. There are nine provinces with the growth of urban built-up areas of less than 200 km2, except for Tibet, Hainan, and Ningxia. The others are provinces with relatively developed economies and high-level of urbanization. Their limited constructible space leads to less growth (Table 4).
4.2 Spatial-Temporal Variation Analysis of China’s Urban Built-Up Areas
4.2.1 Spatial Variation Analysis
• Expansion speed and intensity
China has experienced fast urbanization and economic growth in the past decade. Urban built-up areas had increased from 50,981.5 km2 in 2012 to 78,054.5 km2 in 2021, an increase of 27,073 km2, increased by 53.10% (Table 4) and calculated the expansion speed and intensity of urban built-up areas by period (Eqs 10,11) . The expansion speed in 2015–2018 was higher than that of 2012–2015 and 2018–2021, indicating that the speed of urban construction in China had increased and then had slowed down in the past decade, and the expansion intensity also had changed, from 4.16% in 2012–2015 to 6.72% in 2015–2018, and then slowed down to 4.42%, but overall, China’s urban built-up areas had consistently expanded at a high rate over the past 10 years (Table 6).
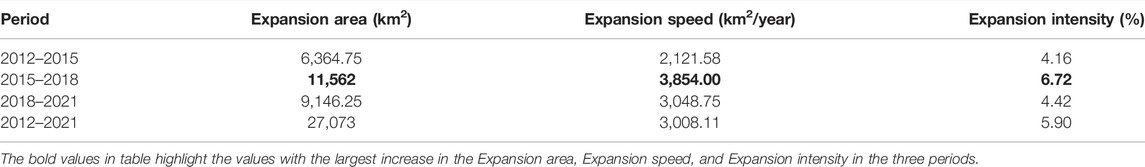
TABLE 6. Expansion of China’s urban built-up areas from 2012 to 2021.
4.2.2 Temporal Variation Analysis
• Expansion Directions
The spatial quadrant orientation method was used to calculate the expansion in urban built-up areas of each region in China during the study period, with the center set at 34°32′27.00″N and 108°55′25.00″E. We divide China into north (N), northeast (NE), east (E), southeast (SE), south (S), southwest (SW), west (W), and northwest (NW) through eight quadrants (Figure 8A). The urban built-up area images in 2012, 2015, 2018, and 2021 were, respectively, divided into eight orientations through the spatial quadrant orientation method and counted the information of urban built-up areas of each quadrant in each (Figures 8B,C; Table 7).

FIGURE 8. (A–C) Expansion of urban built-up areas in all orientations from 2012 to 2021. (D) Gravity center migration of China’s urban built-up areas, 2012–2021.
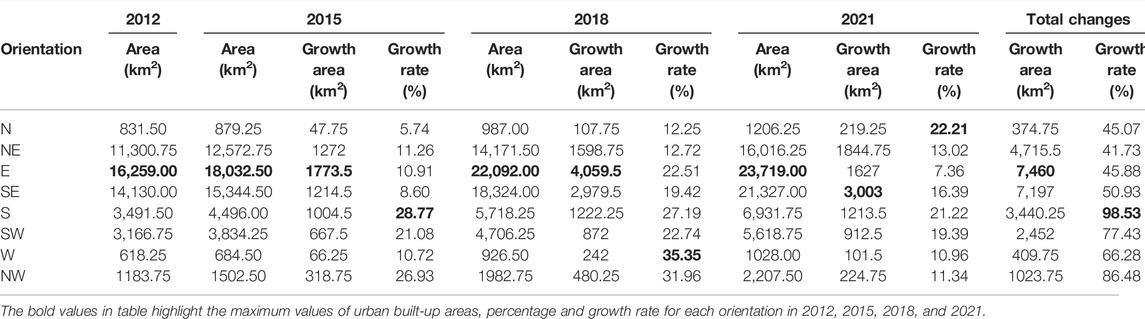
TABLE 7. Urban built-up areas in all orientations from 2012 to 2021.
The results show that in 2021, the E orientation has the largest urban built-up areas of all orientations, with areas of 23719 km2. The W orientation has the smallest urban built-up areas of all orientations, only 1028 km2.
During the study period, the E orientation urban built-up areas increased the most, from 16,259.00 km2 in 2012 to 23,719.00 km2 in 2021, an increase of 7460 km2, increased by 45.88%. N orientation increased the least, by only 374.75 km2, but with a growth rate of 45.07%. The fastest growth rate was in the S orientation, where urban built-up areas in 2021 have increased by 98.53% compared to 2012 and high during the study period (Table 7).
We can conclude that the distribution of urban built-up areas gradually showed a scattered trend. Jiangsu, Zhejiang, and Shanghai have formed a trend of group development with Anhui. Meanwhile, the urban built-up areas between Chengdu and Chongqing have gradually spread and connected. After 2018, the spread and integration in Chengdu and Chongqing have been further strengthened. At the same time, Henan, Anhui, and northern Jiangxi have gradually connected to Jiangsu, Zhejiang, and Shanghai.
To represent the expansion direction more intuitively, we used the standard ellipse difference to visualize the expansion direction according to the expansion area from 2012 to 2020. From Figure 8A, we can see that, generally, the distribution pattern of China’s urban built-up areas has gradually migrated from the “center-periphery” distribution around the growth pole to a networked distribution pattern, showing a trend from agglomeration to dispersion, which is satisfied by the “center-periphery” theory proposed by J.R. Fridemna: from the center of the North-South-Guangzhou triangle in 2012, we gradually migrated to the North-South-Guangzhou-Chengdu-Chongqing economic zone. At the same time, we selected regions from the North-South-Guangdong and Chengdu-Chongqing economic zones, respectively, and their local trends are also “center-periphery,” which also satisfies the “center-periphery” theory proposed by J.R. Fridemna.
• Gravity Center Migration
We calculated the center of gravity for 2012–2020 based on the center of gravity migration index proposed earlier, as shown in Figure 8D.
As we can see, the gravity center of China’s urban built-up areas has migrated to the southwest in the past decade, with a linear migration distance of 60.82 km, including 57.37 km to the west and 20.21 km to the south. The results show that China’s support policies for the west impact the gravity center of urban built-up areas.
Generally, the analysis results show that China’s urban built-up areas have been overgrowing in recent years, but the development in various orientations is quite different. The main growth orientations of urban built-up areas are E and SE; the sum of increased areas in these two orientations exceeds 50% of China’s urban built-up areas, which are the two regions with the fastest urbanization in China. The increase in the urban built-up areas in W and N is less than 500 km2, accounting for 1.51% and 1.38% of the increase in China’s urban built-up areas, respectively. With a large disparity with other orientations, especially because there are fewer cities in these two orientations, but in terms of growth speed, these two orientations have grown fast. Overall, the degree of urbanization in the economically developed regions is higher, and the economically underdeveloped regions are currently chasing.
5 Conclusion
In this article, CBAM_UNet deep semantic segmentation network was built, which combined NTL data and NDVI data to realize the automatic extraction of long-time series in China’s urban built-up areas and analyze the spatial and temporal expansion changes of China’s urban built-up areas over the past 10 years. The results show the following:
1) We selected the UNet model in the field of biomedical segmentation and added the CBAM attention module into the encoder part of UNet to build CBAM_UNet; the model can merge multiple features. Then the NTL data were merged with NDVI data, and taking the 2020 WorldCover as the sample data, we assigned a semantic label to each pixel in the image, realizing end-to-end, pixel-level classification of remote sensing images. [not available in Crossref]
2) Compared with other models, CBAM_UNet shows higher accuracy, the F1 value is 0.6658, and the mIoU value is 0.7480. In addition, through the calibrated CBAM_UNet, the experiment automatically extracted China’s urban built-up areas in 2012, 2015, 2018, and 2021, saving a lot of workforce and time. Thus, the model can realize the annual urban built-up areas extraction in China by combining annual NTL data and NDVI data, which provides a feasible method for long-time series change analysis. [not available in Crossref]
3) Based on urban built-up areas extracted from the calibrated CBAM_UNet model in 2012, 2015, 2018, and 2021, the spatial and temporal expansion of China’s urban built-up areas was analyzed from four indicators: expansion speed, expansion intensity, expansion direction, and gravity center migration. China’s urban built-up area expansion speed in 2015–2018 was higher than that of 2012–2015 and 2018–2021, indicating that China’s urban construction speed increased first and then slowed down in the past decade; the expansion intensity increased from 4.16% in 2012–2015 to 6.72% in 2015–2018 and then slowed down to 4.42%. However, overall, China’s urban built-up areas have consistently expanded at a high rate over the past 10 years. From the view of expansion direction: the E orientation urban built-up areas have increased the most, from 16,259.00 km2 in 2012 to 23,719.00 km2 in 2021, an increase of 7460 km2, increased by 45.88%. Urban built-up areas in the N orientation increased the least, by only 374.75 km2, but with a growth rate of 45.07%. The gravity center of China’s urban built-up areas migrated to the southwest, with a linear migration distance of 60.82 km, including 57.37 km to the west and 20.21 km to the south. The results show that China’s support policies for the west impact the gravity center of urban built-up areas.
The CBAM_UNet model proposed in this experiment can quantitatively and accurately extract urban built-up areas in a long-time series. The findings of this article would help understand the spatial and temporal expansion of urban built-up areas. Such an understanding would help analyze China’s urban development changes in the past 10 years in a relatively macroscopic manner and provide specific scientific decision-making for China’s economic development.
Data Availability Statement
The original contributions presented in the study are included in the article/supplementary material; further inquiries can be directed to the corresponding author.
Author Contributions
MB contributed to the methodology, design of the study, and writing—original draft; SZ contributed to the methodology, writing, checking and editing, and project administration; XW contributed to the methodology and software usage; YF contributed to the data analysis; JW contributed to project administration; PP contributed to conception and funding acquisition.
Funding
The research was supported by The Second Tibetan Plateau Scientific Expedition and Research Program (STEP), China (No. 2019QZKK0301); the program of Census of Forest Germplasm Resources in Chenghua District, Chengdu (No. 80303-AHL038); and the Second National Survey of Key Protected Wild Plant Resources--Special Survey of Orchidaceae in Sichuan Province (No. 80303-AZZ003).
Conflict of Interest
The authors declare that the research was conducted in the absence of any commercial or financial relationships that could be construed as a potential conflict of interest.
Publisher’s Note
All claims expressed in this article are solely those of the authors and do not necessarily represent those of their affiliated organizations, or those of the publisher, the editors, and the reviewers. Any product that may be evaluated in this article, or claim that may be made by its manufacturer, is not guaranteed or endorsed by the publisher.
References
Bramhe, V. S., Ghosh, S. K., and Garg, P. K. (2020). Extraction of Built-Up Areas from Landsat-8 OLI Data Based on Spectral-Textural Information and Feature Selection Using Support Vector Machine Method. Geocarto Int. 35, 1067–1087. doi:10.1080/10106049.2019.1566406
Chen, J., Chen, J., Liao, A., Cao, X., Chen, L., Chen, X., et al. (2015). Global Land Cover Mapping at 30m Resolution: A POK-Based Operational Approach. ISPRS J. Photogrammetry Remote Sens. 103, 7–27. doi:10.1016/j.isprsjprs.2014.09.002
Elvidge, C., Ziskin, D., Baugh, K., Tuttle, B., Ghosh, T., Pack, D., et al. (2009). A Fifteen Year Record of Global Natural Gas Flaring Derived from Satellite Data. Energies 2, 595–622. doi:10.3390/en20300595
Gong, P., Wang, J., Yu, L., Zhao, Y., Zhao, Y., Liang, L., et al. (2013). Finer Resolution Observation and Monitoring of Global Land Cover: First Mapping Results with Landsat TM and ETM+ Data. Int. J. Remote Sens. 34, 2607–2654. doi:10.1080/01431161.2012.748992
He, X., Zhou, C., Zhang, J., and Yuan, X. (2020). Using Wavelet Transforms to Fuse Nighttime Light Data and POI Big Data to Extract Urban Built-Up Areas. Remote Sens. 12, 3887–3920. doi:10.3390/rs12233887
Holben, B. N. (1986). Characteristics of Maximum-Value Composite Images from Temporal AVHRR Data. Int. J. Remote Sens. 7, 1417–1434. doi:10.1080/01431168608948945
Hu, Y., Kong, X., Zheng, J., Sun, J., Wang, L., and Min, M. (2018). Urban Expansion and Farmland Loss in Beijing during 1980-2015. Sustainability 10, 3927–4020. doi:10.3390/su10113927
Jiang, C., Miao, Y., and Xi, Z. (2021a). A New Method of Extracting Built-Up Area Based on Multi-Source Remote Sensing Data: a Case Study of Baoding Central City, China. Geocarto Int. 0, 1–13. doi:10.1080/10106049.2021.1933214
Jiang, W., Li, T., Li, Q., Wu, S., Zhou, Y., and Lu, L. (2021b). Spatial and Temporal Characteristics of Urban Sprawl in Northern Anhui Based on Multi- Temporal Remote Sensing Images—A Case Study of Fuyang City , Anhui Province. Resour. Dev. Markct 37, 780. doi:10.3969/j.issn.1005-8141.2021.07.003
Ju, Y., Dronova, I., Ma, Q., and Zhang, X. (2017). Analysis of Urbanization Dynamics in Mainland China Using Pixel-Based Night-Time Light Trajectories from 1992 to 2013. Int. J. Remote Sens. 38, 6047–6072. doi:10.1080/01431161.2017.1302114
Karim, F., Majumdar, S., Darabi, H., and Harford, S. (2019). Multivariate LSTM-FCNs for Time Series Classification. Neural Netw. 116, 237–245. doi:10.1016/j.neunet.2019.04.014
Kaur, A., Kaur, L., and Singh, A. (2021). GA-UNet: UNet-Based Framework for Segmentation of 2D and 3D Medical Images Applicable on Heterogeneous Datasets, Neural Comput. Applic 33, 14991–15025. doi:10.1007/s00521-021-06134-z
Kearney, V., Chan, J. W., Wang, T., Perry, A., Yom, S. S., and Solberg, T. D. (2019). Attention-enabled 3D Boosted Convolutional Neural Networks for Semantic CT Segmentation Using Deep Supervision. Phys. Med. Biol. 64, 135001. doi:10.1088/1361-6560/ab2818
Kingma, D. P., and Ba, J. L. (2015). Adam: A Method for Stochastic Optimization. 3rd Int. Conf. Learn. Represent. ICLR 2015 - Conf. Track Proc. 1–15.
Li, F., Yan, Q., Bian, Z., Liu, B., and Wu, Z. (2020). A Poi and Lst Adjusted Ntl Urban Index for Urban Built-Up Area Extraction. Sensors 20, 2918. doi:10.3390/s20102918
Li, J., Fang, W., Wang, T., Qureshi, S., Alatalo, J., and Bai, Y. (2017a). Correlations between Socioeconomic Drivers and Indicators of Urban Expansion: Evidence from the Heavily Urbanised Shanghai Metropolitan Area, China. Sustainability 9, 1199. doi:10.3390/su9071199
Li, M., Hu, B., and Ling, Z. (2021). Analysis of Spatial and Temporal Expansion Characteristics of Built-Up Area in Nanning City in Recent 30 Years. Pop. Sci. Technol. 24, 22
Li, X., Li, D., Xu, H., and Wu, C. (2017b). Intercalibration between DMSP/OLS and VIIRS Night-Time Light Images to Evaluate City Light Dynamics of Syria's Major Human Settlement during Syrian Civil War. Int. J. Remote Sens. 38, 5934–5951. doi:10.1080/01431161.2017.1331476
Li, X., and Zhou, Y. (2017). Urban Mapping Using DMSP/OLS Stable Night-Time Light: a Review. Int. J. Remote Sens. 38, 6030–6046. doi:10.1080/01431161.2016.1274451
Liu, C., Yang, K., Bennett, M. M., Guo, Z., Cheng, L., and Li, M. (2019). Automated Extraction of Built-Up Areas by Fusing VIIRS Nighttime Lights and Landsat-8 Data. Remote Sens. 11, 1571–1620. doi:10.3390/rs11131571
Liu, F., Zhang, Z., Shi, L., Zhao, X., Xu, J., Yi, L., et al. (2016). Urban Expansion in China and its Spatial-Temporal Differences over the Past Four Decades. J. Geogr. Sci. 26, 1477–1496. doi:10.1007/s11442-016-1339-3
Liu, J., Jiao, L., Dong, T., Xu, G., Zhang, B., and Yang, L. (2018). A Novel Measure Approach of Expansion Process of Urban Landscape:Multi-Order Adjacency Index. Sci. Geogr. Sin. 38, 1741–1749. doi:10.13249/j.cnki.sgs.2018.11.001
Liu, S., Wu, C., and Shen, H. (2000). A GIS Based Model of Urban Land Use Growth in Beijing. Acta Geogr. Sin. 55, 407
Liu, X., Dong, G., Wang, X., Xue, Z., Jiang, M., Lu, X., et al. (2013). Characterizing the Spatial Pattern of Marshlands in the Sanjiang Plain, Northeast China. Ecol. Eng. 53, 335–342. doi:10.1016/j.ecoleng.2012.12.071
Liu, Y., Zuo, R., and Dong, Y. (2021). Analysis of Temporal and Spatial Characteristics of Urban Expansion in Xiaonan District from 1990 to 2020 Using Time Series Landsat Imagery. Remote Sens. 13, 4299. doi:10.3390/rs13214299
Lu, D., Tian, H., Zhou, G., and Ge, H. (2008). Regional Mapping of Human Settlements in Southeastern China with Multisensor Remotely Sensed Data. Remote Sens. Environ. 112, 3668–3679. doi:10.1016/j.rse.2008.05.009
Ma, T. (2018). An Estimate of the Pixel-Level Connection between Visible Infrared Imaging Radiometer Suite Day/night Band (VIIRS DNB) Nighttime Lights and Land Features across China. Remote Sens. 10, 723–811. doi:10.3390/rs10050723
Ma, X., Tong, X., Liu, S., Luo, X., Xie, H., and Li, C. (2017). Optimized Sample Selection in SVM Classification by Combining with DMSP-OLS, Landsat NDVI and GlobeLand30 Products for Extracting Urban Built-Up Areas. Remote Sens. 9, 236. doi:10.3390/rs9030236
Milletari, F., Navab, N., and Ahmadi, S.-A. (2016). V-net: Fully Convolutional Neural Networks for Volumetric Medical Image Segmentation. Proc. - 2016 4th Int. Conf. 3D Vis. 3DV, 565–571. doi:10.1109/3DV.2016.79
Mithun, S., Sahana, M., Chattopadhyay, S., Johnson, B. A., Khedher, K. M., and Avtar, R. (2021). Monitoring Metropolitan Growth Dynamics for Achieving Sustainable Urbanization (Sdg 11.3) in kolkata Metropolitan Area, india. Remote Sens. 13, 4423. doi:10.3390/rs13214423
Mnih, V., Heess, N., Graves, A., and Kavukcuoglu, K. (2014). Recurrent Models of Visual Attention. Adv. Neural Inf. Process. Syst. 3, 2204
Navab, N., Hornegger, J., Wells, W. M., and Frangi, A. F. (2015). Medical Image Computing and Computer-Assisted Intervention - MICCAI 2015. Lect. Notes Comput. Sci. Incl. Subser. Lect. Notes Artif. Intell. Lect. Notes Bioinforma. 9351, 12–20. doi:10.1007/978-3-319-24574-4
Peng, D., Zhang, Y., and Guan, H. (2019). End-to-end Change Detection for High Resolution Satellite Images Using Improved UNet++. Remote Sens. 11, 1382. doi:10.3390/rs11111382
Shi, K., Yu, B., Huang, Y., Hu, Y., Yin, B., Chen, Z., et al. (2014). Evaluating the Ability of NPP-VIIRS Nighttime Light Data to Estimate the Gross Domestic Product and the Electric Power Consumption of China at Multiple Scales: A Comparison with DMSP-OLS Data. Remote Sens. 6, 1705–1724. doi:10.3390/rs6021705
Sun, J., Di, L., Sun, Z., Wang, J., and Wu, Y. (2020). Estimation of GDP Using Deep Learning with NPP-VIIRS Imagery and Land Cover Data at the County Level in CONUS. IEEE J. Sel. Top. Appl. Earth Obs. Remote Sens. 13, 1400–1415. doi:10.1109/JSTARS.2020.2983331
Tan, Y., Xiong, S., and Li, Y. (2018). Automatic Extraction of Built-Up Areas from Panchromatic and Multispectral Remote Sensing Images Using Double-Stream Deep Convolutional Neural Networks. IEEE J. Sel. Top. Appl. Earth Obs. Remote Sens. 11, 3988–4004. doi:10.1109/JSTARS.2018.2871046
Tan, Y., Xiong, S., Li, Z., Tian, J., and Li, Y. (2019). Accurate Detection of Built-Up Areas from High-Resolution Remote Sensing Imagery Using a Fully Convolutional Network. Photogramm. Eng. Remote Sens. 85, 737–752. doi:10.14358/PERS.85.10.737
Tan, Y., Xiong, S., and Yan, P. (2020). Multi-branch Convolutional Neural Network for Built-Up Area Extraction from Remote Sensing Image. Neurocomputing 396, 358–374. doi:10.1016/j.neucom.2018.09.106
Tianjun Xiao, T., Yichong Xu, Y., Kuiyuan Yang, K., Jiaxing Zhang, J., Yuxin Peng, Y., and Zhang, Z. (2015). The Application of Two-Level Attention Models in Deep Convolutional Neural Network for Fine-Grained Image Classification.” in Proc. IEEE Comput. Soc. Conf. Comput. Vis. Pattern Recognit, 842–850. doi:10.1109/CVPR.2015.7298685
Wang, M., Song, Y., Wang, F., and Meng, Z. (2021). Boundary Extraction of Urban Built-Up Area Based on Luminance Value Correction of NTL Image. IEEE J. Sel. Top. Appl. Earth Obs. Remote Sens. 14, 7466–7477. doi:10.1109/JSTARS.2021.3098787
Wang, Q., Gao, J., and Yuan, Y. (2018). Embedding Structured Contour and Location Prior in Siamesed Fully Convolutional Networks for Road Detection. IEEE Trans. Intell. Transp. Syst. 19, 230–241. doi:10.1109/TITS.2017.2749964
Woo, S., Park, J., Lee, J.-Y., and Kweon, I. S. (2018). CBAM: Convolutional Block Attention Module. Cham: Springer, Vol. 1, 782–797. doi:10.1007/978-3-030-01234-2
Wu, F., Wang, C., Zhang, H., Li, J., Li, L., Chen, W., et al. (2021). Built-up Area Mapping in China from GF-3 SAR Imagery Based on the Framework of Deep Learning. Remote Sens. Environ. 262, 112515. doi:10.1016/j.rse.2021.112515
Yang, W., and Zhao, J. (2020). Study on China's Economic Development from the Perspective of Strong Sustainability. Singap. Econ. Rev. 65, 161–192. doi:10.1142/S021759081746002X
Yang, Y., Wang, D., Yan, Z., and Zhang, S. (2021). Delineating Urban Functional Zones Using U-Net Deep Learning: Case Study of Kuancheng District, Changchun, China. Land 10, 1266–1321. doi:10.3390/land10111266
Yang, Z., Xie, L., Sun, W., and Cheng, Z. (2020). Transitional Spatial Structure with Development of Economic Clusters: The Case of Beijing. J. Urban Plann. Dev. 146, 04020008. doi:10.1061/(asce)up.1943-5444.0000561
Yi-de Ma, M. A., Qing Liu, L. I. U., and Zhi-bai Quan, . 2004). Automated Image Segmentation Using Improved PCNN Model Based on Cross-Entropy,” in Proceedings of 2004 International Symposium on Intelligent Multimedia, Video and Speech Processing, 2004. 743–746. doi:10.1109/ISIMP.2004.1434171
Yin, C. L., Meng, F., Guo, L., Zhang, Y. X., Zhao, Z., Xing, H. Q., et al. (2021). Extraction and Evolution Analysis of Urban Built-Up Areas in Beijing, 1984-2018. Appl. Spat. Anal. 14, 731–753. doi:10.1007/s12061-021-09374-7
Yu, G., He, D., Lin, W., Wu, Q., Xiao, J., Lei, X., et al. (2020). China's Spatial Economic Network and its Influencing Factors. Complexity 2020, 1–13. doi:10.1155/2020/6352021
Yue, W., Fan, P., Wei, Y. D., and Qi, J. (2014). Economic Development, Urban Expansion, and Sustainable Development in Shanghai. Stoch. Environ. Res. Risk Assess. 28, 783–799. doi:10.1007/s00477-012-0623-8
Zeng, C., Liu, Y., Stein, A., and Jiao, L. (2015). Characterization and Spatial Modeling of Urban Sprawl in the Wuhan Metropolitan Area, China. Int. J. Appl. Earth Observation Geoinformation 34, 10–24. doi:10.1016/j.jag.2014.06.012
Zhang, Q., and Seto, K. (2013). Can Night-Time Light Data Identify Typologies of Urbanization? A Global Assessment of Successes and Failures. Remote Sens. 5, 3476–3494. doi:10.3390/rs5073476
Zhang, X., Bai, Z., Fan, X., Lu, Y., Cao, Y., Zhao, Z., et al. (2016). Urban Expansion Process, Pattern, and Land Use Response in an Urban Mining Composited Zone from 1986 to 2013. J. Urban Plann. Dev. 142, 04016014. doi:10.1061/(asce)up.1943-5444.0000327
Zhang, Z., Liu, F., Zhao, X., Wang, X., Shi, L., Xu, J., et al. (2018). Urban Expansion in China Based on Remote Sensing Technology: A Review. Chin. Geogr. Sci. 28, 727–743. doi:10.1007/s11769-018-0988-9
Zhou, Y., Huang, W., Dong, P., Xia, Y., and Wang, S. (2021). D-UNet: A Dimension-Fusion U Shape Network for Chronic Stroke Lesion Segmentation. IEEE/ACM Trans. Comput. Biol. Bioinf. 18, 940–950. doi:10.1109/TCBB.2019.2939522
Keywords: urban built-up areas, deep semantic segmentation network, CBAM_UNet, spatial and temporal expansion of China, center–periphery network
Citation: Bai M, Zhang S, Wang X, Feng Y, Wang J and Peng P (2022) Deep Semantic Segmentation for Rapid Extraction and Spatial-Temporal Expansion Variation Analysis of China’s Urban Built-Up Areas. Front. Earth Sci. 10:883779. doi: 10.3389/feart.2022.883779
Received: 25 February 2022; Accepted: 25 May 2022;
Published: 01 July 2022.
Edited by:
Ding Ma, Shenzhen University, ChinaReviewed by:
Milad Janalipour, Ministry of Science, Research, and Technology, IranMinmin Li, Shenzhen University, China
Copyright © 2022 Bai, Zhang, Wang, Feng, Wang and Peng. This is an open-access article distributed under the terms of the Creative Commons Attribution License (CC BY). The use, distribution or reproduction in other forums is permitted, provided the original author(s) and the copyright owner(s) are credited and that the original publication in this journal is cited, in accordance with accepted academic practice. No use, distribution or reproduction is permitted which does not comply with these terms.
*Correspondence: Peihao Peng, peihaop@163.com