An Estimate of the Pixel-Level Connection between Visible Infrared Imaging Radiometer Suite Day/Night Band (VIIRS DNB) Nighttime Lights and Land Features across China


1
State Key Laboratory of Resources and Environmental Information System, Institute of Geographical Sciences and Natural Resources Research, Chinese Academy of Sciences, Beijing 100101, China
2
University of Chinese Academy of Sciences, Beijing 100049, China
3
Jiangsu Center for Collaborative Innovation in Geographical Information Resource Development and Application, Nanjing 210023, China
Remote Sens. 2018, 10(5), 723; https://doi.org/10.3390/rs10050723
Submission received: 16 April 2018
/
Revised: 24 April 2018
/
Accepted: 3 May 2018
/
Published: 8 May 2018
Abstract
:Satellite-derived nighttime light images are increasingly used for various studies in relation to demographic, socioeconomic and urbanization dynamics because of the salient relationships between anthropogenic lighting signals at night and statistical variables at multiple scales. Owing to a higher spatial resolution and fewer over-glow and saturation effects, the new generation of nighttime light data derived from the Visible Infrared Imaging Radiometer Suite (VIIRS) day/night band (DNB), which is located on board the Suomi National Polar-Orbiting Partnership (Suomi-NPP) satellite, is expected to facilitate the performance of nocturnal luminosity-based investigations of human activity in a spatially explicit manner. In spite of the importance of the spatial connection between the VIIRS DNB nighttime light radiance (NTL) and the land surface type at a fine scale, the crucial role of NTL-based investigations of human settlements is not well understood. In this study, we investigated the pixel-level relationship between the VIIRS DNB-derived NTL, a Landsat-derived land-use/land-cover dataset, and the map of point of interest (POI) density over China, especially with respect to the identification of artificial surfaces in urban land. Our estimates suggest that notable differences in the NTL between urban (man-made) surfaces and other types of land surfaces likely allow us to spatially identify most of the urban pixels with relatively high radiance values in VIIRS DNB images. Our results also suggest that current nighttime light data have a limited capability for detecting rural residential areas and explaining pixel-level variations in the POI density at a large scale. Moreover, the impact of non-man-made surfaces on the partitioned results appears inevitable because of the spatial heterogeneity of human settlements and the nature of remotely sensed nighttime light data. Using receiver operating characteristic (ROC) curve-based analysis, we obtained optimal thresholds of the nighttime light radiance, by equally weighting the sensitivity and specificity of the identification results, for extracting the nationwide distribution of lighted urban man-made pixels from the 2015 annual composite of VIIRS DNB data. Our findings can provide the basic knowledge needed for the further application of current nighttime light data to investigate spatiotemporal patterns in human settlements.

1. Introduction
Remotely sensed anthropogenic lighting signals at night provide us with a proxy measure of the magnitude of human activity over both time and space [1,2,3]. It is well documented that there are generally statistically significant relationships between socioeconomic variables and the nighttime brightness at the regional and national scales [4,5,6]. Hence, satellite-derived nighttime light data, especially the long-term archive data previously collected by the Defense Meteorological Satellite Program (DMSP), have been widely employed to investigate the total degrees of various socioeconomic activities, such as the population size, gross domestic product and electric power consumption, at the regional and national levels [7,8,9,10,11,12,13,14,15,16,17]. In comparison with the DMSP data, current nighttime light images derived from the Visible Infrared Imaging Radiometer Suite (VIIRS) day/night band (DNB) likely enable us to obtain a detailed look at human settlements with a wider radiometric detection range and a higher spatial resolution [18,19,20,21,22]. Thus, VIIRS DNB images might potentially be used to characterize the spatiotemporal pattern of human settlements with locally varying human activities [23,24,25,26,27,28,29].
Excluding ephemeral lights and background noises, remotely sensed nocturnal radiance signals and their spatial variations in the cloud-free composite VIIRS DNB data are mainly determined by artificial lighting sources at night and their spatial arrangements in human settlements. Thus, nighttime light data with enhanced radiometric and spatial resolutions could theoretically allow us to spatially characterize the local patterns and dynamics of human settlement at a fine scale [30,31,32]. In practice, however, there are still some major challenges to the applications of current nighttime light images. In fact: (i) The lack of distinct textural information for artificial lighting sources hampers the morphological identification of different ground features; (ii) non-man-made surfaces lighted from the over-glow effect caused by light diffusion are often hardly distinguishable from nighttime lights, especially over urban land and rural–urban transition zones; (iii) in spite of the uncertainties and variations associated with threshold-based partitions, delineation of human settlements are still done using nighttime light data. However, the selection of an optimal brightness threshold is always difficult, and such thresholds are often questioned because of the diversity of their size and form and the variability in the socioeconomic status of human settlements across different regions; (iv) because of these drawbacks, most investigations are limited to regional- or sub-regional-level surveys of human activity; (v) nonetheless, the impact of pixel-level uncertainties and biases cannot be eliminated at the regional level when we mainly focus on artificial surface-related investigations, because we are unable to completely (or even mostly) exclude lighted non-man-made pixels.
Notwithstanding the abovementioned limitations, the increasing use of satellite-derived anthropogenic nighttime light data is desirable mainly because these data provide timely, consistent, and consecutive observations of diverse demographic and socioeconomic dynamics worldwide. A clear understanding of the connection between lit pixels and corresponding features on the land surface, therefore, is crucially important for further applications of nighttime light data. Unfortunately, such a fundamental issue is less well documented and overlooked in related studies.
The primary objective of the present study is to answer four basic and interrelated questions: (i) What kinds of land surface are covered by lighted pixels in nighttime light images? (ii) Are those lighted pixels distinguishable from each other merely using nighttime brightness data? (iii) How many artificial surfaces or objects cannot be sensed by current nighttime light data? (iv) How can an optimal threshold be developed that can identify urban areas with nighttime light images?
To answer these questions, we performed large-scale comparative analyses of the pixel-level relationship between lit pixels in VIIRS DNB nighttime light data and corresponding land-use/land-cover types derived from Landsat imagery across China in 2015. Point of interest (POI) data were also used to examine the capability of the VIIRS DNB images to identify artificial ground objects.
2. Materials and Methods
2.1. VIIRS Nighttime Light Data
The annual cloud-free composite of VIIRS DNB nighttime light data in 2015 was provided by NOAA’s (National Oceanic and Atmospheric Administration) National Centers for Environmental Information (NCEI) (we downloaded the data from https://ngdc.noaa.gov/eog/viirs/index.html). VIIRS DNB-derived annual composite images of nighttime lights are produced in geographic grids of 15 arc-seconds (~500 m at the equator) in the WGS84 reference system. The VIIRS DNB images used in this study (as illustrated in Figure 1a) contain cloud-free average values of the nighttime light radiance (NTL, in nW cm−2 sr−1 hereafter), and background noises and ephemeral lights were filtered out from the annual composite.
2.2. Land-Use/Land-Cover and Point of Interest Data
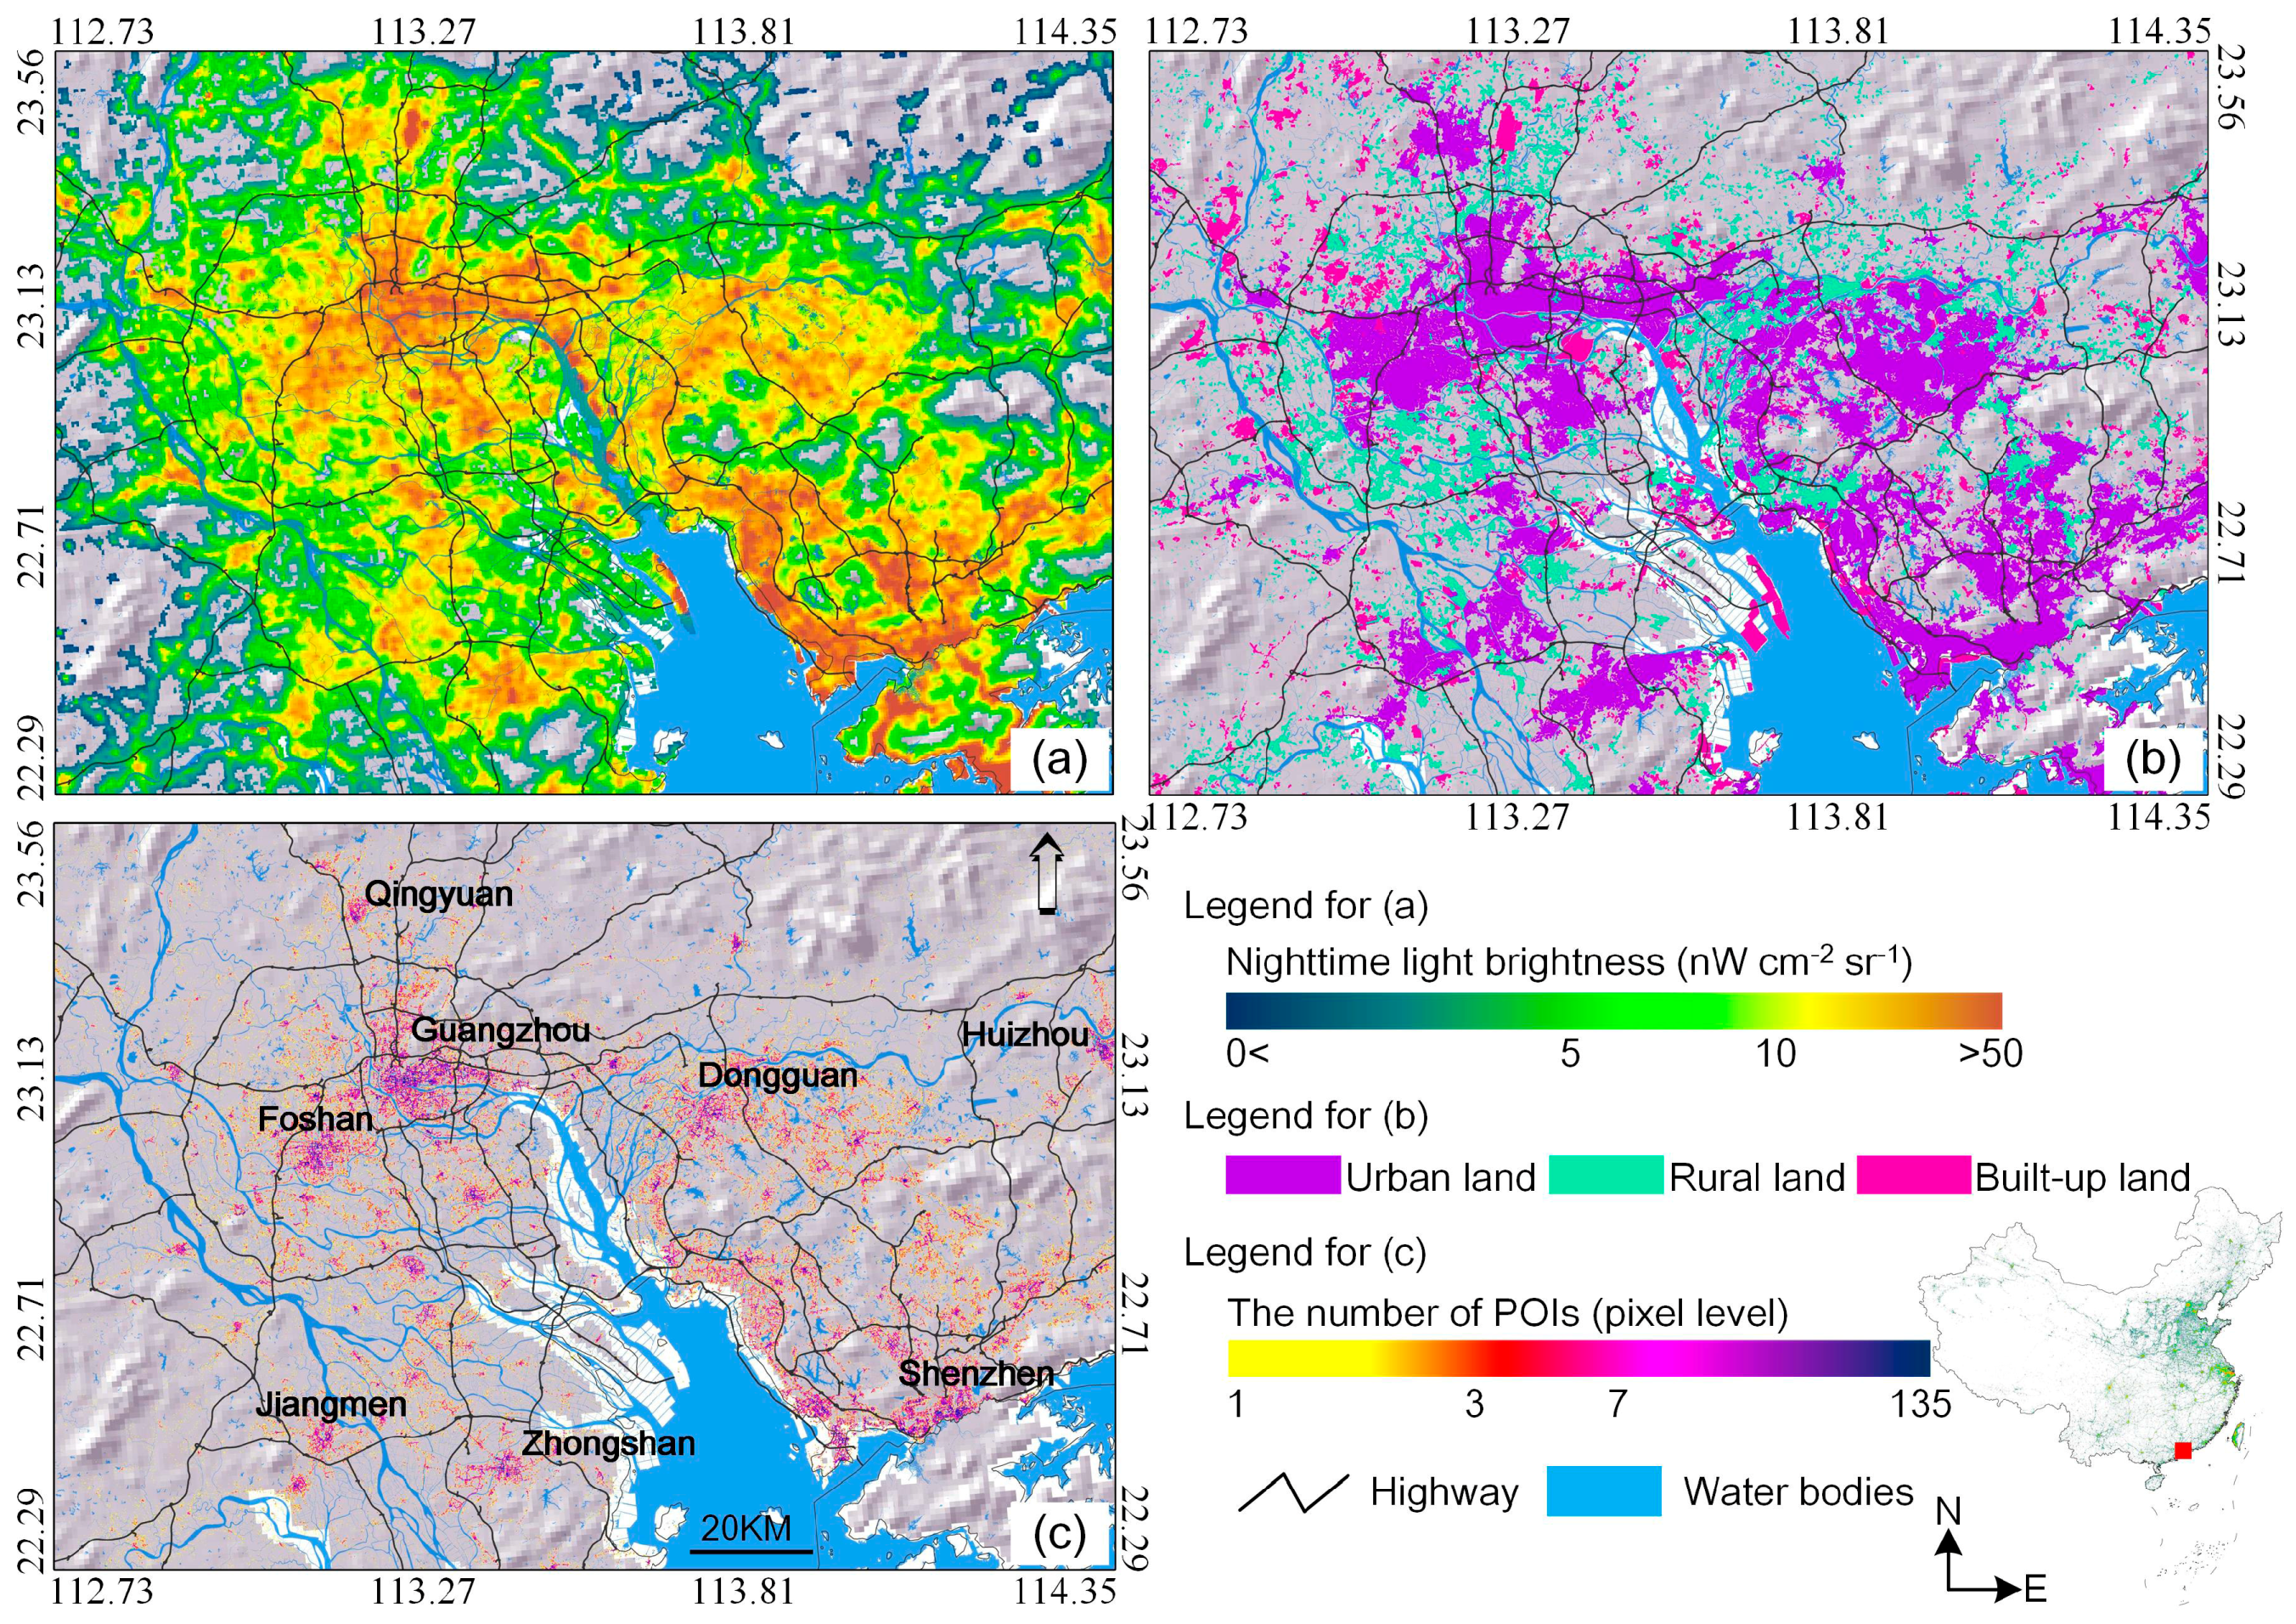
The land-use/land-cover (LULC) map in 2015 was provided by the Institute of Geographical Sciences and Natural Resource Research (IGSNRR) [33]. The IGSNRR LULC map, which has actually been produced every five years since the 1990s with a spatial resolution of 100 m, is derived from remotely sensed Landsat TM and ETM+ imagery through a supervised classification method with ground verification [33]. We re-categorized the initial LULC types of the IGSNRR map into eight groups: urban land (settlement), rural land (residential area), built-up land (including industrial area, factory, mine, oil field, salt field, and transportation), cropland (including rain-fed and irrigated), forest land, grassland (here, the coverage degree >20%), water bodies, and unused land (including desert, Gobi, swamp, and bare soil). Figure 1b demonstrates the spatial distributions of three types of artificial surfaces, including urban, rural, and built-up land. Moreover, we collected a nationwide dataset of POIs (obtained from online mapping services such as https://maps.baidu.com/) consisting of all kinds of artificial ground objects, including residential, financial, commercial, shopping, and public service sites. We then generated a POI density map (number per unit pixel) with a spatial resolution of 100 m (as illustrated in Figure 1c).
2.3. Comparative Analysis of Nighttime Radiance and Land Surface Data
First, we located all of the land-use/land-cover pixels covered by lighted VIIRS DNB pixels through a map overlay operation. We then separately counted the number of identified land-use/land-cover pixels and calculated the statistical features of the nighttime brightness corresponding to the eight different LULC types. Second, we collected the POI density and the pixels that were not present in the lighted areas of the VIIRS DNB images for the three types of artificial surfaces. Third, we used the cumulative distribution of pixel-level VIIRS DNB NTL to quantitatively compare the differences in the nighttime lighting signals of various lit land surfaces among the eight LULC types. Finally, the receiver operating characteristic (ROC) curve was employed to obtain an optimal threshold of the nighttime light radiance to identify urban and built-up lands (collectively called man-made hereafter) on the basis of a tradeoff between the sensitivity and specificity of the partitioned results. It should be noted that our investigations were carried out in a nationwide survey across the whole country at the pixel level in order to obtain a general perspective of the relationship between the VIIRS DNB nighttime light data and the LULC type. Hence, regional variations in their connection were not considered in subsequent analyses.
3. Results and Discussion
3.1. Lit Land Surfaces and Non-Lit Artificial Surfaces
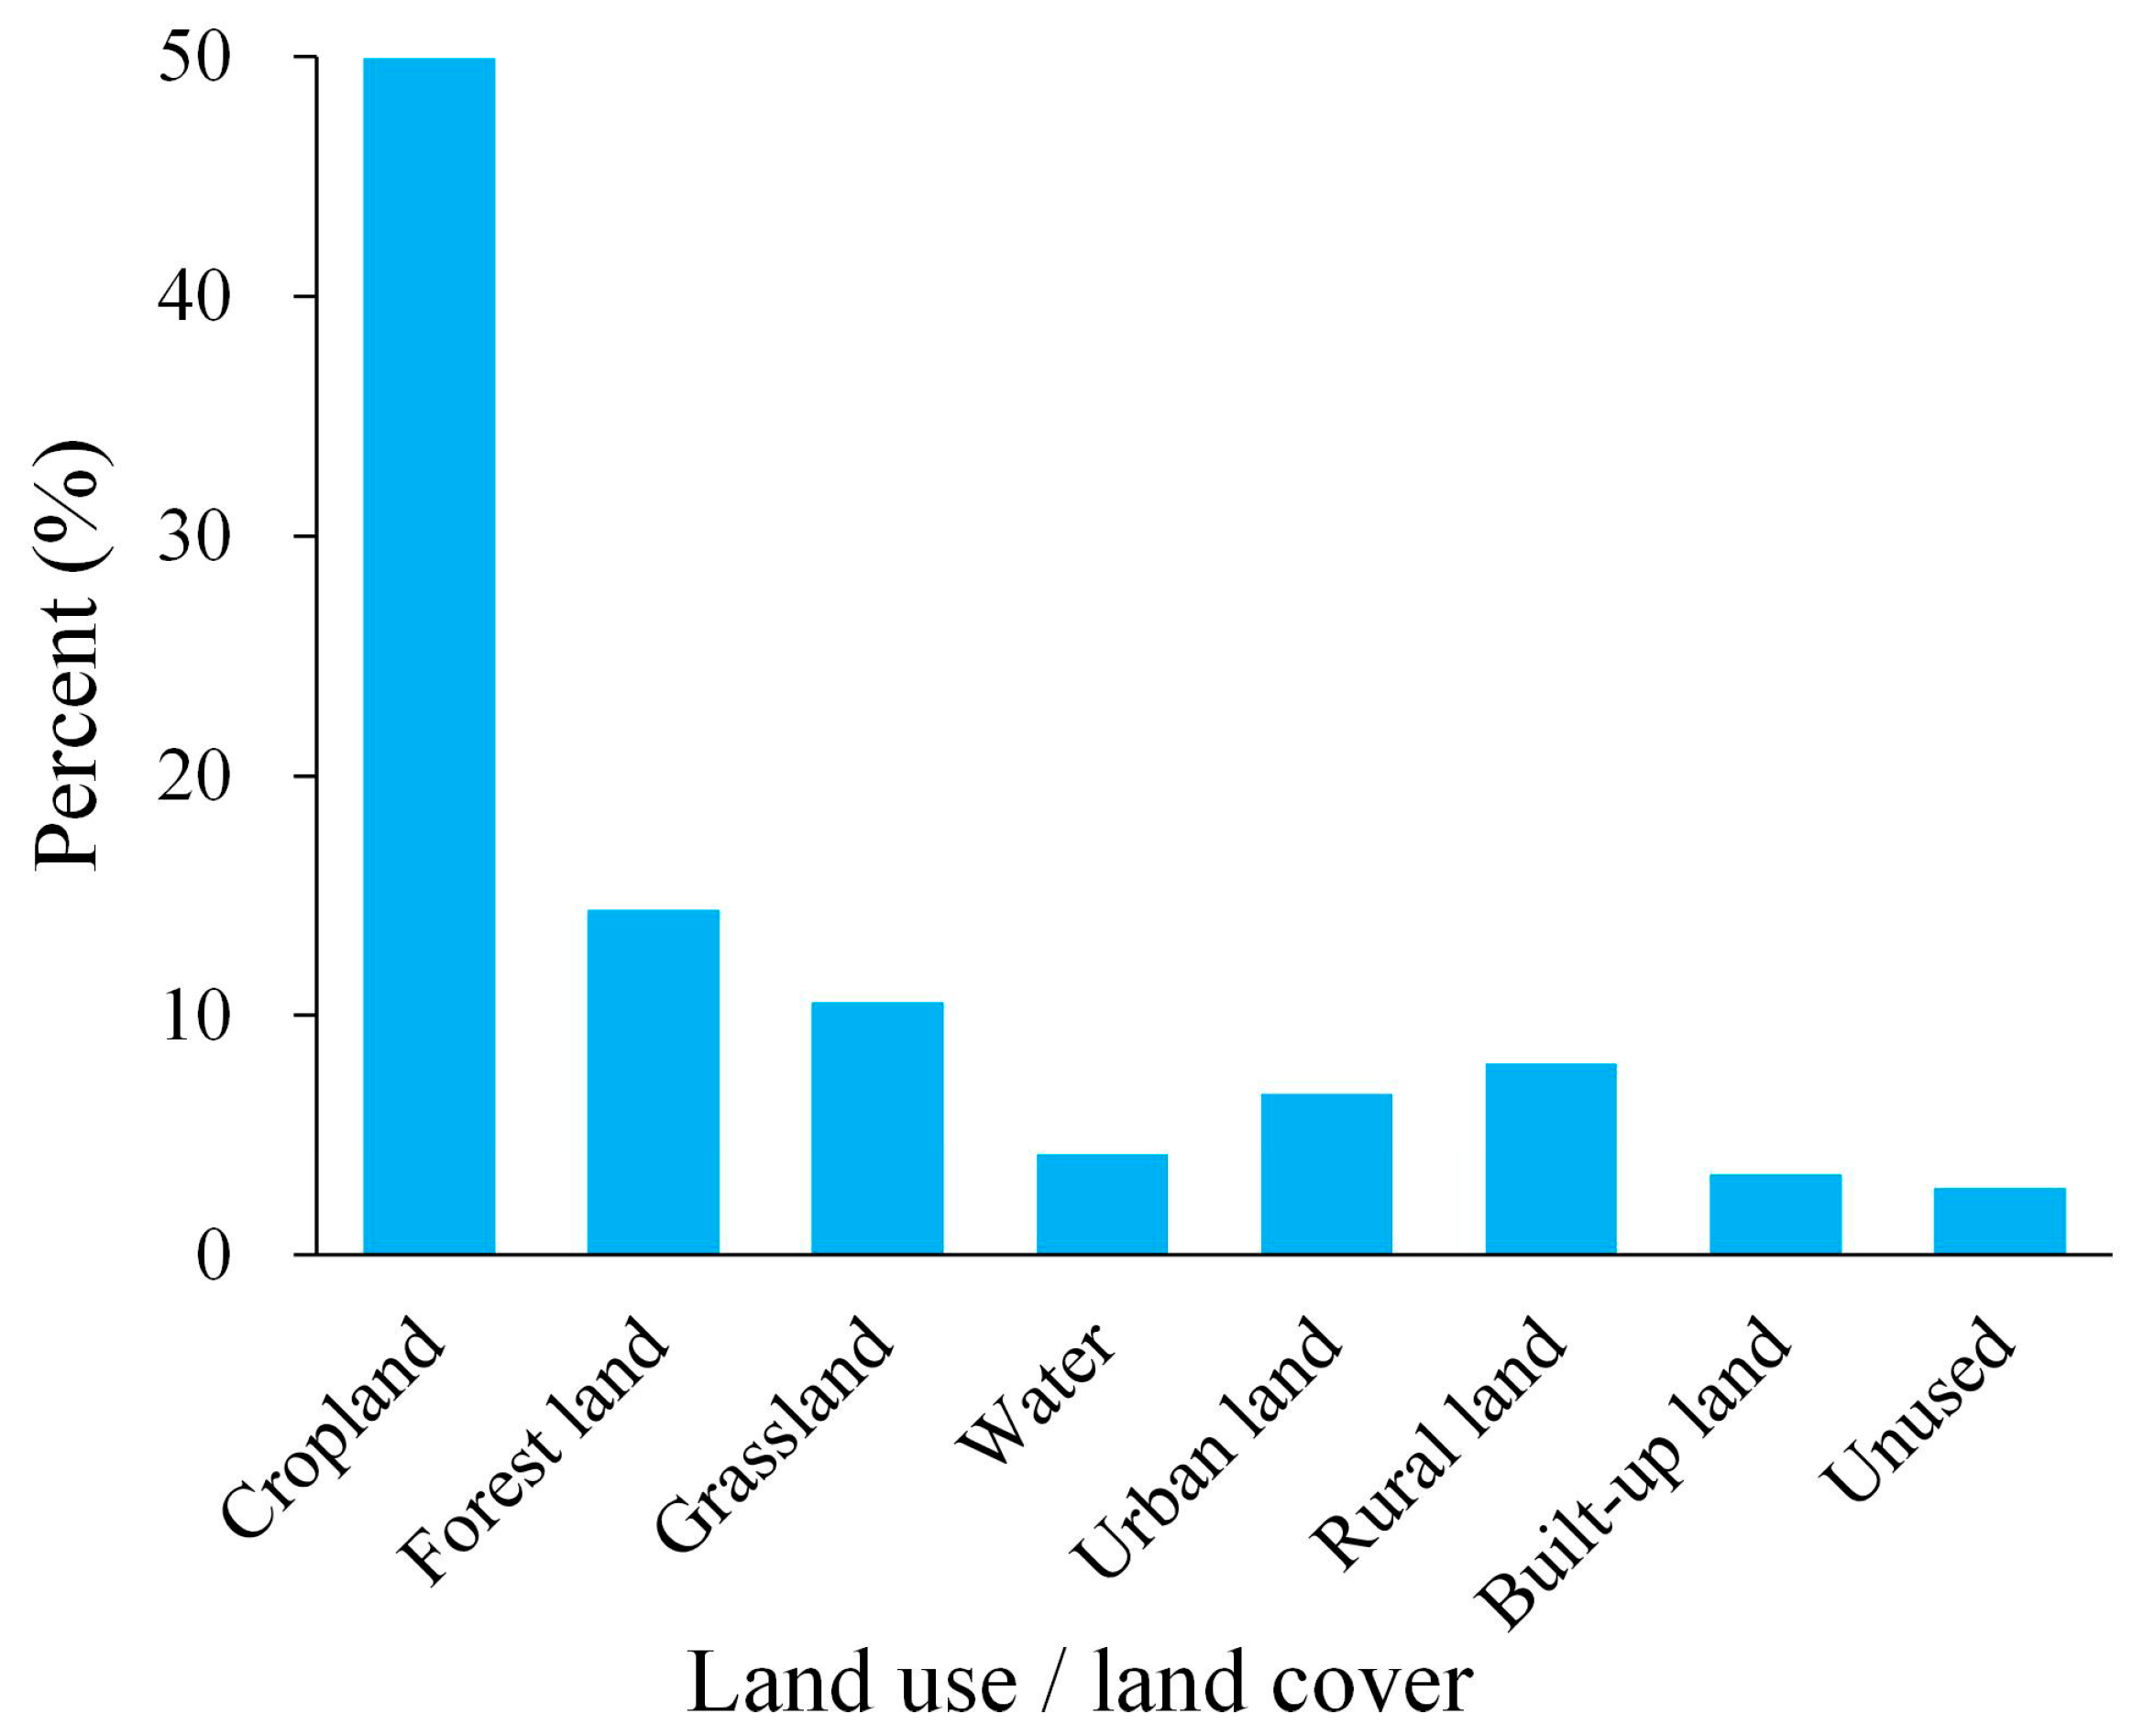
A total of nearly 75.62 million pixels in the LULC map were found to be illuminated by VIIRS DNB-sensed nighttime radiance (here NTL > 0) over the whole country. As shown in Figure 2, we found that most of the lit pixels (~82%) were likely connected to non-man-made surfaces, and artificial land, including urban, rural, and built-up areas, accounted only for ~18%. In particular, nearly half of the lighted area (~49%) was likely connected to cropland. This result reveals a marked impact of the over-glow effect of artificial radiance on the spatial extent of lit areas, even though the magnitude of the effect was visually reduced in the VIIRS DNB images in comparison with the DMSP data. This finding further suggests that lit area-based analysis results without other determinative criteria should be processed and interpreted with great caution, because sizable non-man-made surfaces can be lighted at night as a result of the over-glow effect of current nighttime light images.
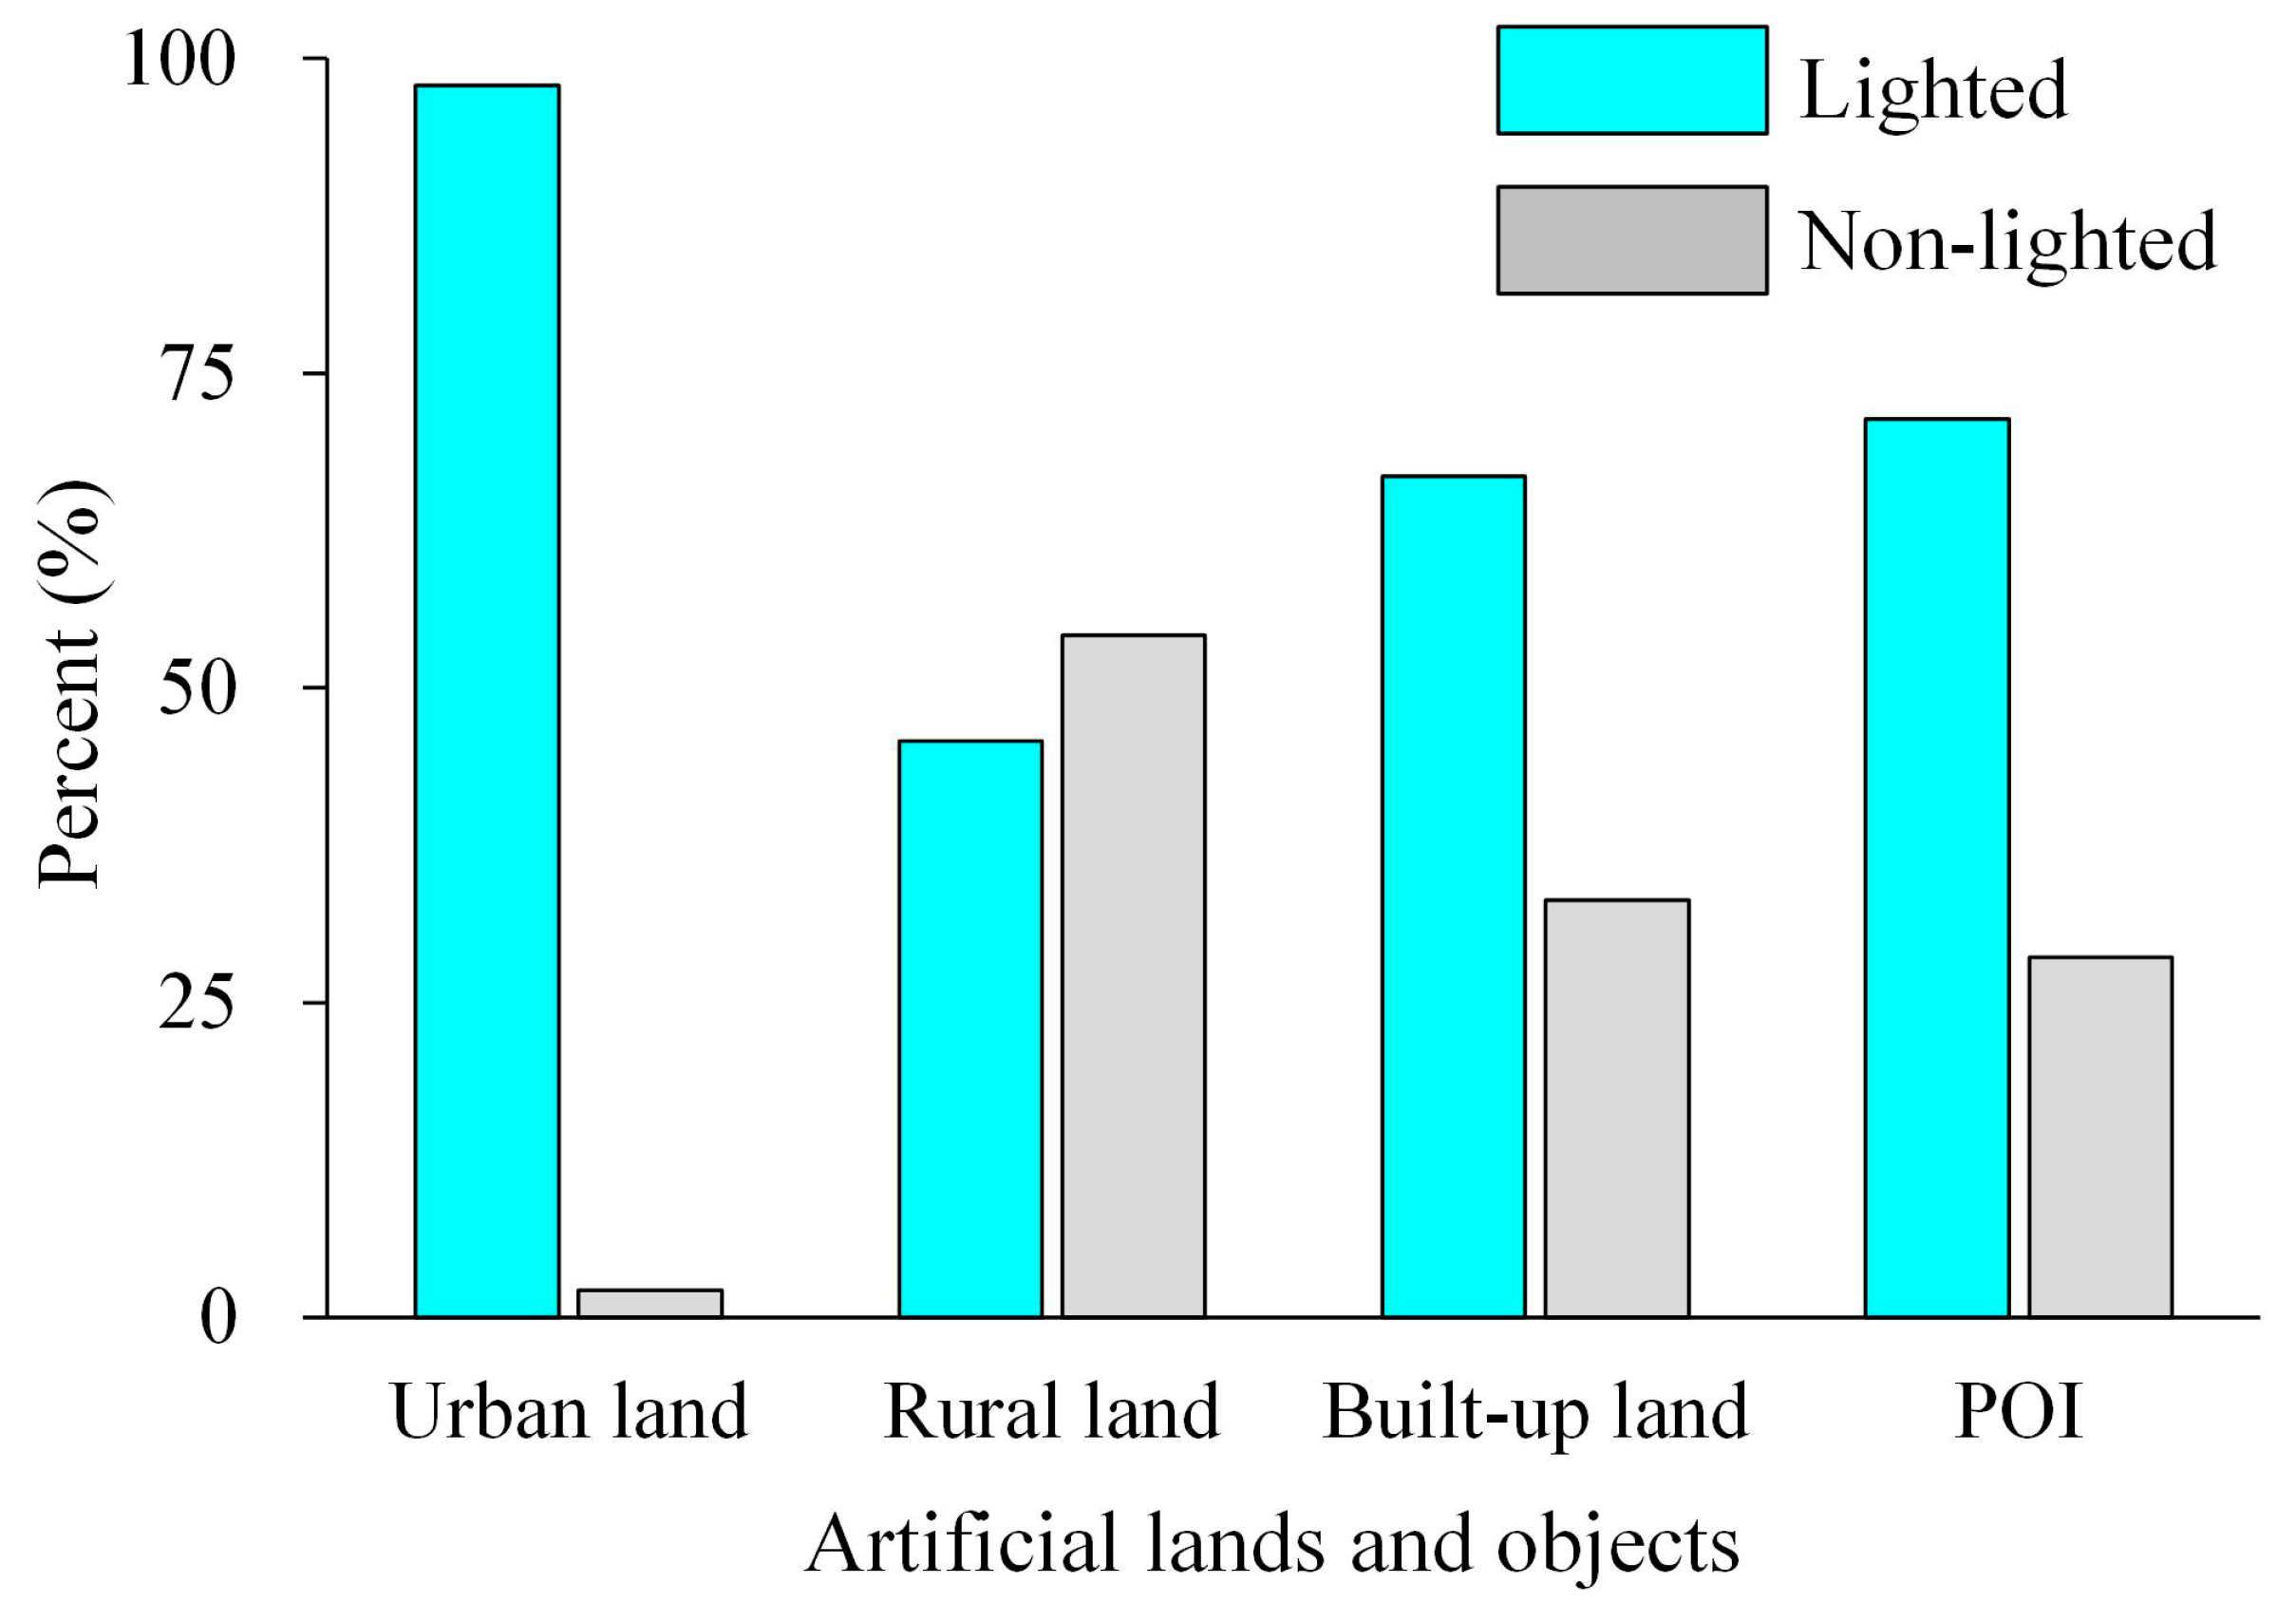
As represented in Figure 3, the large majority (~98%) of urban land and nearly three-fifths of built-up land (~67%), both of which generally experience a relatively high density of human activity, showed detectable nighttime light signals in the VIIRS DNB images. Moreover, according to the POI density map, most of the land surfaces (~71%) with artificial sites were lit by observed artificial lights. In contrast, more than half (~54%) of the rural residential areas, which typically have a low density of human activity, were not covered by lighting pixels in the VIIRS DNB images. These results jointly indicate the limited capability of current nighttime light data for detecting man-made features, especially in those regions with a low density of human activity, even though they have an enhanced radiometric detection range and spatial resolution, particularly for remote rural settlements, because nearly 30% of artificial surfaces and objects (i.e., in total for all four cases shown in Figure 3) were probably excluded by the VIIRS DNB signals.
3.2. Differences in the Nighttime Radiance among Various Types of Land Surfaces
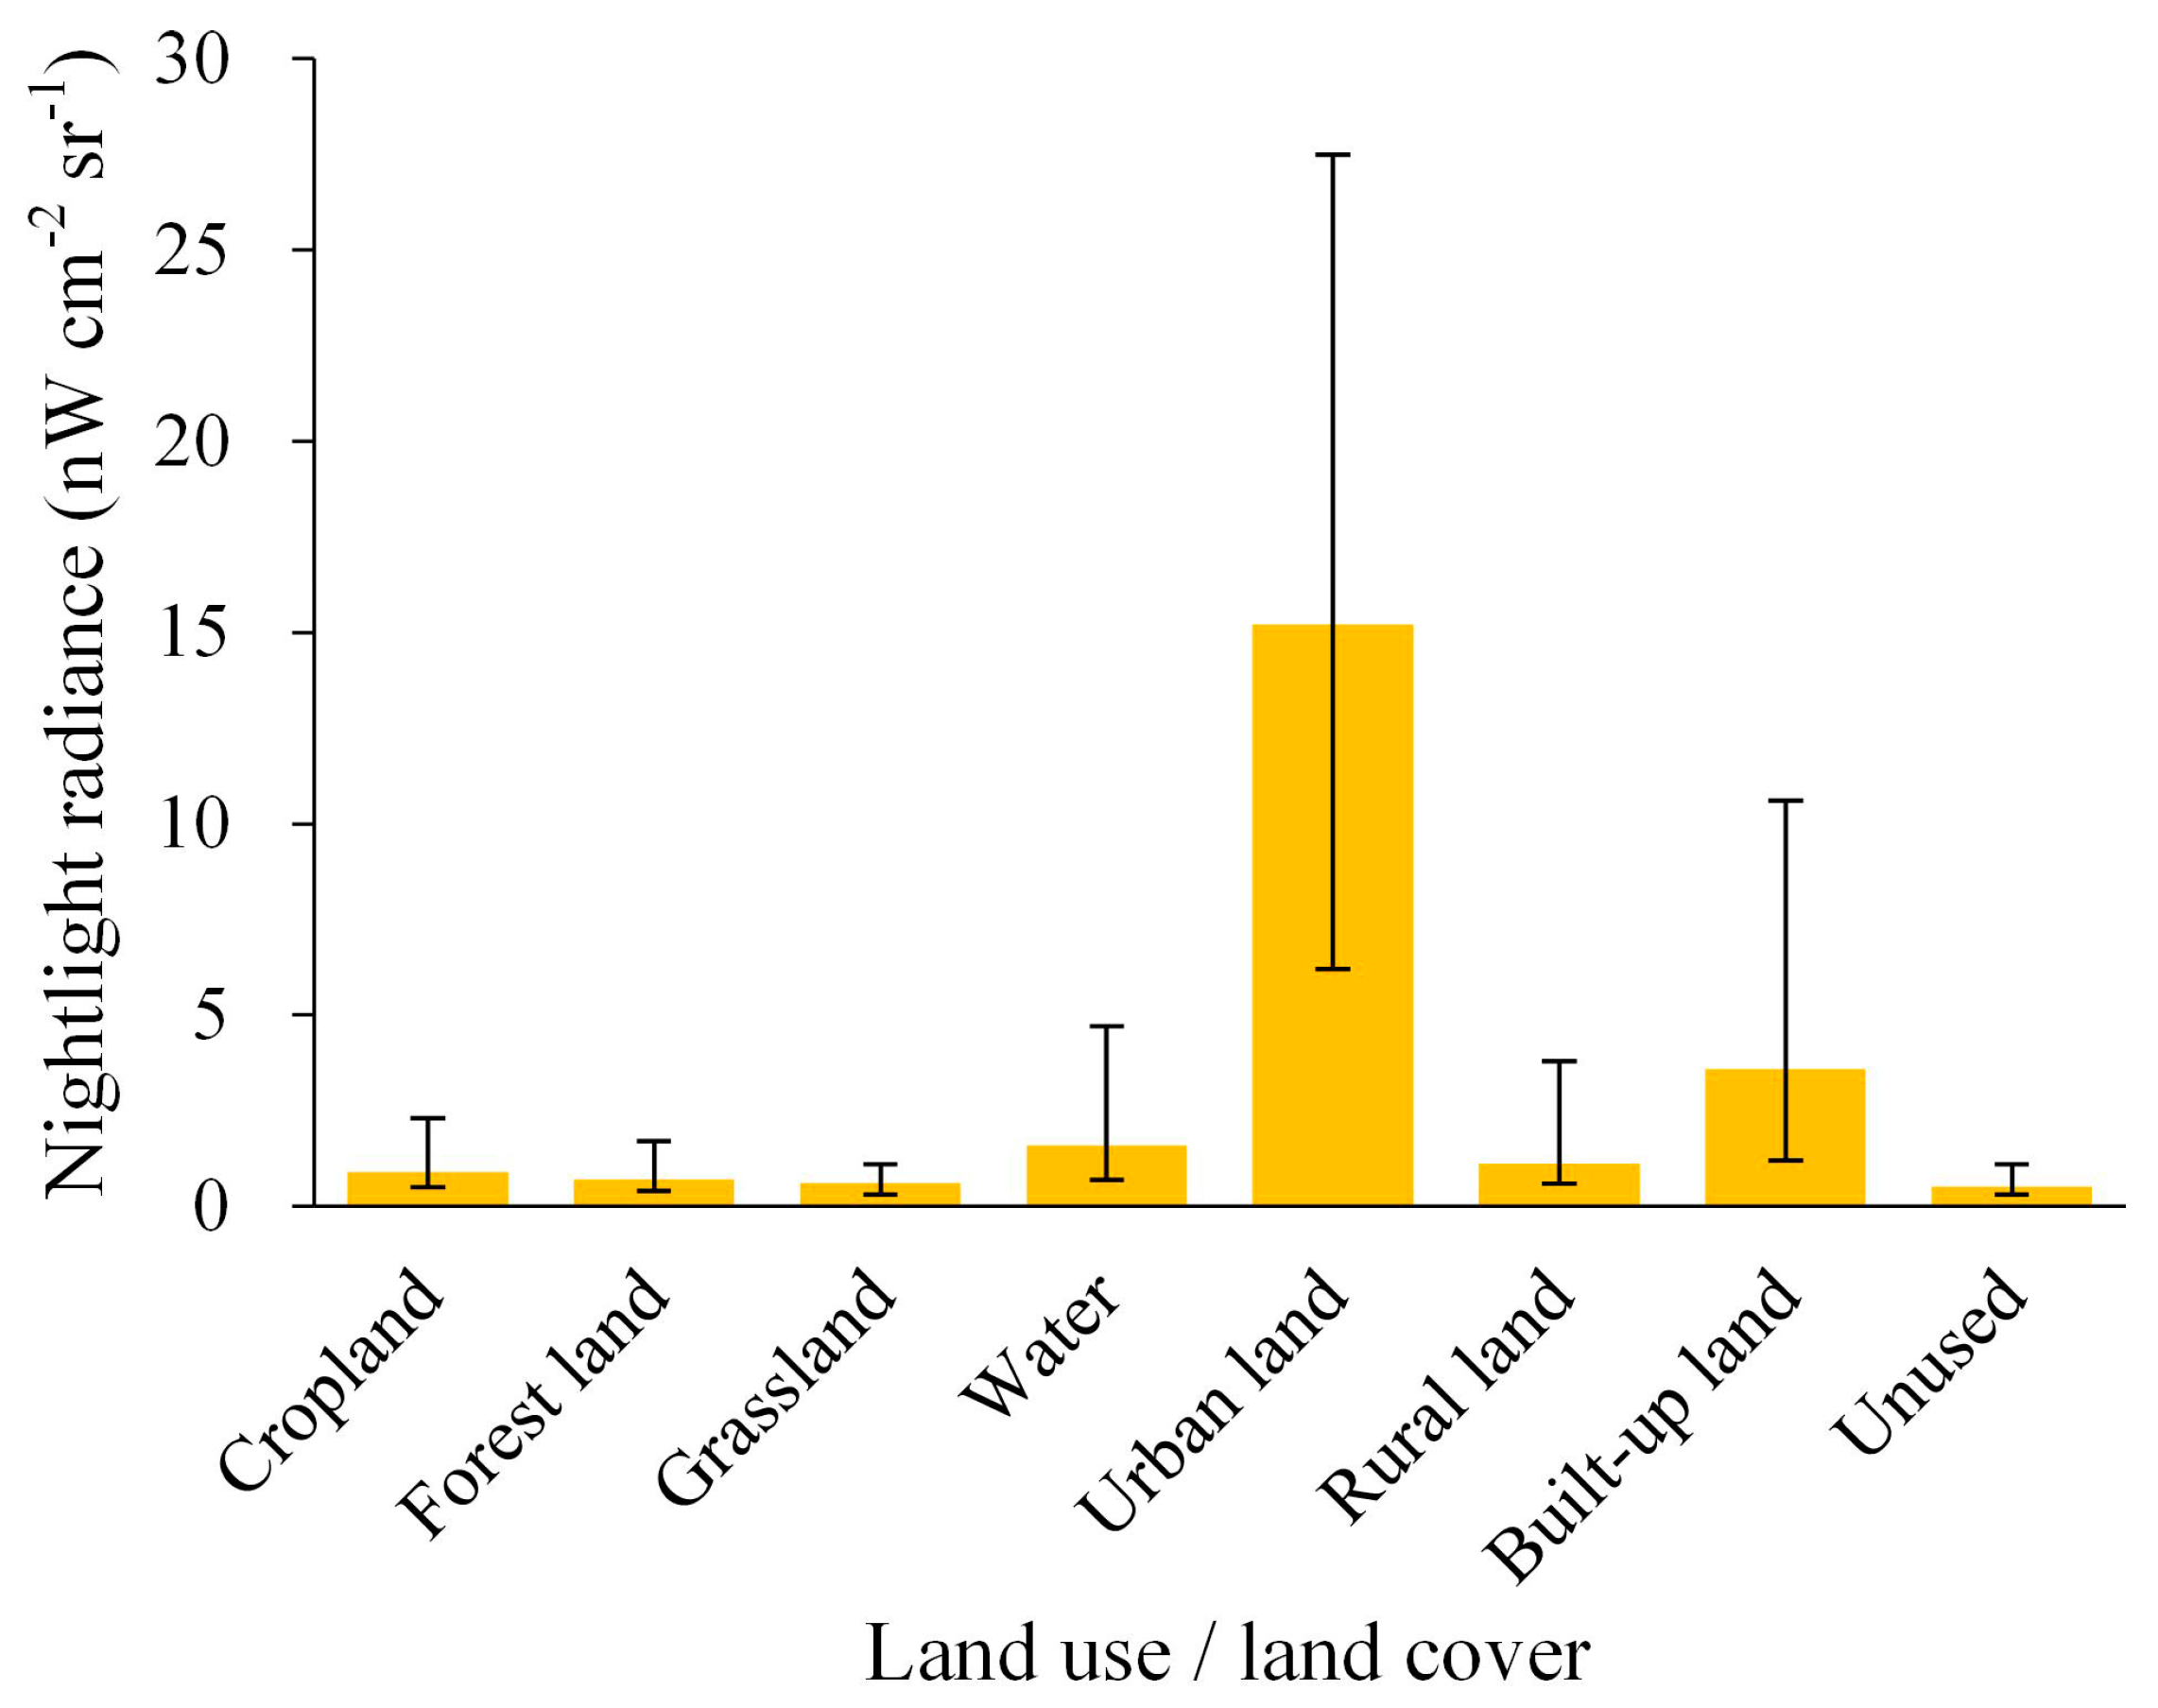
Differential nocturnal radiances constitute the basis for the characterization and identification of artificial lighting sources from nighttime light images in the absence of distinct textural features. Figure 4 presents a comparison of the statistical characteristics of the nighttime brightness data among different groups of lighted LULC pixels. The group of urban land showed a conspicuously high NTL with a median of 15.20 and an arithmetic mean of 19.08. On average, the nocturnal radiance over urban land was estimated to be 16.18 (16.17–16.20, 95% confidence interval), larger than the estimates in the other groups. The mean nighttime brightness in the group of built-up land, in which the median and mean NTL were estimated to 3.60 and 8.73, respectively, also appeared to be 4.75 (4.73–4.76) higher than the estimates in the other groups of non-man-made surfaces. The average nighttime radiance in the group of rural land with a median of 1.10 and a mean of 4.12, however, was slightly larger than those of all types of natural surfaces. On the one hand, notable differences in the nighttime radiances potentially allow a threshold-based partition to cover the majority of urban land and most built-up land characterized by a relatively high density of human activity and corresponding nighttime light signals. On the other hand, the analysis results could also imply that it is usually hardly possible to spatially narrow peripheral lighted areas to precisely match the actual extents of rural settlements merely using dim nocturnal radiance signals from current nighttime light images.
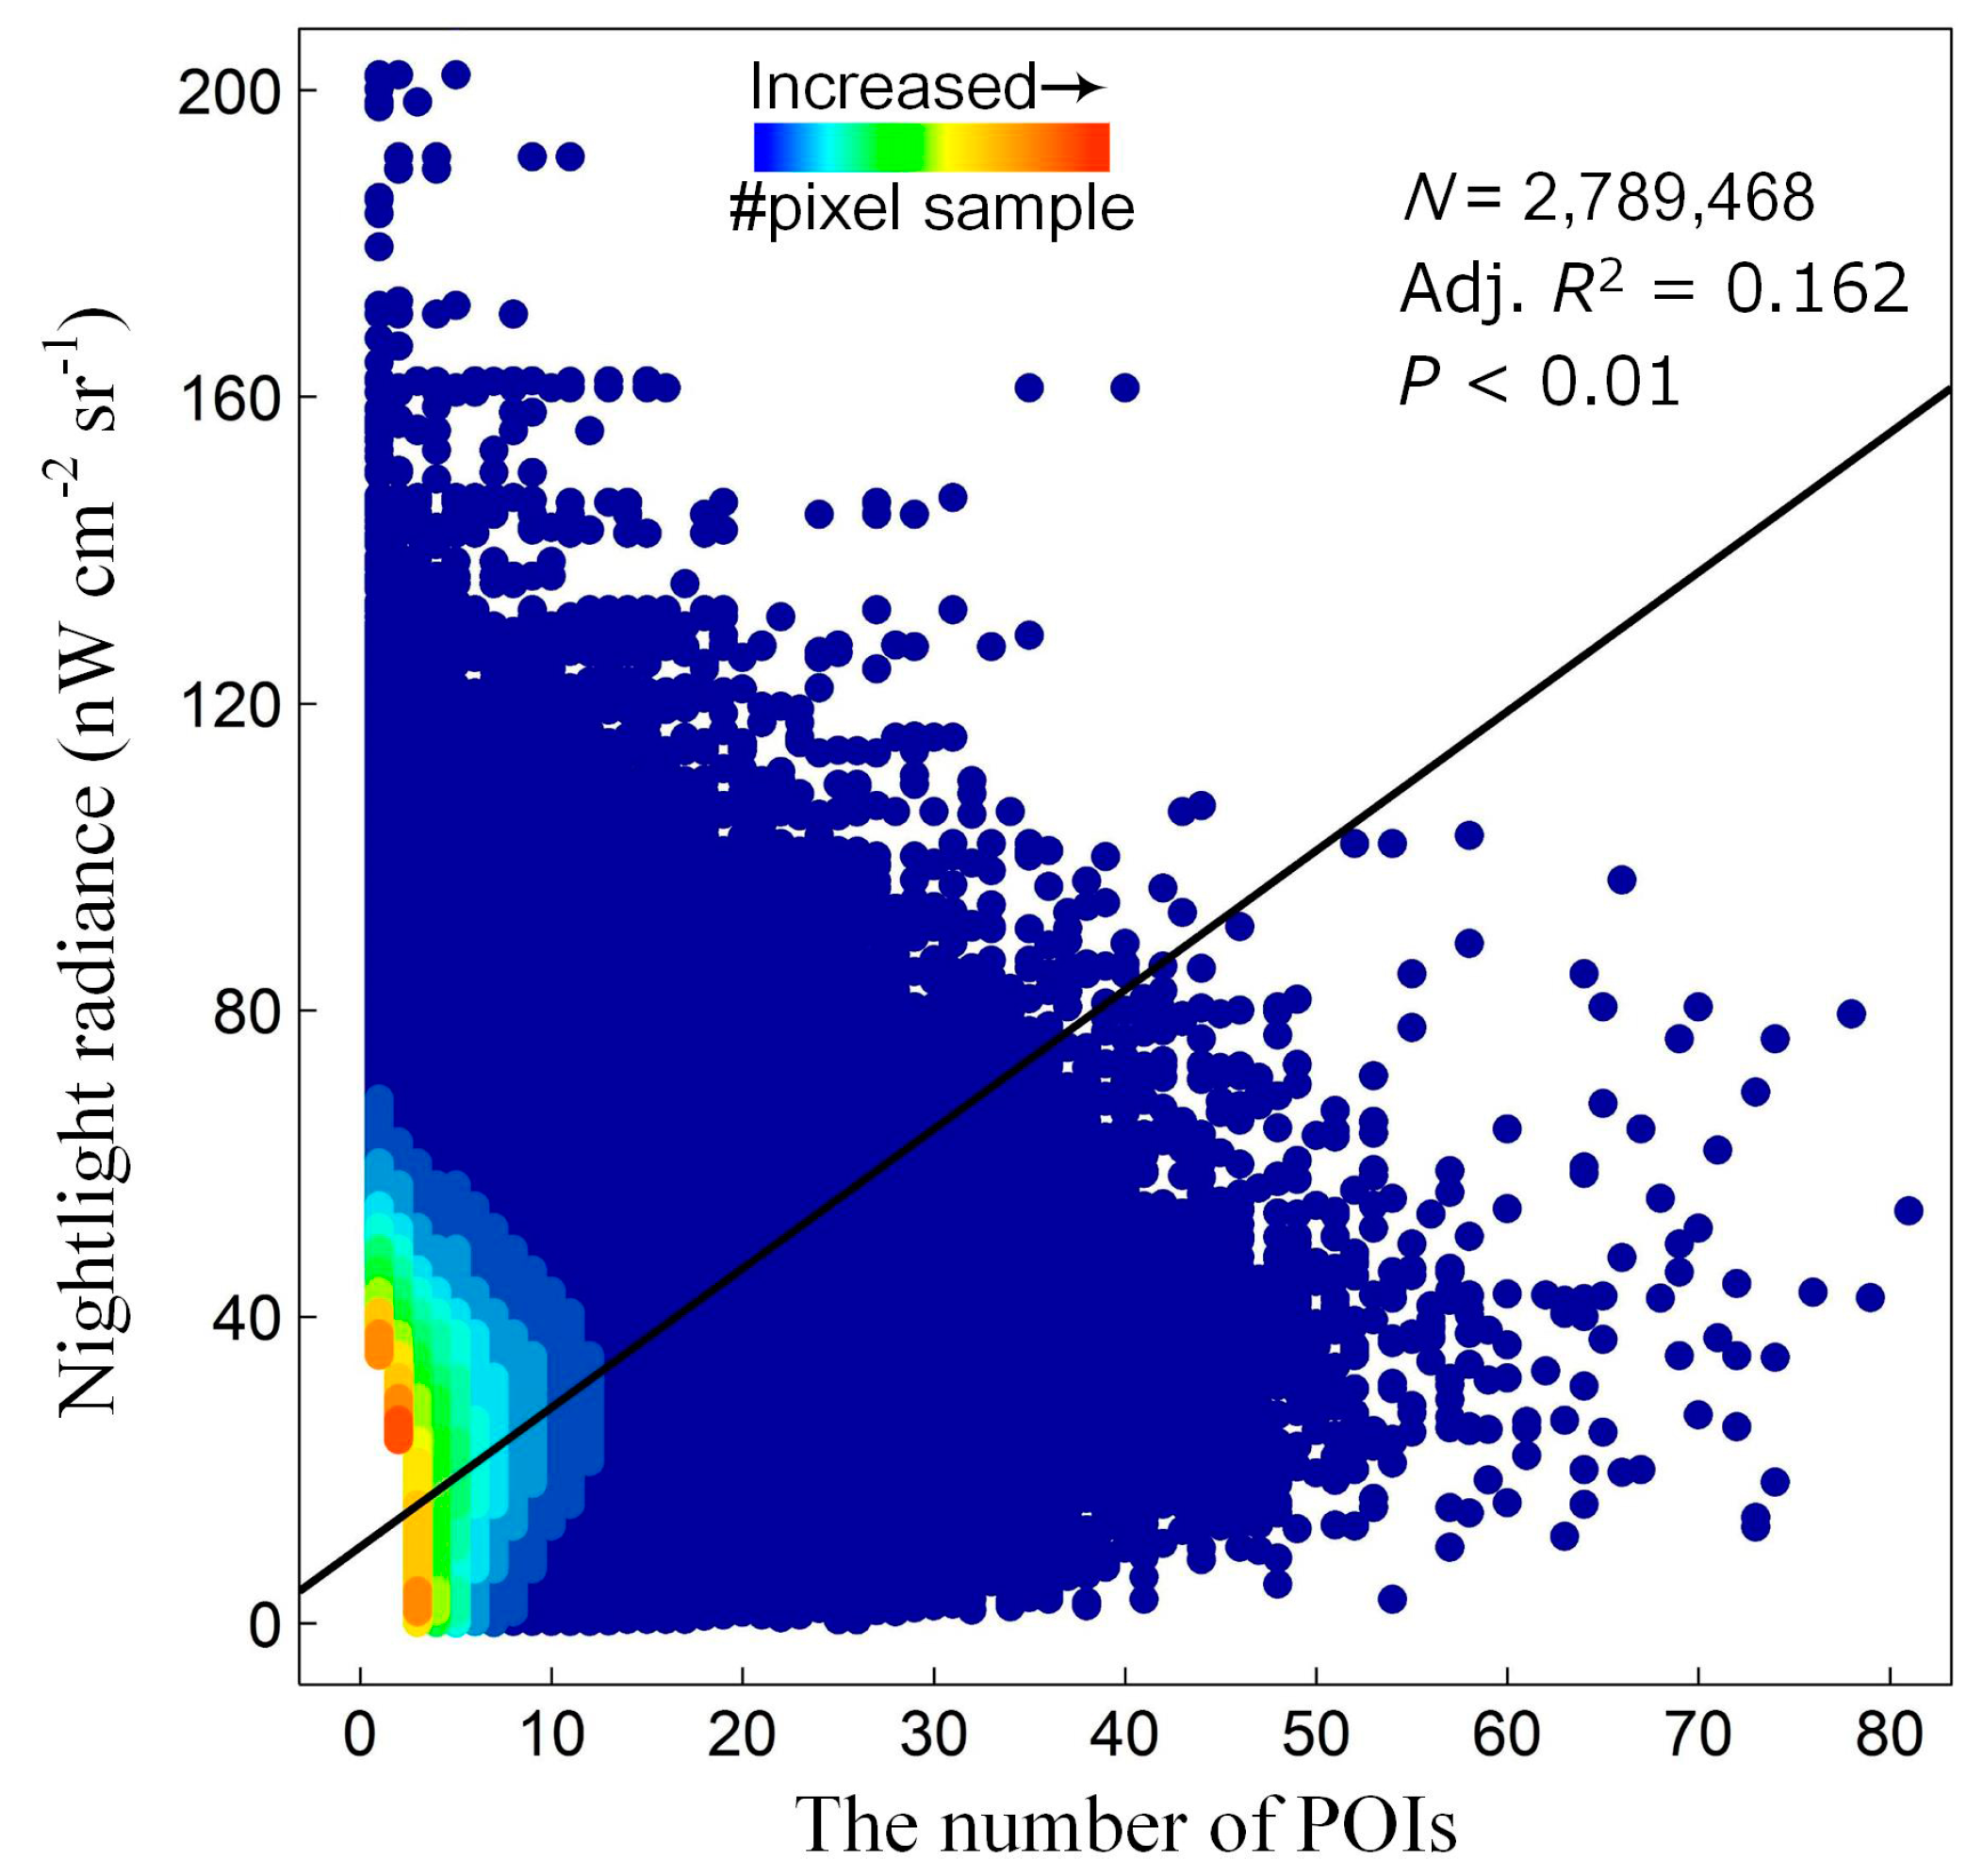
Although no spatial extents of artificial features were represented in the POI map, the grid cell-level aggregate density (frequency) of POIs could be indicative of the degree of local human activity (see Figure 1c). The relationship between the nighttime radiance and POI density at the pixel level, however, might not be simply monotonic. As shown in Figure 5, although the nighttime light brightness showed a statistically significant (p-value < 0.01, which mainly resulted from a high degree of freedom in the F-test of the overall significance in regression analysis, even if the Bonferroni correction was used to reduce the effect of multiple comparisons in significance testing) positive linear response to the increased artificial POI density, it could explain only 16.2% of the spatial variance in the POI density at the pixel level across the whole county. This result implies a complex spatial distribution of artificial ground features that generally cannot be portrayed completely by corresponding variations in the anthropogenic nocturnal luminosity at a fine scale, especially across a vast region such as China.
3.3. Statistical Comparison of Nighttime Lights among Various Types of Land Surfaces
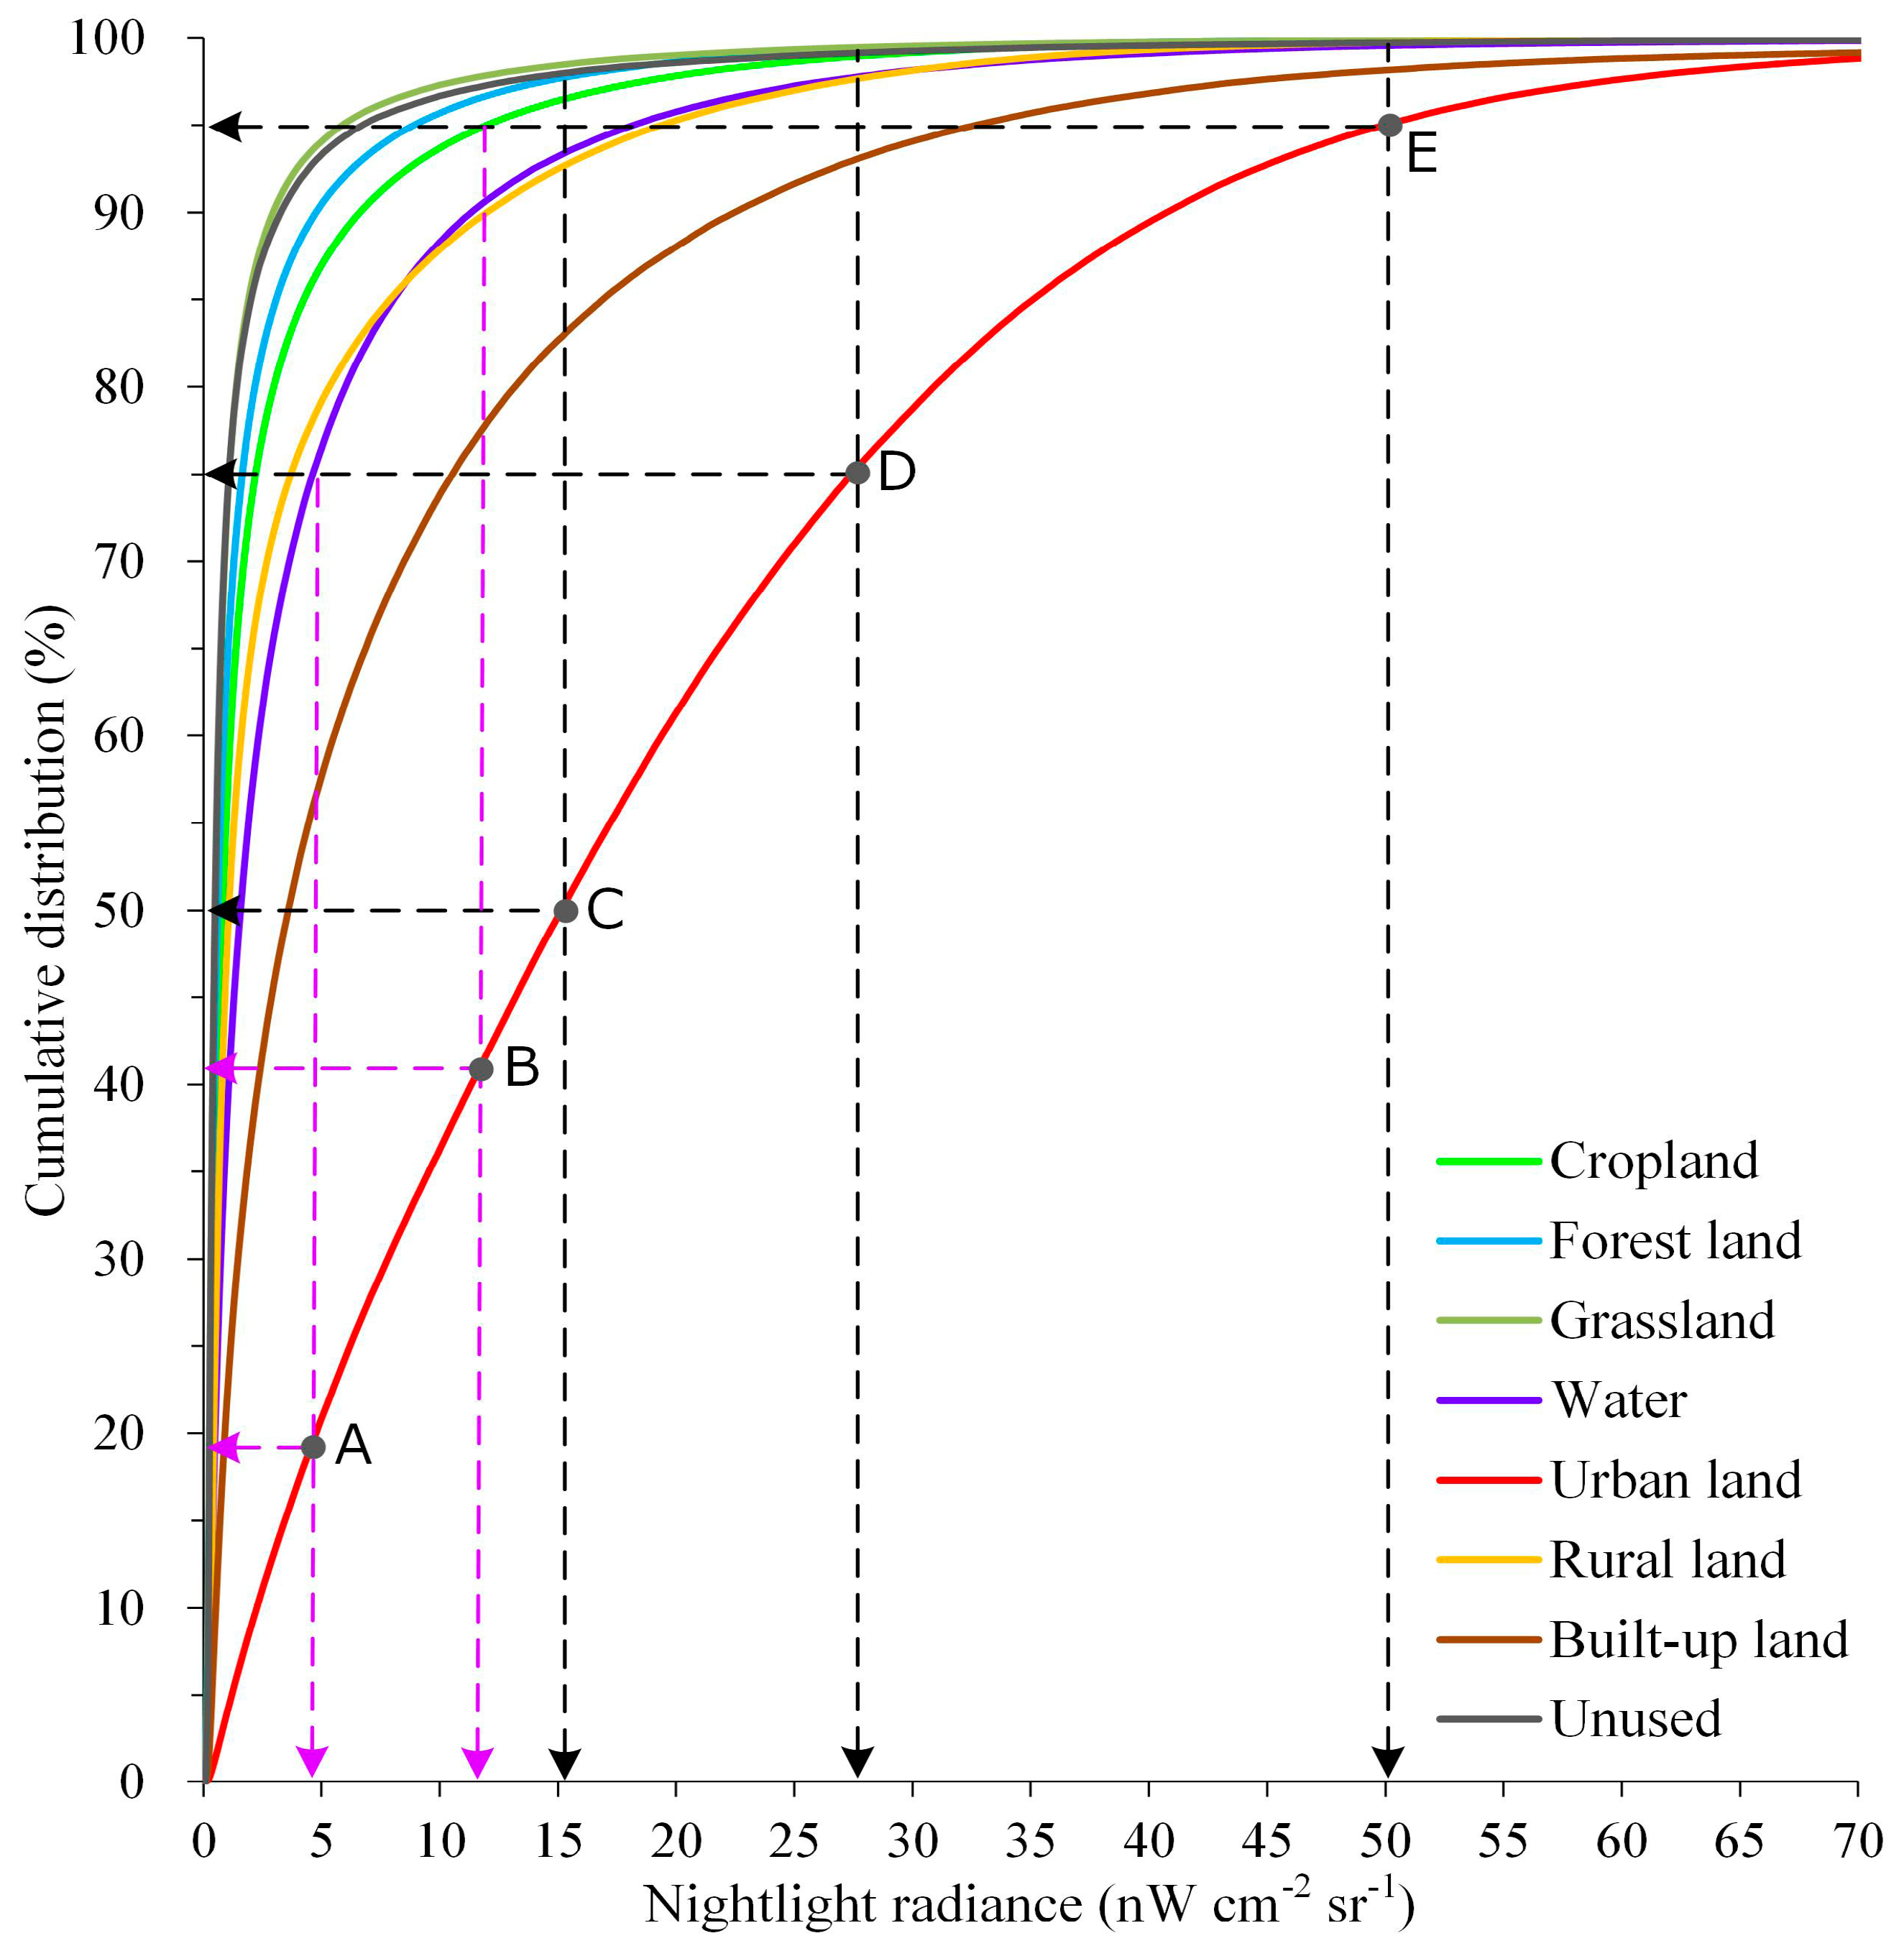
The differences and variations in the mean and quartile range of grouped NTL among the different types of LULC provided us with an incomplete view regarding the connection between the nighttime light radiance and the LULC type in terms of the identification of artificial features from the VIIRS DNB images. Figure 6 further exhibits the differences in the cumulative distributions of pixel-level nighttime light signals for eight types of LULC across China in 2015. Here, we mainly focused on the difference in the cumulative NTL distribution between the group of urban land and the other groups (except built-up land) to further investigate the distinguishability of urban pixels from non-man-made and rural pixels according to various thresholds of nighttime light radiances. First, we noted that whatever small NTL threshold (>0) we chose, there was still a minor component of urban pixels with dim nighttime lights that was not involved. Second, when the NTL threshold was set as 4.6 (see point A in Figure 6 in association with Figure 2; here, the NTL corresponded to 75% percentile of water pixels), nearly 19.4% of the urban pixels might be omitted, and 69.1% of the identified pixels consisted of non-urban pixels (i.e., hereafter, not including non-man-made pixels in urbanized areas), of which 57.4% were cropland pixels. Third, if we set the NTL threshold at 12.0 to exclude 95.0% of lighted cropland pixels (see point B in Figure 6), 41.8% of the urban pixels were also filtered out. Non-urban pixels accounted for more than half (53.1%) of the selected pixels. Fourth, when we set the NTL threshold at 15.2 to exclude half of the urban pixels with relatively low nighttime light radiances (see point C in Figure 6), nearly half (48.5%) of the delineated regions covered the non-urban areas. Fifth, after raising the NTL threshold to 27.5 for the upper one-quarter of urban pixels with relatively high nighttime light radiances (see point D in Figure 6), the proportion of non-urban pixels was markedly decreased to 37.1%, although there were still quite a few. Finally, even with a high NTL threshold of 50 for the identification of urban core areas with intensified human activity (see point E in Figure 6), non-urban pixels were likely to appear in 30.5% of the extracted areas. Moreover, it was definitely visible that the influences of non-man-made and rural pixels on the identification of built-up areas were more significant than the influence of urban pixels.
The above results collectively suggested that for any given degree of socioeconomic activity, the corresponding extent could be overestimated through the NTL threshold-based partition of current nighttime light images; this overestimation is largely due to both the spatial heterogeneity of human settlement and the nature of satellite-derived anthropogenic nighttime light data, especially the over-glow effect. Non-man-made surfaces located in urbanized areas and their periphery, such as urban parks, green belts, and water bodies, are often lighted by adjacent artificially lighted sources at night and generally cannot be excluded directly according to the observed radiance.
3.4. Optimal Threshold Determined by the Receiver Operating Characteristic Curve
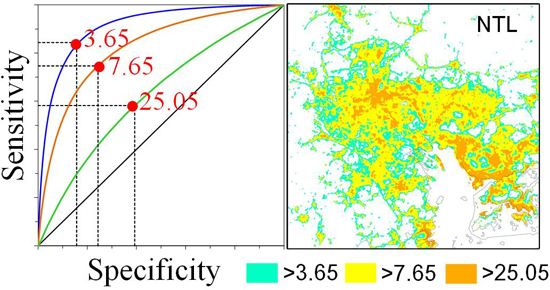
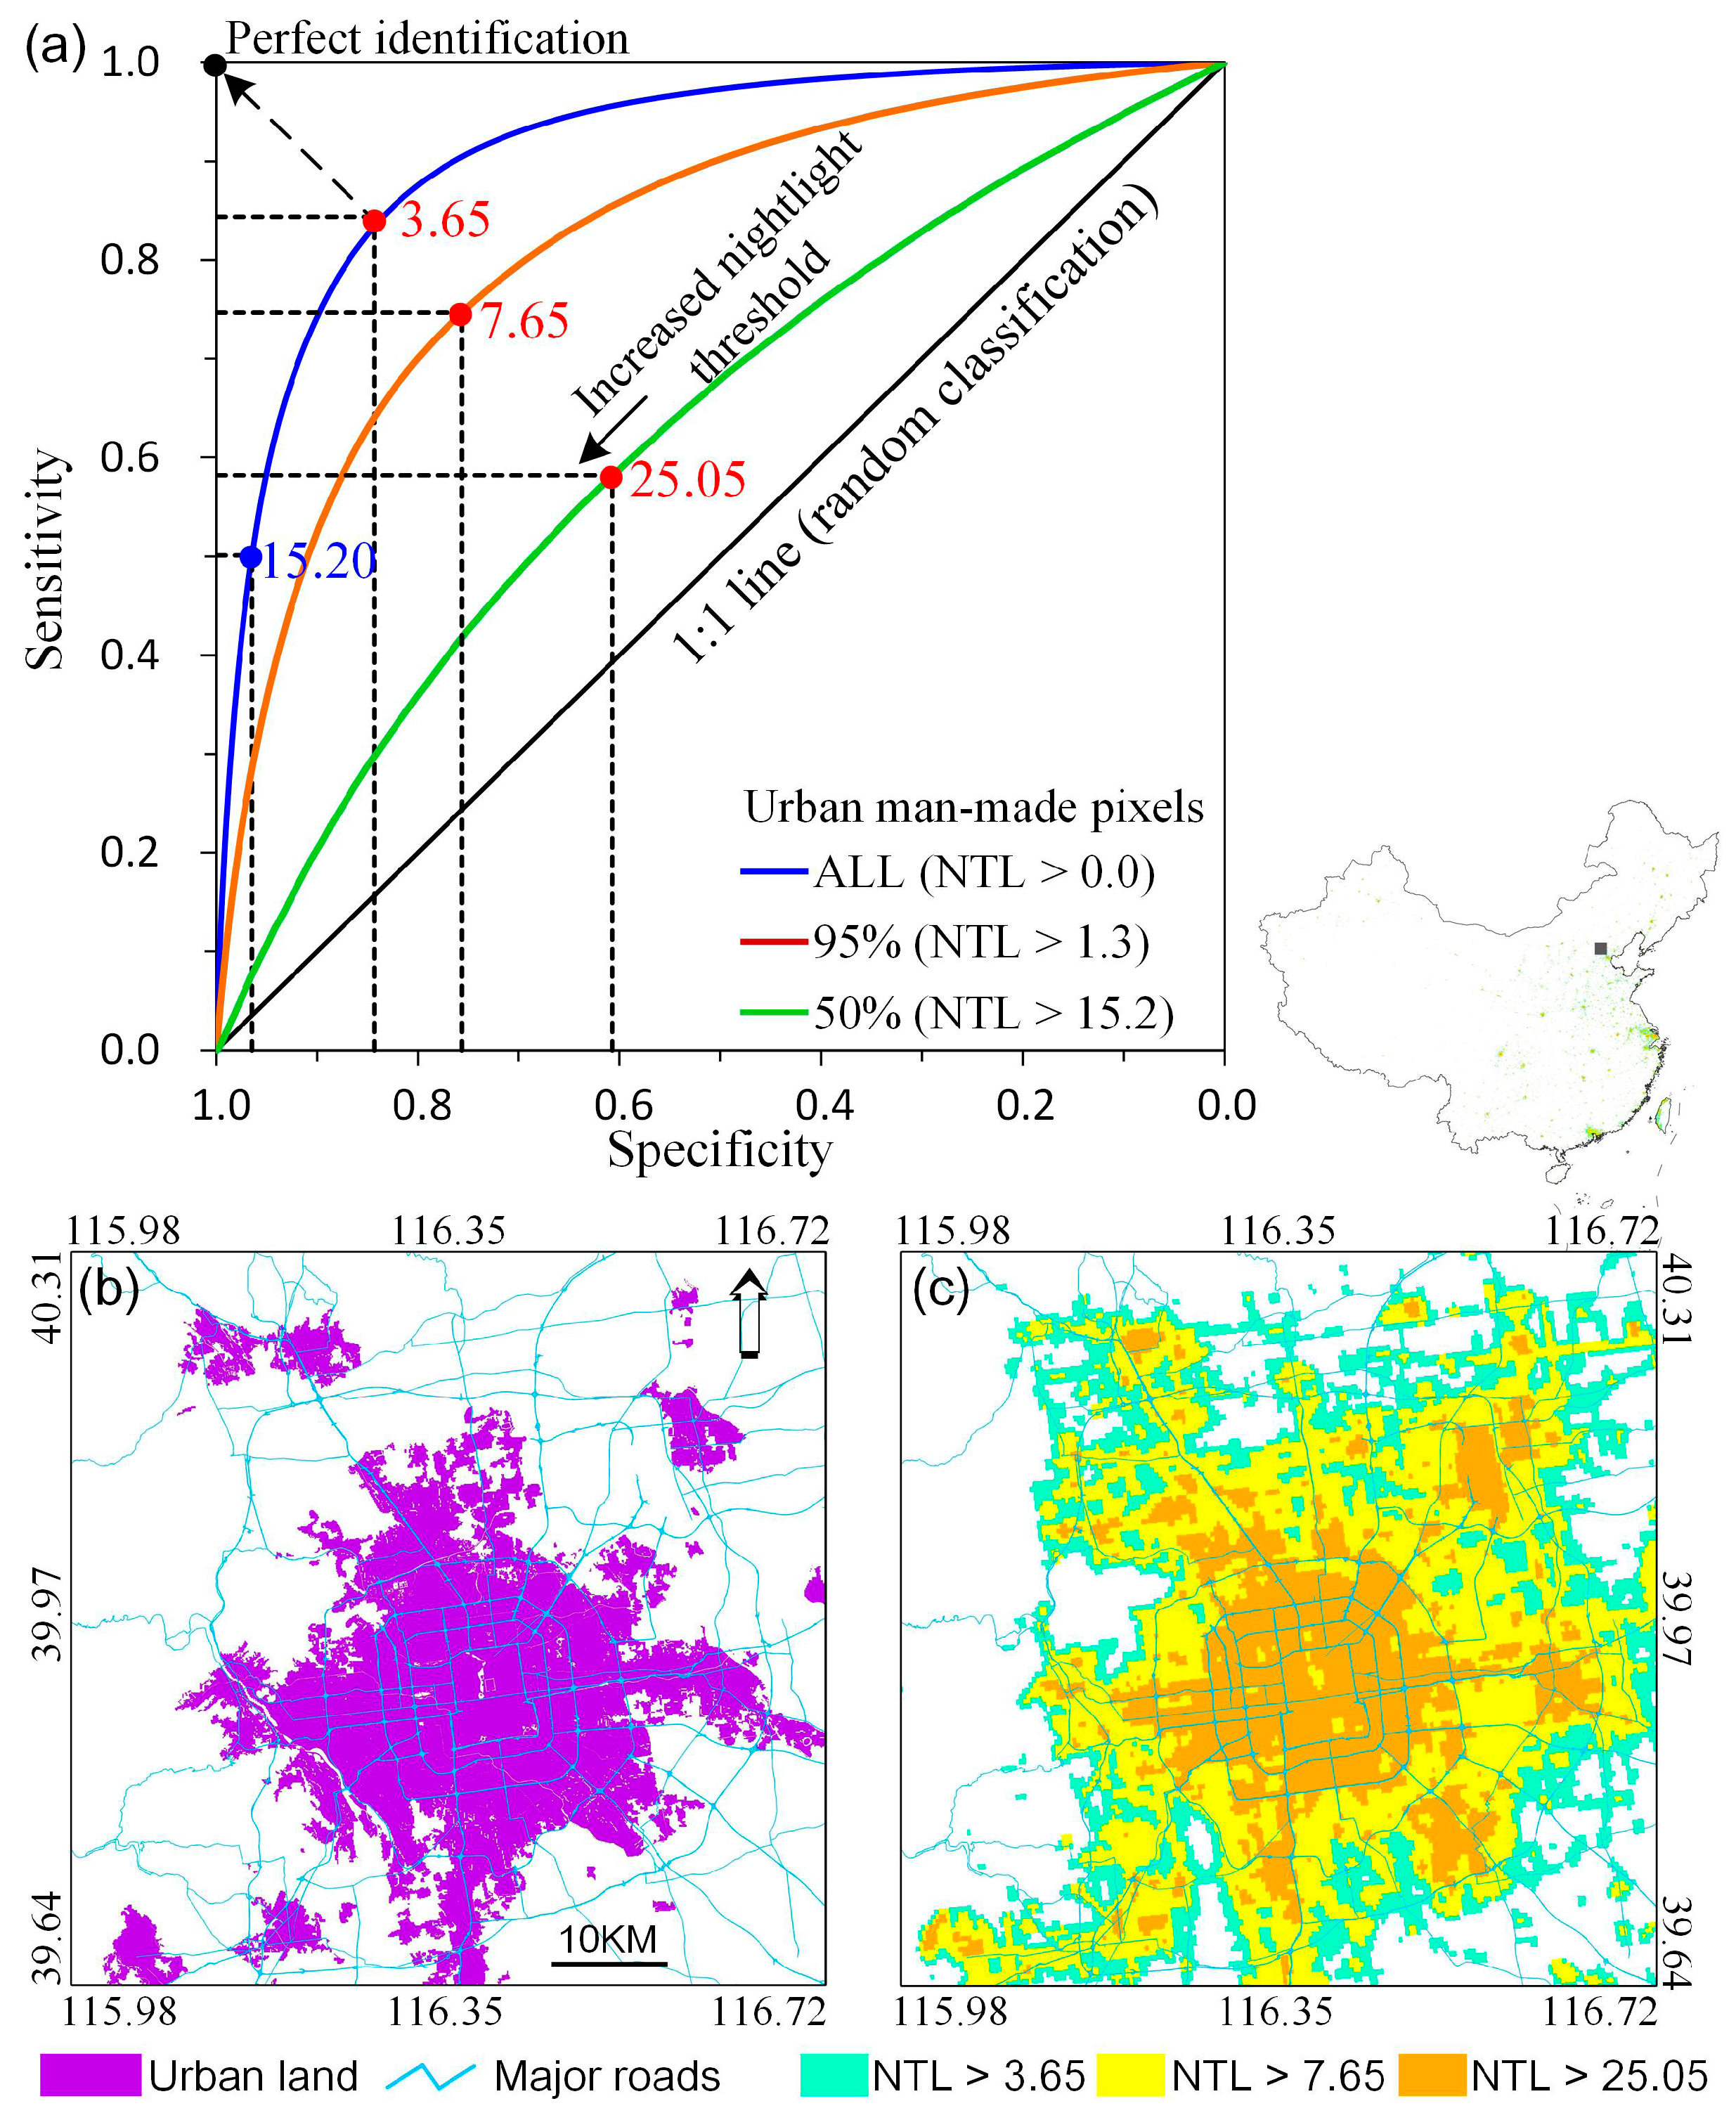
Given that we could not completely differentiate lit non-man-made and rural settlement surfaces from lighted urban pixels, the trade-off between the detection probability of the target urban pixels and the exclusion probability of other types of pixels could help us obtain an optimal NTL threshold for highly lighted artificial surfaces. Here, we used a receiver operating characteristic (ROC) curve to perform a pixel-level investigation of various discrimination thresholds of the nighttime light radiance (as illustrated in Figure 7a). In the ROC curve, two quantitative indices, known as the sensitivity and specificity, are employed to evaluate the identification ability of a binary partition method with NTL-specific nighttime light images. In this study, the sensitivity was defined as the ratio of the number of urban man-made pixels (here, built-up pixels were excluded) recognized in the VIIRS DNB images to their total number in the LULC map for a given NTL threshold. Correspondingly, the specificity was defined as the proportion of correctly excluded non-man-made and rural lit pixels in the partitioned VIIRS DNB images accounting for the total amount of lit pixels having the same type of LULC. Furthermore, the ROC curve can yield an optimal NTL threshold by weighting both the sensitivity and the specificity equally, as measured by the closest distance between the point on the ROC curve and the top-left point (i.e., the perfect classification), where the sensitivity and specificity are both equal to 1 (see Figure 7a).
As shown in Figure 7a (the blue curve), for all lighted urban pixels (NTL > 0), the ROC curve-based estimate suggested a nationwide optimal NTL threshold of 3.64 (red dot on the blue curve in Figure 7a), while 84.4% (sensitivity) of the urban pixels were included and 84.3% (specificity) of the non-man-made and rural lighted pixels were excluded from the partitioned VIIRS DNB images. Although most of the non-urban pixels (96.4%) could be excluded as we increased the NTL threshold to 15.2 (the median of all urban pixels, see point C in Figure 6), half of the urban pixels were also omitted (blue dot in Figure 7a). For the identification of 95% of the lighted urban pixels with NTL > 1.3 (5% percentile), the optimal NTL threshold was estimated to be 7.65, with sensitivity = 0.747 and specificity = 0.756 (see the brown curve in Figure 7a). Moreover, an estimated optimal NTL threshold of 25.05 (sensitivity = 0.582 and specificity = 0.607) could also be suggested for identifying half of the lighted urban pixels with an NTL > 15.2 (median value, see the green curve in Figure 7a). Figure 7b,c demonstrate the spatial distributions of urbanized areas and the partitioned results for the extraction of urban pixels based on three estimated optimal nighttime light thresholds over the city of Beijing, respectively. All of these results jointly state that non-urban pixels cannot be removed completely merely through increasing the NTL threshold. Hence, in the application of current nighttime light data, a trade-off between the sensitivity and specificity of the partitioned results should be considered to obtain an optimal identification of human settlements before the analysis.
4. Conclusions
Owing to the spatially explicit observations of various demographic and socioeconomic parameters, satellite-derived anthropogenic nocturnal lighting signals have been increasingly used for investigations into the patterns and dynamics of human activity at the local, regional, and national scales. However, the characteristics of remotely sensed nighttime light data, including the presence of an over-glow effect and the lack of textural features, create a challenge for an investigation of human activity over space at a fine scale, although we can obtain a detailed look at the anthropogenic nighttime brightness over human settlements from VIIRS DNB images. Hence, an understanding of how nighttime light signals respond to artificial lighting sources is crucially important for the further application of VIIRS DNB data.
In this study, we investigated the pixel-level connection between land-use/land-cover types and the corresponding nighttime light radiances across China using a Landsat-derived LULC map and VIIRS DNB-derived NTL data. Our results show that most urban (>97%) and built-up (>66%) pixels are lighted and that many non-man-made surfaces (>81% of the total lighted area) are also lit in current nighttime light images mainly because of the over-glow effect. Urbanized areas are likely to be distinguishable from non-man-made land surfaces owing to their high average nighttime light radiance. Rural residential sites, however, are most likely indistinguishable from the ambient lighting because of slightly minor differences in the VIIRS DNB-derived nighttime brightness. Although there was a positive linear relationship between the POI density and the corresponding NTL, only a small percentage (~16%) of the nationwide variations in the pixel-level POI density could be explained by spatial changes in the VIIRS DNB nighttime light radiances. The comparisons of the cumulative distributions of pixel-level nightlight radiances over urban land and other non-man-made and rural lands further suggest a potential impact of non-man-made surfaces on the identification of urban areas regardless of the threshold level of nighttime light radiance considered. ROC curve-based analysis yielded a candidate NTL threshold of 3.64 for the annual composite of VIIRS DNB data in 2015 for a nationwide optimal identification of lighted urban surfaces in China by weighting both the sensitivity and the specificity of the partitioned results.
VIIRS DNB-derived nighttime light data likely provide us with an opportunity to investigate demographic and socioeconomic dynamics at a fine scale. A deeper insight into the relationship between remotely sensed anthropogenic lighting signals at night and human activity is crucially important for future applications of high-resolution nighttime light images. Our study revealed the connection between nighttime lighted areas and land-use/land-cover types and emphasized the identification of urbanized areas with man-made surfaces; consequently, further investigations into how current satellite-based nocturnal radiance signals respond to various socioeconomic variables, such as population distribution, traffic dynamics, energy consumption, and building density, are quite desirable to obtain an optimal estimate of human activity using nighttime light data at a fine scale. Additionally, the discovery of an association between VIIRS DNB imagery and synchronous vegetation indices, such as the human settlement index (HSI) [34] and the vegetation adjusted NTL urban index (VANUI) [35] for DMSP nighttime light images, could benefit our analyses of spatial patterns in human settlements.
Author Contributions
T.M. conceived and designed the study and methods; T.M. analyzed the data; T.M. wrote the paper.
Funding
This study was funded by the National Natural Science Foundation of China (Nos. 41771418, 41421001), the Key Research Program of Frontier Science, Chinese Academy of Sciences (No. QYZDY-SSW-DQC007), the National Science and Technology Key Project (No. 2016YFB0502301) and the National Key Basic Research Program of China (No. 2015CB954101).
Conflicts of Interest
The author declares no conflict of interest.
References
- Chen, X.; Nordhaus, W.D. Using luminosity data as a proxy for economic statistics. Proc. Natl. Acad. Sci. USA 2011, 108, 8589–8594. [Google Scholar] [CrossRef] [PubMed]
- Elvidge, C.; Baugh, K.; Anderson, S.; Sutton, P.; Ghosh, T. The night light development index (NLDI): A spatially explicit measure of human development from satellite. Soc. Geogr. 2012, 7, 23–35. [Google Scholar] [CrossRef]
- Huang, Q.; Yang, X.; Gao, B.; Yang, Y.; Zhao, Y. Application of DMSP/OLS nighttime light images: A meta-analysis and a systematic literature review. Remote Sens. 2014, 6, 6844–6866. [Google Scholar] [CrossRef]
- Elvidge, C.; Baugh, K.; Kihn, E.; Kroehl, H.; Davis, E.; Davis, C. Relation between satellite observed visible-near infrared emissions, population, economic activity and electric power consumption. Int. J. Remote Sens. 1997, 18, 1373–1379. [Google Scholar] [CrossRef]
- Ghosh, T.; Powell, R.L.; Elvidge, C.D.; Baugh, K.E.; Sutton, P.C.; Anderson, S. Shedding light on the global distribution of economic activity. Open Geogr. J. 2010, 3, 148–161. [Google Scholar]
- Zhang, Q.; Seto, K.C. Mapping urbanization dynamics at regional and global scales using multi-temporal DMSP/OLS nighttime light data. Remote Sens. Environ. 2011, 115, 2320–2329. [Google Scholar] [CrossRef]
- Elvidge, C.D.; Baugh, K.E.; Kihn, E.A.; Kroehl, H.W.; Davis, E.R. Mapping city lights with nighttime data from the DMSP Operational Linescan System. Photogramm. Eng. Remote Sens. 1997, 63, 727–734. [Google Scholar]
- Sutton, P.C. A scale-adjusted measure of “urban sprawl” using nighttime satellite imagery. Remote Sens. Environ. 2003, 86, 353–369. [Google Scholar] [CrossRef]
- Small, C.; Pozzi, F.; Elvidge, C.D. Spatial analysis of global urban extent from DMSP/OLS night lights. Remote Sens. Environ. 2005, 96, 277–291. [Google Scholar] [CrossRef]
- Amaral, S.; Câmara, G.; Monteiro, A.M.V.; Quintanilha, J.A.; Elvidge, C.D. Estimating population and energy consumption in Brazilian Amazonia using DMSP night-time satellite data. Comput. Environ. Urban Syst. 2005, 29, 179–195. [Google Scholar] [CrossRef]
- Doll, C.; Muller, J.; Morley, J. Mapping regional economic activity from night-time light satellite imagery. Ecol. Econ. 2006, 57, 75–92. [Google Scholar] [CrossRef]
- Sutton, P.; Roberts, D.; Elvidge, C.; Baugh, K. Census from heaven: An estimate of the global human population using night-time satellite imagery. Int. J. Remote Sens. 2001, 22, 3061–3076. [Google Scholar] [CrossRef]
- Small, C.; Elvidge, C.D. Mapping decadal change in anthropogenic night light. Procedia Environ. Sci. 2011, 7, 353–358. [Google Scholar] [CrossRef]
- Li, X.; Ge, L.; Chen, X. Detecting Zimbabwe’s decadal economic decline using nighttime light imagery. Remote Sens. 2013, 5, 4551–4570. [Google Scholar] [CrossRef]
- Xu, T.; Ma, T.; Zhou, C.; Zhou, Y. Characterizing spatio-temporal dynamics of urbanization in China using time series of DMSP/OLS night light data. Remote Sens. 2014, 6, 7708–7731. [Google Scholar] [CrossRef]
- Ma, T.; Zhou, Y.; Zhou, C.; Haynie, S.; Pei, T.; Xu, T. Night-time light derived estimation of spatio-temporal characteristics of urbanization dynamics using DMSP/OLS satellite data. Remote Sens. Environ. 2015, 158, 453–464. [Google Scholar] [CrossRef]
- Bennett, M.M.; Smith, L.C. Advances in using multitemporal night-time lights satellite imagery to detect, estimate, and monitor socioeconomic dynamics. Remote Sens. Environ. 2017, 192, 176–197. [Google Scholar] [CrossRef]
- Miller, S.D.; Hawkins, J.D.; Kent, J.; Turk, F.J.; Lee, T.F.; Kuciauskas, A.P.; Richardson, K.; Wade, R.; Hoffman, C. NexSat: Previewing NPOESS/VIIRS imagery capabilities. Bull. Am. Meteorol. Soc. 2006, 87, 433–446. [Google Scholar] [CrossRef]
- Hillger, D.; Kopp, T.; Lee, T.; Lindsey, D.; Seaman, C.; Miller, S.; Solbrig, J.; Kidder, S.; Bachmeier, S.; Jasmin, T. First-light imagery from Suomi NPP VIIRS. Bull. Am. Meteorol. Soc. 2013, 94, 1019–1029. [Google Scholar] [CrossRef]
- Small, C.; Elvidge, C.D.; Baugh, K. Mapping urban structure and spatial connectivity with VIIRS and OLS night light imagery. In Proceedings of the 2013 Joint Urban Remote Sensing Event (JURSE), Sao Paulo, Brazil, 21–23 April 2013; pp. 230–233. [Google Scholar]
- Elvidge, C.D.; Baugh, K.E.; Zhizhin, M.; Hsu, F.-C. Why VIIRS data are superior to DMSP for mapping nighttime lights. Proc. Asia-Pac. Adv. Netw. 2013, 35, 62–69. [Google Scholar] [CrossRef]
- Falchi, F.; Cinzano, P.; Duriscoe, D.; Kyba, C.C.; Elvidge, C.D.; Baugh, K.; Portnov, B.A.; Rybnikova, N.A.; Furgoni, R. The new world atlas of artificial night sky brightness. Sci. Adv. 2016, 2, e1600377. [Google Scholar] [CrossRef] [PubMed]
- Li, X.; Xu, H.; Chen, X.; Li, C. Potential of NPP-VIIRS nighttime light imagery for modeling the regional economy of China. Remote Sens. 2013, 5, 3057–3081. [Google Scholar] [CrossRef]
- Ma, T.; Zhou, C.; Tao, P.; Haynie, S.; Fan, J. Responses of Suomi-NPP VIIRS-derived nighttime lights to socioeconomic activity in China’s cities. Remote Sens. Lett. 2014, 5, 165–174. [Google Scholar] [CrossRef]
- Shi, K.; Huang, C.; Yu, B.; Yin, B.; Huang, Y.; Wu, J. Evaluation of NPP-VIIRS night-time light composite data for extracting built-up urban areas. Remote Sens. Lett. 2014, 5, 358–366. [Google Scholar] [CrossRef]
- Shi, K.; Yu, B.; Huang, Y.; Hu, Y.; Yin, B.; Chen, Z.; Chen, L.; Wu, J. Evaluating the ability of NPP-VIIRS nighttime light data to estimate the gross domestic product and the electric power consumption of China at multiple scales: A comparison with DMSP-OLS data. Remote Sens. 2014, 6, 1705–1724. [Google Scholar] [CrossRef]
- Jing, X.; Shao, X.; Cao, C.; Fu, X.; Yan, L. Comparison between the Suomi-NPP Day-Night Band and DMSP-OLS for correlating socio-economic variables at the provincial level in China. Remote Sens. 2015, 8, 17. [Google Scholar] [CrossRef]
- Sharma, R.C.; Tateishi, R.; Hara, K.; Gharechelou, S.; Iizuka, K. Global mapping of urban built-up areas of year 2014 by combining MODIS multispectral data with VIIRS nighttime light data. Int. J. Digit. Earth 2016, 9, 1004–1020. [Google Scholar] [CrossRef]
- Levin, N. The impact of seasonal changes on observed nighttime brightness from 2014 to 2015 monthly VIIRS DNB composites. Remote Sens. Environ. 2017, 193, 150–164. [Google Scholar] [CrossRef]
- Yu, B.; Shi, K.; Hu, Y.; Huang, C.; Chen, Z.; Wu, J. Poverty evaluation using NPP-VIIRS nighttime light composite data at the county level in China. IEEE J. Sel. Top. Appl. Earth Obs. Remote Sens. 2015, 8, 1217–1229. [Google Scholar] [CrossRef]
- Ma, T.; Zhou, Y.; Wang, Y.; Zhou, C.; Haynie, S.; Xu, T. Diverse relationships between Suomi-NPP VIIRS night-time light and multi-scale socioeconomic activity. Remote Sens. Lett. 2014, 5, 652–661. [Google Scholar] [CrossRef]
- Dou, Y.; Liu, Z.; He, C.; Yue, H. Urban land extraction using VIIRS nighttime light data: An Evaluation of Three Popular Methods. Remote Sens. 2017, 9, 175. [Google Scholar] [CrossRef]
- Liu, J.; Liu, M.; Tian, H.; Zhuang, D.; Zhang, Z.; Zhang, W.; Tang, X.; Deng, X. Spatial and temporal patterns of China’s cropland during 1990–2000: An analysis based on Landsat TM data. Remote Sens. Environ. 2005, 98, 442–456. [Google Scholar] [CrossRef]
- Lu, D.; Tian, H.; Zhou, G.; Ge, H. Regional mapping of human settlements in southeastern China with multisensor remotely sensed data. Remote Sens. Environ. 2008, 112, 3668–3679. [Google Scholar] [CrossRef]
- Zhang, Q.; Schaaf, C.; Seto, K.C. The vegetation adjusted NTL urban index: A new approach to reduce saturation and increase variation in nighttime luminosity. Remote Sens. Environ. 2013, 129, 32–41. [Google Scholar] [CrossRef]
Figure 1.
Illustrations of the spatial distributions of three different datasets used in this study as exemplified in the Pearl River Delta region in China (see the inset map). (a) Visible Infrared Imaging Radiometer Suite day/night band (VIIRS DNB)-derived nighttime radiance; (b) Landsat-derived artificial land; (c) Pixel-level density of points of interest (POIs).

Figure 2.
Proportions of lighted pixels at night for different types of land use/land cover across China in 2015.
Figure 2.
Proportions of lighted pixels at night for different types of land use/land cover across China in 2015.

Figure 3.
The percentage of lighted and non-lighted pixels for three types of artificial land and POIs at the pixel level across China in 2015.
Figure 3.
The percentage of lighted and non-lighted pixels for three types of artificial land and POIs at the pixel level across China in 2015.

Figure 4.
Statistical summary of the pixel-level VIIRS nighttime radiances for eight types of land use/land cover across China in 2015. Here, the lower quartile (25th percentile), median, and upper quartile (75th percentile) are presented.
Figure 4.
Statistical summary of the pixel-level VIIRS nighttime radiances for eight types of land use/land cover across China in 2015. Here, the lower quartile (25th percentile), median, and upper quartile (75th percentile) are presented.

Figure 5.
Bivariate plot of the pixel-level POI density and VIIRS DNB nighttime radiance across China in 2015. The solid line represents the linear fitting result. Different colors indicate various numbers of pixel samples.
Figure 5.
Bivariate plot of the pixel-level POI density and VIIRS DNB nighttime radiance across China in 2015. The solid line represents the linear fitting result. Different colors indicate various numbers of pixel samples.

Figure 6.
Cumulative distributions of pixel-level nighttime light signals for eight types of land use/land cover across China in 2015.
Figure 6.
Cumulative distributions of pixel-level nighttime light signals for eight types of land use/land cover across China in 2015.

Figure 7.
(a) Receiver operating characteristic (ROC) curve-based analysis for identifying urban surfaces according to VIIRS DNB nighttime light (NTL) radiance data; (b) Spatial distributions of urban man-made surfaces in Beijing; (c) Partitioned results of VIIRS DNB nighttime light data according to three optimal NTL thresholds for identifying all (cyan), 95% (yellow), and 50% (light brown) of lighted urban pixels.

© 2018 by the author. Licensee MDPI, Basel, Switzerland. This article is an open access article distributed under the terms and conditions of the Creative Commons Attribution (CC BY) license (http://creativecommons.org/licenses/by/4.0/).
Share and Cite
MDPI and ACS Style
Ma, T. An Estimate of the Pixel-Level Connection between Visible Infrared Imaging Radiometer Suite Day/Night Band (VIIRS DNB) Nighttime Lights and Land Features across China. Remote Sens. 2018, 10, 723. https://doi.org/10.3390/rs10050723
AMA Style
Ma T. An Estimate of the Pixel-Level Connection between Visible Infrared Imaging Radiometer Suite Day/Night Band (VIIRS DNB) Nighttime Lights and Land Features across China. Remote Sensing. 2018; 10(5):723. https://doi.org/10.3390/rs10050723
Chicago/Turabian StyleMa, Ting. 2018. "An Estimate of the Pixel-Level Connection between Visible Infrared Imaging Radiometer Suite Day/Night Band (VIIRS DNB) Nighttime Lights and Land Features across China" Remote Sensing 10, no. 5: 723. https://doi.org/10.3390/rs10050723
Note that from the first issue of 2016, this journal uses article numbers instead of page numbers. See further details here.