Applicability evaluation of multiple sets of soil moisture data on the tibetan plateau
 Xuefeng Dong
 Xin Lai
 Yingsi Wang1
  Wei Dong
 Li Dong
- 1Plateau Atmosphere and Environment Key Laboratory of Sichuan Province, Joint Laboratory of Climate and Environment Change, School of Atmospheric Sciences, Chengdu Plain Urban Meteorology and Environment Observation and Research Station of Sichuan Province, Chengdu University of Information Technology Chengdu, Chengdu, China
- 2Sanshui District Meteorological Administration, Foshan, China
- 3Key Laboratory of Meteorological Disaster, Ministry of Education/Joint International Research Laboratory of Climate and Environment Change/Collaborative Innovation Center on Forecast and Evaluation of Meteorological Disasters, Nanjing University of Information Science and Technology, Nanjing, China
- 4Shangqiu Meteorological Administration, Shangqiu, China
- 5Tianshui Meteorological Administration, Tianshui, China
- 6Chengdu Institute of Plateau Meteorology, Chengdu, China
Based on the in situ data of the soil moisture-observation networks established at Maqu, Naqu, Ali, and Shiquanhe (Sq) on the Tibetan Plateau (TP), and using five evaluation indices [Pearson correlation coefficient (R), root mean square error (RMSE), mean deviation (bias), standard deviation ratio (SDV), and unbiased RMSE (ubRMSE)], the applicability of soil moisture datasets [COMBINED, ACTIVE, PASSIVE, ERA5, ERA5-Land (LAND), ERA-Interim (INTERIM), CLSM, and NOAH] was comprehensively evaluated. The results showed that, at the observation-network scale, ACTIVE exhibited the best applicability in Maqu (R = 0.704, ubRMSE = 0.040 m3/m3), COMBINED performed best in Naqu (R = 0.803, bias = 0.016 m3/m3), LAND displayed the best consistency with observations in Ali (R = 0.734, bias = −0.035 m3/m3), and ERA5 not only showed the best performance in Sq (R = 0.793, bias = −0.037 m3/m3) but also exhibited good results in the other three observation networks (R > 0.6). In a smaller-scale evaluation in Maqu, ACTIVE performed best, followed by ERA5. The COMBINED and PASSIVE products had serious gaps in Ali and Sq, and had the worst applicability in the western TP. In conclusion, considering the correlation results and temporal and spatial continuities, ERA5 is the most suitable soil moisture dataset for the TP.
1 Introduction
Soil moisture is not only an important variable in Earth’s climate system (Wu and Dickinson, 2004), but it is also a key parameter regulating the exchange of energy and water between the atmosphere and land surface (Liu et al., 2019). It is widely used in global climate system simulations, numerical weather forecasts, climate predictions, land surface runoff forecasts, hydrological modeling, and drought/flood monitoring (Massari et al., 2014; Hunt and Turner, 2017). However, these practical applications require soil moisture data with a high spatial and temporal resolution as well as great accuracy (Zheng et al., 2018a). There are few global soil moisture-observation stations, since it is unpractical to build a high-density global soil moisture-observation network over a short time. In addition, due to the strong spatial heterogeneity of land surfaces, soil moisture observational data can only represent information at a very small spatial scale, and cannot accurately reflect large-scale soil moisture information (Crow et al., 2012). To bridge the gap, researchers have exerted great efforts on the development of various alternative soil moisture data methods, including re-analysis data, land surface model data, and satellite remote sensing products.
The global atmospheric re-analysis dataset published by the European Centre for Medium-Range Weather Forecasts (ECMWF Reanalysis, or ERA) is commonly known as ERA-Interim (hereafter, INTERIM). The dataset has a high spatial and temporal resolution with atmospheric dynamics and physical characteristics (Zhang et al., 2018), and contains four layers of soil moisture. Previous evaluations have claimed that the INTERIM soil moisture performed better in deep soil than in surface soil, and that it generally overestimated surface soil moisture (Albergel et al., 2012; Albergel et al., 2013; Jing et al., 2018). In 2018, the ECMWF released ERA5, the global fifth-generation atmospheric re-analysis dataset, followed by the ERA5-Land (hereafter, LAND) land re-analysis dataset in 2020, both of which contained four layers of soil moisture with a higher spatiotemporal resolution. The Global Land Data Assimilation System (GLDAS) data published by the National Aeronautics and Space Administration (NASA) are among the most representative of the land surface model soil moisture data (Zheng et al., 2015; Zheng et al., 2018b). With driving land surface models, the GLDAS uses validated precipitation datasets as inputs, which reduces many uncertainty errors caused by observed precipitation. However, the accuracy of the GLDAS soil moisture data is affected by the defects in the land surface models (Chen et al., 2013). More recently, NASA has updated the GLDAS dataset (GLDAS v2), which now contains three sets of soil moisture data, although the quality of these needs to be verified.
Satellite remote sensing is considered to be the most promising method for spatiotemporal monitoring of soil moisture (Ulaby et al., 1982; Li et al., 2018; Yang et al., 2020). Over the past few decades, researchers have developed many soil moisture products based on satellites or sensors, such as those from the Advanced SCATterometer (ASCAT) and the Soil Moisture and Ocean Salinity (SMOS) satellite (Gloersen, 1981; Wagner et al., 1999; Paloscia et al., 2001; Bindlish et al., 2003; Kawanishi et al., 2003; Gaiser et al., 2004; Bartalis et al., 2007; Naeimi et al., 2009; Wagner et al., 2012; Al-Yaari et al., 2014; Zheng et al., 2018c; Liu et al., 2019; Zhu et al., 2019). In general, passive microwave soil moisture products have a greater temporal resolution and are less influenced by surface roughness disturbances, while active microwave products are more sensitive to soil moisture (Jiang et al., 2017; Li et al., 2018; Ruqing Zhang et al., 2021). In order to combine the advantages of both active and passive microwave products, the European Space Agency’s soil moisture climate change initiative (ESA CCI soil moisture) uses a fusion algorithm to integrate soil moisture retrieved from various satellites into a soil moisture climate dataset (Alexander et al., 2019); ESA CCI soil moisture product v4.7, released in 2020, was used in this article.
It is very important to assess the accuracy and reliability of these datasets before use (Zeng et al., 2015). Previous assessments have been mainly conducted in Europe (Albergel et al., 2013; Al-Yaari et al., 2014), Australia (Draper et al., 2009), and the United States (Pan et al., 2012; Leroux et al., 2014). However, fewer verification activities have been conducted in the Tibetan Plateau (TP) region (Su et al., 2011). The TP, also known as the “third pole,” is one of the most important geographical components of the Earth’s climate system (Qiu, 2008). Soil moisture regulates the variation of water and heat between land and atmosphere over the TP, which has an important impact on the climate in East Asia and even the global monsoon (Charney and Eliassen, 1949; Xu et al., 2008; Wu et al., 2012). Due to the restrictions of its geographical conditions, there is a shortage of observation data of the soil moisture in the TP (Crow et al., 2012). As a result, very few evaluation activities have been conducted in this region. There is an urgent need to evaluate the new data, with the expectation that the evaluation results can help users better understand the status of the products and hence improve their practical application, as well as provide a reference for product developers to develop or improve data from the TP or similar areas.
In this article, using TP soil moisture observation network data (Su et al., 2011), the applicability of the INTERIM, ERA5, LAND, GLDAS v2, and ESA CCI v4.7 soil moisture products is evaluated. The TP soil moisture observation networks are located at Maqu, Naqu, Ali, and Shiquanhe (Sq), which cover different climate and land surface conditions across the TP. The observation data have been widely used in the past decade to validate satellite- and model-based soil moisture products (Zheng et al., 2015), and the in situ data used are from 2013 to 2016, nearly twice the length of the data used in previous evaluations (Chen et al., 2013; Li et al., 2018; Cheng et al., 2019), which greatly enhances the credibility of the evaluation results. The structure of this article is as follows. Section 2 introduces the data and methods. In Section 3, the evaluation results at the observation-network scale are presented, and then the applicability of alternative data at a smaller scale within one network (Maqu) is analyzed. In Section 4, the evaluation results are discussed, with a summary in Section 5.
2 Materials and methods
2.1 In situ observations
The four soil moisture observation networks located at Maqu, Naqu, Ali, and Sq (Figure 1) represent the four typical underlying surfaces of the TP. The Maqu observation network is located in the east of the TP, which belongs to the alpine and humid climate zone, and the underlying surface is grasslands. The Maqu network has a total of 20 stations and its range is approximately 40 km (south to north) by 80 km (west to east) (Figure 2A). The Naqu observation network is located in the middle of the TP, which belongs to the semi-arid and alpine climate region. There are five sites in the Naqu network and its underlying surface is mainly alpine grasslands (Figure 2B). The Ali and Sq observation networks are located in the semi-arid climate region of the western TP, and the underlying surface is mainly composed of sparse vegetation, desert, or bare land. There are four stations in the Ali network (Figure 2C) and 16 stations in the Sq area (Figure 2D). The aforementioned observation networks use capacitive detectors to measure the dielectric permittivity of the soil, with a probe observation frequency of 15 min. Through the Topp equation (Topp et al., 1980), the soil dielectric permittivity can be converted to the volumetric soil moisture at depths of 5–80 cm (Rogier et al., 2008; Su et al., 2011; Ikonen et al., 2016; Jiang et al., 2017; González-Zamora et al., 2018; Pei Zhang et al., 2021). Due to the different installation and maintenance dates at the observation stations, the time range of the in situ data at each station is also different. Furthermore, owing to the different data quality from different observation stations, we first carried out some quality control procedures on the data from these different observation stations. Specifically, for each station, we deleted the times of data anomalies (soil moisture >1 or <0 m3/m3) and instrument anomalies (instrument voltage alarms). For each observation network, those stations with serious cases of missing data were discarded (the sample size of non-missing data was less than 50% of the whole comparison period). Ultimately, for the Maqu observation network, 12 observation stations were selected, with the time of the in situ data from July 2013 to June 2016; the Naqu observation network had four selected stations, with data from July 2014 to August 2016; three stations were selected from the Ali observation network, with data from August 2014 to August 2016; and the Sq observation network had seven stations selected, with the data from December 2013 to July 2016 (Table 1).
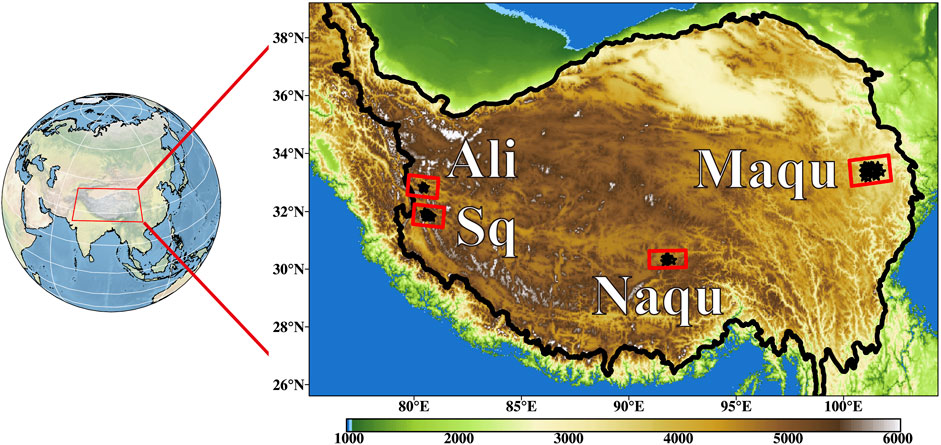
FIGURE 1. Location and topographic height of the plateau and soil moisture-observation networks. Red rectangles represent observation networks and black marks represent observation points. Topographic height unit: meters.
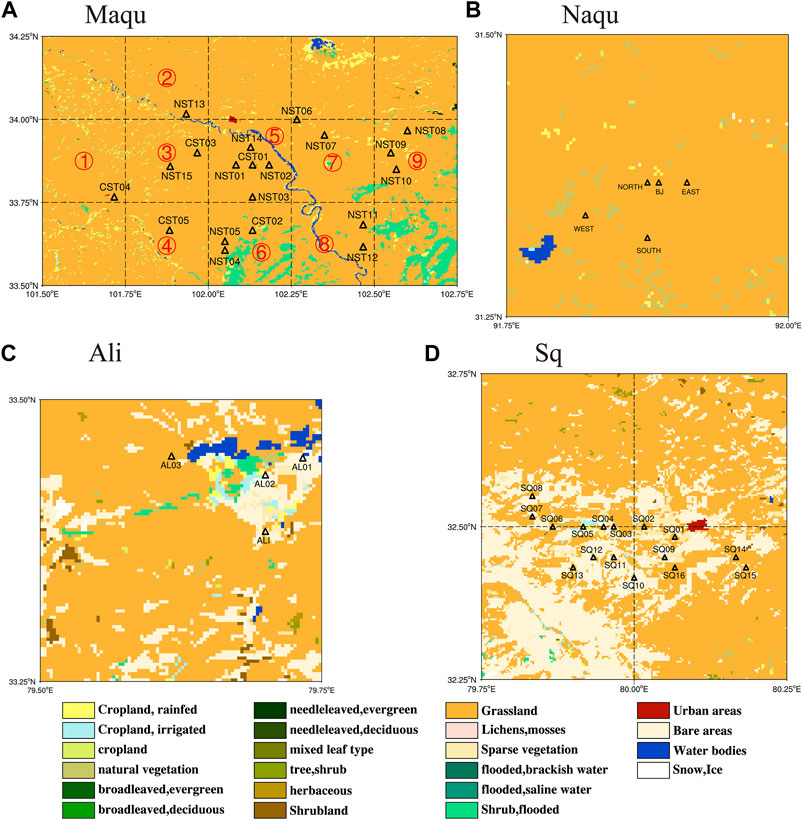
FIGURE 2. Site distribution and underlying surface characteristics of the TP soil moisture-observation networks: (A) Maqu, (B) Naqu, (C) Sq, and (D) Ali. Black hollow triangles represent soil observation points. Dashed lines represent grid lines that replace data resolution. Numbered red circles in Panel (A) represent nine small regions in Maqu.
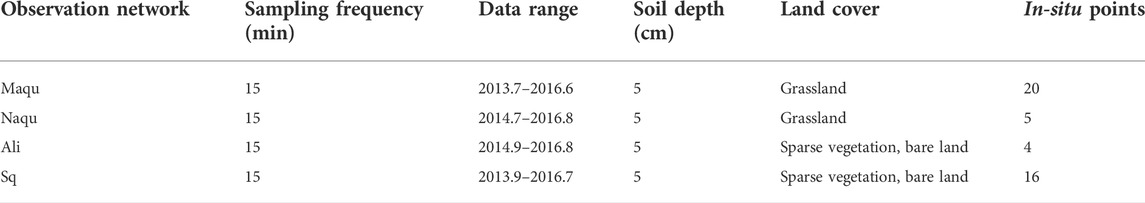
TABLE 1. Soil moisture data of the TP observation networks.
2.2 Re-analysis data
2.2.1 INTERIM soil moisture
INTERIM is a set of global atmospheric re-analysis datasets released by ECMWF, covering the period from 1 January 1979 to August 2019. It is based on a variational data assimilation system that includes satellite- and ground-based measurements in a consistent framework (Makama and Lim, 2020). The INTERIM data provide four layers of soil moisture (0–7, 7–28, 28–100, and 100–289 cm) four times per day. The spatial resolution of the INTERIM is 0.7° × 0.7°. ECMWF stopped updating the INTERIM data in October 2019, but still provides a download service for existing data. We used the INTERIM soil moisture of the upper layer (0–7 cm) for comparison and evaluation in this study. It can be downloaded from https://apps.ecmwf.int/datasets/data/.
2.2.2 ERA5 soil moisture
As the successor to INTERIM, and using advanced four-dimensional data assimilation methods, ERA5 merges more ground and satellite observation data into re-analysis data. The soil moisture data of ERA5 follow the INTERIM soil depths, with the vertical depth divided into four layers. However, the temporal resolution of ERA5 is increased to 1 h, the spatial resolution is adjusted to 0.25° × 0.25°, and the unit of soil moisture is volumetric water content (Gualtieri, 2021; Jiang et al., 2021). It can be downloaded from https://cds.climate.copernicus.eu/.
2.2.3 LAND soil moisture
LAND is a re-analysis dataset providing a consistent view of the evolution of land variables over several decades at an enhanced resolution compared to ERA5. LAND has been produced by replaying the land component of the ERA5 climate re-analysis (Nefabas et al., 2021; Ruqing Zhang et al., 2021). It combines the model data with observations from across the world into a globally complete and consistent dataset using the land surface model, which is based on the laws of physics and mathematical formulas. LAND uses atmospheric variables, such as temperature and humidity, as inputs to control the simulated land fields of ERA5. Without the constraint of atmospheric forcing, the model-based estimates can rapidly deviate from reality. Therefore, while observations are not directly used in the production of the LAND data, they have an indirect influence through the atmospheric forcing used to run the simulation. The LAND resolution is increased to 1 h, and the spatial resolution is increased to 0.1° × 0.1°. Its soil moisture unit, like ERA5, is the volumetric water content. It can be downloaded from https://cds.climate.copernicus.eu/.
2.3 Satellite soil moisture products
The ESA CCI soil moisture product is a merged product, integrating active and passive satellite retrieval of soil moisture (González-Zamora et al., 2018). In essence, the product merges the soil moisture retrieval products of various satellites with limited life and significantly different instrument characteristics (frequency, spatial resolution, time coverage, polarization, revisit time, etc.), into three long-term datasets: an active-microwave-based-only product (hereafter referred to as ACTIVE); a passive-microwave-based-only product (hereafter, PASSIVE); and a combined active–passive product (hereafter, COMBINED) (Alexander et al., 2019). The generation process of the ESA CCI soil moisture product mainly includes, first, the observational times of multiple level 2 active and passive satellite remote sensing data matched to the same time and, second, the cumulative distribution function used to calibrate the level 2 product, with the Advanced Microwave Scanning Radiometer for EOS (AMSR-E) soil moisture used as the scale reference. The PASSIVE and ACTIVE products were obtained by fusing the passive and active microwave products. The COMBINED dataset was obtained by using ACTIVE and PASSIVE data for scaling evaluation and weighted calculation. The ESA CCI released its first-generation soil moisture product (ESA CCI v0.1) in 2012. Since then, the ESA CCI has continuously updated its soil moisture products by improving the data fusion algorithm and satellite sensor calibration, expanding the scope of the spatiotemporal coverage of data. The ESA CCI v4.7 soil moisture product was released in February 2020. Compared with previous versions, ESA CCI v4.7 integrated a new soil moisture sensor and extended the dataset to 31 December 2019. Three sets of ESA CCI soil moisture include the global surface soil moisture data with a spatial resolution of 0.25° × 0.25° and a temporal resolution of 24 h. A more detailed description of the ESA soil moisture data is available in Cheng et al. (2019). The ESA CCI data can be downloaded from https://cds.climate.copernicus.eu/.
2.4 Land surface model soil moisture products
GLDAS ingests satellite- and ground-based observational data products, using advanced land surface modeling and data assimilation techniques, to generate optimal fields of land parameters (Zheng et al., 2017). GLDAS drives multiple, offline (not coupled to the atmosphere) land surface models, integrates a huge quantity of observation-based data, executes globally at high resolutions, and is capable of producing results in near real-time. Observation-based atmospheric and radiation products from atmospheric data assimilation systems are used to force the land surface models. Recently, the GLDAS-driven Noah land surface model and CLSM have developed GLDAS2-Noah and GLDAS2-CLSM data. In the Noah dataset, soil moisture is divided into four vertical layers (0–10, 10–40, 40–100, and 100–200 cm) and CLSM soil moisture is divided into two layers (0–2 and 2–100 cm) (Han et al., 2020; Rzepecka and Birylo, 2020). GLDAS data are archived and distributed in the website of the Goddard Earth Sciences Data and Information Services Center (http://disc.sci.gsfc.nasa.gov/hydrology/data-holdings). In this study, the 3-h soil moisture data of GLDAS-Noah (hereafter NOAH) and GLDAS-CSLM (CLSM) v2.1 with a 0.25° resolution were used.
We also used the land cover classification gridded maps released by the ESA CCI with a spatial resolution of 300 m to draw Figure 2 (Kobayashi et al., 2014). This dataset provides global maps dividing the land surface into 22 classes, which have been defined according to the United Nations Food and Agriculture Organization’s (UN FAO) Land Cover Classification System (LCCS). The digital elevation data from the Shuttle Radar Topography Mission (SRTM) (Chen et al., 2020), which are jointly compiled by NASA and the German and Italian space agencies with a spatial resolution of 10 m, were used to draw Figure 1.
2.5 Methods
Since the ESA CCI provides only surface soil moisture data, the evaluation depth in this article is the surface layer. The evaluation time of each set of alternative data is consistent with the length of the observation data. The unit of the ACTIVE soil moisture product is soil saturation (%); the unit of the NOAH soil moisture is relative soil moisture (kg/m2); and the unit of other alternative data is volumetric water content (m3/m3) (Table 2). The NOAH soil moisture unit can use soil depth to convert to volumetric water content, and the ACTIVE product unit can use soil porosity for the same conversion (Chen et al., 2019). The soil porosity data come from supporting data L3 V1 (LANDMET_ANC_SM) in the LANDMET Ancillary Soil Moisture data from land–atmosphere boundary interactions. The data can be downloaded from NASA’s Goddard Earth Science Data and Information Service Center (GES DISC, https://disc.gsfc.nasa.gov/datasets).
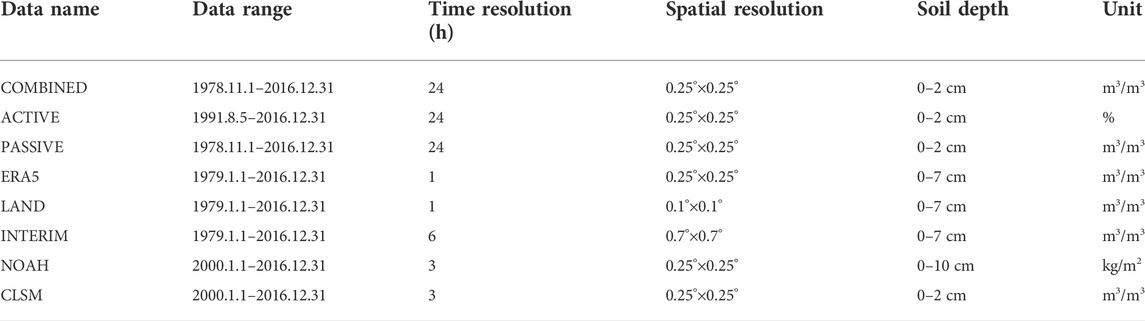
TABLE 2. Details of the multisource satellite and re-analysis data used in this article.
The observed soil moisture represents the content of water in the soil, while the alternative data represent the total water content. Therefore, to achieve an accurate evaluation between the soil moisture observation data and alternative data, the non-freezing period (April to October) was selected as the comparison period in the TP region (Yuan et al., 2019; Yuan et al., 2020; Pei Zhang et al., 2021). As shown in Table 2, the temporal and spatial resolutions of the alternative data and the observation data are inconsistent. In this article, the daily average method is used to convert the temporal resolution of all the data into 24 h. The observed value represents the soil moisture within the limited range of the station, and the grid value of the alternative data represents the average state in the minimum resolution space (0.25° × 0.25°). The natural neighborhood method (Watson, 1992) was used to interpolate the alternative datasets for each station and to calculate the average value of all stations in each network, representing the average soil moisture of the observation network. Neighborhood interpolation uses the weight of the proportional area to calculate the target value, not the distance from the target point, so that the characteristics of the original data can be preserved as far as possible. The proportional area of the Voronoi polygon where the grid point is located is used as the weight. Since the area of the Voronoi polygon is different, the contribution of each grid point to the target point is different. Using the five indices of correlation coefficient (R), mean deviation (bias), root mean square error (RMSE), standard deviation ratio (SDV), and unbiased RMSE (ubRMSE) (Kovačević et al., 2020), the applicability of alternative data in the TP region was quantitatively evaluated. The Student’s t-test was used to test the significance of correlation coefficients. The specific calculation formulas are as follows:
where n denotes the number of data samples, x denotes the sequence of the alternative data, y denotes the sequence of the observation data, and
3 Results
In this section, we evaluate each observation network. Firstly, we analyzed the spatial heterogeneity of soil moisture reflected by the in situ data. For each network, we compared the dynamic characteristics of observation and alternative soil moisture data over the entire period. This can reveal the performance of soil moisture products over daily, monthly, and seasonal timescales. Five evaluation indicators (R, bias, RMSE, SDV, and ubRMSE) were calculated separately in each network, and these were used to quantify the performance of the eight soil moisture products, summarized in Table 3, Table 4, Table 5, and Table 6. Scatterplots of soil moisture showing the observational and alternative data were drawn to display their consistency more clearly, as shown in Figure 5. To further analyze the real performance of each alternative dataset, we carried out a small-scale evaluation of the Maqu data.
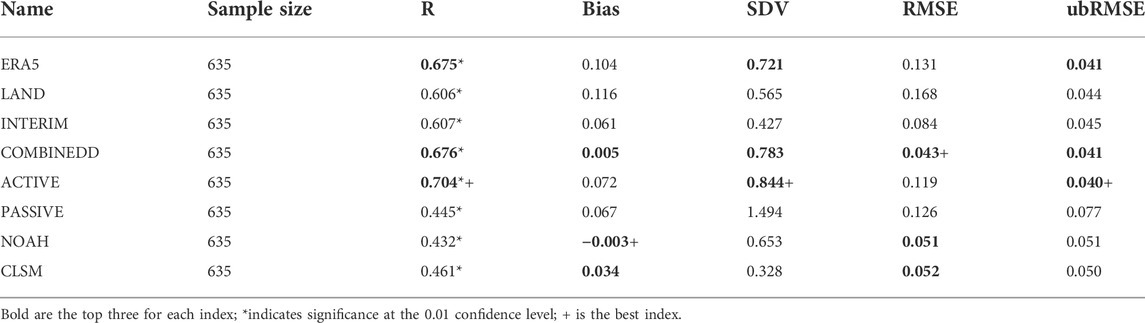
TABLE 3. Statistical results of the evaluation indexes in the Maqu network (observation sample size: 635 days).
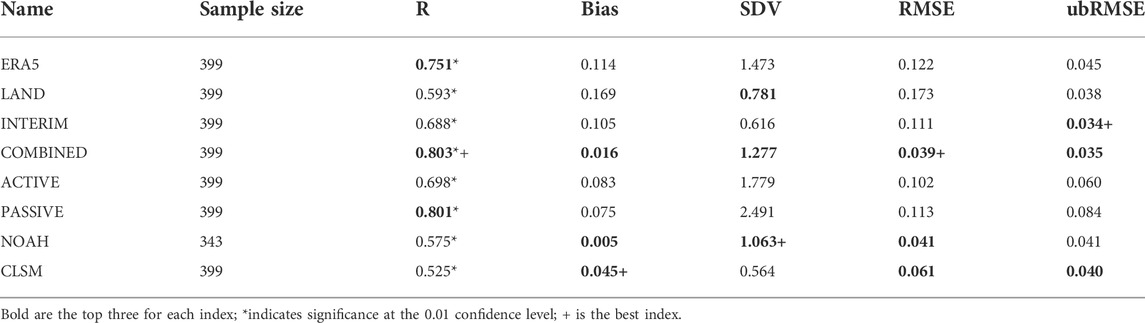
TABLE 4. Statistical results of the evaluation indexes in the Naqu network (observation sample size: 339 days).
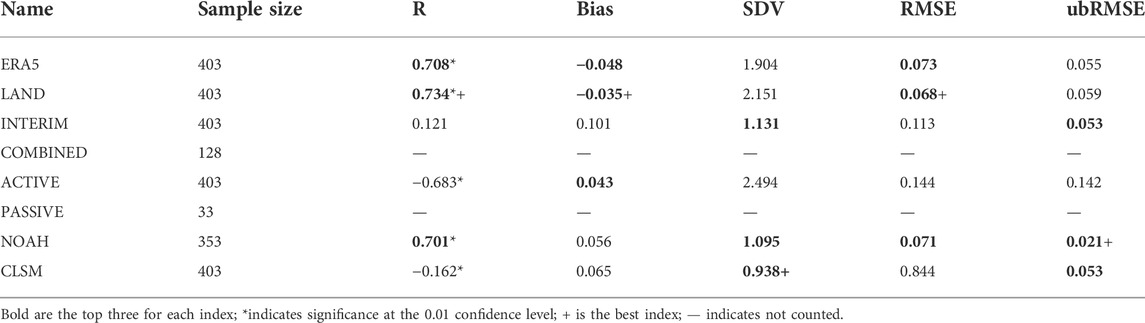
TABLE 5. Statistical results of the evaluation indexes in Ali (observation sample size: 403 days).
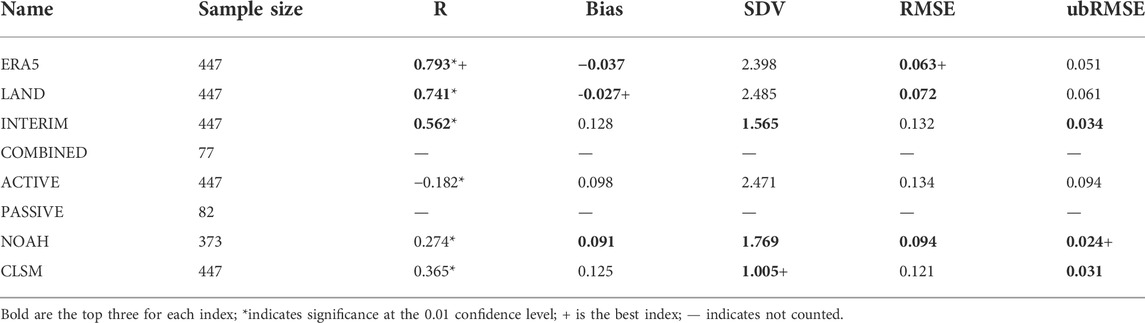
TABLE 6. Statistical results of the evaluation indexes in the Sq network (observation sample size: 447 days).
3.1 Soil moisture heterogeneity
As described in Methods (Section 2.5), we adopted a site-average approach to represent the average state of the observation networks as much as possible. However, considering the significant impact of soil moisture heterogeneity on the spatial average, it is necessary to analyze whether there is a consistent change among stations. For this reason, we calculated the correlation coefficient between stations within each observation network (Figure 3). The heterogeneity of the soil moisture in the Maqu network was relatively strong (Figure 3A). Although some correlation coefficients exceeded 0.5, the correlations of the stations were significantly different, ranging from −0.07 to 0.96. Some of the correlation coefficients were lower than 0.4, or even negative, which indicated that the soil moisture changes were different at some stations in the Maqu network. This may be due to the large range of the Maqu observation network and the different characteristics of the stations, such as land cover, soil texture, instrument installation slope, and so on, leading to differences in short-term changes of soil moisture.
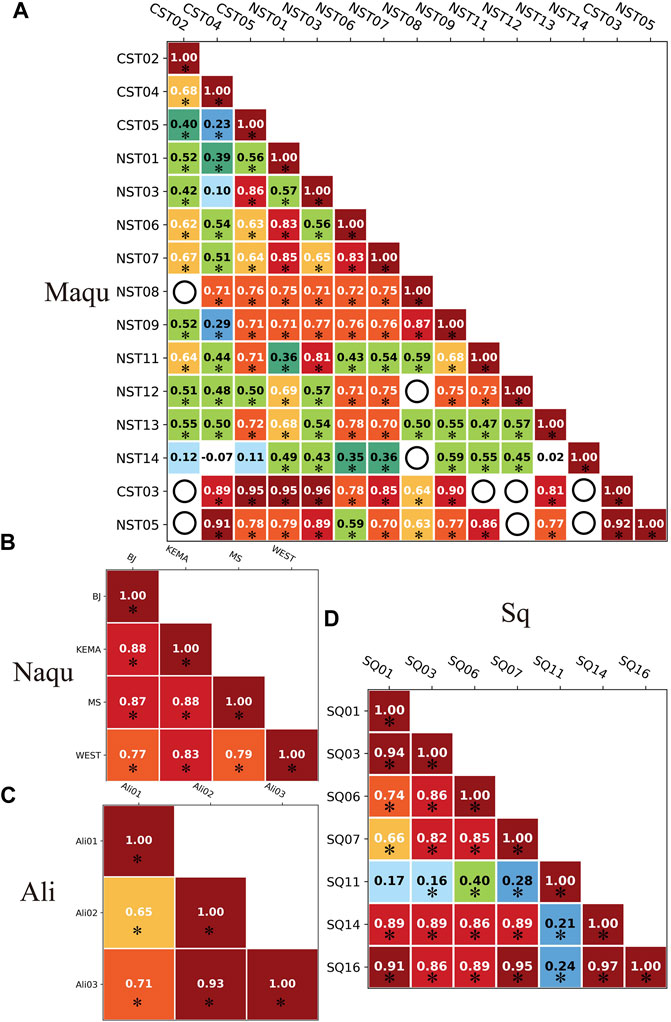
FIGURE 3. Correlation coefficients between stations in the networks of (A) Maqu, (B) Naqu, (C) Ali, and (D) Sq (* indicates significance at the 0.01 confidence level). Black open circles indicate data mismatch.
The spatial heterogeneity of the Naqu and Ali networks is relatively small, especially Naqu, and the correlation coefficient between stations was more than 0.77 (Figure 3B). This indicates that the stations of these two observation networks are fairly representative and can reflect the average state of soil moisture in their respective observation networks. In the Sq network (Figure 3D), the correlation coefficients were all over 0.66 except for one station, indicating that there was heterogeneity in this network, but that it was very weak. The possible reason for these differences is that the Naqu and Ali observation networks are small, the distribution of the stations is concentrated, and the external factors affecting soil moisture change at each station are similar. As a result, the stations of the Naqu, Ali, and Sq networks are more representative. It is worth noting that the resolution of the alternative data should be considered when evaluating them using these in situ data. Data with resolutions that are too coarse cannot reflect the spatial heterogeneity and may not be suitable for Maqu.
3.2 Maqu network
Figure 4A shows the daily variation curves of the observed and alternative soil moistures. The observed soil moisture had little inter-annual variation but a significant daily variation. The sample size of the observed and all alternative data was 635 days (excluding missing data). Both of the GLDAS datasets failed to capture the main dynamic changes of soil moisture. In many periods, the daily variation trend reflected by NOAH was contrary to the observations, and CLSM almost remained at 0.27 m3/m3, so their R results were only 0.432 and 0.461, respectively (Table 3). The scatter points of NOAH and CLSM are more concentrated and closer to the reference line (Figure 5A), indicating that NOAH and CLSM have weak volatility and low error. The bias and RMSE rank in the top three among the eight sets of alternative data.
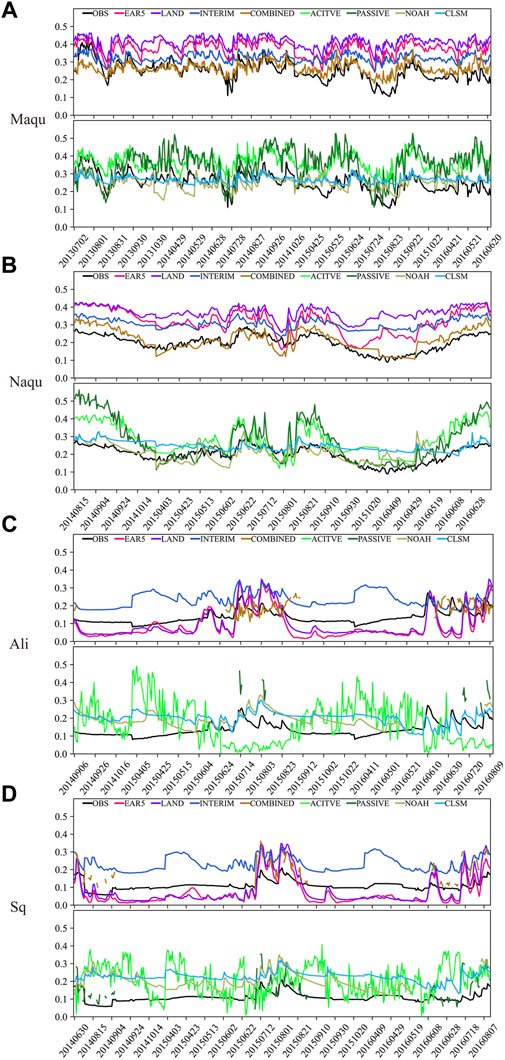
FIGURE 4. Daily variations of soil moisture in the four observation networks on the TP: (A) Maqu, (B) Naqu, (C) Ali, and (D) Sq. Soil moisture unit: m3/m3.
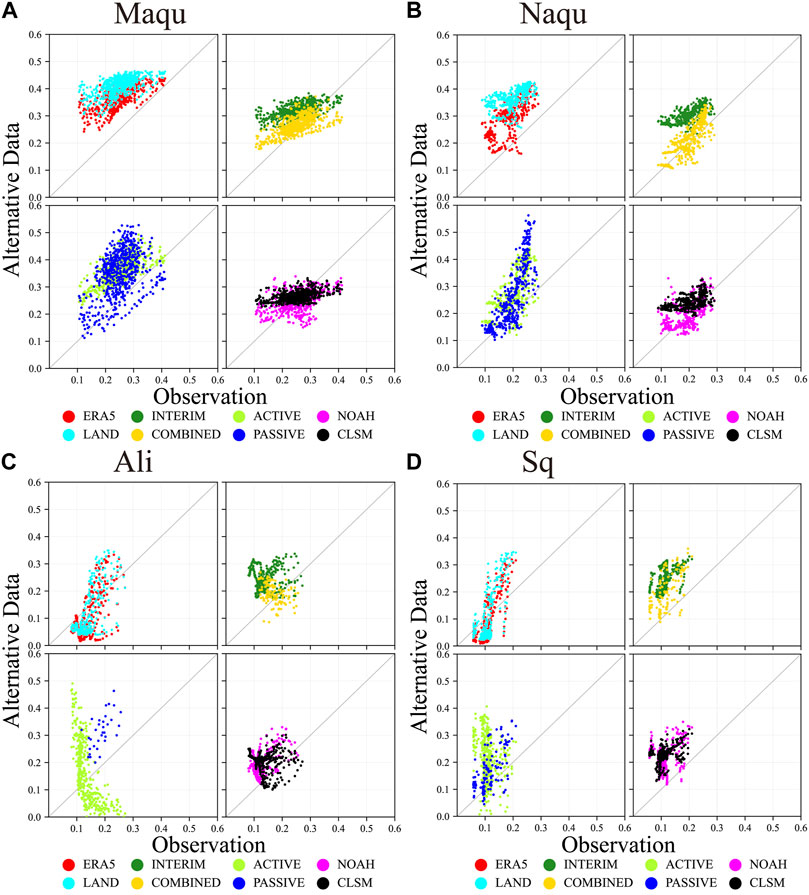
FIGURE 5. Scatterplots of the soil moisture observation data and alternative data in four observation networks on the TP: (A) Maqu, (B) Naqu, (C) Ali, and (D) Sq. Soil moisture unit: m3/m3. The diagonal line is the reference line. Scatter points parallel to the reference line indicate better correlation, and those closer to the reference line mean less errors relative to the observations.
The performance of the three sets of satellite products varied greatly. Both the COMBINED and ACTIVE data captured the dynamic change characteristics of soil moisture well (R > 0.67). ACTIVE reflected the dynamic change closest to the observations and had the optimal R and SDV, of 0.704 and 0.844, respectively; however, strong volatility also increased its relative bias, with bias and RMSE values of 0.072 m3/m3 and 0.119 m3/m3, respectively. In terms of the R and SDV index, COMBINED was slightly worse than ACTIVE, and the weak fluctuation should reduce the error relative to the observations, as confirmed in Figure 5A. The COMBINED scatter was located below ACTIVE and closer to the reference line; its RMSE (0.043 m3/m3) was optimal, and its bias (0.05 m3/m3) was also ranked in the top three. The dynamic change reflected by PASSIVE was poor, with a correlation coefficient of only 0.445.
The performances of the three sets of the re-analysis data were similar, showing good temporal variation of soil moisture (R > 0.6). The correlation coefficient of ERA5 reached 0.675, second only to the ACTIVE result. The scatter points of the three sets of the re-analysis data are all above the reference line, indicating that they all have different overestimations of soil moisture. Comparing the RMSE and ubRMSE results, the ubRMSE values of ERA5 and LAND were smaller, indicating that a large part of the overestimation of soil moisture by these products came from systematic errors.
3.3 Naqu network
As described previously, the climate and surface vegetation types of the Naqu network are similar to those of Maqu, so, it is speculated that the variation characteristics of the soil moisture in Naqu and Maqu will be similar. Compared with Maqu, the daily fluctuation range of the soil moisture in Naqu was weakened (Figure 4B), and the seasonal differences between dry (low values) and wet (high values) periods increased. The high-value period was from June to August and the low-value period was from October to April. In general, the eight sets of data captured the main dynamic characteristics of soil moisture (R > 0.5) (Table 4). NOAH and CLSM scatter were very concentrated (Figure 5B), with correlation coefficients of 0.575 and 0.525, respectively.
The COMBINED data can capture the fluctuation of soil moisture well, and their R (0.803), RMSE (0.039 m3/m3), and SDV (1.227) were the best results. The correlation coefficient of PASSIVE (R = 0.801) was significantly better than that of ACTIVE (R = 0.698), which was contrary to the evaluation results in Maqu. ACTIVE and PASSIVE overestimated the fluctuation range of the soil moisture (Figure 5B), with SDV results of 1.779 and 2.491, respectively, and caused a large error (RMSE >0.1 m3/m3).
ERA5 showed the best dynamic change of soil moisture (R = 0.751). INTERIM underestimated the daily fluctuations of soil moisture (SDV = 0.616). Three sets of the re-analysis data are all above the reference line (Figure 5B), they all overestimated soil moisture. Their ubRMSE were relatively small (ubRMSE <0.045 m3/m3), indicating that their error relative to the observations was mainly due to systematic error.
3.4 Ali network
The Ali observation network is located in the western part of the TP, with climate and surface characteristics that are quite different from those of Maqu, which may indicate different a applicability of alternative data between the two networks. Daily changes of soil moisture were gradual in Ali (Figure 4C). The difference between the dry and wet seasons was enhanced, with the duration of the dry season becoming longer and the change between the dry and wet seasons becoming faster. The performance of the eight sets of data varied greatly in Ali, with the satellite products performing very poorly. COMBINED and PASSIVE datasets had serious cases of missing data; their sample sizes were less than 30% of the observations (Table 5), so their evaluation indicators were not calculated. Although the ACTIVE set had no missing data, it failed to capture the dynamic change of the soil moisture (R = −0.683), with a large error (SDV = 2.494, RMSE > 0.14 m3/m3).
ERA5 and LAND both showed outstanding performances. Specifically, they could grasp the dynamic changes of the soil moisture and reflect the differences between the dry and wet seasons well. The weak fluctuation in dry seasons and the strong fluctuation in wet seasons were well reflected, as was the rapid change of the dry and wet seasons (R > 0.7), which meant that their errors were small. These results are confirmed by Figure 5C. LAND was closest to the observations, and not only captured the dynamic change of the soil moisture (R = 0.734), but also had the smallest error relative to the observations, with bias and RMSE values of −0.035 and 0.068 m3/m3, respectively. Unexpectedly, the performance of the INTERIM was significantly worse, and its correlation was only 0.121, possibly due to the overly gradual change reflected by the INTERIM.
NOAH better grasped the dynamic change of soil moisture (R = 0.701), reflecting the fluctuation difference and rapid transition process of soil moisture from dry to wet seasons (SDV = 1.095). Although it had some small degree of error from the observations, this may have been caused by the decreased total number of samples, due to a lack of measurements in 2016. CLSM was worst at reflecting the dynamic changes of soil moisture (R = −0.162), and did not reflect the obvious difference between dry and wet seasons or the rapid transition process between the seasons.
3.5 Sq network
Sq is close to the Ali network, and their climatic conditions and underlying surface characteristics are similar. Compared with Ali, the dry season in Sq is longer and the variation is more gentle (Figure 4D). The performances of the eight sets of data in Sq were similar to those in Ali. The measurements of the COMBINED and PASSIVE datasets had serious gaps, and the number of samples was less than 20% of the observations (Table 6). The ACTIVE dataset did not capture the main variation of the soil moisture, and its correlation coefficient was only −0.182. ACTIVE overestimated the fluctuation intensity of soil moisture (SDV = 2.471) and caused a large error (RMSE = 0.134 m3/m3).
The three sets of the re-analysis data showed the best performance in Sq (R > 0.56). ERA5 was closest to the observations, and its R (0.793) and RMSE (0.063 m3/m3) were the best. Compared with ERA5, LAND had an R of 0.741, and its bias was the smallest (−0.027 m3/m3). The performance of INTERIM was the worst among the re-analysis data, but it maintained the advantage of gradual change, resulting in an optimal SDV (1.156). As shown in Figure 5D, the scatter points of ERA5 and LAND are not concentrated, indicating that they reflect a relatively high intensity of daily fluctuation (SDV >2.39). However, it was unexpected that both the error of ERA5 and LAND relative to the observations was the best, which was different from the conclusion reached in other areas of the TP. This may be because ERA5 and LAND underestimated soil moisture at low values and overestimated it at high values, making the overall error smaller.
The performances of the two GLDAS datasets in Sq were similar to those in Ali, and their correlation with the observations was weak (R < 0.37). They reflected a gentle variation of the soil moisture, especially CLSM, which was closest to the observations (SDV = 1.005). NOAH also had a small error relative to the observations, just as the analysis results in Ali showed, which may be because the number of samples was smaller than for other data.
3.6 Maqu small-scale evaluation
In the previous sections, the applicability of eight sets of alternative data at the observation network scale was evaluated. However, in those evaluations we used the station average to represent the soil moisture average level of the observation network. The advantage of this simple method is that the ground observational and alternative data are matched in space, but the deficiency is also very obvious: the strong heterogeneity of the soil moisture in the observation network will be ignored. Therefore, it is necessary to further analyze the performance of alternative data on a smaller spatial scale to find any more significant advantages or disadvantages of the various products.
In order to carry out such a small-scale survey, the evaluation field needs to have certain characteristics, such as strong spatial heterogeneity of the soil moisture, a large observation network, and many, relatively scattered observation points. The main reason for this screening is that if the spatial heterogeneity is too weak, it cannot achieve the purpose of the evaluation. If the observation network is too small and the stations are too concentrated, the observation network can only match one or two grid points, which may result in the same assessment results as the observation network scale. Therefore, the Maqu soil moisture observation network was selected as the evaluation field. According to the minimum spatial resolution of the alternative data and the distribution characteristics of the observation stations in Maqu, the Maqu network was divided into 15 small regions, of which only nine had observation stations. We chose these nine small regions, and the average value of observation stations in each was used as ground observations to discuss the performance of alternative data (Figure 2A).
Figure 6 shows the time-varying curve of the observed soil moisture in the nine regions of the Maqu observation network. It can be seen from Figure 6 that the soil moisture values in the different small regions were significantly different at the same time. The soil moisture of Reg6 was highest, at more than 0.4 m3/m3 in most periods, and the average soil moisture of Reg9 was lowest, at less than 0.1 m3/m3 in most periods. On the other hand, the daily variation trends and amplitudes of the soil moisture in different regions were also significantly different. For example, in May 2014, there was no obvious daily variation of soil moisture in Reg6, but the soil moisture in the other regions had a strong daily variation, which indicated that different stations in the Maqu observation network represented different dynamic changes of the soil moisture.
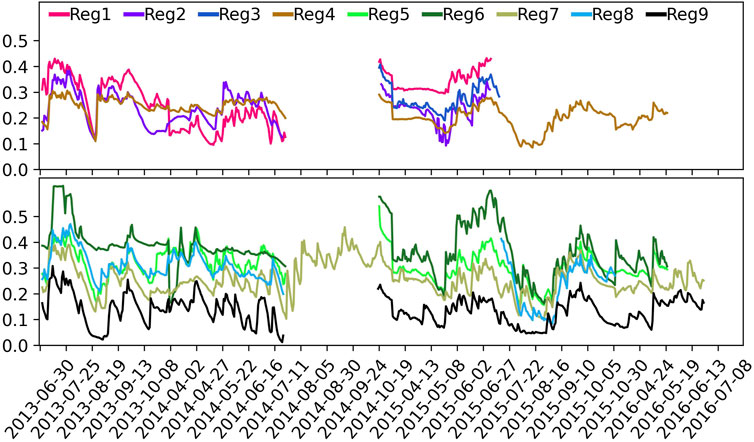
FIGURE 6. Time series of the soil moisture in nine regions of Maqu from July 2013 to June 2016. Soil moisture unit: m3/m3.
Figure 7 shows the correlation coefficients between the alternative and the observed soil moisture in the nine small regions. It can be seen that there are significant differences in the correlation between each set of alternative data and observations. In the nine small regions, the ACTIVE, ERA5, and COMBINED results have good correlation with the observations, and for each of those sets of data, five small regions had a correlation coefficient of more than 0.6. ACTIVE performed best, with a correlation coefficient greater than 0.5 in eight small regions, and greater than 0.6 in seven of them. The performance of ERA5 was second only to ACTIVE, with the correlation coefficient of eight small regions greater than 0.5, and five of them greater than 0.6. The performance of COMBINED was similar to that of ERA5. The performances of INTERIM and LAND were average, with four and five regions, respectively, exceeding 0.6. The PASSIVE performance was poor, and the correlation coefficient of only three small regions exceeded 0.5. NOAH and CLSM performed the worst, with most of their small regions at less than 0.4.
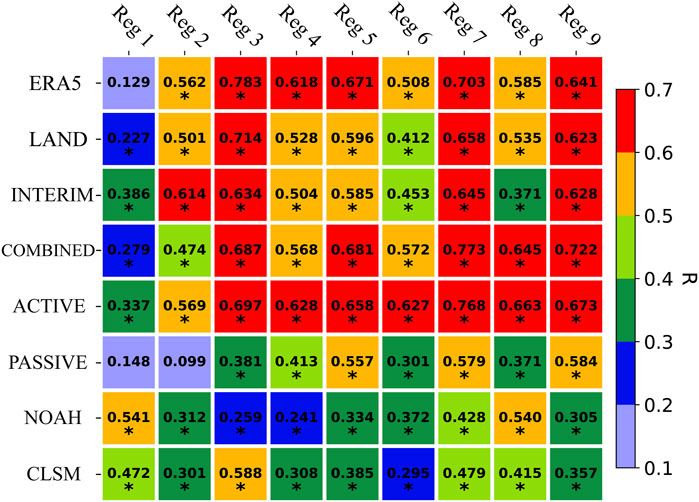
FIGURE 7. Correlation coefficient distribution of the alternative data in nine small regions of Maqu (* indicates significance at the 0.01 confidence level).
In general, the performances of ACTIVE, ERA5, and COMBINED were better, mainly because the high resolution of the data better reflected the spatial heterogeneity. However, it is not just down to the higher resolution as, for example, the performance of LAND was inferior to that of ERA5. The possible reason for this is that the forcing field does not have corresponding high-resolution data, and thus improving the model resolution alone cannot achieve the expected results. LAND uses ERA5 outputs as the meteorological forcing field, including wind, temperature, precipitation, and other variables. Note that these fields are interpolated from the ERA5 resolution of about 31 km to the LAND resolution of about 9 km via a linear interpolation method based on a triangular mesh (Muñoz-Sabater et al., 2021). Although the meteorological forcing field after interpolation meets the input requirements of the LAND model, the numerical change of the forcing field after interpolation is similar to that of ERA5, and the interpolation process may produce errors. Therefore, the performance of the LAND data has not significantly improved compared with that of ERA5. The performance of each set of data in Reg3, Reg5, Reg7, and Reg9 is better than in Reg4, Reg6, and Reg8, which may be because the latter has more water body coverage (Figure 2A). Studies have pointed to the performance of numerical models and satellite products being unsatisfactory for underlying surfaces containing water, as the calculations of the soil moisture in these areas are susceptible to land cover classification (Chen et al., 2013; Zheng et al., 2015). The station average method may have affected the results of the small-scale evaluation. Reg6 has three stations: NST04, NST05, and CST02. NST04, which was a severe case of missing data, was discarded. Because CST02 and NST05 do not match in time (Figure 3A), the Reg6 sequence is actually a splicing of the data of two stations with different variation characteristics, and this caused the low correlation of the alternative data in Reg6. At the same time, the interpolation process can also affect the evaluation result. In Reg1, the CST04 in situ data only represent the variation characteristics of the station, but the interpolation point data do not. When the alternative data were interpolated to the CST04 station, the grid points around it were used to calculate the interpolation point, and the variation characteristics were the combination of multiple points, which may have caused the low correlation of the alternative data in Reg1.
4 Discussion
Through the aforementioned analysis, we found that the performance of the eight sets of soil moisture data differed greatly in the TP region. Some datasets could capture the dynamic characteristics of soil moisture, while others could not provide the accuracy we expected. Meanwhile, any one set of data could have good applicability in some regions and poor performance in others. It is necessary to explore the sources of error of data, and analyze the causes of performance differences of alternative data, especially in the TP region where the underlying surface is highly complex. The possible sources of error are as follows:
1) Mismatches between observation stations and alternative data on the spatial scale: At present, there is no soil moisture observation network that can accurately represent the spatial scale of alternative data. In order to reduce the impact of this well-known problem (Qin et al., 2013), we interpolated the alternative data to the stations, and used the average of the stations to represent the average soil moisture of the observation network. However, the interpolation process can still bring some errors, especially in the complex topography of the TP. Some studies have pointed out that it is difficult for in situ data to describe the spatial characteristics of regional soil moisture, and that sparse observations can only reflect the temporal change of soil moisture and cannot reproduce the numerical absolute change (Koster et al., 2009; Wagner et al., 2013). Therefore, evaluation results should focus more on correlation rather than RMSE or bias.
2) Mismatch of the soil depth: In this study, the surface soil depth of the observation network was 5 cm, the surface soil moisture of the three sets of the satellite products was 0.5–5 cm, and the surface soil moisture of the three sets of re-analysis data was 0–7 cm. NOAH used 0–10 cm, and the surface soil depth of CLSM was 0–2 cm. It should be noted that the observed value refers to soil moisture at the depth of 5 cm, whereas the alternative soil moisture is an average in the vertical direction.
3) Mismatch of the soil moisture unit: NOAH uses the unit of soil depth to convert to volumetric water content, which causes relatively small errors in the calculation process. However, the unit of ACTIVE is soil saturation, which requires soil porosity data to convert to volumetric water content. The accuracy of porosity data has an important influence on the evaluation results, which may be the reason for the large error of the ACTIVE product.
4) Inaccuracy of the input data (such as soil texture, land use type, observation, and satellite data) in the numerical model calculation and satellite inversion: These errors in the input data will be carried into the soil moisture product by the model or algorithm, and may even be magnified, eventually making the error of the product even bigger.
Passive microwave products are widely used throughout the world. This is due to the fact that passive microwave detectors work in the L band: the longer the wavelength, the better the penetration, so they are less affected by surface roughness (Zheng et al., 2019). However, in the Maqu network, the performance of the ACTIVE soil moisture data is significantly better than that of PASSIVE, which is different from our usual understanding and may be related to the underlying surface characteristics of Maqu. Located in the eastern part of the TP, Maqu has a long rainy season and is mainly covered by grasslands and low shrubs with dense vegetation. ACTIVE microwave products have advantages in regions of greater vegetation density and stronger soil moisture change, mainly because active microwave detectors have a higher sensitivity to soil moisture, and low sensitivity to vegetation coverage. This means that they can separate the short timescale changes in soil moisture contained in backscattering signals from seasonal vegetation cycles, thus making it easier to detect dynamic changes in the surface soil moisture (Qin et al., 2013). The COMBINED products demonstrated an excellent performance in Maqu and Naqu, not only capturing dynamic changes in the soil moisture, but also with low error. This shows that this is a very effective method to invert soil moisture by integrating the advantages of active and passive remote-sensing products, which is consistent with the evaluation results of previous research (Dorigo et al., 2017). The results confirm the validity of the COMBINED soil moisture products over the TP. However, there was a serious issue with missing data for the COMBINED and PASSIVE products in Ali and Sq, which may be related to climate and surface features. The Ali and Sq observation networks are located at high altitudes and belong to a cold and arid climate zone. The soil is mostly sandy loam, with the dry season exceeding half a year, and almost no daily variation of soil moisture. The microwave detectors can barely scan the changes of the soil moisture on the surface, and will even judge the microwave signal from the soil as noise (Pei Zhang et al., 2021). When producing COMBINED data, many of the PASSIVE products are integrated, so the gaps are also a problem with this product.
The three sets of re-analysis data can accurately reflect the dynamic changes of the soil moisture. This is mainly because re-analysis data use an advanced assimilation technology to integrate large amounts of precipitation, temperature, and other data from ground and satellite observations, which have been verified by multiple climate regions, making the re-analysis data close to observations in long-term climate trends (Jing et al., 2018). This indicates that the quality of ground and satellite data should be taken into consideration in the assimilation model, because the uncertainty error of the observation data will be brought into the model and may be further magnified. Meanwhile, compared with INTERIM, the performances of the ERA5 and LAND data were greatly improved, indicating that the quality of the re-analysis data can be enhanced by optimizing the numerical model and parameterization scheme, as well as the resolution, and incorporating more high-quality observation data. The variation of the surface vegetation can affect soil moisture by affecting soil-–water storage properties, land–atmosphere water exchange, canopy interception, and so on. Although dynamic vegetation data have been introduced into LAND, the data are on the seasonal scale (Li et al., 2020), which do not match well with the hourly output of LAND, and thus may be an important factor affecting LAND’s performance.
The two sets of GLDAS data did not reflect the dynamic changes of soil moisture in the TP region well. The surface soil moisture responds quickly to short-term meteorological forcing variables; when precipitation variability is strong, soil moisture variability increases (Chen et al., 2013). GLDAS-2 does not couple the atmospheric module and uses the Princeton Meteorological Forcing Dataset, which is a re-analysis product using observational products for the period 1948–2010, as the sole source of forcing data for deviation correction. The deviation correction process greatly reduces the deviation of GLDAS-2 precipitation data, but at the same time reduces the ability to describe precipitation variability (Sheffield et al., 2006). When GLDAS drives NOAH and CLSM by verified atmospheric forcing data, it makes NOAH and CLSM have a weak ability to simulate the dynamic changes of soil moisture in the TP region, but the error is lower.
In summary, the soil moisture dynamic changes of the COMBINED products in the Maqu and Naqu observation networks are consistent with the ground observations, and the error is relatively low. The performance of the active–passive fusion products has been verified in the central and eastern parts of the TP. However, as the evaluation of the ACTIVE and PASSIVE data shows, the performance of satellite products varies from place to place. The ACTIVE soil moisture performance is best in Maqu, with its dense vegetation, while the PASSIVE products are closer to the observations in Naqu, with its sparse grasslands. The three sets of satellite products showed an obvious inapplicability in the Ali and Sq areas, because the COMBINED and PASSIVE products had serious gaps in these regions, while the ACTIVE set failed to capture the main variation characteristics of soil moisture. NOAH and CLSM seemed to have a weak ability to reflect the dynamic changes of soil moisture, and their simulated soil moisture changes were too gradual. Compared with INTERIM, the performances of the ERA5 and LAND data showed significant improvements, and the correlations of both the ERA5 and LAND data in Ali and Sq were good, with the smallest relative error. Meanwhile, in Maqu and Naqu, ERA5 was consistent with the observations, and the correlation was only slightly worse than that of the satellite products. Therefore, relatively, ERA5 has the best applicability in the TP region.
5 Conclusion
The applicability of the COMBINED, ACTIVE, PASSIVE, ERA5, LAND, INTERIM, NOAH, and CLSM data products was studied during the non-freezing periods in the TP region using the in situ data of the Maqu, Naqu, Ali, and Sq soil moisture observation networks. The results showed that:
1) The applicability of the eight sets of data differed obviously in different regions of the TP, and the applicability of any one set of data also differed among the regions. In general, the applicability of the eight sets of data was better in the Maqu region than in the Ali and Sq areas.
2) At the observation-network scale, the COMBINED, ACTIVE, and ERA5 products had a better correlation with the observations in Maqu and Naqu, with correlation coefficients of over 0.65. The COMBINED, NOAH, and CLSM data had small errors relative to the observations. In terms of trend and amplitude of temporal change, the COMBINED, ACTIVE, and ERA5 data products were closer to the observations. In the Ali and Sq areas on the western TP, the COMBINED and PASSIVE data had serious gaps. The ERA5 and LAND datasets in the Ali and Sq regions had a high correlation, with correlation coefficients above 0.7.
3) At the small scale of Maqu, it was found that the correlation of no one set of data was best in all nine regions. Among the datasets, ERA5, COMBINED, and ACTIVE had good correlation with observations of the small regions, and the correlation coefficient of seven small regions was more than 0.5.
This article comprehensively evaluates the overall performance of eight sets of alternative data on the TP, with emphasis on the correlations between the alternative data and the observations and temporal continuity, which are the important factors affecting the results of climate assessments. This work found that ERA5 is the most suitable dataset for studying soil moisture on the TP.
Data availability statement
Publicly available datasets were analyzed in this study. The soil moisture observation network data of TP are available at https://data.tpdc.ac.cn/en/. The combined, active, and passive soil moisture products of ESA CCI v4.7 can be downloaded from https://www.esa-soilmoisture-cci.org. The ERA5 and ERA5-land soil moisture data are available at https://cds.climate.copernicus.eu. The ERA–INTERIM soil moisture data are available at https://apps.ecmwf.int/datasets/data/. The NOAH and CLSM soil moisture data of GLDAS v2.1 can be downloaded from https://disc.gsfc.nasa.gov/datasets/. The ESA land cover data are available at http://maps.elie.ucl.ac.be/CCI/viewer/download.php. The SRTM digital elevation data can be downloaded from https://srtm.csi.cgiar.org/srtmdata/.
Author contributions
XD carried out data collection and data analysis. XD and XL drafted the manuscript. XD, YW, and WD designed the methods and edited the manuscript. LD, JZ, and SC edited and reviewed the manuscript.
Funding
This research was funded by the National Natural Science Foundation of China, grant numbers 42075081, 42075019, 41905008, and 42075019, and the Second Tibetan Plateau Scientific Expedition and Research (STEP) program (2019QZKK0105, 2019QZKK010203).
Acknowledgments
We thank the reviewers and editor for their insightful remarks. We would like to thank the European Centre for Medium-Range Weather Forecasts for providing the ERA5, ERA5-land, and ERA-interim reanalysis data and NASA for providing GLDAS data and the European Space Agency for the ESA CCI data and land cover data. We thank the National Tibetan Plateau Data Center of China for soil moisture in situ observation data. The author thanks NCAR for providing NCL, Python calculations, and the drawing program.
Conflict of interest
The authors declare that the research was conducted in the absence of any commercial or financial relationships that could be construed as a potential conflict of interest.
Publisher’s note
All claims expressed in this article are solely those of the authors and do not necessarily represent those of their affiliated organizations, or those of the publisher, the editors, and the reviewers. Any product that may be evaluated in this article, or claim that may be made by its manufacturer, is not guaranteed or endorsed by the publisher.
References
Al-Yaari, A., Wigneron, J. P., Ducharne, A., Kerr, Y., de Rosnay, P., de Jeu, R., et al. (2014). Global-scale evaluation of two satellite-based passive microwave soil moisture datasets (SMOS and AMSR-E) with respect to Land Data Assimilation System estimates. Remote Sens. Environ. 149, 181–195. doi:10.1016/j.rse.2014.04.006
Albergel, C., de Rosnay, P., Balsamo, G., Isaksen, L., and Muñoz-Sabater, J. (2012). Soil moisture analyses at ECMWF: Evaluation using global ground-based in situ observations. J. Hydrometeorol. 13 (5), 1442–1460. doi:10.1175/JHM-D-11-0107.1
Albergel, C., Dorigo, W., Reichle, R. H., Balsamp, G., Rosnay, P., Muñoz-Sabater, J., et al. (2013). Skill and global trend analysis of soil moisture from reanalyses and microwave remote sensing. J. Hydrometeorol. 14, 1259–1277. doi:10.1175/JHM-D-12-0161.1
Alexander, G., Tracy, S., Robin, V. D. S., Wolfgang, W., and Wouter, D. (2019). Evolution of the ESA CCI Soil Moisture climate data records and their underlying merging methodology. Earth Syst. Sci. Data 11 (2), 717–739. doi:10.5194/essd-11-717-2019
Bartalis, Z., Wagner, W., Naeimi, V., Hasenauer, S., Scipal, K., Bonekamp, H., et al. (2007). Initial soil moisture retrievals from the METOP-A advanced scatterometer (ASCAT). Geophys. Res. Lett. 34, L20401. doi:10.1029/2007GL031088
Bindlish, R., Jackson, T. J., Wood, E., Gao, H. L., Patrick, S., Bosch, D., et al. (2003). Soil moisture estimates fromTRMM microwave imager observations over the southern United States. Remote Sens. Environ. 85, 507–515. doi:10.1016/S0034-4257(03)00052-X
Charney, J. G., and Eliassen, A. (1949). A numerical method for predicting the perturbations of the middle latitude westerlies. Tellus 1, 38–54. doi:10.1111/j.2153-3490.1949.tb01258.x
Chen, Y. Y., Yang, K., Qin, J., Zhao, L., Tang, W. J., Han, M. L., et al. (2013). Evaluation of AMSR-E retrievals and GLDAS simulations against observations of a soil moisture network on the central Tibetan Plateau. J. Geophys. Res. Atmos. 18 (10), 4466–4475. doi:10.1002/jgrd.50301
Chen, A. A., Wang, N. L., Wu, Y. W., Quan, Z., and Guo, Z. M. (2020). Impact of glacier shape on the mass balance changes: A case study of dongkemadi region, central Tibetan plateau. Adv. Clim. Change Res. 11 (1), 22–30. doi:10.1016/j.accre.2020.05.010
Cheng, M. L., Zhong, L., Ma, Y. M., Zuo, M. J., Ge, N., and Wang, X. (2019). A study on the assessment of multi-source satellite soil moisture products and reanalysis data for the Tibetan plateau. Remote Sens. 11 (10), 1196. doi:10.3390/rs11101196
Crow, W. T., Berg, A. A., Cosh, M. H., Loew, A., Mohanty, B. P., Panciera, R., et al. (2012). Upscaling sparse ground-based soil moisture observations for the validation of coarse-resolution satellite soil moisture products. Rev. Geophys. 50, 2002. doi:10.1029/2011RG000372
Dorigo, W., Wagner, W., Albergel, C., Albrecht, F., Balsamo, G., Brocca, L., et al. (2017). ESA CCI soil moisture for improved Earth system understanding: State-of-the art and future directions. Remote Sens. Environ. 203. doi:10.1016/j.rse.2017.07.001
Draper, C. S., Walker, J. P., Steinle, P. J., de Jeu, R. A. M., and Holmes, T. R. H. (2009). An evaluation of AMSR-E derived soil moisture over Australia. Remote Sens. Environ. 113 (4), 703–710. doi:10.1016/j.rse.2008.11.011
Gaiser, P. W., Twarog, E. M., Li, L., Germain, K. T., Poe, G. A., Purdy, W., et al. (2004). “The WindSat space borne polarimetric microwave radiometer: Sensor description and mission overview,” in Proceeding of the 2004 IEEE International Geoscience and Remote Sensing Symposium, Anchorage, AK, USA, September 2004 (IEEE), 374. doi:10.1109/igarss.2004.1369039
González-Zamora, Á., Sánchez, N., Pablos, M., and Martínez-Fernández, J. (2018). CCI soil moisture assessment with SMOS soil moisture and in situ data under different environmental conditions and spatial scales in Spain. Remote Sens. Environ. 225, 469–482. doi:10.1016/j.rse.2018.02.010
Gualtieri, G. (2021). Reliability of ERA5 reanalysis data for wind resource assessment: A comparison against tall towers. Energies 14 (14), 4169. doi:10.3390/en14144169
Han, S., Liu, B. C., Shi, C. X., Liu, Y., Qiu, M., Sun, S., et al. (2020). Evaluation of CLDAS and GLDAS datasets for near-surface air temperature over major land areas of China. Sustainability 12 (10), 4311. doi:10.3390/su12104311
Hunt, K. M. R., and Turner, A. G. (2017). The effect of soil moisture perturbations on Indian monsoon depressions in aNumerical weather prediction model. J. Clim. 30, 8811–8823. doi:10.1175/JCLI-D-16-0733.1
Ikonen, J., Vehviläinen, J., Rautiainen, K., Smolander, T., Lemmetyinen, J., Bircher, S., et al. (2016). The Sodankyläin situ soil moisture observation network: An example application of ESA CCI soil moistureproduct evaluation. Geosci. Instrum. Method. Data Syst. 5 (1), 95–108. doi:10.5194/gi-5-95-2016
Jiang, H. T., Shen, H. F., Li, H. F., Lei, F. N., Gan, W. X., Zhang, L. P., et al. (2017). Evaluation of multiple downscaled microwave soil moisture products over the central Tibetan plateau. Remote Sens. 9 (5), 402. doi:10.3390/rs9050402
Jiang, Y., Han, S., Shi, C. X., Gao, T., Zhen, H. H., Liu, X. Y., et al. (2021). Evaluation of HRCLDAS and ERA5 datasets for near-surface wind over hainan island and south China sea. Atmosphere 12 (6), 766. doi:10.3390/atmos12060766
Jing, W. L., Song, J., and Zhao, X. D. (2018). Validation of ECMWF multi-layer reanalysis soil moisture based on the OzNet hydrology network. Water 10 (9), 1123. doi:10.3390/w10091123
Kawanishi, T., Sezai, T., Ito, Y., Imaoka, K., Takeshima, T., Ishido, Y., et al. (2003). The Advanced Microwave Scanning Radiometer for the Earth Observing System (AMSR-E), NASDA's contribution to the EOS for global energy and water cycle studies. IEEE Trans. Geosci. Remote Sens. 41 (2), 184–194. doi:10.1109/tgrs.2002.808331
Kobayashi, T., Tateishi, R., Alsaaideh, B., Bayan, A., Gegen, T., Xuan, P. D., et al. (2014). Production of global land cover data – glcnmo2008. J. Geogr. Geol. 6 (3), 1. doi:10.5539/jgg.v6n3p99
Koster, R. D., Guo, Z., Yang, R., Dirmeyer, P. A., Mitchell, K., Puma, M. J., et al. (2009). On the nature of soil moisture in land surface models. J. Clim. 22 (16), 4322–4335. doi:10.1175/2009JCLI2832.1
Kovačević, J., Cvijetinović, Ž., Stančić, N., Brodić, N., and Mihajlović, D. (2020). New downscaling approach using ESA CCI SM products for obtaining high resolution surface soil moisture. Remote Sens. 12 (7), 1119. doi:10.3390/rs12071119
Leroux, D. J., Kerr, Y. H., Al Bitar, A., Bindlish, R., Jackson, T. J., Berthelot, B., et al. (2014). Comparison between SMOS, VUA, ASCAT, and ECMWF soil moisture products over four watersheds in US. IEEE Trans. Geosci. Remote Sens. 52 (3), 1562–1571. doi:10.1109/TGRS.2013.2252468
Li, C. W., Lu, H., Yang, K., Han, M. L., Wright, J. S., Chen, Y. Y., et al. (2018). The evaluation of SMAP enhanced soil moisture products using high-resolution model simulations and in-situ observations on the Tibetan plateau. Remote Sens. 10 (4), 535. doi:10.3390/rs10040535
Li, M. X., Wu, P. L., and Ma, Z. G. (2020). A comprehensive evaluation of soil moisture and soil temperature from third‐generation atmospheric and land reanalysis data sets. Int. J. Climatol. 40 (13), 5744–5766. doi:10.1002/joc.6549
Liu, J., Chai, L. N., Lu, Z., Liu, S. M., Qu, Y. Q., Geng, D. Y., et al. (2019). Evaluation of SMAP, SMOS-IC, FY3B, JAXA, and LPRM soil moisture products over the qinghai-Tibet Plateau and its surrounding areas. Remote Sens. 11 (7), 792. doi:10.3390/rs11070792
Makama, E. K., and Lim, H. S. (2020). Variability and trend in integrated water vapour from ERA-interim and IGRA2 observations over peninsular Malaysia. Atmosphere 11 (9), 1012. doi:10.3390/atmos11091012
Massari, C., Brocca, L., Moramarco, T., Tramblay, Y., and Lescot, J. F. D. (2014). Potential of soil moisture observations infloodmodelling: Estimating initial conditions and correcting rainfall. Adv. Water Resour. 74, 44–53. doi:10.1016/j.advwatres.2014.08.004
Muñoz-Sabater, J., Dutra, E., Agustí-Panareda, A., Albergel, C., Arduini, G., Balsamo, G., et al. (2021). ERA5-Land: A state-of-the-art global reanalysis dataset for land applications. Earth Syst. Sci. Data 13, 4349–4383. doi:10.5194/essd-13-4349-2021
Naeimi, V., Scipal, K., Bartalis, Z., Hasenauer, S., and Wagner, W. (2009). An improved soil moisture retrieval algorithm for ERS and METOP scatterometer observations. IEEE Trans. Geosci. Remote Sens. 47 (7), 1999–2013. doi:10.1109/TGRS.2008.2011617
Nefabas, K. L., Sder, L., Mamo, M., and Olauson, J. (2021). Modeling of Ethiopian wind power production using ERA5 reanalysis data. Energies 14 (9), 2573. doi:10.3390/en14092573
Paloscia, S., Macelloni, G., Santi, E., and Koike, T. (2001). A multifrequency algorithm for the retrieval of soil moistureon a large scale using microwave data from SMMR and SSM/I satellites. IEEE Trans. Geosci. Remote Sens. 39 (8), 1655–1661. doi:10.1109/36.942543
Pan, M., Sahoo, A. K., Wood, E. F., Al Bitar, A., Leroux, D., Kerr, Y. H., et al. (2012). An initial assessment of SMOS derived soil moisture over the continental United States. IEEE J. Sel. Top. Appl. Earth Obs. Remote Sens. 5 (5), 1448–1457. doi:10.1109/JSTARS.2012.2194477
Pei Zhang, P., Zheng, D. H., van der Velde, R., Wen, J., Zeng, Y., Wang, X., et al. (2021). Status of the Tibetan Plateau observatory (Tibet-Obs) and a 10-year (2009–2019) surface soil moisture dataset. Earth Syst. Sci. Data 13, 3075–3102. doi:10.5194/essd-2020-209
Qin, J., Yang, K., Lu, N., Chen, Y., Zhao, L., Han, M., et al. (2013). Spatial upscaling of in-situ soil moisture measurements based on MODIS-derived apparent thermal inertia. Remote Sens. Environ. 138, 1–9. doi:10.1016/j.rse.2013.07.003
Rogier, V., Su, Z. B., and Ma, Y. M. (2008). Impact of soil moisture dynamics on ASAR σ0 signatures and its spatial variability observed over the Tibetan plateau. Sensors 8 (9), 5479–5491. doi:10.3390/s8095479
Ruqing Zhang, R. Q., Li, L., Zhang, Y., Huang, F. N., Li, J. D., Liu, W., et al. (2021). Assessment of agricultural drought using soil water deficit index based on ERA5-land soil moisture data in four southern provinces of China. Agriculture 11 (5), 411. doi:10.3390/agriculture11050411
Rzepecka, Z., and Birylo, M. (2020). Groundwater storage changes derived from GRACE and GLDAS on smaller river basins-A case study in Poland. Geosciences 10 (4), 124. doi:10.3390/geosciences10040124
Sheffield, J., Goteti, G., and Wood, E. F. (2006). Development of a 50-Year high-resolution global dataset of meteorological forcings for land surface modeling. J. Clim. 19 (13), 3088–3111. doi:10.1175/JCLI3790.1
Su, Z., Wen, J., Dente, L., Velde, R. V. D., Wang, L., Ma, Y., et al. (2011). The Tibetan Plateau observatory of plateau scale soil moisture and soil temperature (Tibet-Obs) for quantifying uncertainties in coarse resolution satellite and model products. Hydrol. Earth Syst. Sci. 15 (7), 2303–2316. doi:10.5194/hess-15-2303-2011
Topp, G. C., Davis, J. L., and Annan, A. P. (1980). Electromagnetic determination of soil water content: Measurements in coaxial transmission lines. Water Resour. Res. 16, 574–582. doi:10.1029/WR016i003p00574
Ulaby, F. T., Moore, R. K., and Fung, A. K. (1982). Microwave remote sensing: Active and passive, vol.II: Radar remote sensing and surface scattering and emission theory. New York: Addison-Wesley Publishing Company.
Wagner, W., Lemoine, G., and Rott, H. (1999). A method for estimating soil moisture from ERS scatterometer and soildata. Remote Sens. Environ. 70 (2), 191–207. doi:10.1016/S0034-4257(99)00036-X
Wagner, W., Dorigo, W., Jeu, R. D., Fernandez, D., Benveniste, J., Haas, E., et al. (2012). Fushion of ACTIVE andPASSIVEMicrowave observations to create an essential climate variable data record on soil moisture. ISPRS annals of photogrammetry. Remote Sens. Spatial Inf. Sci. 7, 315–321. doi:10.5194/isprsannals-I-7-315-2012
Wagner, W., Hahn, S., Kidd, R., Melzer, T., Bartalis, Z., Hasenauer, S., et al. (2013). The ASCAT soil moisture product: A review of its specifications, validation results, and emerging applications. metz. 22, 5–33. doi:10.1127/0941-2948/2013/0399
Watson, D. F. (1992). Contouring: A guide to the analysis and display of spatial data. Oxford: Pergamon Press, 321.
Wu, G. X., Liu, Y. M., He, B., Bao, Q., Duan, A. M., Jin, F. F., et al. (2012). Thermal controls on the asiansummer monsoon. Sci. Rep. 2, 404. doi:10.1038/srep00404
Wu, W., and Dickinson, R. E. (2004). Time scales of layered soil moisture memory in the context of land atmosphere interaction. J. Clim. 17 (14), 2752–2764. doi:10.1175/1520-0442(2004)017<2752:tsolsm>2.0.co;2
Xu, X. D., Shi, X. Y., Wang, Y. Q., Peng, S. Q., and Shi, X. H. (2008). Data analysis and numerical simulation of moisture source and transport associated with summer precipitation in the Yangtze River Valley over China. Meteorol. Atmos. Phys. 100 (1-4), 217–231. doi:10.1007/s00703-008-0305-8
Yang, S. H., Ren, L., Wu, T. H., Hu, G. J., Xiao, Y., Du, Y., et al. (2020). Evaluation of reanalysis soil temperature and soil moisture products in permafrost regions on the Qinghai-Tibetan Plateau. Geoderma 377 (4), 114583. doi:10.1016/j.geoderma.2020.114583
Yuan, Y., Lai, X., Gong, Y. F., Wen, J., Ding, X., Zhu, L. H., et al. (2019). CLM4.5 model simulation of soil moisture over the qinghai-xizang plateau and its performance evaluation. Chin. J. Atmos. Sci. 43 (3), 676–690. (in Chinese). doi:10.3878/j.issn.1006-9895.1808.18143
Yuan, Y., Lai, X., Gong, Y. F., and Chen, J. L. (2020). The impacts of late spring soil moisture in the Tibetan Plateau on summer precipitation in eastern China. Int. J. Climatol. 41 (5), 862–877. doi:10.1002/joc.6692
Zeng, J. Y., Li, Z., Chen, Q., Bi, H. Y., Qiu, J. X., Zou, P. F., et al. (2015). Evaluation of remotely sensed and reanalysis soil moisture products over the Tibetan Plateau using in-situ observations. Remote Sens. Environ. 163, 91–110. doi:10.1016/j.rse.2015.03.008
Zhang, Q., Fan, K., Singh, V. P., Peng, S., and Shi, P. (2018). Evaluation of remotely sensed and reanalysis soil moisture against in situ observations on the himalayan-Tibetan plateau. J. Geophys. Res. Atmos. 132 (14), 7132–7148. doi:10.1029/2017JD027763
Zheng, D. H., van der Velde, R., Su, Z., Wang, X., Chen, Y. Y., Booij, M. J., et al. (2015). Augmentations to the noah model physics for application to the yellow river source area. Part I: Soil water flow. J. Hydrometeorol. 16 (6), 2659–2676. doi:10.1175/JHM-D-14-0198.1
Zheng, D. H., van der Velde, R., Su, Z., Wen, J., Wang, X., Yang, K., et al. (2017). Evaluation of noah frozen soil parameterization for application to a Tibetan meadow ecosystem. J. Hydrometeorol. 18 (6), 1749–1763. doi:10.1175/JHM-D-16-0199.1
Zheng, D. H., van der Velde, R., Su, Z., Wen, J., Wang, X., Yang, K., et al. (2018a). Impact of soil freeze-thaw mechanism on the runoff dynamics of two Tibetan rivers. J. Hydrology 563, 382–394. doi:10.1016/j.jhydrol.2018.06.024
Zheng, D. H., Wang, X., van der Velde, R., Ferrazzoli, P., Wen, J., Wang, Z. L., et al. (2018b). Impact of surface roughness, vegetation opacity and soil permittivity on L-band microwave emission and soil moisture retrieval in the third pole environment. Remote Sens. Environ. 209, 633–647. doi:10.1016/j.rse.2018.03.011
Zheng, D. H., van der Velde, R., Wen, J., Wang, X., Ferrazzoli, P., Schwank, M., et al. (2018c). Assessment of the SMAP soil emission model and soil moisture retrieval algorithms for a Tibetan desert ecosystem. IEEE Trans. Geosci. Remote Sens. 56, 3786–3799. doi:10.1109/TGRS.2018.2811318
Zheng, D. H., Li, X., Wang, X., Wang, Z. L., Wen, J., van der Velde, R., et al. (2019). Sampling depth of L-band radiometer measurements of soil moisture and freeze-thaw dynamics on the Tibetan Plateau. Remote Sens. Environ. 226, 16–25. doi:10.1016/j.rse.2019.03.029
Keywords: soil moisture, Tibet plateau, comprehensive evaluation, multi-source satellite data, reanalysis data
Citation: Dong X, Lai X, Wang Y, Dong W, Zhu J, Dong L and Cen S (2022) Applicability evaluation of multiple sets of soil moisture data on the tibetan plateau. Front. Earth Sci. 10:872413. doi: 10.3389/feart.2022.872413
Received: 09 February 2022; Accepted: 13 July 2022;
Published: 10 August 2022.
Edited by:
Domenico Capolongo, University of Bari Aldo Moro, ItalyReviewed by:
Alberto Refice, National Research Council (CNR), ItalyDonghai Zheng, Institute of Tibetan Plateau Research (CAS), China
Copyright © 2022 Dong, Lai, Wang, Dong, Zhu, Dong and Cen. This is an open-access article distributed under the terms of the Creative Commons Attribution License (CC BY). The use, distribution or reproduction in other forums is permitted, provided the original author(s) and the copyright owner(s) are credited and that the original publication in this journal is cited, in accordance with accepted academic practice. No use, distribution or reproduction is permitted which does not comply with these terms.
*Correspondence: Xin Lai, nacylai@cuit.edu.cn