Sedimentary records and chronology of the late Pleistocene overbank flooding in the Yellow River source area, NE Tibetan Plateau
 Yan Zhu1 Haoyu Wang2
  Yuzhu Zhang1*
  Chun Chang Huang3 Xiaochun Zha2
  Haijun Qiu1 Ya-na Jia1 Qili Xiao1 Dou Chen1 Xu Lin1 Tao Liu4
- 1Shaanxi Key Laboratory of Earth Surface System and Environmental Carrying Capacity, College of Urban and Environmental Sciences, Northwest University, Xi’an, China
- 2Key Laboratory of Western China’s Environmental Systems (Ministry of Education), College of Earth and Environmental Sciences, Lanzhou University, Lanzhou, China
- 3School of Geography and Tourism, Shaanxi Normal University, Xi’an, China
- 4Department of Hydrology and Atmospheric Sciences, University of Arizona, Tucson, AZ, United States
Paleohydrological investigations were carried out in the Yellow River source area on the northeast (NE) Tibetan Plateau. During our fieldwork investigations, two units of overbank flood deposits (OFD) were found in the Maqu-Kesheng reach. These OFD units were studied using a multi-index approach, including magnetic susceptibility, hygroscopic water, grain size distribution and micro-morphological features. It can be inferred that they have recorded two episodes of overbank flooding of the Yellow River. Using the optically stimulated luminescence (OSL) and AMS 14C dating techniques, the first episode was dated to 34,680 ± 1880-29000 ± 1790 a and correlated with the late Marine Isotope Stage 3a (MIS 3a) with a warm and wet climate. The second episode occurred at 16,500 ± 1,250-14000 ± 1,280 a, which is coincided with the Bølling-Allerød warm stage during the last deglaciation, a period of coexisting global warming and rapidly shrinking ice sheets. At these two periods, the water was mainly derived from the accelerated melting of mountain glaciers surrounding the basin and/or the large-scale precipitation, which led to the overbank flooding events. At the same time, the related overbank flood deposits were interbedded within glacial outwash/flashflood deposits in the valley bottom of the Yellow River, which intensified the valley aggradation. These results are of great significance in enriching the paleoflood records in the Yellow River source area, recognizing the effect of river system on the development of valley landform, as well as understanding the hydro-climatic response of the Tibetan Plateau to global climate warming occurring presently.
1 Introduction
Paleoflood hydrology sub-discipline of paleohydrology that involves expertise from geomorphology, sedimentology, hydrology, modeling, and statistics, and concerns the study of past or ancient flood events using physical or botanical information, irrespective of any direct human observation (Schulte et al., 2019; Baker et al., 2022). The primary goal of paleoflood hydrology is to extend flood records over periods of time ranging from decades to millennia. The result is of great significance in providing data on the magnitude and frequency of floods and can indicate a limit to flood magnitude over a specified time interval (England et al., 2010; Guo et al., 2017; Munoz et al., 2018; Liu et al., 2019; Greenbaum et al., 2020; Panda et al., 2020; Baker et al., 2022; Benito et al., 2022; Mao et al., 2022), and understanding environmental and disaster effects of the interaction of hydrological processes, climate change, geomorphic factors and human activity (Knox, 2000; Benito et al., 2008; Huang et al., 2011; Srivastava et al., 2017; Wu et al., 2017; Liu et al., 2019; Zhang et al., 2019; Chen et al., 2021; Sharma et al., 2022). Consequently, since Kochel and Baker (1982) introduced “Paleoflood hydrology” in the journal Science, paleoflood investigates have been carried out over much of the world.
The geographic location of the Yellow River source area, influenced by the interplay among the Asian summer monsoon (ASM), Plateau monsoon, and Westerlies, provides great potential for elucidating climatic or environmental changes from sedimentary archives (Li et al., 1995; Wang et al., 1995; Shen et al., 1996; Zhou et al., 2010; Zhao et al., 2011; Wang et al., 2017; Hu et al., 2018; Li et al., 2020; Jia et al., 2022). The sensitivity of the region is shown in the temporal and spatial variability of natural indicators, such as floods, desertification, droughts and biodiversity, which are closely related to the global change drivers, climate and human activity (Li et al., 2011; Peng et al., 2014; Meng et al., 2016; Guo et al., 2022). In particular, the extreme floods in the Yellow River source area, characterized by high peak discharge, large area of influence, and long duration, can result in great damage and the loss of life and property (Peng et al., 2014). At present, scholars mainly rely on the measured data (no more than 60 years) from hydrometeorological stations and very limited historical documents to reveal the occurrence regularity of floods (Wang et al., 2009; Wang et al., 2012). However, extreme floods are events with low probabilities (IPCC, 2007). Therefore, it is necessary to carry out paleoflood studies and extend flood records to reveal the temporal spatial variability of extreme floods and the evolution tendency of the catchment system in the Yellow River source area.
The connection of the Zoige Basin with the Yellow River and the start of the basin excavation occurred at approximately 35,000 a BP (Li et al., 1995; Wang et al., 1995). After the endorheic Zoige catchment was captured by the Yellow River from the downstream basin at a much lower elevation, a rapid valley aggradation phase occurred at ca. 35,000-14600 a BP in the Maqu-Kesheng reach in the Yellow River source area (Wang et al., 2021). Scholars have revealed that valley aggradation often requires high sediment production from the catchment (climatically or human induced) and overbank (moderate or extreme) flows (Starkel, 2003; Benito et al., 2008; Srivastava et al., 2008; Chaudhary et al., 2015; Chahal et al., 2019; Prizomwala et al., 2019). It's worth noting that our research team has indeed found two units of late Pleistocene overbank flood deposits 2-6 m in thickness in the sediment sequences at Chameiqu (CMQ) and Zuhaka (ZHK) sites in the reach. And thus, the objectives of this study are as follows: 1) to enrich identification characteristics of these two units of overbank flood deposits; 2) to establish the chronology of overbank flooding by using the AMS 14C and OSL dating techniques; and 3) to explore the possible triggering factors and climate background of overbank flooding. These results are very useful for reasonable utilization of water resources and mitigation of flood disasters in the Yellow River source area, and they will enrich theoretical results of the interaction of hydrological processes, climate change and geomorphic factors.
2 Geographical setting
The Yellow River source area is generally defined as the upstream catchment above the Tangnaihai (TNH) hydrological station, situated between 95°50′45″ E-103°28′11″ E and 32°12′10″ N-35°48′7″ N on the NE Tibetan Plateau (Figure 1). It has a main flow length of 1,553 km, a drainage area of 121,972 km2, and an average channel gradient of ca. 1.1‰ (Li et al., 2014). The river flows southeast from the bedrock gorges into the Zoige Basin, which is a late Cenozoic faulted basin formed by tectonic movement (Lehmkuhl and Spönemann, 1994; Xue et al., 1998). The Zoige Basin is a relative subsidence area surrounded by East Kunlun Fault, Bailongjiang Fault, Awangcang Fault and so on (Figure 1B and Figure 2A). Originally, this basin was a paleolake (Zoige paleolake) with lacustrine sediments >300 m thick in the center (Xue et al., 1998).
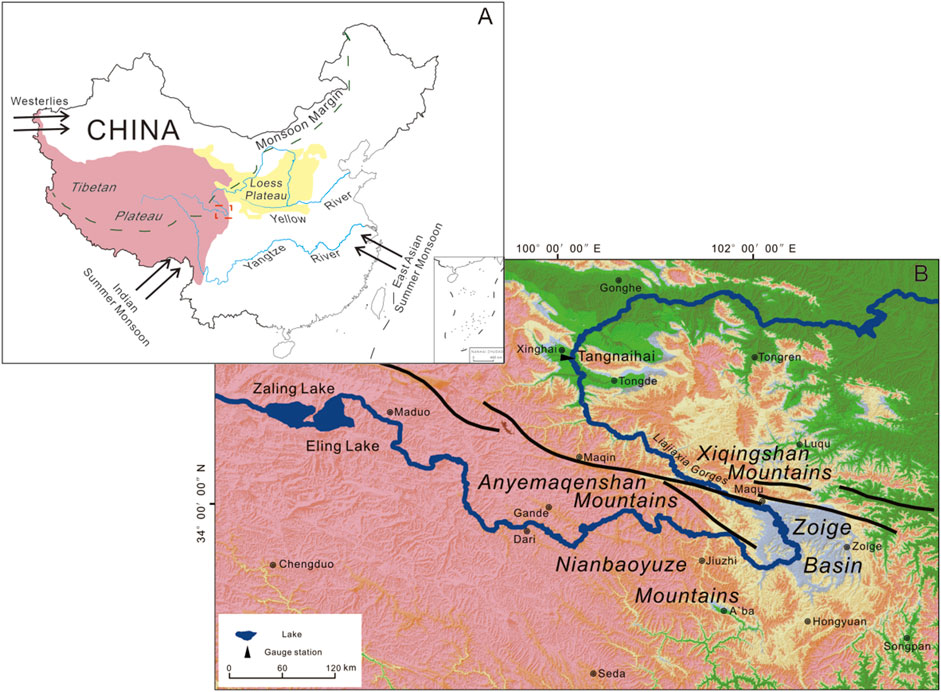
FIGURE 1. (A) Map showing the Maqu-Kesheng reach downstream of the Zoige Basin (red square) in the Yellow River source area on the NE Tibetan Plateau. (B) Map showing drainage basin, major fault zones (marked with ‘‘ ’’) (He et al., 2006) and topographical features of the Yellow River source area on the NE Tibetan Plateau.
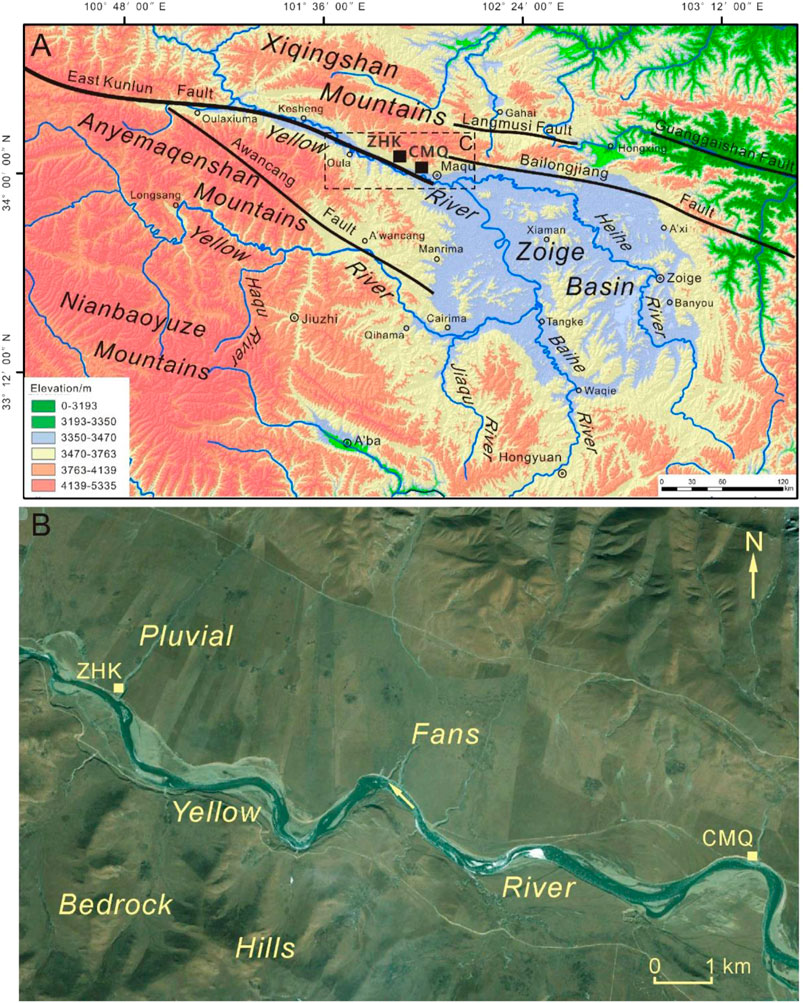
FIGURE 2. (A) Map showing the location of the CMQ and ZHK profiles (marked with ‘‘ ’’) in the Maqu-Kesheng reach downstream of the Zoige Basin. (B) Google Earth image showing the location and the landscape at the CMQ and ZHK profiles (marked with ‘‘
 ’’).
’’).
The Yellow River meets the Jiaqu, Baihe and Heihe Rivers within the basin, and flows northwest into the Maqu-Kesheng reach forming a huge U-shaped bend (Figure 2A). In the Maqu-Oula reach, the well-developed huge pluvial fans from the Xiqing Mountains forced the Yellow River to move southward to the foot of bedrock hills of the northern Anyemaqen Mountains (Figure 2B). However, in the Oula-Kesheng reach, the huge pluvial fans from the Anyemaqen Mountains forced the Yellow River to move northward to the foot of bedrock hills of the Xiqing Mountains.
The climate in the Yellow River source area is sub-humid and semi-arid area characterized by low temperatures, drastic seasonal variations in precipitation, frequent strong winds, high evaporation, and strong solar radiation. The mean annual temperature varies between -3.5°C and 2.4°C from southeast to northwest (1961-2014) (Shi et al., 2018). The mean annual precipitation ranges from 753.3 mm in the southeast to ca. 322.3 mm in the northwest (1961-2014) (Shi et al., 2018). Up to 75%-90% precipitation occurs between June and September because of the alpine hydro-climatic conditions with high seasonal variability. In addition, mean annual potential evaporation is 884.4 mm in the area (2000-2014) (Shi et al., 2018).
The Yellow River source area is often referred to as the water tower of the Yellow River as it contributes about 35% of the total annual runoff of the entire Yellow River (Hu et al., 2011). The area is covered with mountain glaciers, permafrost, snow, wetlands, lakes and grasslands, etc., forming a unique hydrological ecosystem. This causes extraordinary floods in the area with mixed recharge in the catchment derived from precipitation, snow melting and glacier ablation (LiG F et al., 2013). The hydrological data observed at the TNH gauge station show that the mean annual runoff volume is 1.78×10¹⁰ m3, and the mean annual sediment concentration is 0.60 kg/m3 (1991-2011) (Li et al., 2014). The gauged maximum flood discharge since 1955 is 5,450 m3/s, which occurred in September 1981 (Peng et al., 2014).
3 Sampling sites and methods
3.1 Sampling sites
The Maqu-Kesheng reach in the Yellow River source area, is located in the downstream of the Zoige Basin and upstream of the Lajia Gorges (Figures 1, 2). The river valley is ca. 4-5 km in width developed along the East Kunlun Fault extending WNW-ESE between the Anyemaqen Mountains and the Xiqing Mountains (Zhou et al., 2021). Sediment sequences consist of aeolian loess-soil deposits, glacial outwash/flashflood deposits and periglacial slope deposits are widely distributed on the cliff river banks in the river reach. According to a variety of sedimentological criteria used in paleoflood hydrology (Benito et al., 2008; Huang et al., 2011), two units of overbank flood deposits (OFD) inserted into the large clastic sediments deposited from glacial outwash or flashflood have been identified on the right bank adjacent to Chameiqu (CMQ) and Zuhaka (ZHK) sites (Figure 3A,B). These sedimentological criteria include 1) sediment consisting of silt and medium sand with parallel beddings; 2) abrupt vertical change in color, grain size, texture and structure; 3) stratigraphic breaks between the beds; 4) a thin clay cap on top of a bed resulting from sorted deposition (Supplementary Figure S1); 5) presence of clastic sediments deposited from glacial outwash or flashflood between the units. The top of sediment profile at the CMQ site (102°0′30.5″ E, 33°59′36.8″ N; 3,341 m a.s.l.) is about 28 m above the normal water level of the Yellow River. The ZHK site is located ca. 13.5 km downstream from the CMQ site (Figure 2B). The front of the sediment profile at the ZHK site (101°53′9.9″ E, 34°1′13.6″ N; 3,437 m a.s.l.) is ca. 29 m above the normal water level of the Yellow River.
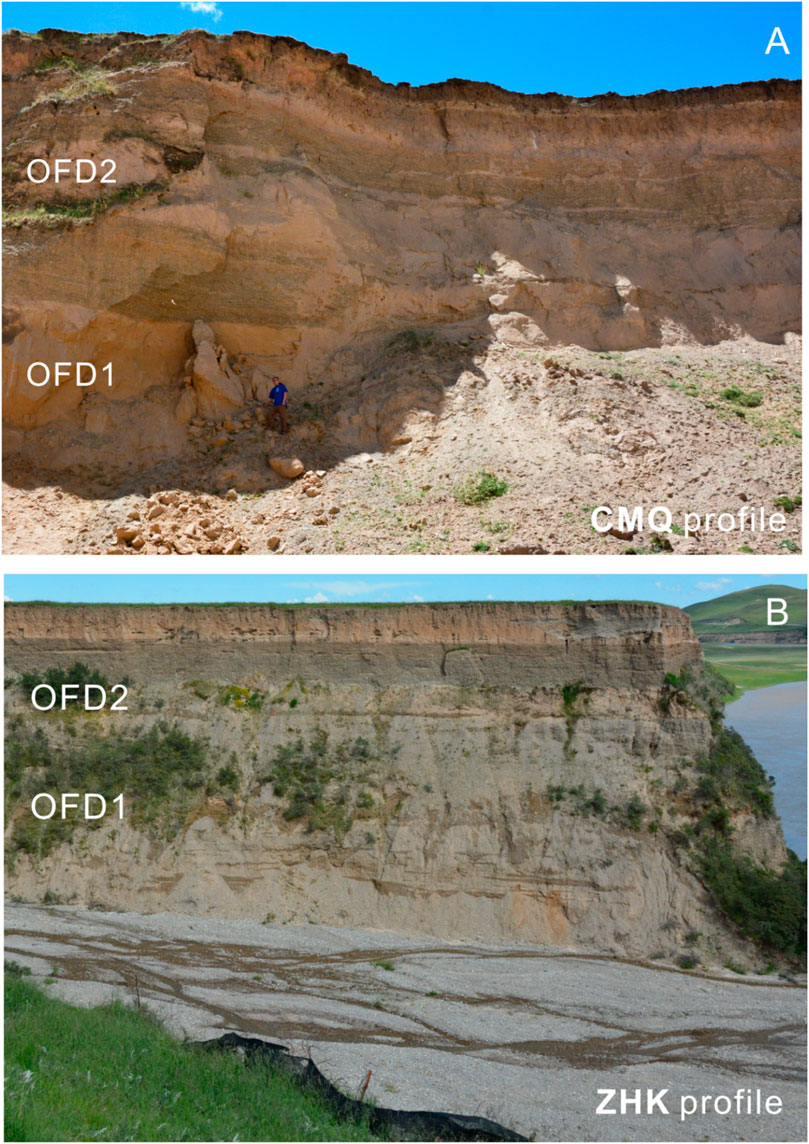
FIGURE 3. Photo showing the overbank flood deposits within the sediment profiles at the CMQ and ZHK sites in the Yellow River source area on the NE Tibetan Plateau.
Pedo-stratigraphic subdivisions and sedimentological characteristics in the sediment sequences at the CMQ and ZHK sites were observed and described in detail during the fieldwork (Figure 3A,B; Tables 1, 2). After detailed observations and establishment of pedo-stratigraphical subdivisions, 228 bulk samples for sedimentary analysis were collected from modern soil, paleosol, loess, OFD units and paleochannel deposits in these two profiles. Four bulk samples for micro-morphological feature analysis were taken from paleosol, OFD1 unit in the CMQ profile and aeolian loess, OFD1 unit in the ZHK profile, respectively. Sixteen luminescence samples for OSL dating and nine organic sediment samples were collected from the ZHK and CMQ profiles according to the location of the lithostratigraphic boundaries (Table 3 and Table 4).
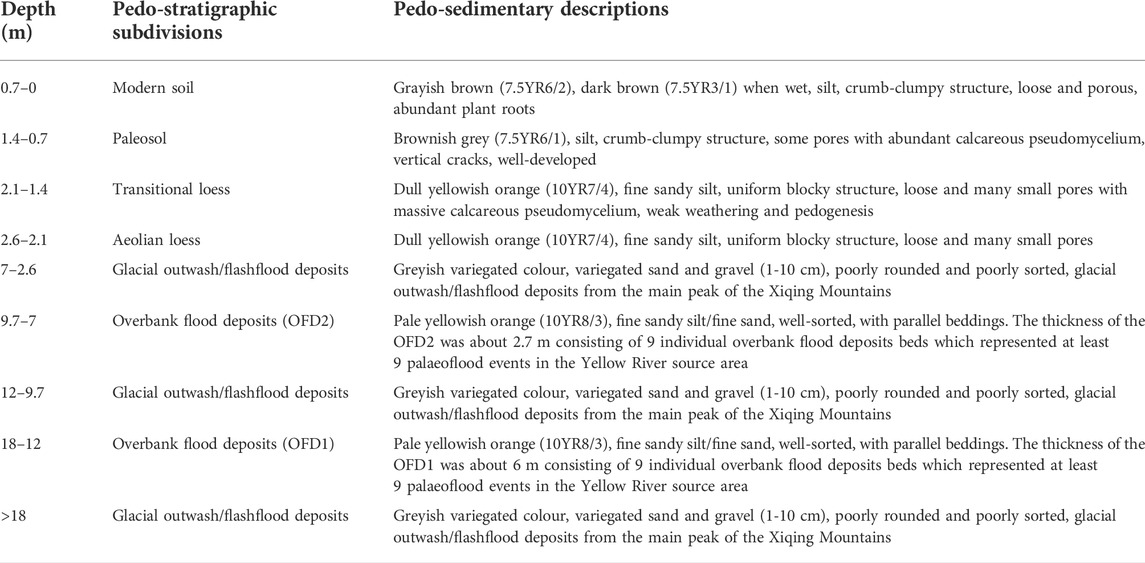
TABLE 1. Pedo-stratigraphic subdivisions and descriptions of the CMQ profile in the Yellow River source area on the NE Tibetan Plateau.
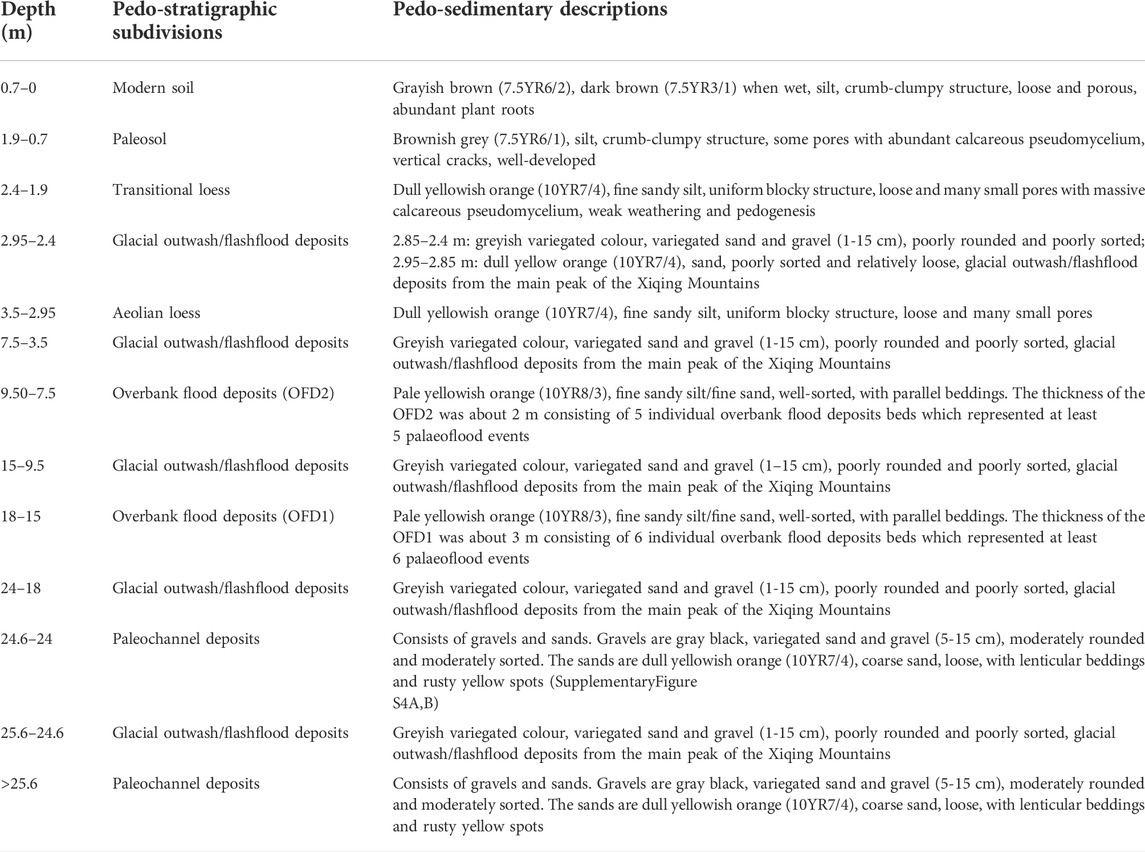
TABLE 2. Pedo-stratigraphic subdivisions and descriptions of the ZHK profile in the Yellow River source area on the NE Tibetan Plateau.
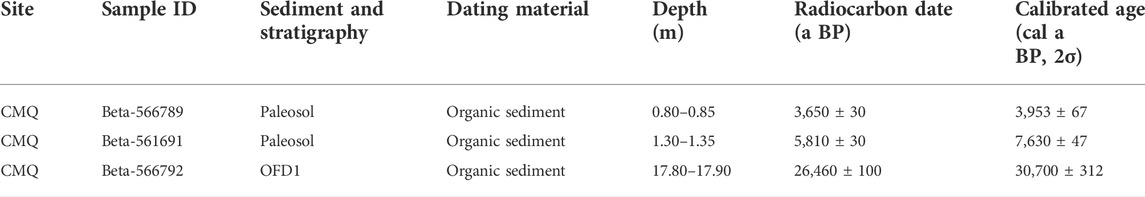
TABLE 3. Calibrated radiocarbon dates of the CMQ and ZHK profile in the Yellow River source area on the northeast Tibetan Plateau.
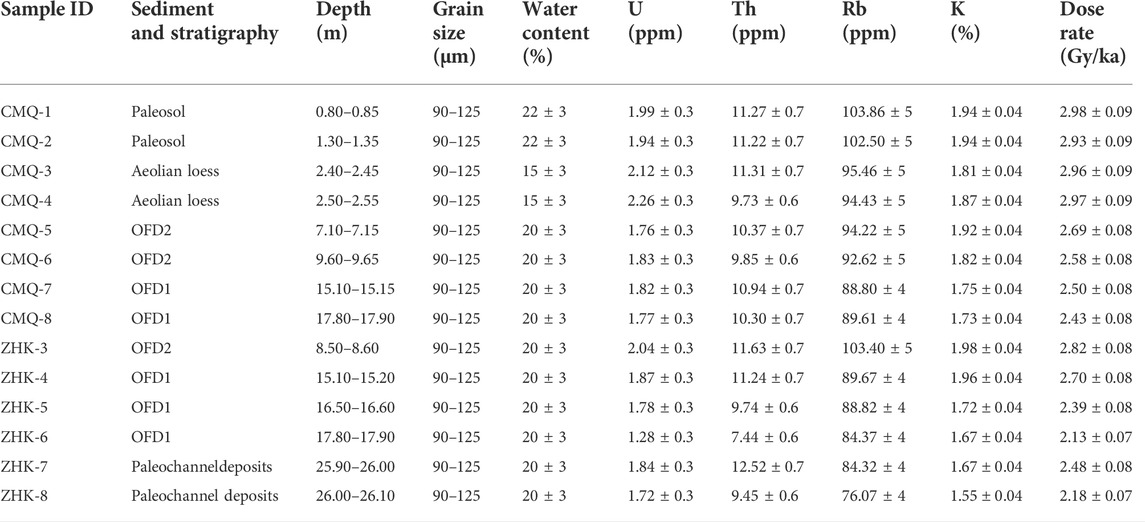
TABLE 4. Summary of the U, Th, K, Rb and dose rates for samples taken from overbank flood deposits (OFD), paleosol, aeolian loess, paleochannel deposits, glacial outwash/flashflood deposits in the CMQ and ZHK profiles in the Yellow River source area on the NE Tibetan Plateau.
3.2 Methods
3.2.1 Paleo-environmental proxy analysis
Magnetic susceptibility can indicate the concentration of ferromagnetic minerals in the sediments and used for manifesting the changing intensity of weathering and pedogenic modification to accumulated dust in semi-humid and semi-arid regions (Liu, 1985; Kukla and An, 1989; Liu et al., 1993; Maher, 1998). Magnetic susceptibility was measured on a mass of 10 g of ground sediment with a Bartington MS-2B magnetic susceptibility meter (0.47/4.7 kHz) under the condition of no interference from magnetic objects.
Hygroscopic water concentration is closely related to the distribution of sediment grain size, which can indirectly reflect the intensity of soil weathering and pedogenisis as well as climate change (Huang, 2001; Zhao et al., 2012). The determination of hygroscopic water concentration is that 5 g of dried soil sample is put in an aluminum box and baked at 105°C for more than 24 h to constant weight, and then the percentage of hygroscopic water content is calculated.
Grain size distribution can be used to differentiate the paleoflood deposits from other kinds of sediments in the river valley (Zha et al., 2015; Mao et al., 2016; Zhang et al., 2019; Chen et al., 2021). Grain size distribution was analyzed using a LS13320 laser analyzer with (NaPO3)6 as a dispersing agent after pre-treatment with 30% H2O2 and 10% HCl to remove organic matter and carbonates, respectively.
Micro-morphological features can provide the key information that enables reconstruction of the pedo-sedimentary processes and associated paleoclimatic controls responsible for the formation of pedocomplexes (Kemp 1999; Przemyslaw, 2013; Zhang et al., 2018). The micro-morphological feature was observed under the Leica-DMRX polarizing microscope.
3.2.2 Optically stimulated luminescence and AMS 14C dating
Sixteen OSL samples were prepared under subdued red light in the OSL laboratory in the Shaanxi Key Laboratory of Earth Surface System and Environmental Carrying Capacity, Xi’an. The outer 2-3 cm of deposits within the sample tubes were removed and reserved for measurement of U, Th, K and Rb concentrations. The remaining deposits within the tube were pretreated with 30% H2O2 (to remove organic materials), 10% HCl (to dissolve carbonates), and wet sieving to obtain the 90-125 μm grain fractions from the paleosol, transitional loess, aeolian loess, OFD and paleochannel deposits. And the 90-125 mm grain fractions were etched with 40% HF for 50 min (followed by an HCl rinse) to remove the outer (alpha-irradiated) layer of quartz grains and to eliminate feldspars.
Optically stimulated luminescence (OSL) dating was carried out on a Risø-TL/OSL-DA20 Dating System using the single-aliquot regenerative-dose (SAR) protocol (Murray and Wintle, 2000). The Risø-TL/OSL-DA20 Dating System was equipped with a new automated detection and stimulation head (DASH). The automated DASH includes blue LEDs (470 nm, ∼80 mW/m2), green LEDs (525 nm, ∼40 mW/m2) and infrared LEDs (850 nm, ∼300 mW/m2). Laboratory irradiation was carried out using 90Sr/90Y sources mounted on the reader. The OSL signal was detected using an ET PDM 9107Q-AP-TTL-03 photomultiplier tube in combination with a 7.5 mm thick Hoya U-340 glass filter and calculated by subtracting the average of the last 4 s (background signal) from the first 0.8 s of the signal decay curve (Figure 4). The OSL signals of the samples taken from the paleosol, transitional loess, aeolian loess, OFD and paleochannel deposits show rapid decay dominated by the fast component of the signal (Murray and Wintle, 2003). A preheat temperature of 220°C and a cut-heat of 180°C were selected for the regeneration and test doses, respectively, in routine equivalent dose (De) determination (Jia et al., 2022). All sensitivity-corrected dose response curves were fitted with saturating-exponential function to calculate De values using the software Analyst (Duller, 2015) (Figure 4).
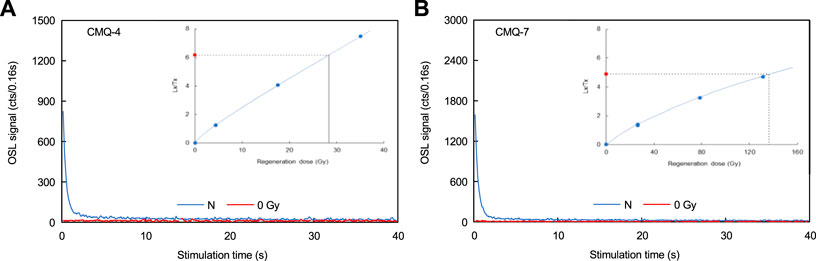
FIGURE 4. Growth and decay curves for the samples (A) CMQ-4 and (B) CMQ-7 from the CMQ and ZHK profiles in the Yellow River source area on the NE Tibetan Plateau.
In order to explain the distributions of De values and analyze the factors affecting the scatter in De, such as partial bleaching, post-depositional mixing or a combination of these, we used the R package ‘Luminescence’ (Kreutzer et al., 2012) that offers plot_KDE() (KDE: kernel density estimates) (Figure 5) and radial plots (Supplementary Figure S3) for dose distribution visualization to assess the luminescence samples. In addition, another approach is based on the assumption that partially bleached samples show not only a large scatter of De values but also a trend of rising paleodose with increasing OSL intensity. This can be identified by plotting the sensitivity corrected OSL signal against the corresponding De value (Li, 2001) (Supplementary Figure S4).
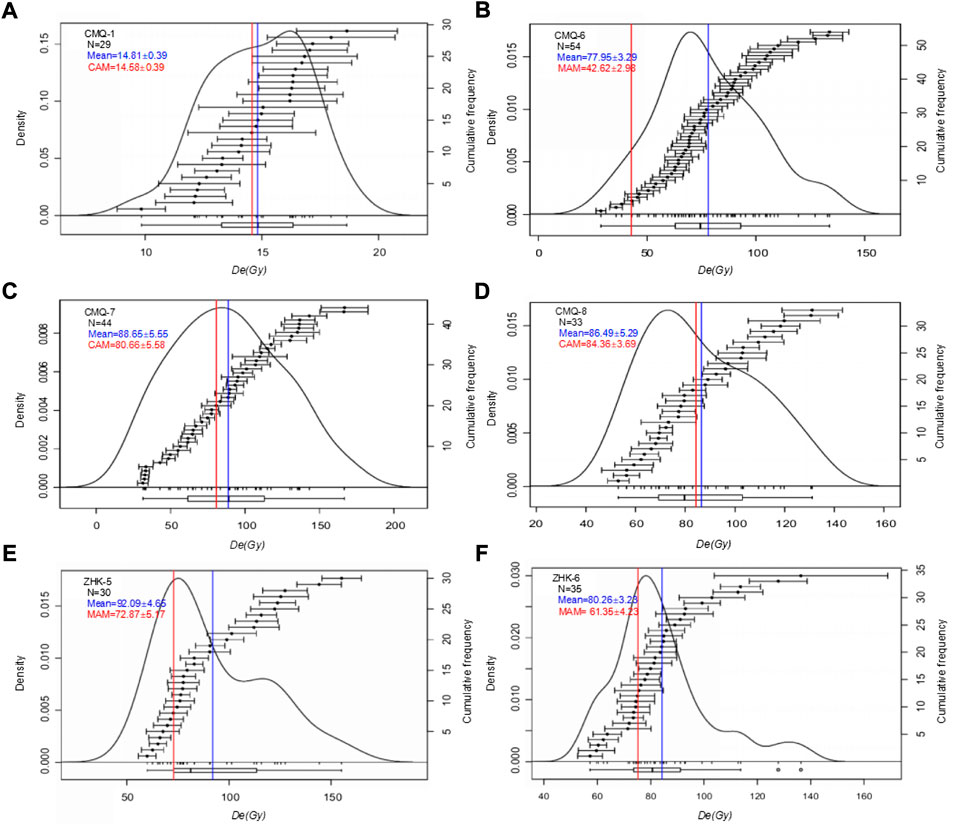
FIGURE 5. Plot_KDE() (KDE: kernel density estimates) for sample (A) CMQ-1, (B) CMQ-6, (C) CMQ-7, (D) CMQ-8 and (E) ZHK-5, (F) ZHK-6 from the CMQ and ZHK profiles in the Yellow River source area on the NE Tibetan Plateau.
The central age model (CAM) and the minimum age model (MAM) were used to estimate the burial dose in this study (Galbraith et al., 1999). We used a formal decision process for selecting between these models, based on values of sample statistics such as overdispersion (OD), skewness (sk), kurtosis (Kg) and relative standard deviation (RSD) (Arnold et al., 2007). The CAM is used for estimating De values of well-bleached samples such as CMQ-1, CMQ-2, CMQ-3 and CMQ-4 with low OD values (<15%). In addition, the samples CMQ-7, CMQ-8 and ZHK-7 with high OD values (>15%) and a broad range of De values, but which display only slight asymmetry. The CAM is also appropriate for calculating De values for these samples (Arnold et al., 2007). However, other samples such as CMQ-5, CMQ-6, ZHK-3, ZHK-4, ZHK-5, ZHK-6 and ZHK-8 with high OD values (>15%) and asymmetric and/or positively skewed De values indicate incomplete zeroing and the MAM is more appropriate for calculating De values for these samples (Arnold et al., 2007) (Figure 5 and Table 5).
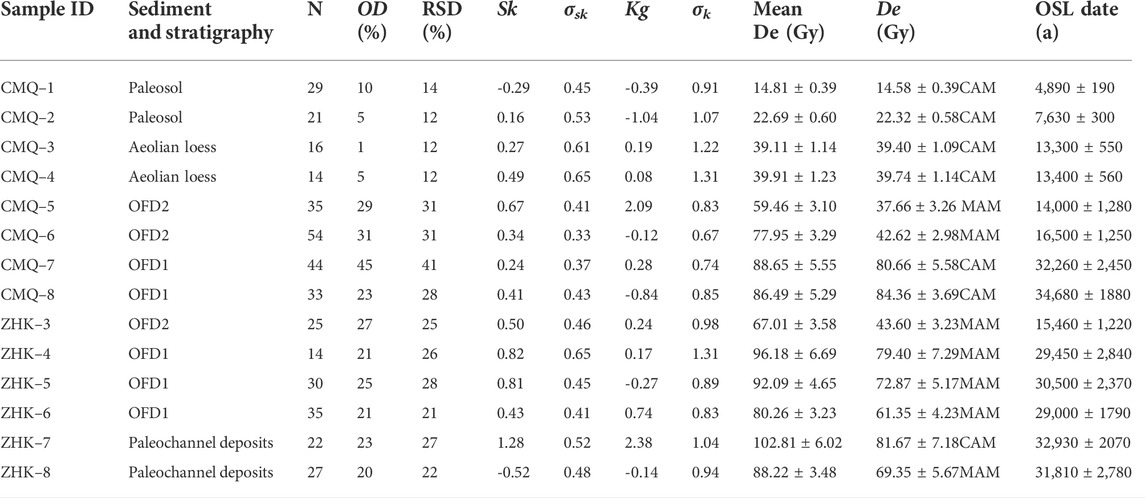
TABLE 5. The equivalent dose values and OSL ages for samples taken from overbank flood deposits (OFD), paleosol, aeolian loess, paleochannel deposits, and glacial outwash/flashflood deposits in the CMQ and ZHK profiles in the Yellow River source area on the NE Tibetan Plateau.
The U, Th and Rb concentrations were measured by a Thermo Fisher iCAP 7,400 inductively coupled plasma-optical emission spectrometer (ICP-OES). And the K concentration was analyzed by a Thermo Fisher iCAP RQ inductively coupled plasma mass spectrometer (ICP-MS) (Table 4). The cosmic-ray dose rate was estimated for each sample as a function of depth, altitude and geomagnetic latitude (Prescott and Hutton, 1994). The total dose rates were calculated using the conversion factors of Guerin et al. (2011). The water content was estimated from field measurements of the water content when collected and the saturation water content.
AMS 14C dating was measured in the Beta Analytic Radiocarbon Dating Laboratory in America, and the Calib 8.20 procedure and IntCal20 Northern Hemisphere radiocarbon age calibration curve were used for age correction (Stuiver and Reimer, 1993; Reimer et al., 2020).
4 Results and interpretations
4.1 Geophysical features
The variation curve of magnetic susceptibility is very similar to that of hygroscopic water in the CMQ profile in the Yellow River source area (Figure 6 and Table 6). The higher values of magnetic susceptibility (37.60×10⁻⁸-78.20×10⁻⁸ m3/kg, 85.80×10⁻⁸-114.10×10⁻⁸ m3/kg) and the hygroscopic water (1.13%-1.83%, 1.52%-2.04%) are shown in the paleosol and modern soil, suggesting the intensified pedogenic modification to the accumulated dust (Jia et al., 2022). The lower values of magnetic susceptibility (29.50×10⁻⁸-34.60×10⁻⁸ m3/kg, 29.70×10⁻⁸-39.30×10⁻⁸ m3/kg) and hygroscopic water (0.85–0.95%, 0.91–1.11%) in the loess levels (aeolian loess, transitional loess) indicating that they remained as accumulated dust and experienced very weak weathering and pedogenesis processes. The lowest values of magnetic susceptibility (10.10×10⁻⁸–28.60×10⁻⁸ m3/kg, 16.00×10⁻⁸-25.00×10⁻⁸ m3/kg) and hygroscopic water (0.37%-0.96%, 0.28%-0.54%) occur in the overbank flood deposits (OFD1, OFD2). This shows that these sediments were deposited in a very short period of time and preserved immediately after the flood recession.
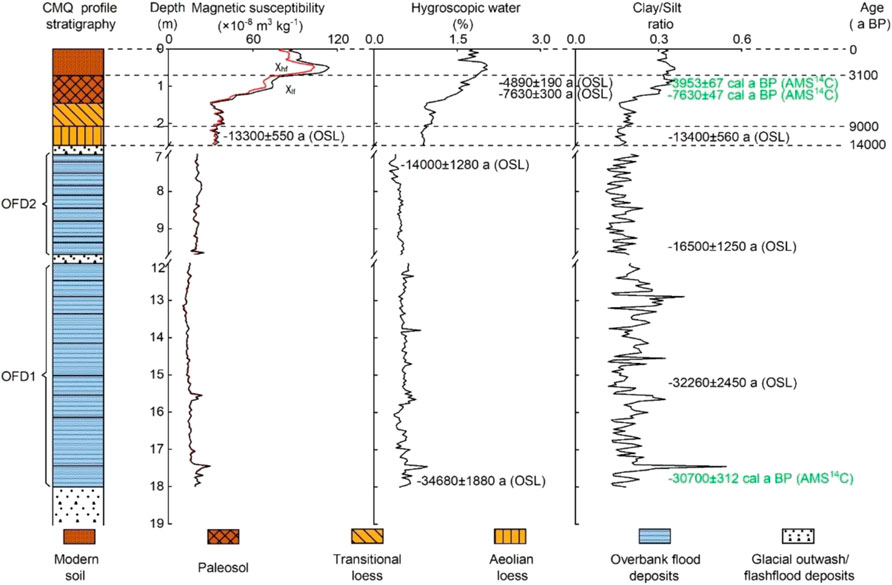
FIGURE 6. Pedo-stratigraphy, magnetic susceptibility, hygroscopic water concentration, clay/silt ratio in the CMQ profile in the Yellow River source area on the NE Tibetan Plateau.
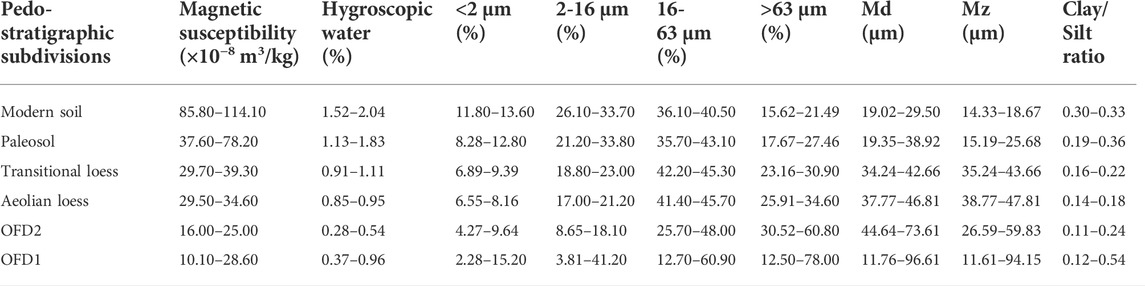
TABLE 6. Magnetic susceptibility, hygroscopic water concentration and grain size distribution in the Yellow River source area on the NE Tibetan Plateau.
The grain size distribution and the statistical indices of these sediments in the CMQ profile are shown in Figure 7, Supplementary Figure S5 and Table 6. The variation curves of clay/silt ratio, clay (<2 μm) and fine silt (2-16 μm) concentrations are consistent with that of magnetic susceptibility and hygroscopic water. They are generally high in the paleosol/modern soil and low in the aeolian loess/transitional loess. That is, the paleosol and modern soil have a higher clay content because of pedogenic alteration of the accumulated aeolian dust. The sand (>63 μm) content is low in the paleosol/modern soil and high in the aeolian loess/transitional loess. It can be inferred that the loess levels with an increased sand content have recorded extremely intensified aeolian activity over the river valley, which resulted from the incursion of some fluvial deposits and slope clastics into the loess (Li et al., 2018). The sand (>63 μm) content of the OFD units is the highest in the profile, inferring that the overbank flooding with strong transporting energy that can carry coarse sediments.
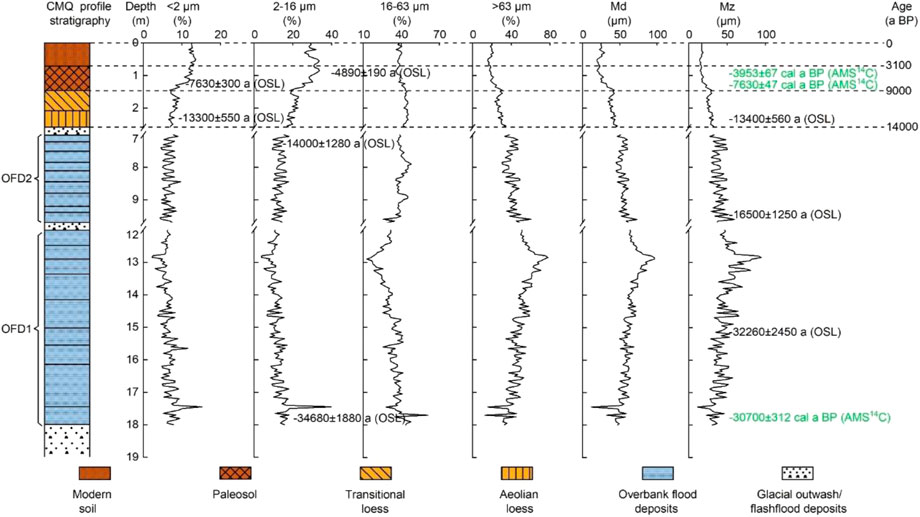
FIGURE 7. Pedo-stratigraphy and grain size distribution in the CMQ profile in the Yellow River source area on the NE Tibetan Plateau.
Grain size distribution frequency curves of the CMQ profile are shown in Figure 8A and Figure 8B. Compared to the grain size distribution frequency curves of aeolian loess and transitional loess, the paleosol and modern soil in the CMQ profile present three peaks centered at: (i) 30-80 μm (peak 1); (ii) 2-10 μm (peak 2); and (iii) 200-300 μm (peak 3) (Figure 8A). It shows that the content of secondary clay and fine silt are increasing under the influence of pedogenic alteration (Chen et al., 2021). Therefore, the paleosol and modern soil are defined as silt. It is also mixed with some fluvial deposits and slope clastics carried by valley wind from the nearby area (Li et al., 2018; Jia et al., 2022). The grain size distribution frequency curves of the upper and lower of the paleochannel deposits are significantly different, and their major peak centered at 25-75 μm and 90-200 μm, respectively. The shape of grain size distribution curves of the OFD units are very different from that of the aeolian loess/soil as well as paleochannel deposits, and are clearly shifted to the coarse side (Figure 8B). It shows a high-narrow major peak centered at 50-120 μm. The OFD1 and OFD2 units are classified as sandy silt or sand. The grain size indices, such as mode (Md), mean (Mz), skewness (Sk), and kurtosis (Kg), sorting (S) values also differentiate the OFD units, aeolian loess/soil and paleochannel deposits well in the profile (Supplementary Figure S5).
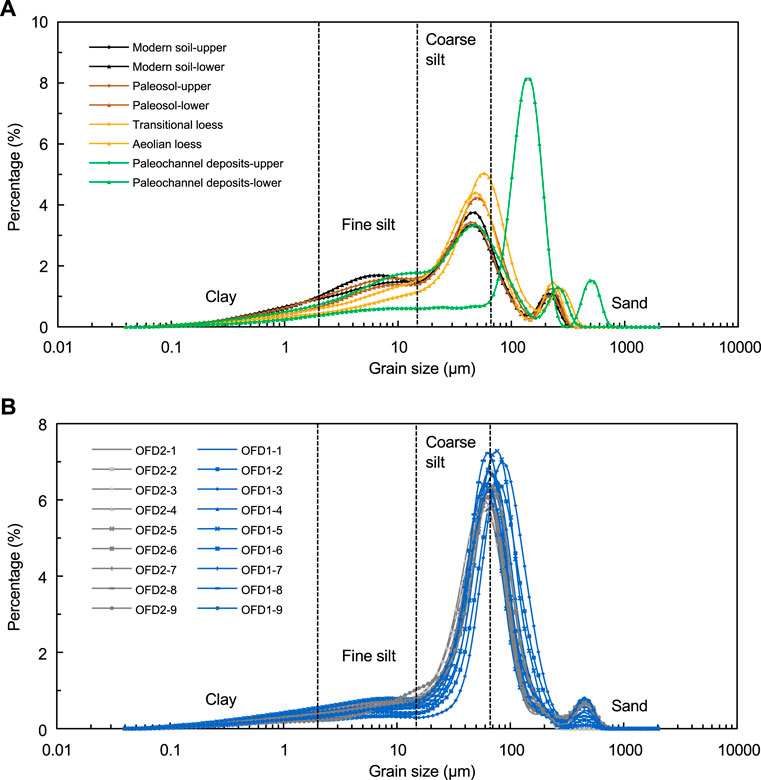
FIGURE 8. A comparison of grain size distribution frequency curves among (A) aeolian loess-paleosol deposits and Paleochannel deposits, (B) prehistoric overbank flooding deposits (OFD) in the CMQ profile in the Yellow River source area on the NE Tibetan Plateau.
The micro-morphological features of the thin sections observed by the polarizing microscope can clearly differentiate the overbank flood deposits (OFD) from the aeolian loess/soil in the CMQ and ZHK profiles (Figure 9). The paleosol is characterized by round to sub-round coarse grains, high porosity and medium abundance of secondary calcite crystallite (pseudomycelia) in the pores (Figure 9A). The loess is characterized by angular to sub-angular coarse grains, simple packing bio-pores (Figure 9B). However, the OFD units consist of coarser well-rounding grains (Figure 9C and Figure 9D). Their distribution is very loose and the grain size is relatively uniformity, manifesting that they were mainly deposited from suspended sediment load in floodwaters.
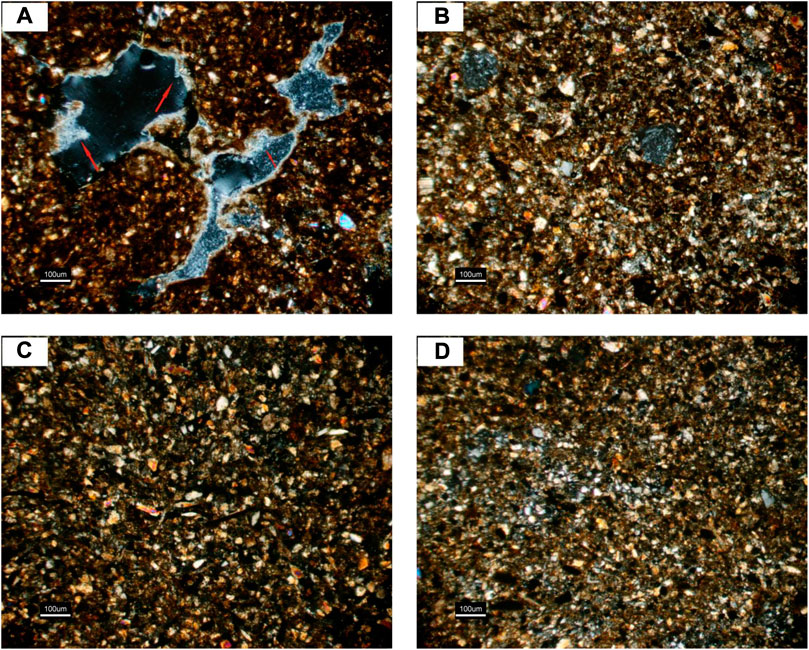
FIGURE 9. Micro-morphological features in the ZHK and CMQ profiles in the Yellow River source area on the NE Tibetan Plateau. (A) Micro-morphological features of the paleosol in the CMQ profile with needle-shaped secondary-calcite (10 × 5, crossed polarized light); (B) Micro-morphological features of the aeolian loess in the ZHK profile (10 × 5, crossed polarized light); (C) Micro-morphological features of the overbank flooding deposits (OFD1) in the CMQ profile (10 × 5, crossed polarized light); (D) Micro-morphological features of the overbank flooding deposits (OFD1) in the ZHK profile (10 × 5, crossed polarized light).
4.2 OSL and AMS14C ages
As shown in Figure 10, the pedo-stratigraphy in the CMQ profile is well synchronous with the ZHK profile in the Yellow River source area. Overall, the OSL and AMS14C ages at the same level in the CMQ and ZHK profiles are consistent (Figure 10). The OFD1 unit was found at the depth range of 12.00–18.00 m in the CMQ profile and 15.00–18.00 m in the ZHK profile. OSL ages from the middle (15.10–15.15 m) and the bottom (17.80–17.90 m) of the OFD1 in the CMQ profile are 32,260 ± 2,450 a and 34,680 ± 1880 a, respectively. In addition, the similar AMS14C age (30,700 ± 312 cal a BP) is also obtained from the bottom of the OFD1 in the CMQ profile. And the top, middle and bottom of OFD1 in the ZHK profile were OSL dated to 29,450 ± 2,840 a, 30,500 ± 2,370 a and 29,000 ± 1790 a, respectively. The first episode of overbank flooding was therefore within a bracket of 34,680 ± 1880-29000 ± 1790 a. The OFD2 unit was identified at the depth range of 7.00–9.70 m in the CMQ profile and 7.50–9.00 m in the ZHK profile. The top (7.10–7.15 m) and the lower (9.60–9.65 m) of the OFD2 unit in the CMQ profile were OSL dated to 14,000 ± 1,280 a and 16,500 ± 1,250 a, respectively. The middle (8.50–8.60 m) of the OFD2 unit in the ZHK profile yielded an OSL age of 15,460 ± 1,220 a. It can be concluded that the second episode of overbank flooding occurred at 16,500 ± 1,250-14000 ± 1,280 a.
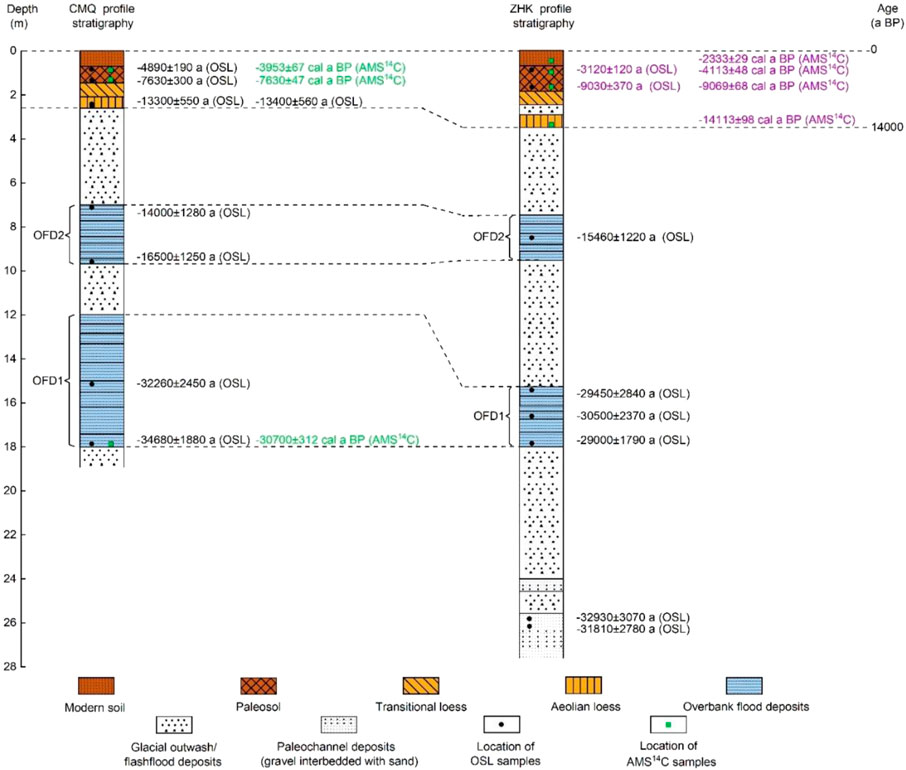
FIGURE 10. Pedo-stratigraphy and chronostratigraphic framework of the CMQ and ZHK profiles in the Yellow River source area on the NE Tibetan Plateau. [The dating data indicated in purple is taken from Jia et al. (2022)].
5 Discussion
5.1 The first episode of overbank flooding
The first episode overbank flooding occurred at 34,680 ± 1880-29000 ± 1790 a that correlated with the late Marine Isotope Stage 3a (MIS 3a) (Imbrie et al., 1984; Shi and Yu, 2003; Pu et al., 2010; Chen et al., 2014). Previous studies have shown that Asian summer monsoon is highly sensitive to the insolation difference caused by the earth orbital change (Prell and Kutzbach, 1992). During the period of MIS 3a, the incident radiation in the region between 50°N and 30°S was 20 W/m2 higher than that of modern and the increase in the incident radiation resulted in the rise of air temperature (Shi et al., 1999) (Supplementary Figure S6), which led continental ice sheets retreated significantly, mountain glaciers melted and sea levels rose (Wang and Yao, 2002). Especially in the Yellow River source area, rising temperatures will inevitably lead to the melting of surrounding mountain glaciers. In addition, due to increased heat input, the difference of thermal properties between land and sea increases, the East Asian summer monsoon (EASM) as well as the evaporation of the tropic and sub-tropic Indian Ocean surface was strengthened. At the same time, the cross-equatorial airflow moving towards the Northern Hemisphere may intensify the Indian summer monsoon (ISM). The ISM and EASM carried a large amount of moisture as moving over the ocean surface and formed the exceptionally strong summer monsoon on the Tibetan Plateau, which formed a large area of abundant precipitation (Shi et al., 1999).
Climate proxies in all over the world sensitively recorded the warm and wet climate characteristics during this period (Figure 11). Solar radiation in summer at 65°N (Berger and Loutre, 1991), <4 μm grain fractions of Shijiu Lake core (Wang, 2016), TOC content of cores LV53-23 in the Japan Sea (Zong, 2016), δ18O concentration in Guliya ice core (Yao et al., 1997), δ18O concentration in GRIP2 (Grootes et al., 1993; Stuiver and Grootes, 2000), CPIh, ACLh and pollen concentrations in Qarhan Salt Lake sediments (Pu et al., 2010) and simulated precipitation in Central Asia (Li X Z et al., 2013) were all higher during the MIS 3a. But the Mz of the Jingyuan loess profile (Wang, 2016), the Md of the South China Sea SO17940 core (Wang, 2016) and the δ18O concentration of the Hulu Cave Stalagmite (Wang et al., 2001) are lower in this period, indicating that the global climate was mainly warm and wet during the MIS 3a.
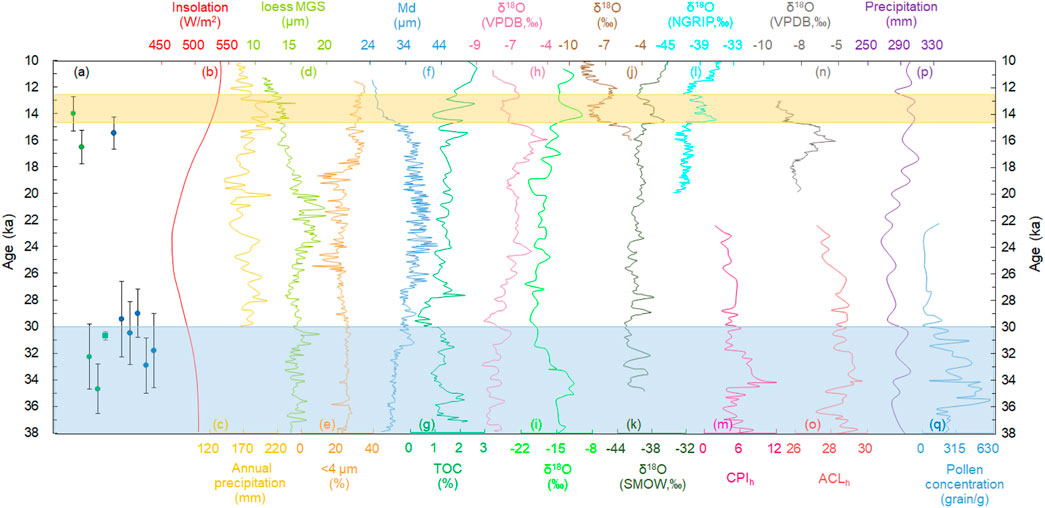
FIGURE 11. (A) The ages of OFD units in CMQ and ZHK profiles (Green and blue dots represent the OSL ages of CMQ and ZHK profile respectively; The green square represents AMS 14C age of the CMQ profile), (B) Variation curve of solar radiation in summer at 65°N (Berger and Loutre, 1991), (C) precipitation reconstructed from rock core in Balikun Lake (Zhao, 2017), (D) The Mz of the Jingyuan loess profile (Wang, 2016), (E) <4 μm grain fractions of Shijiu Lake core (Wang, 2016), (F) The Md of the South China Sea SO17940 core (Wang, 2016), (G) TOC content of cores LV53-23 in the Japan Sea (Zong, 2016), (H) The δ18O concentration of the stalagmite in Hulu Cave (Wang et al., 2001),(I) The δ18O concentration in Guliya ice core (Yao et al., 1997), (J) The δ18O concentration of the stalagmite in Dongge Cave (Dykoski et al., 2005), (K) The δ18O concentration in GRIP2 (Grootes et al., 1993; Stuiver and Grootes, 2000), (L) The δ18O concentrations in Greenland ice cores (Basak et al., 2018), (M) The CPIh in Qarhan Salt Lake sediments (Pu et al., 2010), (N) The δ18O concentration of the stalagmite in Haozhu Cave (Zhang et al., 2016), (O) The ACLh in Qarhan Salt Lake sediments (Pu et al., 2010), (P) The simulated precipitation in Central Asia (Li X Z et al., 2013), (Q) The pollen concentrations in Qarhan Salt Lake sediments (Pu et al., 2010) (The blue and yellow rectangles represent MIS3a and Bøling-Allerød stages respectively).
In addition, high-resolution climatic proxies in the Tibetan Plateau and its surrounding areas record the warm and wet climatic characteristics in the MIS 3a. For example, the profiles containing trees and neutral herbaceous pollen in Qinghai Lake Basin, NE Tibetan Plateau, increased significantly at 39,000-26000 a, reflecting a relatively warm and humid environment (Shan et al., 1993). The profile in the eastern Bangong Co. paleolake on the western Tibetan Plateau was the most abundant in pollen and types at 36,000-28000 a, indicating that the climate was warmer and wetter than the present (Huang et al., 1989). The paleontological fossils of pelobranchids, gastropods and ostracids in the shell deposits on the east of Qarhan Salt Lake indicate that the lake was fresh-brackish water at 38,000-28050 a BP, and the lake area was larger and the lake surface was higher during this period, which was about 2.56 times as large as the modern one (Chen and Bowler, 1985). The Baijian Lake in the tengger desert on the north of the Tibetan plateau appeared a high lake level 30 m higher than the modern lake level in 39,000–23000 a BP, suggesting that precipitation generally increased in the Tibetan Plateau during this period (Pachur et al., 1995; Li, 2000; Li et al., 2008). The δ18O curve of Guliya ice-core in west Kunlun shows that the temperature is the highest in the MIS3a, the temperature and precipitation at this period are 2-4 °C and 40%-100% higher than those in modern, respectively (Shi et al., 2002, 1999). All these evidences indicated that the Tibetan Plateau had a warm and wet climate between 34,680 ± 1880 and 29,000 ± 1790 a.
Previous studies have shown that during the last glacial period, the ancient glaciers of the Anyemaqen Mountains may have reached the Yellow River, with an altitude of 2,650 m at the end and a snow line of 4,125 m (Kuhle et al., 1987). The total glacier area of Qiequ valley on the eastern slope and Zhihaidai valley on the western slope is 156.7 km2 (Deng et al., 2004). In addition, geological and chronological evidence of glacial advance has been found at multiple sites on the Tibetan Plateau and surrounding mountains during the MIS 3b (Zhao et al., 2007; Wang, 2010). Significant glacial advance also took place in Anyemaqen and Nianbaoyuze Mountains during the MIS 3b (Owen et al., 2003, 2006). In both regions, glaciation was most extensive during the MIS3 (Anyemaqen and Jiukehe Glacial Stages) (Zheng et al., 1994; Lehmkuhl, 1998), which was represented by expanded ice caps and long valley glaciers that advanced ∼15 km beyond the present glacier margins (Owen et al., 2003). However, mountain glaciers are very sensitive to temperature changes (Ali et al., 2015). With the advent of MIS 3a, the climate became warm-humid, and the mountain glaciers around the Yellow River Source area are bound to melt in large quantities. There are lateral moraines overtopped the surface of the lake on both sides of Ximen Co Lake on the NE Tibetan Plateau, and the moraines at both ends are obviously higher than the front of the lake. The age of aeolian loess on the moraine ridge is 32,000 ± 3,000 a, which indicates that the glacier had begun to retreat before that period (Lehmkuhl, 1998). There are many moraine ridges in the 6-10 km north of the Ximen Co Lake, and the age of exposure moraine above them indicates that the glaciers retreat at 42,000-19000 a BP (Owen et al., 2003). Therefore, we have reason to believe that during the MIS 3a period with a very warm and humid climate, the water mainly derived from the accelerated melting of mountain glaciers from both sides and/or the large-scale precipitation flowed into the Yellow River source course, resulting in the overbank flooding. Moreover, the overbank flooding carried abundant sediment, which covered the glacial outwash/flashflood deposits, and intensified the channel accretion.
5.2 The second episode of overbank flooding
The second episode overbank flooding recorded by OFD2 unit in the CMQ and ZHK profiles was dated to 16,500 ± 1,250-14000 ± 1,280 a, which is coincided with the Bølling-Allerød warm and humid period (Dykoski et al., 2005; Basak et al., 2018) of the last deglaciation (19,000-11000 a BP) (Pedro et al., 2011; Clark et al., 2012). At that time, the incident radiation in the northern hemisphere in summer was 20 W/m2 higher than that of present (Shi et al., 1999) (Supplementary Figure S6). Under this climate background, the increase of incident radiation would still result in the rise of air temperature in the Yellow River source area, which would lead to the massive melting of mountain glaciers. Beyond that, the increase of incident radiation would expand the difference of thermal properties between land and sea, which would contribute to intensifying the EASM and increasing precipitation on the Tibetan Plateau.
Various climate proxies around the world also have been recorded the climate characteristics of the period (Figure 11). Solar radiation in summer at 65°N (Berger and Loutre, 1991), precipitation reconstructed from rock core in Balikun Lake (Zhao, 2017), <4 μm grain fractions of Shijiu Lake core (Wang, 2016),TOC content of cores LV53-23 in the Japan Sea (Zong, 2016), δ18O concentration in Guliya ice core (Yao et al., 1997), δ18O concentration in GRIP2 (Grootes et al., 1993; Stuiver and Grootes, 2000), δ18O concentrations in Greenland ice cores (Basak et al., 2018) and simulated precipitation in Central Asia (Li G F et al., 2013) were all higher in 14,700–12500 a BP. The Mz of the Jingyuan loess profile (Wang, 2016), the Md of the South China Sea SO17940 core (Wang, 2016) and the δ18O concentration of the stalagmite in Hulu Cave (Wang et al., 2001), Dongge Cave (Dykoski et al., 2005) and Haozhu Cave (Zhang et al., 2016) are lower, indicating that the global climate was mainly warm and wet during this period.
The grain-size characteristics of Macheng profile on NE Jianghan Plain show that the temperature rose rapidly and the precipitation increased significantly at ca. 17,900-12050 a BP. And the climate is characterized by warm, wet and rainy as a whole (Zhang et al., 2020). High-resolution pollen records in the Dalianhai sediment cores on NE Tibetan Plateau show that tree pollen increased at 14,800–12900 cal a BP, indicating that forests developed in nearby mountains and the climate was warm and humid. In addition, the grassland coverage increases around Gonghe Basin (Cheng et al., 2010). In 14,100-12700 a BP, the Qinghai Lake vegetation changed from desert-steppe to forest-steppe, indicating a significant increase in temperature and humidity over the northeastern Tibetan Plateau during this period (Shen et al., 2005). Climate reconstruction of n-alkanes from Zabuye Lake cores in the Tibetan Plateau shows that woody plants are abundant and has a relatively warm climate in 15,600–12500 a BP (An et al., 2012; Jin, et al., 2015; Ling et al., 2017).
Previous studies have shown that during the Last Glacial Maximum (26,500-19000 a BP) (Clark et al., 2012), the global temperature was low, the glaciers were widely covered on the NE Tibetan Plateau, and the glacial advances of Anyemaqen and Nianbaoyuze mountains occurred during the Last Glacial Maximum. During this period, the glacial areas of Anyemaqen and Nianbaoyuze mountains were 8 and 206 times that of modern glaciers respectively. And their snow line height was 1,000 m lower than that of modern glaciers (Edward et al., 1991; Shi, 2022). However, since the last deglaciation, the global temperature has increased significantly. The mountain glaciers (or ice caps) on the NE Tibetan Plateau have inevitably melted in large quantities (Zhong et al., 2021). This large-scale meltwater event caused super floods in Europe, North and South America (Tomasson, 1996; Baker, 2013). The large-scale melting of the ice sheet also caused a large amount of meltwater to pour into the sea, which led the coastline retreated and the continental shelf was submerged. And the global average sea level rose substantially (Huang and Tian, 2008). Many lakes on the Tibetan Plateau such as Qinghai Lake, Selinco Lake and Longmuco Lake have rapidly increased due to the rapid increase of glacial melt water, and a large amount of ice water has been injected into the lakes, leading to the expansion of lakes and the rise of water level (Jia et al., 2001).
Therefore, we believe that second episode of overbank flooding recorded by OFD2 in the CMQ and ZHK profiles in the Yellow River Source area was due to the significant increase in temperature and the EASM significantly strengthened during the Bølling-Allerød period. In the meanwhile, the monsoon state is unstable, the mountain glaciers and ice caps melt rapidly in a large range, and the snowmelt water increases abnormally in the Yellow River source area. The water mainly derived from the accelerated melting of mountain glaciers surrounding the basin and/or the large-scale precipitation flowed into Yellow River, which led to the overbank flooding events (Qiu, 2008; Cuo et al., 2015; Chen et al., 2021).
6 Conclusion
During our paleohydrological investigations, two units of overbank flood deposits were found in the sediment sequences at Chameiqu (CMQ) and Zuhaka (ZHK) sites in the Maqu-Kesheng reach in the Yellow River source area. These paleoflood OFD units were studied using a multi-index approach, including magnetic susceptibility, hygroscopic water, grain size distribution and micro-morphological features. Based on field observations and laboratory analysis, it can be inferred that these paleoflood OFD units were deposited from the sediment load in Yellow River floodwaters. They have recorded two episodes of overbank flooding, which were dated to 34,680 ± 1880-29000 ± 1790 a and 16,500 ± 1,250-14000 ± 1,280 a respectively. The first episode was dated to 34,680 ± 1880-29000 ± 1790 a and correlated with the late Marine Isotope Stage 3a (MIS 3a) with a warm and wet climate. The second episode occurred at 16,500 ± 1,250-14000 ± 1,280 a, which is coincided with the Bølling-Allerød of the last deglaciation, a period of coexisting global warming and rapidly shrinking ice sheets. At these two periods, the water mainly derived from the accelerated melting of mountain glaciers surrounding the basin and/or the large-scale precipitation flowed into Yellow River, which led to the overbank flooding events. Obviously, the related overbank flood deposits were interbedded within glacial outwash/flashflood deposits in the valley bottom of the Yellow River, which intensified the valley aggradation.
Data availability statement
The original contributions presented in the study are included in the article/Supplementary Material, further inquiries can be directed to the corresponding author.
Author contributions
YaZ: Conceptualization, Methodology Software, Writing-Original Draft; HW: Data Curation, Writing-Original Draft; Investigation Formal Analysis YuZ: Conceptualization, Funding Acquisition, Writing-Review and Editing. CCH: Visualization, Investigation XZ: Resources, Supervision; HQ: Software Validation Y-nJ: Visualization, Writing-Review and Editing QX: Resources DC: Resources XL: Methodology Software TL: Supervision. All authors contributed to the article and approved the submitted version.
Funding
This work was supported by the grants from the Second Tibetan Plateau Scientific Expedition and Research Program (2019QZKK0903), the National Science Foundation of China (42277449, 41801060, 4197116), Strategic Priority Research Program of the Chinese Academy of Sciences (XDA20060201), and the Open Foundation of The State Key Laboratory of Loess and Quaternary Geology (SKLLQG2107).
Conflict of interest
The authors declare that the research was conducted in the absence of any commercial or financial relationships that could be construed as a potential conflict of interest.
Publisher’s note
All claims expressed in this article are solely those of the authors and do not necessarily represent those of their affiliated organizations, or those of the publisher, the editors and the reviewers. Any product that may be evaluated in this article, or claim that may be made by its manufacturer, is not guaranteed or endorsed by the publisher.
Supplementary material
The Supplementary Material for this article can be found online at: https://www.frontiersin.org/articles/10.3389/feart.2022.1021106/full#supplementary-material
SUPPLEMENTARY FIGURE S1 | Close shot of the clay cap and silt at the top of OFD1-9 at CMQ profile in the Yellow River source area on the NE Tibetan Plateau.
SUPPLEMENTARY FIGURE S2 | (A) Photo of deposits at the bottom of the ZHK profile and (B) riverbed gravels interbedded with sand in paleochannel deposits in the ZHK profile in the Yellow River source area on the NE Tibetan Plateau.
SUPPLEMENTARY FIGURE S3 | Radial plots for sample (A) CMQ-1, (B) CMQ-6, (C) CMQ-7, (D) CMQ-8 and (E) ZHK-5, (F) ZHK-6 from the CMQ and ZHK profiles in the Yellow River source area on the NE Tibetan Plateau. These plots both present the De distributions and illustrate the spread in the data and how the modeled minimum or central age maps onto the distributions.
SUPPLEMENTARY FIGURE S4 | Plots of single-aliquot De versus sensitivity corrected natural OSL signal for the sample (A) CMQ-1, (B) CMQ-6, (C) CMQ-7, (D) CMQ-8 and (E) ZHK-5, (F) ZHK-6 from the CMQ and ZHK profiles in the Yellow River source area on the NE Tibetan Plateau.
SUPPLEMENTARY FIGURE S5 | Characteristic value diagram of grain size parameters showing the grain size distribution in the CMQ profile in the Yellow River source area on the NE Tibetan Plateau.(A) 3-D stereogram of skewness (Sk), standard deviation (δ) and kurtosis (Kg); (B) 3-D stereogram of mean (Mz), median (Md) and sorting coefficient (S).
SUPPLEMENTARY FIGURE S6 | Insolation departures in July relative to the present values at various latitudes during the past 125 ka BP (W/m2) (The blue rectangle and the yellow rectangle represent the Bølling-Allerød and MIS3a period) (Shi et al., 1999).
References
Ali, Z., Liu, W. L., Wang, X. D., Zainab, I., Zona, Z., Raza, S. T., et al. (2015). Glacier receding and ecological thresholds for Tibetan Plateau and associated cryosphere. J. Animal Plant Sci. 25 (3), 278–296.
An, Z. S., Colman, S. M., Zhou, W. J., Li, X. Q., Brown, E. T., Timothy Jull, A. J., et al. (2012). Interplay between the Westerlies and Asian Monsoon recorded in lake Qinghai sediments since 32 ka. Sci. Rep. 2, 619. doi:10.1038/srep00619
Arnold, L. J., Bailey, R. M., and Tuckerd, G. E. (2007). Statistical treatment of fluvial dose distributions from southern Colorado arroyo deposits. Quat. Geochronol. 2, 162–167. doi:10.1016/j.quageo.2006.05.003
Baker, V. R. (2013). 9.26 global late Quaternary fluvial paleohydrology: With special emphasis on paleofloods and megafloods. Treatise Geomorphol. 9, 511–527. doi:10.1016/b978-0-12-374739-6.00252-9
Baker, V. R., Benito, G., Brown, A. G., Carling, P. A., Enzel, Y., Greenbaum, N., et al. (2022). Fluvial palaeohydrology in the 21st century and beyond. Earth Surf. Process. Landf. 47, 58–81. doi:10.1002/esp.5275
Basak, C., Froellje, H., Lamy, F., Gersonde, R., Benz, V., Anderson, R., et al. (2018). Breakup of last glacial deep stratification in the South. Pacific. Science 359 (6378), 900–904. doi:10.1126/science.aao2473
Benito, G., Harden, T. M., and O'Connor, J. E. (2022). 6.35-Quantitative paleoflood hydrology. Treatise Geomorphol. 7, 743–764.
Benito, G., Thorndycraft, V. R., Rico, M., Sánchez-Moya, Y., and Sopeña, A. (2008). Palaeoflood and floodplain records from Spain: Evidence for long-term climate variability and environmental changes. Geomorphology 101, 68–77. doi:10.1016/j.geomorph.2008.05.020
Berger, A., and Loutre, M. F. (1991). Insolation values for the climate of the last 10 million years. Quat. Sci. Rev. 10, 297–317. doi:10.1016/0277-3791(91)90033-q
Chahal, P., Kumar, A., Sharma, C. P., Singhal, S., Sundriyal, Y. P., and Srivastava, P. (2019). Late Pleistocene history of aggradation and incision, provenance and channel connectivity of the Zanskar River, NW Himalaya. Glob. Planet. Change 178, 110–128. doi:10.1016/j.gloplacha.2019.04.015
Chaudhary, S., Shukla, U. K., Sundriyal, Y. P., Srivastava, P., and Jalal, P. (2015). Formation of paleovalleys in the Central Himalaya during valley aggradation. Quat. Int. 371, 254–267. doi:10.1016/j.quaint.2014.12.064
Chen, K. Z., and Bowler, J. M. (1985). Preliminary study on sedimentary characteristics and paleoclimate evolution of qarhan Salt Lake in Qaidam Basin. Sci. Sin. 5, 463–473.
Chen, M. Y., Xu, S. L., Wu, Z. H., Li, Y. H., Zhao, X. T., Zhang, K. Q., et al. (2014). The features and ages of lake beach rock around Sayram Lake in Western Tian Shan and its significance on lake level fluctuation during the last interglacial epoch MIS3. J. Geomechanics 20 (2), 174–184. (In Chinese with English abstract).
Chen, Y. L., Huang, C. C., Zhang, Y. Z., Zhou, Y. L., Zha, X. C., Wang, N. L., et al. (2021). Palaeoflood events during the last deglaciation in the Yellow River source area on the northeast Tibetan Plateau. Geol. J. 56, 4293–4309. doi:10.1002/gj.4164
Cheng, B., Chen, F. H., and Zhang, J. W. (2010). Palaeovegetational and palaeoenvironmental changes in GongheBasin since last deglaciation. Acta Geogr. Sin. 65 (11), 1336–1344. (In Chinese with English abstract).
Clark, P. U., Shakun, J. D., Baker, P. A., Bartlein, P. J., Brewer, S., Brook, E., et al. (2012). Global climate evolution during the last deglaciation. Proc. Natl. Acad. Sci. U. S. A. 109 (19), 1134–1142. doi:10.1073/pnas.1116619109
Cuo, L., Zhang, Y. X., Bohn, T. J., Zhao, L., Li, J. L., Liu, Q. M., et al. (2015). Frozen soil degradation and its effects on surface hydrology in the northern Tibetan Plateau. J. Geophys. Res. Atmos. 120 (6), 8276–8298. doi:10.1002/2015jd023193
Deng, X. F., Liu, S. Y., Ding, Y. J., Shen, Y. P., Zhao, L., and Xie, C. W. (2004). Quaternary glaciations and environment change in the Anyemaqen Mountains. J. Glaciol. Geocryol. 26 (3), 305–311. (In Chinese with English abstract).
Duller, G. (2015). The Analyst software package for luminescence data: Overview and recent improvements. Anc. TL 3, 35–42.
Dykoski, C. A., Edwards, R. L., Cheng, H., Yuan, D. X., Cai, Y. J., Zhang, M. L., et al. (2005). A high-resolution, absolute-dated Holocene and deglacial Asian Monsoon record from Dongge Cave, China. Earth Planet. Sci. Lett. 233 (1-2), 71–86. doi:10.1016/j.epsl.2005.01.036
Edward, D., Shi, Y. F., Li, J. J., Zheng, B. X., Li, S. J., and Wang, J. T. (1991). Quaternary glaciation of Tibet: The geological evidence. Quat. Sci. Rev. 10 (6), 485–510. doi:10.1016/0277-3791(91)90042-s
England, J. F., Godaire, J. E., Klinger, R. E., Bauer, T. R., and Julien, P. Y. (2010). Paleohydrologic bounds and extreme flood frequency of the Upper Arkansas River, Colorado, USA. Geomorphology 124 (1-2), 1–16. doi:10.1016/j.geomorph.2010.07.021
Galbraith, R. F., Roberts, R. G., Laslett, G. M., Yoshida, H., and Olley, J. M. (1999). Optical dating of single and multiple grains of quartz from Jinmium rock shelter, northern Australia. Part I. Archaeometry 41, 339–364. doi:10.1111/j.1475-4754.1999.tb00987.x
Greenbaum, N., Schwartz, U., Carling, P., Bergman, N., Mushkin, A., Zituni, R., et al. (2020). Frequency of boulders transport during large floods in hyperarid areas using paleoflood analysis-An example from the Negev Desert, Israel. Earth-Science Rev. 202, 103086. doi:10.1016/j.earscirev.2020.103086
Grootes, P. M., Stuiver, M., White, J. W. C., Johnsen, S., and Jouzel, J. (1993). Comparison of oxygen isotope records from the GISP2 and GRIP Greenland ice cores. Nature 366 (6455), 552–554. doi:10.1038/366552a0
Guerin, G., Mercier, N., and Adamiec, G. (2011). Dose-rate conversion factors: Update. Anc. TL 29, 5–8.
Guo, B., Wei, C. X., Yu, Y., Liu, Y. F., Li, J. l., Meng, C., et al. (2022). The dominant influencing factors of desertification changes in the source region of Yellow River: Climate change or human activity? Sci. Total Environ. 813, 152512. doi:10.1016/j.scitotenv.2021.152512
Guo, Y. Q., Huang, C. C., Pang, J. L., Zhou, Y. L., Zha, X. C., and Mao, P. N. (2017). Reconstruction palaeoflood hydrology using slackwater flow depth method in the Yanhe River valley, middle Yellow River basin, China. J. Hydrology 544, 156–171. doi:10.1016/j.jhydrol.2016.11.017
He, W. G., Xiong, Z., Yuan, D. Y., Ge, W. P., and Liu, X. W. (2006). Paleo-earthquake study on the Maqu fault of East Kunlun active fault. Earthq. Res. China 2, 126–134. [in Chinese with English abstract]
Hu, G. Y., Yu, L. P., Dong, Z. B., Lu, J. F., Li, J. Y., Wang, Y. X., et al. (2018). Holocene aeolian activity in the Zoige Basin, northeastern Tibetan Plateau, China. Catena 160, 321–328. doi:10.1016/j.catena.2017.10.005
Hu, Y. R., Maskey, S., Uhlenbrook, S., and Zhao, H. L. (2011). Stream flow trends and climate linkages in the source region of the Yellow River, China. Hydrol. Process. 25 (22), 3399–3411. doi:10.1002/hyp.8069
Huang, C. C., Pang, J. L., Zha, X. C., and Zhou, Y. L. (2011). Prehistorical floods in the Guanzhong Basin in the Yellow River drainage area: A case study along the Qishuihe River valley over the Zhouyuan loess tableland. Sci. China Earth Sci. 41 (11), 1658–1669. (In Chinese).
Huang, C. X., Zhang, Q. S., and Liu, F. T. (1989). A Preliminary study of paleovegetation and paleoclimate in the later period of late Pleistocene in the Bangong Co Lake region of Xizang. J. Nat. Resour. 3, 247–253. (In Chinese with English abstract).
Huang, E. Q., and Tian, J. (2008). Glacial meltwater events and abrupt climate change during the last deglaciation. Chin. Sci. Bull. 53 (12), 1437–1447. (In Chinese).
Imbrie, J., Hays, J. D., Martinson, D. G., McIntyre, A., and Shackleton, N. J. (1984). “The orbital theory of Pleistocene climate: Support from a revised chronology of the marine δ18O record,” in Milankovitch and climate. Editors A. Berger, J. Imbrie, J. Hays, G. Kukla, and B. Saltzman (Dordrecht: D. Reidel Publishing Company), 269–305.
IPCC (2007). The fourth assessment report of the intergovernmental panel on climate change. Cambridge: Cambridge University Press.
Jia, Y. L., Shi, Y. F., Wang, S. M., Jiang, X. Z., Li, S. J., Wang, A. J., et al. (2001). Preliminary study on four periods of lake flooding and their formation mechanism in the Tibetan Plateau since 40 ka. Sci. Sin. S1, 241–251 [(in Chinese with English abstract].
Jia, Y. N., Zhang, Y. Z., Huang, C. C., Wang, N. L., Qiu, H. J., Wang, H. Y., et al. (2022). Late pleistocene-holocene aeolian loess-paleosol sections in the Yellow River source area on the northeast Tibetan plateau: Chronostratigraphy, sediment provenance, and implications for paleoclimate reconstruction. Catena 28, 105777. doi:10.1016/j.catena.2021.105777
Jin, Z. D., An, Z. S., Yu, J. M., Li, F. C., and Zhang, F. (2015). Lake Qinghai sediment geochemistry linked to hydroclimate variability since the last glacial. Quat. Sci. Rev. 122, 63–73. doi:10.1016/j.quascirev.2015.05.015
Kemp, R. A. (1999). Micromorphology of loess–paleosol sequences: A record of paleoenvironmental change. Catena 35 (2-4), 179–196. doi:10.1016/s0341-8162(98)00099-x
Knox, J. C. (2000). Sensitivity of modern and Holocene floods to climate change. Quat. Sci. Rev. 19, 439–457. doi:10.1016/s0277-3791(99)00074-8
Kochel, R. C., and Baker, V. R. (1982). Paleoflood hydrology. Science 215, 353–361. doi:10.1126/science.215.4531.353
Kreutzer, S., Schmidt, C., Fuchs, M. C., Dietze, M., Fischer, M., and Fuchs, M. (2012). Introducing an R package for luminescence dating analysis. Anc. TL 30 (1), 1–8.
Kuhle, M., Hovemann, J., and Wang, W. J. (1987). Reports on the northeastem part of the Qinghai-Xizang (Tibet) Plateau. Beijing: Science Press. (In Chinese).The problem of a Pleisocene in land glaciation of the northeastem Qinghai-Xizang Plateau
Kukla, G., and An, Z. S. (1989). Loess stratigraphy in central China. Palaeogeogr. Palaeoclimatol. Palaeoecol. 72 (89), 203–225. doi:10.1016/0031-0182(89)90143-0
Lehmkuhl, F. (1998). Extent and spatial distribution of Pleistocene glaciations in eastern Tibet. Quat. Int. 45/46, 123–134. doi:10.1016/s1040-6182(97)00010-4
Lehmkuhl, F., and Spönemann, J. (1994). Morphogenetic problems of the upper Huang He drainage Basin. GeoJournal 34 (1), 31–40. doi:10.1007/bf00813967
Li, B. Y. (2000). The last greatest lakes on the Xizang (Tibetan) Plateau. Acta Geogr. Sin. 2, 174–182. (In Chinese with English abstract).
Li, G. F., Wang, C., Wang, Z. F., Hua, J. P., Ge, C. X., and Deng, J. H. (2013). Study on probable maximum flood in source region of Yellow River. J. Hohai Univ. Nat. Sci. 41 (2), 102–107. (In Chinese with English abstract).
Li, G. Q., Zhang, H. X., Liu, X. J., Yang, H., Zhang, X. J., Jonell, T. N., et al. (2020). Paleoclimatic changes and modulation of East Asian summer monsoon by high-latitude forcing over the last 130, 000 years as revealed by independently dated loess-paleosol sequences on the NE Tibetan Plateau. Quat. Sci. Rev. 237, 106283. doi:10.1016/j.quascirev.2020.106283
Li, J. C., Yang, Y. G., and Zhang, C. X. (2011). Quantitative study on influencing factors of desertification in headwater area of Yellow River. J. Arid Land Resour. Environ. 25 (2), 88–92 [in Chinese with English abstract].
Li, S. H. (2001). Identification of well-bleached grains in the optical dating of quartz. Quat. Sci. Rev. 20 (12), 1365–1370. doi:10.1016/s0277-3791(00)00156-6
Li, S. J., Shi, Y. F., and Wang, S. M. (1995). The evolution, environment change and ecosystem study of Qinghai-Xizang Plateau. Beijing: Science Press. (In Chinese).Geological record of climatic and environmental changes in Zoige Basin during the last 30000 years//The steering commission of the qinghai-xizang Program
Li, S. J., Zhang, H. L., Shi, Y. F., and Zhu, Z. Y. (2008). A high-resolution MIS 3 environmental change record derived from lacustrine deposit of Tianshuihai Lake, Qinghai-Tibet Plateau. Quat. Sci. 1, 122–131. (In Chinese with English abstract).
Li, S., Yang, S. L., Liang, M. H., Cheng, T., Chen, H., and Liu, N. N. (2018). The end member model analysis on grain size of loess in the eastern Tibetan plateau. Earth Environ. 46 (4), 331–338. (In Chinese with English abstract).
Li, X. Z., Liu, X. D., Qiu, L. J., An, Z. S., and Yin, Z. Y. (2013). Transient simulation of orbital-scale precipitation variation in monsoonal East Asia and arid central Asia during the last 150 ka. J. Geophys. Res. Atmos. 118, 7481–7488. doi:10.1002/jgrd.50611
Li, Z. W., Wang, Z. Y., Tian, S. M., and Zhang, C. D. (2014). Variation of stream-flow and sediment discharge rate and relationship with temperature change in Yellow River source area. J. Sediment Res. 3, 28–35. (In Chinese with Chinese abstract).
Ling, Y., Zheng, M. P., Sun, Q., and Dai, X. Q. (2017). Last deglacial climatic variability in Tibetan Plateau as inferred from n-alkanes in a sediment core from Lake Zabuye. Quat. Int. 454, 15–24. doi:10.1016/j.quaint.2017.08.030
Liu, W. M., Carling, P. A., Hu, K. H., Wang, H., Zhou, Z., Zhou, L. Q., et al. (2019). Outburst floods in China: A review. Earth-Science Rev. 197, 102895. doi:10.1016/j.earscirev.2019.102895
Liu, X. M., Liu, D. S., and John, S. (1993). Characteristics of magnetic minerals in Chinese loess and their paleoclimatic significance. Quat. Sci. 3, 281–287. (In Chinese with English abstract).
Maher, B. A. (1998). Magnetic properties of modern soils and Quaternary loessic paleosols: Paleoclimatic implications. Palaeogeogr. Palaeoclimatol. Palaeoecol. 137 (1-2), 25–54. doi:10.1016/s0031-0182(97)00103-x
Mao, P. N., Pang, J. L., Huang, C. C., Zha, X. C., Zhou, Y. L., Guo, Y. Q., et al. (2022). Paleoflood evidence for an upper limit of the maximum flood magnitudes along the Gold Gorge, the upper Hanjiang River, China. Catena 212, 106111. doi:10.1016/j.catena.2022.106111
Mao, P. N., Pang, J. L., Huang, C. C., Zha, X. C., Zhou, Y. L., Guo, Y. Q., et al. (2016). A multi-index analysis of the extraordinary paleoflood events recorded by slackwater deposits in the Yunxi Reach of the upper Hanjiang River, China. Catena 145, 1–14. doi:10.1016/j.catena.2016.05.016
Meng, F. C., Su, F. G., Yang, D. Q., Tong, K., and Hao, Z. C. (2016). Impacts of recent climate change on the hydrology in the source region of the Yellow River basin. J. Hydrology Regional Stud. 6, 66–81. doi:10.1016/j.ejrh.2016.03.003
Munoz, S. E., Giosan, L., Therrell, M. D., Remo, J. W. F., Shen, Z. X., Sullivan, R. M., et al. (2018). Climatic control of Mississippi River flood hazard amplified by river engineering. Nature 556, 95–98. doi:10.1038/nature26145
Murray, A. S., and Wintle, A. G. (2000). Luminescence dating of quartz using an improved single aliquot regenerative-dose protocol. Radiat. Meas. 32 (1), 57–73. doi:10.1016/s1350-4487(99)00253-x
Murray, A. S., and Wintle, A. G. (2003). The single aliquot regenerative dose protocol: Potential for improvements in reliability. Radiat. Meas. 37 (4-5), 377–381. doi:10.1016/s1350-4487(03)00053-2
Owen, L. A., Finkel, R. C., Haizhou, M., Spencer, J. Q., Derbyshire, E., Barnard, P. L., et al. (2003). Timing and style of late quaternary glaciation in northeastern Tibet. Geol. Soc. Am. Bull. 115 (11), 1356–1364. doi:10.1130/b25314.1
Owen, L. A., Finkel, R. C., Ma, H. Z., and Barnard, P. L. (2006). Late quaternary landscape evolution in the Kunlun Mountains and qaidam basin, northern Tibet: A framework for examining the links between glaciation, lake level changes and alluvial fan formation. Quat. Int. 154/155, 73–86. doi:10.1016/j.quaint.2006.02.008
Pachur, H. J., Wunneman, B., and Zhang, H. C. (1995). Lake evolution in the Tengger Desert, northwestern China, during the last 40, 000 years. Quat. Res. 44, 171–180. doi:10.1006/qres.1995.1061
Panda, S., Kumar, A., Das, S., Devrani, R., Rai, S., Prakash, K., et al. (2020). Chronology and sediment provenance of extreme floods of Siang River (Tsangpo-Brahmaputra River valley), northeast Himalaya. Earth Surf. Process. Landf. 45 (11), 2495–2511. doi:10.1002/esp.4893
Peng, H., Zheng, Y. S., and Shang, H. X. (2014). Analysis on flood variation characteristics in tangnaihe River and its upstream of the Yellow River. J. North China Univ. Water Resour. Electr. Power (Natural Sci. Ed. 35 (6), 18–20. (In Chinese with English abstract).
Prell, W. L., and Kutzbach, J. E. (1992). Sensitivity of the Indian monsoon to forcing parameters and implications for its evolution. Nature 360, 647–652. doi:10.1038/360647a0
Prescott, J. R., and Hutton, J. T. (1994). Cosmic ray contributions to dose rates for luminescence and ESR dating: Large depths and long-term time variations. Radiat. Meas. 23 (2-3), 497–500. doi:10.1016/1350-4487(94)90086-8
Prizomwala, P., Yadava, G. J., Solanki, T., Das, A., Chauhan, G., and Makwana, N. (2019). Style and stages of valley fill aggradation-incision cycles in the Northern Hill Range, Kachchh, Western India. Quat. Int. 510, 18–27. doi:10.1016/j.quaint.2018.11.020
Przemyslaw, M. (2013). Recycled loesses-a micromorphological approach to the determination of local source areas of Weichselian loess. Quat. Int. 296 (16), 241–250. doi:10.1016/j.quaint.2013.02.040
Pu, Y., Zhang, H. C., Lei, G. L., Chang, F. Q., Yang, M. S., Zhang, W. X., et al. (2010). Climate variability recorded by n-alkanes of paleolake sediment in Qaidam Basin on the northeast Tibetan Plateau in late MIS3. Sci. China Earth Sci. 40 (5), 624–631. (In Chinese).
Reimer, P. J., Austin, W. E. N., Bard, E., Bayliss, A., Blackwell, P. G., Bronk, R. C., et al. (2020). The IntCal20 Northern Hemisphere radiocarbon age calibration curve (0-55 cal k BP). Radiocarbon 62, 725–757. doi:10.1017/rdc.2020.41
Schulte, L., Schillereff, D., and Santisteban, J. I. (2019). Pluridisciplinary analysis and multi-archive reconstruction of paleofloods: Societal demand, challenges and progress. Glob. Planet. Change 177, 225–238. doi:10.1016/j.gloplacha.2019.03.019
Shan, F. S., Du, N. Q., and Kong, Z. C. (1993). Vegetational and environmental changes in the last 350 ka in Erlangjian, Qinghai Lake. J. Lake Sci. 5 (1), 9–17. (In Chinese with English abstract). doi:10.18307/1993.0102
Sharma, C. P., Chahal, P., Kumar, A., Singhal, S., Sundriyal, Y. P., Ziegler, A. D., et al. (2022). Late Pleistocene–Holocene flood history, flood-sediment provenance and human imprints from the upper Indus River catchment, Ladakh Himalaya. GSA Bull. 134 (1-2), 275–292. doi:10.1130/b35976.1
Shen, C. M., Tang, L. Y., and Wang, S. M. (1996). Vegetation and climate during the last 22000 years in Zoige region. Acta Micropaleontol. Sin. 13 (4), 401–406. (In Chinese with English abstract).
Shen, J., Liu, X. Q., Wang, S. M., and Matsumoto, R. (2005). Palaeoclimatic changes in the Qinghai Lake area during the last 18, 000 years. Quat. Int. 136 (1), 131–140. doi:10.1016/j.quaint.2004.11.014
Shi, M. X., Lan, Y. C., Shen, Y. P., Tian, H., Wang, X., La, C. F., et al. (2018). Analyses of multiple time scale variation characteristics of pan evaporation and mutation in the source regions of the Yellow River from 1961 to 2014. J. Glaciol. Geocryol. 40 (4), 666–675. (In Chinese with English abstract).
Shi, Y. F. (2022). Discussion on temperature lowering values and equilibrium line altitude in the Qinghai-Xizang Plateau during the last Glacial Maximum and their simulated results. Quat. Sci. 22 (4), 312–322. (In Chinese with English abstract).
Shi, Y. F., Jia, Y. L., Yu, G., Yang, D. Y., Fan, Y. Q., Li, S. J., et al. (2002). Features, impacts and causes of the high temperature and large precipitation event in the Tibetan Plateau and its adjacent area during 40-30 ka BP. J. Lake Sci. 14 (1), 1–11. (In Chinese with English abstract).
Shi, Y. F., Liu, X. D., Li, B. Y., and Yao, T. D. (1999). A very strong summer monsoon event during 30-40 ka BP in the Qinghai-Xizang (Tibet) Plateau and its relation to precessional cycle. Chin. Sci. Bull. 44 (20), 1851–1858. doi:10.1007/bf02886339
Shi, Y. F., and Yu, G. (2003). Warm-humid climate and transgressions during 40-30 ka BP and their potential mechanisms. Quat. Sci. 23 (1), 1–11. (In Chinese with English abstract).
Srivastava, P., Kumar, A., Chaudhary, S., Meena, N., Sundriyal, Y. P., Rawat, S., et al. (2017). Paleofloods records in Himalaya. Geomorphology 284, 17–30. doi:10.1016/j.geomorph.2016.12.011
Srivastava, P., Tripathi, J. K., Islam, R., and Jaiswal, M. K. (2008). Fashion and phases of late Pleistocene aggradation and incision in the Alaknanda River valley, Western Himalaya, India. Quat. Res. 70, 68–80. doi:10.1016/j.yqres.2008.03.009
Starkel, L. (2003). Climatically controlled terraces in uplifting mountain areas. Quat. Sci. Rev. 22, 2189–2198. doi:10.1016/s0277-3791(03)00148-3
Stuiver, M., and Grootes, P. M. (2000). GISP2 oxygen isotope ratios. Quat. Res. 53 (5), 277–284. doi:10.1006/qres.2000.2127
Stuiver, M., and Reimer, P. J. (1993). Extended 14C data base and revised Calib 3.0 14C age calibration Program. Radiocarbon 35 (1), 215–230. doi:10.1017/s0033822200013904
Tomasson, H. (1996). The jokulhlaup from Katla in 1918. Ann. Glaciol. 22, 249–254. doi:10.1017/s0260305500015494
Wang, G. X., Li, N., and Hu, H. C. (2009). Hydrologic effect of ecosystem responses to climatic change in the source regions of Yangtze River and Yellow River. Clim. Change Res. 5 (4), 202–208. (In Chinese with English abstract).
Wang, J. (2010). Glacial advance in the Qinghai-Xizang Plateau and peripheral mountains during the mid-MIS3. Quat. Sci. 30 (5), 1055–1065. (In Chinese with English abstract).
Wang, Q. F., Jin, H. J., Wu, Q. B., Zhang, T. J., and Huang, Y. D. (2017). Climatic evolution since 6 cal. ka B.P. recorded by frozen peat deposits in the source area of the Yellow River northeastern Qinghai-Tibet Plateau. Quat. Sci. 37 (2), 402–415. (in Chinese with English abstract).
Wang, X. Y., Liu, Y., Su, Q., Lu, H. Y., Miao, X., Li, Y., et al. (2021). Late Quaternary terrace formation from knickpoint propagation in the headwaters of the Yellow River, NE Tibetan Plateau. Earth Surf. Process. Landf. 46, 2788–2806. doi:10.1002/esp.5208
Wang, X. Y., Yang, T., Wang, B., Li, H. H., and Hao, X. B. (2012). Scenarios forecasting of runoff extreme value in source region of Yellow River based on multiple hydrological models. Water Resour. Power 30 (3), 27–30. (In Chinese with English abstract).
Wang, Y. (2016). Climatic and environmental changes recorded in the sediments of Shijiu Lake during 38-11 ka BP. Nanjing: Nanjing Normal University. (In Chinese with English abstract).
Wang, Y. F., Wang, S. M., Xue, B., Ji, L., Wu, J. L., Xia, W. L., et al. (1995). Sedimentological evidence of the piracy of fossil Zoige Lake by the Yellow River. Chin. Sci. Bull. 40 (8), 723–725. (In Chinese).
Wang, Y. J., Cheng, H. Y., Edwards, R. L., An, Z. S., Wu, J. Y., Shen, C. C., et al. (2001). A high-resolution absolute-dated late Pleistocene monsoon record from Hulu Cave, China. Science 294 (5550), 2345–2348. doi:10.1126/science.1064618
Wang, Y. Q., and Yao, T. D. (2002). Progresses in the studies of abrupt climatic change events recorded in Ice Cores during the Last Glacial-Interglacial Cycle. J. Glaciol. Geocryol. 5, 550–558. (In Chinese with English abstract).
Wu, L., Zhu, C., Ma, C. M., Li, F., Meng, H. P., Liu, H., et al. (2017). Mid-holocene palaeoflood events recorded at the Zhongqiao Neolithic cultural site in the Jianghan Plain, middle Yangtze River valley, China. Quat. Sci. Rev. 173, 145–160. doi:10.1016/j.quascirev.2017.08.018
Xue, B., Wang, S. M., Xia, W. L., Wu, J. L., Wang, Y. F., Qian, J. L., et al. (1998). The uplift and environmental change of the Qinghai Tibet Plateau since 900 ka BP revealed by the RM core within the Zoige Basin. Sci. Sin. (Terrae) 27 (6), 543–547. (In Chinese).
Yao, T. D., Thompson, L. G., Shi, Y. F., Qin, D. H., Jiao, K. Q., Yang, Z. H., et al. (1997). Records of climate change since the last interglacial period in the Guliya ice core. Sci. Sin. (Terrae) 5, 447–452. (In Chinese with English abstract).
Zha, X. C., Huang, C. C., Pang, J. L., Liu, J. F., and Xue, X. Y. (2015). Reconstructing the palaeoflood events from slackwater deposits in the upper reaches of Hanjiang River, China. Quat. Int. 380-381 (4), 358–367. doi:10.1016/j.quaint.2014.06.029
Zhang, H. B., Griffiths, M. L., Huang, J. H., Cai, Y. J., Wang, C. F., Zhang, F., et al. (2016). Antarctic link with East Asian summer monsoon variability during the Heinrich Stadial-Bølling interstadial transition. Earth Planet. Sci. Lett. 435, 243–251. doi:10.1016/j.epsl.2016.08.008
Zhang, Y. F., Li, C. A., Zhao, J. X., Mao, X., Xu, Y. S., Wei, C. Y., et al. (2020). Grain size characteristics and climatic environmental significance of sediments in the northeastern margin of the Jianghan Plain during the last deglaciation period. Acta Sedimentol. Sin. 39 (4), 1–14. (In Chinese with English abstract).
Zhang, Y. Z., Huang, C. C., Pang, J. L., Guo, Y. Q., and Zhou, Q. (2018). Identification of the prehistoric catastrophes at the Lajia Ruins using micromorphological analysis within the Guanting Basin, Minhe County, Qinghai Province. Archaeol. Anthropol. Sci. 3, 711–723. doi:10.1007/s12520-017-0509-2
Zhang, Y. Z., Huang, C. C., Tan, Z. H., Chen, Y. L., Qiu, H. J., Huang, C., et al. (2019). Prehistoric and historic overbank floods in the Luoyang Basin along the Luohe River, middle Yellow River basin, China. Quat. Int. 521, 118–128. doi:10.1016/j.quaint.2019.06.023
Zhao, J. D., Zhou, S. Z., Liu, S. Y., He, Y. Q., Liu, X. B., and Wang, J. (2007). A preliminary study of the glacier advance in MIS3b in the Western regions of China. J. Glaciol. Geocryol. 29 (2), 233–241. (In Chinese with English abstract).
Zhao, M., Zha, X. C., Huang, C. C., and Pang, J. L. (2012). Geochemical characteristics of the Holocene palaeoflood slackwater deposits in Weihe River basin. J. Soil Water Conservation 26 (1), 106–111. (In Chinese with English abstract).
Zhao, Y. T. (2017). Vegetation and climate history around Balikun region from MIS3 to early Holocene (∼60-9 ka BP) documented by multi-proxy data of Balikun Lake. Lanzhou: Lanzhou University. (In Chinese with English abstract).
Zhao, Y., Yu, Z. C., and Zhao, W. W. (2011). Holocene vegetation and climate histories in the eastern Tibetan plateau: Controls by insolation-driven temperature or monsoon derived precipitation changes? Quat. Sci. Rev. 30 (9-10), 1173–1184. doi:10.1016/j.quascirev.2011.02.006
Zheng, B. X., Li, S. J., and Wang, S. M. (1994). “The Quaternary glacial evolution of the mountains surrounding Zoige Basin,” in The expert committee on the qingzang Program ed. Study on the formation and evolution of the qinghai-xizang plateau, environmental change and ecological annual academic (Beijing: Science Press). (In Chinese).
Zhong, N., Jiang, H. C., Li, H. B., Xu, H. Y., and Liang, L. J. (2021). The Impact of climate transition on seismic activities on the eastern margin of the Tibetan Plateau during the last deglaciation. Acta Geosci. Sin. 42 (1), 21–31. (In Chinese with English abstract).
Zhou, L., Li, J., Zhang, P., and Jin, Y. (2021). Study on fault structure and stress field characteristics of Maqin-Maqu section of East Kunlun Fault. J. Geodesy Geodyn. 41 (1), 62–66. (In Chinese with English abstract).
Zhou, W. J., Yu, S. Y., Burr, G. S., Kukla, G. J., Jull, A. J. T., Xian, F., et al. (2010). Postglacial changes in the asian summer monsoon system: A pollen record from the eastern margin of the Tibetan Plateau. Boreas 39, 528–539. doi:10.1111/j.1502-3885.2010.00150.x
Keywords: Tibetan Plateau, Yellow River source area, late Pleistocene, environmental evolution, overbank flooding
Citation: Zhu Y, Wang H, Zhang Y, Huang CC, Zha X, Qiu H, Jia Y-n, Xiao Q, Chen D, Lin X and Liu T (2022) Sedimentary records and chronology of the late Pleistocene overbank flooding in the Yellow River source area, NE Tibetan Plateau. Front. Earth Sci. 10:1021106. doi: 10.3389/feart.2022.1021106
Received: 17 August 2022; Accepted: 30 August 2022;
Published: 29 September 2022.
Edited by:
Xiekang Wang, Sichuan University, ChinaCopyright © 2022 Zhu, Wang, Zhang, Huang, Zha, Qiu, Jia, Xiao, Chen, Lin and Liu. This is an open-access article distributed under the terms of the Creative Commons Attribution License (CC BY). The use, distribution or reproduction in other forums is permitted, provided the original author(s) and the copyright owner(s) are credited and that the original publication in this journal is cited, in accordance with accepted academic practice. No use, distribution or reproduction is permitted which does not comply with these terms.
*Correspondence: Yuzhu Zhang, xbdzyz05@nwu.edu.cn