An agent-based model of cardiac allograft vasculopathy: toward a better understanding of chronic rejection dynamics
 Elisa Serafini1,2,3†
  Anna Corti4†
  Diego Gallo1
  Claudio Chiastra1
  Xian C. Li5,6,7
  Stefano Casarin2,3,7*
- 1PolitoBIOMed Lab, Department of Mechanical and Aerospace Engineering, Politecnico di Torino, Turin, Italy
- 2LaSIE, UMR 7356 CNRS, La Rochelle Université, La Rochelle, France
- 3Center for Precision Surgery, Houston Methodist Research Institute, Houston, TX, United States
- 4Laboratory of Biological Structure Mechanics (LaBS), Department of Chemistry, Materials and Chemical Engineering “Giulio Natta”, Politecnico di Milano, Milan, Italy
- 5Immunobiology and Transplant Science Center, Houston Methodist Hospital, Houston, TX, United States
- 6Department of Surgery, Weill Cornell Medical College of Cornell University, New York, NY, United States
- 7Department of Surgery, Houston Methodist Hospital, Houston, TX, United States
Cardiac allograft vasculopathy (CAV) is a coronary artery disease affecting 50% of heart transplant (HTx) recipients, and it is the major cause of graft loss. CAV is driven by the interplay of immunological and non-immunological factors, setting off a cascade of events promoting endothelial damage and vascular dysfunction. The etiology and evolution of tissue pathology are largely unknown, making disease management challenging. So far, in vivo models, mostly mouse-based, have been widely used to study CAV, but they are resource-consuming, pose many ethical issues, and allow limited investigation of time points and important biomechanical measurements. Recently, agent-based models (ABMs) proved to be valid computational tools for deciphering mechanobiological mechanisms driving vascular adaptation processes at the cell/tissue level, augmenting cost-effective in vivo lab-based experiments, at the same time guaranteeing richness in observation time points and low consumption of resources. We hypothesize that integrating ABMs with lab-based experiments can aid in vivo research by overcoming those limitations. Accordingly, this work proposes a bidimensional ABM of CAV in a mouse coronary artery cross-section, simulating the arterial wall response to two distinct stimuli: inflammation and hemodynamic disturbances, the latter considered in terms of low wall shear stress (WSS). These stimuli trigger i) inflammatory cell activation and ii) exacerbated vascular cell activities. Moreover, an extensive analysis was performed to investigate the ABM sensitivity to the driving parameters and inputs and gain insights into the ABM working mechanisms. The ABM was able to effectively replicate a 4-week CAV initiation and progression, characterized by lumen area decrease due to progressive intimal thickening in regions exposed to high inflammation and low WSS. Moreover, the parameter and input sensitivity analysis highlighted that the inflammatory-related events rather than the WSS predominantly drive CAV, corroborating the inflammatory nature of the vasculopathy. The proof-of-concept model proposed herein demonstrated its potential in deepening the pathology knowledge and supporting the in vivo analysis of CAV.
1 Introduction
Heart transplant (HTx) is the standard of care for patients with refractory end-stage heart disease. More than 5,000 transplants are performed yearly worldwide (Khush et al., 2019; Chambers et al., 2021; Spartalis et al., 2022). Thanks to advances in immunosuppressive therapies and donor–recipient matching criteria, the overall recipient survival has significantly increased in the last two decades (Dharmavaram et al., 2021). While progresses in immunosuppressive drugs markedly improved the HTx short-term outcome, long-term survival is still compromised by the high incidence of cardiac allograft vasculopathy (CAV), which affects 50% of recipients and is the major cause of late mortality (Stehlik et al., 2018; Spartalis et al., 2022). CAV is an inflammatory fibroproliferative disease that affects graft vasculature, manifests as an accelerated form of atherosclerosis, and ultimately leads to organ dysfunction (Chih et al., 2016; Pighi et al., 2020). The pathology is driven by a complex interplay between immunological and non-immunological factors (e.g., hyperlipidemia, ischemia–reperfusion time, biomechanics, and comorbidity). An early inflammatory response promotes endothelial injury and, subsequently, a cascade of maladaptive remodeling processes, involving, among others, exacerbated vascular and inflammatory cellular activities (Chih et al., 2016; Pighi et al., 2020). However, a thorough understanding of the pathology etiology and evolution is lacking.
Current disease management, from diagnosis to treatment, is still controversial and the only curative intervention is re-HTx, recommended in advanced CAV patients with graft impairment (Chih et al., 2016; Pighi et al., 2020; Spartalis et al., 2022). In this context, understanding the multiscale immunological and mechanobiological mechanisms leading to degenerative cellular and molecular events is pivotal to improve prevention, diagnosis, and treatment of CAV.
So far, in vivo murine models have been of great importance in gaining valuable insights into CAV pathophysiology (Pober et al., 2021). However, in vivo studies are logistically demanding, time-consuming, limited in their ability to efficiently address the multi-scale nature of the disease, pose animal welfare issues, and give access only to a limited number of time points during experimental follow-up, which are instead pivotal to deepen the understanding of the pathology dynamics. In this context, in silico approaches have the potential to address some of the in vivo study limitations, thus representing a valid support to the experimental research. Computational models have been successfully applied to a broad spectrum of complex pathologies (Barh et al., 2014), including cardiac and vascular diseases (Corti et al., 2021). However, to the best of the authors’ knowledge, CAV has been under-investigated through in silico approaches, with previous studies mainly applying computational fluid dynamics (CFD) to elucidate the role of blood flow dynamics (Timmins et al., 2013; Timmins et al., 2015).
Recently, continuum models have been adopted to simulate vascular maladaptive phenomena by accounting for immune cell dynamics in a continuum description (Gierig et al., 2023). In addition, agent-based models (ABMs) have emerged as a promising computational approach to capture cell/tissue mechanobiological processes underlying vascular adaptation (Corti et al., 2021). Specifically, ABMs of vascular remodeling, describing cellular dynamics and cell–cell and cell–environment interactions, were proposed, demonstrating their potentialities in the context of atherosclerosis and restenosis after endovascular/surgical procedures (Corti et al., 2021). Consequently, we hypothesize that studying CAV through the development of an ad hoc ABM will provide us with a deeper understanding of the pathology initiation and development, ultimately aiding in improving treatment and prevention.
Accordingly, the current work presents the development of an ABM of CAV initiation and progression along 4 weeks of follow-up in a mouse left coronary artery (LCA) cross-section to provide further understanding in the immunologic and non-immunologic events involved in the pathology initiation and development. We leveraged the versatility of a previously developed ABM, which has demonstrated successful applications in various maladaptive phenomena (Garbey et al., 2017; Corti et al., 2019; Corti et al., 2020; Corti et al., 2022a; Corti et al., 2022b; Corti et al., 2023a; Corti et al., 2023b). By adapting this ABM to investigate the specific pathology of CAV, we efficiently explored unique dynamics and mechanisms of this disease while capitalizing on the proven effectiveness of the computational framework. In addition to the immunological factors, we placed particular emphasis on investigating the impact of different wall shear stress (WSS) patterns on the vascular dynamics. The extensive model study includes a parameter sensitivity analysis and a subsequent input scenario testing to understand the relative weight of the different pathological risk factors and to gain mechanistic insights into CAV initiation and progression.
2 Methods
2.1 Agent-based model of CAV
A bidimensional (2D) ABM was implemented in MATLAB (R2021b, MathWorks, Natick, MA, USA) to simulate the CAV development and progression in an idealized bilayered mouse LCA cross-section along 4 weeks of follow-up.
In the current work, three cellular/molecular events were assumed to be the major events during the post-HTx period at the cell–tissue level driving CAV formation (Vergani et al., 2013; Kloc and Ghobrial, 2014; Liu et al., 2016). In detail, the events are as follows: i) macrophage (MP) infiltration, mitosis/apoptosis, and chemoattractant diffusion; ii) smooth muscle cell (SMC) mitosis/apoptosis and migration; and iii) extracellular matrix (ECM) production/degradation. Each event was driven by probabilistic rules defined such that, under baseline conditions (i.e., without stimuli), they guarantee homeostasis, while under inflammatory and WSS-based stimuli, they are perturbed, determining the initiation and development of CAV. Due to the stochastic nature of the model, three independent simulations were performed for each investigated scenario (Corti et al., 2022a; Corti et al., 2022b).
Figure 1 shows the conceptual ABM flow chart that simulates CAV (Figure 1A) and the temporal details with which the cellular and molecular events occur during the 4-week timeline (Figure 1B), representing the typical period of CAV manifestation in mouse models (Pinheiro and Barros, 2009; Zhang et al., 2012; Vergani et al., 2013; Wang et al., 2021). First, within the initialization routine, the initial geometry of the ABM was generated along with the inflammatory and WSS-based stimuli. Second, the cellular and molecular events were executed, simulating CAV progression and related arterial wall remodeling until reaching the end of the proposed follow-up time (
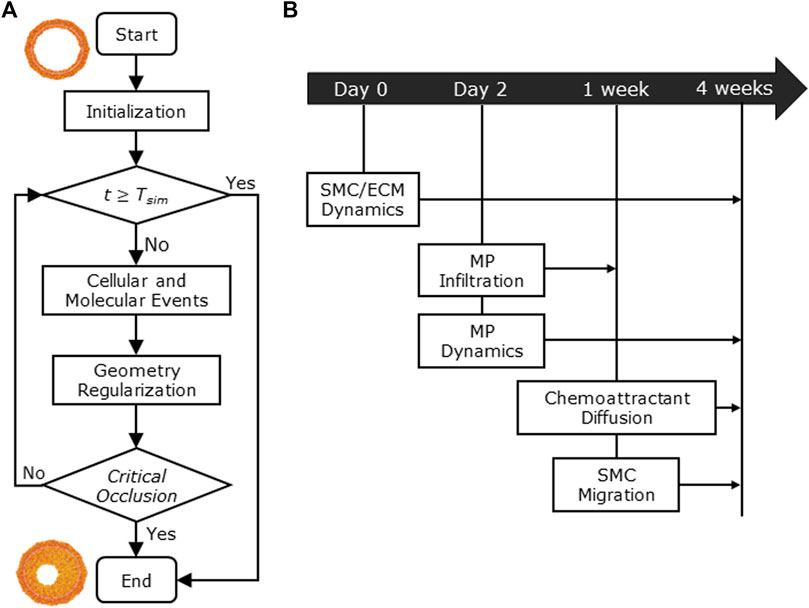
FIGURE 1. (A) Agent-based model (ABM) working mechanism flow chart. (B) 4-week timeline of the implemented cellular and molecular events: smooth muscle cell/extracellular matrix (SMC/ECM) dynamics from Day 0 (i.e., heart transplant time) to 4 weeks (i.e.,
2.1.1 Initialization
The ABM was implemented to resemble the LCA distal cross-section of a 25-week-old mouse (Pai et al., 2012). The model is laid on a 2D on-lattice <141 × 141> hexagonal grid and represents an idealized LCA cross-section with concentric lumen, intima, internal elastic lamina (IEL), and media layers (Figure 2). The artery presents a lumen radius (
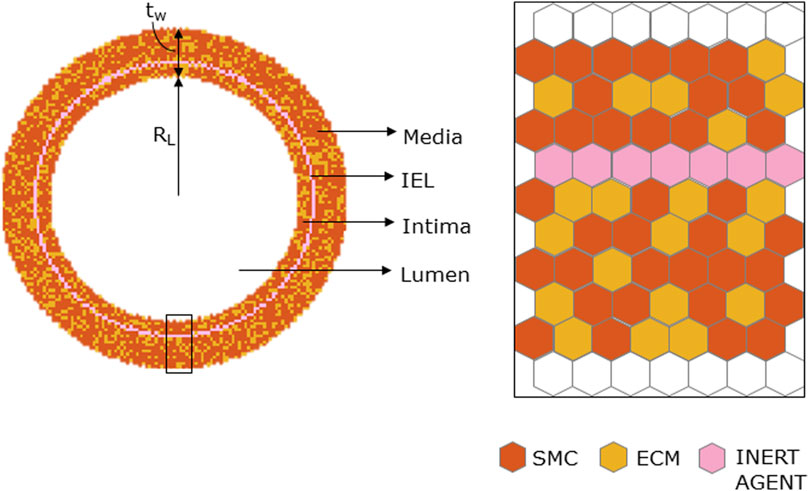
FIGURE 2. Geometrical initialization. Agent-based model cross-section with lumen, tunica intima, internal elastic lamina (IEL), and tunica media. The tunica intima and media are initially populated by smooth muscle cells (SMCs) and extracellular matrix (ECM) and IEL homogeneously filled with inert agents.
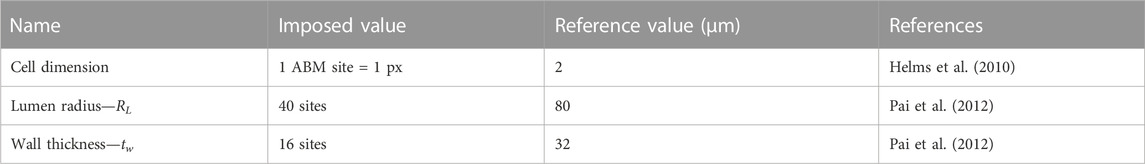
TABLE 1. Agent-based model (ABM) geometric parameters reported with name, imposed value, reference value, and literature reference.
The ABM was informed with an inflammatory input

TABLE 2. Agent-based model inputs.
2.1.2 Cellular and molecular events
Cellular/molecular events were governed by probabilistic rules and were set to occur with a specific timing throughout the simulation. SMC/MP mitosis and apoptosis and ECM production/degradation were marked by the related agent-specific cycle. At
MP infiltration and SMC media-to-intima migration occurred for
The probability rules defined for each event and the corresponding parameter values are listed in Table 3 and Table 4, respectively, and detailed as follows. For the parameters included in the sensitivity analysis, their range, rather than a value, is provided, and the explanation is detailed in Section 2.2.
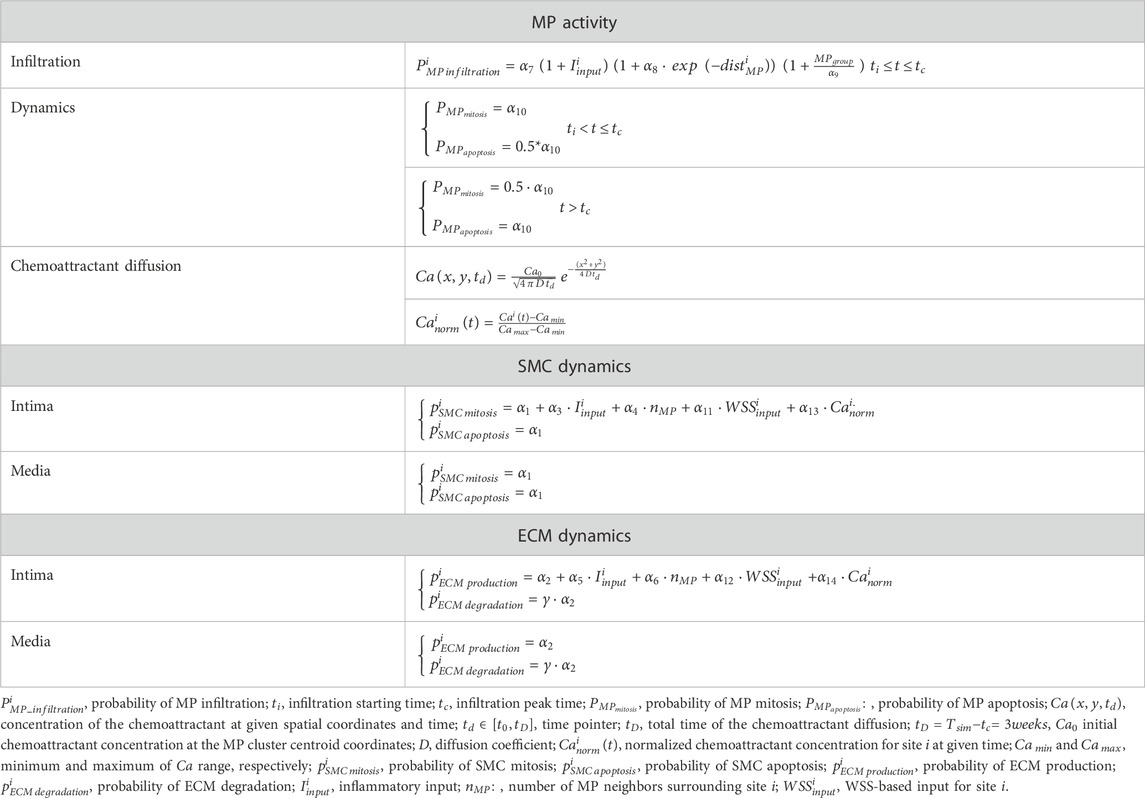
TABLE 3. Agent-based model probability equations.
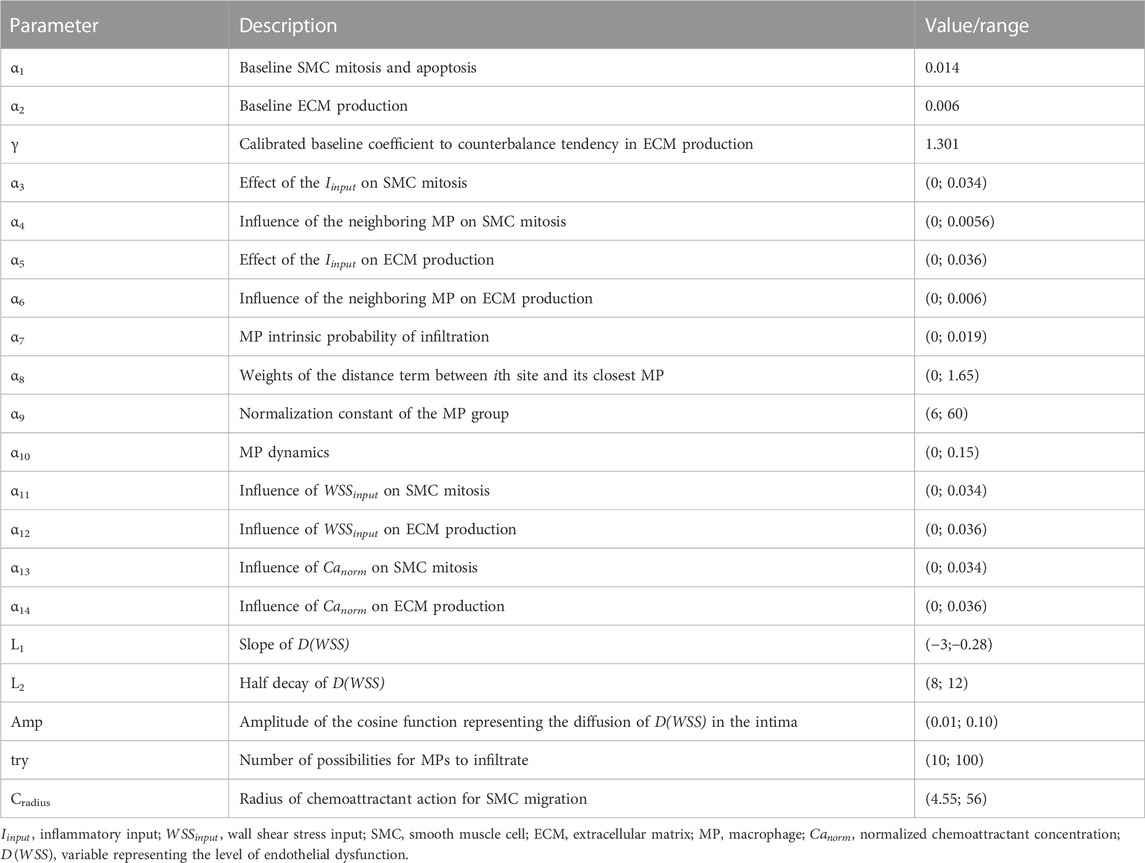
TABLE 4. Agent-based model (ABM) parameters.
2.1.2.1 MP activities
MP infiltration and dynamics were activated starting from
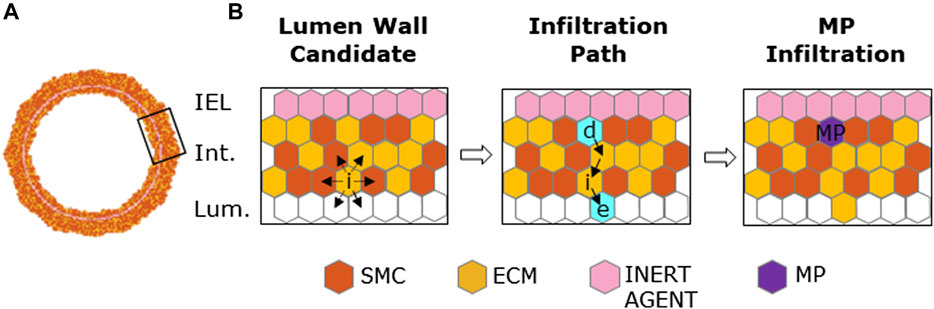
FIGURE 3. Macrophage (MP) infiltration sequence. (A) Artery cross-section at MP infiltration with its cellular components: smooth muscle cells (SMCs), extracellular matrix (ECM), inert agent, and MPs. (B) Left panel: active site (i) explores the content of neighbors and targets an empty site in the lumen and an occupied one in the intima. Central panel: site (e) and (d) (in cyan) are the designated sites in the lumen and in the intima, respectively, with solid black arrows explaining shifting movement among the wall. Right panel: site (d) filled with an MP agent (in purple).
A two-phase MP mitosis/apoptosis was implemented to qualitatively replicate the dynamic trend of the graft-infiltrating cells (e.g., MPs, monocytic and lymphocytic cells) in the first days after organ transplantation (McLean et al., 1997). Specifically, the mitosis/apoptosis probability rules were defined so that i) MP mitosis was promoted within the range
Once the MP cluster formed and reached the highest number of cells (t =
2.1.2.2 SMC and ECM dynamics
Under baseline conditions, namely, in the absence of perturbations, balanced SMC mitosis/apoptosis and ECM production/degradation were set to guarantee a physiologic arterial wall remodeling (Garbey et al., 2015; Garbey et al., 2017; Corti et al., 2019; Corti et al., 2020). In the presence of
2.1.2.3 SMC media-to-intima migration
SMC migration occurred when
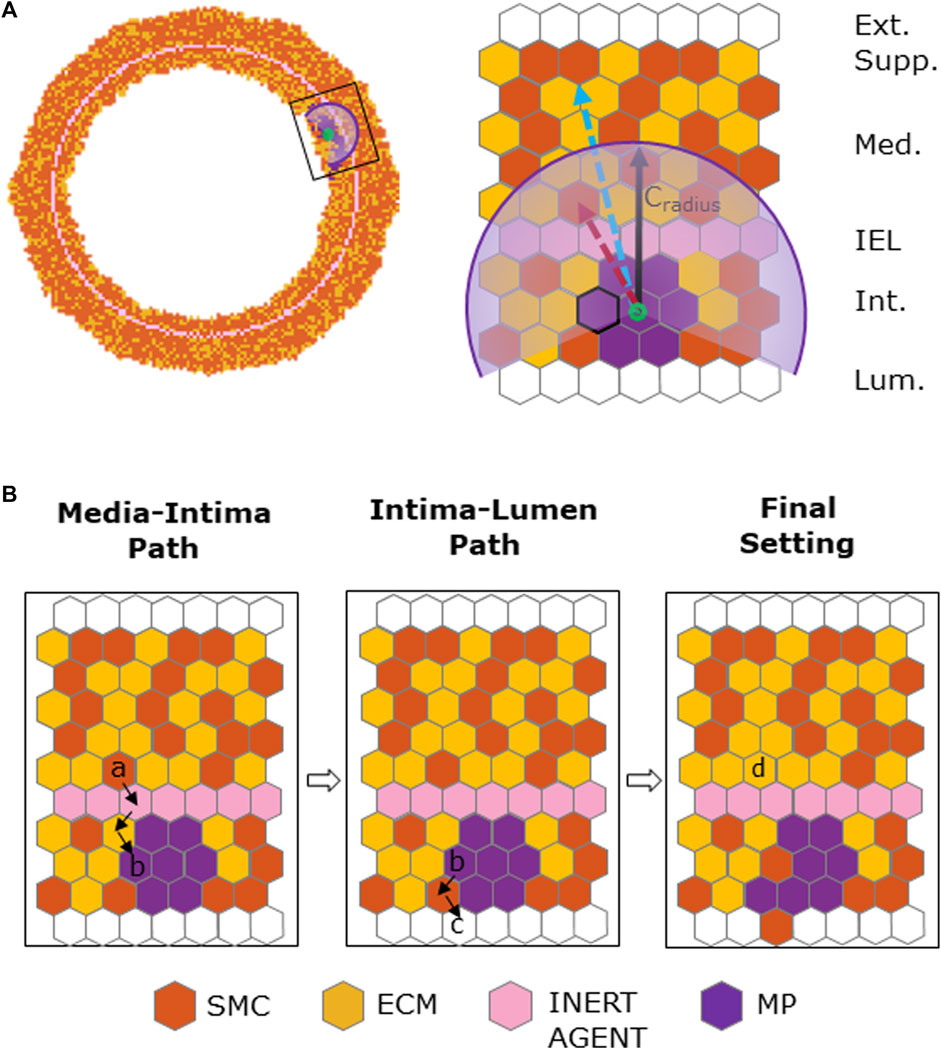
FIGURE 4. Chemoattractant-induced SMC media-to-intima migration. (A) Coronary cross-section at
2.1.3 Geometry regularization
To guarantee structure integrity and a smooth inner and outer profile, IEL and border regularizations were applied after SMC/ECM dynamics and SMC media-to-intima migration, respectively. Specifically, at the inner and outer borders, agents were locally redistributed to maximize their contact as conducted in previous works (Garbey et al., 2017; Corti et al., 2019; Corti et al., 2020; Corti et al., 2022a; Corti et al., 2022b), while the IEL was regularized to re-establish the initial configuration after SMC migration as detailed in Supplementary Figure S3.
2.2 Sensitivity analysis
A sensitivity analysis was performed to quantify the impact of the set of j = 17 ABM parameters
Latin hypercube sampling (LHS) was adopted to sample the admissible range of the j parameters in
2.3 Definition of scenarios
The ABM response to different conditions was investigated by setting the ABM parameters presented in Table 4 at their half-range values. Fourteen scenarios (detailed in Table 5) were generated and were characterized by the combination of different inflammatory and hemodynamic WSS-based inputs shown in Figure 5 and by the activation/deactivation of MP infiltration/dynamics and chemoattractant diffusion events.
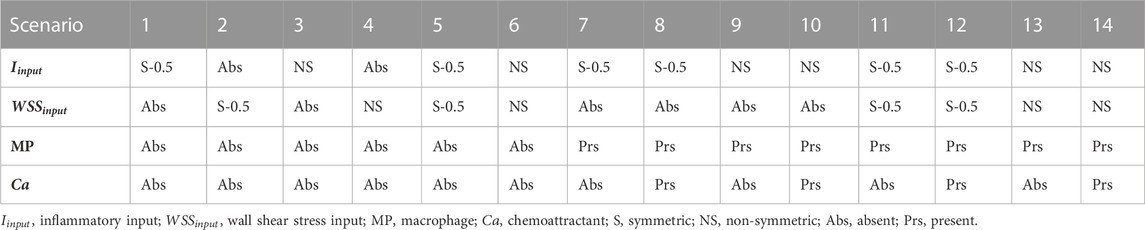
TABLE 5. Agent-based model testing scenarios 1–14.
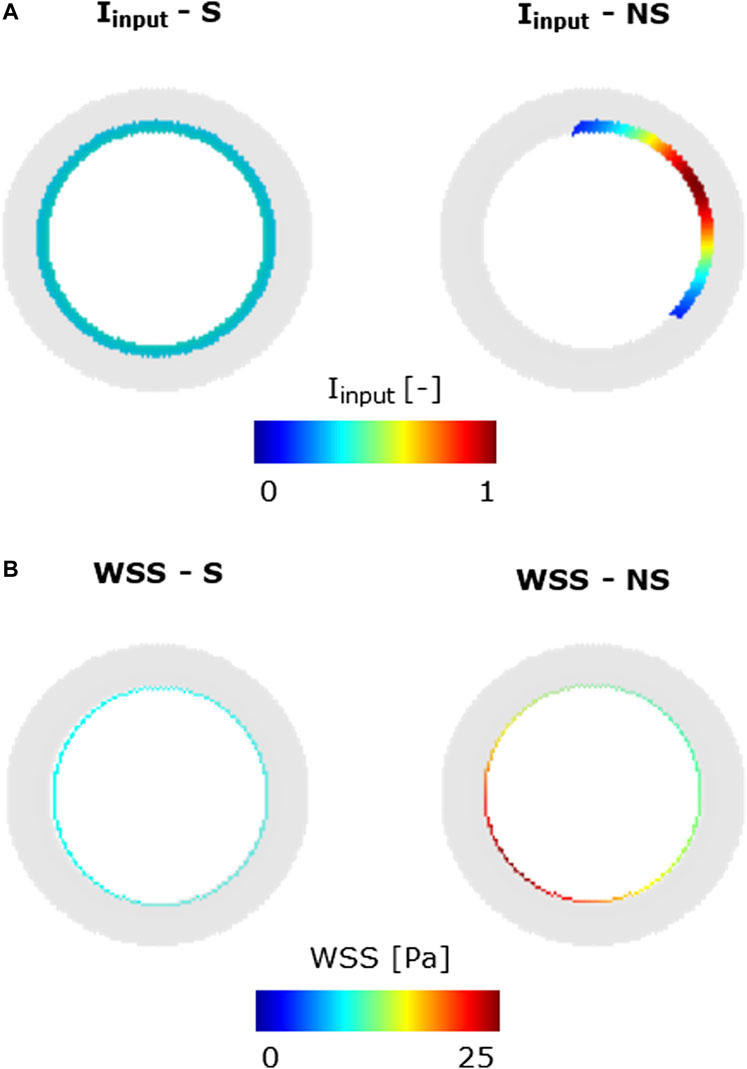
FIGURE 5. Inflammatory/hemodynamic-based input stimuli. (A)
Specifically, in scenarios 1–4, only one stimulus, either inflammatory or hemodynamic, was considered, with the MP and chemoattractant events deactivated. In scenarios 5 and 6, both the inflammation and hemodynamic stimuli were present, with the MP and chemoattractant events deactivated. Finally, in scenarios 7–14, the MP and chemoattractant events were activated and combined with different inflammation and hemodynamic WSS-based inputs. As regards the inflammation input, i) a S and uniform inflammation equal to 0.5 (representative of a mid-level inflammation) and ii) a NS inflammation localized at the top-right portion of the cross-section, with a peak of 1, were generated. As regards the hemodynamic input, i) an S WSS profile with
2.4 Generation of CAV cases
To explore the heterogeneous response of the ABM to different levels of
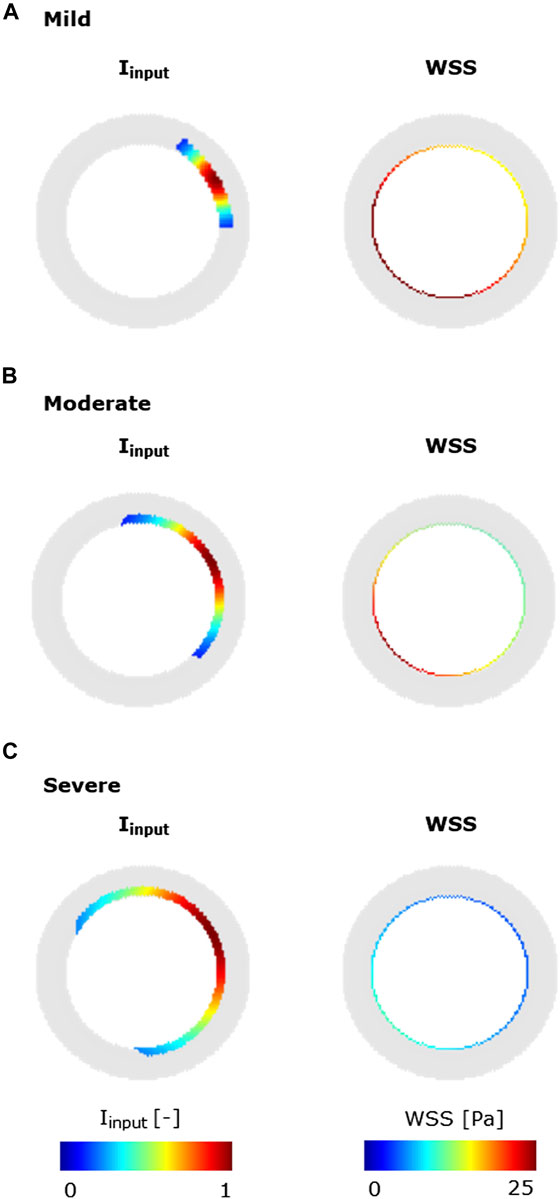
FIGURE 6. Inflammatory/hemodynamic-based stimuli leading to characteristic CAV manifestations. (A) Mild-CAV model initialized with a small inflammation region and WSS profile with a minimum value of 15 Pa and a maximum value of 35 Pa. (B) Moderate-CAV model initialized with the mid-dimension inflammation region and WSS profile with a minimum value of 8 Pa and a maximum value of 25 Pa. (C) Severe-CAV model initialized with a large inflammation region and WSS profile with a minimum value of 5 Pa and a maximum value of 10 Pa. The displayed WSS range was set to [0 25] Pa.
3 Results
3.1 Findings of sensitivity analysis
Figure 7 shows the PRCCs between the j = 17 parameters and the five ABM outputs of 17 ABM sites, at two time points, i.e., at the 1-week and 4-week follow-ups. At 1 week, four out of 17 parameters (i.e.,
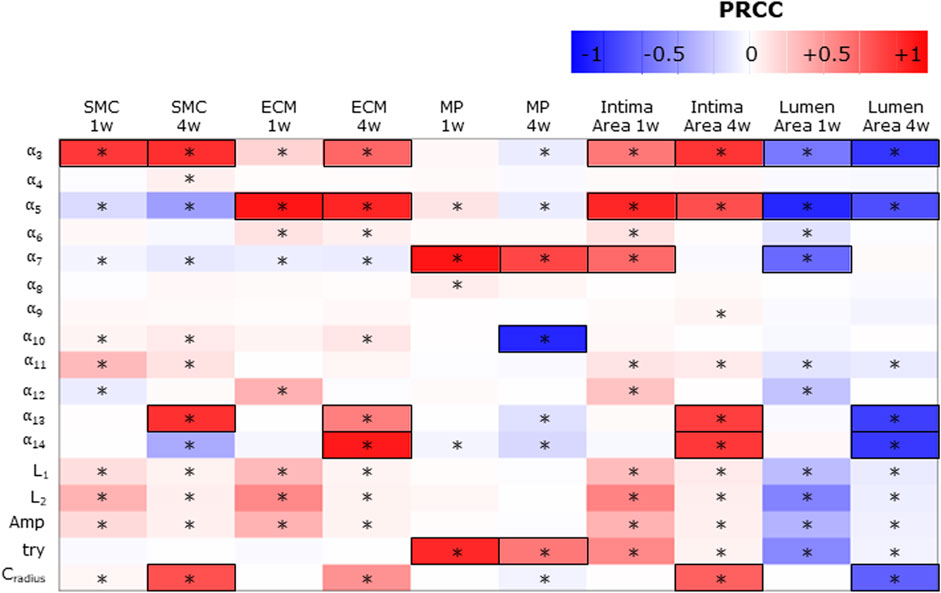
FIGURE 7. Sensitivity analysis results for intima variables, intima, and lumen areas. Partial rank correlation coefficients (PRCCs) between the ABM parameters and 1-week and 4-week smooth muscle cell (SMC), extracellular matrix (ECM), macrophage (MP), intima, and lumen areas. PRCCs range from −1 (blue) to +1 (red), with negative PRCCs corresponding to a negative correlation and positive PRCCs to a positive correlation. |PRCC| > 0.5 is squared in black. (*) Significant PRCC, p-value <0.05.
Consequently,
SMC and ECM intima contents are determined by SMC mitosis/apoptosis and media-to-intima migration and ECM production/degradation. As regards SMC mitosis/apoptosis and ECM production/degradation, the parameters associated with
The MP intima content is determined by MP infiltration and MP mitosis/apoptosis. As regards the parameters driving MP infiltration,
Finally, the parameters promoting the cellular contents (i.e.,
3.2 Test scenarios
Figures 8, 9 show the 4-week evolution of the ABM cross-section of the single-input and combined-input scenarios (1–4 and 5–6 in Table 5), and the combined input-event scenarios (7–14 in Table 5), respectively. For each scenario, the representative output cross-section was retrieved among the three repetitions, as anticipated in Section 2.1. Specifically, we computed the mean of the three lumen configuration outcomes and selected the result that exhibited the closest proximity to this average, determined by the mean squared error criterion, as detailed in Corti et al (2020). Figure 10 presents the corresponding normalized lumen area over the time (as median and IQR) of all the 14 scenarios. As presented in Figures 8–10: i) a greater intimal thickening was observed in correspondence of a low WSS or a high
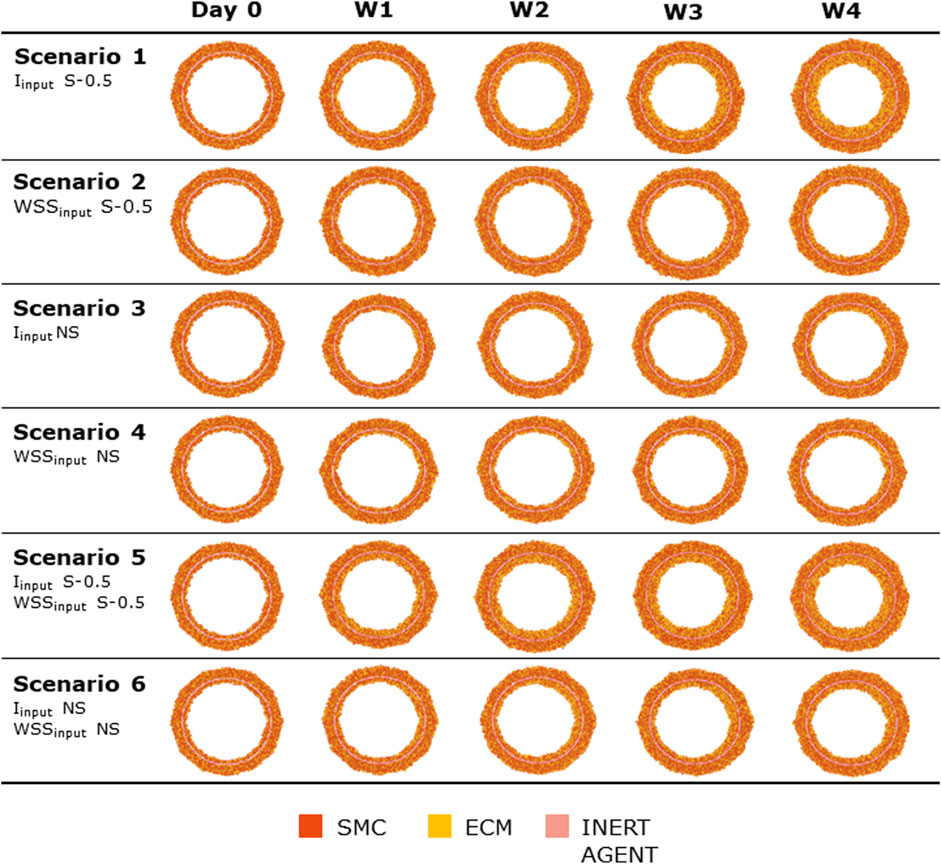
FIGURE 8. ABM temporal evolution. Simulations under scenarios 1–6 (Table 5) along 4 weeks (Day 0, W1, W2, W3, and W4). For each scenario, the results were retrieved from one out of three ABM simulations, namely, the one presenting the lumen configuration minimizing the root mean square deviation from the average one. W1, week 1; W2, week 2; W3, week 3; W4, week 4; NS, non-symmetric; S, symmetric.
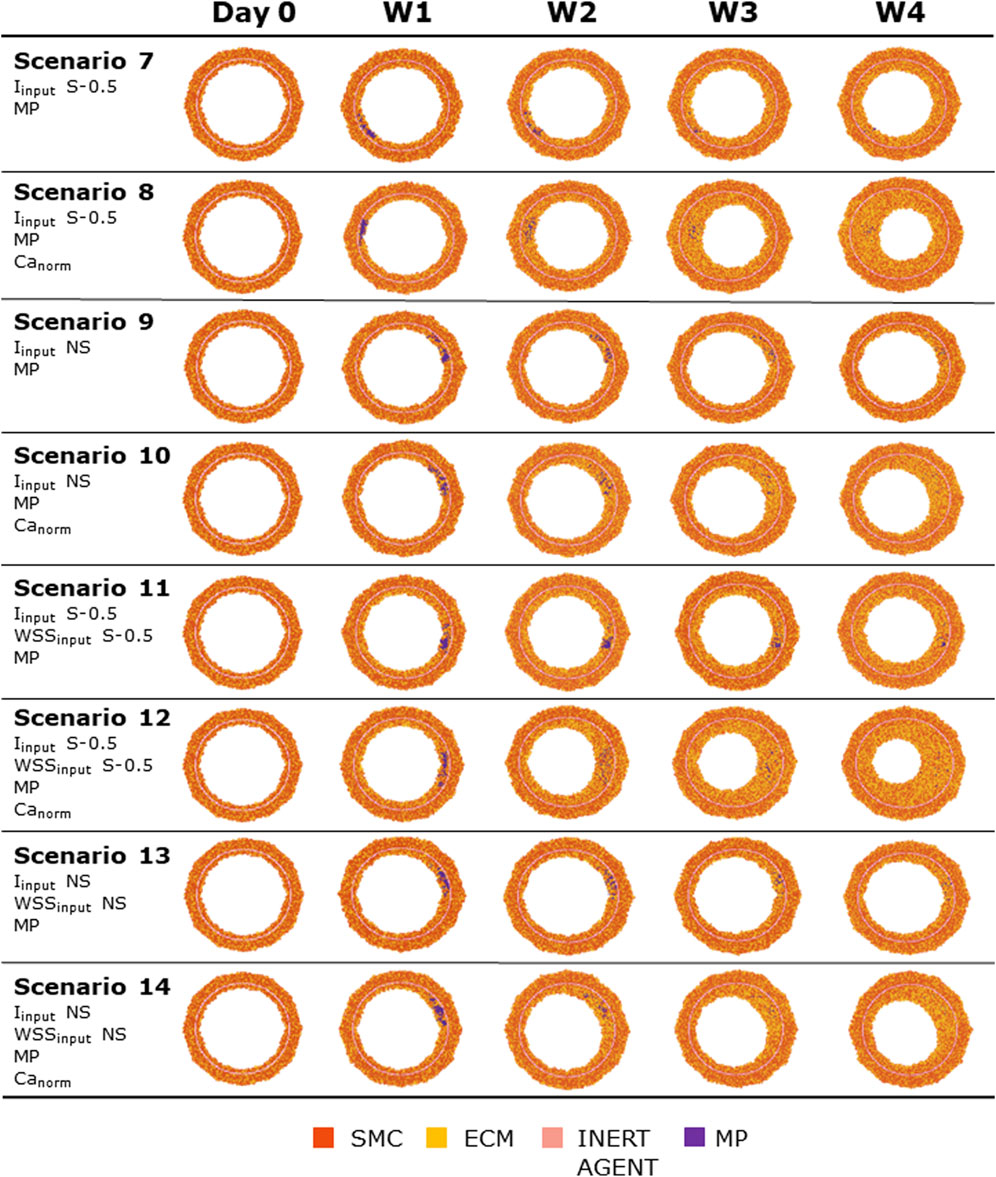
FIGURE 9. ABM temporal evolution. Simulations under scenarios 7–14 (Table 5) along 4 weeks (Day 0, W1, W2, W3, and W4). For each scenario, the results were retrieved from one out of three ABM simulations, namely, the one presenting the lumen configuration minimizing the root mean square deviation from the average one. W1, week 1; W2, week 2; W3, week 3; W4, week 4; NS, non-symmetric; S, symmetric.
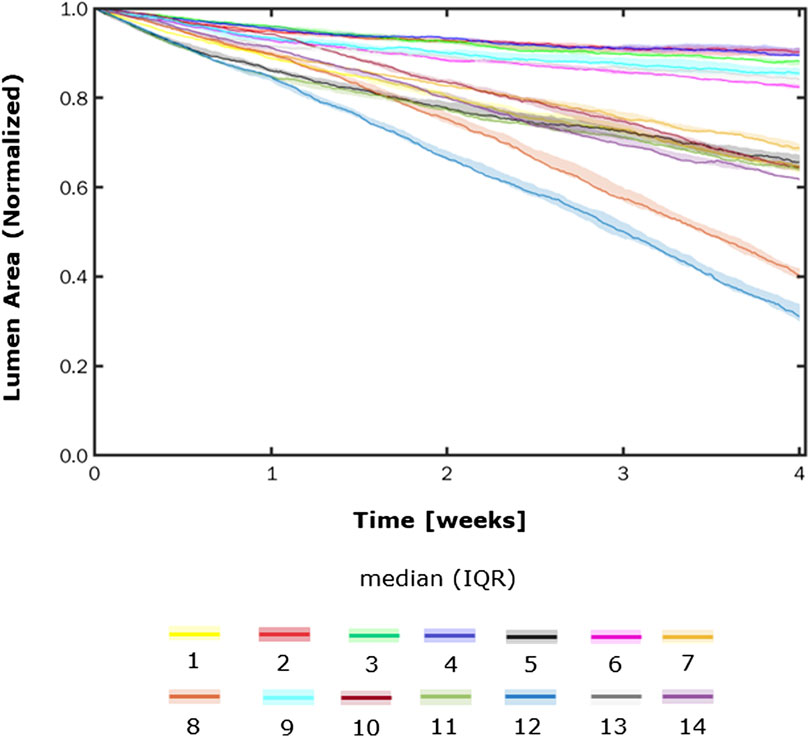
FIGURE 10. Normalized lumen area vs. time. Simulations under scenarios 1–14 (Table 5) along 4 weeks. The results are provided in terms of the median and interquartile range (IQR) obtained from three repetitions of each scenario.
More in detail, a slight NS intimal growth was obtained under single- and combined NS-input scenarios (scenarios 3, 4, and 6 in Figure 8) and in the presence of single- and combined NS-input with the solo MP infiltration (scenarios 9 and 13 in Figure 9), while a more pronounced NS geometry was observed when both the events were considered (scenarios 10 and 14 in Figure 9), due to the concurrent effects of MP cluster formation and chemoattractant diffusion. This qualitative observation was confirmed by the quantitative calculation of a 4-week NS-index i.e., the percentage ratio between the difference of maximum/minimum lumen radius expressed in polar coordinates and the initial lumen radius of 40 sites, from which we set a threshold of a high NS lumen configuration of 20% (scenario 3: NS-index = 14.78%, scenario 4: NS-index = 12.80%, scenario 6: NS-index = 13.88%, scenario 9: NS-index = 15.70%, scenario 13: NS-index = 15.85%, scenario 10: NS-index = 38.73%, and scenario 14: NS-index = 42.05%, listed in Table 6). As expected, with NS inputs, MP infiltration occurred in correspondence to the peak of
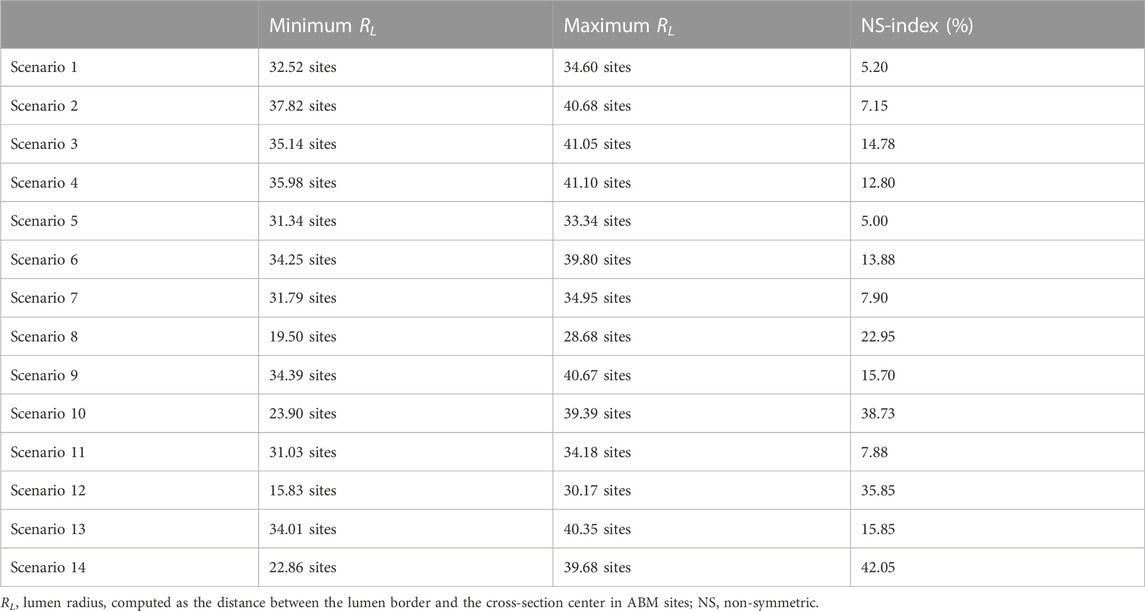
TABLE 6. NS-index for scenarios 1–14 at 4 weeks.
In all the scenarios, the lumen area temporal trend exhibited a linear decrease due to the time-independence of
3.3 CAV manifestations
The ABM exhibited heterogeneous CAV degree responses to mild, moderate, and severe NS—
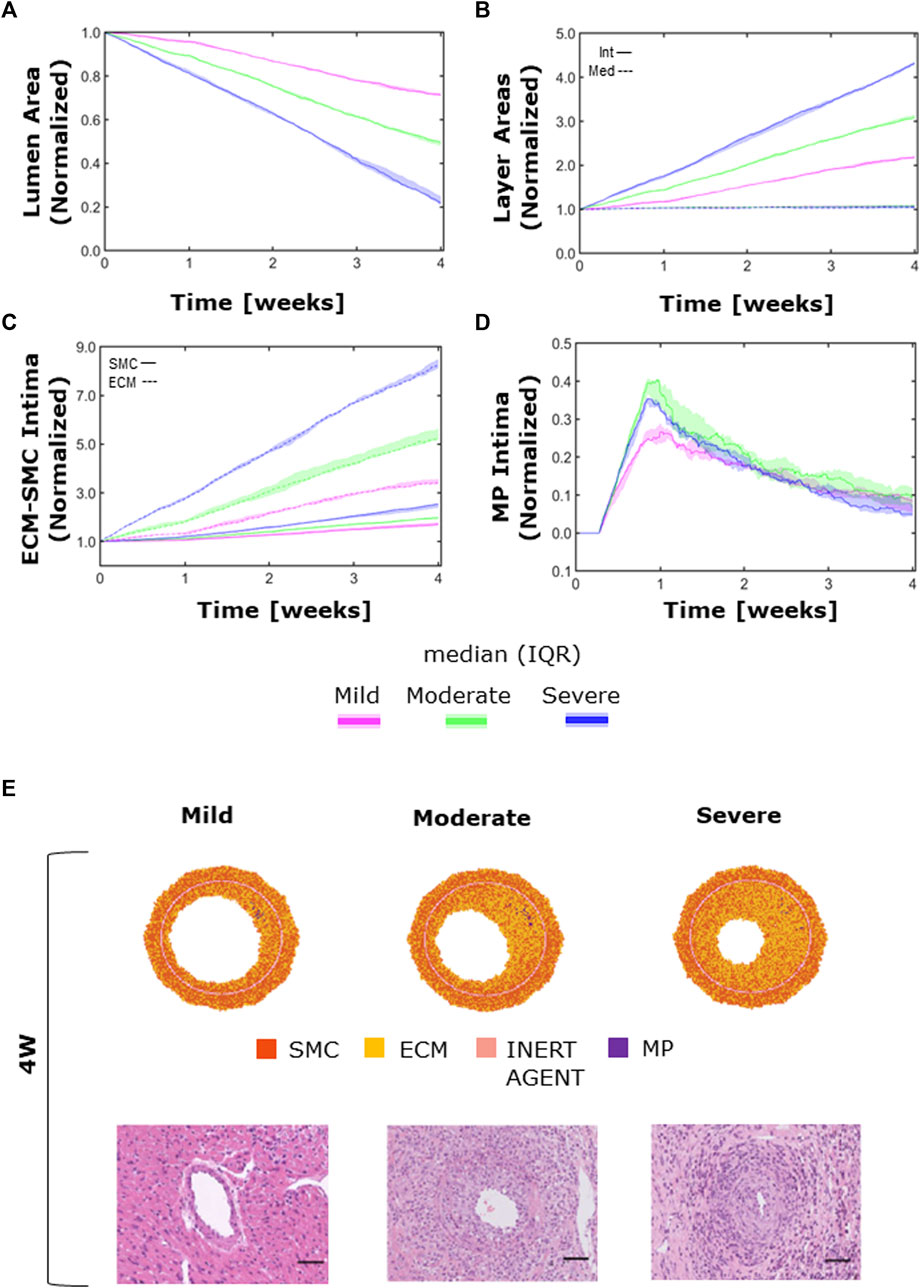
FIGURE 11. CAV temporal dynamics and qualitative validation. Temporal trends of (A) the lumen area; (B) intimal (solid line) vs. medial layer (dashed line); (C) SMC (solid line) vs. ECM (dashed line) intimal content; (D) MP intimal content; (E) qualitative validation: comparison between 4-week agent-based model (ABM) outputs and 4-week histological images of cardiac heterotopic transplantation mice model by Zhang et al. (2021) in mild- (left), moderate- (center), and severe (right)-CAV condition. Adapted with permission from Zhang et al. (2021) (https://creativecommons.org/licenses/by/4.0/).
Moreover, the ECM intima content exhibited a higher growth rate than the SMC intima content in all the three CAV cases (Figure 11C). This led to a change in the ECM/SMC relative composition: from an initial hypercellularity (60% SMC and 40% ECM) to a progressive hypocellularity at 4 weeks (56% SMC and 44% ECM in the mild-CAV case, 48% SMC and 52% ECM in the moderate-CAV case, and 42% SMC and 58% ECM in the severe-CAV case).
As regards MP, the temporal trend was characterized by an initial growth within 1 week and a decrease until the end of the 4 weeks, consistently with the ABM implementation explained in Section 2.1.2.1 (Figure 11D). Moreover, the MP content appears to be unrelated to the CAV degree from 1 week because apoptosis is promoted, and therefore MPs are irrelevant for the final areas (i.e., lumen and intima area), which are consequently determined only by the SMC and ECM contents. Figure 11E shows a qualitative comparison between the 4-week ABM representative outputs (selected among three repetitions, as Supplementary Figures S6) and the 4-week histological images of the cardiac heterotopic transplantation mice model without immunosuppressive treatment (Zhang et al., 2021). Both the ABM outputs and the histological images exhibit three degrees of CAV with comparable occlusions. However, the model produced more pronounced NS geometries (especially in the mild and moderate cases) compared to the histological images. Moreover, in the histological images, a greater and less localized content of MPs can be appreciated compared to the ABM cross-section outputs.
4 Discussion
The current study presents the first ABM-based approach to study CAV, contributing to a better understanding of this key pathology within chronic HTx rejection. Mouse-based in vivo models are considered the gold standard for CAV experimental studies in pre-clinical trials. Motivated by i) the advancements obtained by in silico modeling in the cardiovascular field, ii) the promising results of ABMs in deciphering mechanobiological mechanisms driving vascular adaptation, and iii) the suitability of computational models in providing high granularity of investigation time points with very limited resource consumption, this work proposed a 2D ABM of CAV initiation and progression in a mouse LCA model at the cell/tissue scale. The ABM was able to effectively replicate a 4-week CAV initiation and progression, characterized by lumen area decrease due to progressive intimal thickening in regions exposed to high inflammation and low WSS. While hemodynamic-based vascular remodeling processes were already simulated in previous ABMs by our research group (Garbey et al., 2017; Corti et al., 2019; Corti et al., 2020; Corti et al., 2022a; Corti et al., 2022b; Corti et al., 2023b; Corti et al., 2023a), the explicit modeling of inflammatory processes is the key novelty of the present work, being crucial to capture CAV-related phenomena. In particular, the simulated inflammatory cascade encompassed macrophage infiltration in the arterial wall and subsequent mitosis/apoptosis and chemoattractant release, in turn affecting SMC activity. To the best of the authors’ knowledge, except for Bhui and Hayenga (2017), who focused on atherosclerosis, the present study proposes the first ABM of vascular maladaptive phenomena in which the effect of the inflammatory input on immune cell dynamics (e.g., macrophage infiltration) is discerned from other triggers (e.g., hemodynamics) and explicitly simulated.
As emerged through the sensitivity analysis, the inflammatory input constituted the main trigger compared to the WSS-based one. This was consistent with the CAV inflammatory nature and suggested that WSS alone does not support the development of CAV. Moreover, CAV development and progression was governed by the synergic interplay of cellular and molecular events derived from the inflammatory input (MP infiltration and dynamics, chemoattractant diffusion, and SMC media-to-intima migration) rather than by one specific event. The identification of the driving parameters allowed not only gaining insights into the working mechanisms of the ABM but also laying the basis for a future calibration against ad hoc in vivo data. Indeed, the primary role played by inflammatory-related events suggests that a future quantitative calibration of the ABM should primarily focus on the inflammatory coefficients found to be statistically significant in driving CAV. As demonstrated in Corti et al. (2022b), this would enable a more efficient calibration, guaranteeing a good accuracy with low computational costs.
The model was also sensitive to different inputs (i.e., S or NS
The ABM was able to effectively replicate three degrees of CAV under different levels of inflammatory and hemodynamic stimuli. Similar to the histological findings reported by Zhang et al. (2021), the simulated CAV development manifested as a progressive lumen area reduction due to intimal growth determined by the increased SMC and ECM content in the intima. Conversely, in the ABM, MPs did not contribute to intimal area increase: their intimal content over time was characterized by an initial increase, due to infiltration and mitosis (which was favored up to 1 week), followed by a progressive decrease, leading to scarce presence of MPs in the intima at the 4-week follow-up. Although not remarkably contributing to the intimal growth, a greater MP intimal content was present in the histological images, suggesting the need for calibrating the MP dynamics to reflect the histological findings. Moreover, the ABM ECM/SMC relative composition changed during CAV progression, from an initial hypercellularity to a progressive hypocellularity at 4 weeks. However, due to the lack of literature data and the inability to detect ECM/SMC composition in the histological images, at the current stage it was not possible to calibrate the model and assess the reliability of this behavior.
Although minor discrepancies between the model outputs and the histological images were found, the ABM was able to capture major CAV characteristics, thus representing a viable proof-of-concept of CAV in an idealized 2D artery.
The study is not exempt from limitations. First, being a preliminary and methodological investigation, an idealized vessel cross-section geometry was considered. This enabled a robust analysis, allowing to test and refine the model, before applying it to a more realistic vessel geometry. Second, i) SMCs and MPs were the only two cellular phenotypes considered in the ABM, with SMCs being the major arterial wall components and MPs the major players (among the graft-infiltrating cells) in chronic rejection (Vergani et al., 2013; Liu et al., 2016; Lee et al., 2018) and ii) a generic molecule was assumed to represent the action of different released factors (e.g., IFN-γ, IL-2, and TNF-α) on vascular cells. Although simplified, these assumptions allowed qualitatively replicating the pattern of graft-infiltrating cells reported in the literature (McLean et al., 1997; Liu et al., 2016; Ordikhani et al., 2020) and the chemoattractant effect of molecules released by the inflammatory cells. Third, only the WSS was considered a hemodynamic factor, which resulted in not being relevant for CAV development. In future, both the direct and indirect role of hemodynamics in CAV development will be addressed. Regarding the direct role, other hemodynamic descriptors in addition to WSS magnitude (Candreva et al., 2022) could be considered. Regarding the indirect role, the blood transport of immune cells could be investigated. Finally, herein, a qualitative comparison of the model outputs with histological data from the literature was performed due to the lack of experimental available data. Future efforts must be focused on calibrating and validating the model, based on in vivo data (vessel geometry, cellular and molecular profiles, etc.).
Although constituting a proof-of-concept, this study demonstrated the potentiality of the developed ABM in gaining further insights in the vasculopathy. Once calibrated and validated, the ABM can be used to support the in vivo research, for example, by i) representing a generator of hypotheses of CAV-promoting mechanisms, in turn driving experimental analyses; ii) constituting a digital twin of experimental setups, allowing quantifying processes and variables hardly retrievable in vivo; and iii) preliminary testing anti-chronic rejection treatments.
5 Conclusion
In this work, an ABM simulating CAV was developed. The proposed ABM effectively replicated a 4-week CAV initiation and progression dynamics in an idealized LCA mouse cross-section. The model was driven by inflammatory and WSS-based stimuli, triggering MP infiltration and subsequent chemoattractant diffusion and perturbed vascular cell activities. The ABM captured relevant CAV features, including: i) decrease in the lumen area and progressive intimal thickening in regions subjected to high inflammation and low WSS, ii) S and NS occlusions mirroring the different experimental outcomes, and iii) the predominant role of inflammation rather than WSS in CAV initiation and progression, confirming the inflammatory nature of the vasculopathy. Our model lays the foundation toward an experimental–computational integrated analysis of CAV, including calibration and validation processes on mouse datasets, to deepen the understanding of the pathology and potentially optimize anti-chronic rejection treatments.
Data availability statement
The original contributions presented in the study are included in the article/Supplementary Material; further inquiries can be directed to the corresponding author.
Author contributions
ES and AC: formal analysis, investigation, methodology, software, results interpretation, writing—original draft, and writing—review and editing; DG: supervision, formal analysis, result interpretation, and writing—review and editing; CC: supervision, formal analysis, result interpretation, and writing—review and editing; XL: conceptualization and writing—review and editing; SC: conceptualization, formal analysis, result interpretation, resources, supervision, writing—original draft, and writing—review and editing. All authors contributed to the article and approved the submitted version.
Funding
AC and CC have been partially supported by Fondazione Cariplo, Italy (Grant number 2017-0792, TIME).
Conflict of interest
The authors declare that the research was conducted in the absence of any commercial or financial relationships that could be construed as a potential conflict of interest.
Publisher’s note
All claims expressed in this article are solely those of the authors and do not necessarily represent those of their affiliated organizations, or those of the publisher, the editors, and the reviewers. Any product that may be evaluated in this article, or claim that may be made by its manufacturer, is not guaranteed or endorsed by the publisher.
Supplementary material
The Supplementary Material for this article can be found online at: https://www.frontiersin.org/articles/10.3389/fbioe.2023.1190409/full#supplementary-material
Abbreviations
ABM, agent-based model; CAV, cardiac allograft vasculopathy; ECM, extracellular matrix; HTx, heart transplant; IEL, internal elastic lamina; LCA, left coronary artery; MP, macrophage; PRCC, partial rank correlation coefficient; SMC, smooth muscle cell; WSS, wall shear stress.
References
Araujo, A., Cook, L. M., Lynch, C. C., and Basanta, D. (2014). An integrated computational model of the bone microenvironment in bone-metastatic prostate cancer. Cancer Res. 74, 2391–2401. doi:10.1158/0008-5472.CAN-13-2652
Barh, D., Chaitankar, V., Yiannakopoulou, E. C., Salawu, E. O., Chowbina, S., Ghosh, P., et al. (2014). In silico models: from simple networks to complex diseases. Anim. Biotechnol., 385–404. doi:10.1016/B978-0-12-416002-6.00021-3
Bhui, R., and Hayenga, H. N. (2017). An agent-based model of leukocyte transendothelial migration during atherogenesis. PLoS Comput. Biol. 13, e1005523–23. doi:10.1371/journal.pcbi.1005523
Candreva, A., De Nisco, G., Lodi Rizzini, M., D’Ascenzo, F., De Ferrari, G. M., Gallo, D., et al. (2022). Current and future applications of computational fluid dynamics in coronary artery disease. Rev. Cardiovasc. Med. 23, 377. doi:10.31083/j.rcm2311377
Chambers, D. C., Perch, M., Zuckermann, A., Cherikh, W. S., Harhay, M. O., Hayes, D. J., et al. (2021). The international thoracic organ transplant registry of the international society for heart and lung transplantation: ahirty-eighth adult lung transplantation report - 2021; focus on recipient characteristics. J. Hear. lung Transpl. Off. Publ. Int. Soc. Hear. Transpl. 40, 1060–1072. doi:10.1016/j.healun.2021.07.021
Chih, S., Chong, A. Y., Mielniczuk, L. M., Bhatt, D. L., and Beanlands, R. S. B. (2016). Allograft vasculopathy: the achilles’ heel of heart transplantation. J. Am. Coll. Cardiol. 68, 80–91. doi:10.1016/j.jacc.2016.04.033
Corti, A., Casarin, S., Chiastra, C., Colombo, M., Migliavacca, F., and Garbey, M. (2019). “A multiscale model of atherosclerotic plaque development: toward a coupling between an agent-based model and CFD simulations,” in Lecture notes in computer science (including subseries lecture notes in artificial intelligence and lecture notes in bioinformatics), 410–423. doi:10.1007/978-3-030-22747-0_31
Corti, A., Chiastra, C., Colombo, M., Garbey, M., Migliavacca, F., and Casarin, S. (2020). A fully coupled computational fluid dynamics – agent-based model of atherosclerotic plaque development: multiscale modeling framework and parameter sensitivity analysis. Comput. Biol. Med. 118, 103623. doi:10.1016/j.compbiomed.2020.103623
Corti, A., Colombo, M., Migliavacca, F., Rodriguez Matas, J. F., Casarin, S., and Chiastra, C. (2021). Multiscale computational modeling of vascular adaptation: a systems biology approach using agent-based models. Front. Bioeng. Biotechnol. 9, 744560. doi:10.3389/fbioe.2021.744560
Corti, A., Colombo, M., Migliavacca, F., Berceli, S. A., Casarin, S., Rodriguez Matas, J. F., et al. (2022a). Multiscale agent-based modeling of restenosis after percutaneous transluminal angioplasty: effects of tissue damage and hemodynamics on cellular activity. Comput. Biol. Med. 147, 105753. doi:10.1016/j.compbiomed.2022.105753
Corti, A., Colombo, M., Rozowsky, J. M., Casarin, S., He, Y., Carbonaro, D., et al. (2022b). A predictive multiscale model of in-stent restenosis in femoral arteries: linking haemodynamics and gene expression with an agent-based model of cellular dynamics. J. R. Soc. Interface 19, 20210871. doi:10.1098/rsif.2021.0871
Corti, A., McQueen, A., Migliavacca, F., Chiastra, C., and McGinty, S. (2023a). Investigating the effect of drug release on in-stent restenosis: a hybrid continuum – agent-based modelling approach. Comput. Methods Programs Biomed. 241, 107739. doi:10.1016/j.cmpb.2023.107739
Corti, A., Migliavacca, F., Berceli, S. A., and Chiastra, C. (2023b). Predicting 1-year in-stent restenosis in superficial femoral arteries through multiscale computational modelling. J. R. Soc. Interface 20, 20220876. doi:10.1098/rsif.2022.0876
Dharmavaram, N., Hess, T., Jaeger, H., Smith, J., Hermsen, J., Murray, D., et al. (2021). National trends in heart donor usage rates: are we efficiently transplanting more hearts? J. Am. Heart Assoc. 10, e019655. doi:10.1161/JAHA.120.019655
Feng, Y., Wang, X., Fan, T., Li, L., Sun, X., Zhang, W., et al. (2018). Bifurcation asymmetry of small coronary arteries in juvenile and adult mice. Front. Physiol. 9, 519. doi:10.3389/fphys.2018.00519
Garbey, M., Rahman, M., and Berceli, S. (2015). A multiscale computational framework to understand vascular adaptation. J. Comput. Sci. 8, 32–47. doi:10.1016/j.jocs.2015.02.002
Garbey, M., Casarin, S., and Berceli, S. A. (2017). Vascular adaptation: pattern formation and cross validation between an agent based model and a dynamical system. J. Theor. Biol. 429, 149–163. doi:10.1016/j.jtbi.2017.06.013
Gierig, M., Wriggers, P., and Marino, M. (2023). Arterial tissues and their inflammatory response to collagen damage: a continuum in silico model coupling nonlinear mechanics, molecular pathways, and cell behavior. Comput. Biol. Med. 158, 106811. doi:10.1016/j.compbiomed.2023.106811
Goodhill, G. J. (1998). Mathematical guidance for axons. Trends Neurosci. 21, 226–231. doi:10.1016/S0166-2236(97)01203-4
Helms, S. A., Azhar, G., Zuo, C., Theus, S. A., Bartke, A., and Wei, J. Y. (2010). Smaller cardiac cell size and reduced extra-cellular collagen might be beneficial for hearts of Ames dwarf mice. Int. J. Biol. Sci. 6, 475–490. doi:10.7150/ijbs.6.475
Khush, K. K., Cherikh, W. S., Chambers, D. C., Harhay, M. O., Hayes, D. J., Hsich, E., et al. (2019). The international thoracic organ transplant registry of the international society for heart and lung transplantation: thirty-sixth adult heart transplantation report - 2019; focus theme: donor and recipient size match. J. Hear. Lung Transpl. Off. Publ. Int. Soc. Hear. Transpl. 38, 1056–1066. doi:10.1016/j.healun.2019.08.004
Kloc, M., and Ghobrial, R. M. (2014). Chronic allograft rejection: a significant hurdle to transplant success. Burn. Trauma 2, 3–10. doi:10.4103/2321-3868.121646
Lee, M. S., Tadwalkar, R. V., Fearon, W. F., Kirtane, A. J., Patel, A. J., Patel, C. B., et al. (2018). Cardiac allograft vasculopathy: A review. Catheter. Cardiovasc. Interv. 92, E527–E536. doi:10.1002/ccd.27893
Liu, Y., Kloc, M., and Li, X. C. (2016). Macrophages as effectors of acute and chronic allograft injury. Curr. Transpl. Rep. 3, 303–312. doi:10.1007/s40472-016-0130-9
Louis, S. F., and Zahradka, P. (2010). Vascular smooth muscle cell motility: from migration to invasion. Exp. Clin. Cardiol. 15, e75–e85.
Marino, S., Hogue, I. B., Ray, C. J., and Kirschner, D. E. (2008). A methodology for performing global uncertainty and sensitivity analysis in systems biology. J. Theor. Biol. 254, 178–196. doi:10.1016/j.jtbi.2008.04.011
McLean, A. G., Hughes, D., Welsh, K. I., Gray, D. W., Roake, J., Fuggle, S. V., et al. (1997). Patterns of graft infiltration and cytokine gene expression during the first 10 days of kidney transplantation. Transplantation 63, 374–380. doi:10.1097/00007890-199702150-00008
Ordikhani, F., Pothula, V., Sanchez-Tarjuelo, R., Jordan, S., and Ochando, J. (2020). Macrophages in organ transplantation. Front. Immunol. 11, 582939. doi:10.3389/fimmu.2020.582939
Pai, V. M., Kozlowski, M., Donahue, D., Miller, E., Xiao, X., Chen, M. Y., et al. (2012). Coronary artery wall imaging in mice using osmium tetroxide and micro-computed tomography (micro-CT). J. Anat. 220, 514–524. doi:10.1111/j.1469-7580.2012.01483.x
Panteleev, M. A., Korin, N., Reesink, K. D., Bark, D. L., Cosemans, J. M. E. M., Gardiner, E. E., et al. (2021). Wall shear rates in human and mouse arteries: standardization of hemodynamics for in vitro blood flow assays: communication from the ISTH SSC subcommittee on biorheology. J. Thromb. Haemost. 19, 588–595. doi:10.1111/jth.15174
Pighi, M., Gratta, A., Marin, F., Bellamoli, M., Lunardi, M., Fezzi, S., et al. (2020). Cardiac allograft vasculopathy: pathogenesis, diagnosis and therapy. Transpl. Rev. 34, 100569. doi:10.1016/j.trre.2020.100569
Pober, J. S., Chih, S., Kobashigawa, J., Madsen, J. C., and Tellides, G. (2021). Cardiac allograft vasculopathy: current review and future research directions. Cardiovasc. Res. 117, 2624–2638. doi:10.1093/cvr/cvab259
Spartalis, M., Spartalis, E., and Siasos, G. (2022). Cardiac allograft vasculopathy after heart transplantation: pathophysiology, detection approaches, prevention, and treatment management. Trends cardiovasc. Med. 32, 333–338. doi:10.1016/j.tcm.2021.07.002
Stehlik, J., Kobashigawa, J., Hunt, S. A., Reichenspurner, H., and Kirklin, J. K. (2018). Honoring 50 Years of clinical heart transplantation in circulation: in-depth state-of-the-art review. Circulation 137, 71–87. doi:10.1161/CIRCULATIONAHA.117.029753
Teng, B., Tilley, S. L., Ledent, C., and Mustafa, S. J. (2016). In vivo assessment of coronary flow and cardiac function after bolus adenosine injection in adenosine receptor knockout mice. Physiol. Rep. 4, e12818. doi:10.14814/phy2.12818
Timmins, L. H., MacKie, B. D., Oshinski, J. N., Giddens, D. P., and Samady, H. (2013). Colocalization of low and oscillatory coronary wall shear stress with subsequent culprit lesion resulting in myocardial infarction in an orthotopic heart transplant patient. JACC Cardiovasc. Interv. 6, 1210–1211. doi:10.1016/j.jcin.2013.03.024
Timmins, L. H., Gupta, D., Corban, M. T., Molony, D. S., Oshinski, J. N., Samady, H., et al. (2015). Co-Localization of disturbed flow patterns and occlusive cardiac allograft vasculopathy lesion formation in heart transplant patients. Cardiovasc. Eng. Technol. 6, 25–35. doi:10.1007/s13239-014-0198-2
Vergani, A., Tezza, S., D’Addio, F., Fotino, C., Liu, K., Niewczas, M., et al. (2013). Long-term heart transplant survival by targeting the ionotropic purinergic receptor P2X7. Circulation 127, 463–475. doi:10.1161/circulationaha.112.123653
Von Rossum, A., Laher, I., and Choy, J. C. (2014). Immune-mediated vascular injury and dysfunction in transplant arteriosclerosis. Front. Immunol. 5, 684–714. doi:10.3389/fimmu.2014.00684
Wang, G., Zou, D., Wang, Y., Gonzalez, N. M., Yi, S. G., Li, X. C., et al. (2021). IRF4 ablation in B cells abrogates allogeneic B cell responses and prevents chronic transplant rejection. J. Hear. Lung Transpl. 40, 1122–1132. doi:10.1016/j.healun.2021.06.008
Waters, S. L., Alastruey, J., Beard, D. A., Bovendeerd, P. H. M., Davies, P. F., Jayaraman, G., et al. (2011). Theoretical models for coronary vascular biomechanics: progress & challenges. Prog. Biophys. Mol. Biol. 104, 49–76. doi:10.1016/j.pbiomolbio.2010.10.001
Zhang, L., Kloc, M., Tejpal, N., You, J., Cordero-Reyes, A. M., Youker, K. A., et al. (2012). Rock1 inhibitor abrogates chronic rejection in rat cardiac model system. Open J. Organ Transpl. Surg. 02, 46–51. doi:10.4236/ojots.2012.24012
Keywords: heart transplant, chronic rejection, cardiac allograft vasculopathy, arterial wall remodeling, coronary artery, computational model, agent-based modeling, sensitivity analysis
Citation: Serafini E, Corti A, Gallo D, Chiastra C, Li XC and Casarin S (2023) An agent-based model of cardiac allograft vasculopathy: toward a better understanding of chronic rejection dynamics. Front. Bioeng. Biotechnol. 11:1190409. doi: 10.3389/fbioe.2023.1190409
Received: 20 March 2023; Accepted: 17 August 2023;
Published: 12 September 2023.
Edited by:
Jerome Noailly, Pompeu Fabra University, SpainReviewed by:
Michele Marino, University of Rome Tor Vergata, ItalyEdoardo Borgiani, University of Liège, Belgium
Copyright © 2023 Serafini, Corti, Gallo, Chiastra, Li and Casarin. This is an open-access article distributed under the terms of the Creative Commons Attribution License (CC BY). The use, distribution or reproduction in other forums is permitted, provided the original author(s) and the copyright owner(s) are credited and that the original publication in this journal is cited, in accordance with accepted academic practice. No use, distribution or reproduction is permitted which does not comply with these terms.
*Correspondence: Stefano Casarin, scasarin@houstonmethodist.org
†These authors have contributed equally to this work and share first authorship