Identifying Small Molecule-miRNA Associations Based on Credible Negative Sample Selection and Random Walk
 Fuxing Liu
 Lihong Peng
 Geng Tian2
  Jialiang Yang
 Liqian Zhou
- 1School of Computer Science, Hunan University of Technology, Zhuzhou, China
- 2Geneis (Beijing) Co. Ltd., Beijing, China
- 3College of Chemical Engineering, Xiangtan University, Xiangtan, China
- 4Xiangya Second Hospital, Central South University, Changsha, Hunan, China
Recently, many studies have demonstrated that microRNAs (miRNAs) are new small molecule drug targets. Identifying small molecule-miRNA associations (SMiRs) plays an important role in finding new clues for various human disease therapy. Wet experiments can discover credible SMiR associations; however, this is a costly and time-consuming process. Computational models have therefore been developed to uncover possible SMiR associations. In this study, we designed a new SMiR association prediction model, RWNS. RWNS integrates various biological information, credible negative sample selections, and random walk on a triple-layer heterogeneous network into a unified framework. It includes three procedures: similarity computation, negative sample selection, and SMiR association prediction based on random walk on the constructed small molecule-disease-miRNA association network. To evaluate the performance of RWNS, we used leave-one-out cross-validation (LOOCV) and 5-fold cross validation to compare RWNS with two state-of-the-art SMiR association methods, namely, TLHNSMMA and SMiR-NBI. Experimental results showed that RWNS obtained an AUC value of 0.9829 under LOOCV and 0.9916 under 5-fold cross validation on the SM2miR1 dataset, and it obtained an AUC value of 0.8938 under LOOCV and 0.9899 under 5-fold cross validation on the SM2miR2 dataset. More importantly, RWNS successfully captured 9, 17, and 37 SMiR associations validated by experiments among the predicted top 10, 20, and 50 SMiR candidates with the highest scores, respectively. We inferred that enoxacin and decitabine are associated with mir-21 and mir-155, respectively. Therefore, RWNS can be a powerful tool for SMiR association prediction.
1. Introduction
miRNA is a small non-coding RNA molecule found in human beings, animals, plants, and even viruses (Bartel, 2004; Borges and Martienssen, 2015; Gebert and MacRae, 2019; Zhang et al., 2019b). miRNA can regulate gene expression and influence basic cellular functions, including proliferation, differentiation, and death (Lu et al., 2005; Gong et al., 2019). Overexpression and misregulation of miRNAs can result in great regulatory upheavals in the cell (Lu et al., 2005; Croce, 2009; Shigemizu et al., 2019) and produce phenotypes of human disease states (Trang et al., 2009; Chen et al., 2017a). For example, miR-21 is a well-known oncogenic miRNA, and its overexpression may result in onset of a variety of cancers, including ovarian, breast, lung, and gastric cancers (Esteller, 2011; Simonian et al., 2018). In Gastric Cancer (GC), its upregulation may lead to the suppression of tumor-suppressor genes, including PTEN, RECK, and PDCD4 (Kim et al., 2013), and promote proliferation, migration, and apoptosis inhibition (Zhang et al., 2008). Although miRNAs were discovered in the early 1990s (Lee et al., 1993; Wightman et al., 1993), related research did not achieve further progress until the 2000s (Reinhart et al., 2000; Lau et al., 2001). Many research studies have suggested that miRNAs play important roles in controlling many severe diseases, and miRNA can associate with diseases. Many computational models have been proposed to mine associations between miRNA and disease, such as AMVML (Liang et al., 2019), LPLNS (Li et al., 2018), and GRNMF (Xiao et al., 2017). Most drugs are composed of small molecules with a low molecular weight(<900 Daltons) (Huangfu et al., 2008). Small molecule drugs can regulate numerous cellular processes and thus heal diverse complex diseases (Lamb et al., 2006; Warner et al., 2018; Zhang et al., 2019a). More importantly, small molecules can inhibit miRNA pathways and regulate the metabolisms of humans (Sonnenburg and Bäckhed, 2016). New clues have been provided for various human disease therapies, including immune disorders and cancers, based on small molecules targeting miRNAs (Sevignani et al., 2006; Zhang et al., 2010; Abba et al., 2017; De Santi et al., 2017). For example, small molecules can inhibit the expression of miR-21 to activate tumor-suppressor genes by targeting miR-21 (Masoudi et al., 2018). Therefore, it has become a new therapy for human diseases to find miRNAs interacting with small molecules. Wet experiments discovered several Small Molecule drug-miRNA (SMiR) associations (Qu et al., 2018; Chen et al., 2020); however, this is a costly and time-consuming process. Therefore, various computational models are currently being explored to uncover potential SMiR associations based on small molecule similarity, the disease phenotype similarity of miRNA, and the SMiR association network (Monroig et al., 2015; Chen et al., 2020). Lv et al. (2011) and Qu et al. (2018) proposed SMiR association models based on random walk with restart. Jiang et al. (2012) identified new SMiR associations based on the expression difference of miRNA target genes and therapy drugs from 17 different cancers. Meng et al. (2014) explored a systematic computational model (smiRN-AD) to construct a bioactive SMiR association Network. smiRN-AD integrated gene expression data from bioactive small molecule perturbation and Alzheimer's disease-related miRNA regulation. Li et al. (2016) designed a network-based miRNA pharmacogenomic model, SMiR-NBI, integrating relevant biological information, including drugs, miRNAs, genes, and a network-based inference approach into a unified framework. SMiR-NBI effectively discovered potential response mechanisms of anticancer drugs targeting miRNAs and found that miRNAs may be underlying pharmacogenomic biomarkers in cancers. Chen et al. (2017b) developed an NRDTD database. NRDTD provides 165 non-coding RNA-drug associations supported by wet and clinical experiments from 96 drugs and 97 non-coding RNAs. Wang et al. (2019) developed a random forest-based SMiR prediction model, RFSMMA. Zhao et al. (2020) found SMiR association candidates based on symmetric non-negative matrix factorization and Kronecker regularized least squares. Yin et al. (2019) discovered underlying SMiR association-based sparse learning and heterogeneous graph inference. Qu et al. (2019) identified possible SMiR associations based on the HeteSim algorithm. These methods effectively improved SMiR association prediction performances. However, no negative samples (non-associating SMiR pairs) were available for validation. Therefore, these models had to randomly select parts of unobserved small molecule-miRNA pairs (unlabeled samples) as negative samples. However, these extracted negative samples probably contained positive SMiR associations, and this thus severely affects the prediction performance of computational models. More importantly, some methods, for example, TLHNSMMA (Qu et al., 2018), require numerous computational resources. Inspired by graph embedding methods on biomedical networks (Yue et al., 2020), we developed a new SMiR association prediction model, RWNS, integrating credible negative sample selection, random walk with restart, and diverse biological information into a unified framework. It includes three procedures: similarity computation, negative sample selection, and SMiR association prediction based on random walk with restart on the constructed small molecule-disease-miRNA association network (triple-layer network). RWNS computed small molecule similarity based on side effects, chemical structures, disease phenotypes, and gene functional consistency and miRNA similarity based on disease phenotypes and gene functional consistency. RWNS selected highly credible negative SMiR associations based on obtained similarity information. RWNS then iteratively performed a random walk with restart on the constructed triple-layer heterogeneous network to propagate association information and discover SMiR candidates. To evaluate the performance of RWNS, we used leave-one-out cross-validation (LOOCV) and 5-fold cross validation to compare RWNS with two state-of-the-art SMiR association methods, namely, TLHNSMMA and SMiR-NBI. Experimental results showed that RWNS obtained better improvement, and enoxacin and decitabine may be associated with mir-21 and mir-155, respectively. Therefore, RWNS could be a powerful tool for SMiR association prediction.
2. Materials and Methods
2.1. Small Molecule-miRNA Associations
The SMiR association network was obtained from the SM2miRdatabase (Liu et al., 2012). There are 664 experimentally validated SMiR associations in the database. Two datasets were applied to compare the performance of RWNS with two state-of-the-art methods, TLHNSMMA and SMiR-NBI. Dataset 1 (SM2miR1) contained 831 small molecules and 541 miRNAs. Dataset 2 (SM2miR2) contained 39 small molecules and 286 miRNAs. Only a part of the small molecules and miRNAs were involved in the known 664 SMiR associations from the SM2miRdatabase in dataset 1; however, all small molecules and miRNAs were fully involved in the known 664 SMiR associations in dataset 2.
An adjacency matrix Msm was used to indicate the known SMiR associations. The value of Msm(i,j) was 1/664 if a small molecule s(i) interacted with an miRNA m(j), and otherwise it was 0. Furthermore, variables s and m were defined as the number of small molecules and miRNAs, respectively.
2.2. Human miRNA-Disease Associations
Human miRNA-disease association data was obtained from the HMDD database (v2.0) (Li et al., 2013). We performed the same preprocessing as TLHNSMMA and deleted disease-related miRNAs that were not involved in the known 664 SMiR associations. As a result, we downloaded 6,233 miRNA-disease interactions and constructed an adjacency matrix Mmd to indicate miRNA-disease associations. The value of Mmd(i,j) was 1/6, 233 if an miRNA m(i) interacted with a disease d(j), and otherwise it was 0. Variables m and d were defined as the number of miRNAs and diseases, respectively.
2.3. Small Molecule Similarity
2.3.1. Side Effect Similarity
We downloaded side-effect information on small molecules from the SIDER database (Kuhn et al., 2010). Two small molecules are more similar if they share more side effects based on guilt-by-association. The similarity value is 0 if two small molecules do not share any side effects. Suppose that N(i) represents a side effect set related to a small molecule s(i); indicates side effect similarity between sm(i) and sm(j). We computed side-effect similarity of small molecules based on the Jaccard formula via Equation (3). |X| represents the cardinality of set X.
2.3.2. Chemical Structure Similarity
SIMCOMP (Hattori et al., 2003) (http://www.genome.jp/tools/simcomp) is a graph-based tool that can be used to compute small molecule similarity based on chemical structures extracted from the COMPOUND and DRUG sections of the KEGG LIGAND database (Kanehisa et al., 2012). We used the tool to search a maximal share sub-graph isomorphism between small molecules sm(i) and sm(j) and computed their chemical structure similarity .
2.3.3. Disease Phenotype-Based Similarity
We extracted small molecule-related diseases from Comparative Toxicogenomics Database (CTD) (Davis et al., 2013), DrugBank (Kuhn et al., 2010), and Therapeutic Targets database (TTD) (Zhu et al., 2011). Based on the assumption that two small molecules are more similar if they share more diseases, disease phenotype-based similarity between small molecules sm(i) and sm(j) can be computed via Equation (4).
2.3.4. Gene Functional Consistency-Based Similarity
We extracted target genes of small molecules from DrugBank (Law et al., 2013) and TTD (Li et al., 2017). Based on the assumption that two target genes tend to be more similar if they share more functional consistency, we can compute functional consistency-based similarity between two small molecules sm(i) and sm(j) via the Gene Set Functional Similarity (GSFS) method provided by Lv et al. (2011).
2.3.5. Fused Small Molecule Similarity
We designed a weighted combination technique to fuse small molecule side effects, chemical structures, gene functions, and diseases phenotypes. The weighted combination technique can decrease the deviation of each separated similarity and balance the four different similarities. The fused small molecule similarity SMs can defined as shown via Equation (5).
Here, the default value δi = 1 indicates that the four different similarities have the same weight.
2.4. miRNA Similarity
2.4.1. Disease Phenotype-Based Similarity
We extracted miRNA-related diseases from HMDD v2.0 (Li et al., 2013), miR2Disease (Jiang et al., 2008), and PhenomiR (Ruepp et al., 2010). Based on the assumption that two miRNAs are more similar if they share more diseases, we could compute the disease phenotype-based similarity of miRNAs by using the Jaccard equation. Suppose that M(i) indicates the miRNA m(i)-related disease set. The disease phenotype-based similarity between two miRNAs mir(i) and mir(j) can be calculated via Equation (6).
2.4.2. Gene Functional Consistency-Based Similarity
We extracted the target genes of miRNA from the TargetScan database (Friedman et al., 2009), and we calculated the functional consistency-based similarity between two miRNAs mir(i) and mir(j) based on GSFS (Lv et al., 2011).
2.4.3. Fused miRNA Similarity
We designed a weighted combination technique to fuse miRNA gene functions and diseases phenotypes. The weighted combination technique can decrease the deviation of each separated similarity and balance the two different similarities. The fused miRNA similarity MR can be defined as Equation (7).
where the default value γi =1 indicates that the two similarities have the same weight.
2.5. Disease Similarity
We computed disease similarity based on the disease semantic similarity model designed by Qu et al. (2018).
2.5.1. Disease Semantic Similarity Method 1
We downloaded disease semantic information from the U.S. National Library of Medicine (MeSH) (http://www.nlm.nih.gov/mesh/) and constructed a disease similarity matrix DS based on its Directed Acyclic Graph (DAG) (Chen et al., 2016). Suppose that DAG(Dis) = (Dis, Set(Dis), E(Dis)) represents a disease Dis, where Set(Dis) is a node set containing Dis and its ancestors, and E(Dis) is an edge set containing edges between child and parent nodes. The semantic similarity of diseases based on DAG can be computed via Equation (8):
where α represents the semantic contribution factor, and the semantic contribution value of a disease to itself is 1. The semantic contribution of disease d to Dis will decrease when the distance between d and Dis increases. The semantic value of disease Dis can be calculated via Equation (9).
Based on the assumption that two diseases sharing more DAGs are more similar, we computed the semantic similarity between two diseases d(i) and d(j) as
2.5.2. Disease Semantic Similarity Method 2
According to the results provided by Qu et al. (2018), different disease terms included in the same layer of a DAG(D) may appear in multiple disease DAGs, and furthermore, the number of their occurrences may be different. For example, for two diseases, d(i) and d(j), that appear in the same layer of the DAG(D), d(i) may appear less in disease DAGs than d(j). We can infer that d(i) may be more specific than d(j). Therefore, the contribution of d(i) to the semantic value of D should be higher than d(j). The contribution can be represented:
The semantic similarity between d(i) and d(j) based on disease semantic similarity method 2 can be computed via Equation (12).
2.5.3. Gaussian Interaction Profile Kernel Similarity for Disease Similarity
Based on the “guilt-by-association” principle, similar diseases tend to associate with miRNAs that share more functions. Suppose that a binary vector ID(d(u)) represents the interaction profile of disease d(u) associated with miRNAs: its value is set as 1 if d(u) associates with an miRNA, otherwise the value is 0. The Gaussian interaction profile kernel similarity between d(i) and d(j) is calculated as:
where parameter γd is applied to determine the kernel bandwidth. This can be computed by standardizing a new bandwidth γd′:
2.5.4. Fused Disease Similarity
We could calculate the semantic similarity for many diseases based on their DAGs. However, we could not obtain DAGs for a few diseases and calculate their semantic similarity. Therefore, the Gaussian interaction profile kernel was used to measure the similarity for these diseases. Accordingly, we developed an integrated disease similarity measurement Ds based on disease semantic similarity method 1, disease semantic similarity method 2, and the Gaussian interaction profile kernel similarity. The formulation can be computed as shown via Equation (15).
3. RWNS
We developed an SMiR association prediction pipeline, RWNS. RWNS integrated a credible negative sample selection, random walk with restart, and diverse biological information. First, small molecule similarity, miRNA similarity, and disease similarity were computed. Highly credible negative SMiR associations were then selected based on the obtained similarity information, and random walks with restart were iteratively performed on the constructed triple-layer heterogeneous network to propagate association information and discover SMiR candidates. The details are shown in Figure 1.
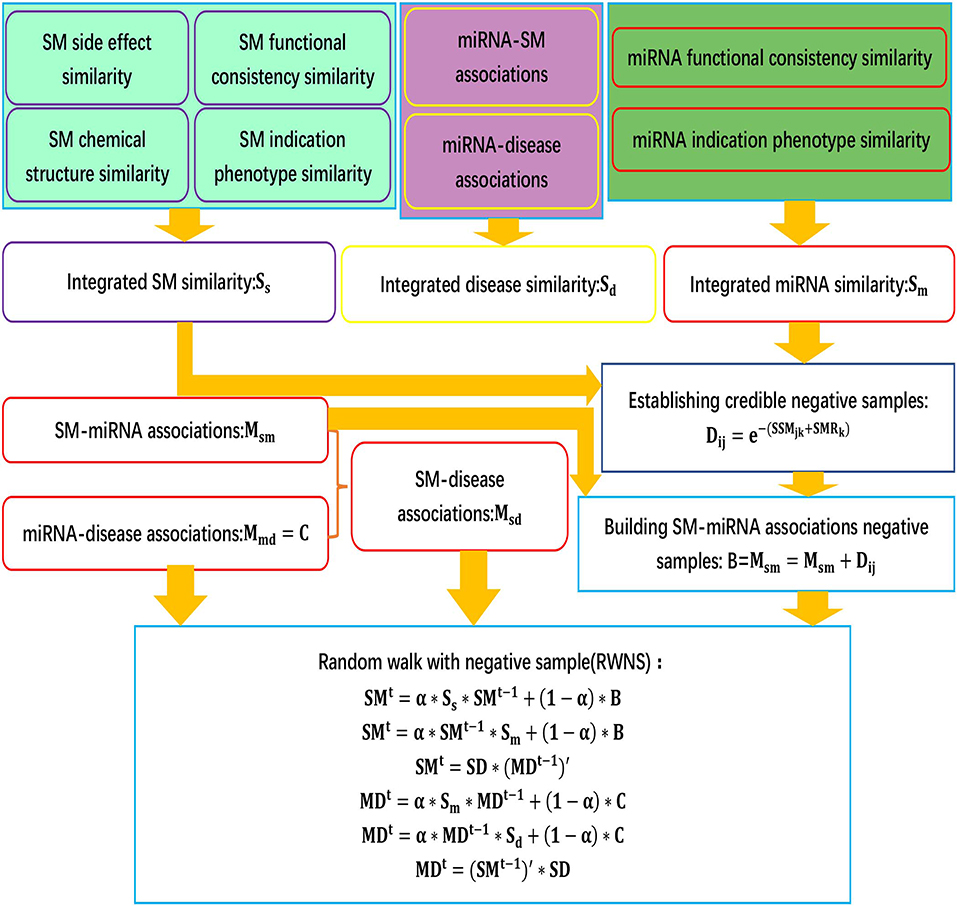
Figure 1. The flowchart of RWNS.
3.1. Selecting Credible Negative SMiR Samples
High-quality negative samples can improve predictive performance. A lack of negative SMiR association samples can result in predictive bias. Consequently, it is important to integrate credible negative samples into the SMiR association prediction model. However, there is currently no public data repository that can provide negative SMiR association samples. Therefore, inspired by the negative compound-protein interaction selection method provided by Liu et al. (2015), we developed a Credible Negative Sample extraction method, CNSMiRS, to obtain high-quality negative SMiR association samples.
Existing SMiR association prediction techniques are based on the assumption that similar small molecules/miRNAs are more likely to associate with miRNAs/small molecules that are more similar to the corresponding known miRNAs/small molecules. Based on the converse negative proposition of this assumption, CNSMiRS assumes that a small molecule dissimilar to every known small molecule targeting an miRNA is unlikely to associate with this miRNA. Similarly, an miRNA dissimilar to any known miRNA interacting with a small molecule is unlikely to be targeted by this small molecule. For simplicity, we represent them as the small molecule dissimilarity rule and miRNA dissimilarity rule, respectively. Both rules are used to select the most credible negative SMiR samples. This process is summarized in Algorithm 1, as can be seen in Figure 2.
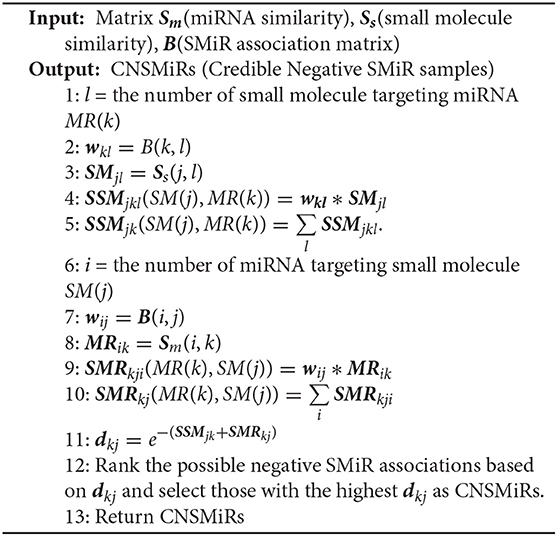
Algorithm 1: Credible negative SMiR association sample extraction (CNSMiRS).
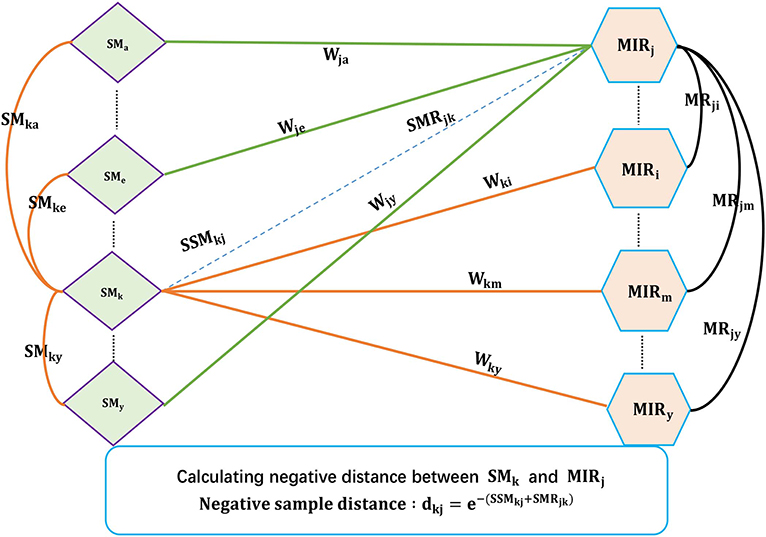
Figure 2. The flowchart of extracting credible negative SMiR samples.
As shown in Algorithm 1, the fused similarity for each pair of small molecules/miRNAs is firstly computed via Equations (5) and (7). Known SMiR association data are then applied to build positive sample assembly K in the preprocessing step. Potential negative association between small molecule SM(k) and miRNA MR(j) is denoted as (SMk, MRj, dkj) with dkj representing the distance between small molecule SM(k) and miRNA MR(j). dkj can be computed as follows.
a. For any small molecule SM(l) targeting miRNA MR(k) in K, CNSMiRS calculates the weighted score SSMjkl = wkl*SMjl that represents the probability of small molecule SM(j) targeting miRNA MR(k) by considering the similarity between SM(j) and SM(l). Integrating the similarity between SM(j) and each known small molecule SM(l) targeting MR(j), i.e., (SMk, MRj, wkl) ∈ K, CNSMiRS computes the associated possibility by summing up the weighed scores SSMjkl related to small molecule SM(l) and thus obtains .
b. Similarly, CNSMiRS calculates the weighed score SMRkji = wij*MRik, which indicates the probability of miRNA MR(k) targeted by small molecule SM(j) by considering the similarity between MR(k) and MR(i). Integrating the similarity between MR(k) and each known miRNA MR(i)-targeted SM(j), i.e., (MRi, SMj, wij) ∈ K, CNSMiRS computes the associated possibility by summing up the weighed scores SMRkji related to miRNA MR(i) and thus obtains .
c. For small molecule SM(j) and miRNA MR(k), CNSMiRS calculates the distance between SM(j) and MR(k):
where dkj represents the final possibility that small molecule SM(j) does not associate with miRNA MR(k). The larger the dkj is, the higher the probability of SM(j) not targeting MR(k) is.
Finally, CNSMiRS ranks negative SMiR association scores based on dkj and selects those with the highest scores as negative SMiR samples.
3.2. Random Walk on Triple-Layer Heterogeneous Network
Peng et al. (2017) developed a protein function prediction algorithm, ThrRW, based on unbalanced random walks on three biological networks. ThrRW (Peng et al., 2017) obtained a better predictive performance. Inspired by ThrRW (Peng et al., 2017), we designed an SMiR association algorithm, RWNS, based on the constructed triple-layer heterogeneous network (Figure 3). Suppose that matrix B(M * N) and C(N * Z) represent known SMiR and known miRNA-disease association matrix, respectively. The values of entities in these matrices are 1 (there are associations between corresponding entities) and 0 (otherwise). Sd(Z * Z), Ss(M * M), and Sm(N * N) are the fused disease similarity matrix, small molecule similarity matrix, and miRNA similarity matrix, respectively. SM(M * N), MD(N * Z), and SD(M * Z) represent predicted SMiR associations, miRNA-disease associations, and small molecule-disease associations, respectively. The value of SM(i,j) represents the probability of a small molecule i associating with an miRNA j. Similarly, MD(i,j) represents the probability that an miRNA i associates with a disease j, and SD(i,j) represents the probability that a small molecule i associates with a disease j.
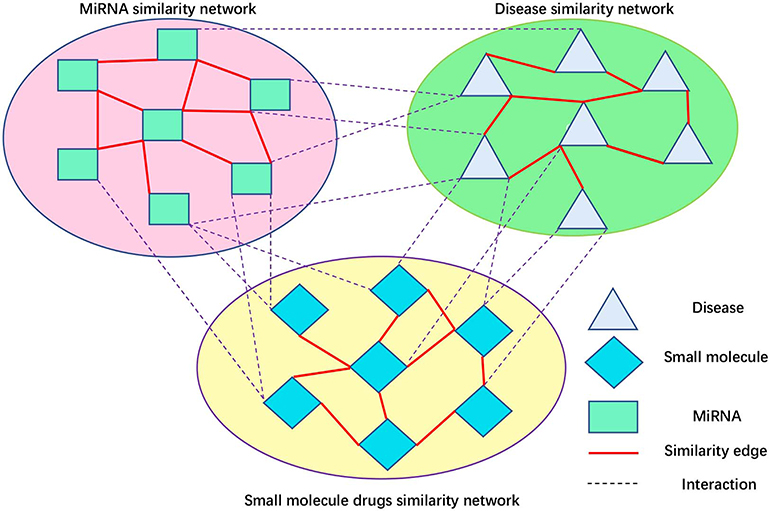
Figure 3. Small molecule-disease-miRNA association network.
The aim of our study was to predict possible SMiR associations according to known association information. We obtained this information by iteratively updating matrix SM. The basic assumption is that the higher the similarity between the two small molecules, the higher the possibility that they interact with the same miRNA. Similarly, the higher the similarity between the two small molecules, the higher the possibility that they are associated with the same disease. RWNS developed three ways to update SM based on the assumption. Firstly, random walk steps (denoted by l1) were conducted in small molecule similarity network (Ss) to propagate small molecule association information from their direct to level-l1 neighbors. Secondly, several random walk steps (denoted by r1) were conducted in the miRNA similarity matrix (Sm) so that miRNAs could interact with common small molecules based on their direct to level-r1 neighbor information. Thirdly, miRNA-disease associations were transferred to small molecules through the known small molecule-disease associations (SD). Considering the difference between the small molecule similarity network and the miRNA similarity network, it is clear that the steps walking in these two networks are different (l1 steps in the small molecule similarity matrix, and r1 steps in the miRNA similarity matrix). Mathematically, the random walk process can be described via Equations (17–19).
As Equation (17) and (18) show, at each random walk step, small molecule and miRNA paths were extended (obtained by multiplying Ss on the left and Sm on the right), and some possible SMiR associations were thus found (achieved by updating matrix SM). The parameter t(t = 1, 2, …) is the iteration steps. Matrix B as prior knowledge controls the iteration process. The parameter α ∈ [0, 1] is used to penalize longer paths and control the weight of known associations in B. Because small molecules are more likely to associate with similar miRNAs, several random walks were conducted in both association networks to achieve association information of its local neighbors. Because Ss and Sm are different in structure and topology, two parameters (r1 and l1) were introduced to regulate maximal iteration steps in these two similarity networks. As shown in Equation (19), MDt−1 stores the predicted miRNA-disease associations in the (t-1)-th step. There are some SMiR associations (stored in matrix SD). Therefore, if two small molecules associate with a common disease, they may interact with a common miRNA, which is obtained by multiplying matrix SD on the left hand of matrix (MDt−1).
On the other hand, association matrix MD can also be updated in the manner similar to that of SM. Mathematically, the random walk process can be described as
As shown in Equations (20) and (21), several random walks were conducted in Sm and Sd, respectively. In each random walk step, some potential miRNA-disease associations (obtained by updating matrix MD) could be uncovered by extending miRNA and disease paths in their corresponding networks (obtained by multiplying Sm on the left and Sd on the right in each iteration). Matrix C stores known miRNA-disease associations that are used to control the iteration process. Different random walk steps were conducted in two similarity networks (Sm and Sd), by performing different iteration steps (l2 steps in Sm and r2 steps in Sd). Based on small molecule-disease associations, the predicted SMiR association information can also be transferred to diseases associated with common miRNAs by Equation (22).
In summary, RWNS integrated a credible negative sample selection, random walk on a triple-layer heterogeneous network, and various biological information into a unified framework. The details are shown in Algorithm 2. The predicted SMiR association scores based on RWNS in SM2miR2 and SM2miR1 were listed in Supplementary Material (Tables S1, S2).
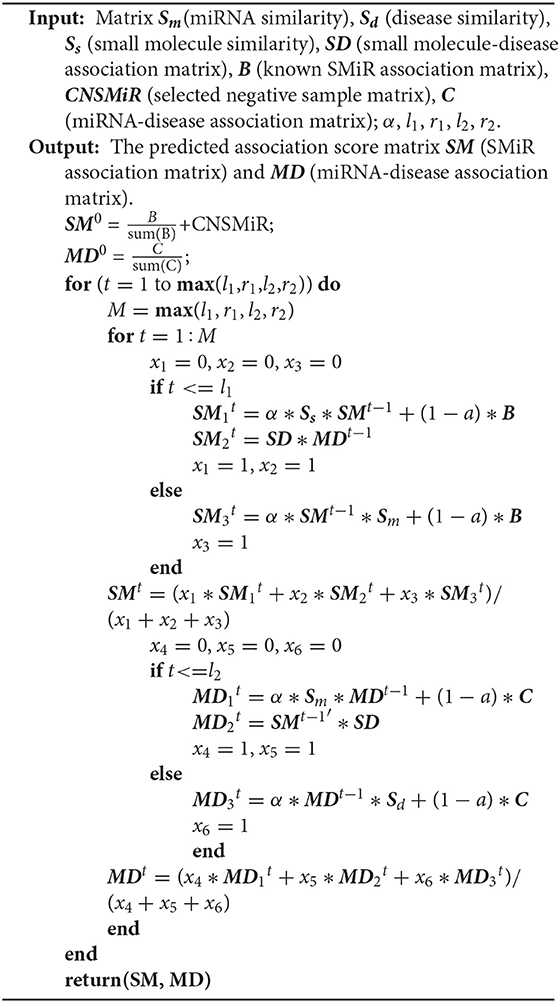
Algorithm 2: Identifying SMiR associations based on a credible negative sample selection and random walk on triple-layer heterogeneous network(RWNS).
4. Results
4.1. Experimental Setup and Evaluation Metrics
In this study, we performed extensive experiments to evaluate the performance of RWNS. We used leave-one-out cross validation (LOOCV) and 5-fold cross validation to compare RWNS with two state-of-the-art SMiR association methods, namely, TLHNSMMA and SMiR-NBI.
4.1.1. Experimental Setup
Parameter α with range [0,1] was used to determine whether the known association state need change based on known SMiR associations (or miRNA-disease associations). In the manuscript provided by Peng et al. (2017), ThrRW obtained the best performance when the parameter α was set as 0.45. Considering the difference between ThrRW and RWNS, RWNS repeated the experiment 100 times and obtained the optimal performance when α was set as 0.4. Therefore, RWNS set α as 0.4. The four parameters l1, r1, l2, and r2 ranged from 1 to 4. Parameters l1 and r1 were used to regulate random walk steps in miRNA and small molecule similarity matrices, respectively. Parameters l2 and r2 were used to regulate random walk steps in disease and miRNA similarity matrix, respectively. The experiments were repeated 100 times. When parameters l1, r1, l2, and r2 were set as 4, 1, 1, and 1, respectively, RWNS obtained the best performance. We therefore set the five parameters as α = 0.4, l1 = 4, r1 = 1, l2 = 1, and r2 = 1. The parameters TLHNSMMA and SMiR-NBI were set as the values provided by their corresponding papers.
4.1.2. Evaluation Metrics
Recall, precision, accuracy, and AUC are extensively used to evaluate different association prediction models. We used these four metrics to measure the performance of RWNS. Recall is the proportion of successfully predicted SMiR associations. Precision is the proportion of correctly predicted SMiR associations. Accuracy is the proportion of correctly predicted positive and negative SMiR associations. AUC is the area under ROC (the Receiver Operating Curve). For these four metrics, higher values indicate better prediction performance. We used these four metrics to evaluate our proposed RWNS framework. In the following two sections, experiments were performed under RWNS considering credible negative SMiR association samples. The metrics can be defined as
where TP, FP, and FN are defined in Table 1.
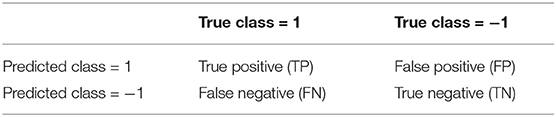
Table 1. Confusion matrix of a binary classifier.
4.2. Performance Evaluation Under LOOCV
We performed LOOCV based on the known SMiR associations in the SM2miRdatabase (Liu et al., 2012) to measure the performance of RWNS. RWNS was compared with two state-of-the-art SMiR prediction methods: SMiR-NBI (Li et al., 2016) and TLHNSMMA (Qu et al., 2018) in LOOCV. SMiR-NBI designed a network-based inference method to identify new SMiR associations. TLHNSMMA integrated SM similarity, miRNA similarity, disease similarity, experimentally verified SM-miRNA associations, and miRNA-disease associations into a heterogeneous network. The same datasets were used in these three methods. There were 664 known small molecule-miRNA associations between 831 small molecules and 541 miRNAs in dataset 1 (SM2miR1) and 664 known SMiR associations between 39 small molecules and 286 miRNAs in dataset 2 (SM2miR2). In LOOCV, each known SMiR association was chosen as the test sample in turn, and the remaining associations were used as the training samples. We conducted a series of experiments according to different negative sample selection proportion. Table 2 showed the AUC values for these three methods based on different negative sample selection proportion in two datasets. The best performance was described in boldface in each row in Table 2.
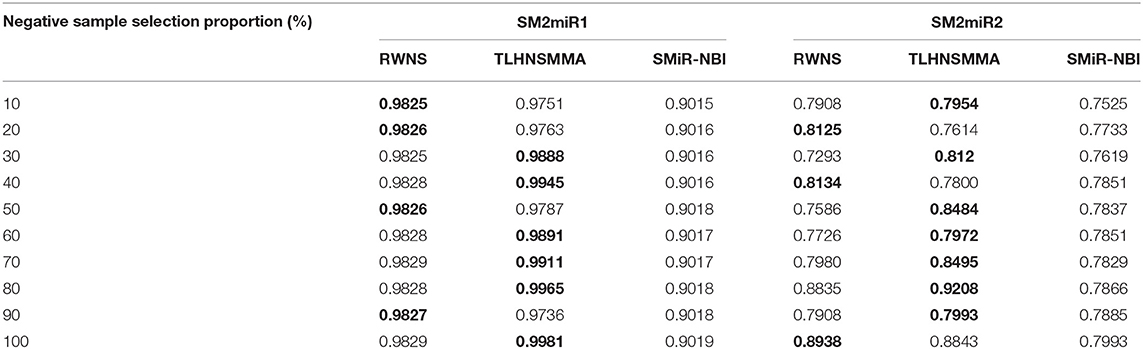
Table 2. The performance comparison of RWNS, TLHNSMMA, and SMiR-NBI under LOOCV on SM2miR1 and SM2miR2.
As a result, RWNS and TLHNSMMA were superior to SMiR-NBI in two datasets. Moreover, RWNS is comparable to TLHNSMMA in LOOCV. When the negative sample selection proportion increased from 10 to 100%, the performance of the three computational models were relatively steady, and that of RWNS did not almost change in the SM2miR1 dataset. However, the AUC values slightly changed when the proportion increased in the SM2miR2 dataset, and these three methods obtained better performances when the negative sample selection proportion was 1, i.e., the number of negative samples was equal to the number of positive samples. AUCs in RWNS with dataset SM2miR1 and SM2miR2 reached 0.9829 and 0.8938, respectively. The details are shown in Figure 4.
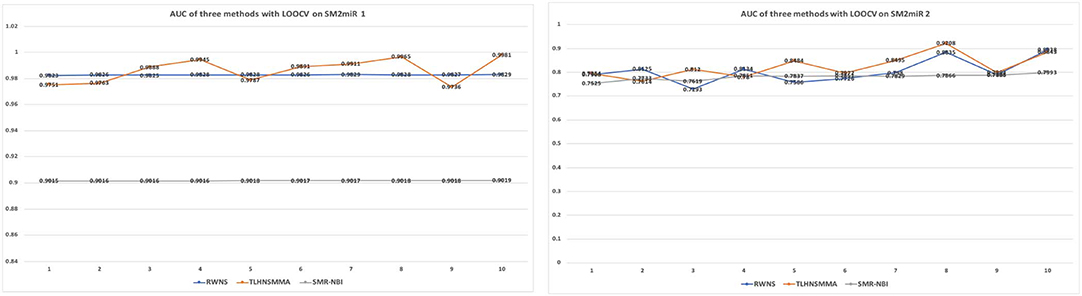
Figure 4. The performance comparison of RWNS, TLHNSMMA, and SMiR-NBI under LOOCV on SM2miR1 and SM2miR2.
4.3. Performance Evaluation Under 5-Fold Cross Validation
We performed 5-fold cross validation based on the known SMiR associations in the SM2miRdatabase (Liu et al., 2012) to evaluate the performance of RWNS. Similarly, RWNS was compared with two state-of-the-art SMiR prediction methods-SMiR-NBI (Li et al., 2016) and TLHNSMMA (Qu et al., 2018)-using 5-fold cross validation on two datasets. Tables 3, 4 showed AUC, recall, precision, and accuracy of these three methods with 5-fold cross validation based on two datasets. The best performance was described in boldface in each row in Tables 3, 4. The predicted SMiR association scores based on RWNS were shown in Tables S3, S4.
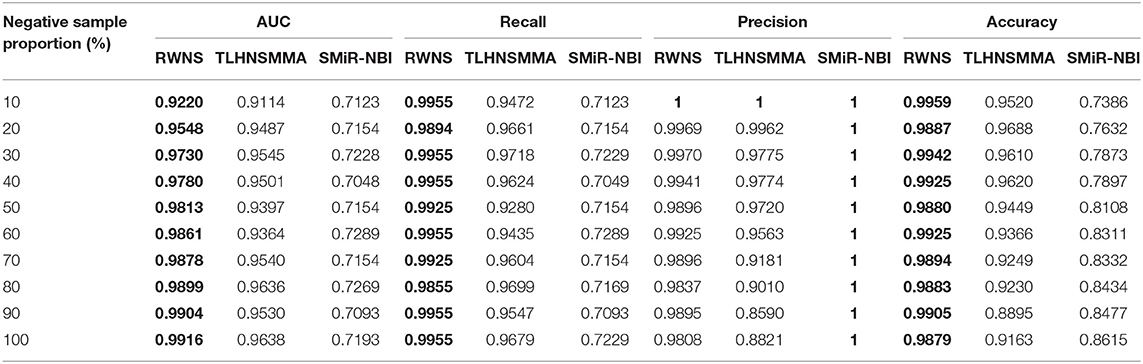
Table 3. The performance comparison of RWNS, TLHNSMMA, and SMiR-NBI under 5-fold cross validation in SM2miR1.

Table 4. The performance comparison of RWNS, TLHNSMMA, and SMiR-NBI under 5-fold cross validation in SM2miR2.
Table 3 showed the performance of RWNS, TLHNSMMA, and SMiR-NBI based on AUC, recall, precision, and accuracy in the SM2miR1 dataset. As a result, regardless of negative sample selection proportion, RWNS obtained the best AUC, recall, and accuracy compared with SMiR-NBI and TLHNSMMA in SM2miR1. Although the performance of RWNS was not the best among these three methods according to different negative sample selection proportions, it was still fit for comparison. The results demonstrated that RWNS could better identify possible SMiR associations. Moreover, RWNS and TLHNSMMA outperformed SMiR-NBI on AUC, recall, and accuracy. SMiR-NBI obtained the highest precision when negative sample selection proportion increase from 10 to 100%. It showed that SMiR-NBI could correctly predict more SMiR associations. More importantly, RWNS achieved the highest AUC of 0.9916, recall of 0.9955 and accuracy of 0.9879 when the negative sample selection proportion was 100%. Based on the comprehensive measurement of the experimental results, RWNS gave the optimal performance, followed by TLHNSMMA and SMiR-NBI. The details are shown in Figure 5.
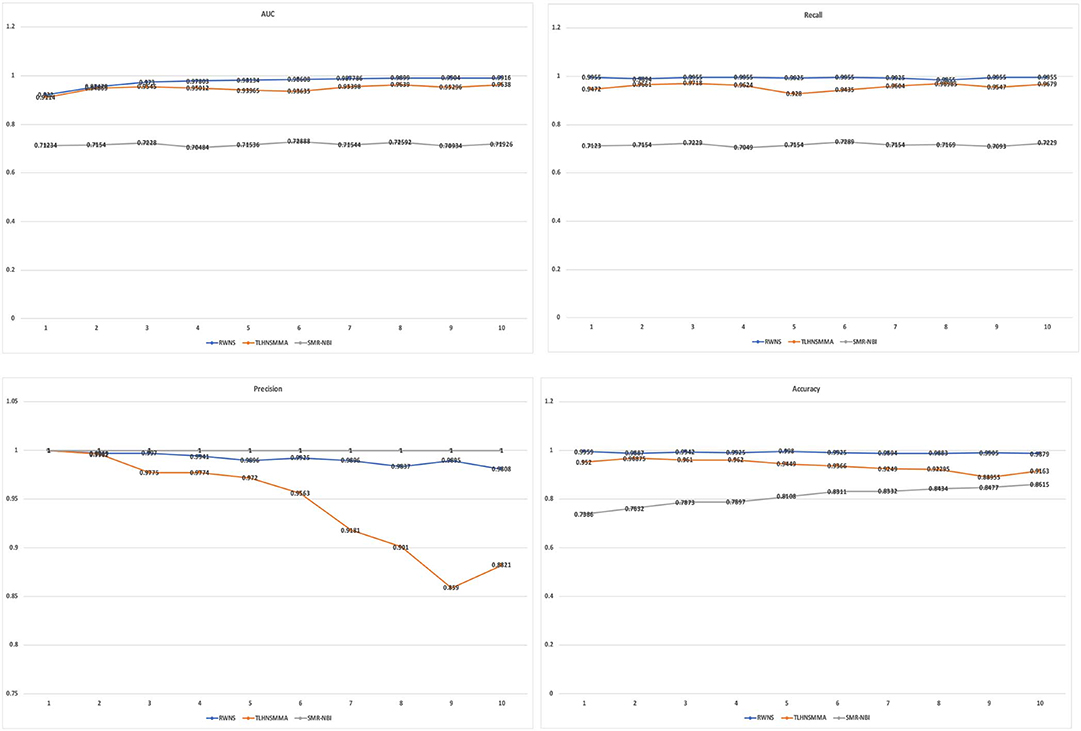
Figure 5. The performance comparison of RWNS, TLHNSMMA, and SMiR-NBI under 5-fold cross validation on SM2miR1.
Table 4 showed the performance of RWNS, TLHNSMMA, and SMiR-NBI based on AUC, recall, precision, and accuracy in the SM2miR2 dataset. None of these three methods outperformed the other two methods when the negative sample selection proportion changed, and this may be caused by different data structures. Moreover, when the negative sample selection proportion was 0.7, RWNS obtained a better performance, and AUC, recall, precision, and accuracy were 0.9899, 0.9855, 0.9136, and 0.8325, respectively. The details are shown in Figure 6.
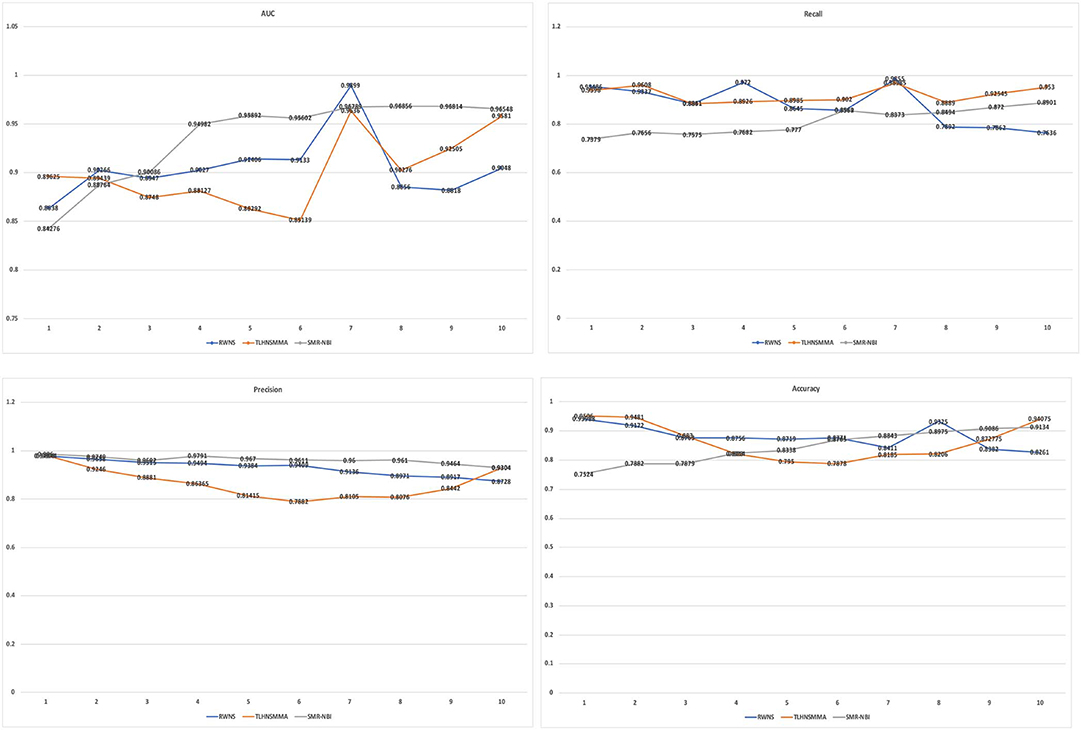
Figure 6. The performance comparison of RWNS, TLHNSMMA, and SMiR-NBI under 5-fold cross validation on SM2miR2.
4.4. Performance Comparison Considering CNSMiRS or Not
In this section, we analyzed the effect of credible negative sample selection on predictive performance. We compared RWNS+CNSMiRS (RWNS considering negative sample selection) with RWNS-CNSMiRS (RWNS not considering negative sample selection). The results are shown in Table 5. As shown in Table 5, RWNS+CNSMiRS resulted in a better performance than RWNS-CNSMiRS in two datasets. In the SM2miR1 dataset, RWNS+CNSMiRS obtained the AUC value of 0.9916, while RWNS-CNSMiRS obtained 0.9875. In the SM2miR2 dataset, RWNS+CNSMiRS obtained the AUC value of 0.9899, while RWNS-CNSMiRS obtained 0.7865. The results suggested that credible negative SMiR association samples may help improve predictive performance. The best performance was described in boldface in each row in Table 5. The predicted negative SMiR association scores based on CNSMiRS were shown in Tables S3, S4.
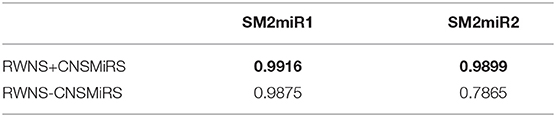
Table 5. Performance comparison considering CNSMiRS or not.
There were 449,571 and 11,154 small molecule-miRNA pairs in SM2miR1 and SM2miR2, respectively. However, there were only 664 experimentally validated SMiR associations in two datasets. In the SM2miR1 dataset, unobserved samples were more than that of SM2miR2, and thus selected negative samples were more than of SM2miR2. More negative samples may have helped improve predictive accuracy. Therefore, RWNS+CNSMiRS exhibited a better performance in the SM2miR1 dataset than SM2miR2.
4.5. Case Study
In this study, we extracted the top 50 SMiR associations with the highest scores and validated these associations from the published references in the PubMed database by retrieving the related documents. The details are shown in Table 6. Among the predicted top 10, 20, and 50 associations with the highest scores, there are 9, 17, and 37 SMiR associations that can be validated by the other documents, respectively. That is to say, among the predicted 10, 20, and 50 associations with the highest scores, 90, 85, and 74% associations can be confirmed by the published references in the PubMed database, respectively. The results demonstrated that RWNS can effectively identify SMiR association candidates. For TLHNSMMA, among the predicted top 10, 20, and 50 SMiR associations with the highest scores, there are only 2, 4, and 14 associations that can be validated by the published documents, respectively. There are three SMiR associations that can be simultaneously identified by RWNS and TLHNSMMA. The results suggest that RWNS may more accurately find possible SMiR associations.
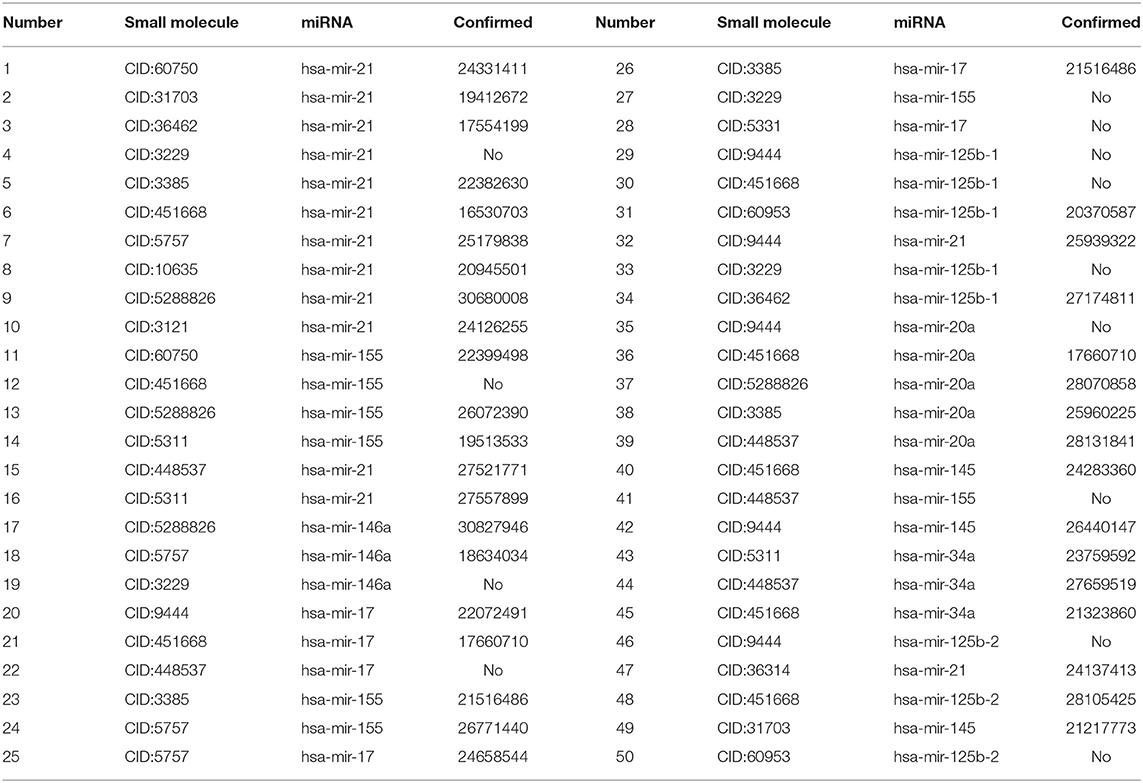
Table 6. The predicted top 50 SMiR associations with the highest scores.
Among the predicted top 10 SMiR associations, 10 different small molecules were associated with the same miRNA (hsa-mir-21). Mir-21 is a kind of non-protein-coding RNA and can regulate the expression of related target genes to control tumorigenic processes (Esteller, 2011). This clinical study has shown that overexpression of mir-21 plays an essential role in primary breast cancer, lung cancer (Bica-Pop et al., 2018), gastric cancer (Zhang et al., 2008; Tsujiura et al., 2010), and normal adjacent tumor tissues (Negrini and Calin, 2008; Markou et al., 2013). Higher expression of mir-21 is related to lower overall survival rates of patients (Teixeira et al., 2014). The nine known small molecules are confirmed to associate with mir-21 and are used to control cancer initiation and progression (Krichevsky and Gabriely, 2009). The remaining small molecule (CID:3229) is predicted to interact with mir-21. Therefore, we have inferred that small molecule (CID:3229) probably interact with mir-21 and can be applied to control cancer initiation and progression.
Among the predicted top 20 SMiR associations, we discovered new interactions related to mir-155 and mir-146a. Mir-155 can control and regulate various physiological and pathological processes (Friedman et al., 2009). Some clinical studies have found that mir-155 is overexpressed in pancreatic juice samples from pancreatic cancer patients, and mir-155 may control pathological processes related to pancreatic cancer (Sadakari et al., 2010).
Among the predicted results, gemcitabine (CID:60750), doxorubicin (CID:31703), etoposide (CID:36462), and fluoracil (CID:3385) are small molecules associated with mir-21. They have similar functions and can destroy DNA molecular structures to inhibit DNA synthesis, reconstruct DNA topological structures, and prevent cell entry into the mitotic phase of cell division and thus lead to cell death. The process arrests tumor growth and result in apoptosis. Associations between these four small molecules and mir-21 are ranked as one, two, three, and five, respectively. The functions of enoxacin (CID:3229) are similar to the above small molecules. It can inhibit DNA topoisomerase type II (atp-hydrolyzing) activity. DNA topoisomerase type II plays an essential role in relaxing supercoiled DNA. Therefore, we inferred that enoxacin may be associated with mir-21.
Moreover, gemcitabine (CID:60750) and vorinostat (CID:5311) can inhibit the process of cell division and thus lead to cell death. The process arrests tumor growth and result in apoptosis. Decitabine (CID:451668) can be incorporated into DNA during replication and RNA during transcription. The process can regulate way of proteins binding to the RNA/DNA substrate and control the process of cell division. Decitabine (CID:451668), gemcitabine (CID:60750), and vorinostat (CID:5311) have similar pharmacodynamics functions. Gemcitabine (CID:60750) and vorinostat (CID:5311) associate with mir-155. Therefore, we have inferred that decitabine (CID:451668) may interact with miRNA-155.
5. Conclusion and Further Research
The overexpression of miRNA can result in various complex human diseases. Identifying possible SMiR associations help genomic pharmacy studies. However, experimental methods for SMiR association prediction are still expensive, time-consuming, and laborious processes. Many computational methods have therefore been developed to address this problem.
In this study, we developed an SMiR association prediction method, RWNS, integrating various biological information, credible negative sample selection, and random walk on triple-layer heterogeneous network into a unified framework. We compared the performance of RWNS with TLHNSMMA and SMiR-NBI based on AUC, recall, precision, and accuracy. The results showed that RWNS obtained better performance and could effectively predict possible SMiR associations. Moreover, we analyzed the predicted top 50 SMiR associations with the highest scores and found that enoxacin and decitabine may be associated with mir-21 and mir-155, respectively. Therefore, RWNS could be an effective tool for SMiR association prediction.
Biological information help find SMiR candidates in a more accurately way. RWNS fused different biological information related to small molecules and miRNAs. However, it may be improved by integrating more data, for example, functional associations between microRNAs and long non-coding RNAs (Zhang et al., 2018b). More importantly, how to integrate these data is still an ongoing challenge. In the future, we will further consider deep learning-based models to better integrate diverse biological data and improve predictive performances. Finally, the linear neighborhood propagation method (Zhang et al., 2018a, 2019c) may be efficiently applied to SMiR association prediction.
Data Availability Statement
The authors declare that the data supporting the findings of this study are available within the article/Supplementary Material.
Author Contributions
FL, LP, GT, JY, and LZ developed the negative sample selection method. FL, LP, GT, and HC wrote the paper, and JY, QH, and XL revised the original draft. All authors read and approved the final manuscript.
Funding
This research was funded by the Natural Science Foundation of China (Grant 61803151), the Natural Science Foundation of Hunan Province (Grant 2018JJ2461, 2018JJ3570), and the Project of Scientific Research Fund of Hunan Provincial Education Department (Grant 17A052).
Conflict of Interest
GT and JY were employed by the company Geneis (Beijing) Co. Ltd.
The remaining authors declare that the research was conducted in the absence of any commercial or financial relationships that could be construed as a potential conflict of interest.
Acknowledgments
We would like to thank all authors of the cited references.
Supplementary Material
The Supplementary Material for this article can be found online at: https://www.frontiersin.org/articles/10.3389/fbioe.2020.00131/full#supplementary-material
Table S1. The predicted SMiR association scores based on RWNS in SM2miR1.
Table S2. The predicted SMiR association scores based on RWNS in SM2miR2.
Table S3. The predicted negative SMiR association scores based on CNSMiR in SM2miR1.
Table S4. The predicted negative SMiR association scores based on CNSMiR in SM2miR2.
References
Abba, M. L., Patil, N., Leupold, J. H., Moniuszko, M., Utikal, J., Niklinski, J., et al. (2017). Micrornas as novel targets and tools in cancer therapy. Cancer Lett. 387, 84–94. doi: 10.1016/j.canlet.2016.03.043
Bartel, D. P. (2004). Micrornas: genomics, biogenesis, mechanism, and function. Cell 116, 281–297. doi: 10.1016/s0092-8674(04)00045-5
Bica-Pop, C., Cojocneanu-Petric, R., Magdo, L., Raduly, L., Gulei, D., and Berindan-Neagoe, I. (2018). Overview upon miR-21 in lung cancer: focus on NSCLC. Cell. Mol. Life Sci. 75, 3539–3551. doi: 10.1007/s00018-018-2877-x
Borges, F., and Martienssen, R. A. (2015). The expanding world of small RNAs in plants. Nat. Rev. Mol. Cell Biol. 16:727. doi: 10.1038/nrm4085
Chen, J., Zhu, D., and Sun, Y. (2017a). CAP-seq reveals complicated miRNA transcriptional mechanisms in C. elegans and mouse. Quant. Biol. 5, 352–367. doi: 10.1007/s40484-017-0123-4
Chen, X., Guan, N.-N., Sun, Y.-Z., Li, J.-Q., and Qu, J. (2020). MicroRNA-small molecule association identification: from experimental results to computational models. Brief. Bioinform. 21, 47–61. doi: 10.1093/bib/bby098
Chen, X., Huang, Y.-A., Wang, X.-S., You, Z.-H., and Chan, K. C. (2016). FMLNCSIM: fuzzy measure-based lncRNA functional similarity calculation model. Oncotarget 7:45948. doi: 10.18632/oncotarget.10008
Chen, X., Sun, Y.-Z., Zhang, D.-H., Li, J.-Q., Yan, G.-Y., An, J.-Y., et al. (2017b). NRDTD: a database for clinically or experimentally supported non-coding RNAs and drug targets associations. Database 2017:bax057. doi: 10.1093/database/bax057
Croce, C. M. (2009). Causes and consequences of microRNA dysregulation in cancer. Nat. Rev. Genet. 10:704. doi: 10.1038/nrg2634
Davis, A. P., Wiegers, T. C., Roberts, P. M., King, B. L., Lay, J. M., Lennon-Hopkins, K., et al. (2013). A CTD–pfizer collaboration: manual curation of 88,000 scientific articles text mined for drug–disease and drug–phenotype interactions. Database 2013:bat080. doi: 10.1093/database/bat080
De Santi, C., Melaiu, O., Bonotti, A., Cascione, L., Di Leva, G., Foddis, R., et al. (2017). Deregulation of miRNAs in malignant pleural mesothelioma is associated with prognosis and suggests an alteration of cell metabolism. Sci. Rep. 7:3140. doi: 10.1038/s41598-017-02694-0
Esteller, M. (2011). Non-coding RNAs in human disease. Nat. Rev. Genet. 12:861. doi: 10.1038/nrg3074
Friedman, R. C., Farh, K. K., Burge, C. B., and Bartel, D. P. (2009). Most mammalian mRNAs are conserved targets of micrornas. Genome Res. 19, 92–105. doi: 10.1101/gr.082701.108
Gebert, L. F. R., and MacRae, I. J. (2019). Regulation of microRNA function in animals. Nat. Rev. Mol. Cell Biol. 20, 21–37. doi: 10.1038/s41580-018-0045-7
Gong, Y., Niu, Y., Zhang, W., and Li, X. (2019). A network embedding-based multiple information integration method for the miRNA-disease association prediction. BMC Bioinformatics 20:468. doi: 10.1186/s12859-019-3063-3
Hattori, M., Okuno, Y., Goto, S., and Kanehisa, M. (2003). Development of a chemical structure comparison method for integrated analysis of chemical and genomic information in the metabolic pathways. J. Am. Chem. Soc. 125, 11853–11865. doi: 10.1021/ja036030u
Huangfu, D., Maehr, R., Guo, W., Eijkelenboom, A., Snitow, M., Chen, A. E., et al. (2008). Induction of pluripotent stem cells by defined factors is greatly improved by small-molecule compounds. Nat. Biotechnol. 26:795. doi: 10.1038/nbt1418
Jiang, Q., Wang, Y., Hao, Y., Juan, L., Teng, M., Zhang, X., et al. (2008). miR2disease: a manually curated database for microRNA deregulation in human disease. Nucleic Acids Res. 37, D98–D104. doi: 10.1093/nar/gkn714
Jiang, W., Chen, X., Liao, M., Li, W., Lian, B., Wang, L., et al. (2012). Identification of links between small molecules and miRNAs in human cancers based on transcriptional responses. Sci. Rep. 2:282. doi: 10.1038/srep00282
Kanehisa, M., Goto, S., Sato, Y., Furumichi, M., and Tanabe, M. (2012). KEGG for integration and interpretation of large-scale molecular data sets. Nucleic Acids Res. 40, D109–D114. doi: 10.1093/nar/gkr988
Kim, S. Y., Jeon, T. Y., Choi, C. I., Kim, D. H., Kim, D. H., Kim, G. H., et al. (2013). Validation of circulating miRNA biomarkers for predicting lymph node metastasis in gastric cancer. J. Mol. Diagn. 15, 661–669. doi: 10.1016/j.jmoldx.2013.04.004
Krichevsky, A. M., and Gabriely, G. (2009). miR-21: a small multi-faceted RNA. J. Cell. Mol. Med. 13, 39–53. doi: 10.1111/j.1582-4934.2008.00556.x
Kuhn, M., Campillos, M., Letunic, I., Jensen, L. J., and Bork, P. (2010). A side effect resource to capture phenotypic effects of drugs. Mol. Syst. Biol. 6:343. doi: 10.1038/msb.2009.98
Lamb, J., Crawford, E. D., Peck, D., Modell, J. W., Blat, I. C., Wrobel, M. J., et al. (2006). The connectivity map: using gene-expression signatures to connect small molecules, genes, and disease. Science 313, 1929–1935. doi: 10.1126/science.1132939
Lau, N. C., Lim, L. P., Weinstein, E. G., and Bartel, D. P. (2001). An abundant class of tiny RNAs with probable regulatory roles in Caenorhabditis elegans. Science 294, 858–862. doi: 10.1126/science.1065062
Law, V., Knox, C., Djoumbou, Y., Jewison, T., Guo, A. C., Liu, Y., et al. (2013). Drugbank 4.0: shedding new light on drug metabolism. Nucleic Acids Res. 42, D1091–D1097. doi: 10.1093/nar/gkt1068
Lee, R. C., Feinbaum, R. L., and Ambros, V. (1993). The C. elegans heterochronic gene lin-4 encodes small RNAs with antisense complementarity to lin-14. Cell 75, 843–854. doi: 10.1016/0092-8674(93)90529-y
Li, G., Luo, J., Xiao, Q., Liang, C., and Ding, P. (2018). Predicting microRNA-disease associations using label propagation based on linear neighborhood similarity. J. Biomed. Inform. 82, 169–177. doi: 10.1016/j.jbi.2018.05.005
Li, J., Lei, K., Wu, Z., Li, W., Liu, G., Liu, J., et al. (2016). Network-based identification of microRNAs as potential pharmacogenomic biomarkers for anticancer drugs. Oncotarget 7:45584. doi: 10.18632/oncotarget.10052
Li, Y., Qiu, C., Tu, J., Geng, B., Yang, J., Jiang, T., et al. (2013). HMDD v2.0: a database for experimentally supported human microRNA and disease associations. Nucleic Acids Res. 42, D1070–D1074. doi: 10.1093/nar/gkt1023
Li, Y. H., Yu, C. Y., Li, X. X., Zhang, P., Tang, J., Yang, Q., et al. (2017). Therapeutic target database update 2018: enriched resource for facilitating bench-to-clinic research of targeted therapeutics. Nucleic Acids Res. 46, D1121–D1127. doi: 10.1093/nar/gkx1076
Liang, C., Yu, S., and Luo, J. (2019). Adaptive multi-view multi-label learning for identifying disease-associated candidate miRNAs. PLoS Comput. Biol. 15:e1006931. doi: 10.1371/journal.pcbi.1006931
Liu, H., Sun, J., Guan, J., Zheng, J., and Zhou, S. (2015). Improving compound–protein interaction prediction by building up highly credible negative samples. Bioinformatics 31, i221–i229. doi: 10.1093/bioinformatics/btv256
Liu, X., Wang, S., Meng, F., Wang, J., Zhang, Y., Dai, E., et al. (2012). Sm2mir: a database of the experimentally validated small molecules' effects on microRNA expression. Bioinformatics 29, 409–411. doi: 10.1093/bioinformatics/bts698
Lu, J., Getz, G., Miska, E. A., Alvarez-Saavedra, E., Lamb, J., Peck, D., et al. (2005). Microrna expression profiles classify human cancers. Nature 435:834. doi: 10.1038/nature03702
Lv, S., Li, Y., Wang, Q., Ning, S., Huang, T., Wang, P., et al. (2011). A novel method to quantify gene set functional association based on gene ontology. J. R. Soc. Interface 9, 1063–1072. doi: 10.1098/rsif.2011.0551
Markou, A., Sourvinou, I., Vorkas, P. A., Yousef, G. M., and Lianidou, E. (2013). Clinical evaluation of microrna expression profiling in non small cell lung cancer. Lung Cancer 81, 388–396. doi: 10.1016/j.lungcan.2013.05.007
Masoudi, M. S., Mehrabian, E., and Mirzaei, H. (2018). miR-21: a key player in glioblastoma pathogenesis. J. Cell. Biochem. 119, 1285–1290. doi: 10.1002/jcb.26300
Meng, F., Dai, E., Yu, X., Zhang, Y., Chen, X., Liu, X., et al. (2014). Constructing and characterizing a bioactive small molecule and microrna association network for Alzheimer's disease. J. R. Soc. Interface 11:20131057. doi: 10.1098/rsif.2013.1057
Monroig Pdel, C., Chen, L., Zhang, S., and Calin, G. A. (2015). Small molecule compounds targeting miRNAs for cancer therapy. Adv. Drug Deliv. Rev. 81, 104–116. doi: 10.1016/j.addr.2014.09.002
Negrini, M., and Calin, G. A. (2008). Breast cancer metastasis: a microRNA story. Breast Cancer Res. 10:303. doi: 10.1186/bcr1867
Peng, W., Li, M., Chen, L., and Wang, L. (2017). Predicting protein functions by using unbalanced random walk algorithm on three biological networks. IEEE/ACM Trans. Comput. Biol. Bioinform. 14, 360–369. doi: 10.1109/TCBB.2015.2394314
Qu, J., Chen, X., Sun, Y.-Z., Li, J.-Q., and Ming, Z. (2018). Inferring potential small molecule–miRNA association based on triple layer heterogeneous network. J. Cheminform. 10:30. doi: 10.1186/s13321-018-0284-9
Qu, J., Chen, X., Sun, Y.-Z., Zhao, Y., Cai, S.-B., Ming, Z., et al. (2019). In silico prediction of small molecule-miRNA associations based on the hetesim algorithm. Mol. Ther. Nucleic Acids 14, 274–286. doi: 10.1016/j.omtn.2018.12.002
Reinhart, B. J., Slack, F. J., Basson, M., Pasquinelli, A. E., Bettinger, J. C., Rougvie, A. E., et al. (2000). The 21-nucleotide let-7 RNA regulates developmental timing in Caenorhabditis elegans. Nature 403:901. doi: 10.1038/35002607
Ruepp, A., Kowarsch, A., Schmidl, D., Buggenthin, F., Brauner, B., Dunger, I., et al. (2010). Phenomir: a knowledgebase for microrna expression in diseases and biological processes. Genome Biol. 11:R6. doi: 10.1186/gb-2010-11-1-r6
Sadakari, Y., Ohtsuka, T., Ohuchida, K., Tsutsumi, K., Takahata, S., Nakamura, M., et al. (2010). MicroRNA expression analyses in preoperative pancreatic juice samples of pancreatic ductal adenocarcinoma. J. Pancreas 11, 587–592. doi: 10.6092/1590-8577/3402
Sevignani, C., Calin, G. A., Siracusa, L. D., and Croce, C. M. (2006). Mammalian microRNAs: a small world for fine-tuning gene expression. Mamm. Genome 17, 189–202. doi: 10.1007/s00335-005-0066-3
Shigemizu, D., Akiyama, S., Asanomi, Y., Boroevich, K. A., Sharma, A., Tsunoda, T., et al. (2019). Risk prediction models for dementia constructed by supervised principal component analysis using miRNA expression data. Commun. Biol. 2:77. doi: 10.1038/s42003-019-0324-7
Simonian, M., Mosallayi, M., and Mirzaei, H. (2018). Circulating miR-21 as novel biomarker in gastric cancer: diagnostic and prognostic biomarker. J. Cancer Res. Ther. 14:475. doi: 10.4103/0973-1482.175428
Sonnenburg, J. L., and Bäckhed, F. (2016). Diet–microbiota interactions as moderators of human metabolism. Nature 535:56. doi: 10.1038/nature18846
Teixeira, A. L., Ferreira, M., Silva, J., Gomes, M., Dias, F., Santos, J. I., et al. (2014). Higher circulating expression levels of miR-221 associated with poor overall survival in renal cell carcinoma patients. Tumor Biol. 35, 4057–4066. doi: 10.1007/s13277-013-1531-3
Trang, P., Weidhaas, J. B., and Slack, F. J. (2009). MicroRNAs as potential cancer therapeutics. Oncogene 27:S52. doi: 10.1038/onc.2009.353
Tsujiura, M., Ichikawa, D., Komatsu, S., Shiozaki, A., Takeshita, H., Kosuga, T., et al. (2010). Circulating microRNAs in plasma of patients with gastric cancers. Br. J. Cancer 102:1174. doi: 10.1038/sj.bjc.6605608
Wang, C.-C., Chen, X., Qu, J., Sun, Y.-Z., and Li, J.-Q. (2019). RFSMMA: a new computational model to identify and prioritize potential small molecule–mirna associations. J. Chem. Inform. Model. 59, 1668–1679. doi: 10.1021/acs.jcim.9b00129
Warner, K. D., Hajdin, C. E., and Weeks, K. M. (2018). Principles for targeting RNA with drug-like small molecules. Nat. Rev. Drug Discov. 17:547. doi: 10.1038/nrd.2018.93
Wightman, B., Ha, I., and Ruvkun, G. (1993). Posttranscriptional regulation of the heterochronic gene lin-14 by lin-4 mediates temporal pattern formation in C. elegans. Cell 75, 855–862. doi: 10.1016/0092-8674(93)90530-4
Xiao, Q., Luo, J., Liang, C., Cai, J., and Ding, P. (2017). A graph regularized non-negative matrix factorization method for identifying microrna-disease associations. Bioinformatics 34, 239–248. doi: 10.1093/bioinformatics/btx545
Yin, J., Chen, X., Wang, C.-C., Zhao, Y., and Sun, Y.-Z. (2019). Prediction of small molecule-microRNA associations by sparse learning and heterogeneous graph inference. Mol. Pharma. 16, 3157–3166. doi: 10.1021/acs.molpharmaceut.9b00384
Yue, X., Wang, Z., Huang, J., Parthasarathy, S., Moosavinasab, S., Huang, Y., et al. (2020). Graph embedding on biomedical networks: methods, applications, and evaluations. Bioinformatics 36, 1241–1251. doi: 10.1093/bioinformatics/btz718
Zhang, S., Chen, L., Jung, E. J., and Calin, G. A. (2010). Targeting microRNAs with small molecules: from dream to reality. Clin. Pharmacol. Ther. 87, 754–758. doi: 10.1038/clpt.2010.46
Zhang, W., Jing, K., Huang, F., Chen, Y., Li, B., Li, J., et al. (2019a). SFLLN: a sparse feature learning ensemble method with linear neighborhood regularization for predicting drug–drug interactions. Inform. Sci. 497, 189–201. doi: 10.1016/j.ins.2019.05.017
Zhang, W., Li, Z., Guo, W., Yang, W., and Huang, F. (2019b). “A fast linear neighborhood similarity-based network link inference method to predict microRNA-disease associations,” in IEEE/ACM Transactions on Computational Biology and Bioinformatics. doi: 10.1109/TCBB.2019.2931546
Zhang, W., Qu, Q., Zhang, Y., and Wang, W. (2018a). The linear neighborhood propagation method for predicting long non-coding RNA–protein interactions. Neurocomputing 273, 526–534. doi: 10.1016/j.neucom.2017.07.065
Zhang, W., Tang, G., Zhou, S., and Niu, Y. (2019c). LncRNA-miRNA interaction prediction through sequence-derived linear neighborhood propagation method with information combination. BMC Genomics 20:946. doi: 10.1186/s12864-019-6284-y
Zhang, W., Yue, X., Tang, G., Wu, W., Huang, F., and Zhang, X. (2018b). SFPEL-LPI: sequence-based feature projection ensemble learning for predicting lncrna-protein interactions. PLoS Comput. Biol. 14:e1006616. doi: 10.1371/journal.pcbi.1006616
Zhang, Z., Li, Z., Gao, C., Chen, P., Chen, J., Liu, W., et al. (2008). miR-21 plays a pivotal role in gastric cancer pathogenesis and progression. Lab. Invest. 88:1358. doi: 10.1038/labinvest.2008.94
Zhao, Y., Chen, X., Yin, J., and Qu, J. (2020). SNMFSMMA: using symmetric nonnegative matrix factorization and kronecker regularized least squares to predict potential small molecule-microRNA association. RNA Biol. 17, 281–291. doi: 10.1080/15476286.2019.1694732
Keywords: SMiR associations, random walk, negative sample selection, triple-layer heterogeneous network, drug repositioning
Citation: Liu F, Peng L, Tian G, Yang J, Chen H, Hu Q, Liu X and Zhou L (2020) Identifying Small Molecule-miRNA Associations Based on Credible Negative Sample Selection and Random Walk. Front. Bioeng. Biotechnol. 8:131. doi: 10.3389/fbioe.2020.00131
Received: 25 November 2019; Accepted: 10 February 2020;
Published: 17 March 2020.
Edited by:
Wen Zhang, Huazhong Agricultural University, ChinaReviewed by:
Guanghui Li, East China Jiaotong University, ChinaGuohua Huang, Shaoyang University, China
Cheng Guo, Columbia University, United States
Copyright © 2020 Liu, Peng, Tian, Yang, Chen, Hu, Liu and Zhou. This is an open-access article distributed under the terms of the Creative Commons Attribution License (CC BY). The use, distribution or reproduction in other forums is permitted, provided the original author(s) and the copyright owner(s) are credited and that the original publication in this journal is cited, in accordance with accepted academic practice. No use, distribution or reproduction is permitted which does not comply with these terms.
*Correspondence: Liqian Zhou, zhoulq11@163.com
†These authors have contributed equally to this work and share first authorship