Discrete electrocardiogram T amplitude detection based on cycle duration
DOI:
https://doi.org/10.15587/1729-4061.2023.282759Keywords:
detect the amplitude T, cycle duration base, ECG discrete, electrocardiogramAbstract
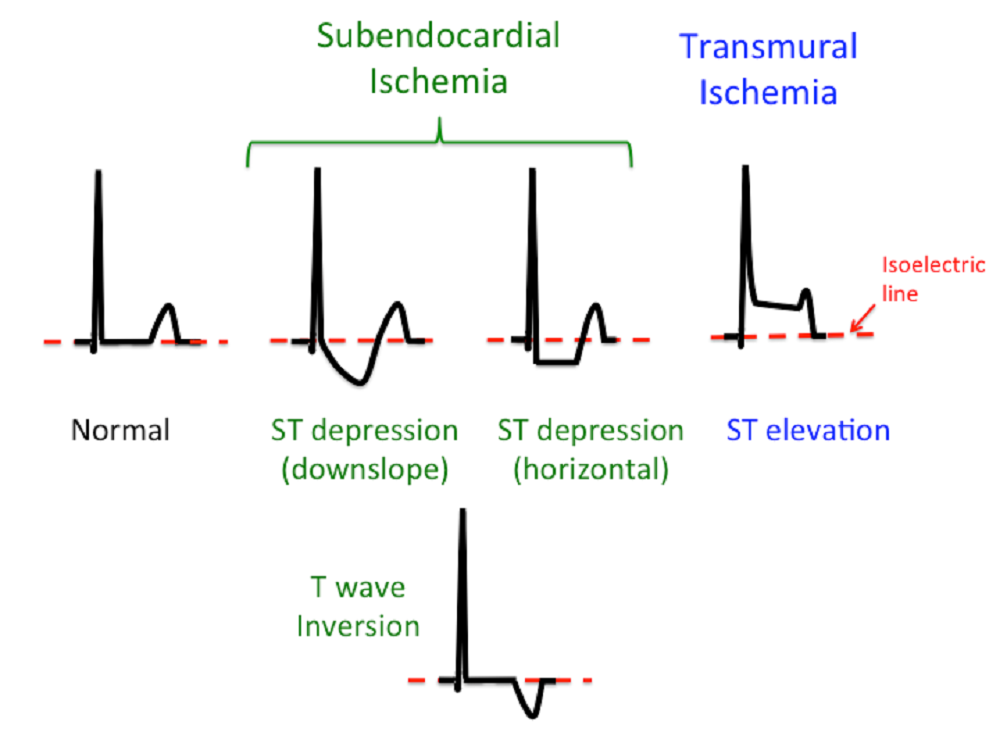
In each cycle of the electrocardiogram wave there are P, Q, R, S and T amplitudes. Many studies have been conducted to obtain amplitude and QRS waves because they are related to ventricular depolarization, but to obtain T amplitude values related to ventricular repolarization are still rarely done, not even for the clinical standard (12 leads). This study aims to obtain the amplitude T value in each cycle and each electrocardiogram lead. Obtaining the amplitude T position on the reference lead will also find the amplitude T value on the other lead. Each cycle duration obtained from the duration RN to RN+1 is used to obtain the position of the endpoint of each cycle. The maximum value between the amplitude S position and the end point of the cycle is the amplitude T value. The results of research on 10 Physionet sinus rhythm samples and 10 Saiful Anwar Hospital Malang samples show that the duration of the cycle was successful in obtaining the amplitude T value for each lead. All samples can display a value. The amplitude in each cycle, where the values obtained in each cycle are still in normal conditions. The amplitude T value obtained is certainly accurate because there is only one positive value between the amplitude S position and the end of the cycle position. The position of the amplitude integer T found in a cycle in one lead will be the same as the position of the amplitude integer T in the cycle for the other lead. This occurs because of the simultaneous transmission of impulses that affect the atrial and ventricular muscle cells. The position of the amplitude T for each cycle can be found by filtering the maximum amplitude value between the amplitude position S and the final position of the cycle. Practically, this method can be programmed to be added to a digital electrocardiograph
Supporting Agency
- The author would like to thank the head of the electrical engineering department at Widyagama University Malang for the assistance of the computer laboratory and the director of the Saiful Anwar Hospital Malang for the assistance of examination data.
References
- Serhani, M. A., T. El Kassabi, H., Ismail, H., Nujum Navaz, A. (2020). ECG Monitoring Systems: Review, Architecture, Processes, and Key Challenges. Sensors, 20 (6), 1796. doi: https://doi.org/10.3390/s20061796
- He, R., Wang, K., Li, Q., Yuan, Y., Zhao, N., Liu, Y., Zhang, H. (2017). A novel method for the detection of R-peaks in ECG based on K-Nearest Neighbors and Particle Swarm Optimization. EURASIP Journal on Advances in Signal Processing, 2017 (1). doi: https://doi.org/10.1186/s13634-017-0519-3
- Hamdi, S., Ben Abdallah, A., Bedoui, M. H. (2017). Real time QRS complex detection using DFA and regular grammar. BioMedical Engineering OnLine, 16 (1). doi: https://doi.org/10.1186/s12938-017-0322-2
- Yochum, M., Renaud, C., Jacquir, S. (2016). Automatic detection of P, QRS and T patterns in 12 leads ECG signal based on CWT. Biomedical Signal Processing and Control, 25, 46–52. doi: https://doi.org/10.1016/j.bspc.2015.10.011
- Rosenthal, T. M., Masvidal, D., Abi Samra, F. M., Bernard, M. L., Khatib, S., Polin, G. M. et al. (2017). Optimal method of measuring the T-peak to T-end interval for risk stratification in primary prevention. EP Europace, 20 (4), 698–705. doi: https://doi.org/10.1093/europace/euw430
- Andršová, I., Hnatkova, K., Šišáková, M., Toman, O., Smetana, P., Huster, K. M. et al. (2020). Heart Rate Dependency and Inter-Lead Variability of the T Peak – T End Intervals. Frontiers in Physiology, 11. doi: https://doi.org/10.3389/fphys.2020.595815
- Costa, R., Winkert, T., Manhães, A., Teixeira, J. P. (2021). QRS Peaks, P and T Waves Identification in ECG. Procedia Computer Science, 181, 957–964. doi: https://doi.org/10.1016/j.procs.2021.01.252
- Kaur, A., Agarwal, A., Agarwal, R., Kumar, S. (2018). A Novel Approach to ECG R-Peak Detection. Arabian Journal for Science and Engineering, 44 (8), 6679–6691. doi: https://doi.org/10.1007/s13369-018-3557-8
- Gliner, V., Behar, J., Yaniv, Y. (2018). Novel Method to Efficiently Create an mHealth App: Implementation of a Real-Time Electrocardiogram R Peak Detector. JMIR MHealth and UHealth, 6 (5), e118. doi: https://doi.org/10.2196/mhealth.8429
- Chen, H., Maharatna, K. (2020). An Automatic R and T Peak Detection Method Based on the Combination of Hierarchical Clustering and Discrete Wavelet Transform. IEEE Journal of Biomedical and Health Informatics, 24 (10), 2825–2832. doi: https://doi.org/10.1109/jbhi.2020.2973982
- Shang, H., Wei, S., Liu, F., Wei, D., Chen, L., Liu, C. (2019). An Improved Sliding Window Area Method for T Wave Detection. Computational and Mathematical Methods in Medicine, 2019, 1–11. doi: https://doi.org/10.1155/2019/3130527
- Wani, I. A., Afroz, Ahmad, R. (2022). Detection of R- Peaks in Electrocardiogram based on Wavelet Transform and Wavelet Approximation. Punjab University Journal of Mathematics, 54 (7), 441–453. doi: https://doi.org/10.52280/pujm.2022.540702
- Wijaya, C., Andrian, Harahap, M., Christnatalis, Turnip, M., Turnip, A. (2019). Abnormalities State Detection from P-Wave, QRS Complex, and T-Wave in Noisy ECG. Journal of Physics: Conference Series, 1230 (1), 012015. doi: https://doi.org/10.1088/1742-6596/1230/1/012015
- Yu, Q., Liu, A., Liu, T., Mao, Y., Chen, W., Liu, H. (2019). ECG R-wave peaks marking with simultaneously recorded continuous blood pressure. PLOS ONE, 14 (3), e0214443. doi: https://doi.org/10.1371/journal.pone.0214443
- Lata, S., Kumar, R. (2019). Disease Classification Using ECG Signals Based on R-Peak Analysis With ABC and ANN. International Journal of Electronics, Communications, and Measurement Engineering, 8 (2), 67–86. doi: https://doi.org/10.4018/ijecme.2019070105
- Abdullah Al, Z. Md., Thapa, K., Yang, S.-H. (2021). Improving R Peak Detection in ECG Signal Using Dynamic Mode Selected Energy and Adaptive Window Sizing Algorithm with Decision Tree Algorithm. Sensors, 21 (19), 6682. doi: https://doi.org/10.3390/s21196682
- Fahira Adriati, S., Setiawidayat, S., Rofii, F. (2021). Identification Of ECG Signal By Using Backpropagation Neural Network. Journal of Physics: Conference Series, 1908 (1), 012014. doi: https://doi.org/10.1088/1742-6596/1908/1/012014
- Physionet. Available at: https://archive.physionet.org/cgi-bin/atm/ATM
- Khelil, B., Kachouri, A., Messaoud, M. B., Ghariani, H. (2007). P Wave Analysis in ECG Signals using Correlation for Arrhythmias Detection. Fourth International Multi-Conference on Systems, Signals & Devices. Available at: https://www.academia.edu/12240318/P_Wave_Analysis_in_ECG_Signals_using_Correlation_for_Arrhythmias_Detection
- Setiawidayat, S., Putri, S. I. (2016). Filtering Data Diskrit Elektrokardiogram Untuk Penentuan Pqrst Dalam Satu Siklus. SENTIA.
- Setiawidayat, S., Rahman, A. Y. (2022). Method for Obtain Peak Amplitude Value on Discrete Electrocardiogram. Lecture Notes in Electrical Engineering, 97–108. doi: https://doi.org/10.1007/978-981-19-1804-9_8
- Webster, J. G. (Ed.) (2010). Medical Instrumentation: Application and Design. John Wiley & Sons, 696. Available at: http://fa.bme.sut.ac.ir/Downloads/AcademicStaff/3/Courses/4/Medical%20instrumentation%20application%20and%20design%204th.pdf
Downloads
Published
How to Cite
Issue
Section
License
Copyright (c) 2023 Sabar Setiawidayat

This work is licensed under a Creative Commons Attribution 4.0 International License.
The consolidation and conditions for the transfer of copyright (identification of authorship) is carried out in the License Agreement. In particular, the authors reserve the right to the authorship of their manuscript and transfer the first publication of this work to the journal under the terms of the Creative Commons CC BY license. At the same time, they have the right to conclude on their own additional agreements concerning the non-exclusive distribution of the work in the form in which it was published by this journal, but provided that the link to the first publication of the article in this journal is preserved.
A license agreement is a document in which the author warrants that he/she owns all copyright for the work (manuscript, article, etc.).
The authors, signing the License Agreement with TECHNOLOGY CENTER PC, have all rights to the further use of their work, provided that they link to our edition in which the work was published.
According to the terms of the License Agreement, the Publisher TECHNOLOGY CENTER PC does not take away your copyrights and receives permission from the authors to use and dissemination of the publication through the world's scientific resources (own electronic resources, scientometric databases, repositories, libraries, etc.).
In the absence of a signed License Agreement or in the absence of this agreement of identifiers allowing to identify the identity of the author, the editors have no right to work with the manuscript.
It is important to remember that there is another type of agreement between authors and publishers – when copyright is transferred from the authors to the publisher. In this case, the authors lose ownership of their work and may not use it in any way.