
Acoustic divergence in advertisement calls among three sympatric Microhyla species from East China
- Published
- Accepted
- Received
- Academic Editor
- Jia-Yong Zhang
- Subject Areas
- Animal Behavior, Evolutionary Studies, Zoology
- Keywords
- Acoustic differentiation, Body size, Intraspecific variation, Microhyla, Species recognition, Phylogenetic effect
- Copyright
- © 2020 Chen et al.
- Licence
- This is an open access article distributed under the terms of the Creative Commons Attribution License, which permits unrestricted use, distribution, reproduction and adaptation in any medium and for any purpose provided that it is properly attributed. For attribution, the original author(s), title, publication source (PeerJ) and either DOI or URL of the article must be cited.
- Cite this article
- 2020. Acoustic divergence in advertisement calls among three sympatric Microhyla species from East China. PeerJ 8:e8708 https://doi.org/10.7717/peerj.8708
Abstract
Background
Species-specific advertisement calls are the main mechanism of transmitting information between individuals in anuran amphibians and are therefore indispensable for anuran survival and reproduction. Survey methods that monitor these calls can be used for rapid species recognition, behavioral experiments, and conservation monitoring. In this study, we described in detail 10 call parameters from three sympatric species in the genus Microhyla and analyzed the differences in call parameter among these species to provide a basis for systematic monitoring, acoustic analysis and taxonomic study of this genus.
Methods
The quantitative analyses of temporal and spectral call parameters were used in our study for the advertisement calls of three sympatric Microhyla species (M. beilunensis, M. fissipes and M. heymonsi) in Zhejiang Province, East China.
Results
Our results showed the following: (1) Significant differences existed among the three sympatric Microhyla species in call duration (CD), call interval (CI), number of pulses (NP), pulse rate, call intensity (CIT), dominant frequency (DF) and frequency of the first to fourth formants (F1, F2, F3 and F4). (2) Some spectral parameters (DF, F1 and F3) were negatively correlated with the body size of the vocalizing individuals in each species. (3) The coefficients of variation within individuals (CVw) for CIT, DF and F1–F4 were smaller than 5%, whereas the CVW for CI was larger than 10% in each species. (4) The principal component analysis and discriminant function analysis showed that call parameters could distinguish the three Microhyla species. (5) The phylogenetic generalized least squares analysis showed that phylogenetic relationships affected CD and NP against snout-vent length (SVL), DF and NP against CD, and NP against DF, but not of DF against SVL; based on the phylogenetic analysis, CD and NP were not related to SVL, but DF was negatively related to SVL.
Introduction
Vocalizations, whose functions are mainly involved in reproduction, aggressive behavior and defense, is one of the important mode of communication in anuran amphibians (Gerhardt & Huber, 2002; Kelley, 2004; Wells, 2007; Toledo et al., 2015b). Advertisement calls are a form of male anuran vocalization that is most commonly heard and of the highest value in taxonomy and they play a crucial role in attracting potential mates and conveying territorial information to conspecifics. Several researchers have focused on advertisement calls of anurans (Wells, 2007; Gambale, Signorelli & Bastos, 2014; Köhler et al., 2017; Poyarkov et al., 2019; Wei et al., 2019). The variation in advertisement calls in anurans is generally studied at the intraspecific and interspecific levels (Köhler et al., 2017). Call variation within and between individuals of many anurans is influenced by individual motivation of the vocalizing male owing to numerous internal and/or external factors (Wells, 2007; Köhler et al., 2017). For example, social context could change the frequency of calls (Bee, Perrill & Owen, 2000; Reichert & Gerhardt, 2013) and temperature effects are linked to pulse rate and call duration (CD) (Lingnau & Bastos, 2007; Pröhl et al., 2007; Gasser, Amézquita & Hödl, 2009; Bee, Suyesh & Biju, 2013; Ziegler, Arim & Bozinovic, 2015) at the individual level. Furthermore, body size could constrain the frequency of calls (Gerhardt & Huber, 2002; Gingras et al., 2013) and physical or physiological damages could generate differences in calls (Hoffmann & Kloas, 2012; Pröhl et al., 2013) among individuals. Interspecific variation in calls is generally considered for species recognition in anurans (Gerhardt & Huber, 2002) and it is higher than intraspecific variation (Köhler et al., 2017). Therefore, Köhler et al. (2017) suggested that the assessment of variation in advertisement calls in anurans is important for understanding speciation and signal evolution.
Several studies on advertisement calls in anurans have focused on the variation pattern in spectral and temporal parameters (Gerhardt, 1991; Bee, Reichert & Tumulty, 2016). The static and dynamic properties of call parameters are proposed to be relevant to species recognition and mate choice, respectively (Gerhardt, 1991). In most anuran species, spectral and fine temporal call parameters are relatively stable (more static) at the within-individual level, whereas gross temporal parameters represented higher variability (more dynamic) (Gerhardt, 1991; Reinhold, 2009; Köhler et al., 2017). When a parameter has a relatively low variation, it is hypothesized to be caused by stabilizing selection of female preferences (Gerhardt, 1991; Castellano & Rosso, 2006). However, the static and dynamic traits of call parameters are not strictly inalterable, that is, these traits of a specific call parameter may vary among anuran species (e.g., dominant frequency (DF), Gambale, Signorelli & Bastos, 2014; Wei et al., 2019).
Microhyla (Anura: Microhylidae) is a genus with 50 species that are distributed from the Ryukyu Island and South China through India to Sri Lanka and through Southeast Asia to Sumatra, Borneo, Java and Bali (Frost, 2020). Nine species of Microhyla are currently known from Southeast China (AmphibiaChina, 2020). To date, there are reports on the advertisement calls of 28 Microhyla species (Table S1). Several studies have reported the taxonomy and identification of Microhyla species in some distribution areas (Sri Lanka, Myanmar and South Asia) through bio-acoustic comparison (Wijayathilaka, Meegaskumbura & Gianni, 2016; Garg et al., 2018; Poyarkov et al., 2019). In East China, M. beilunensis Zhang et al. (2018), M. fissipes Boulenger (1884) and M. heymonsi Vogt (1911) are three common Microhyla species and their distribution ranges are overlapping (Fig. 1). They breed from April to June in shallow, ephemeral pools and paddy flied (AmphibiaChina, 2020; Fei, Ye & Jiang, 2012; Z.-Q. Chen et al., 2019, unpublished data). In this study, we quantified call parameters in these three species. The results will be of importance for systematics, rapid identification of species, behavioral experiments and species protection. Particularly, they will be useful to identify species quickly and accurately in field surveys. We quantified the spectral and temporal parameters of advertisement calls in the three sympatric Microhyla species in the Jiulongshan National Nature Reserve, Lishui City, Zhejiang Province, East China. We also explored the relationships among snout-vent length (SVL), CD, number of pulses (NP) and DF using previously published data, while accounting for phylogenetic relationships.
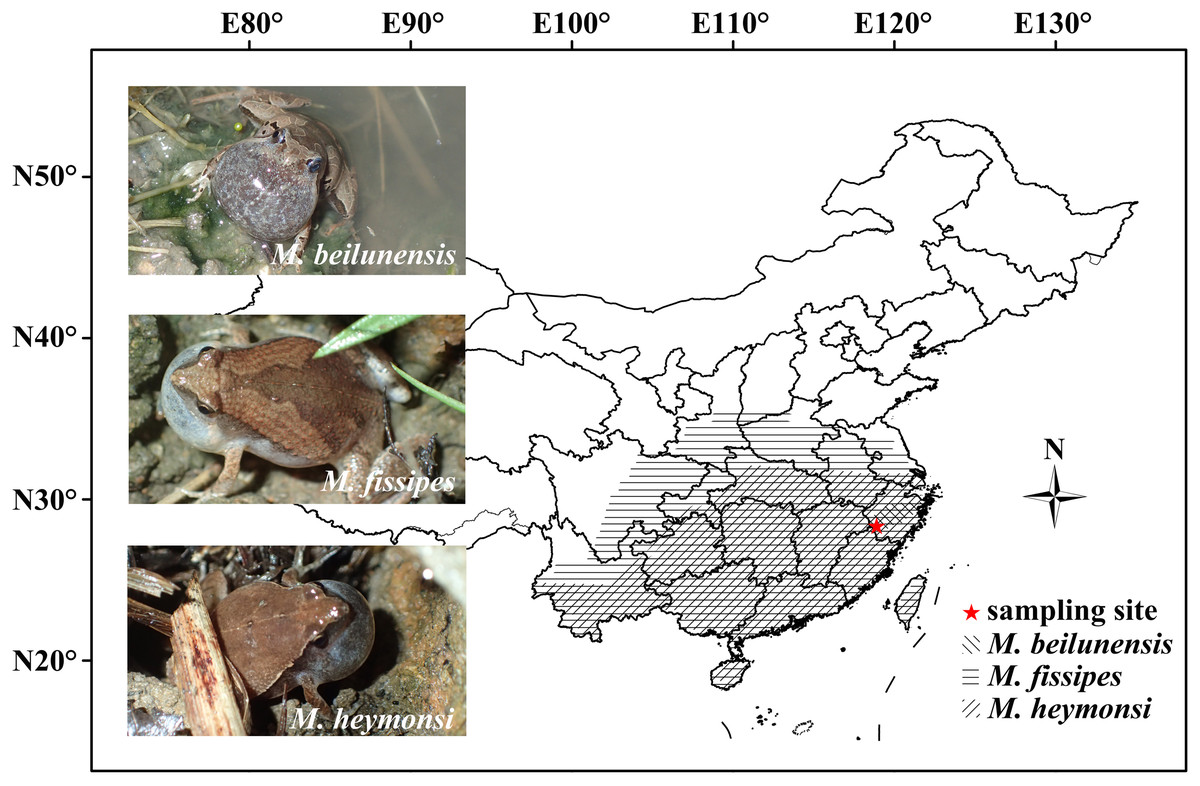
Figure 1: The geographical distribution of the three Microhyla species in China.
Photos of the three Microhyla calling males in field (Photo by Guo-Hua Ding) and sampling site were showed in the figure.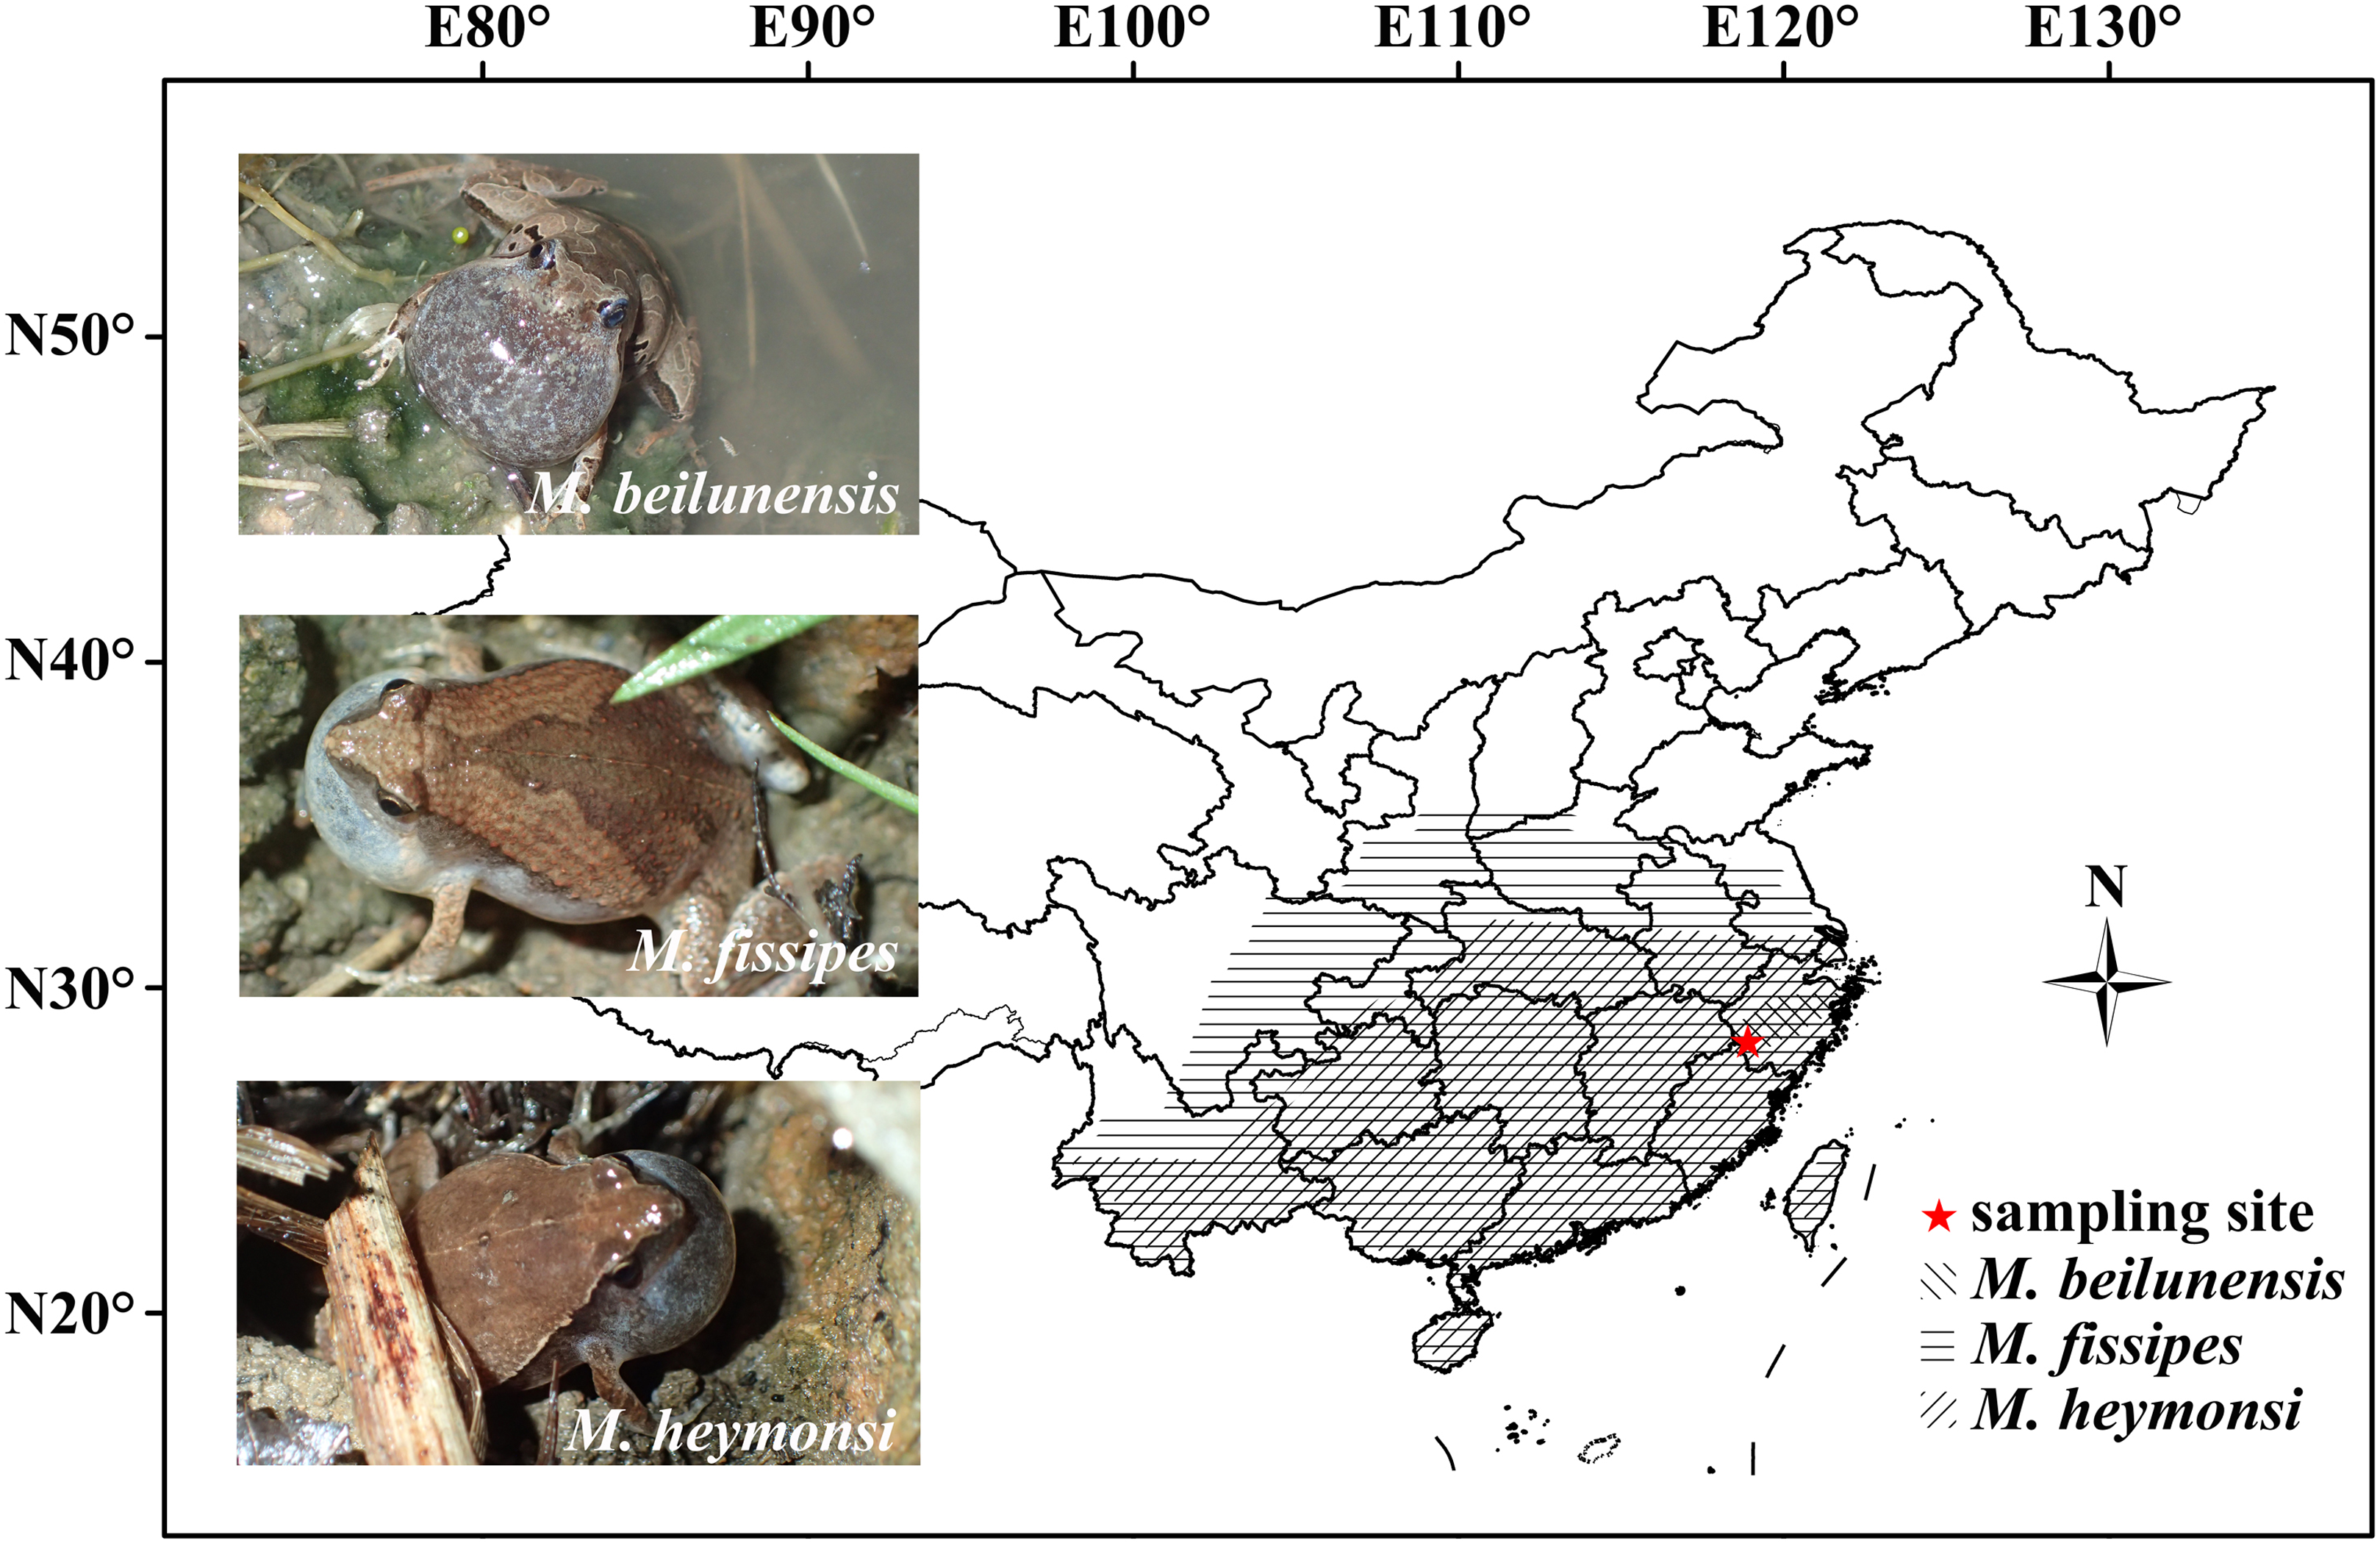
Materials and Methods
Data collection
Administration Bureau of Jiulongshan National Nature Reserve provided the permit for capturing animals in the field (No. 20180422). Our experimental procedures complied with the current laws on animal welfare and research in China and were specifically approved by the Animal Research Ethics Committee of College of Ecology in Lishui University (Permit No. ARE-CECLU 201804-001).
The advertisement calls of males from three Microhyla species were recorded in the Jiulongshan National Nature Reserve (28.37°N, 118.90°E), in April and May 2017–2018. Males of M. fissipes and M. heymonsi were captured in the same six paddy fields, while males of M. beilunensis were captured from four paddy fields adjacent to those of other two species. Each frog was individually placed in a lidded, transparent, plastic cage (20 cm × 10 cm × 10 cm) and the cage was then placed on the ridge of the paddy field, where the frogs were initially collected. After placing the cage for 10 min, the call of each male was recorded for at least 1 min at 20:00–22:00 h, using a Sony IC recorder (ICD-SX1000) with an internal microphone, placed at 0.5 m from the cage, with a sampling frequency resolution of 44,100 Hz and 16-bit resolution. Thereafter, the SVL was measured using a digital Mitutoyo caliper (±0.1 mm). A total of 1,328 valid advertisement calls were recorded successfully, from the 45 males (17 M. beilunensis, 13 M. fissipes and 15 M. heymonsi), across all three species (444 calls of M. beilunensis, 475 calls of M. fissipes and 409 calls of M. heymonsi). We also recorded the ambient air temperature during the experiment, using the UNI-T digital thermometer (UT325). The air temperature during the experiment ranged between 16.8 °C and 18.2 °C (for M. beilunensis) and between 16.3 °C and 19.8 °C (for M. fissipes and M. heymonsi). After recording, all individuals were released.
Bioacoustics analysis
Recordings were transferred from the recording device to PC with Cool Edit Pro 2.1. Then, background noise was reduced by 20 dB (FFT = 1,024 points) in the noise reduction module and files were saved in the “.wav” format. Advertisement calls were analyzed using Praat 6.0.49 (Boersma & Weenink, 2019) at a sampling frequency resolution of 44,100 Hz and 16-bit resolution. The temporal and spectral structures of the calls were analyzed using 10 variables: CD, call interval (CI), NP, pulses rate of the call (PR), call intensity (CIT), DF and the frequency of the first to fourth formants (F1, F2, F3 and F4).
Data analyses
We used coefficients of variation within individual (CVW) and among individuals (CVA) to quantify the variability in call parameters. CVW was calculated as the standard deviation (SD) divided by the mean, for each acoustic parameter and for each individual. An overall mean CVW was calculated for each species and for each parameter. CVA was calculated for each parameter using the overall mean and SD, for all individuals of the same species (Pettit, Bourne & Bee, 2013). With respect to CVW, the parameters with a mean that explained up to 5% of the total variance were considered static. The parameters with a mean of between 5% and 10% were intermediate and those with a mean that explained more than 10% of the total variance were considered dynamic (Gerhardt, 1991). The magnitude of sample variation was calculated using the ratio of CVA/CVW for each parameter; a non-parametric Kruskal–Wallis H test was used to evaluate if CVA was higher than CVW (Morais et al., 2012; Gambale, Signorelli & Bastos, 2014; Turin, Nali & Prado, 2018).
Calls were pooled by individual specimens. Statistical analyses of the calls were conducted using SPSS 18.0 software. Prior to parametric analysis, the normality and homogeneity of variance in the data were tested using the Kolmogorov–Smirnov test and Bartlett’s M test, respectively. Data did not require any transformation to meet the assumptions of the parametric tests. We used Pearson’s correlation analyses (correlation coefficient = ρ) to assess the relationship between SVL and the 10 call parameters, for each species. We used min–max normalization to homogenize the call variable data for each species and carried out principal component analysis (PCA) to determine the relative contribution of each of the 10 acoustic parameters to call distinctiveness. We used discriminant function analysis (DFA) to verify the results of the PCA. A call parameter was classified as the main contributing factor if its absolute value was higher than 0.7 (Turin, Nali & Prado, 2018). One-way ANOVAs was used to determine the difference in acoustic characteristics between the three Microhyla species, with factor scores for the two axes. Tukey’s post hoc test (HSD) was carried out on variables that differed among the three species. All values are presented as mean ± SD and the differences are considered statistically significant at α = 0.05.
We combined our data with previously published records of the SVL, CD, NP and DF of advertisement calls from 29 Microhyla species (Table S1). The tests detailed previously were carried out using the topology including the 29 Microhyla species collected. The species topology was based on phylogenetic relationships (Fig. S1). For phylogenetic analyses, we downloaded the mitochondrial 12S rRNA, 16S rRNA and CO I sequence data for the related species from GenBank (Table S2). Concatenated sequence data of 12S (351 bp), 16S (508 bp) and CO I (577 bp) of the 29 Microhyla species were used for phylogenetic reconstructions. According to Matsui et al. (2011), one Kaloula verrucosa sample was chosen as the outgroup. Phylogenetic relationships were reconstructed using the Bayesian Inference (BI) method, implemented in MrBayes v. 3.2 (Ronquist et al., 2012). Before that, the best-fit substitution model was selected using jModeltest v. 2.1.4 (Darriba et al., 2012) under the corrected Akaike’s Information Criterion (AIC; Hurvich & Tsai, 1989). Based on the results, the GTR+I+G model was selected for the BI phylogenetic analyses. In BI, we initiated a dependent run with four simultaneous Monte Carlo Markov chains (MCMC) for 20 million generations with sampling every 1,000 generations and discarded the first 25% of generations as burn-in after confirming the convergence of chains. The final majority tree and posterior probabilities (pp) were achieved from the remaining trees. We used substitutions/site of BI method to represent branch length. Ordinary least squares (OLS) and phylogenetic general least squares (PGLS) regressions were implemented in R 3.2.3 (R Development Core Team, 2015), using the RMS (Harrell, 2012) and CAPER (Orme et al., 2012) packages. OLS regression was used to estimate the slope for all conventional analyses. PGLS regression was used to examine the relationships between pairs of variables (SVL, CD, NP and DF), while accounting for phylogenetic effects. PGLS regression incorporates phylogenetic information into generalized linear models and offers a powerful methodology for analyzing continuous data. Previously, it has been applied to estimate the evolutionary relationship between traits of interest (Warne & Charnov, 2008; Barros, Herrel & Kohlsdorf, 2011; Yu et al., 2014). In PGLS regression, the strength and type of phylogenetic signal in the data matrix can be accounted for by adjusting branch length, which can be optimized to find the maximum likelihood transformation. We used AIC to estimate merits and drawbacks of the models tested; the best model was that with the lowest AIC and λ, using a maximum likelihood approach to evaluate phylogenetic effects (λ = 0 indicates no phylogenetic effect and λ = l indicates the strongest phylogenetic effect equivalent to that expected under the Brownian motion model). The best-fitting model can be determined using the maximum-likelihood ratio test.
Results
The advertisement calls of all three species had approximately the same spectrogram shape: first a pulse of low amplitude, which then increases, then the main body of the call, then a final pulse, during which the amplitude decreases again. It is a spindle-shaped trend in which the amplitude gradually increased, and then gradually decreased (Fig. 2). However, there were species-specific differences in call composition (Fig. 2). All species exhibited significant differences in the frequency of the NP. The call of M. beilunensis was composed of 2–7 separate pulses (Figs. 2B and 2C); a six-pulse call occurred most frequently, comprising 37.70% of the total calls. The call of M. fissipes had 8–21 separate pulses (Figs. 2F and 2G); the 16-pulse call occurred most frequently, comprising 33.75% of thetotal calls. The call of M. heymonsi was composed of 3–11 separate pulses (Figs. 2K and 2L); the six-pulse call occurred most frequently, comprising 43.40% of the total calls. Males of all three species have an external single subgular vocal sac and their throat color differs among the three species (Figs. 2E, 2J and 2O). M. beilunensis has small black markings around the throat (Fig. 2E). The throat of M. fissipes has large black markings on all sides and small black markings in the center (Fig. 2J) and that of M. heymonsi has small brown markings (Fig. 2O).
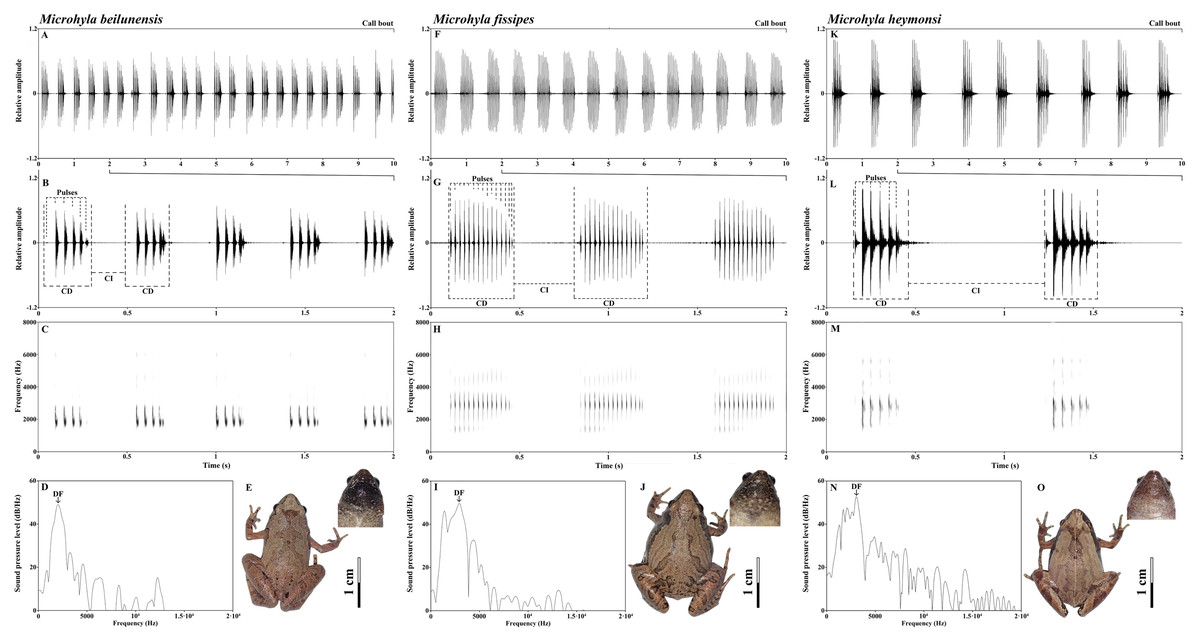
Figure 2: Sample recordings of the advertisement call of the three Microhyla species from East China.
(A, F and K) Oscillogram of a 10 s long call bout of the three Microhyla species recorded in Suichang, Zhejiang, China (B, G and L) detailed view of a 2 s section of the oscillogram and (C, H and M) spectrogram of the same call (D, I and N) power spectrum of the same advertisement call, and (E, J and O) dorsal and pharyngeal views of males in M. beilunensis, M. fissipes and M. heymonsi, respectively. M. beilunensis is characterized by a brown triangular marking between the eyes, dark-brown markings with light brown margins on the dorsum and limbs and a brown-black pharyngeal; M. fissipes is characterized by a pink-gray, yellow-brown or gray-brown dorsum, two inverted V-shaped marking tandem lined on the dorsum and a black pharyngeal; M. heymonsi is characterized by a yellow thin ridge line from snout to vent, a pair or two pairs of brown arcuate spots on the ridge line of dorsum and brown stripes on the pharyngeal (AmphibiaChina, 2020; Zhang et al., 2018).
The mean SVL differed among the three species (F2, 42 = 11.51, P < 0.001) and was the largest in M. fissipes (23.2 ± 1.2 mm; ranged, 21.6–25.8 mm; N = 13) and the smallest in M. heymonsi (21.5 ± 1.2 mm; ranged,19.6–23.6 mm; N = 15), with M. beilunensis (22.5 ± 0.7 mm; ranged, 21.2–23.5 mm; N = 17) in between. The correlation analysis between SVL and the 10 call parameters showed that SVL negatively correlated with the DF in M. fissipes (ρ = −0.698) and M. beilunensis (ρ = −0.652), with the F1 in M. heymonsi (ρ = −0.558) and M. beilunensis (ρ = −0.494) and with the F3 in all three species (M. beilunensis: ρ = −0.553, M. fissipes: ρ = −0.733, M. heymonsi: ρ = −0.526).
All the 10 call parameters differed significantly among the three species (Table 1). The CD, DF, F2 and F3 were higher in M. fissipes and M. heymonsi than in M. beilunensis; the CI and CIT were the highest in M. heymonsi and the lowest in M. beilunensis; the NP was the highest in M. fissipes and the lowest in M. beilunensis; the PR was higher in M. fissipes than in M. heymonsi and M. beilunensis; and the F1 and F4 were lower in M. fissipes than in the other species (Table 1).
| Call parameters | Species | Statistical results | ||
|---|---|---|---|---|
| M. beilunensis | M. fissipes | M. heymonsi | ||
| N | 17 | 13 | 15 | |
| CD (s) | 0.273 ± 0.027 | 0.334 ± 0.030 | 0.308 ± 0.046 | F2, 42 = 11.33, P < 0.001 |
| 0.248–0.331 | 0.286–0.375 | 0.248–0.386 | MF = MH > MB | |
| CI (s) | 0.238 ± 0.072 | 0.483 ± 0.095 | 0.919 ± 0.098 | F2, 42 = 241.99, P < 0.0001 |
| 0.126–0.387 | 0.325–0.595 | 0.762–1.068 | MH > MF > MB | |
| NP (pulses) | 5.0 ± 0.4 | 14.8 ± 1.7 | 6.3 ± 0.8 | F2, 42 = 354.56, P < 0.0001 |
| 4.4–5.6 | 11.3–16.6 | 5.3–7.6 | MF > MH > MB | |
| PR (pulses/s) | 18.7 ± 2.2 | 44.9 ± 7.3 | 20.1 ± 1.5 | F2, 42 = 163.85, P < 0.0001 |
| 15.1–22.3 | 30.6–55.7 | 19.4–24.7 | MF > MH = MB | |
| CIT (dB) | 74.6 ± 0.9 | 75.5 ± 1.3 | 79.0 ± 0.4 | F2, 42 = 96.15, P < 0.0001 |
| 72.8–76.1 | 73.0–77.5 | 78.5–79.8 | MH > MF > MB | |
| DF (Hz) | 2,139.2 ± 218.9 | 2,951.5 ± 151.8 | 2,877.5 ± 188.4 | F2, 42 = 107.60, P < 0.0001 |
| 1,750.1–2,411.7 | 2,644.8–3,116.8 | 2,696.7–3,048.3 | MF = MH > MB | |
| F1 (Hz) | 1,642.9 ± 52.1 | 1,472.3 ± 52.4 | 1,589.0 ± 44.0 | F2, 42 = 44.28, P < 0.0001 |
| 1557.3–1,750.7 | 1,353.7–1,530.3 | 1,630.3–1,662.4 | MF < MH = MB | |
| F2 (Hz) | 2,122.1 ± 132.5 | 2,336.1 ± 62.1 | 2,389.7 ± 70.7 | F2, 42 = 33.98, P < 0.0001 |
| 1,848.9–2,326.7 | 2,256.1–2,437.2 | 2,275.3–2,512.4 | MF = MH > MB | |
| F3 (Hz) | 2,651.0 ± 71.7 | 2,963.4 ± 117.6 | 2,951.2 ± 90.9 | F2, 42 = 57.16, P < 0.0001 |
| 2,544.2–2,827.5 | 2,715.7–3,080.0 | 2,842.4–3,129.9 | MF = MH > MB | |
| F4 (Hz) | 3,805.9 ± 63.7 | 3,641.9 ± 135.2 | 3,803.9 ± 68.0 | F2, 42 = 14.80, P < 0.0001 |
| 3,723.7–3,936.5 | 3,315.0–3,934.8 | 3,714.8–3,917.3 | MF < MH = MB | |
In all the species, four temporal parameters (CD, CI, NP and PR) showed larger CVW and CVA, whereas six spectral parameters presented smaller coefficients (Table 2). The mean CVA was larger than the mean CVW for all the parameters (the ratio of CVA/CVW > 1.0), and these differences were statistically significant (Table 2).
| Call parameters | M. beilunensis | M. fissipes | M. heymonsi | ||||||||||||
|---|---|---|---|---|---|---|---|---|---|---|---|---|---|---|---|
| CVW (%) (range) | Property | CVA (%) | CVA/CVW | H | CVW (%) (range) | Property | CVA (%) | CVA/CVW | H | CVW (%) (range) | Property | CVA (%) | CVA/CVW | H | |
| CD | 14.7 (8.1–23.1) | Dynamic | 18.19 | 1.24 | 13.55* | 7.3 (4.6–12.4) | Intermediate | 11.30 | 1.54 | 9.07* | 24.4 (11.1–41.9) | Dynamic | 31.44 | 1.29 | 7.45* |
| CI | 41.7 (15.1–59.7) | Dynamic | 52.04 | 1.25 | 13.96* | 27.5 (10.8–53.1) | Dynamic | 35.47 | 1.29 | 9.07* | 26.6 (17.8–41.5) | Dynamic | 28.53 | 1.07 | 6.92* |
| NP | 18.9 (9.1–29.9) | Dynamic | 20.52 | 1.09 | 13.21* | 8.6 (5.1–15.1) | Intermediate | 13.58 | 1.59 | 9.07* | 20.1 (8.7–43.4) | Dynamic | 25.58 | 1.28 | 7.88* |
| PR | 15.5 (10.6–23.2) | Dynamic | 19.28 | 1.25 | 13.96* | 5.5 (2.7–8.3) | Intermediate | 16.72 | 3.06 | 9.92* | 12.2 (5.9–26.4) | Dynamic | 14.72 | 1.20 | 7.45* |
| CIT | 1.3 (0.6–2.1) | Static | 1.86 | 1.39 | 13.96* | 0.9 (0.3–2.4) | Static | 1.98 | 2.22 | 9.07* | 1.1 (0.5–1.7) | Static | 1.20 | 1.12 | 6.92* |
| DF | 4.1 (0.4–8.0) | Static | 11.25 | 2.71 | 15.71* | 2.3 (0.9–6.1) | Static | 5.26 | 2.26 | 9.07* | 3.0 (0.3–9.0) | Static | 5.47 | 1.82 | 8.41* |
| F1 | 3.7 (0.8–5.8) | Static | 5.04 | 1.36 | 13.55* | 1.1 (0.4–3.4) | Static | 3.40 | 3.01 | 9.92* | 2.2 (1.1–3.4) | Static | 3.52 | 1.60 | 9.80* |
| F2 | 2.9 (0.9–5.8) | Static | 6.92 | 2.36 | 15.71* | 1.2 (0.5–3.7) | Static | 2.93 | 2.47 | 9.07* | 2.9 (0.6-5.0) | Static | 4.20 | 1.43 | 7.88* |
| F3 | 2.9 (0.9–6.1) | Static | 4.25 | 1.44 | 13.55* | 1.3 (0.2–5.0) | Static | 4.17 | 3.14 | 9.07* | 1.9 (0.6–3.2) | Static | 3.44 | 1.83 | 9.80* |
| F4 | 3.2 (0.8–8.4) | Static | 4.10 | 1.29 | 13.55* | 2.1 (0.4–5.5) | Static | 4.38 | 2.10 | 9.07* | 2.8 (1.8–5.5) | Static | 3.27 | 1.18 | 7.45* |
Notes:
CD, call duration; CI, call interval; NP, number of pulses; PR, pulse rate; CIT, call intensity; DF, dominant frequency; F1, the first formant; F2, the second formant; F3, the third formant; F4, the fourth formant; CVW, Within-individual coefficients of variation; CVA, Among-individual coefficients of variation; Static, CVW ≤ 5%; dynamic, CVW ≥ 10%; intermediate, 5% < CVW < 10%.
The PCA analysis suggested that two components (eigenvalue ≥ 1) from the original ten acoustic parameters accounted for 78.39% of the variation (Table 3). The first component (explained 50.60% of variance) had high positive loading scores for NP, PR, F2 and F3 and a high negative loading score for F1; the second axis (explained 27.79% of variance) mainly represented CI and CIT (Table 3). The resulting scores differed significantly among the three species on both axes (first axis: F2, 42 = 323.24, P < 0.0001; MH > MF > MB; second axis: F2, 42 = 131.73, P < 0.0001; MH > MB > MF) (Fig. 3A).
| Call parameters | PCA | DFA | ||
|---|---|---|---|---|
| PC1 | PC2 | Function 1 | Function 2 | |
| CD | 0.637 | −0.112 | 0.013 | 0.687 |
| CI | 0.548 | 0.751 | 0.620 | 0.713 |
| NP | 0.791 | −0.585 | 0.964 | −1.365 |
| PR | 0.734 | −0.598 | −0.183 | 1.035 |
| CIT | 0.433 | 0.789 | 0.182 | 0.309 |
| DF | 0.939 | 0.255 | 0.200 | −0.486 |
| F1 | −0.701 | 0.414 | −0.571 | 0.159 |
| F2 | 0.794 | 0.434 | −0.238 | 0.489 |
| F3 | 0.856 | 0.283 | 0.741 | 0.372 |
| F4 | −0.517 | 0.613 | −0.045 | −0.333 |
| Eigenvalue | 5.059 | 2.782 | 40.798 | 16.546 |
| Variance (%) | 50.59 | 27.82 | 71.15 | 28.85 |
| Cumulative variance (%) |
50.59 | 78.41 | 71.15 | 100 |
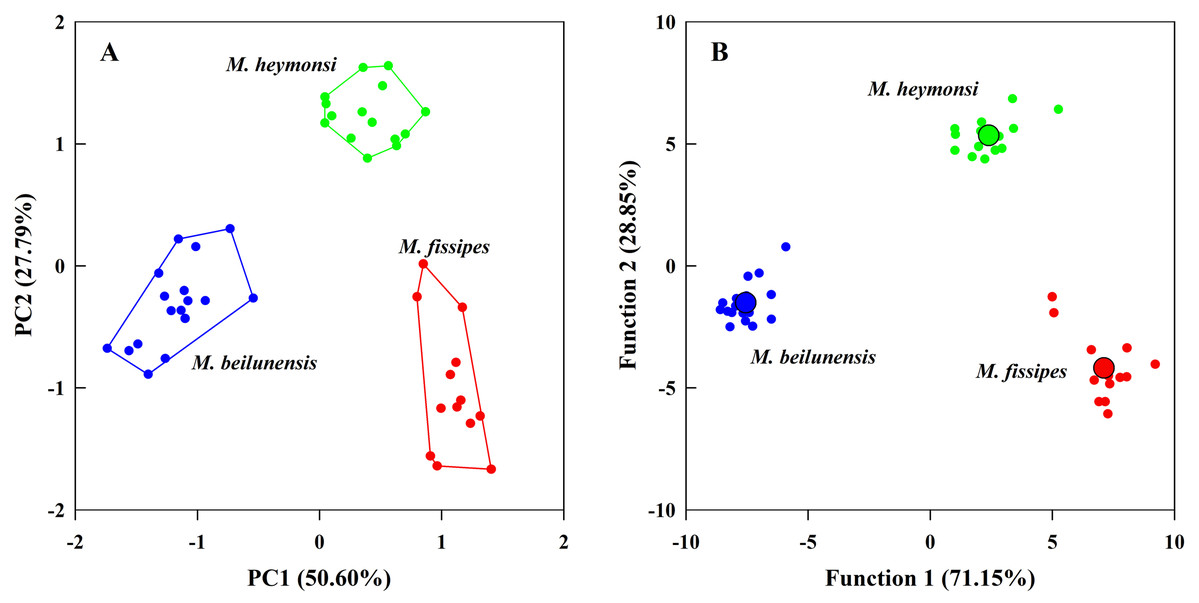
Figure 3: The principal component analysis and the discriminant function analysis of advertisement call parameters for the three Microhyla species.
(A) Plot of principle components 1 and 2 (PC1 vs. PC2) based on ten variables of acoustic parameters. (B) Canonical variables plot of the discriminant function analysis based on 10 variables of acoustic parameters with the centroids indicated as enlarged dots.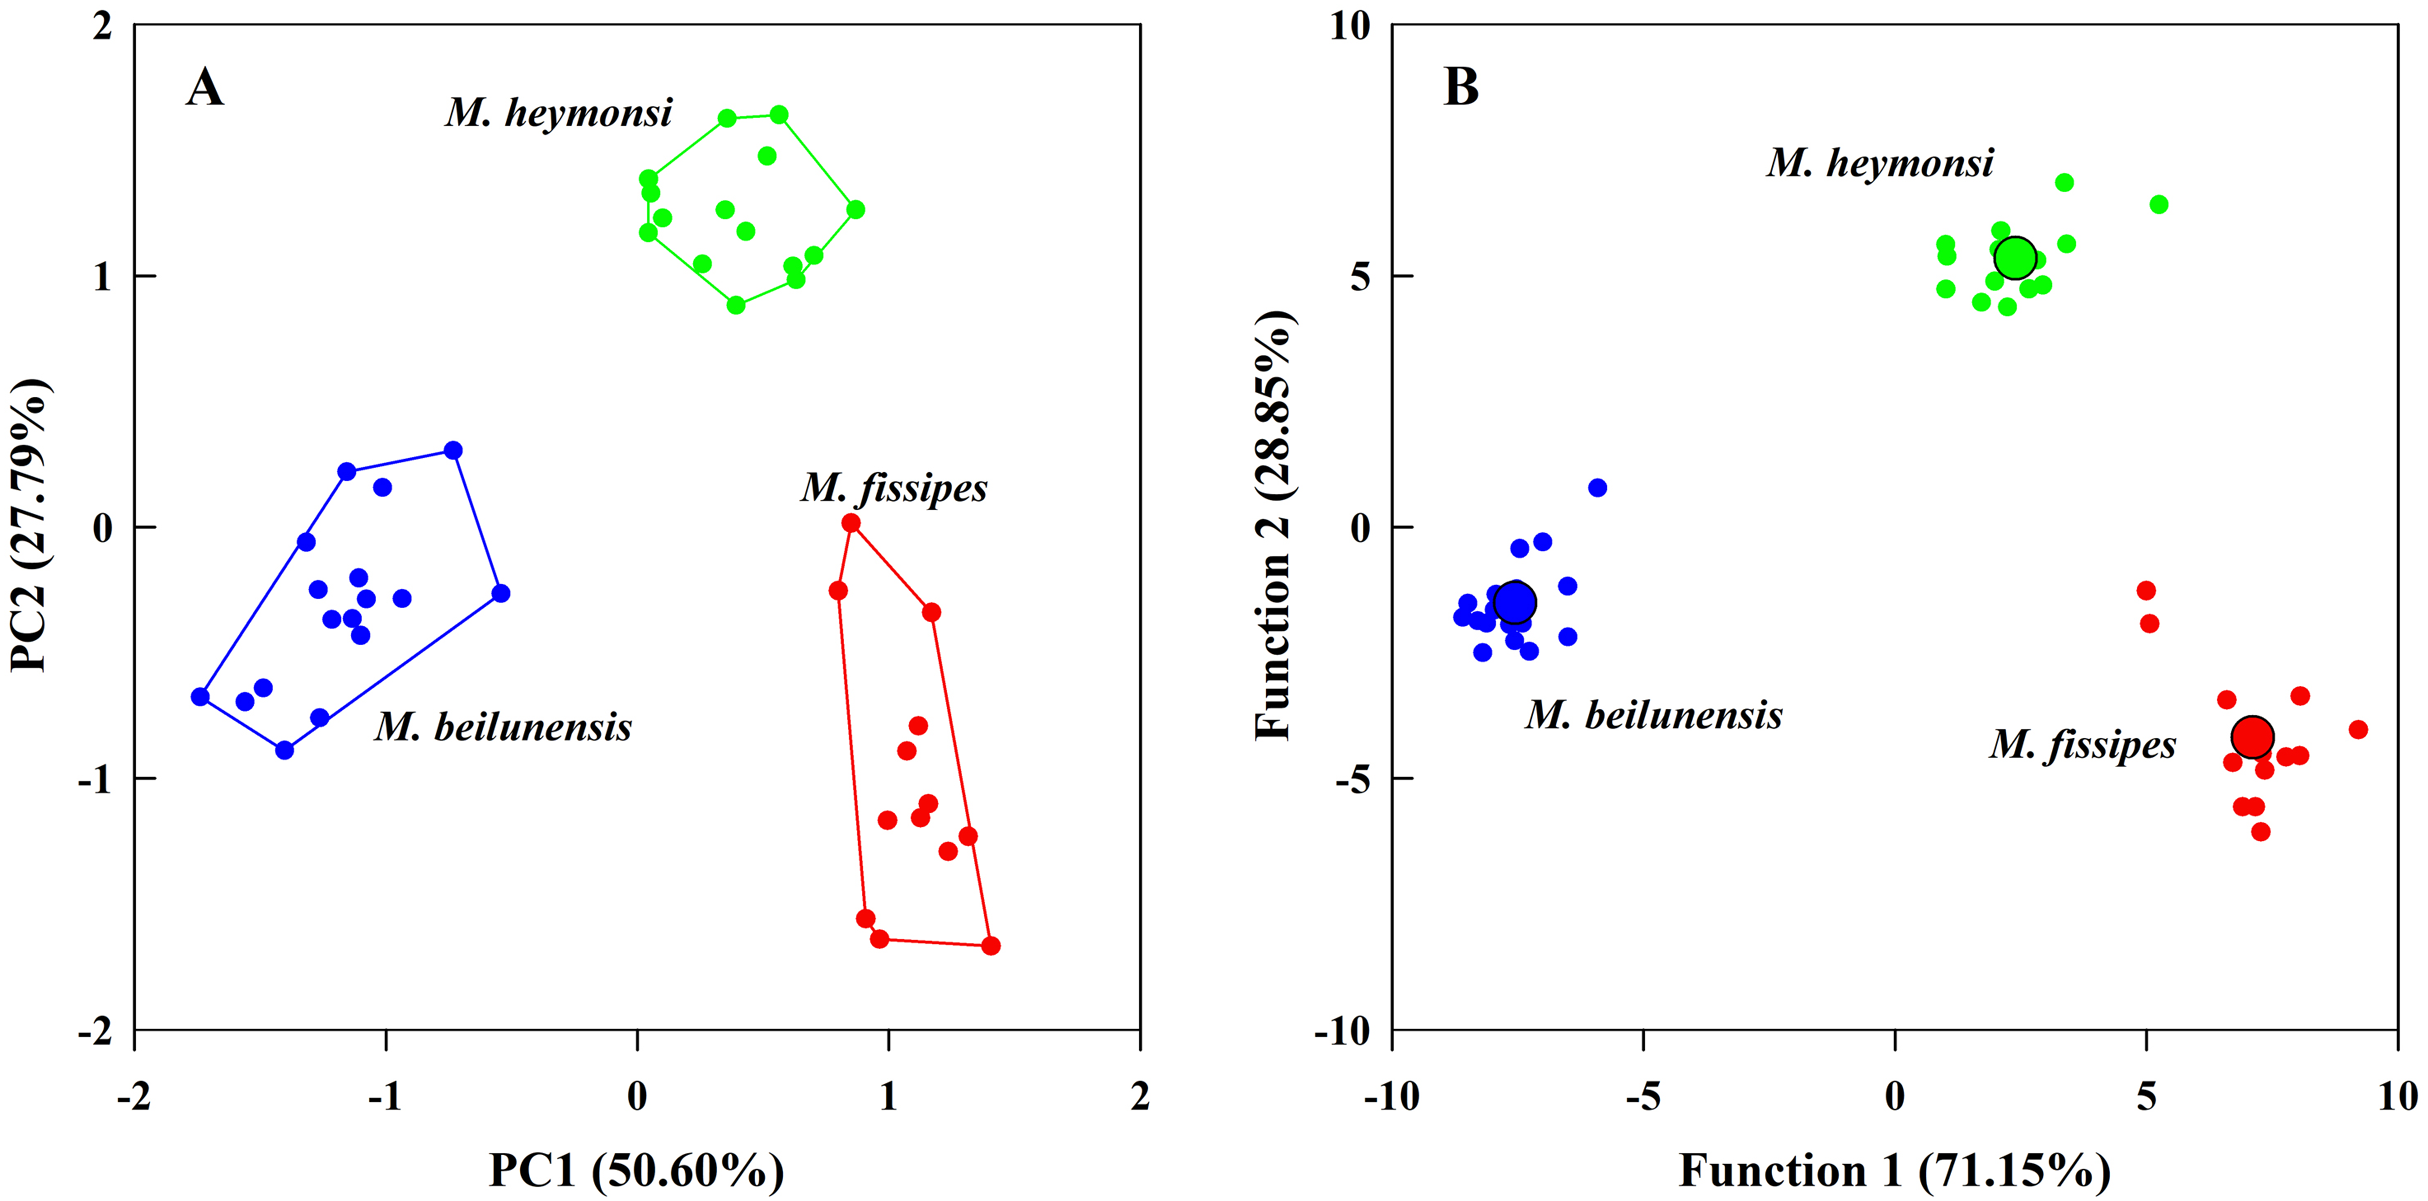
The DFA analysis presented results similar to those of the PCA and generated two discriminant functions (Table 3). The first canonical variable (explained 71.15% of variance) mostly represented NP and F3; the second canonical variable (explained 28.85% of variance) was largely represented by the CI, NP and PR (Table 3). The two functions differed significantly among the three species (Wilks’ λ = 0.001, P < 0.0001); even after excluding the first function, the second function was still different for each species (Wilks’ λ = 0.057, P < 0.0001). The centroids were −7.55, −1.52 for M. beilunensis; 7.11, −4.18 for M. fissipes; and 2.40, 5.34 for M. heymonsi (Fig. 3B).
By incorporating data from 29 Microhyla species, we found that the mean male SVL in the genus ranged from 14.9 mm to 33.6 mm; mean CD ranged from 0.062 s to 1.806 s; mean NP ranged from 4 to 97; and mean DF ranged from 1,650 Hz to 5,029 Hz (Table S1). The PGLS analysis showed that phylogenetic relationships affect CD vs. SVL, NP vs. SVL, DF vs. CD, NP vs. CD and NP vs. DF (all λ > 0.77), but not DF vs. SVL (λ = 0) (Table 4). DF was negatively related to SVL (Fig. 4), but the relationship between CD and SVL, NP and SVL, DF and CD, and NP and DF were not significant in the OLS and PGLS models (Table 4). NP was positively related to CD in the OLS model, but not in the PGLS model (Table 4). Based on likelihood ratio tests, the PGLS model was a better fit to the data than the OLS model for NP vs. SVL, NP vs. CD and NP vs. DF (Table 4).
| Models | N | Slope | Intercept | r2 | Ln likelihood | AIC | λ | Statistical results |
|---|---|---|---|---|---|---|---|---|
| OLS | ||||||||
| CD vs. SVL | 28 | −1.37 ± 0.71 | 2.85 ± 2.13 | 0.126 | −30.875 | 67.75 | F1, 26 = 3.74, P = 0.064 | |
| DF vs. SVL | 27 | −1.05 ± 0.16 | 11.13 ± 0.48 | 0.633 | 11.640 | −17.28 | F1, 25 = 43.17 P < 0.001 | |
| NP vs. SVL | 29 | −0.40 ± 0.91 | 3.92 ± 2.72 | 0.007 | −39.060 | 84.12 | F1, 27 = 0.20, P = 0.660 | |
| DF vs. CD | 26 | 0.10 ± 0.06 | 8.08 ± 0.10 | 0.089 | −1.105 | 8.21 | F1, 24 = 2.36, P = 0.138 | |
| NP vs. CD | 28 | 0.65 ± 0.20 | 3.54 ± 0.30 | 0.285 | −33.560 | 73.12 | F1, 26 = 10.34, P < 0.01 | |
| NP vs. DF | 27 | 0.95 ± 0.69 | −4.81 ± 5.51 | 0.070 | −35.430 | 76.86 | F1, 25 = 1.89, P = 0.181 | |
| PGLS | ||||||||
| CD vs. SVL | 28 | −0.15 ± 0.76 | −1.24 ± 2.28 | 0.001 | −22.610 | 53.22 | 1.0 | F1, 26 = 0.04, P = 0.845 |
| DF vs. SVL | 27 | −1.09 ± 0.16 | 11.23 ± 0.48 | 0.651 | 14.120 | −20.24 | 0 | F1, 25 = 46.58, P < 0.001 |
| NP vs. SVL | 29 | 0.46 ± 0.66 | 1.15 ± 2.00 | 0.017 | −19.795* | 47.59 | 1.0 | F1, 27 = 0.47, P = 0.497 |
| DF vs. CD | 26 | 0.02 ± 0.08 | 8.09 ± 0.20 | 0.004 | 0.640 | 6.72 | 0.777 | F1, 24 = 0.09, P = 0.765 |
| NP vs. CD | 28 | 0.17 ± 0.17 | 2.82 ± 0.48 | 0.034 | −19.270* | 46.54 | 1.0 | F1, 26 = 0.93, P = 0.344 |
| NP vs. DF | 27 | 0.67 ± 0.38 | −2.82 ± 3.08 | 0.108 | −17.760* | 43.52 | 1.0 | F1, 25 = 3.04, P = 0.094 |
Note:
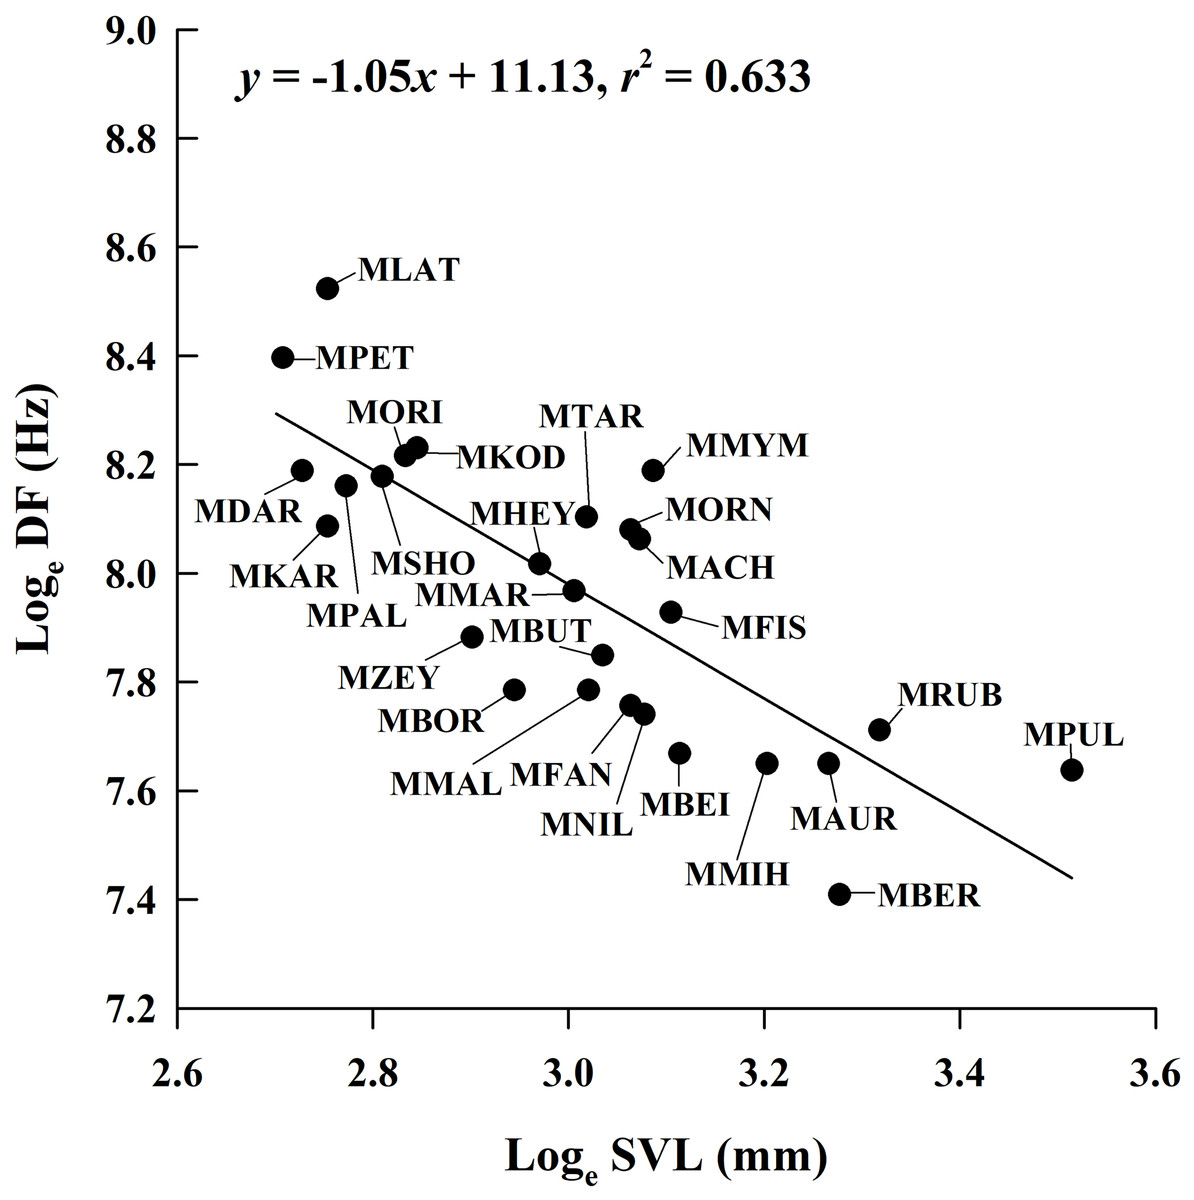
Figure 4: Ordinary least squares regression of dominant frequency (DF) on male snout-vent length (SVL) of 26 Microhyla species.
Regression equation and coefficient are given in the figure. MACH, M. achatina; MAUR, M. aurantiventris; MBEI, M. beilunensis; MBER, M. berdmorei; MBOR, M. borneensis; MBUT, M. butleri; MDAR, M. darreli; MFIS, M. fissipes; MFAN, M. fanjingshanensis; MHEY, M. heymonsi; MKAR, M. karunaratnei; MKOD, M. kodial; MLAT, M. laterite; MMAL, M. malang; MMIH, M. mihintalei; MMYM, M. mymensinghensis; MNIL, M. nilphamariensis; MORI, M. orientalis; MORN, M. ornata; MPAL, M. palmipes; MPET, M. petrigena; MPUL, M. pulchra; MRUB, M. rubra; MSHO, M. sholigari; MTAR, M. taraiensis; MZEY, M. zeylanica.
Discussion
To the best of our knowledge, the present study is the first to report the advertisement call of M. beilunensis consisting of 2–7 pulses per call, which has relatively few NPs among the 29 studied Microhyla species. Similar to that in other Microhyla species reported previously (Wijayathilaka, Meegaskumbura & Gianni, 2016; Sun, 2017; Nguyen et al., 2019; Poyarkov et al., 2019; Garg et al., 2018), oscillograms and spectrogram of advertisement calls in M. beilunensis were conformed to the pulse-repetition sound based on Beeman’s (1998) sound categories.
The patterns of variation in call parameters of anurans are correlated with female preferences and different parameters contain different kinds of biologically significant information (Gerhardt, 1991). Our results showed that the examined spectral parameters (e.g., DF, F1–F4 and CIT) were not or weakly variable as their CVW is smaller than 5% and a temporal parameter (CI) was variable as its CVW was larger than 10% in the three sympatric Microhyla species, according to the classification of Gerhardt (1991). These results were similar to those of most of reported 48 anurans, of which the DF of 69% species was classified as a static property and CI of 40% species was classified as a dynamic property (Köhler et al., 2017). Static properties with lower CVW are more important in species recognition, caused by stabilizing selection, because females usually prefer the values of individual calls at or near the mean of the population. Whereas, dynamic properties with higher CVW are generally supposed to be beneficial for mate choice and are driven by directional selection, because females tend to prefer extreme values of male calls (Gerhardt, 1991, 1994; Castellano & Giacoma, 1998; Wollerman, 1998; Friedl, 2006; Reinhold, 2011; Köhler et al., 2017). Therefore, our results indicated that all spectral parameters contributed to species recognition and the CI might encode information on mate quality in the three sympatric Microhyla species.
Generally, call parameters with stable within-individual variation have a low CVA and within-individual dynamic call parameters are also more variable on the CVA (Köhler et al., 2017). However, this phenomenon does not necessarily mean that among-individual variations are lower in static than in dynamic properties (Köhler et al., 2017). In our study, the CVs of spectral parameters were higher among individuals than within individual in the three Microhyla species. Especially, the values of CVA were more than 1.8 times of those of CVW for DF of the three Microhyla species. These variations among individuals were supposed to serve sexual selection and play a role in male–male competitions (Gerhardt, 1991; Howard & Young, 1998; Friedl & Klump, 2002; Köhler et al., 2017). Furthermore, body size is an important determinant of variations in call parameters among individuals (McClelland, Wilczynski & Ryan, 1996; Wang et al., 2012; Rodríguez et al., 2015). Our results showed that spectral parameters (e.g., DF, F1 and F3) are under the physical body size constraint, with smaller individuals producing calls at higher frequencies; in contrast, temporal parameters were not influenced by body size in the three Microhyla species. Similar results were also found in other Microhyla species (Wijayathilaka, Meegaskumbura & Gianni, 2016) indicating that spectral parameters of calls might encode the information of male’s body size in each Microhyla species. Therefore, researchers suggested that the spectral parameters of anurans’ advertisement calls, as an honest signal, transfer information about the body size of vocalizing individuals and thus, possibly information about its strength and quality to females and competitors (Davies & Halliday, 1978; Wells, 2007). In addition, although spectral parameters are relatively stable, they also have certain plasticity under the influence of social context (Lopez et al., 1988; Wagner, 1992; Bee & Perrill, 1996; Bee, Perrill & Owen, 2000). For example, Lithobates clamitans could lower the DF of their calls in response to broadcasts of conspecific calls (Bee & Perrill, 1996; Bee, Perrill & Owen, 2000). However, this phenomenon was not examined in our three Microhyla species. Therefore, further experiments are required to ascertain whether Microhyla species alter spectral parameters of advertisement calls in accordance with different social contexts.
Interspecific variation of advertisement calls in anurans serve in species recognition (Gerhardt & Huber, 2002; Köhler et al., 2017). Sympatric anuran sister species share the same acoustic space and tend to exhibit similar acoustic signals and behavioral traits (Toledo et al., 2015a). It is not clear how to minimize interference in the acoustic niche including spatial, temporal and structure dimensions (Rabin et al., 2003; Sinsch et al., 2012). The three Microhyla species studied used similar microhabitat and vocalizing time during the breeding season (Fei, Ye & Jiang, 2012; Z.-Q. Chen et al., 2019, unpublished data), but differences in acoustic structure were significant among the three sympatric Microhyla species. Besides, it cannot be ignored that phylogenetic history is perhaps the main restriction on the evolution of acoustic characteristics in anurans (Mclean, Bishop & Nakagawa, 2013). Many studies have shown that call differences between anuran species can largely be accounted by phylogeny (Bosch & De la Riva, 2004; Cocroft & Ryan, 1995; Mclean, Bishop & Nakagawa, 2013). Our PGLS results showed that the CD vs. SVL, NP vs. SVL, DF vs. CD, NP vs. CD and NP vs. DF relationships were significantly influenced by Microhyla phylogeny. However, the relationship between DF and SVL was not influenced by phylogeny, possibly owing to inter-sexual selection, which could weaken or even modify phylogenetic effects on the evolution of acoustic characteristics (Mclean, Bishop & Nakagawa, 2013). The level of call modification may also be affected by the properties of a specific signal. For example, behavioral traits are often more highly modified than physiological features (Blomberg, Garland & Ives, 2003; Mclean, Bishop & Nakagawa, 2013). Several Microhyla species are sympatric (Lee et al., 2016; Poyarkov et al., 2019; Frost, 2020; Z.-Q. Chen et al., 2019, unpublished data). To prevent inter-specific hybridization events, sympatric species must be able to distinguish conspecifics, via behavioral and physical features. Gerhardt & Huber (2002) found that inter-sexual selection is the main driving force behind the evolution of acoustic communication in anurans. Our results provide considerable evidence that the three sympatric Microhyla species have acoustic divergence in call structure, facilitating inter-sexual selection, which may therefore help prevent hybridization.
Conclusion
Based on the results, we conclude the following: (1) CVs of all spectral parameters were smaller than 5%, whereas the CV of CI was larger than 10% within individual of the three sympatric Microhyla species. (2) Body size was a key factor that leads to among-individual variation in advertisement calls of Microhyla species. (3) Acoustic divergence in call structure existed in the three sympatric Microhyla species. (4) The PGLS analysis showed that phylogeny affected the NP, DF and SVL vs. CD and SVL and DF vs. NP but not DF vs. SVL.
Supplemental Information
Descriptive statistics for mean and range of snout-vent length (SVL), call duration (CD), number of pulses (NP) and dominant frequency (DF) of advertisement calls of 29 Microhyla species.
Data were collected from 21 references and our study.
Vouchers, localities and GenBank accession numbers for samples used in the molecular analyses.
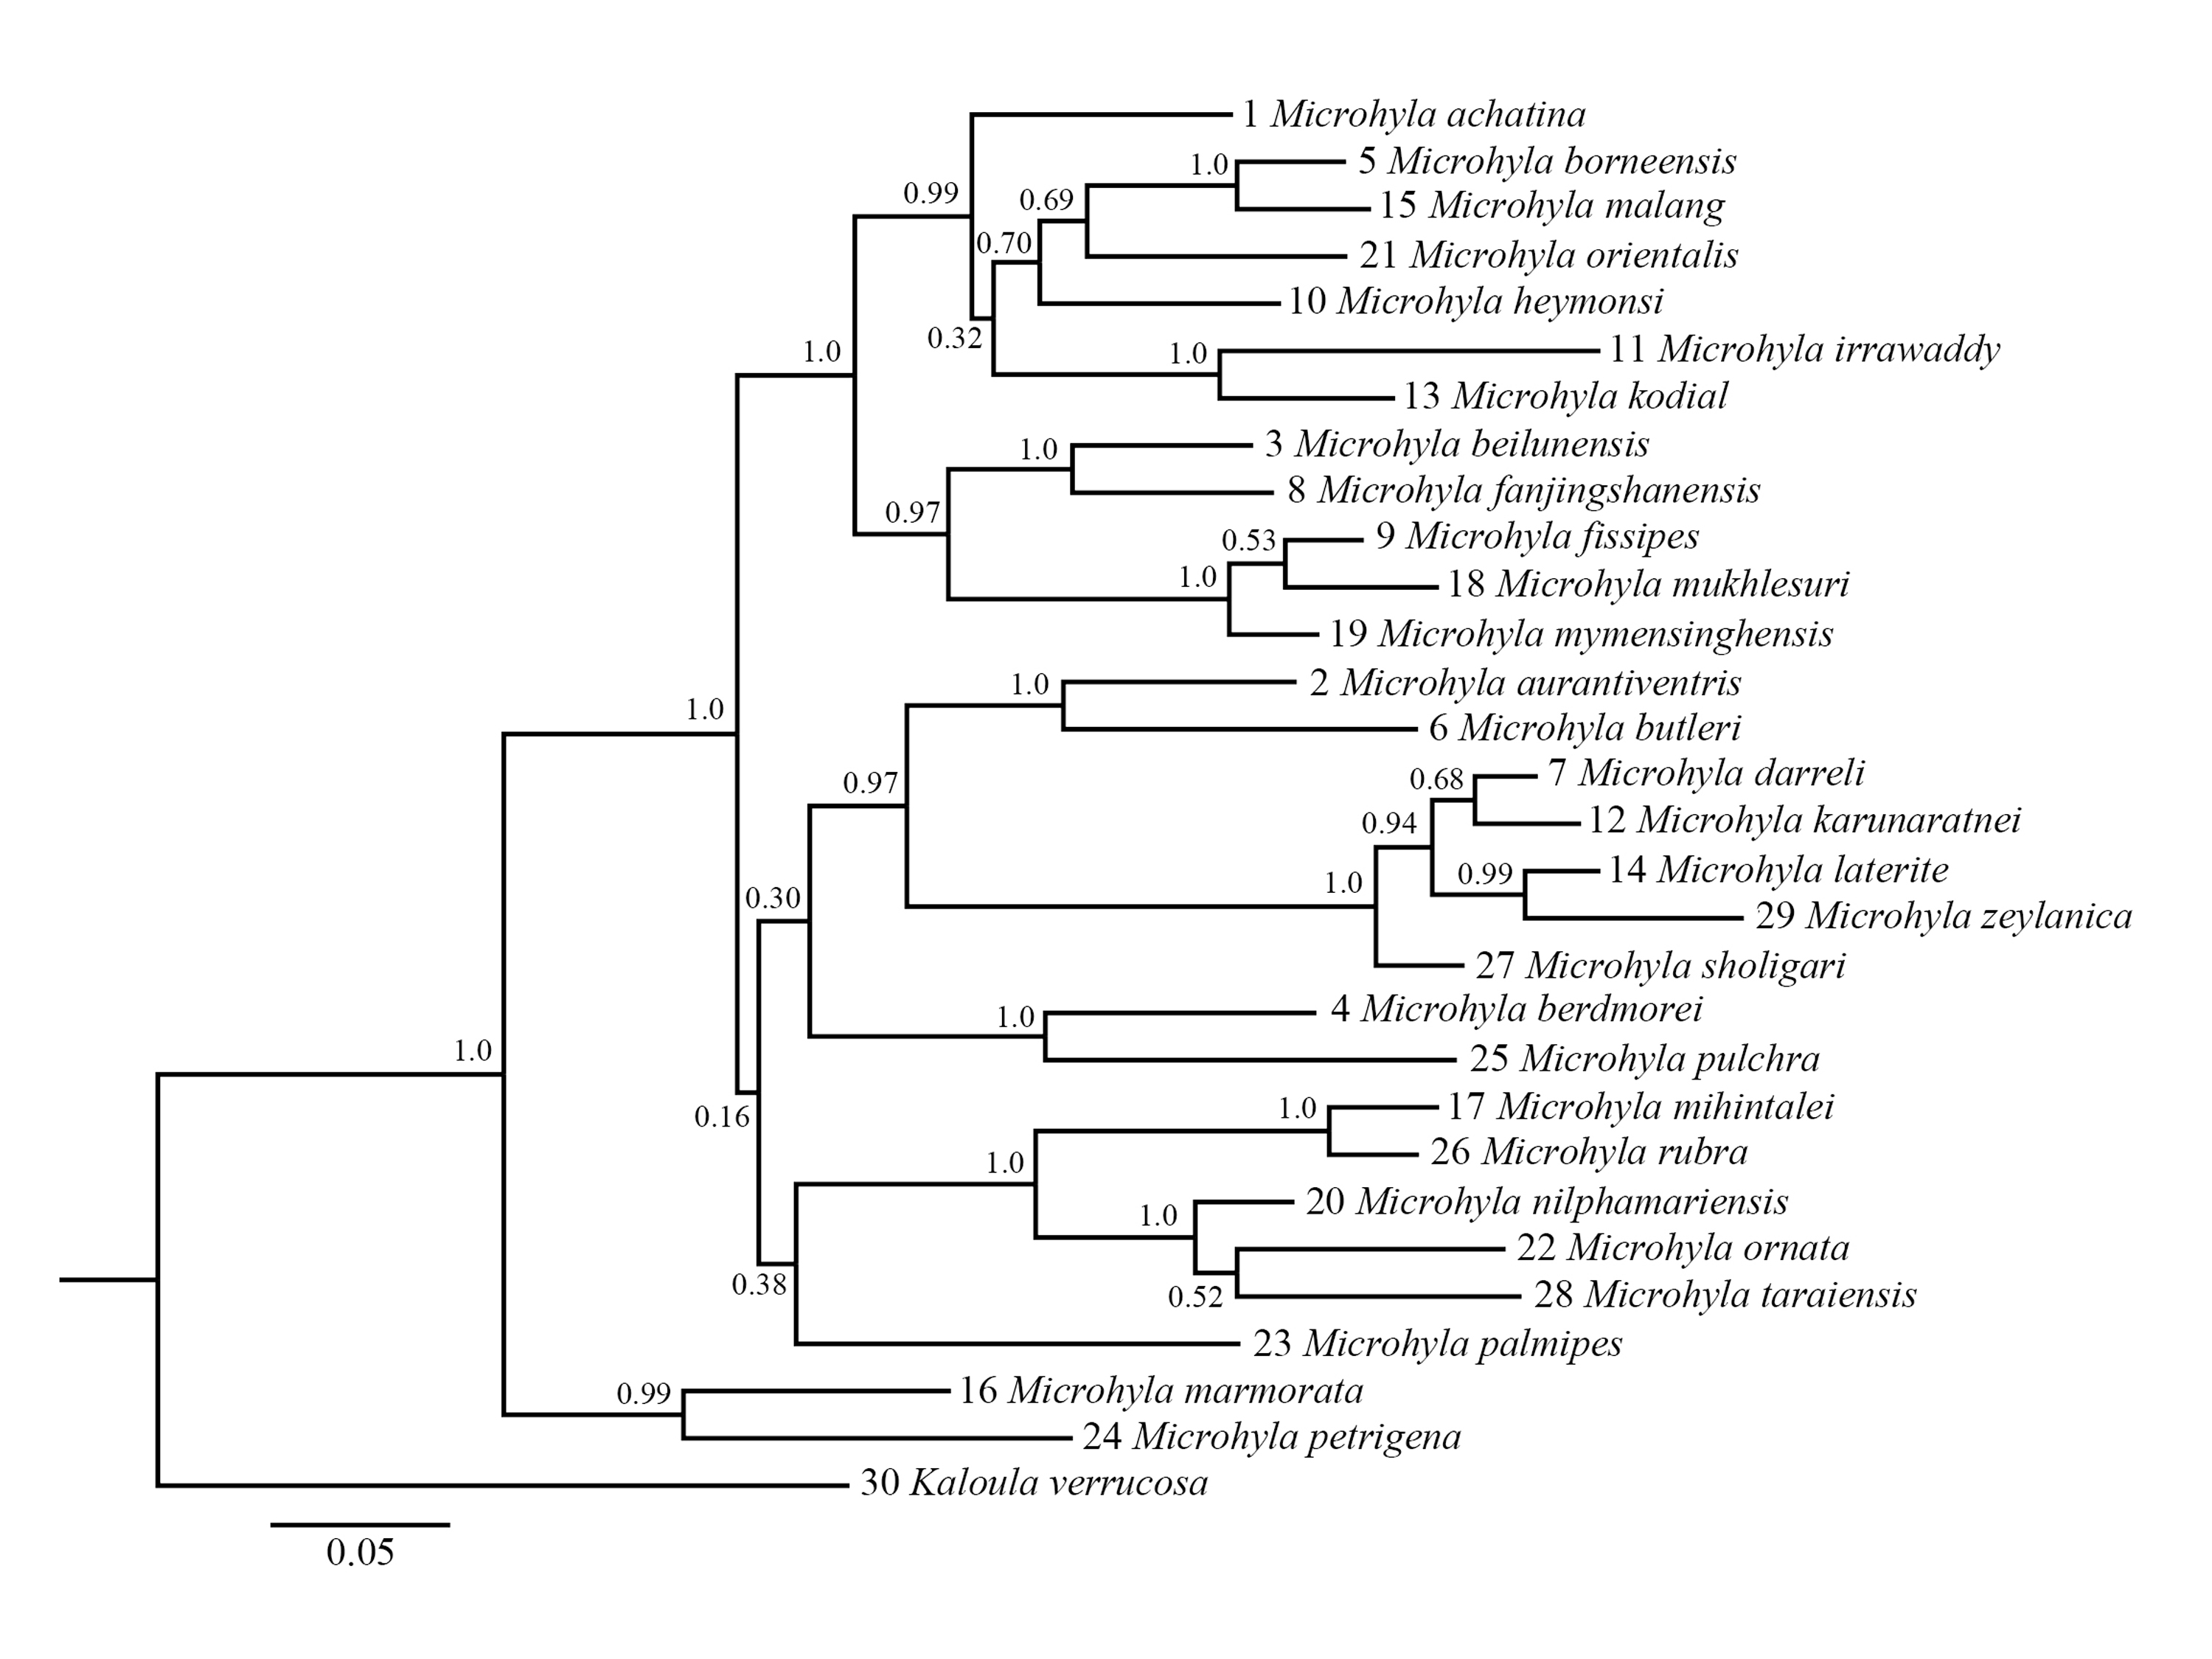
The Bayesian inference tree for 29 Microhyla species reconstructed based on mitochondrial 12S+16S+COⅠ gene sequences (1,436 bp).
One Kaloula verrucosa sample is chosen as outgroup. Numbers on the nodes show posterior probabilities. The scaleplate represents substitutions/site. The specimen number and accession number are showed in appendix table 2.