
HER2 and BRAF mutation in colorectal cancer patients: a retrospective study in Eastern China
- Published
- Accepted
- Received
- Academic Editor
- Paula Soares
- Subject Areas
- Gastroenterology and Hepatology, Oncology, Pathology
- Keywords
- Human epidermal growth factor receptor 2 gene, BRAF mutation, Colorectal cancer, Prognosis
- Copyright
- © 2020 Zhang et al.
- Licence
- This is an open access article distributed under the terms of the Creative Commons Attribution License, which permits unrestricted use, distribution, reproduction and adaptation in any medium and for any purpose provided that it is properly attributed. For attribution, the original author(s), title, publication source (PeerJ) and either DOI or URL of the article must be cited.
- Cite this article
- 2020. HER2 and BRAF mutation in colorectal cancer patients: a retrospective study in Eastern China. PeerJ 8:e8602 https://doi.org/10.7717/peerj.8602
Abstract
Objective
To investigate the frequency and prognostic role of the human epidermal growth factor receptor 2 gene (HER2) and BRAF V600E gene mutation in Chinese patients with colorectal cancer (CRC).
Methods
Clinicopathological and survival information from 480 patients with stage I–III CRC were reviewed and recorded. HER2 amplification was analyzed by immunohistochemistry (IHC) and fluorescence in situ hybridization (FISH), BRAF V600E mutation was tested by IHC and Sanger sequencing. The relationship between HER2 and BRAF V600E mutation status and clinicopathological characteristics and outcomes were determined.
Results
The amplification of HER2 and BRAF V600E mutation were identified in 27 of 480 (5.63%) and 19 of 480 (3.96%) CRC patients, respectively. HER2 amplification significantly correlated with greater bowel wall invasion (P = 0.041) and more advanced TNM stage (I vs. II vs. III; 0 vs 5.78% vs. 7.41%, P = 0.013). Patients suffering from tumors with poor differentiation had a higher incidence rate of BRAF V600E mutation than those with moderate/well differentiation (7.77% vs 2.92%, P = 0.04). HER2 amplification was an independent prognostic factor for worse disease-free survival (DFS) (HR = 2.53, 95% CI: 1.21–5.30, P = 0.014).
Conclusion
The prevalence of HER2 amplification and BRAF V600E mutation in stage I–III CRC patients in Chinese was 6% and 4%, respectively, and HER2 amplification appeared to be associated with a worse DFS. More comprehensive molecular classification and survival analysis are needed to validate our findings.
Introduction
Colorectal cancer (CRC) is one of the most common malignant tumors in China, with 376,300 new cases and 191,000 disease-related deaths in 2015 (Chen et al., 2016). The outcome of CRC patients has significantly improved over the past decades, but the identification of clinically actionable oncogenic drivers and related predicted biomarkers are largely elusive.
Previous studies have evaluated variety of genetic changes that appear to influence the prognosis of CRC patients, including microsatellite instability (MSI), RAS mutation, BRAF mutation, the human epidermal growth factor receptor 2 gene (HER2) (De Roock et al., 2010; Liu et al., 2017, 2018; Noda et al., 2018; Salvia, Lopez-Gomez & Garcia-Carbonero, 2018). HER2 gene, which is located on chromosome 17q21, is a tyrosine kinase receptor and encodes for a 185-kDa transmembrane protein (Salvia, Lopez-Gomez & Garcia-Carbonero, 2018). HER2 gene has been evidenced as a proto-oncogene and identified in many cancer types, including breast, gastric and CRC (Calhoun & Collins, 2015; Sartore-Bianchi et al., 2016; Wakatsuki et al., 2018). HER2 gene amplification plays a pivotal role in tumor growth and metastasis. In advanced stage CRC, patients with HER2 amplification tumors were resistant to cetuximab-based treatment (Salvia, Lopez-Gomez & Garcia-Carbonero, 2018). Therefore, the accurate assessment of HER2 gene amplification status in CRC appears to be particularly important for patients who might undertake this specific targeted therapy.
BRAF gene is another important molecular marker for malignancies. BRAF gene mutation can activate the RAF/MAPK pathway independently of epidermal growth factor receptor (EGFR) activation, leading to poor response to EGFR monoclonal antibody (Cetuximab) (De Roock et al., 2010). In additional, detection of BRAF mutation is useful to distinguish sporadic MSI CRCs from Lynch syndrome (Loughrey et al., 2007), and the presence of BRAF mutation is associated with worse prognosis in metastatic CRC (mCRC) patients (Boursault et al., 2013; Saridaki et al., 2013). But in early stage CRC patients, the prognostic role of BRAF mutations is controversial (Gallo et al., 2019; Smeby et al., 2018). A study conducted by European scholars showed BRAF mutation was an independent prognostic factor in stage II and III CRC (Fariña-Sarasqueta et al., 2010), and a meta-analysis based on randomized clinical trials showed BRAF mutation patients presented poor response to adjuvant chemotherapy (Zhu et al., 2016); however, Chinese scholars demonstrated BRAF mutation did not have prognostic value in stage II and III CRC patients (Shen et al., 2016).
Several studies had reported the frequency of BRAF mutation in CRC patients, but the number of samples was limited in most of studies. The mutation rate was 5–20% in western countries (Nazemalhosseini-Mojarad et al., 2019; Smeby et al., 2018). But in Chinese, only 5% CRC patients harbored BRAF mutation (Shen et al., 2011; Ye et al., 2015; Yunxia et al., 2010). Moreover, the predictive value about this gene in Chinese patients with early stage CRC was also unclear. In addition, information about HER2 amplification in Chinese CRC patients was limited (Li et al., 2011b). Some studies (Laurentpuig et al., 2016; Stahler et al., 2017) demonstrated patients with HER2 amplification tumor had a worse survival, but other studies (Pietrantonio et al., 2017; Richman et al., 2016) argued no meaningful relationships between this marker and survival. Therefore, in the present study, we analyzed the HER2 amplification and BRAF V600E mutation status of CRC patients to evaluate possible associations between HER2 and BRAF V600E mutation and the clinicopathological characteristics in primary stage I–III CRC, and we also attempted to explore the prognostic role of HER2 and BRAF V600E mutation.
Materials and Methods
Four hundred and eighty formalin-fixed, paraffin-embedded tumor specimens from stage I–III CRC patients who underwent primary surgical resection from 2014 to 2016 in the Affiliated Hospital of Qingdao University were selected for this study. Patients who had undergone preoperative radiotherapy, chemotherapy and/or EGFR-targeted therapy were not included in this study. The clinic and pathologic variables were collected as previous description (Zhang et al., 2018a). The patients were followed up until December 2018, and the data concerning cancer recurrence and patient survival were collected. The study was approved by the Ethics Committee of the Affiliated Hospital of Qingdao University (QDFY-20130049).
HER2 amplification analysis by immunohistochemistry and fluorescence in situ hybridization
Immunohistochemistry (IHC) staining was performed on an Automated Staining System (BenchMark XT, Ventana Medical Systems, Inc., Oro Valley, AZ, USA). In brief, after deparaffinization and rehydration, paraffin-embedded tissue sections were blocked with CC1 citrate buffer (pH 6.0; Ventana) for 30 min, and incubated with HER2 specific monoclonal rabbit antibody (clone 4B5, Ventana Medical Systems Inc., Oro Valley, AZ, USA, working solution) at 37 °C for 32 min. Then, the tissue sections were incubated with 3,3′-diaminobenzidine (DAB) for 4 min. Counterstaining was performed with hematoxylin and bluing reagent for 4 min. The results were analyzed by two pathologists according to the scoring criteria described by Bartley et al. (2017). The IHC staining was scored: 0 (no staining or membrane staining in less than 10% of tumor cells), 1+ (faint/barely visible membrane staining in at least 10% of cells or staining in parts of their membrane), 2+ (weak to moderate complete, basolateral, or lateral membrane staining in at least 10% of tumor cells), 3+ (strong complete or basolateral membrane staining in at least 10% of tumor cells) (Figure 1).
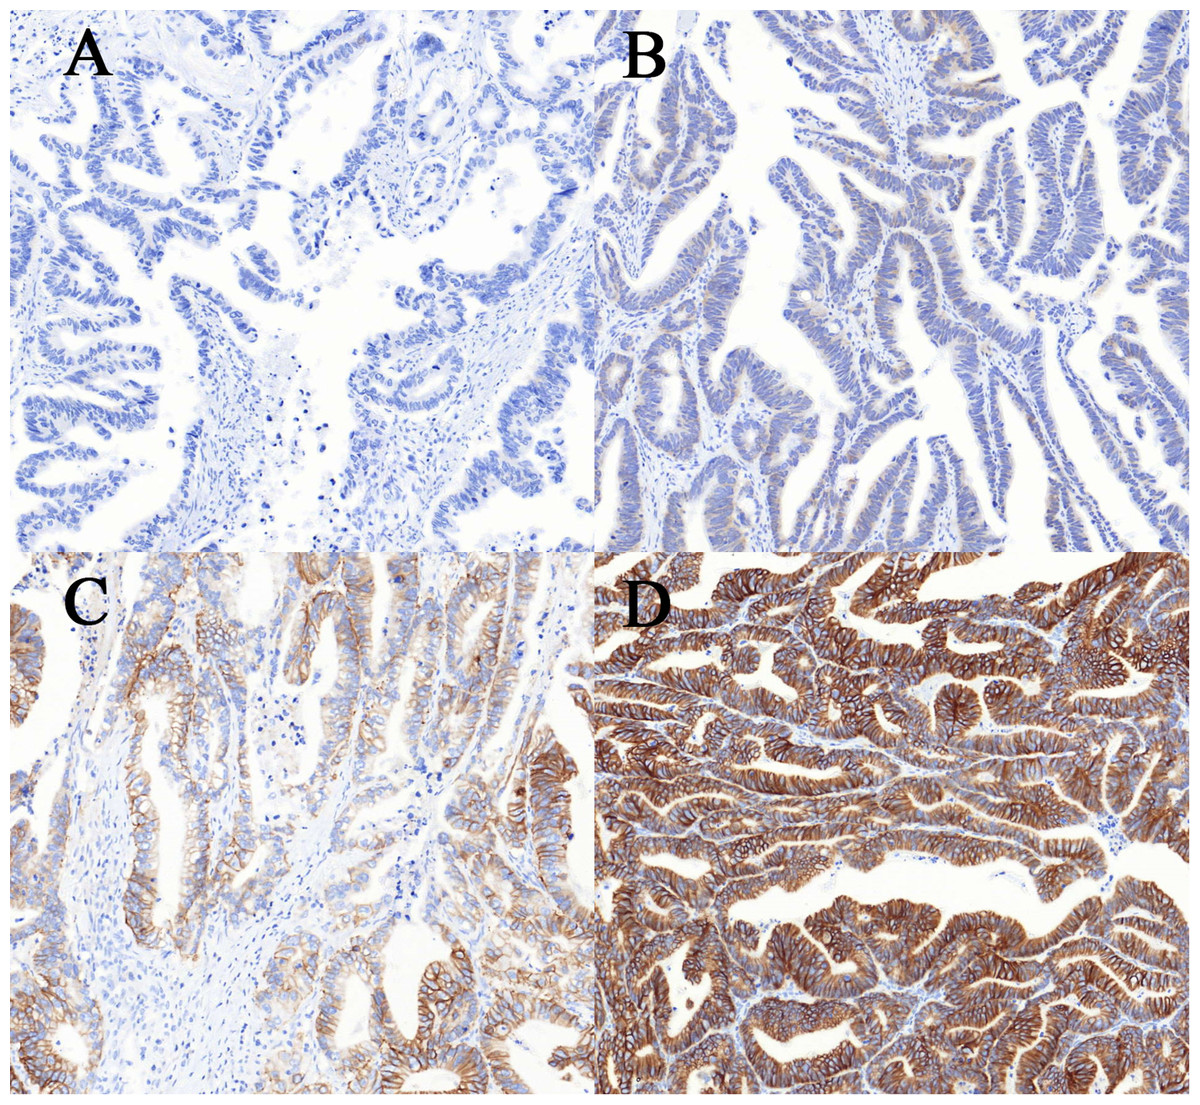
Figure 1: Immunohistochemical staining for human epidermal growth factor receptor 2 (HER2) in colorectal cancer.
(A–D) The intensity of staining was scored as negative (0, A), weak (1+, B), moderate (2+, C) and strong (3+, D). Allimages are at 100× magnification.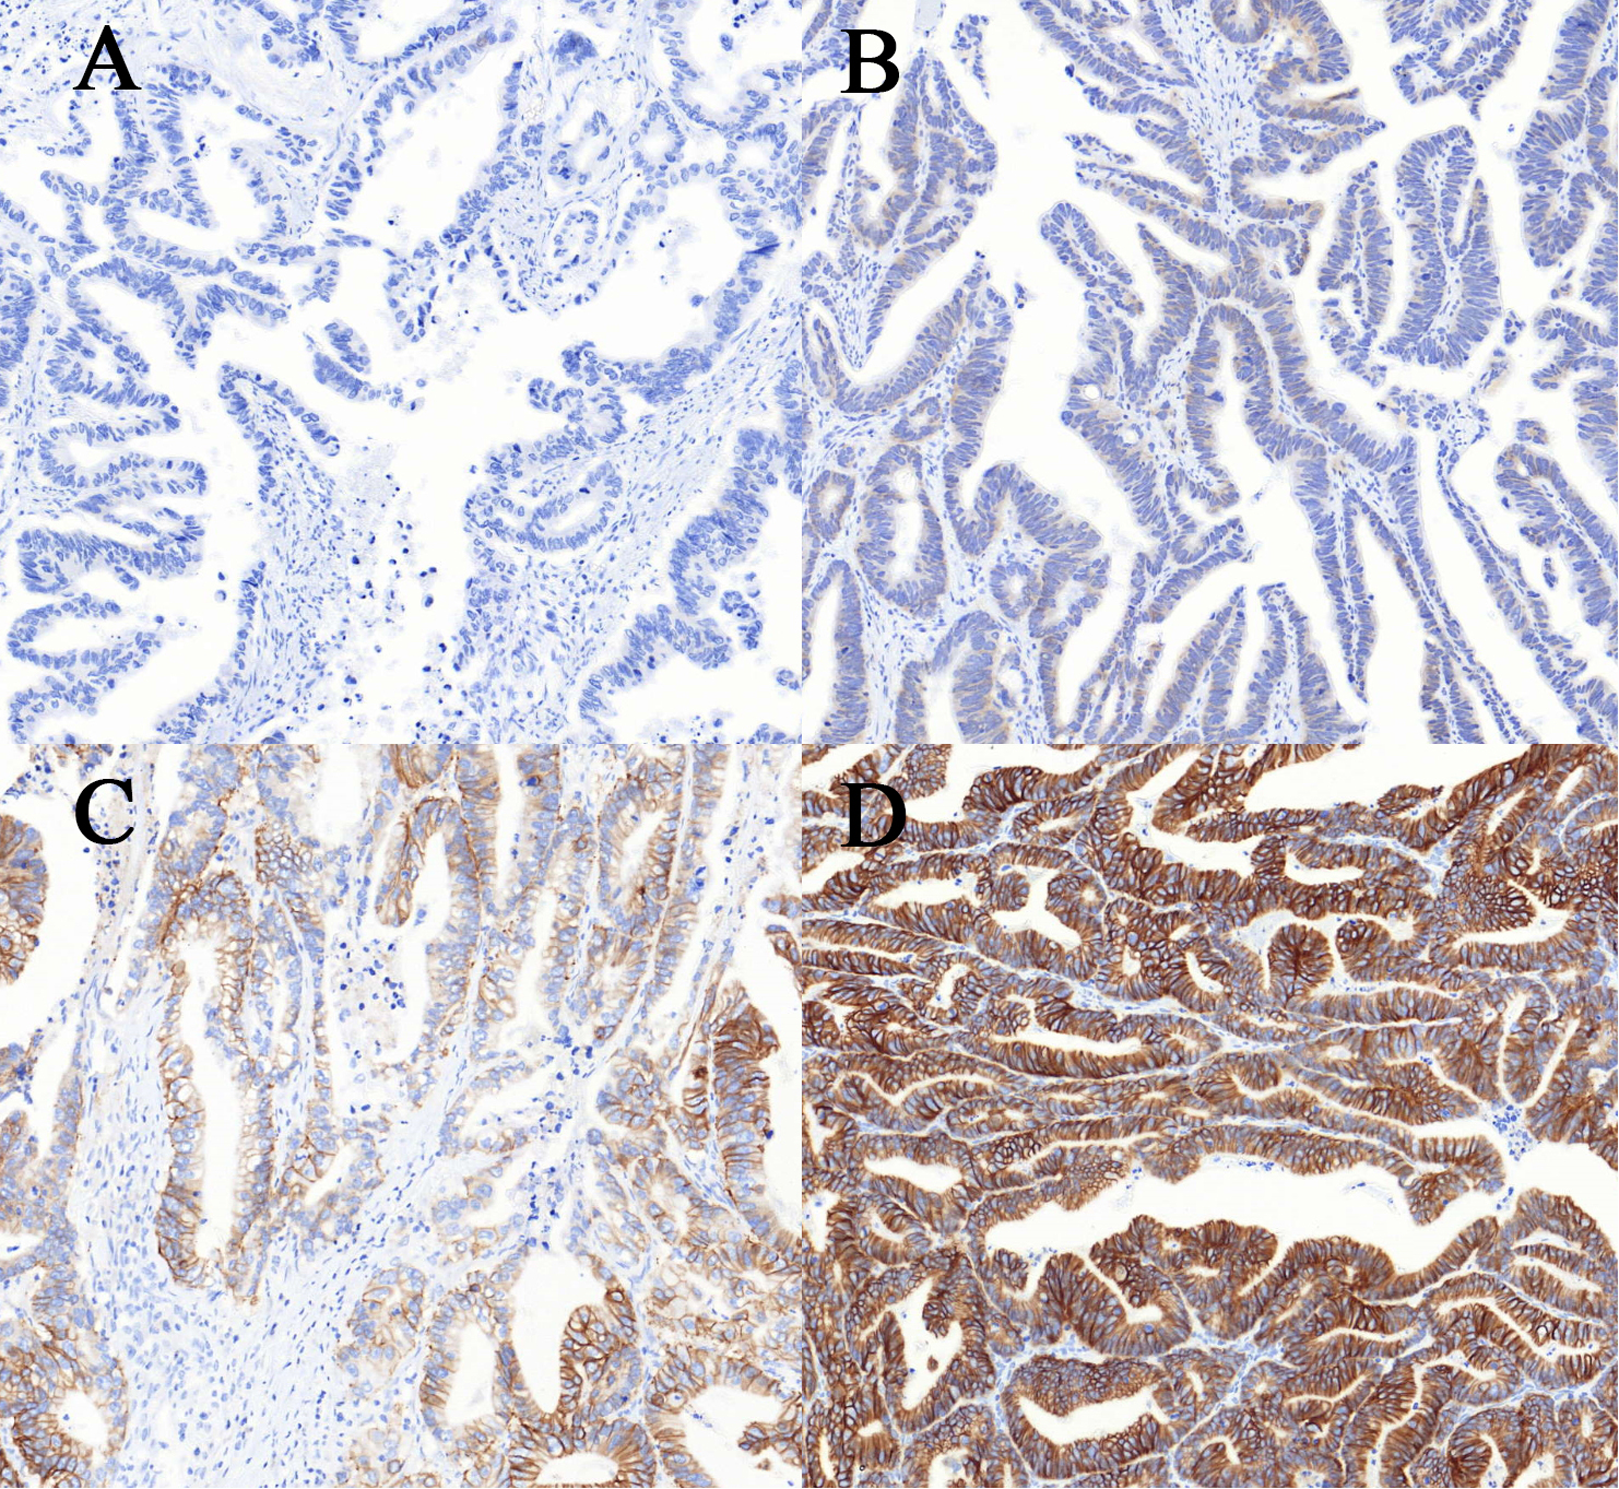
Samples with 2+ to 3+ IHC staining were retested by fluorescence in situ hybridization (FISH), using the PathVysion HER2 DNA probe kit and procedure (Vysis/Abbott, Abbott Park, IL, USA). After deparaffinizated and rehydration, paraffin-embedded tissue sections (5 μm thick) were pretreatment at 82 °C for 10 min, then blocked with proteinase at 37 °C for 30 min. After 70% alcohol, tissue sections were denaturation at 75 °C for 10 min and hybridization with HER2 DNA probe (10 µl) at 37 °C for 24 h, then counterstaining with 4′,6-diamidino-2-phenylindole (DAPI). The scoring for in situ hybridization was performed by counting HER2 (labeled with Spectrum-Orange) and CEP17 (chromosome 17 enumeration probe labeled with Spectrum-Green) signals from no less than 20 non-overlapping tumor nuclei. Non-tumor tissue (normal colon mucosa) was used as an internal negative control. Samples with a HER2/CEP17 ratio ≥2.0, or the presence of tight gene clusters as recently reported (Valtorta et al., 2015) were considered as amplified, otherwise samples were defined as negative for HER2. FISH staining was evaluated by two different pathologists to ensure consistency (Figure 2).
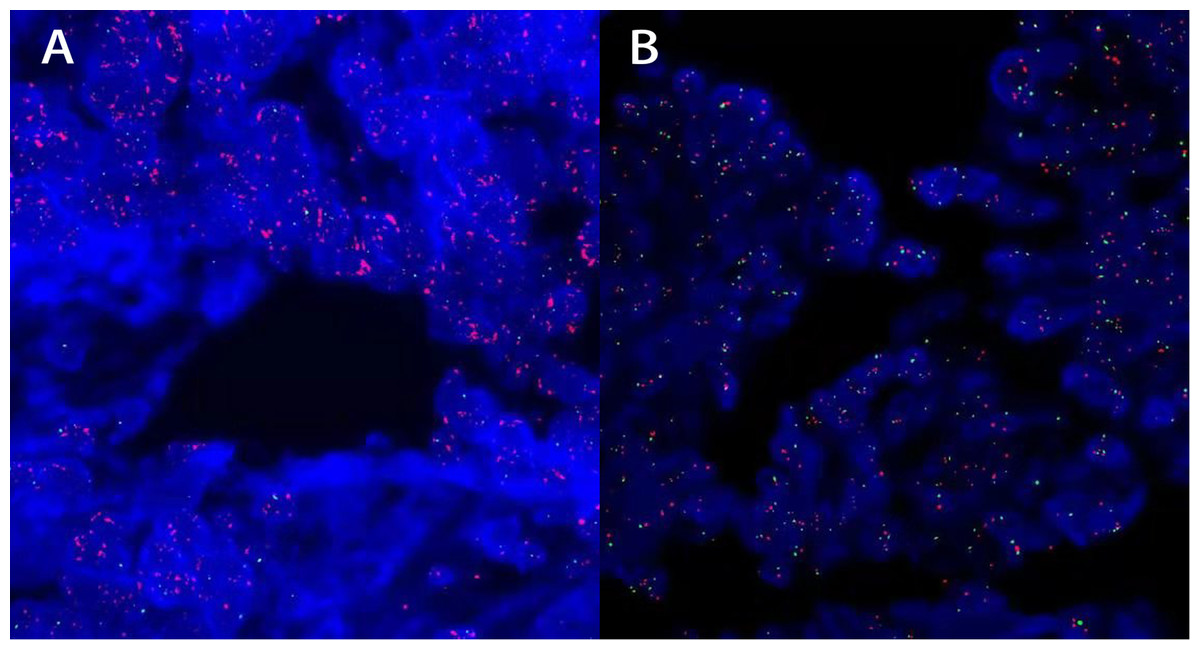
Figure 2: FISH staining for human epidermal growth factor receptor 2 (HER2) in colorectal cancer.
(A and B) The intensity of staining was scored as positive: HER2/CEP17 ratio was 2.3 in 20 tumor nuclei (A) and negative: HER2/CEP17 ratio was 1.58 in 20 tumor nuclei (B). All images are at 1,000× magnification.
Analysis of BRAF V600E mutation by immunohistochemistry and Sanger sequencing
Immunohistochemistry staining and Sanger sequencing for BRAF mutation were performed as previously described by Zhang et al. (2018b). In brief, after deparaffinization and rehydration, paraffin-embedded tissue sections (3 μm thick) were blocked with 3% hydrogen peroxide for 4 min at room temperature, treated with heat-induced antigen retrieval CC1 solution for 32 min, and incubated with BRAF V600E specific monoclonal mouse antibody (clone VE1, item code 790–4855, Ventana Medical Systems Inc., Oro Valley, AZ, USA, working solution) at 37 °C for 32 min. Then, the tissue sections were incubated with OptiView HRP Linker for 12 min, OptiView HRP multimer for 12 min, and developed with DAB for 4 min. Counterstaining was performed with hematoxylin and bluing reagent for 4 min. The results were analyzed by two pathologists according to the scoring criteria described by Zhang et al. (2018b). BRAF V600E expression within the cytoplasm was subjectively graded as: 0, no cytoplasmic staining visualized at any magnification; 1+, weak, requiring a 10× or greater objective to recognize flavescent staining on the section; 2+, moderate, easy to recognize yellow staining with a 10× objective; and 3+, strong brown staining with a 10× microscopic objective (Figure 3).

Figure 3: Immunohistochemical staining for BRAF V600E in colorectal cancer.
(A–D) The intensity of staining was scored as negative (0, A), weak (1+, B), moderate (2+, C) and strong (3+, D). All images are at 100× magnification.
All CRC cases with cytoplasmic staining were retested by Sanger sequencing analysis to exclude false positive. DNA was extracted using the Blood and Tissue DNA retraction Kit (Tiangen Inc., Beijing, China). Primers were designed to amplify the V600E point mutation. The sequence of the forward primer was 5′-TCATCCTAACACATTTCAAGCC-3′ and the reverse primer was 5′-GTAAAACGACGGCCAGTTTTGTGAATACTGGGAACTATGAAA-3′. PCR amplification conditions: 95 °C for 3 min, followed by 45 cycles of 94 °C for 15 s, 60 °C for 45 s, with a final cooling time for 1 min at 25 °C. The PCR products were purified with QIAquick Gel Extraction Kit (Qiagen). The cycling conditions were as follows: 96 °C for 1 min, followed by 30 cycles of 96 °C for 10 s, 50 °C for 5 s, with a final extension at 60 °C for 2 min. Purified products were then run on an ABI 3500 DX Genetic Analyzer (Applied Biosystems, Foster City, CA, USA) and analyzed using software supplied by the manufacturer (Zhang et al., 2018b). Both forward and reverse strands were sequenced. The sequences were compared with the database sequence in GenBank sequence database (HGNC: 1097) (Figure 4).
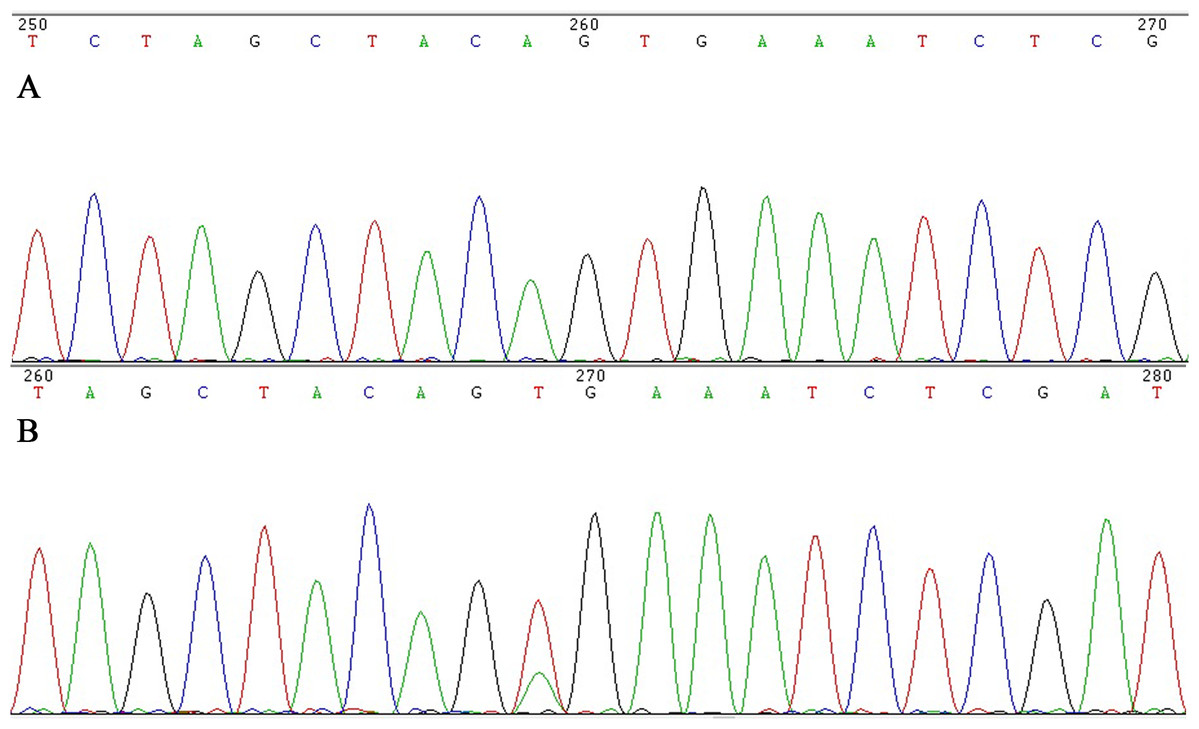
Figure 4: Sanger sequencing for BRAF V600E in colorectal cancer.
(A), BRAF V600E wildtype by Sanger sequencing, (B) BRAF V600E mutation by Sanger sequencing.
Statistical analysis
Results were analyzed with SPSS 19.0 (SPSS, Inc., Chicago, IL, USA). For comparison of the frequencies among groups, Chi-square test and Fisher exact test were used. Survival curves for disease-free survival (DFS) and overall survival (OS) were estimated using Kaplan-Meier analysis with the log-rank test. Multivariable analysis was performed using Cox regression. Probability (P) value <0.05 was considered as statistical significance.
Results
HER2 status and associations with clinicopathological characteristics
HER2 IHC scores of 3+, 2+, 1+ and 0 were observed in 10 (2.1%), 54 (11.3%), 86 (17.9%) and 330 (68.7%) tumors, respectively. HER2 gene amplification was seen in 27 samples (9 cases with HER2 IHC scores of 3+, 18 cases with HER2 IHC scores of 2+) (Supplemental Files). The amplification rate of HER2 in CRC was 5.63% (27/480). HER2 status and clinicopathological characteristics, including age, gender, tumor location, tumor size, histological characteristics, TNM stage and family medication history are shown in Table 1. HER2 amplification was significantly correlated with greater bowel wall invasion (P = 0.041) and more advanced TNM stage (I vs II vs III; 0 vs 5.78% vs 7.41%, P = 0.013). Although HER2 amplification tumors were present more often in patients with CRC family history, there is no significant statistical difference in this study (10.34% vs 6.59%, P > 0.05).
| Characteristics | Number | BRAF | P | HER2 | P | ||
|---|---|---|---|---|---|---|---|
| Mutation | % | Amplification | % | ||||
| Gender | |||||||
| Male | 288 | 10 | 3.47 | 0.51 | 18 | 6.25 | 0.55 |
| Female | 192 | 9 | 4.69 | 9 | 4.69 | ||
| Age (year) | |||||||
| ≤50 | 63 | 3 | 4.76 | 0.72* | 5 | 7.94 | 0.38* |
| >50 | 417 | 16 | 3.84 | 22 | 5.28 | ||
| Location | |||||||
| Right side colon | 105 | 3 | 2.86 | 0.19* | 5 | 4.76 | 0.99 |
| Left side colon | 87 | 7 | 8.05 | 6 | 6.90 | ||
| Rectum | 269 | 9 | 3.35 | 16 | 5.95 | ||
| Mucin production | |||||||
| With | 415 | 15 | 3.61 | 0.31* | 23 | 5.54 | 0.77* |
| Without | 65 | 4 | 6.15 | 4 | 6.15 | ||
| Tumor differentiation | |||||||
| Poor | 103 | 8 | 7.77 | 0.04* | 5 | 4.85 | 0.71 |
| Moderate/well | 377 | 11 | 2.92 | 22 | 5.84 | ||
| Tumor stage | |||||||
| I | 66 | 2 | 3.03 | 0.62 | 0 | 0.00 | 0.013* |
| II | 225 | 11 | 4.89 | 13 | 5.78 | ||
| III | 189 | 6 | 3.17 | 14 | 7.41 | ||
| Bowel wall invasion (T) | |||||||
| T1+T2 | 90 | 2 | 2.22 | 0.55* | 1 | 1.11 | 0.041* |
| T3+T4 | 390 | 17 | 4.36 | 26 | 667 | ||
| Tumor diameter | |||||||
| <5 cm | 261 | 7 | 2.68 | 0.18 | 14 | 5.36 | 0.97 |
| ≥5 cm | 219 | 12 | 5.48 | 13 | 5.94 | ||
| Lymph node metastasis (N) | |||||||
| With | 189 | 6 | 4.47 | 0.48 | 13 | 6.88 | 0.17 |
| Without | 291 | 13 | 3.17 | 14 | 4.81 | ||
| Lymphovascular invasion | |||||||
| No | 332 | 14 | 4.22 | 0.66 | 17 | 5.12 | 0.47 |
| Yes | 148 | 5 | 3.38 | 10 | 6.76 | ||
| Alcohol intake | |||||||
| Ever | 99 | 2 | 2.02 | 0.39* | 4 | 4.04 | 0.44 |
| Never | 381 | 17 | 4.46 | 23 | 6.03 | ||
| Smoking | |||||||
| Ever | 129 | 3 | 2.33 | 0.27 | 8 | 6.20 | 0.74 |
| Never | 351 | 16 | 4.56 | 19 | 4.69 | ||
| Cancer family history | |||||||
| Yes | 92 | 3 | 3.26 | 0.99 | 7 | 7.61 | 0.61 |
| No | 119 | 4 | 3.36 | 8 | 6.72 | ||
| Unknown | 269 | ||||||
| Colorectal family history | |||||||
| Yes | 29 | 0 | 0.00 | 0.59* | 3 | 10.34 | 0.49* |
| No | 182 | 7 | 3.85 | 12 | 6.59 | ||
| Unknown | 269 | ||||||
| MSI status | |||||||
| MSI | 72 | 4 | 5.56 | 0.51* | 4 | 5.56 | 0.98* |
| MSS | 408 | 15 | 3.68 | 23 | 5.63 | ||
| RAS status | |||||||
| Mutation | 207 | 0 | 0 | 0.001 | 2 | 3.48 | 0.001 |
| Wildtype | 273 | 19 | 6.95 | 25 | 9.12 | ||
Note:
BRAF V600E status and associations with clinicopathological characteristics
Immunohistochemistry testing showed 26 cases with positive staining and 454 cases with negative staining. The distribution of positive IHC staining was 3+ in 12 cases, 2+ in 8 cases, and 1+ in 6 cases in CRCs (Supplemental Files). Sanger sequencing showed 19 samples (12 cases with 3+ and 7 cases with 2+) harbored BRAF V600E mutation, so the mutation rates of BRAF V600E were 3.96% (19/480). Patients suffering from tumors with poor differentiation had a higher incidence rate of BRAF V600E mutation compared with those having tumors with moderate/well differentiation (7.77% vs 2.92%, P = 0.04). No significant difference between BRAF V600E mutation and other clinicopathological characteristics was found in present study (Table 1).
Prognostic value of HER2 amplification and BRAF V600E mutation in stage I–III CRC
Univariable analysis by Kaplan-Meier survival analysis and log-rank test was performed to evaluate the significance of clinicopathological factors for DFS and OS. We found that factors with statistical significance for DFS were age (P = 0.04), tumor differentiation (P = 0.002), bowel wall invasion (P = 0.04), lymph node metastasis (P = 0.03), lymphovascular invasion (P = 0.001) and HER2 amplification (P = 0.007). Factors that were statistically significant for OS were age (P = 0.04), tumor differentiation (P = 0.03), tumor stage (P = 0.001), bowel wall invasion (P = 0.01), lymph node metastasis (P = 0.001) and lymphovascular invasion (P = 0.001) (Table 2).
| Characteristics | DFS | P | OS | P |
|---|---|---|---|---|
| HR (95% CI) | HR (95% CI) | |||
| Gender | ||||
| Male vs female | 1.13 [0.71–1.83] | 0.6 | 1.18 [0.7–2.0] | 0.54 |
| Age (year) | ||||
| ≤50 vs >50 | 0.49 [0.25–0.97] | 0.04 | 0.47 [0.22–0.97] | 0.04 |
| Location | ||||
| Right side colon vs left side colon vs rectum | 0.73 | 0.85 | ||
| Mucin production | ||||
| With vs without | 1.75 [0.89–3.47] | 0.11 | 1.8 [0.85–3.80] | 0.12 |
| Tumor differentiation | ||||
| Poor vs moderate/well | 2.56 [1.40–4.68] | 0.002 | 2.08 [1.09–3.99] | 0.03 |
| Tumor stage | ||||
| I vs II vs III | 0.06 | 0.001 | ||
| Bowel wall invasion (T) | ||||
| T1+T2 vs T3+T4 | 0.54 [0.30–0.97] | 0.04 | 0.44 [0.23–0.85] | 0.01 |
| Tumor diameter | ||||
| ≤5 cm vs >5 cm | 1.17 [0.73–1.88] | 0.5 | 1.11 [0.66–1.86] | 0.7 |
| Lymph node metastasis (N) | ||||
| Without vs with | 0.59 [0.36–0.95] | 0.03 | 0.39 [0.23–0.66] | 0.001 |
| Lymphovascular invasion | ||||
| No vs yes | 0.41 [0.24–0.69] | 0.001 | 0.42 [0.23–0.75] | 0.001 |
| Alcohol intake | ||||
| Ever vs never | 1.1 [0.62–1.94] | 0.75 | 0.97 [0.52–1.81] | 0.91 |
| Smoking | ||||
| Ever vs never | 1.3 [0.77–2.19] | 0.32 | 0.99 [0.55–1.77] | 0.97 |
| Cancer family history | ||||
| Yes vs no | 1.86 [0.92–3.76] | 0.09 | 1.91 [0.86–4.28] | 0.11 |
| Colorectal family history | ||||
| Yes vs no | 1.12 [0.41–3.06] | 0.83 | 0.75 [0.23–2.44] | 0.64 |
| MSI status | ||||
| MSI vs MSS | 1.14 [0.58–2.25] | 0.69 | 0.98 [0.46–2.06] | 0.95 |
| RAS status | ||||
| RAS mutation vs RAS wildtype | 1.35 [0.84–2.19] | 0.21 | 1.45 [0.86–2.25] | 0.16 |
| BRAF status | ||||
| BRAF mutation vs BRAF wildtype | 3.41 [0.91–12.74] | 0.07 | 1.08 [0.25–4.68] | 0.92 |
| HER2 status | ||||
| HER2 amplification vs HER2 negative | 3.97 [1.35–11.72] | 0.007 | 2.98 [0.92–9.67] | 0.08 |
Patients with HER2 amplification tumors were found to have significantly worse DFS (P = 0.007) (Figure 5A). To determine the prognostic value independent of age distribution, tumor differentiation, bowel wall invasion, lymph node metastasis, lymphovascular invasion and HER2 amplification were entered into a Cox regression model. Multivariate Cox regression analysis showed HER2 amplification was an independent risk factor for worse DFS, tumors with HER2 amplification were associated with a 2.53-fold increase in risk of cancer recurrence (HR = 2.53, 95% CI [1.21–5.30], P = 0.014) (Table 3).
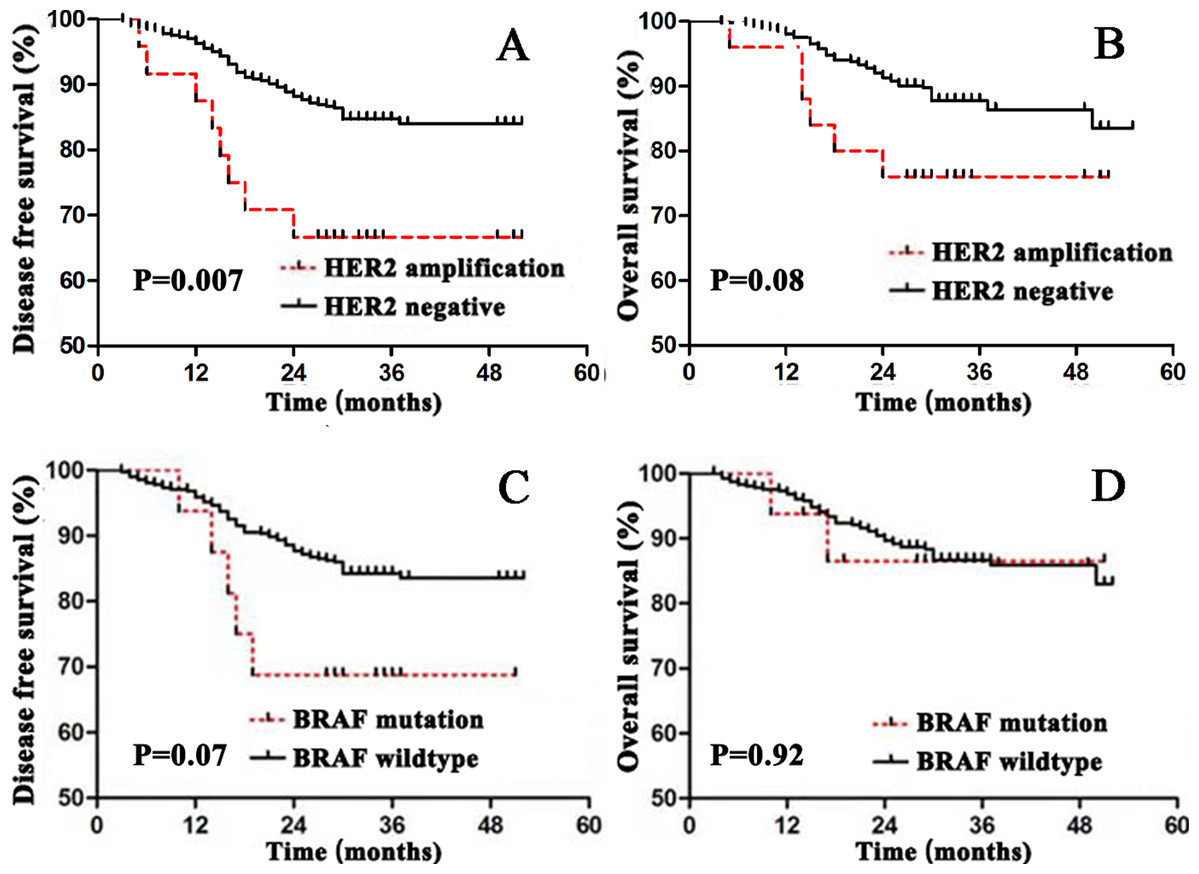
Figure 5: Survival curves for disease free survival (DFS) and overall survival (OS) in stage I–III colorectal cancer according to HER2 or BRAF status.
(A) DFS according to HER2 status; (B) OS according to HER2 status; (C) DFS according to BRAF status; (D) OS according to BRAF status.
| Characteristics | HR (95% CI) | P |
|---|---|---|
| HER2 amplification | 2.53 [1.21–5.30] | 0.014 |
| Tumor poor differentiation | 1.91 [1.16–3.14] | 0.011 |
| Lymphovascular invasion | 2.15 [1.34–3.44] | 0.001 |
Discussion
HER2 and BRAF mutation are important for clinical treatment and prognosis evaluation in cancer patients. As we know, HER2 has been found to be a predictive marker to HER2-targeted therapy in breast and gastric cancer; therefore, routine test for HER2 status is mandatory in these tumors (Calhoun & Collins, 2015; Jiang et al., 2018). The frequency of BRAF mutation in CRCs ranges from 5% to 15%, and BRAF mutation has been demonstrated to be a worse prognostic factor in mCRC (Boursault et al., 2013) and should be tested for mCRC patients before MoAb treatment (De Roock et al., 2010). No evidence has convinced that HER2 gene amplification is a prognostic factor for CRC. Laurentpuig et al. (2016) and Stahler et al. (2017) demonstrated patients with HER2 amplification tumor had a worse survival, but some recent studies (Pietrantonio et al., 2017; Richman et al., 2016) argued no meaningful relationships between this marker and survival. Several studies had reported the frequency of BRAF mutation in Chinese CRC patients, but the number of samples was limited in most of the studies (Li et al., 2011a; Mao et al., 2012). Thus, we designed this study in Chinese population to explore the relationship between HER2 amplification and BRAF mutation and clinicopathological parameters, and to evaluate prognostic and predictive values of HER2 amplification and BRAF mutation for CRC.
In our study, the HER2 gene amplification rate is 5.63%, similar to some other studies (Hyman et al., 2018; Jeong et al., 2016; Laurentpuig et al., 2016; Richman et al., 2016). However, report from Korea (Dong et al., 2007) showed the protein expression rate was 47%. There are several possible reasons for this discrepancy such as ethnic diversity and test methods, but the most likely reason for the divergent findings might be the different scoring systems. Dong et al. (2007) judged only cytoplasmic staining in >20% of tumor cells to be positive, so there was relatively higher positive rate in CRC. Nowadays, there are two different scoring systems for HER2 IHC in CRC, gastroesophageal adenocarcinoma criteria (GEA criteria) and HER2 Amplification for Colorectal Cancer Enhanced Stratification diagnostic criteria (HERACLES criteria) (Valtorta et al., 2015). The different criteria of membrane positivity may also cause for the conflicting results, Liu et al. (2019) argued HER2 status evaluated by the HERACLES criteria showed survival predictive for stage II–III CRC, but the results were not represented based on the GEA diagnostic criteria. In present study, the GEA criteria was used, and 33.3% (18/54) samples with IHC staining 2+ were confirmed to harbor HER2 gene amplification, but Wang et al. (2019) judged only 20% of tumors with HER2 IHC 2+ staining showing gene amplification based on this criteria. IHC is a semiquantitative method and may be influenced by subjective perception of pathologists frequently, so exactly HER2 positive standardized by IHC in CRC is urgently needed.
In our current study, we found HER2 gene amplification was related to bowel wall invasion and advanced tumor stage, but several other studies have failed to show such relationship. Li et al. (2011b) reported an association between HER2 expression and tumor size and distant metastases, and a recent meta-analysis showed HER2 amplification was associated with lymph node metastasis and advanced tumors stage (Sun et al., 2016). The number of studies suggests that HER2 may play some role in tumor progression and would be a valuable prognostic factor for CRC patients (Laurentpuig et al., 2016; Stahler et al., 2017). But in other studies, HER2 gene amplification was higher in patients with more advanced stage or distant metastases, and no significant difference in prognosis for CRC patients (Pietrantonio et al., 2017; Wang et al., 2019).
The prognostic value of HER2 amplification in CRC patients has been widely investigated, but no rationale had been obtained. A study from Germany indicated that HER2 amplification resulted in poorer prognosis in all stage CRC (Ingold Heppner et al., 2014), and Laurentpuig et al. (2016) found that HER2 amplification was significantly associated with worse prognosis in patients with stage III CRC. Moreover, some studies showed patients with HER2 wild-type tumors have positive OS compared with those tumors containing amplified HER2 due to benefit from anti-EGFR monoclonal antibody, and the targeted management may be an influential factor in patients with advanced CRC (Pietrantonio et al., 2017; Salvia, Lopez-Gomez & Garcia-Carbonero, 2018). In this study, we demonstrated that HER2 amplification was independently associated with worse survival in DFS, considering that none of our patients received anti-EGFR treatment before recurrence, the influence in survival due to targeted management could be excluded. Therefore, we confirmed HER2 amplification tumors had a higher propensity to recurrence and metastasize, and HER2 amplification was an independent prognostic factor for DFS in stage I–III CRC.
In the present study, the mutation rates of BRAF was 3.96%, the BRAF mutation rate is similar to that previously reported in Iranian (5.8%, 15/258) (Nazemalhosseini-Mojarad et al., 2019), but significantly lower than the value of 16% among 1185 CRC patients from Norway (Smeby et al., 2018). On the other hand, the association between BRAF mutations and clinicopathological characteristics has not been well known in Chinese CRC patients due to the insufficient number of CRCs with BRAF mutation. Nonetheless, reports from other countries have demonstrated that tumors with BRAF mutation are associated with tumor location, tumor grade, and mucinous production (Nazemalhosseini-Mojarad et al., 2019; Zlobec et al., 2010), our data confirmed BRAF mutations was only association with tumor differentiation. Several factors may be related to these differences, such as sample size, the distribution of age, stage, as well as racial and/or environmental differences.
Most previous studies demonstrated BRAF mutation was related to poorer outcomes (Kadowaki et al., 2015; Smeby et al., 2018; Toon et al., 2014). However, this evidence is mainly based on studies in western country, little is known about the prognostic role of BRAF mutations in eastern Chinese populations. Contrary to some previous studies, no associations of BRAF mutation with DFS and OS were found in eastern Chinese CRC patients in our study. In additional, in patients with mCRC, BRAF mutation acted as worse prognostic markers, and patients with BRAF mutations were less likely to achieve response to treatment with panitumumab or cetuximab (Di Nicolantonio et al., 2008; Saridaki et al., 2013; Benvenuti et al., 2007). We did not evaluate the effect of panitumumab or cetuximab treatment after tumors achieved distant metastases, so the predictive value of BRAF mutation for monoclonal antibody treatment in stage IV CRC patients was unexplored. This is the preliminary study to explore the prognostic value of BRAF mutation in this area and further studies based on larger sample size and longer follow-up time are needed to confirm this finding.
Conclusion
In summary, we investigated HER2 and BRAF gene status in a series of stage I–III CRC patients in eastern China. Our data show the prevalence of HER2 and BRAF mutation was 5.63% and 3.96%, respectively. HER2 amplification appears to be associated with a worse DFS. More comprehensive molecular classification and survival analysis are needed to validate our findings.