
Association of genetic polymorphisms in SOD2, SOD3, GPX3, and GSTT1 with hypertriglyceridemia and low HDL-C level in subjects with high risk of coronary artery disease
- Published
- Accepted
- Received
- Academic Editor
- Antonio Palazón-Bru
- Subject Areas
- Bioinformatics, Cardiology, Diabetes and Endocrinology, Medical Genetics, Metabolic Sciences
- Keywords
- Antioxidant, Glutathione peroxidase, Superoxide dismutase, GlutathioneS-transferase, Atherosclerosis, Oxidative stress, Genetic risk score
- Copyright
- © 2019 Decharatchakul et al.
- Licence
- This is an open access article distributed under the terms of the Creative Commons Attribution License, which permits unrestricted use, distribution, reproduction and adaptation in any medium and for any purpose provided that it is properly attributed. For attribution, the original author(s), title, publication source (PeerJ) and either DOI or URL of the article must be cited.
- Cite this article
- 2019. Association of genetic polymorphisms in SOD2, SOD3, GPX3, and GSTT1 with hypertriglyceridemia and low HDL-C level in subjects with high risk of coronary artery disease. PeerJ 7:e7407 https://doi.org/10.7717/peerj.7407
Abstract
Background
Oxidative stress modulates insulin resistant-related atherogenic dyslipidemia: hypertriglyceridemia (HTG) and low high-density lipoprotein cholesterol (HDL-C) level. Gene polymorphisms in superoxide dismutase (SOD2 and SOD3), glutathione peroxidase-3 (GPX3), and glutathione S-transferase theta-1 (GSTT1) may enable oxidative stress-related lipid abnormalities and severity of coronary atherosclerosis. The present study investigated the associations of antioxidant-related gene polymorphisms with atherogenic dyslipidemia and atherosclerotic severity in subjects with high risk of coronary artery disease (CAD).
Methods
Study population comprises of 396 subjects with high risk of CAD. Gene polymorphisms: SOD2 rs4880, SOD3 rs2536512 and rs2855262, GPX rs3828599, and GSTT1 (deletion) were evaluated the associations with HTG, low HDL-C, high TG/HDL-C ratio, and severity of coronary atherosclerosis.
Results
SOD2 rs4880-CC, SOD3 rs2536512-AA, rs2855262-CC, and GPX3 rs3828599-AA, but not GSTT1-/- individually increased risk of HTG combined with low HDL-C level. With a combination of five risk-genotypes as a genetic risk score (GRS), GRS ≥ 6 increased risks of low HDL-C, high TG/HDL-C ratio, and HTG combined with low HDL-C, comparing with GRS 0–2 [respective adjusted ORs (95% CI) = 2.70 (1.24–5.85), 3.11 (1.55–6.23), and 5.73 (2.22–14.77)]. Gene polymorphisms, though, were not directly associated with severity of coronary atherosclerosis; high TG/HDL-C ratio was associated with coronary atherosclerotic severity [OR = 2.26 (95% CI [1.17–4.34])].
Conclusion
Combined polymorphisms in antioxidant-related genes increased the risk of dyslipidemia related to atherosclerotic severity, suggesting the combined antioxidant-related gene polymorphisms as predictor of atherogenic dyslipidemia.
Introduction
Atherosclerosis is the major cause of coronary artery disease (CAD). Atherogenesis is a complex interplay of abnormal plasma lipid level (dyslipidemia), oxidative stress, and dysfunctional endothelial cells. In addition, genetic variations have also been implicated as a potent risk-predictor for CAD. Primary low level of high-density lipoprotein cholesterol (HDL-C), isolated hypertriglyceridemia (HTG), high triglycerides (TG) to HDL-C ratio (TG/HDL-C), as well as a combination of high TG with low HDL-C levels have also emerged as risk factors for cardiovascular events, including CAD (Ahmed et al., 2016; Da Luz et al., 2008; Klempfner et al., 2016; Lee et al., 2017).
Oxidative stress is the stage of redox imbalance; where the oxidant activity, mostly from reactive oxygen species (ROS), overwhelms the defense capacity of the endogenous antioxidant system. Oxidative stress plays a role in endothelial dysfunction and atherosclerotic process (Kattoor et al., 2017). A number of in vitro and population studies have provided strong evidence that oxidative stress is the key mechanism in insulin resistance (IR) (Ding et al., 2016; Maslov et al., 2019; Meigs et al., 2007; Park et al., 2009). IR enables adipocyte lipolysis that increases hepatic in-flux of free fatty acids (FFA), by which it induces hepatic TG synthesis. This leads to increased hepatic secretion of TG-rich very low-density lipoprotein (VLDL) and results in elevated blood TG level (Welty, 2013). Moreover, and in vitro study has reported that high ROS levels down-regulated APOAI gene expression and ApoA-I secretion. Because ApoA-I is the major protein component in HDL biosynthesis, therefore oxidative stress-related suppression of ApoA-I also has an effect on lowering HDL-C level (Shavva et al., 2017).
The major antioxidant enzymes that maintain redox homeostasis include superoxide dismutase (SOD), glutathione peroxidase (GPX), and glutathione S-transferase (GST). SOD2 and SOD3, which localize respectively within mitochondrial matrix and to the cell surface, catalyze the dismutation of superoxide (O2•−) into hydrogen peroxide (H2O2) (Karlsson, Lindahl & Marklund, 1988; Karnati et al., 2013) whereas GPX3, an antioxidant component in HDL fraction, involved in detoxification of extracellular H2O2 and lipid hydroperoxides (Chen et al., 2000). Both O2• − and H2O2 are potent ROS found in mitochondria, cytosol, and extracellular compartment. There are reports showing that accumulation of these ROS in mitochondria and influx of extracellular ROS contribute to cellular IR (Fazakerley et al., 2018; Iwakami et al., 2011) which may be suppressed by SOD and GPX through their neutralizing of these ROS. Furthermore, over-expression of Sod2 in the rat (Boden et al., 2012) and Sod3 in the mouse (Cui et al., 2014) have prevented high fat diet-induced IR. In addition, induced-expression of GPX3 in human skeletal muscle cells has also inhibited oxidative stress-induced IR (Chung et al., 2009), a condition associated with HTG and low HDL-C level. Glutathione S-transferase theta 1 (GSTT1), a member of cytosolic GSTs, plays a key role in termination of phospholipid oxidation by detoxifying phospholipid hydroperoxide (Hurst et al., 1998). In vitro studies have revealed that 4-hydroperoxy-nonenal (4-HNE), an end product of phospholipid oxidation (Reis & Spickett, 2012), can induce IR in adipocytes, and activation of GST protein expression can prevent 4-HNE-induced IR and lipolysis in adipocytes (Liu et al., 2018).
As genetic variations are the underlying risk factors for almost all complex diseases; we speculated that polymorphisms in these antioxidant genes may modify their gene function that affects their antioxidant activities associated with dyslipidemia and risk for CAD. The SOD2 c.47C>T polymorphism (Ala16Val, rs4880) has been associated with the risks of CAD (Souiden et al., 2016) and type 2 diabetes mellitus (T2DM) (Vats et al., 2015). The SOD3 c.172G>A polymorphism (Ala58Thr, rs2536512) has also been associated with a risk of T2DM (Yang, Xie & Jin, 2016) but not hypertension (HT) (Dong et al., 2014). Another SOD3 polymorphism, g.9892T>C (rs2855262), is localized in 3’untranslated region (3’UTR) (Crocco et al., 2016) and, as a linkage single nucleotide polymorphism (SNP) in SOD3 haplotype, has been associated with decreased severity of acute-infected lung injury (Arcaroli et al., 2009). The GPX3 c.87+1494A>G polymorphism (rs3828599), localized in the first intron of this gene, has been associated with essential HT (Hao et al., 2011). Several reports have provided the evident association between GSTT1 deletion polymorphism (GSTT1 + or −) and risk of CAD; however, with variable results (Song et al., 2017). GSTT1 deletion carriers have higher blood levels of TG, VLDL-C, and TG/HDL-C ratio (Maciel et al., 2009; Pinheiro et al., 2013) and lower level of HDL-C (Maciel et al., 2009).
Because five polymorphisms from four genes—SOD2 rs4880, SOD3 rs2536512 and rs2855262, GPX3 rs3828599, and GSTT1 (deletion)—have previously been reported their association with oxidative stress-related CAD risk factors such as HT and T2DM (Hao et al., 2011; Petrovic & Peterlin, 2014; Vats et al., 2015; Yang, Xie & Jin, 2016), they may implicate in lipid abnormalities and severity of coronary atherosclerosis in individuals with CAD. These gene polymorphisms were therefore selected for the present study. However, most of the previous reports have provided evidence form single gene polymorphisms and demonstrated inconsistent results. For complex diseases, genetic associations provided by single polymorphisms are usually of small magnitude (odds ratios 1.1–1.5) and usually elucidate only 1–8% of the overall disease risk in the population; the combined or additive effect of multiple genetic variants from different loci may account for a greater proportion of the disease risk (Ioannidis, 2003). However, the associations of combined polymorphisms in these genes with lipid abnormalities and atherosclerotic severity have never been studied in subjects with high risk of coronary artery disease (CAD). We hypothesized that subjects who carry a combined risk genotype from five polymorphisms would have a greater risk of having lipid abnormalities and contribute to the severity of coronary atherosclerosis compared to those with combined non-risk genotypes. The present study, therefore, aimed to evaluate the associations of individual and combined SOD2, SOD3, GPX3, and GSTT1 gene polymorphisms with lipid abnormalities, particularly HTG and low HDL-C level in subjects with high risk of CAD, and to further investigate the associations of these polymorphisms and lipid abnormalities with the severity of coronary atherosclerosis.
Materials & Methods
Study population
The study population were recruited from Thai subjects who attended for CAD investigation at Queen Sirikit Heart Center of the Northeast, Faculty of Medicine, Khon Kaen University, Thailand, between 2008 and 2012. These subjects, indicated as “high-risk subjects”, had signs or symptoms suspecting of CAD (reviewed in Cassar et al., 2009) and/or history of cardiovascular risk factors such as smoking, dyslipidemia, diabetes mellitus, hypertension, or obesity. Participants who had unstable angina, left ventricular hypertrophy, heart failure, cardiomyopathy, arrhythmia, and undergoing percutaneous coronary intervention or stent implantation, as well as those who were diagnosed with renal diseases, liver diseases, cancers, and inflammatory diseases, were excluded from the study. After providing the detail of the study, 396 participants, aged between 30 and 86 years, had voluntarily joined the study and gave written consent forms as well as demographic and risk factor information. Physical examination and blood collection were conducted for these participants, before being referred to the Cardiac Catheterization Unit for coronary angiography. There were 389 subjects who underwent elective, non-urgent coronary angiography in the absence of emergency conditions. Based on coronary angiography, 225 patients who had at least one of the main coronary arteries showing ≥50% luminal stenosis were defined as CAD, whereas 164 subjects having none or with <50% luminal stenosis were categorized as non-CAD (Scanlon et al., 1999).
Ethics statement
The study protocols, as being performed in human participants, were examined and approved by the Khon Kaen University Ethics Committee for Human Research and were in accordance with the 1964 Helsinki Declaration and its later amendments or comparable ethical standards. The approval certificate for Ethics in Human Research for Experimental studies, HE510414, was obtained.
Assessment for the severity of coronary atherosclerosis
The severity of coronary atherosclerosis, based on angiographic data, was evaluated using “Gensini score (GS)”, which is correlated with “atherosclerotic plaque burden” (Neeland et al., 2012). GS was calculated as the sum of “individual lesion score”—based on the degree of luminal stenosis, the involved coronary vessel, and its location along the target vessel—according to a previously described method (Yongsakulchai et al., 2016). To evaluate the severity of coronary atherosclerosis, the subjects were categorized into two groups using the median GS, 32 points in this study population, as the cut-off point between two groups being assigned as “absent to mild” and “moderate to severe” coronary atherosclerosis.
Blood biochemical parameters and demographic data
Venous blood was collected after 12 h fasting; for high-risk group, blood was collected before undergoing coronary angiography. Blood lipid parameters and fasting blood sugar (FBS) were determined using Cobas Integra 400 chemistry autoanalyzer (Roche diagnostic, Switzerland). LDL-C was calculated using the Friedewald equation for samples with TG concentrations <4.5 mmol/L. Serum high-sensitivity C-reactive protein (hs-CRP) was measured using the BN ProSpec® System (Siemens Healthcare Diagnostics Products GmbH, Marburg, Germany). Fasting insulin level was determined by sandwich immunoassay (Cisbio Bioassays, Bedford, MA, USA). The homeostatic model assessment of insulin resistance (HOMA-IR) was calculated by [FBS (mmol/L) × fasting insulin level (µU/mL)]/22.5 (Matthews et al., 1985).
Obesity was identified from body mass index (BMI) of ≥25 kg/m2 (WHO, 2000). Diabetes mellitus (DM) was identified by prior physician diagnosis or FBS ≥7.0 mmol/L (American Diabetes Association, 2013). Hypertension (HT) was defined if: (i) subject received the antihypertensive drug, or (ii) from prior physician diagnosis, or (iii) whose blood pressure reading ≥140 mmHg for systolic blood pressure (SBP) or ≥90 mmHg for diastolic blood pressure (DBP) (Weber et al., 2014). All abnormal lipid and lipoprotein profiles were followed the National Cholesterol Education Program and Adult Treatment Panel III (NCEP-ATP III) guideline. Low HDL-C level was considered from a value of HDL-C below the 50th percentile (HDL-C <1.0 mmol/L). Hypertriglyceridemia (HTG) was defined by fasting serum for TG level of ≥1.7 mmol/L. Subject who had an abnormal level of one or more lipid profiles, or currently on the lipid-lowering drug, or had a history of lipid disorder was defined as “dyslipidemia (DL)”. The cut-off point for “high TG/HDL ratio (in mg/dL unit)” in the present study was 3.7, as determined by constructing the ROC curves for prediction of atherosclerotic severity. In addition, the TG/HDL-C ratio ≥3, as a surrogate marker of insulin resistance (IR) (Hannon et al., 2006; Iwani et al., 2017) was also included in the evaluation. Metabolic syndrome (MetS) was defined for subjects who had three or more of five conditions according to the International Diabetes Federation (IDF) and NCEP-ATPIII criteria.
Genotyping of antioxidant gene polymorphisms
The polymorphisms of antioxidant genes were selected based on data from the previous reports showing evidence of association with CVD risk factors in various populations, except for SOD3 g.9892T>C (rs2855262). This SNP comprises two polymorphic, T and C alleles that generate three possible genotypes (TT, TC, and CC). Although there was no report of association between SOD3 rs2855262 and CVD risk factors, this SNP was selected based on prior pilot study showing its relationship with oxidative stress markers in subjects with MetS, aged >50 years; subjects with CC had a higher level of malondialdehyde (MDA) than those with TT (p = 0.010) (Table S1).
Genomic DNA was extracted from peripheral blood leukocytes using the Flexi Gene DNA isolation kit (QIAGEN, Germany). GSTT1 deletion polymorphism was determined by multiplex polymerase chain reaction (multiplex PCR) previously described by Sprenger et al. (2000) with some modification. SOD2, SOD3, and GPX3 SNPs were determined using allele-specific polymerase chain reaction (AS-PCR) technique. GeneFisher software (Giegerich, Meyer & Schleiermacher, 1996) was used in designing the PCR primers. Details of genotyping are provided in the Data S1.
For each gene polymorphism, the genotyping results were validated by DNA sequencing (1st BASE, Selangor, Malaysia) of at least 10% randomly selected samples. The DNA sequencing results confirmed all genotyping results of all gene polymorphisms in all randomly selected samples (examples of DNA sequencing profiles are shown in Data S2).
Genetic risk scores
To evaluate the combined effect, genetic risk score (GRS) was formulated based on risk-contributing alleles across multiple polymorphisms. For each bi-allelic locus, an individual may possibly have risk score 0, 1, or 2. A GRS was calculated by the summation of risk alleles from all five polymorphisms: SOD2 rs4880, SOD3 rs2536512, SOD3 rs2855262, GPX3 rs3828599, and GSTT1 (deletion). For five polymorphisms, an individual would theoretically have GRS between scores 0 and 10.
Statistical analysis
Statistical analysis was performed using the SPSS software version 17 (SPSS inc., Chicago, IL). The genotype frequency and categorical variable differences between case and control subjects were assessed by Chi-square analysis. The genotype distributions were tested for Hardy–Weinberg equilibrium (HWE) using HW calculator provided by Santiago Rodriguez (http://www.oege.org/software/hwe-mr-calc.shtml). The associations between genotypes and the risks of metabolic disorders were analyzed using a logistic regression model and expressed as Odds Ratio (OR) with 95% confidence interval (95% CI). For multiple testing, the results for the GRS-phenotype associations were corrected using a Bonferroni correction, based on the number of calculated GRSs (n = 5). This study set significance at a Bonferroni corrected alpha (α) [corrected p < 0.010, α = 0.050∕5]. Continuous variables were first tested for normal distribution utilizing the Kolmogorov–Smirnov normality test. Those variables with skewed distribution were log10-transformed before subsequent data analysis. Student’s t-test was used to compare the means of continuous variables between two groups. One way analysis of variance (ANOVA) was used to compare variables among three or more groups and followed by a post hoc test (Scheffe’s procedure). The polynomial linear trend test was used to assess linear trends across genotype or GRS groups for continuous variables. All continuous variables were expressed as means ± standard deviation (SD). Statistical significance was considered as a two-tailed p-value <0.05. Sample size and power calculations are shown in Table S2.
Results
Baseline demographics and clinical characteristics of the study population
For further analysis, the study population was first divided into two groups based on the degree of coronary atherosclerosis, using Gensini score (GS) 32 as the cut-off point, and was assigned as “absent to mild” (GS ≤ 32) and “moderate to severe” (GS > 32) coronary atherosclerosis. The baseline demographics and clinical characteristics of study subjects based on GS are demonstrated in Table 1. The number of male subjects in “moderate to severe” coronary atherosclerosis group (70.2%) was higher than in “absent to mild” coronary atherosclerosis group (53.4%), p = 0.002. The frequencies of subjects with high TG/HDL-C ratio were significantly higher in “moderate to severe” than in “absent to mild” groups. As compared with “absent to mild”, patients with “moderate to severe” atherosclerosis had significantly higher average age, Gensini score (GS), and waist/hip ratio; higher levels of TC, TG, LDL-C, and TG/HDL-C; and lower level of HDL-C.
| Parameter | Gensini score≤32; N (%)(n = 268) | Gensini score>32; N (%)(n = 121) | p-value |
|---|---|---|---|
| Gender: | |||
| Male, n (%) | 143 (53.4%) | 85 (70.2%) | 0.002 |
| Female, n (%) | 125 (46.6%) | 36 (29.8%) | |
| Smoking status; n (%) | 89 (33.2%) | 51 (42.1%) | 0.089 |
| High TG/HDL-C (≥3; unit mg/dL) | 158 (59.0%) | 87 (71.9%) | 0.014 |
| High TG/HDL-C (≥3.7; unit mg/dL) | 124 (46.3%) | 72 (59.5%) | 0.016 |
| Metabolic syndrome; n (%) | 154 (60.4%) | 78 (67.8%) | 0.171 |
| CAD; n (%) | 105 (39.2%) | 120 (99.2%) | <0.001 |
| Age (year) | 60.2 ± 9.0 | 63.1 ± 9.2 | 0.004 |
| Gensini score | 7.1 ± 9.7 | 67.7 ± 33.2 | <0.001 |
| HOMA-IR | 5.29 ± 5.09 | 7.47 ± 12.23 | 0.102 |
| SBP (mmHg) | 129.5 ± 18.7 | 129.4 ± 18.5 | 0.972 |
| DBP (mmHg) | 74.1 ± 10.3 | 72.5 ± 11.6 | 0.118 |
| BMI (kg/m2) | 24.7 ± 3.7 | 24.7 ± 3.0 | 0.680 |
| Waist/hip ratio | 0.94 ± 0.07 | 0.97 ± 0.07 | 0.014 |
| FBS (mmol/L) | 6.21 ± 2.61 | 6.44 ± 2.66 | 0.395 |
| TC (mmol/L) | 4.43 ± 1.08 | 4.75 ± 1.46 | 0.033 |
| TG (mmol/L) | 1.86 ± 1.05 | 2.18 ± 1.31 | 0.013 |
| HDL-C (mmol/L) | 1.10 ± 0.34 | 1.00 ± 0.26 | 0.009 |
| LDL-C (mmol/L) | 2.48 ± 0.91 | 2.77 ± 1.16 | 0.017 |
| TG/HDL-C (unit: mmol/L) | 1.95 ± 1.54 | 2.46 ± 1.86 | 0.003 |
| TG/HDL-C (unit: mg/dL) | 4.46 ± 3.53 | 5.62 ± 4.25 | 0.003 |
| hsCRP (mg/L) | 4.10 ± 10.16 | 4.11 ± 7.01 | 0.492 |
Notes:
- HOMA-IR
-
Homeostatic Model Assessment for Insulin Resistance
- SBP
-
systolic blood pressure
- DBP
-
diastolic blood pressure
- BMI
-
body mass index
- FBS
-
fasting blood sugar
- TC
-
total cholesterol
- TG
-
triglycerides
- HDL-C
-
high density lipoprotein cholesterol
- LDL-C
-
low density lipoprotein cholesterol
- hs-CRP
-
high-sensitivity C-reactive protein
Categorical variables are presented as percentage of subject in each group and continuous variables are presented as mean ± SD.
Associations of SOD2, SOD3, GPX3, and GSTT1 polymorphisms with TG and HDL-C dyslipidemia
The distribution of genotypes and alleles for all gene polymorphisms in the study population followed HWE (p > 0.05). The frequencies of minor alleles: SOD2 rs4880-C, SOD3 rs2536512-A, SOD3 rs2855262-C, GPX3 rs3828599-A, and GSTT1 (+) were 25.0%, 39.1%, 42.7%, 43.3%, and 42.7%, respectively. Linkage disequilibrium (D′ = 0.82) between two SOD3 polymorphisms was also observed in this population. The step-wise relationship between genotypes and TG and HDL-C levels in each individual polymorphism is summarized in Table 2 (showing p for trend).
| Polymorphisms | TG(mmol/L) | HDL-C(mmol/L) | TG/HDL-C(unit: mmol/L) | TG/HDL-C(unit: mg/dL) | |
|---|---|---|---|---|---|
| SOD2 rs4880 | TT (n = 223) | 1.83 ± 0.93 | 1.06 ± 0.33 | 1.99 ± 1.40 | 4.57 ± 3.20 |
| TC (n = 148) | 2.07 ± 1.39 | 1.11 ± 0.34 | 2.16 ± 2.02 | 4.95 ± 4.63 | |
| CC (n = 25) | 2.45 ± 1.56 | 0.99 ± 0.25 | 2.82 ± 2.24 | 6.46 ± 5.12 | |
| p-value | 0.049 | 0.137 | 0.102 | 0.102 | |
| p for trend* | 0.020 | 0.330 | 0.033 | 0.033 | |
| SOD3 rs2536512 | GG (n = 146) | 1.82 ± 1.10a | 1.10 ± 0.33 | 1.88 ± 1.52b | 4.30 ± 3.47b |
| GA (n = 190) | 1.98 ± 1.24 | 1.09 ± 0.34 | 2.15 ± 1.87 | 4.92 ± 4.28 | |
| AA (n = 60) | 2.22 ± 1.09a | 0.99 ± 0.28 | 2.54 ± 1.63b | 5.82 ± 3.74b | |
| p-value | 0.037 | 0.052 | 0.014 | 0.014 | |
| p for trend* | 0.010 | 0.016 | 0.004 | 0.004 | |
| SOD3 rs2855262 | TT (n = 136) | 1.92 ± 1.36 | 1.12 ± 0.36c | 2.04 ± 2.05d | 4.66 ± 4.69d |
| TC (n = 182) | 1.93 ± 1.10 | 1.08 ± 0.32 | 2.04 ± 1.50 | 4.67 ± 3.44 | |
| CC (n = 78) | 2.08 ± 0.98 | 0.99 ± 0.28c | 2.39 ± 1.56d | 5.48 ± 3.57d | |
| p-value | 0.133 | 0.020 | 0.029 | 0.029 | |
| p for trend* | 0.047 | 0.006 | 0.009 | 0.009 | |
| GPX3 rs3828599 | GG (n = 127) | 1.96 ± 1.22 | 1.13 ± 0.36 | 2.09 ± 1.81 | 4.79 ± 4.16 |
| GA (n = 195) | 1.95 ± 1.23 | 1.06 ± 0.32 | 2.14 ± 1.85 | 4.89 ± 4.25 | |
| AA (n = 74) | 1.97 ± 0.91 | 1.05 ± 0.29 | 2.06 ± 1.09 | 4.73 ± 2.51 | |
| p-value | 0.675 | 0.158 | 0.483 | 0.483 | |
| p for trend* | 0.416 | 0.175 | 0.243 | 0.243 | |
| GSTT1 gene deletion polymorphism | +∕ + (n = 79) | 1.90 ± 1.02 | 1.11 ± 0.35 | 1.96 ± 1.31 | 4.48 ± 3.00 |
| +∕ − (n = 180) | 1.98 ± 1.25 | 1.09 ± 0.34 | 2.14 ± 1.85 | 4.91 ± 4.23 | |
| −∕ − (n = 137) | 1.95 ± 1.16 | 1.04 ± 0.30 | 2.15 ± 1.76 | 4.92 ± 4.04 | |
| p-value | 0.980 | 0.337 | 0.806 | 0.806 | |
| p for trend* | 0.901 | 0.190 | 0.525 | 0.525 | |
| Genetic risk score (GRS) | 0–2 (n = 73) | 1.72 ± 0.96 | 1.16 ± 0.36e | 1.74 ± 1.30f | 3.97 ± 2.97f |
| 3 (n = 82) | 1.92 ± 1.22 | 1.10 ± 0.36 | 2.06 ± 1.78 | 4.73 ± 4.07 | |
| 4–5 (n = 155) | 1.98 ± 1.24 | 1.07 ± 0.31 | 2.15 ± 1.89 | 4.93 ± 4.33 | |
| 6–10 (n = 86) | 2.13 ± 1.16 | 1.00 ± 0.28e | 2.38 ± 1.63f | 5.46 ± 3.73f | |
| p-value | 0.092 | 0.041 | 0.023 | 0.023 | |
| p for trend* | 0.011 | 0.004 | 0.002 | 0.002 | |
Assessment by logistic regression for SOD 2 c.47C>T (rs4880), CC genotype significantly increased the risks of HTG [adjusted OR = 3.23 (95% CI [1.20–8.75]), p = 0.021 (Fig. S1)], high TG/HDL-C ratio (≥3.7) [adjusted OR = 2.57 (95% CI [1.06–6.24]), p = 0.037 (Fig. S2)] and HTG combined with low HDL-C (<1 mmol/L) [adjusted OR = 3.60 (95% CI [1.06–12.19]), p = 0.040 (Fig. 1)], as compared with TT. With linear regression analysis, significant associations of TC and CC genotypes with TG (log-transformed) levels were also revealed as compared with TT genotype, adjusted for age, gender, HDL-C level, smoking status, and administration of fibrate (β = 0.046 p = 0.035 and β = 0.098 p = 0.023). Moreover, CC genotype was significantly associated with TG/HDL-C ratio (log-transformed), adjusted for age, gender, smoking status, and administration of fibrate, β = 0.169, p = 0.009.

Figure 1: Adjusted Odds ratios (ORs) and 95% CI for the risk of HTG and low HDL-C (<1 mmol/L) as the function of antioxidant related gene polymorphisms.
The ORs were adjusted for age, gender, smoking status, and administration of fibrate. N, total number of genotype carriers in each group. * indicates statistically significant; p < 0.05.
For SOD3 c.172G>A (rs2536512), comparing with GG genotype, AA genotype had higher levels of TG and TG/HDL-C ratio (Table 2) and significantly associated with HTG [adjusted OR = 2.09 (95% CI [1.08–4.05]), p = 0.029 (Fig. S1)]. Moreover, AA carriers were also associated with risk of having HTG combined with low HDL-C (<1 mmol/L) as compared with GG [adjusted OR = 2.87 (95% CI [1.27–6.50]), p = 0.011 (Fig. 1)]. After adjusting for confounding factors, a significant association of AA carriers with TG/HDL-C ratio (log-transformed) levels was also presented as compared with GG carriers (β = 0.111, p = 0.015).
SOD3 g.9892T>C (rs2855262), compared with TT, CC carriers had lower HDL-C level and higher TG/HDL-C ratio (Table 2) and were associated with risk of having HTG combined with low HDL-C [adjusted OR = 2.92 (95% CI [1.33–6.41]), p = 0.007 (Fig. 1)]. Furthermore, CC genotype was also significantly associated with TG/HDL-C ratio (log-transformed) after adjusting for confounding factors, β = 0.096, p = 0.023.
Both GPX3 c.87+1494A>G (rs3828599) and GSTT1 deletion polymorphisms revealed no genotype relationship with abnormal lipid level (Table 2). When assessed by regression analysis, however, individuals with GPX3 rs3828599 AA genotype, as comparing with GG carriers, increased risks of high TG/HDL-C ratio [adjusted OR = 2.48 (95% CI [1.34–4.59]), p = 0.004 (Fig. S2)], having low HDL-C level [<1 mmol/L; adjusted OR = 2.22 (95% CI [1.17–4.20]), p = 0.014 (Fig. S3)], and HTG combined with low HDL-C [adjusted OR = 3.31(95% CI [1.51–7.28]), p = 0.003 (Fig. 1)]. There were no associations of GSTT1 deletion polymorphisms with either HTG alone or HTG combined with low HDL-C level; however, GSTT1-/- carriers revealed marginal association with low HDL-C level as compared with GSTT1+/+ genotype [adjusted OR = 1.70 (95% CI [0.92–3.15]), p = 0.092 (Fig. S3)]. In addition, comparing between HOMA-IR ≥5.75 (tertile 3rd) and ≤3.40 (tertile 1), GSTT1-/- carriers were associated with high HOMA-IR as compared with GSTT1 presence (GSTT1+/+) carriers; OR = 2.29 (95% CI [1.09–4.82]), p = 0.028 (adjusted for age, gender, DM, HTG, obesity, and cigarette smoking).
The “power of test” was also determined. Overall, this study has more than 80% power of determining for all alleles that carried OR of 2 or more (p < 0.05 as shown in Table S2).
Effect of combined SOD2, SOD3, GPX3, and GSTT1 polymorphisms on the risk of TG and HDL-C dyslipidemia
To further investigate the combined effect of these five antioxidant gene polymorphisms, the genetic risk score (GRS) was constructed based on the sum of risk alleles in individual subjects. GRS was formulated based on the risk-contributing alleles across multiple polymorphisms that were significantly associated with HTG, low HDL-C, high TG/HDL-C ratio, combined HTG and low HDL-C, and insulin resistance (high HOMA-IR) in this study. Subjects were first categorized into four GRS groups, defined by the quartiles of all subjects, as having GRSs 0–2 (N = 73), 3 (N = 82), 4–5 (N = 155), and 6–10 (N = 86). The GRS 0–2 was then used as a reference for risk assessment in other higher GRS groups. As expected, high GRS revealed a significant association with lipid abnormalities. The group of GRS 6-10 had lower HDL-C level and higher TG/HDL-C ratio (Table 2) and presented with increased risk of having low HDL-C level (Fig. 2A), high TG/HDL-C ratio (Fig. 2B), and HTG combined with low HDL-C level (Fig. 2C) as compared with group of GRS 0–2 [respective adjusted ORs (95% CI) = 2.70 (1.24–5.85), p = 0.012; 3.11 (1.55–6.23), p = 0.001; and 5.73 (2.22–14.77), p < 0.001]. The associations of GRS with lipid abnormalities, except low HDL-C, remained statistically significant after applying Bonferroni correction (p < 0.010). The associations of GRS 4–5 and GRS 6–10 with TG/HDL-C ratio (log-transformed) were also significant, as compared with GRS 0–2, after adjusting for confounding factors (β = 0.091, p = 0.030 and β = 0.150, p = 0.002).
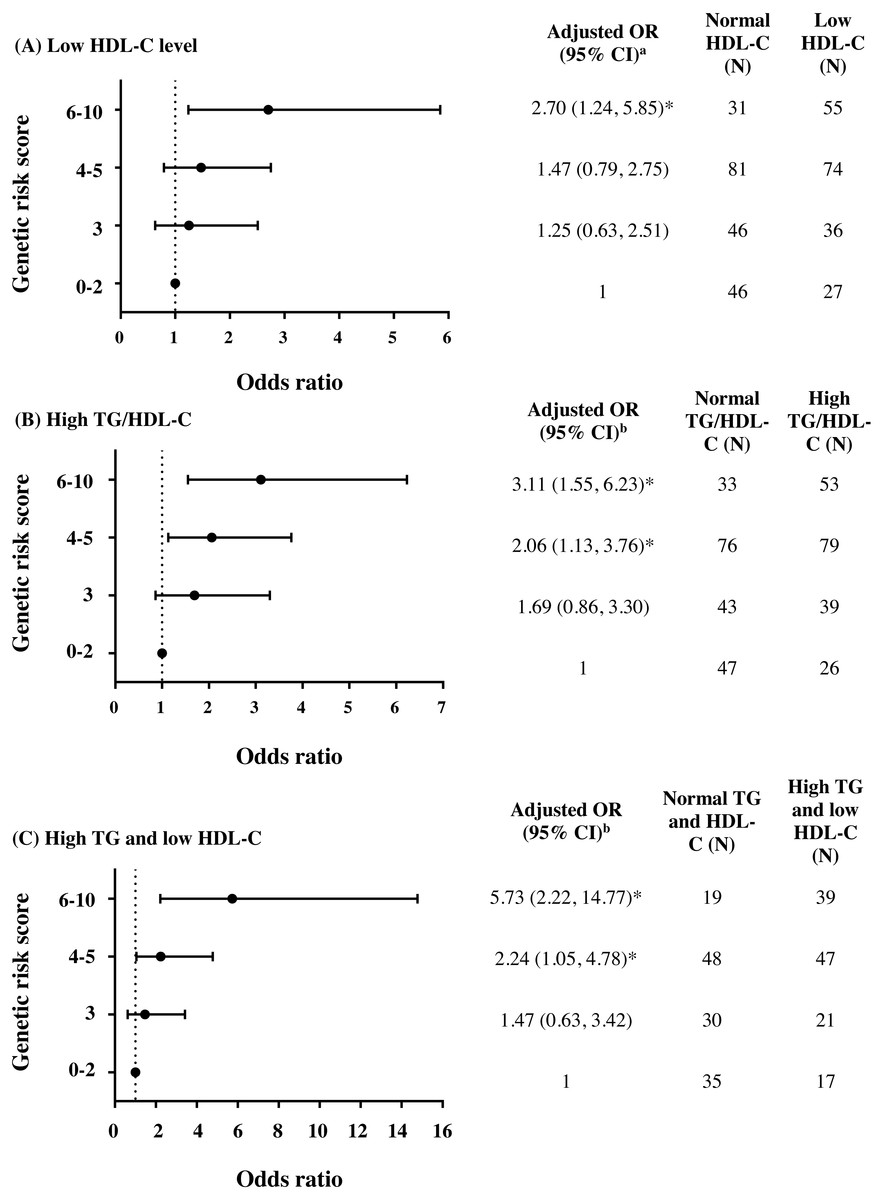
Figure 2: Adjusted ORs and 95% CI for the risks of low HDL-C level, high TG/HDL-C ratio (≥3.7), and HTG combined with low HDL-C as the function of genetic risk score.
The adjusted ORs indicating the function of combined five polymorphisms by using genetic risk score 0–2, 3, 4–5, and 6–10 are presented in (A) for low HDL-C level, (B) for high TG/HDL-C ratio, and (C) for HTG combined with low HDL-C. a The ORs were adjusted for age, gender, prevalence of HTG, smoking status, and administration of fibrate and b adjusted for age, gender, smoking status, and administration of fibrate. N, total number of combined genotype carriers in each group. * indicates statistically significant; p < 0.05.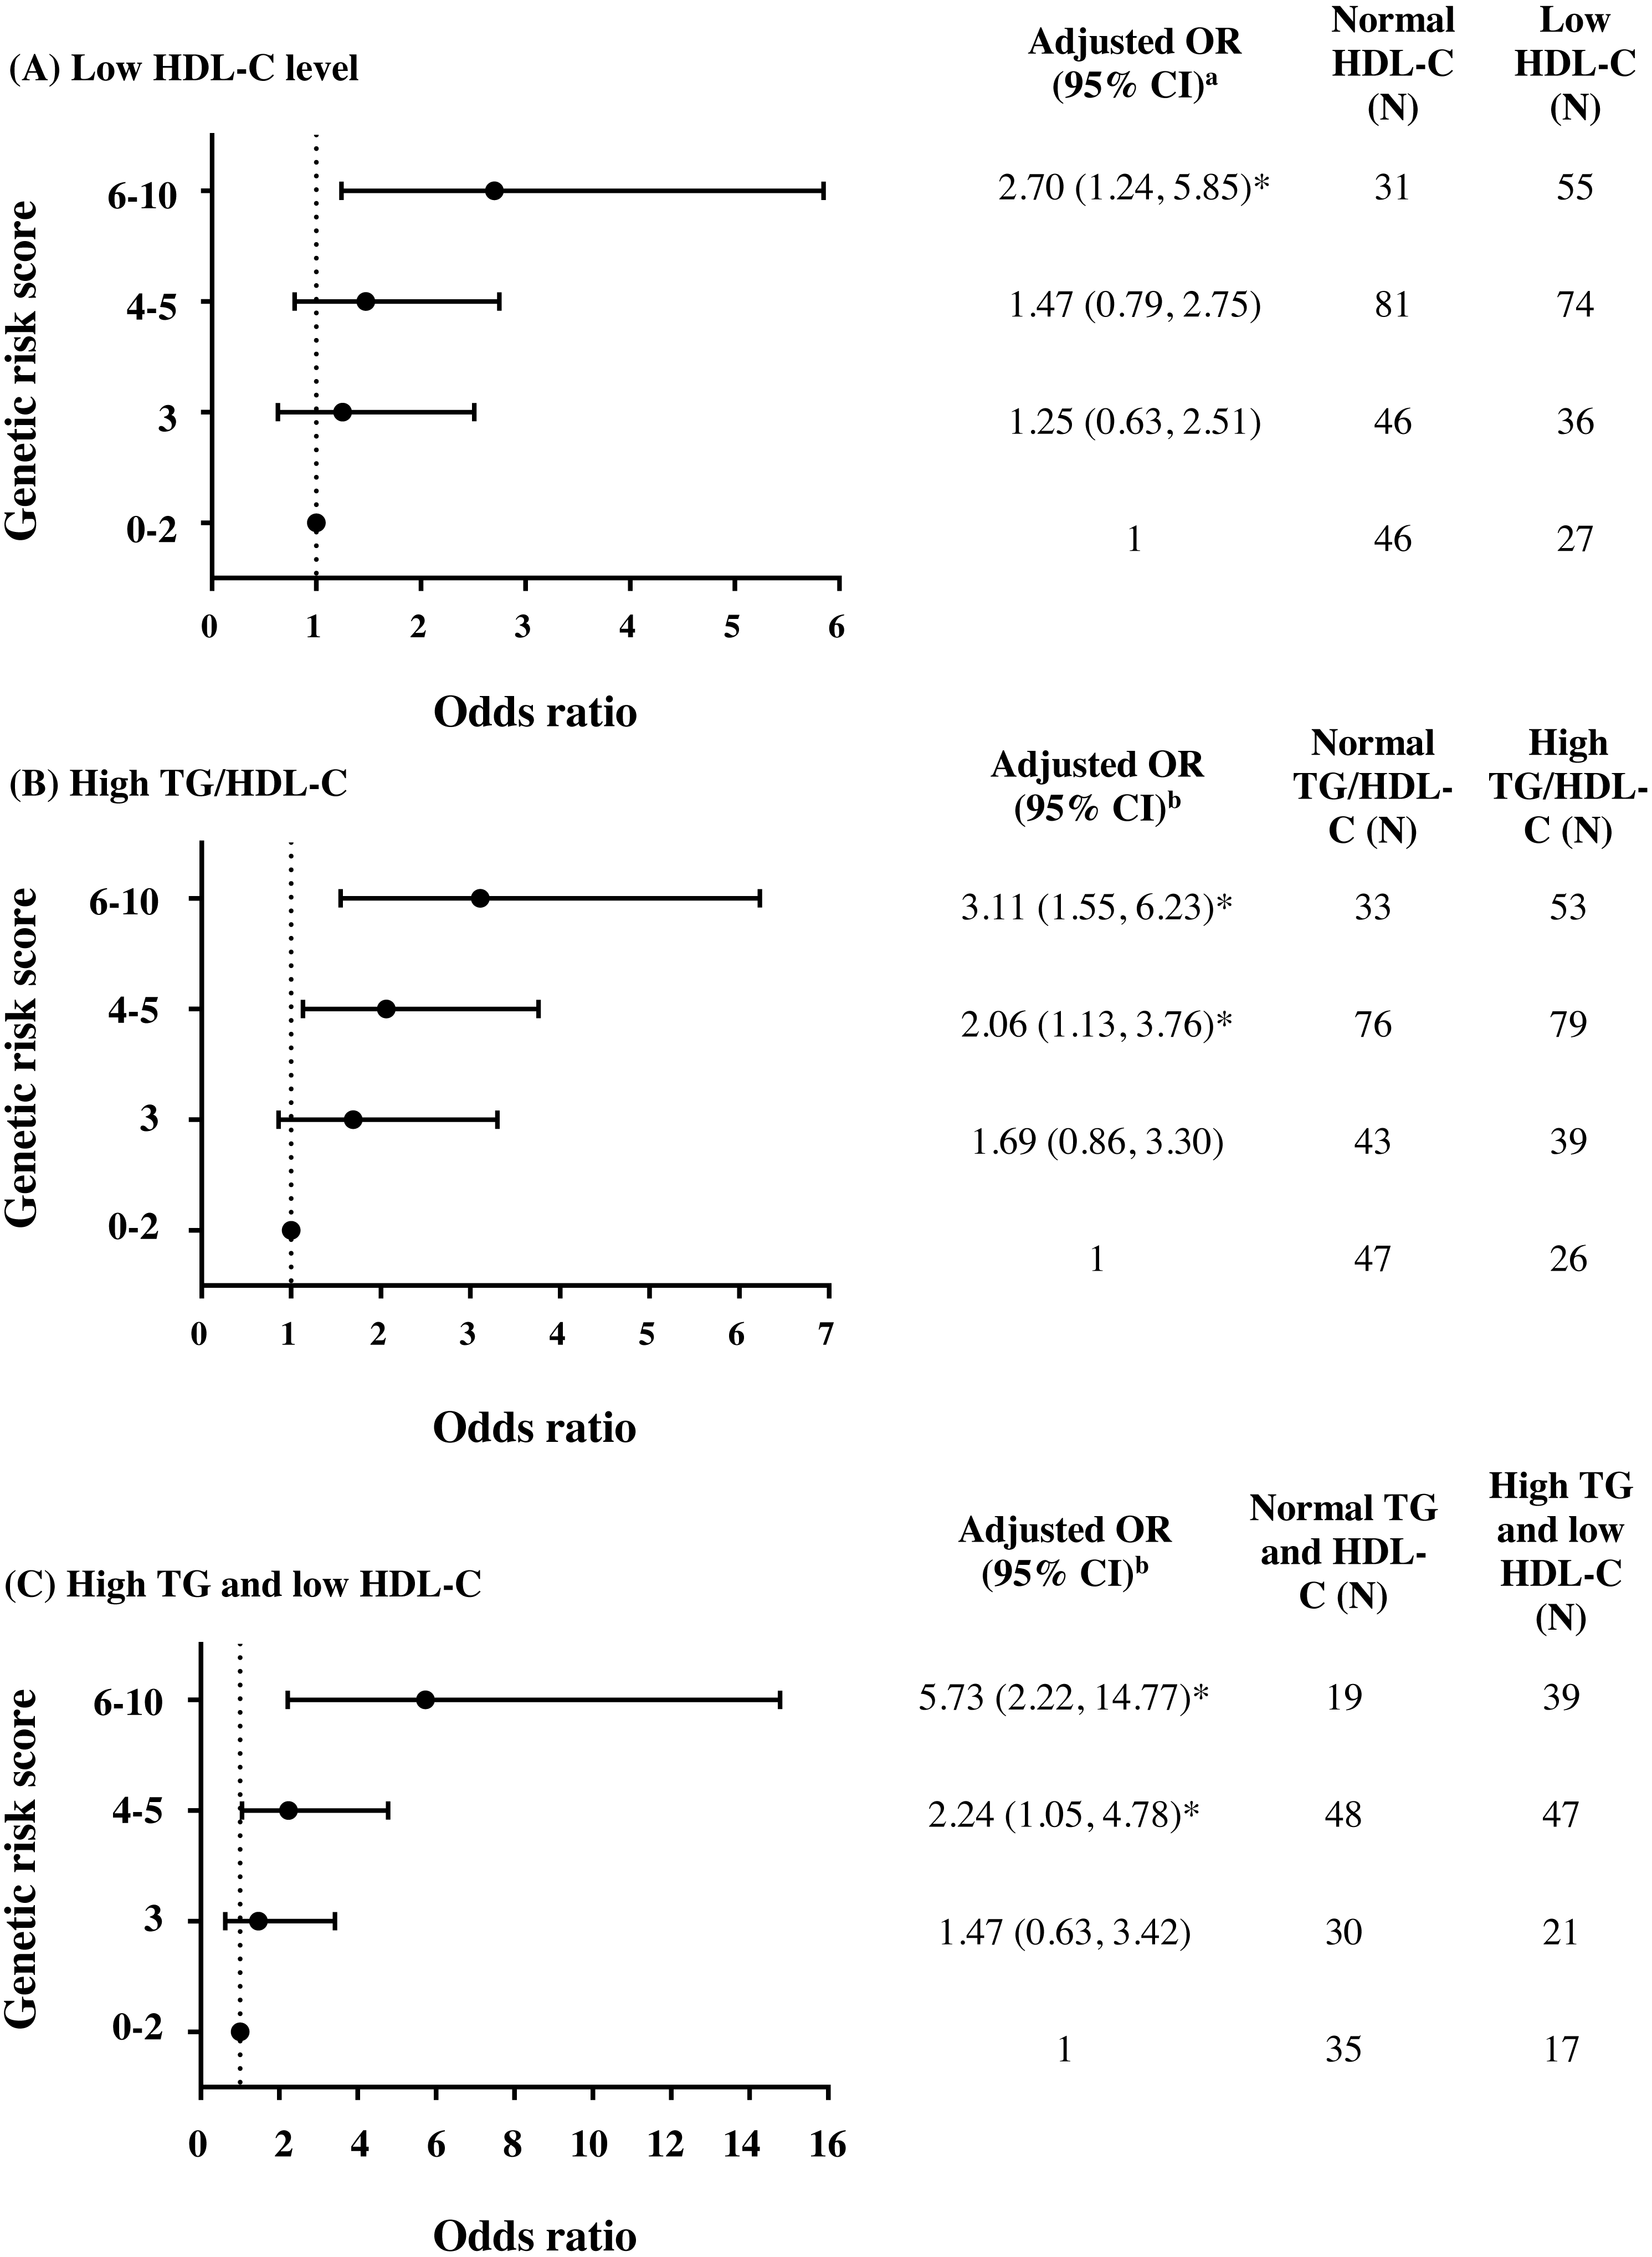
Associations of TG and HDL-C dyslipidemia with the severity of coronary atherosclerosis
To evaluate if such abnormalities of TG and HDL-C levels could predict the severity of coronary atherosclerosis, association studies were conducted for atherosclerotic severity (Gensini score >32) as a function of lipid abnormalities as well as other CVD risk factors. Only high TG/HDL-C ratio (≥3.7) was associated with severity of coronary atherosclerosis (GS >32) with adjusted OR = 2.26 (95% CI [1.17–4.34]) (Table 3). Furthermore, by using a number of vessels with ≥50% stenosis as an indicator of atherosclerotic severity, high TG/HDL-C ratio (≥3.7) was also associated with multi-vessel disease (≥2) as compared with 0-1 vessel with stenosis, adjusted OR = 2.18 (95% CI [1.20–3.99]).
| CVD risk factors | Gensiniscore≤32; N (%)(n = 268) | Gensini score>32; N (%)(n = 121) | CrudeOdds Ratio (95%CI) | p-value | AdjustedOdds Ratio(95% CI) | p-value |
|---|---|---|---|---|---|---|
| Diabetes mellitus (DM) | 79 (29.6%) | 46 (38.7%) | 1.50 (0.95, 2.36) | 0.080 | 1.22 (0.62, 2.40)a | 0.559 |
| Hypertension (HT) | 220 (82.1%) | 106 (87.6%) | 1.54 (0.83, 2.88) | 0.174 | 1.12 (0.42, 3.01)b | 0.821 |
| Dyslipidemia (DL) | 263 (98.1%) | 119 (98.3%) | 1.13 (0.22, 5.91) | 0.884 | 0.68 (0.10, 4.58)c | 0.695 |
| Obesity (OB) | 115 (42.9%) | 50 (42.0%) | 0.96 (0.62, 1.49) | 0.870 | 0.96 (0.61, 1.52)d | 0.877 |
| Hypertriglyceridemia (HTG) | 127 (47.4%) | 68 (56.2%) | 1.42 (0.92, 2.19) | 0.108 | 1.13 (0.60, 2.13)c | 0.700 |
| Low HDL-C level | 128 (47.8%) | 63 (52.1%) | 1.19 (0.77, 1.83) | 0.432 | 1.27 (0.67, 2.41)c | 0.461 |
| High TG/HDL-C (≥3) | 158 (59.0%) | 87 (71.9%) | 1.78 (1.12, 2.84) | 0.015 | 1.95 (0.95, 4.00)c | 0.069 |
| High TG/HDL-C (≥3.7) | 124 (46.3%) | 72 (59.5%) | 1.71 (1.10, 2.64) | 0.016 | 2.26 (1.17, 4.34)c | 0.015 |
| HTG with normal HDL-C level | 47 (17.5%) | 25 (20.7%) | 1.50 (0.80, 2.81) | 0.206 | 0.82 (0.29, 2.33)c | 0.705 |
| Low HDL-C level with normal TG level | 48 (17.9%) | 20 (16.5%) | 1.17 (0.61, 2.26) | 0.631 | 1.17 (0.44, 3.09)c | 0.750 |
| HTG and low HDL-C level | 80 (29.9%) | 43 (35.5%) | 1.51 (0.88, 2.61) | 0.134 | 1.36 (0.57, 3.25)c | 0.485 |
Genetic polymorphisms in SOD2, SOD3, GPX3, and GSTT1 and severity of coronary atherosclerosis
Further investigation was carried out for the possibility that risk genotypes in these antioxidant genes could be also associated with the severity of atherosclerosis. There were no associations of all gene variants with the severity of coronary atherosclerosis (GS >32, Table S3). However, GSTT1 deletion polymorphism appeared to have the relationship with step-wise increasing GS in all subjects; the mean level of GS for each genotype was 21.5 ± 32.7 for +∕ + (N = 75), 26.9 ± 35.4 for +/ − (N = 178), and 27.1 ± 34.5 for −/− (N = 136), p = 0.120, p for trend = 0.041. Although there were no significant associations of GRS with the severity of coronary atherosclerosis (Table S4), GSTT1-/- carriers were associated with increased risk of multi-vessel CAD (≥2 vessels with ≥50% stenosis) as compared with GSTT1+/+ carriers (OR = 2.23, 95% CI [1.10–4.51], p = 0.026, adjusted for age, gender, DM, HT, waist/hip ratio, and cigarette smoking).
Discussion
The present study explored the association of five antioxidant-related gene variants with atherogenic dyslipidemia in subjects with high-risk of CAD. From five gene variants being tested, only polymorphisms in SOD2, SOD3 and GPX3 were significantly associated with HTG combined with low HDL-C (Fig. 1). For SOD2 c.47C>T (rs4880), CC genotype significantly increased risks of HTG (Fig. S1) and high TG/HDL-C ratio (Fig. S2), as compared with TT. SOD3 c.172G>A (rs2536512) significantly associated with HTG, whereas GPX3 c.87+1494A>G (rs3828599) revealed association with risks of having low HDL-C level (Fig. S3) and high TG/HDL-C. GSTT1-/- carriers, though did not have a significant association with such abnormal lipid levels, were associated with increased risk of high IR state (high HOMA-IR), a condition related to TG and HDL-C dyslipidemia. Further combined effect of five polymorphisms, expressed as a genetic risk score (GRS), was investigated; the high GRS pronounced significant association with low HDL-C, high TG/HDL-C ratio, and HTG combined with low HDL-C; with stronger effect (higher OR) was observed for both high TG/HDL-C ratio and HTG combined with low HDL-C, as compared with the effect of individual polymorphisms (Fig. 2) (significant association remained after Bonferroni correction), suggesting the interaction or additive effect of these polymorphisms on such atherogenic lipid abnormality. In the present study, the patients with “moderate to severe” atherosclerosis had significantly higher waist/hip ratio (WHR) as compared with control groups and denoted as abdominal obesity, defined by mean level of WHR above 0.95 for males and above 0.80 for females (Lean, Han & Morrison, 1995). The previous studies have reported significant positive relationships of WHR to the presence of CAD (Rashiti, Behluli & Bytyqi, 2017) and atherosclerotic severity (Scicali et al., 2018), indicating abdominal obesity as an independent risk factor for CAD. We also demonstrated that high TG/HDL-C ratio (≥3.7) independently associated with severity of coronary atherosclerosis, by using either GS >32 or the number of vessels with 50% stenosis as an indicator. This finding may indicate such a high TG/HDL-C ratio as a potent predictor for the severity of coronary atherosclerosis. Although a combination of five antioxidant-related gene variants was not directly associated with severity of coronary atherosclerosis; they were, however, strongly associated with combined HTG and low HDL-C as well as high TG/HDL-C ratio (≥3.7), atherogenic dyslipidemia showing association with atherosclerotic severity. To the best of our knowledge, the present study is the first report for the combined effect of five genetic variants in these antioxidant-related genes on lipid abnormalities associated with severity of coronary atherosclerosis in subjects with high risk of CAD.
Regarding TG and HDL-C dyslipidemia, high TG/HDL-C ratio has also been reported with increased risks of atherosclerosis and arterial stiffness in patients with diabetes (Shimizu et al., 2013), and has been a strong independent predictor of CVD mortality, as well as incident T2DM (Vega et al., 2014). A combination of high TG with low HDL-C levels has also recently been reported to increase risks of both CAD and stroke, particularly in subjects with diabetes (Lee et al., 2017). High TG/HDL-C ratio has been associated with the extent of coronary disease and used as a surrogate marker for insulin resistance (IR) (Da Luz et al., 2008; Iwani et al., 2017).
The prevalence of subjects with high TG/HDL-C ratio [ratio ≥3 (Hannon et al., 2006; Iwani et al., 2017; McLaughlin et al., 2003)] was high, and almost all subjects (95.3%) had high HOMA-IR [≥1.56 for men and ≥1.64 for women (Do et al., 2010)], indicating the presence of IR state. HTG is the most common lipid abnormality in IR state; is due to increased production of TG-rich lipoprotein (VLDL), and is related to the occurrences of small dense LDL particles and low HDL-C level which play mechanistically role in atherogenesis and atherosclerotic progression (Welty, 2013). Therefore, lipid abnormalities in IR condition could pronounce the effect toward increasing severity of atherosclerosis, as seen in the present report.
There was an indirect genotype-outcome relationship regarding SOD gene variants associated with TG and HDL-C dyslipidemia. SOD2 rs4880 causes Ala (GCT) to Val (GTT) substitution in mitochondrial targeting peptide. The Ala-SOD2 can efficiently import into the mitochondrial matrix, whereas the Val variant causes the partial arrest of the precursor within the inner membrane and reduced the formation of active SOD2, resulting in lower SOD2 activity (Fujimoto et al., 2008; Sutton et al., 2003). However, in the present study, SOD2 rs4880-CC genotype (Ala-SOD2) increased the risks of having HTG and HTG combined with low HDL-C levels. Under metabolic disorder, higher SOD2 activity in subjects with rs4880-CC might cause higher mitochondrial H2O2 accumulation, leading to oxidative stress-related IR which affect HTG and low HDL-C level (Li et al., 2014). In accordance with animal studies, high-fat diet (HFD)-induced mitochondrial O2• − overproduction in mouse adipocytes has resulted in increasing the rate of conversion into H2O2 by SOD2 and involved in IR-related HTG (Fisher-Wellman & Neufer, 2012; Li et al., 2014). Adipocyte-targeted Sod2 knockout mice prevent HFD-induced obesity and IR via increasing in mitochondrial biogenesis and fatty acid oxidation, leading to the clearance of circulating FFA and the improvement of IR (Han et al., 2016).
In a previous report, individuals with SOD3 rs2536512-A allele, causing Ala to Thr substitution at amino acid position 58 in SOD3, has presented with higher SOD activity compared to those with G allele (Dong et al., 2014). In the present study, SOD3 rs2536512-AA genotype increased the risks of having HTG and HTG combined with low HDL-C levels. In accordance with our finding, a previous study has also demonstrated that SOD3 rs2536512-A allele carriers have higher IR and an increased risk of T2DM (Tamai et al., 2006). Furthermore, other studies have reported that serum SOD level and SOD activity are negatively correlated with HDL-C and positively correlated with TG levels in patients with cardiovascular risk factors (Gomez-Marcos et al., 2016; Yubero-Serrano et al., 2013). High SOD3 activity was expected to effectively neutralize excess O2• − level, however it could result in overproduction of H2O2, which could accumulate and induce hepatic IR (Iwakami et al., 2011). IR state promotes hepatic VLDL overproduction (increasing de novo lipogenesis) and VLDL secretion, and causes delayed clearance of plasma TG-rich lipoproteins (Taskinen & Boren, 2015). This results in elevated blood TG level which affects HDL level and particle size. High level of TG-rich lipoproteins induces cholesteryl ester transfer protein (CETP) activity in catalyzing the transfer of cholesteryl ester (CE) from HDL to TG-rich lipoproteins in exchange for TG. This exchange results in the small (TG-rich and CE-poor) HDL particles which are catabolized faster than large (CE-rich) HDL, resulting in lower levels of HDL-C (Welty, 2013). For SOD3 rs2855262, in our pilot study, the CC carriers in older subjects with MetS had the highest level of MDA, an oxidative marker, compared with other genotypes (Table S1). Furthermore, the SOD3 rs2855262 had strong linkage disequilibrium with SOD3 rs2536512. Consequently, the association between this SNP and HTG combined with low HDL-C level were also observed.
Regarding GPX3 rs3828599, by which AA carrier was also strongly associated with low HDL-C level and HTG combined with low HDL-C. Functionally, the AA genotype has been reported with increasing level of GPX3 expression (Wang et al., 2010). In animal study, human GPX3 transgenic mice had lower levels of TC and HDL-C compared to wild-type mice (Yang et al., 2009). These may suggest that high GPX3 activity promote such lipid abnormalities. Because GPX3 function in detoxifying H2O2 requires reduced glutathione (GSH), high GPX3 activity in the presence of high H2O2 level may lead to the reduction of GSH level. Majority of our study subjects had advanced age and a high prevalence of DM and MetS. GSH levels decline with age (Maher, 2005) and decrease in an individual with DM and MetS (Spanidis et al., 2016). Low GSH redox activity plays a major role in reducing insulin sensitivity (De Mattia et al., 1998), which could contribute to HTG and low HDL-C. In addition, GSH indirectly increases HDL-mediated cholesterol efflux from macrophages via ABCA1 and ABCG1 transporters (Rosenblat et al., 2014); and GSH-treated macrophage expresses a higher level of PPAR α and ABCA1 mRNA than in control cells (Rosenblat et al., 2014). GSH may, therefore, be the mediator influencing both TG and HDL levels.
Altogether, the association of SOD2, SOD3 and GPX3 polymorphisms with atherogenic dyslipidemia, observed in the present study, could result from the interplay of gene polymorphisms, their modified protein functions, and their involved antioxidant pathway, as well as the underlying condition of the study population. However, further investigation is required to confirm this hypothesis.
The association between GSTT1 deletion polymorphism and CAD risk has remained controversial (Du et al., 2012). In the present study, GSTT-/- had a marginal association with severity of atherosclerosis and low HDL-C level; however, GSTT-/- carriers were associated high HOMAR-IR, a state of IR that may contribute to HTG and low HDL-C dyslipidemia in combination with other gene polymorphisms. GSTT1, a cytosolic GST, plays an important role in detoxifying lipid peroxidation products (Hurst et al., 1998). In animal studies, those with lower GST activity had higher levels of TC, TG, phospholipids and lipid peroxidation (Suzumura et al., 2000). In human studies, GSTT-/- carriers in adults had a lower level of HDL-C and a higher level of TG/HDL-C ratio (Maciel et al., 2009). However, the molecular mechanism underlying this association remains unclear.
A previous study in the Hungarian population has reported the relationship between catalase gene (CAT) polymorphism (C-262T, rs1001179) and HDL-C levels (Goth et al., 2012); T2DM patients with TT had significantly lower HDL-C level than CC carriers. The present study, however, did not explore this SNP in the Thai population because rare minor allele frequency (4%) has been reported in the Asian population (Liu et al., 2016).
The limitation of this study was the absence of functional studies to investigate the impact of the different genotypes on antioxidant gene expression and/or enzyme activity as well as oxidative stress markers in question because of an insufficient amount of fresh blood. This study was carried out only in Thai subjects, a study in other ethnic population may provide variable evidence causes by ethnic-specific genetic variations as well as the different environmental factors. In addition, relatively limited sample sizes could affect the statistical power on detecting associations. Thus, these findings should be considered exploratory until they can be replicated in a larger sample size.
Conclusions
In conclusion, we have demonstrated that four polymorphisms in antioxidant genes (SOD2 rs4880, SOD3 rs2536512 and rs2855262, and GPX3 rs3828599) are independently associated with combined HTG and low HDL-C in subjects with high risk of CAD. We also provide evidence that high TG/HDL-C ratio predicts the severity of coronary atherosclerosis. We further demonstrated that high GRS derived from combined SOD2, SOD3, GPX3, and GSTT1 polymorphisms have a strong association with such atherogenic dyslipidemia. Our finding provides the evidence of indirect linking between antioxidant gene variants and the severity of coronary atherosclerosis.